Abstract
Understanding mixing patterns in urban networks is crucial for exploring the connectivity relationships between nodes and revealing the connection tendencies. Based on multi-source data (Baidu index data, investment data of listed companies, high-speed rail operation data, and highway network data) from 2017 to 2019 across seven national-level urban agglomerations, this study introduces complex network assortativity coefficients to analyze the mechanisms of urban relationship formation from two dimensions, structural features and socioeconomic attributes, to evaluate how these features shape urban agglomeration networks and reveal the distribution of network assortativity coefficients across urban agglomerations to classify diverse developmental patterns. The results show that the sampled cities exhibit heterogeneous characteristics following a stretched exponential distribution in urban structural features and a log-normal distribution in socioeconomic attributes, demonstrating significant resource mixing patterns. Different types of urban agglomeration networks display distinct assortativity characteristics. Information network mixing patterns within urban agglomerations are insignificant; investment relationships, high-speed rail, and highway networks demonstrate significant centripetal mixing patterns. The assortativity coefficients of urban agglomerations follow a unified general probability density distribution, suggesting that urban agglomerations objectively tend toward centripetal agglomeration.
1. Introduction
In the context of accelerating economic globalization and deepening regional economic integration, projections indicate that urban areas will accommodate approximately 68 percent of the global population by 2050 [1]. Cities have evolved beyond being mere centers of human mobility, information flow, and capital flow; they have become crucial hubs for global innovation, cultural exchange, and economic growth. The interactions between these cities, facilitated by the flow of critical elements, have resulted in a trend of spatial clustering. Consequently, establishing urban agglomerations as the dominant pattern of contemporary urban evolution [2,3]. Urban agglomerations, representing an advanced stage of urban system development, have emerged globally as a model for regional development and spatial organization. They play a crucial role in regional industrial clustering, participation in global urban competition and cooperation, addressing various globalization challenges, and achieving regional economic integration [4,5].
Regarding the evolution of urban agglomerations, traditional Central Place Theory and modern Flow Space Theory offer two distinct interpretative perspectives. Central Place Theory emphasizes urban hierarchical systems, suggesting that urban agglomerations form hierarchical spatial organizational structures centered around core cities through market coverage and economies of scale, where smaller cities become dependent on larger ones, resulting in spatial aggregation [6]. In contrast, Flow Space Theory transcends traditional hierarchical concepts, emphasizing that cities form functionally complementary spatial organizational patterns through multidimensional network connections, including flows of human goods, capital, and information [7]. Comprehensively, Flow Space Theory provides a dynamic theoretical foundation for urban planning and regional development research, supporting the development of urban polycentricity and regional integration. Flow Space Theory effectively breaks through the physical spatial constraints on intercity interactions, allowing relationships within urban agglomerations to extend beyond simple hierarchical dependencies. This results in the coexistence of cooperation and competition among cities, jointly promoting regional economic integration. Unraveling the underlying principles that shape these patterns is crucial for informing strategic decisions and policies that will guide the sustainable growth of urban agglomerations.
Urban networks are an objective abstraction of the different types of relationships between cities. Structural analysis based on urban networks has become an essential analytical tool for understanding the interconnections and interdependencies among cities and revealing the evolution of regional economies. It is extensively applied in research related to urban agglomerations. Domestic and international scholars have used social network analysis (SNA) to conduct extensive research on urban agglomerations such as the Beijing–Tianjin–Hebei [8,9], the Yangtze River Delta [10,11,12], the Pearl River Delta [13], and the Chengdu–Chongqing urban agglomeration [14,15]. Moreover, there is often a consistent scaling relationship between the connectivity of cities in the network and the scale of the cities [14]. Because of urban economic, political, and cultural factors, urban agglomeration networks usually have a clear network center, which forms the center of a stable core–periphery structure [16]. The examination of urban agglomeration mechanisms is essential for understanding how cities evolve, both in their spatial developmental patterns and functional organization. While existing research has analyzed structural features across various types of networks in urban agglomerations, there remains a critical gap in understanding how cities with different attributes tend to cluster and establish connections within these networks.
Mixing patterns are a fundamental metric in complex network theory that characterizes the tendency of network nodes to connect with others sharing similar or dissimilar attributes [17]. In the context of urban agglomeration studies, it quantitatively captures how cities with different socioeconomic attributes or structural features within urban agglomerations. Additionally, through the assortativity coefficient, it provides a mathematical framework to measure whether cities tend to connect with others of similar characteristics (assortative mixing) or different characteristics (disassortative mixing). Furthermore, mixing pattern analysis extends beyond simple connectivity measures by incorporating node attributes into network analysis, enabling a more nuanced understanding of how cities’ socioeconomic attributes and structural features influence their interaction patterns within urban agglomerations. Thus, it reveals whether urban development follows patterns of homogeneous or heterogeneous clustering. It is crucial to understand the formation of relationships within the network and the structural evolution it undergoes. However, discussions remain limited regarding the revealing of intercity connection tendencies through structural features and socioeconomic attributes, as well as how these connection relationships influence the formation of urban agglomerations.
Through analyzing selected urban agglomerations, this paper aims to recognize the mechanisms of relationship formation within urban agglomeration networks, quantitatively evaluate whether cities’ socioeconomic attributes and structural features play consistent roles in shaping urban agglomeration networks, and develop an analytical framework based on assortativity coefficient distributions for classifying and assessing the diverse developmental patterns of urban agglomeration networks. The assortativity coefficient is used as the primary analytical metric to measure the mixing patterns of information, investment, high-speed rail, and highway networks in these seven urban agglomerations. The research examines the mixing patterns among urban agglomerations, revealing the connection tendencies of structural features and socioeconomic attributes. The main contributions of this research can be synthesized into three main aspects. First, this study examines multiple urban agglomerations and urban agglomeration networks. Second, this study reveals the mixing patterns in structural features and socioeconomic attributes of urban agglomeration networks by examining information flows, capital flows, human mobility, and infrastructure connectivity. Third, through statistical analysis of the assortativity coefficient distributions in urban agglomeration networks, this study discovers that they follow a stretched exponential distribution, with distribution parameters that can help identify mixing patterns and evaluate the development modes of urban agglomerations, thereby providing structured insights to support future planning strategies and optimize development policies for urban agglomerations.
This paper continues as follows. Section 2 presents a literature review on the urban network and mixing pattern. Section 3 presents the method and data. Section 4 presents the results on the mixing pattern of urban agglomeration networks. Section 5 presents the discussions. Finally, Section 6 presents the conclusions.
2. Literature Review
2.1. The Evolution of Urban Agglomeration
Urban agglomeration refers to a collective of cities within a specific region that are closely connected through economic, social, and infrastructural aspects, possessing a certain economic scale and spatial structure [18]. Conceptually, urban agglomerations should first be composed of multiple cities that are spatially concentrated. Second, cities within the agglomeration are interconnected through economic activities such as industrial chains, capital flows, and labor flows, forming complex economic networks. Third, cities within the agglomeration form divisions of labor and collaborative relationships based on their respective resource advantages and socioeconomic attributes. Simultaneously, urban agglomerations achieve resource sharing and complementary advantages through interconnected transportation, information, and other infrastructure, promoting overall regional economic development. Finally, the geographical proximity of cities within the agglomeration facilitates economic interaction, resulting in spatial diffusion and radiation effects. Although research has provided relatively clear definitions of urban agglomerations’ connotations, their extensions currently exhibit diversity based on spatial scope, intercity relationships, and hierarchical functional connections. As shown in Table 1, it provides the definitions and characteristics of different concepts associated with urban agglomerations, along with the references to the respective studies.

Table 1.
The concepts of urban agglomeration.
Table 1.
The concepts of urban agglomeration.
| Urban Agglomeration | Definition | Characteristics |
|---|---|---|
| Urban Agglomeration [19] | A concentrated continuous urban area formed by multiple adjacent cities and towns within natural geographical or administrative regions through integration of population and economy | Emphasizes economic and population integration between cities |
| City Cluster [20] | A group of closely related cities with economic, cultural, and administrative connections, emphasizing intercity linkages and cluster effects | Emphasizes tight connections and collective effects among cities |
| Metropolitan Area [21] | A region centered around one or more core cities, including surrounding closely connected suburbs and towns | Highlights connections between a single center and its surrounding radiating areas |
| Urban Belt [22] | A linear region connecting multiple cities that are geographically distributed in a belt-like pattern and closely connected through transportation and economic aspects | Emphasizes transportation and economic connections between cities |
Based on the optimization of spatial layouts and resource distribution, urban agglomerations generate substantial scale and agglomeration effects that reshape regional developmental patterns [19]. The formation of urban agglomerations facilitates industrial division and coordination among cities, leading to enhanced economic efficiency, specialized industrial clusters, and improved regional competitiveness [23]. These agglomerations typically exhibit hierarchical structures characterized by complex interregional interactions, where core cities and peripheral areas develop complementary functions and cooperative relationships [24]. Additionally, scale economies emerge as industries concentrate within specific localities, reducing production and operational costs while enhancing specialization [25]. Agglomeration economies foster knowledge spillovers, technological innovation, and talent mobility, significantly improving overall productivity [19]. Furthermore, urban agglomerations fundamentally transform spatial structures by establishing polycentric, networked configurations that overcome the limitations of single-center urban developmental patterns. The enhancement of infrastructure connectivity facilitates efficient factor mobility and economic integration [18]. This spatial reorganization optimizes urban functional zoning and promotes complementary development among cities, ultimately contributing to more balanced and sustainable regional growth patterns. And meanwhile, the intricate interconnections formed through economic activities and infrastructure sharing within urban agglomerations highlight the importance of adopting network perspectives in analyzing their developmental patterns and dynamics.
Network analysis serves as a fundamental tool in comprehending urban agglomerations through quantifying the complicated information flows, investment patterns, and infrastructure connections. This analytical method excels at identifying critical transportation nodes and illuminating the complex interplay of coordinated and agglomeration effects within urban systems [26]. Additionally, through detailed examination of structural characteristics and evolutionary patterns in urban agglomeration networks, enabling more precise assessment of urban agglomeration development [27]. Furthermore, the network-based approach effectively captures both radiation and diffusion dynamics of urban agglomerations, enhancing our understanding of their spatial growth patterns and economic influence [28]. Thus, by systematically mapping intercity relationships, this analytical framework provides policymakers with sophisticated insights for evidence-based decision-making, particularly in areas of resource allocation, transportation system optimization, and industrial coordination [29].
2.2. Urban Networks
Existing research has extensively applied network perspectives to analyze intercity relationships within urban agglomerations. Scholars have abstracted cities as nodes and their various connections as edges, constructing different types of networks based on economic flows, transportation linkages, and information exchanges. For instance, studies have used enterprise networks to capture business connections, transportation networks to reflect infrastructure connectivity, and knowledge networks to represent innovation collaborations, as shown in Table 2.
Table 2.
Different types of urban network.
Table 2.
Different types of urban network.
| Type | References |
|---|---|
| Airline network | [5,25,30] |
| High-speed rail network | [12,25] |
| Rail network | [31] |
| Innovation network | [32,33] |
| Investment network | [10,34] |
| Information network | [35,36] |
| Human mobility network | [3,14] |
As shown in Table 2, current research on urban networks primarily focuses on three key domains: transportation networks, social networks, and economic networks. In transportation network studies, research has predominantly addressed issues of traffic congestion, flow allocation, and sustainable transportation development [3]. Notable findings indicate an evolution in urban transportation network structure from a Beijing-centered monocentric pattern to a more complex diamond structure anchored by four national centers: Beijing, Shanghai, Guangzhou, and Chengdu. This structural transformation has facilitated more intensive intercity interactions across the network [5]. Social network analyses have revealed distinctive patterns of information dissemination and social interaction within urban agglomerations [32]. These networks typically exhibit small-world characteristics [37,38], where key nodes serve as critical information hubs. For instance, studies of information flows in the Yangtze River Delta urban agglomeration, based on Baidu Index data, demonstrate a relatively stable hierarchical structure evolving from a “pyramid” to a “spindle” pattern [36]. Similarly, analyses of population mobility, particularly during peak migration periods such as the Spring Festival, show concentrated flows among four major urban agglomerations, with network distributions following power-law patterns and displaying small-world properties [39]. Economic network research has focused on intercity trade, investment, and cooperation relationships [10,11]. These studies consistently reveal core–periphery patterns in urban agglomeration development. A notable example is the Yangtze River Delta’s financial enterprise network, which has evolved from a Shanghai-centered monocentric structure to a polycentric network with Shanghai as the primary hub and Nanjing, Hangzhou, and Hefei as secondary centers [10]. Similar patterns have been observed in the Chengdu–Chongqing urban agglomeration, where economic development shows significant spatial concentration in core urban areas, leading to distinct regional disparities [14].
Despite significant advances in urban network research, several limitations persist in understanding intercity relationships within urban agglomerations. Current research predominantly examines either single urban agglomerations or individual types of networks, largely due to challenges in data acquisition and processing. This has constrained our ability to conduct comprehensive analyses of multi-regional and multi-dimensional urban networks [33]. Additionally, the analytical toolkit employed in existing research tends to be relatively limited, primarily relying on basic network metrics such as centrality measures, core–periphery structures, and cohesive subgroup analysis [16,40,41]. While these methods have provided valuable insights, they offer insufficient explanatory power for understanding the complex mechanisms underlying the formation and evolution of urban agglomerations. A more sophisticated and multifaceted analytical framework is needed to capture the intricate dynamics of intercity relationships and their implications for regional development.
2.3. Mixing Patterns of Urban Networks
Compared to single-type urban networks, identifying intercity connections and interactions and understanding urban evolution patterns are crucial for promoting balanced development between cities and comprehending the formation of urban agglomerations [19]. Mixing patterns is a key concept in complex network analysis, proposed by Newman to measure the similarity between nodes in networks [18]. Regarding the application of mixing patterns, early scholars primarily focused on the phenomenon of “homophily” in social networks, where individuals tend to establish connections with others sharing similar characteristics [42]. In technological networks like the internet, these networks often exhibit scale-free characteristics [43]. In social networks, such as research collaboration and actor collaboration networks, they are often assortative [44]. With the development of network science, the concept of the mixing patterns has gradually been introduced into multiple disciplines, including economics and sociology, to analyze connection patterns in different types of networks. Thus, providing a broader perspective for understanding connection patterns in urban networks [17].
In urban network research, the application of mixing patterns not only deepens understanding of urban network structural features but also reveals connection preferences formed by the similarity or dissimilarity of node attributes, providing a theoretical foundation for understanding the evolution of urban networks and functional optimization. Existing research employs assortativity coefficients to quantitatively analyze mixing patterns in urban networks, quantifying cities’ connection tendencies based on specific attributes, and finds that investment relationships in urban agglomerations tend toward central agglomeration, indicating that cities with similar attributes are more likely to form close connections, thereby influencing the organizational characteristics and internal structure of urban agglomerations [45,46]. In migration networks, cities generally exhibit assortative characteristics, where cities tend to establish close connections with others of similar economic levels or cultural backgrounds [47,48]. In contrast, transportation and innovation networks more often demonstrate disassortative characteristics, indicating that connections in these networks tend to link cities with significantly different attributes, thereby promoting complementarity and interconnectivity between different cities [49,50,51]. This is particularly evident in high-speed rail networks; developed regions demonstrate multiple-core, complex network patterns, while in developing regions, a clear core–periphery pattern emerges where central cities strengthen their connections, but peripheral cities face growing marginalization [52,53]. Although existing research has made certain progress, current discussions on urban network mixing patterns still lack systematic analysis, particularly with limited discussion of network mixing patterns at the urban agglomeration scale. More importantly, current research primarily analyzes urban network mixing patterns from the perspective of node degree while paying less attention to mixing patterns under other structural features of urban networks, with even rarer analyses of urban agglomeration network mixing patterns based on urban socioeconomic attributes.
Based on the above discussion, this study investigates mixing patterns in urban agglomerations through two dimensions: structural features and socioeconomic attributes. The structural dimension encompasses spatial configuration, transportation infrastructure, and urban hierarchies, which collectively shape the intensity and morphology of urban agglomeration processes. The economic dimension, including levels of economic development, population dynamics, and resource distribution, determines the nature of intercity interactions and cooperation mechanisms. By examining these perspectives, this research aims to reveal the mixing patterns of urban interaction and their influence on agglomeration processes.
3. Methodology and Data
This study proposes an analytical framework for examining mixing patterns in urban agglomerations, consisting of three parts: network mixing patterns, study area construction, and results. In the first part, this study analyzes the evolution of urban agglomerations from both structural features and socioeconomic attributes and proposes two mixing patterns, disassortative (centripetal mixing pattern) and assortative (balanced mixing pattern). To identify urban connection tendencies, this study develops a methodology based on assortativity coefficients. Building upon this foundation, the study extends Newman’s significance testing approach for assortativity coefficients to verify the two proposed mixing patterns in urban agglomerations. In the second part, this study introduces the construction of different networks. In the third part, this study examines the distribution of assortativity coefficients across different network types. The overall framework is shown in Figure 1.
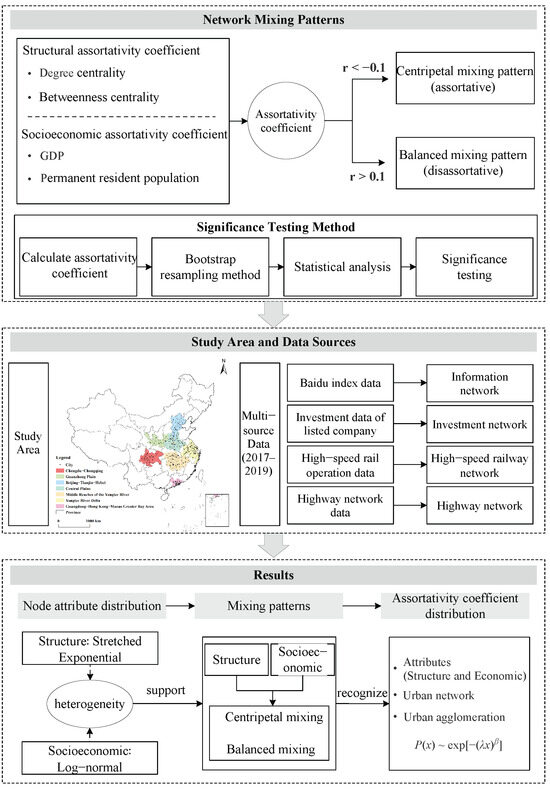
Figure 1.
Research framework.
3.1. Network Mixing Patterns
3.1.1. The Evolution of Urban Agglomerations
Drawing on the Flow Space Theory of intercity relationships, urban agglomeration emerges from resource exchanges between cities. These resource exchanges generate both attractive and repulsive forces, thereby shaping intercity relationships. The structural dimension is manifested in the hierarchical organization of urban networks, where cities occupy different positions within the core–periphery structure, while the economic dimension is reflected in the heterogeneous distribution of socioeconomic attributes across cities. This study aims to investigate how cities form urban agglomerations through their structural features and socioeconomic attributes. Network mixing patterns describe the tendency of nodes to connect with other nodes based on certain attributes. Following Newman’s framework, mixing patterns reveal how nodes with similar or different characteristics tend to connect, providing insights into network formation and evolution. Based on these theoretical foundations, this study hypothesizes two distinct mixing patterns in urban agglomerations, as shown in Figure 2.
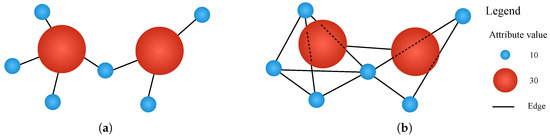
Figure 2.
Mixing patterns of urban networks: (a) centripetal mixing pattern; (b) balanced mixing pattern.
As shown in Figure 2. First, the centripetal mixing pattern suggests that cities are more likely to establish connections with those having complementary functions regardless of their comprehensive strength, facilitating the formation of specialized divisions of labor and functional complementarity within the urban system. Second, the balanced mixing pattern indicates that cities tend to establish connections with others possessing similar comprehensive strength, reflecting their preference for comparable partners in resource exchange and cooperation. This study aims to explore the presence and operation of these two mixing patterns across different urban networks, examining whether both patterns exist and function distinctively in various urban networks, or whether a single pattern predominates. By recognizing these mixing patterns, this research contributes to identifying the formation mechanisms of intercity relationships and understanding of urban network evolution.
3.1.2. Measuring Assortativity Coefficient
This paper applies theoretical ideas to examine the mixing patterns within complex networks to reveal the mixing patterns of Chinese cities. It also analyzes the general patterns exhibited by the structural features or socioeconomic attributes of cities in their mixing patterns. The mixing patterns of networks, which exhibit assortativity, is described as the similarity of node attributes at both ends of the network links. The assortativity coefficient is a key quantitative measure of assortative mixing in networks, as shown in Equation (1).
where x and y represent certain attribute values of the nodes at both ends of a link in the network. represents the proportion of links in the network where the attribute values at both ends of the link are x and y, respectively; and represent the proportion of links where the attribute values at one end are x or y, respectively. () denote the standard deviations of the distributions of (). The value of r ranges between (−1,1), and when , the assortative (or disassortative) mixing features of the network are significant. In this paper, the assortativity coefficients of urban agglomerations are calculated from two dimensions: structural features and socioeconomic attributes, as follows:
(1) Structural assortativity coefficient: The micro-structural features of network nodes are used as the node attribute, including degree centrality and betweenness centrality, which represent the city’s ability to occupy and control resources, respectively. The information and investment networks are directed networks, the out-degree and in-degree of nodes will be discussed as two independent node structural features. Additionally, the assortativity coefficient of betweenness centrality will also be calculated as a node attribute. Degree centrality and betweenness centrality are defined as follows: Degree centrality is a fundamental measure of node importance in networks. Based on the adjacency matrix representation, degree centrality is defined as shown in Equation (2).
where represents elements in the adjacency matrix; represents the number of nodes directly connected to node i; n is the network size. The normalization represents the ratio of the node’s actual degree to its theoretical maximum degree, thus also known as relative degree centrality. In this study, a higher degree of centrality indicates that a city occupies a more central position within the urban agglomeration, while a lower value suggests the city is more isolated. Betweenness centrality measures a node’s ability to control network resources. A node achieves higher betweenness centrality when it lies on more geodesic paths between other node pairs. According to the definition, network betweenness centrality is defined as shown in Equation (3).
where represents the node’s betweenness, describing the proportion of geodesic paths between nodes j and k that pass through node i. Similar to the normalization of degree centrality, it standardizes the measure to eliminate the effect of network size, making betweenness centrality a measure of how close a node is to achieving maximum betweenness centrality. Specifically, in urban agglomeration networks, nodes with higher betweenness centrality occupy crucial positions within the entire urban network, effectively controlling and coordinating resource flows and personnel movement between cities. A higher value indicates a stronger ability of a city to control pairs of other nodes in the network; thus, betweenness centrality primarily describes how a district’s topological position influences its centrality. Therefore, this study selects both degree centrality and betweenness centrality as nodes’ structural features.
(2) Socioeconomic assortativity coefficient: The socioeconomic development level of cities and their population attributes are used as the city attributes to calculate the assortativity of the urban agglomeration network. This paper calculates the average values of GDP and permanent resident population for the sample cities from the China Statistical Yearbook (2017 to 2019) to eliminate the effects of random fluctuations on the socioeconomic development level of the cities. To facilitate the comparison of assortativity features across different urban agglomerations, the average GDP and average permanent resident population were standardized according to the scale of each urban agglomeration and used as node attributes. Unlike structural assortativity, attribute assortativity embeds the socioeconomic attributes of cities within the network structure, describing the similarity of the attributes of cities at both ends of a relationship. This allows for an analysis of the internal mechanisms driving the formation of intercity relationships from the perspective of socioeconomic development levels.
GDP is a crucial indicator measuring the economic scale and wealth level of districts, reflecting a region’s overall economic level. Permanent resident population not only indicates the demographic scale of districts but also represents their potential market capacity, closely correlating with the intensity of economic activities, market potential, and demand. Therefore, this study selects GDP and permanent resident population as nodes’ socioeconomic attributes.
3.1.3. Significance Testing for Assortativity Coefficients
Based on Newman’s paper [17], the method for testing the statistical significance of the assortativity coefficient r is the jackknife method, which treats each edge as an independent measurement and calculates the standard deviation using Equation (4).
where represents the r value with the edge removed, and M represents the number of edges in the network. However, while this method is theoretically sound, it becomes computationally intensive for large networks due to the need to recalculate the coefficient multiple times by removing each edge sequentially. To evaluate the statistical significance of the network assortativity coefficient, this study employed the bootstrap resampling method, which is well suited for large-scale datasets. The networks analyzed in this study primarily contain over 1000 edges, making the Jackknife method used by Newman’s paper [17]. Computationally expensive due to its reliance on repeated calculations. Initially, this study calculated the original assortativity coefficient for each urban network. This study then conducted 1000 bootstrap resampling iterations. In each iteration, this study randomly selected, with replacement, several edges equal to the size of the original network’s edge set. Using the degree distribution, this study reconstructed the network and calculated its assortativity coefficient . From these 1000 resampled coefficients, this study computed the standard deviation of the assortativity coefficient .
To determine the statistical significance of the assortativity coefficient, this study assumed that the resampled coefficients follow a normal distribution and conducted a Z-test. The Z-value was calculated as , where r is the original network’s assortativity coefficient and is the standard deviation derived from the Bootstrap method. At a 95 percent confidence level, the null hypothesis (that the network exhibits no significant assortativity or disassortativity) was rejected if . A Z-value greater than 1.96 indicates significant assortativity, while a Z-value less than −1.96 suggests significant disassortativity. If , the assortativity coefficient is deemed statistically insignificant.
It is worth noting that although the bootstrap method is primarily designed to assess degree assortativity, it does not account for node attributes during resampling. Despite this limitation, this study extended the method to evaluate assortativity coefficients based on node attributes. While this adaptation may overlook certain attribute-specific considerations, it offers a preliminary statistical reference for analyzing assortativity patterns involving node attributes.
Additionally, this study examines the distribution of assortativity coefficients across different network types. Based on distribution fitting results on the empirical network, a universal indicator for mixing patterns in urban agglomerations is established. By recognizing how assortativity coefficients are distributed across different network types, we can better understand the generality of different mixing patterns in urban agglomeration development.
3.2. Study Area and Data Sources
This study focuses on seven national-level urban agglomerations in China, encompassing 142 cities and their district attributes (GDP, population, and area), as shown in Table 3. These urban agglomerations received formal government approval in 2018, reflecting their status as China’s most strategically significant economic zones.
Table 3.
Overview of seven national-level urban agglomerations in China in 2018.
These urban agglomerations demonstrate distinct spatial structural and developmental characteristics, as shown in Figure 3.
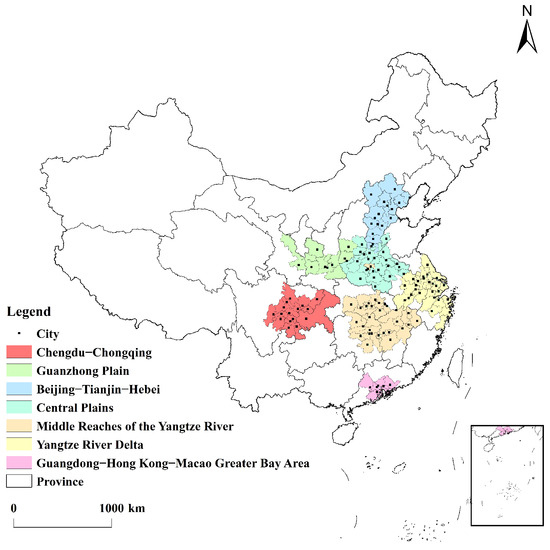
Figure 3.
Study area. Base map source: State Bureau of Surveying and Mapping, GS(2020)4619, with no modifications to the base map.
Based on the defined scope of urban agglomerations and their constituent cities, this study selected data from the year before and after this policy (2017–2019) as our study period. This timeframe ensures consistency in both data availability and resolution across all analyzed datasets. During this timeframe, four distinct types of intercity relationship data were collected and analyzed: information flow, investment ties, and transportation infrastructure (high-speed rail operation frequency and highway networks). To ensure our analysis captures genuine intercity relationships, this study excluded administrative and governmental connections from our network construction. This enabled the study to focus on the connectivity between cities through information, economic, and infrastructural flows, rather than relationships defined by administrative boundaries or policy frameworks. The specific data sources for each urban network are detailed below:
(1) Baidu index data: The average search index between cities from the Baidu Index during the period from January 2017 to December 2019 is used to represent the informational relationships between cities, serving as the weight for the information network relationships. These data are used to construct a directed and weighted information network. These data, covering a range of socioeconomic events, ensure the broadness and representativeness of the data. Consequently, it is utilized to construct a directed and weighted information network.
(2) Investment data of listed company: As a comprehensive financial data platform, Tushare (accessed on 1 June 2021, https://tushare.pro) provides a wide range of financial data services. As of the end of 2019, a total of 3777 companies were listed on the Shanghai and Shenzhen stock exchanges. This study obtained the registered locations of these listed companies, their shareholders, and the number of shares held using the Tushare financial data interface. Non-individual shareholders’ registered city information was filtered and collected, and the investment capital of each shareholder was used as the weight for the investment network relationships, constructing a directed and weighted investment network.
(3) High-speed rail operation data: To ensure the comprehensiveness of traffic contact intensity, considering the traffic flow on different dates, high-speed rail (G, D, C) schedule data was obtained from the official China Railway 12306 website (https://www.12306.cn/index/) for 23 days from September to November 2019, which included 17 weekdays and 6 non-working days/holidays. An average of 7071 train services per day was recorded, with the data for train services between sample cities retained. The number of train services between cities was used to represent the strength of the transportation connections, and an undirected, weighted high-speed rail network was constructed using the P-space network construction method.
(4) Highway network data: According to a circular jointly released by the National Development and Reform Commission and the Ministry of Transport about the national road network, the China Transportation Technology Database (https://www.transformcn.com) provided data on the built sections of the national highway network from 2013 to 2030, including the starting and ending points, cities/counties passed, interchanges along the route, and exits. The highways passing through the sample cities were used to represent the connection relationships between cities, and an undirected, weighted highway network was constructed using the P-space network construction method.
Additionally, this paper uses the China Statistical Yearbook (2017 to 2019) to obtain socioeconomic data of the cities, including permanent resident population and GDP for empirical analysis. These data provide a comprehensive perspective on the development status of the cities, enhancing the representativeness and credibility of the research findings. Through these rigorous data collection and network construction methods, this study ensures the representativeness of the data.
Based on the intercity relationship data, this study constructs four types of urban networks to describe information flow, capital flow, human mobility, and infrastructure connectivity among cities. The urban networks to be analyzed are denoted as , where V represents the sample cities selected in this study; represents the edge relationships between sample cities, varying by network type; and represents the weight of intercity relationships, also varying by network type. Specifically, they are as follows:
(1) Information network, : represents the annual average search index from city i to city j. If , an edge is established with weight , . Considering the information flow between cities is asymmetrical, the resulting information network is a directed weighted network, where the direction of edge indicates information flow from city i to city j.
(2) Investment network, : represents the invested capital where company x registered in city i has shareholder y registered in city j. The investment relationship weight from city j to city i is calculated using Equation (5):
Similar to the information network, the investment network is also a directed weighted network, where edge direction indicates investment from city i to city j.
(3) High-speed rail network, : This study uses a P-space network construction method. According to the P-space network definition, if a high-speed rail route L from city i to city j stops at cities m, n, and l, edges are established between all pairs of nodes i, m, n, l, and j. The edge weight is calculated based on the number of high-speed rail services between cities, where , .
(4) Highway network, : Similar to the high-speed rail network, this study uses the P-space network construction method for the highway network, establishing edges between sample cities along national highway routes. However, unlike the high-speed rail network, edge weights are determined using geographical distance between cities to evaluate relationship intensity. Closer cities have more frequent relationships. Additionally, the number of highways m between cities increases relationship frequency. Therefore, the edge weight in the highway network is calculated using Equation (6):
It should be noted that since most high-speed rail services in China operate bidirectionally and highway connectivity is symmetric, both the high-speed rail network and highway network are undirected weighted networks.
Based on the construction of the four types of urban networks described above, this paper extracts the seven urban agglomerations as subnetworks from the overall network, forming the urban agglomeration networks analyzed in this study. To focus on the internal structure of the urban agglomerations, inter-cluster links and their weights are naturally discarded during the subnetwork analysis. At the same time, considering the impact of network weights on the analysis of urban agglomerations, a backbone network extraction method was employed to remove low-weight links [54] and highlight the core structural features of the urban network. This method allows us to construct a concise network model that emphasizes core interactions. The topology of the extracted network is shown in Figure 4.
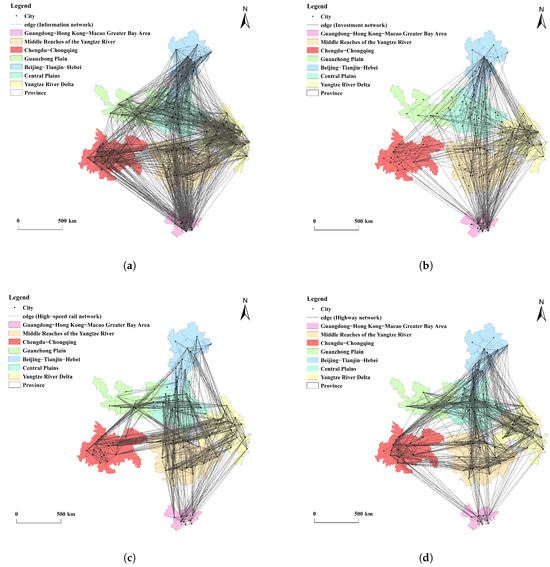
Figure 4.
Topology of the four types of urban networks: (a) information network; (b) investment network; (c) high-speed rail network; (d) highway network.
4. Results
4.1. Structural Features and Node Attribute Distribution
This paper first calculates and summarizes the basic structural features of the four types of urban networks analyzed, as shown in Table 4.
Table 4.
Structural features of the four types of urban networks.
The information network has the largest number of links and the highest proportion of the largest connected component, indicating that most of the sample cities have formed dense informational relationships. In contrast, the investment network has the smallest number of links, and the proportion of the largest connected component is significantly lower than in other types of networks, indicating that the investment network’s structure is sparse, with weaker investment ties between the sample cities and relatively dispersed investment relationships. For the high-speed rail and highway networks, the number of links for the high-speed rail network is slightly higher than those for the highway network. This suggests that the connections between sample cities based on high-speed rail services are stronger than those based on highway infrastructure. However, the similar levels of connectivity between cities in both types of networks indicate that the coverage of intercity relationships established by the two transportation systems does not show a significant difference. Furthermore, when comparing the average path lengths and clustering coefficients of the four types of networks with those of random networks, it is evident that none of the four networks exhibit a small-world phenomenon.
Based on the description of the basic structural features above, this study further analyzes the structural features of the nodes in the four types of urban networks. This study implemented the maximum likelihood estimation (MLE) method using the lmfit package in Python 3.7 to fit their distribution fitting and evaluated the fitting results referenced Clauset et al.’s testing method [55]. The fitting results are shown in Figure 5.
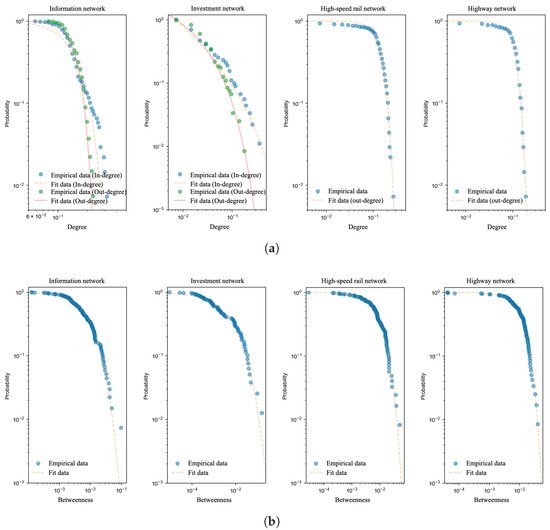
Figure 5.
Distribution of node attribute of urban networks: (a) degree centrality; (b) betweenness centrality.
The empirical data fitting reveals that the degree centrality and betweenness centrality of the nodes in the four types of networks follow a stretched exponential distribution, as shown in Equation (7):
This distribution is jointly regulated by the scale parameter and the stretch parameter (also referred to as the shape parameter). Generally, the scale parameter controls the decay location of the distribution, while the stretch parameter controls the concentration tendency and decay rate of the distribution. In general, when the stretch parameter is greater than 1, it indicates that the distribution has a distinct concentration point, and a larger stretch parameter implies that the distribution is more concentrated in the tail. Therefore, in a stretched exponential distribution, the stretch parameter has a stronger interpretive significance for the distribution. The fitting results of the stretch parameter for the centrality distributions of the four types of networks are shown in Table 5.
Table 5.
Results of fitting the stretched parameters of the centrality distribution of the four types of urban networks.
The results indicate that the stretch parameters for both degree centrality and betweenness centrality in the investment network are less than 1, suggesting that a large number of cities have low investment levels and investment control capabilities, with capital and investment being controlled by an extremely small scale of cities. Additionally, the stretch parameters for betweenness centrality in the information, high-speed rail, and highway networks are close to 1, indicating that the differences in the control of information, traffic flow, and infrastructure resources among the sample cities are relatively similar. Furthermore, it is noteworthy that the stretch parameters for the degree centrality distribution in the information, high-speed rail, and highway networks are generally greater than 1, indicating that the degree centrality of cities in these networks tends to concentrate within a certain range, with similar values within that range. However, a few cities outside this range exhibit a significantly higher degree of centrality than other cities, suggesting that central cities in certain urban agglomerations, such as Beijing, Chongqing, and Wuhan, dominate more resources, leading to an uneven distribution of urban resources. In addition to analyzing the structural features of network nodes, this paper also conducts statistical analysis and fits the socioeconomic attributes distributions of the sample cities; the results are shown in Figure 6.
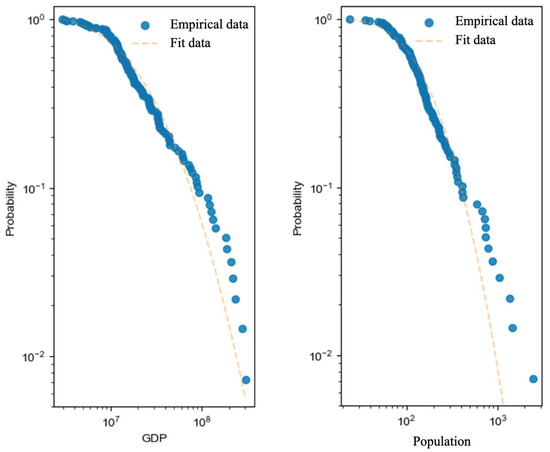
Figure 6.
Distribution of socioeconomic attributes of urban network nodes.
The fitting results show that the GDP and permanent resident population of the sample cities follow a log-normal distribution, indicating that the distribution of cities’ socioeconomic attributes is similar to their network structural features, both exhibiting heterogeneity. However, the log-normal distribution suggests that the differences in socioeconomic attributes, such as GDP and permanent resident population, among the sample cities share a degree of similarity, though relative differences between cities may be amplified by variations in economic levels. Moreover, it is observed from the distribution that a few cities in the tail of the distribution have socioeconomic attributes significantly higher than the fitted line. These cities are primarily concentrated in the Yangtze River Delta, the Greater Bay Area, and other central urban agglomerations, indicating that there are notable differences in socioeconomic attributes between central cities and other cities within the sample urban agglomerations. In summary, the statistical findings on the structural features and socioeconomic attributes of the sample cities suggest that these attributes can support two possible mixing patterns: disassortativity (centripetal agglomeration) and assortativity (balanced agglomeration). Therefore, this paper will further verify the two mixing patterns hypotheses by calculating the assortativity coefficients of urban agglomeration networks.
4.2. Mixing Patterns Analysis
Based on the statistical analysis of the basic structural features of urban agglomeration networks and the hypotheses regarding the two mixing patterns, this paper calculates the assortativity coefficients of degree centrality and betweenness centrality in the four types of networks for the sample urban agglomerations, along with their significance, as shown in Table 6 and Table 7. The assortativity coefficient of the information network between the sample cities is close to 0, indicating that information exchange between cities is not influenced by structural features such as information activity (out-degree), attention received (in-degree), or the degree to which cities control information exchange (betweenness centrality). Investment relationships between the sample cities exhibit significant disassortative features, with the disassortativity of betweenness centrality being higher than that of degree centrality. This suggests that capital flows between the sample cities show a pronounced centripetal mixing pattern, with capital flows at the global level being more easily controlled by central cities such as Beijing, Shanghai, and Shenzhen. The high-speed rail and highway networks display similar assortative features in terms of degree centrality, suggesting that intercity relationships in both networks tend to be established between cities with similar passenger flow levels or infrastructure scales. At the global level, the sample cities exhibit a balanced mixing pattern.
Table 6.
The node degree assortativity coefficient of the four types of urban networks.
Table 7.
The node betweenness centrality assortativity coefficient of the four types of urban networks.
For the urban networks of the seven urban agglomerations, only the Central Plains Urban Agglomeration, Guanzhong Plain Urban Agglomeration and the Middle Reaches of Yangtze River Urban Agglomeration exhibit significant assortative features in the information network. This suggests that the network structural features of the cities do not directly influence information exchange within urban agglomerations, and the level of information activity can result in distinct information mixing patterns within the urban agglomeration itself. For the investment network, except for the Central Plains Urban Agglomeration, which exhibits some assortativity in terms of in-degree, all other urban agglomerations show disassortativity in both degree centrality and betweenness centrality. This suggests a preference for a centripetal mixing pattern within urban agglomerations, where central cities not only control the direction of capital flow but also the pathways through which it moves. However, the in-degree of assortativity within the Central Plains Urban Agglomeration suggests a balanced mixing pattern, in which capital flows tend to occur between cities with similar levels of capital. The results for the high-speed rail network indicate that central cities such as Beijing, Guangzhou, Shenzhen, and Xi’an play critical roles within urban agglomerations, with significant differences in the structural positions of cities within these urban agglomerations. In urban agglomerations, the features of the highway networks are similar to those of the high-speed rail network, where highways are more likely to radiate outward from central cities to peripheral cities or converge from peripheral cities towards central cities, forming a centripetal mixing pattern.
Based on the analysis of structural assortativity in urban agglomeration networks, this paper further examines the assortativity features of urban agglomeration networks in terms of socioeconomic attributes, which are shown in Table 5 and Table 6. According to the statistical results in Table 8 and Table 9, the assortativity features of different types of global networks show a weak correlation between GDP and permanent resident population. Among the four types of networks, only the information network exhibits significant assortativity in both the GDP level and the permanent resident population, indicating that information flow between cities tends to occur between cities with similar socioeconomic attributes. In contrast, the investment network shows significant disassortativity only in terms of GDP, suggesting that capital tends to flow from cities with higher GDP to those with more average GDP on a national scale. The statistical results for the high-speed rail and highway networks indicate that economic disparities between cities do not significantly affect intercity transportation links on a global scale.
Table 8.
Assortativity coefficient for four types of urban networks based on GDP.
Table 9.
Assortativity coefficient for four types of urban networks based on the permanent resident population.
For the urban networks of the seven urban agglomerations, the assortativity coefficients for the Beijing–Tianjin–Hebei, Yangtze River Delta, Greater Bay Area, and Chengdu–Chongqing urban agglomerations show no correlation in the information network, indicating that information exchange between cities is not solely based on socioeconomic attributes. However, other urban agglomerations demonstrate strong disassortativity, implying that the socioeconomic development levels of these urban agglomerations influence the information connections between cities. For the investment network, most urban agglomerations show significant disassortative features, indicating that cities are more likely to connect with cities that have differing economic or permanent resident populations. Urban agglomerations with assortativity, on the other hand, tend to have relatively balanced economic levels or permanent resident populations, which structurally promotes capital synergy between similarly scaled cities. For the high-speed rail network, the assortativity coefficients for urban agglomeration networks show disassortativity or no correlation in terms of GDP and permanent resident population, indicating that high-speed rail services primarily connect cities with significant economic disparities. However, this trend is not as evident in the Beijing–Tianjin–Hebei, Yangtze River Delta, and Chengdu–Chongqing urban agglomerations. This suggests that for most urban agglomerations, the high-speed rail network takes into account differences and complementarities between cities. It is worth noting that in a few urban agglomerations, factors such as the density of the high-speed rail network, the frequency of train services, and geographic distance may diminish the impact of socioeconomic attribute differences on intercity relationships. For the highway network, the assortativity coefficients show similar results to the high-speed rail network, indicating that highway planning focuses more on complementarity between economic levels within urban agglomerations. Compared to the high-speed rail network, the flexibility and convenience of the highway network make its planning more adaptable to covering cities with different economic levels. However, the more pronounced disassortativity may also lead to an over-concentration of infrastructure, reinforcing the resource dominance of central cities and exacerbating the core–periphery structural differences within urban agglomerations.
4.3. Distribution of Network Assortativity Coefficients
Based on the previous discussion of structural and socioeconomic assortativity in urban networks, to further analyze the general patterns of assortativity features in urban networks and explain the mixing patterns of urban agglomerations, this paper conducts a statistical analysis of the assortativity coefficients of different types of networks in the studied urban agglomerations, as shown in Figure 7. The fitting results revealed that while different perspectives estimate the assortativity coefficient distributions of urban agglomeration networks, the assortativity coefficients generally follow a stretched exponential distribution with a scale parameter () and a stretch parameter ().
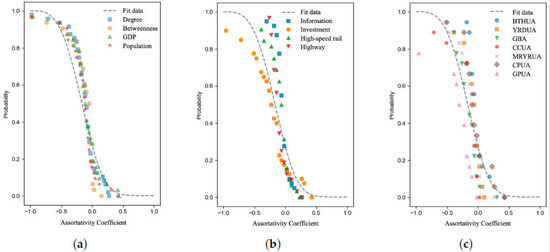
Figure 7.
Distribution and fitting of urban network assortativity coefficient: (a) different attributes; (b) different networks; (c) different urban agglomerations.
The findings for different assortativity coefficients (Figure 7a) show that the structural assortativity coefficient and the socioeconomic assortativity coefficient have similar scale and stretch parameters, indicating that the mixing patterns of cities based on these two types of attributes are statistically consistent. On the one hand, this suggests that intercity relationships, whether in terms of structural features or socioeconomic attributes, exhibit a centripetal mixing pattern. On the other hand, it indicates a correlation between structural features and socioeconomic attributes. Based on the fitting results for different network types (Figure 7b), the scale parameters of the information and high-speed rail networks are similar to those of the global distribution, but they exhibit higher stretch parameters. As a result, urban agglomeration networks show that they are not related to each other. The investment network, however, has the lowest stretch parameter among the four network types, meaning that the assortativity coefficient for this network is more likely to be negative, and disassortativity features are more pronounced. This indicates that the investment relationships in urban agglomerations exhibit a stronger centripetal mixing pattern. Additionally, the stretch parameter for the highway network is slightly higher than the global distribution parameter, with the assortativity coefficients mainly concentrated within a fixed range. This suggests that disassortative features are evident in the highway networks of urban agglomerations, with a prominent centripetal mixing pattern for transportation infrastructure within the urban agglomerations. After fitting the assortativity coefficient distributions of different urban agglomerations (Figure 7c), the Guanzhong Plain urban agglomeration has the opposite trend to the Yangtze River Delta urban agglomeration: it has the highest stretch parameter but a relatively small-scale parameter. The Yangtze River Delta, an urban agglomeration network, has stable differences in assortativity coefficients that are not correlated with each other. On the other hand, the Guanzhong Plain urban agglomeration has larger differences in assortativity coefficients and a very clear centripetal mixing pattern. Further, for other urban agglomeration networks, the statistical results suggest that the distributions of assortativity coefficients are similar. Higher stretch parameters mean that the assortativity coefficients of the Chengdu–Chongqing, Middle Reaches of Yangtze River, and Central Plains urban agglomerations are more likely to be close to zero, showing that they are not related to each other. The parameters for the Beijing–Tianjin–Hebei and Greater Bay Area urban agglomerations are close to those of the global distribution. This means that they show disassortative features, which is in line with the centripetal mixing pattern.
5. Discussion
This study constructed four types of urban networks, including information, investment, high-speed rail, and highway networks, and analyzed the mixing patterns in Chinese urban agglomerations based on both structural features and socioeconomic attributes. Therefore, some of the issues identified in the relevant studies are summarized from three perspectives: node attribute distribution, mixing patterns, and distribution of network assortativity coefficients.
Our analysis of the node attribute distribution revealed significant heterogeneity in cities’ structural features and socioeconomic attributes. Based on this observed heterogeneity, this study proposed and tested two potential mixing patterns: disassortative mixing (centripetal mixing pattern) and assortative mixing (balanced mixing pattern). These findings align with previous studies, for instance, research showing how core cities in the Yangtze River Delta dominated regional economic activities [10], and Ding demonstrated similar resource concentration patterns in the Chengdu–Chongqing Urban Agglomeration through network centrality analysis [14]. This network-based perspective provides a novel approach to understanding the formation mechanisms of urban agglomerations by quantitatively analyzing how cities of varying characteristics establish connections. Rather than merely identifying the hierarchical structure, this method reveals the underlying connection preferences in intercity relationships.
In studying the mixing patterns of different urban agglomeration networks, our network-based approach revealed distinct connection preferences across different types of networks. Specifically, this study found that high-speed rail and highway networks generally show disassortative mixing (centripetal mixing pattern) in terms of socioeconomic attributes, particularly within urban agglomerations, indicating these infrastructure networks tend to connect cities with significant economic disparities. However, this pattern shows notable exceptions in three major urban agglomerations. In the Beijing–Tianjin–Hebei region, high-speed rail network planning prioritizes regional coordinated development over economic efficiency. The Yangtze River Delta’s networks are designed primarily to serve as national comprehensive transportation corridors, while the Chengdu–Chongqing urban agglomeration’s development is largely shaped by the geographical constraints of the Sichuan Basin. These cases demonstrate that high-speed rail network development in urban agglomerations is influenced by national strategic objectives and regional coordination policies rather than purely socioeconomic disparities. In contrast to their socioeconomic mixing patterns, these networks display assortative features in terms of degree centrality, suggesting connections are more likely between cities with similar passenger flow levels or infrastructure scales. More importantly, our analysis of information and investment networks demonstrates different mixing patterns. Information networks show significant assortativity (balanced mixing pattern) in both GDP level and permanent resident population at the global scale, indicating information flows tend to occur between cities with similar socioeconomic attributes. In contrast, investment networks exhibit significant disassortative mixing (centripetal mixing pattern), particularly within urban agglomerations, suggesting capital tends to flow between cities of different economic scales. Previous studies have primarily focused on describing the hierarchical structure and spatial distribution of transportation networks or analyzing economic connection patterns separately [12,34]. Indeed, different types of networks play distinct roles in constructing intercity relationships [14]. While traditional infrastructure networks primarily reflect regional planning that emphasizes economic complementarity between cities (centripetal mixing pattern), information and investment networks reveal more complex connection preferences. These findings suggest that the mixing patterns of urban agglomerations are influenced by both network types and the underlying socioeconomic attributes of cities, offering a more nuanced understanding than previous structural analyses.
In terms of the distribution of network assortativity coefficients, this study found that the structural and socioeconomic assortativity coefficients of urban agglomerations follow a stretched exponential distribution with unified parameters. This distribution pattern remains consistent across different urban agglomerations and network types, suggesting an underlying universal mechanism in the formation of urban connections. Previous studies have primarily identified the existence of core–periphery structures in urban agglomerations [16], but our analysis of assortativity coefficient distributions provides quantitative evidence for how these structures form. For instance, investment networks consistently show the lowest stretch parameter among all network types, indicating a stronger tendency toward disassortative mixing (centripetal mixing pattern). This finding extends beyond the traditional understanding of resource concentration by revealing how economic interactions favor connections between dissimilar cities. Interestingly, our analysis revealed variations in mixing patterns across different urban agglomerations. While the Yangtze River Delta shows stable differences in assortativity mixing, suggesting a more balanced network structure, the Guanzhong Plain exhibits larger variations and a more pronounced assortativity mixing (centripetal pattern). These distinctions indicate that urban agglomerations may develop different connection strategies despite similar core–periphery structures. Finally, the higher stretch parameters observed in information and high-speed rail networks suggest that peripheral cities actively participate in network formation rather than simply depending on core cities.
The interaction between structural features and socioeconomic attributes in shaping network connections adds another layer to existing theories of urban agglomeration development. Consistent with other research [10,14], our analysis demonstrates that infrastructure distribution and cities’ structural positions play equally important roles in determining connection patterns.
The distribution patterns of network assortativity coefficients and centripetal agglomeration modes revealed in this study provide the following practical implications for urban agglomeration planning and resource allocation:
(i) Core cities in urban agglomerations demonstrate significant advantages in resource allocation. Therefore, during the development of urban agglomerations, governments should fully utilize the leading role of core cities by strengthening their connections with peripheral cities, promoting a rational flow of resources and economic activities, and achieving balanced regional development.
(ii) Different types of networks in urban agglomerations exhibit distinct mixing patterns. In the construction of high-speed rail and highway networks, the impact of geographical location on urban relationships should be fully considered. Through the rational layout of transportation infrastructure, connections between peripheral cities is strengthened, enhancing their resource acquisition capabilities and providing a scientific basis for optimizing infrastructure layout.
(iii) The structural and socioeconomic assortativity coefficients of urban agglomeration networks conform to a stretched exponential distribution with unified parameters. The unified distribution parameters derived in this study provide an effective tool for evaluating urban mixing patterns by comparing the distribution of assortativity coefficients across different urban agglomerations; characteristics of mixing patterns are identified, enabling governments to make targeted policy adjustments. For urban agglomerations with excessive centripetal agglomeration, policy measures should be implemented to encourage resource allocation towards peripheral cities, promoting balanced resource distribution and coordinated development within urban agglomerations. Furthermore, within broader urban network systems, this research methodology also helps identify mixing patterns among global cities, supporting coordinated development between nations and regions.
6. Conclusions
This study describes the structural assortativity of Chinese urban agglomeration from a new analysis perspective of complex network assortativity features. It shows the differences in the structural features and socioeconomic attributes of disassortative tendencies in intercity relationships within the urban agglomeration networks. This study has delineated the heterogeneity of urban agglomerations, where sample cities demonstrate distinct structural features and socioeconomic attributes, following stretched exponential and log-normal distributions, respectively. These distributions underscore the pronounced agglomeration of resource elements within urban contexts, thereby summarizing the objective centripetal mixing patterns of Chinese urban agglomeration. The research further establishes a clear correlation between the structural features and socioeconomic attributes of mixing patterns within urban agglomerations, suggesting a relationship between the network structure and the economic prowess of the urban agglomerations. Importantly, the assortativity coefficients of these networks adhere to a unified general probability density distribution, indicating an inherent propensity towards centripetal agglomeration in urban agglomerations. The assortativity coefficient distribution parameters that were found help us learn more about the formation of intercity relationships and the structural evolution mechanisms of urban agglomeration. This has a certain guiding significance for evaluating future urban agglomeration developmental patterns and proposing rational urban planning and economic policies.
Furthermore, while this study focuses on Chinese urban agglomerations, the analytical framework and methodological approach developed here can be readily applied to urban networks in other countries. The methods for analyzing the relationship between network structure features and socioeconomic attributes could provide valuable insights into urban agglomeration patterns across different national contexts. For instance, this approach could be particularly relevant for studying urban networks in countries experiencing rapid urbanization, where understanding the mechanisms of urban agglomeration is crucial for regional planning. In addition, the unified probability density distribution of assortativity coefficients found in Chinese urban agglomerations might serve as a reference point for comparative studies, helping to identify both universal patterns and unique characteristics in urban development across different geographical and socioeconomic contexts.
However, this study solely examines the assortativity coefficients and mixing patterns of static urban agglomeration networks from a cross-sectional viewpoint. Future work will analyze the evolutionary trends of assortativity coefficients using panel data from urban agglomerations or expand the research sample to cities, aiming to distill general characteristics of urban agglomeration networks. This will provide more scientific and effective guidance for planning urban agglomerations and economic development pathways in China.
Author Contributions
Conceptualization, K.Z.; methodology, K.Z., L.J. and S.X.; software, K.Z.; validation, S.X. and L.J.; formal analysis, L.J.; investigation, L.J.; resources, K.Z.; data curation, K.Z.; writing—original draft preparation, L.J.; writing—review and editing, K.Z.; visualization, K.Z. and L.J.; supervision, S.X.; project administration, S.X.; funding acquisition, K.Z. and S.X. All authors have read and agreed to the published version of the manuscript.
Funding
This research was supported by the Western Region Project of the National Social Science Foundation of China (23XGL034), the Social Science Foundation Project of Shaanxi Provincial (2019S044), the Natural Science Program of Shaanxi Province (2023-JC-YB-620), the Shaanxi Province Innovation Ability Support Plan (2024GH-GHJD-16), and the Fundamental Research Funds for the Central Universities (300102234611).
Institutional Review Board Statement
Not applicable.
Informed Consent Statement
Not applicable.
Data Availability Statement
These data were derived from the following resources available in the public domain: [high-speed rail operation data: https://www.12306.cn/index/; highway network data: https://www.openstreetmap.org/ (accessed on 1 July 2022); and China Statistical Yearbook (2017 to 2019). As such, socioeconomic data were obtained for the cities: https://www.stats.gov.cn/sj/ndsj/ (accessed on 1 October 2022)].
Acknowledgments
The financial support is gratefully acknowledged.
Conflicts of Interest
The authors declare no conflicts of interest.
References
- Zhang, B.; Zhang, J.; Miao, C. Urbanization level in Chinese counties: Imbalance pattern and driving force. Remote Sens. 2022, 14, 2268. [Google Scholar] [CrossRef]
- Huang, H.J.; Xia, T.; Tian, Q.; Liu, T.L.; Wang, C.; Li, D. Transportation issues in developing China’s urban agglomerations. Transp. Policy 2020, 85, A1–A22. [Google Scholar] [CrossRef]
- Liu, W.; Hou, Q.; Xie, Z.; Mai, X. Urban network and regions in China: An analysis of daily migration with complex networks model. Sustainability 2020, 12, 3208. [Google Scholar] [CrossRef]
- Farahani, R.Z.; Miandoabchi, E.; Szeto, W.Y.; Rashidi, H. A review of urban transportation network design problems. Eur. J. Oper. Res. 2013, 229, 281–302. [Google Scholar] [CrossRef]
- Zhang, F.; Ning, Y.; Lou, X. The evolutionary mechanism of China’s urban network from 1997 to 2015: An analysis of air passenger flows. Cities 2021, 109, 103005. [Google Scholar] [CrossRef]
- Dacey, M.F. The geometry of central place theory. Geogr. Ann. Ser. B Hum. Geogr. 1965, 47, 111–124. [Google Scholar] [CrossRef]
- Castells, M. Grassrooting the space of flows. Urban Geogr. 1999, 20, 294–302. [Google Scholar] [CrossRef]
- Yuan, X.; Wei, F.; Zhang, M.; Zhang, X. Spatial-temporal evolution of technology flows in China’s Beijing-Tianjin-Hebei region: Patent transfer networks 2003–2021. PLoS ONE 2024, 19, e0301509. [Google Scholar] [CrossRef] [PubMed]
- Wang, H.; Zhang, X.; Zhang, X.; Liu, R.; Ning, X. Understanding coordinated development through spatial structure and network robustness: A case study of the Beijing-Tianjin-Hebei region. J. Geogr. Sci. 2024, 34, 1007–1036. [Google Scholar] [CrossRef]
- Zhang, Y.; Wang, T.; Supriyadi, A.; Zhang, K.; Tang, Z. Evolution and optimization of urban network spatial structure: A case study of financial enterprise network in Yangtze River Delta, China. ISPRS Int. J. Geo-Inf. 2020, 9, 611. [Google Scholar] [CrossRef]
- Wang, Z.; Fang, C.; Cheng, S.; Wang, J. Evolution of coordination degree of eco-economic system and early-warning in the Yangtze River Delta. J. Geogr. Sci. 2013, 23, 147–162. [Google Scholar] [CrossRef]
- Wang, F.; Wei, X.; Liu, J.; He, L.; Gao, M. Impact of high-speed rail on population mobility and urbanisation: A case study on Yangtze River Delta urban agglomeration, China. Transp. Res. Part A Policy Pract. 2019, 127, 99–114. [Google Scholar] [CrossRef]
- Pan, J.; Lai, J. Spatial pattern of population mobility among cities in China: Case study of the National Day plus Mid-Autumn Festival based on Tencent migration data. Cities 2019, 94, 55–69. [Google Scholar] [CrossRef]
- Ding, R.; Fu, J.; Zhang, Y.; Zhang, T.; Yin, J.; Du, Y.; Du, L. Research on the evolution of the economic spatial pattern of urban agglomeration and its influencing factors, evidence from the Chengdu-Chongqing urban agglomeration of China. Sustainability 2022, 14, 10969. [Google Scholar] [CrossRef]
- Guo, Z.; Li, Z.; Lu, C.; She, J.; Zhou, Y. Spatio-temporal evolution of resilience: The case of the Chengdu-Chongqing urban agglomeration in China. Cities 2024, 153, 105226. [Google Scholar] [CrossRef]
- Ma, J.C.; Wang, L.; Jiang, Z.Q.; Yan, W.; Zhou, W.X. City logistics networks based on online freight orders in China. Phys. A Stat. Mech. Appl. 2021, 583, 126333. [Google Scholar] [CrossRef]
- Newman, M.E. Mixing patterns in networks. Phys. Rev. E 2003, 67, 026126. [Google Scholar] [CrossRef] [PubMed]
- Newman, M.E. The structure and function of complex networks. SIAM Rev. 2003, 45, 167–256. [Google Scholar] [CrossRef]
- Fang, C.; Yu, D. Urban agglomeration: An evolving concept of an emerging phenomenon. Landsc. Urban Plan. 2017, 162, 126–136. [Google Scholar] [CrossRef]
- Choe, K. City Cluster Development: Toward an Urban-Led Development Strategy for Asia; Asian Development Bank: Manila, Philippines, 2008. [Google Scholar]
- Hirsch, W.Z. Interindustry relations of a metropolitan area. Rev. Econ. Stat. 1959, 41, 360–369. [Google Scholar] [CrossRef]
- Ren, Y.; Tian, Y.; Xiao, X. Spatial effects of transportation infrastructure on the development of urban agglomeration integration: Evidence from the Yangtze River Economic Belt. J. Transp. Geogr. 2022, 104, 103431. [Google Scholar] [CrossRef]
- Wang, Y.; Cheng, H.; Huang, L. Water resources carrying capacity evaluation of a dense city group: A comprehensive water resources carrying capacity evaluation model of Wuhan urban agglomeration. Urban Water J. 2018, 15, 615–625. [Google Scholar] [CrossRef]
- Pan, F.; Zhao, S.X.; Wójcik, D. The rise of venture capital centres in China: A spatial and network analysis. Geoforum 2016, 75, 148–158. [Google Scholar] [CrossRef]
- Duan, L.; Sun, W.; Zheng, S. Transportation network and venture capital mobility: An analysis of air travel and high-speed rail in China. J. Transp. Geogr. 2020, 88, 102852. [Google Scholar] [CrossRef]
- Yexi, Z.; Xinghua, F.; Yuzhao, W. The evolvement and driving mechanism of economic network structure in the Changjiang river economic zone. Sci. Geogr. Sin. 2016, 36, 10. [Google Scholar]
- Song, Q.; Zhao, X.Z.; Li, T.S.; Liu, J. Spatial structures and influencing factors of multiple urban networks based on the perspective of directed-multivalued relation. Prog. Geogr. 2018, 37, 1257–1267. [Google Scholar]
- Yao, Z.; Ye, K.; Xiao, L.; Wang, X. Radiation Effect of Urban Agglomeration’s Transportation Network: Evidence from Chengdu–Chongqing Urban Agglomeration, China. Land 2021, 10, 520. [Google Scholar] [CrossRef]
- Tian, Y.; Kan, C.; Li, X.; Dang, A. An analysis of agglomeration structure for Beijing, Tianjin, and Hebei based on spatial-temporal big data. Comput. Urban Sci. 2024, 4, 11. [Google Scholar] [CrossRef]
- Yang, H.; Du, D.; Wang, J.; Wang, X.; Zhang, F. Reshaping China’s urban networks and their determinants: High-speed rail vs. air networks. Transp. Policy 2023, 143, 83–92. [Google Scholar] [CrossRef]
- Xin, M.; Feng, S. Urban rail transit network topology evolutionary stage has influence on rail ridership: Insights from linear mixed-effects models with heterogeneity in variances. Transp. Res. Part A Policy Pract. 2024, 180, 103951. [Google Scholar] [CrossRef]
- Hu, R.; Xu, W. What’s going on? Urban agglomerations and firm green innovation: Evidence from Chengdu-Chongqing Economic Circle, China. J. Clean. Prod. 2023, 414, 137662. [Google Scholar] [CrossRef]
- Zhang, H.; Jiang, L.; Zhou, J.; Chu, N.; Li, F. The characteristics and influencing factors of spatial network of city-based innovation correlation in China: From the perspective of high tech zones. Sci. Rep. 2023, 13, 16289. [Google Scholar] [CrossRef] [PubMed]
- Jin, Y.; Xu, M.; Wang, W.; Xi, Y. Venture capital network and the M&A performance of listed companies. China Financ. Rev. Int. 2021, 11, 92–123. [Google Scholar]
- Li, C.; Duan, X. Exploration of urban interaction features based on the cyber information flow of migrant concern: A case study of China’s main urban agglomerations. Int. J. Environ. Res. Public Health 2020, 17, 4235. [Google Scholar] [CrossRef]
- Lin, Q.; Xiang, M.; Zhang, L.; Yao, J.; Wei, C.; Ye, S.; Shao, H. Research on urban spatial connection and network structure of urban agglomeration in Yangtze River Delta—Based on the perspective of information flow. Int. J. Environ. Res. Public Health 2021, 18, 10288. [Google Scholar] [CrossRef]
- Watts, D.J.; Strogatz, S.H. Collective dynamics of’small-world’networks. Nature 1998, 393, 409–410. [Google Scholar] [CrossRef] [PubMed]
- Zhang, M.; Huang, T.; Guo, Z.; He, Z. Complex-network-based traffic network analysis and dynamics: A comprehensive review. Phys. A Stat. Mech. Appl. 2022, 607, 128063. [Google Scholar] [CrossRef]
- Lai, J.; Pan, J. China’s city network structural characteristics based on population flow during spring festival travel rush: Empirical analysis of “tencent migration” big data. J. Urban Plan. Dev. 2020, 146, 04020018. [Google Scholar] [CrossRef]
- Liu, H.; Zhang, Y.; Sang, Z.; Wang, W.; Zhang, L.; Li, M. Connection Characteristics and Hierarchical Structure of China’s Urban Network-Based on the Communications Technology Service Industry. Complexity 2022, 2022, 6143293. [Google Scholar] [CrossRef]
- Ma, F.; Yang, Z.; Zhao, S.; Yuen, K.F.; He, H.; Sun, Q.; Shang, Z. Assessing the development level of logistics for sustainable cities in urban agglomeration based on a multi-layer complex network. Systems 2022, 10, 171. [Google Scholar] [CrossRef]
- Doherty, I.A.; Adimora, A.A.; Muth, S.Q.; Serre, M.L.; Leone, P.A.; Miller, W.C. Comparison of sexual mixing patterns for syphilis in endemic and outbreak settings. Sex. Transm. Dis. 2011, 38, 378–384. [Google Scholar] [CrossRef] [PubMed]
- Barabási, A.L.; Albert, R. Emergence of scaling in random networks. Science 1999, 286, 509–512. [Google Scholar] [CrossRef] [PubMed]
- Newman, M.E. Assortative mixing in networks. Phys. Rev. Lett. 2002, 89, 208701. [Google Scholar] [CrossRef] [PubMed]
- Ye, S.; Qian, Z. The economic network resilience of the Guanzhong plain city cluster, China: A network analysis from the evolutionary perspective. Growth Change 2021, 52, 2391–2411. [Google Scholar] [CrossRef]
- Wang, L.; Hu, H.; Shao, X. The dynamic evolution of the structure of an urban housing investment niche network and its underlying mechanisms: A case study of 35 large and medium-sized cities in China. Sustainability 2022, 14, 3523. [Google Scholar] [CrossRef]
- Zhou, C.; Li, M.; Zhang, G.; Chen, J.; Zhang, R.; Cao, Y. Spatiotemporal characteristics and determinants of internal migrant population distribution in China from the perspective of urban agglomerations. PLoS ONE 2021, 16, e0246960. [Google Scholar] [CrossRef]
- Zhong, Y.; Chen, Y.; Qiu, J. Study on the Spatial Structure of the Complex Network of Population Migration in the Poyang Lake Urban Agglomeration. Sustainability 2023, 15, 14789. [Google Scholar] [CrossRef]
- He, D.; Chen, Z.; Pei, T.; Zhou, J. Analysis of structural evolution and its influencing factors of the high-speed railway network in China’s three urban agglomerations. Cities 2023, 132, 104063. [Google Scholar] [CrossRef]
- Ma, H.; Xu, X.; Li, X.; Liu, J. Towards innovation resilience through urban networks of co-invention: A case study of cities in China. Front. Earth Sci. 2022, 10, 974219. [Google Scholar] [CrossRef]
- Gao, Y.; Ye, L. Characteristics and evolution of knowledge innovation network in the Yangtze River Delta urban agglomeration—A case study of China National Knowledge Infrastructure. PLoS ONE 2023, 18, e0283853. [Google Scholar] [CrossRef] [PubMed]
- Locurcio, M.; Tajani, F.; Anelli, D. Sustainable urban planning models for new smart cities and effective management of land take dynamics. Land 2023, 12, 621. [Google Scholar] [CrossRef]
- He, Y.; Sherbinin, A.D.; Shi, G.; Xia, H. The Economic Spatial Structure Evolution of Urban Agglomeration under the Impact of High-Speed Rail Construction: Is There a Difference between Developed and Developing Regions? Land 2022, 11, 1551. [Google Scholar] [CrossRef]
- Coscia, M.; Neffke, F.M. Network backboning with noisy data. In Proceedings of the 2017 IEEE 33rd International Conference on Data Engineering (ICDE), San Diego, CA, USA, 19–22 April 2017; pp. 425–436. [Google Scholar]
- Clauset, A.; Shalizi, C.R.; Newman, M.E.J. Power-law distributions in empirical data. SIAM Rev. 2009, 51, 661–703. [Google Scholar] [CrossRef]
Disclaimer/Publisher’s Note: The statements, opinions and data contained in all publications are solely those of the individual author(s) and contributor(s) and not of MDPI and/or the editor(s). MDPI and/or the editor(s) disclaim responsibility for any injury to people or property resulting from any ideas, methods, instructions or products referred to in the content. |
© 2025 by the authors. Licensee MDPI, Basel, Switzerland. This article is an open access article distributed under the terms and conditions of the Creative Commons Attribution (CC BY) license (https://creativecommons.org/licenses/by/4.0/).