1. Introduction
The Federal Highway Administration’s (FHWA) Traffic Incident Management (TIM) program provides direct support to state agencies through the provision of novel tools and techniques designed to improve the detection, response to and resolution of traffic incidents as quickly as possible. Importantly, the goal of the TIM Program is to “continuously improve the safety of responders and road users, the reliability of travel, and the efficiency of incident and emergency response” [
1].
Since 1996, all 50 states have passed “Move Over” laws designed to improve the safety of first responders and other roadside workers. Generally, these laws require motorists to change lanes in order to leave the lane adjacent to the responder or worker free from traffic. When changing lanes is not possible, these laws require motorists to slow down by a set amount from the posted speed limit. By freeing up the lane adjacent to the responder or worker, a “buffer” is created in an attempt to reduce the likelihood of a collision by passing motorists. When a motorist is unable to change lanes, the required speed reduction is also intended to minimize the chance of a collision.
Although Move Over laws have been in place for many years, the number of responders and other roadside workers struck by passing motorists continues to be a significant safety problem. Nearly 30 roadside workers, first responders, tow truck drivers, or other field personnel supporting roadway operations are killed every year due to the failure of motorists to comply with Move Over laws. In fact, annual work zone deaths have risen from 586 in 2010 to 857 in 2020 [
2], and FHWA has found that secondary accidents account for more than 20% of all crashes.
In the past decade, various efforts have been employed to improve roadside worker and responder safety, including the use of new technologies, some of which have been developed by state transportation agencies in-house. Many of these solutions complement existing Move Over laws by, for example, deploying improved incident barriers and using real-time alerts regarding the need to “Move Over” due to the presence of workers or responders in the motorist’s direction of travel. Despite these efforts, the number of injuries to workers and responders remains high.
Beginning in September 2020, FHWA issued an award to Battelle Memorial Institute, the University of Maryland’s Center for Advanced Transportation Technology (UMD CATT), and the Volpe National Transportation System Center to conduct a comprehensive, data-driven assessment of existing Move Over laws in the United States. This effort included large dataset analytics covering multiple states and regions as well as automated incident scene observations using state-of-the-art object detection and tracking (ODT) technologies already developed and deployed by UMD CATT. The ODT solution has been modified to focus on tracking vehicles as they travel by first responders (transportation, Fire/EMS, and/or law enforcement) who are stopped on the highway with alert lights engaged.
In our study, we would like to investigate the problem of Move Over law compliance rates depending on various conditions, such as advance warnings or incident type, whether there is any factor that significantly improves the compliance rates, and whether factors such as advanced knowledge of the incident or its seriousness have no impact. Data derived from this research can be leveraged to improve motorist compliance with “Move Over” laws. Through the isolation of specific factors, including but not limited to, incident type, responder vehicles present (e.g., law enforcement versus transportation), roadway topography, and time of day, more specific public awareness campaigns and/or targeted notifications can be implemented to increase motorist compliance. In addition, further analysis of these data can help to inform changes to “Move Over” laws in order to better target enforcement around specific incidents types, locations, and times that may improve overall compliance. ODT technologies can be automatically integrated into existing highway camera video, thereby creating real-time “Move Over” compliance monitoring and enforcement systems. Similar to automated speed enforcement efforts, this solution may significantly improve motorist behavior in “Move Over” situations, notably through the increased public awareness, including some initial resistance to this type of enforcement, which has historically generated strong reactions from the general public that in turn, result in greater awareness and discussion, including by the media.
This paper makes two key contributions to Move Over law compliance analysis. First, we introduce an automated deep learning-based system that detects and evaluates compliance using object detection and tracking techniques. Second, we perform a large-scale, multi-state assessment using real-world traffic video data, offering new empirical insights into driver behavior under different incident conditions. These contributions provide a foundation for data-driven policy improvements, enhanced enforcement strategies, and more targeted public awareness campaigns.
Data Availability
Although the original highway video processed using the ODT solution is no longer available, the resulting ODT output can be shared with researchers in order to aid in further analysis. These data will be provided by the authors upon request. In addition, various elements of the ODT solution are published in an open-source repository, which can also be provided to requestors.
2. Literature Review
Responder vehicles are emergency vehicles such as police cars, fire trucks, and ambulances and towing/recovery vehicles. The crashes of responder vehicles have been a significant issue throughout the US. A total of 122 police officers were killed throughout the US while on duty because of the collision by vehicles from 2009 to 2018. This could explain nearly 8% of officer fatalities and 23% of fatalities related to on-road motor vehicle incidents [
3]. A study conducted in Ohio revealed that crashes involving patrol cars constituted just 4% of all incidents included these vehicles, but 55% resulted in severe injuries. Moreover, about two-thirds of these crashes happened on roads with high speed and volume [
4]. A study on first responder roadway safety in Florida estimated the financial cost of crashes for these vehicles in 2016, 2017, and 2018. Based on this study, 13, 24 and 16 crashes with fatality involved first responders occurred at Florida in 2016, 2017, and 2018. These crashes account for 1.2%, 1.19%, and 1.21% of the total crashes in 2016, 2017 and 2018. The most crashes among first responder vehicles in all three years were related to police vehicles. The potential liabilities for all first responders to the state of Florida was estimated at more than USD 29 million, USD 31 million, and USD 44 million in 2016, 2017, and 2018, respectively [
5].
Move Over laws state that motorists should slow down. If possible, motorist should change lanes away from the responder vehicles on the shoulder, providing space for incident responders and reducing the risk of crashes. The “Move Over” law has been enacted in all 50 U.S. states and the District of Columbia; however, it should be mentioned that the emergency responder vehicle types covered in each state and the actions required for drivers vary [
6]. For example, Move Over laws in some states only cover emergency vehicles, but in some other states, such as Florida and North Carolina, they cover emergency and towing/recovery vehicles. Additionally, some states such as California and Georgia cover transportation maintenance vehicles as well. Animal control vehicles are another type of responder vehicles that are covered in the Move Over law in the state of Alaska [
7].
When moving over to another lane is not possible or unsafe, drivers should slow down. Some states force drivers to reduce their speed to a specific amount which is less than the posted speed limit. For example, if the speed limit is 25 miles per hour, motorists should slow down to 20 miles per hour or less [
6]. However, some other states do not determine a specific amount for speed and only require drivers to reduce their speed to a safe or reasonable speed.
Raising public awareness about Move Over laws is important and could significantly impact the safety of emergency responders and reduce crashes and injuries. State agencies are taking action using media campaigns. Examples of efforts made in different states for raising public awareness are websites dedicated to describing the laws, signage along highways, public service announcements and commercials, brochures, flyers, and information sheets [
6,
7].
A study investigated the effectiveness and impact of Move Over laws on safety improvement [
8]. In this study, the Move Over law compliance for motorists in a section of Florida freeways was quantified by using marked research vehicle and a police vehicle at each staged stop, a video of passing traffic, and a laser speed calculation device for calculating speed of passing vehicle. They investigated more than 9000 vehicles located on the right lane of Florida freeways in north and central Florida. They computed the Move Over law compliance in Florida as equal to 75.9%, but the compliance to slowing down without moving over was 5.8%. Moreover, it was concluded that blue and red emergency lights on patrol vehicles increased compliance to 80%. The compliance was 68.8% when only amber lights were used.
Another study examined secondary crashes in Florida involving emergency incident responders in which breaking of Move Over laws occurred [
9]. Crashes from 2011 to 2020 were investigated and 519 crashes with Move Over laws cited were found. The data showed that over half of accidents due to Move Over law violations happened on roads where the speed limit was 45 mph or lower. The study showed that in incidents where emergency responders were struck by vehicles, several factors were significant, including the operation on the side-facing traffic during the incident scene, law enforcement officers, and the absence of high-visibility safety apparel. Although the majority of incidents happened on local roadways, towing operators were at higher risk of severe injuries on higher-speed roadways.
Megat-Johari et al. [
3] examined driver behavior in some scenarios in Michigan, in which emergency/service vehicles were positioned on the freeway shoulder with their lights activated. Moreover, they investigated the effectiveness of using upstream Dynamic Message Signs (DMS) on driver behavior in these scenarios. The data of speed and lane positions were driven from emergency/service vehicles in two locations and vehicles on the closest lane to the right upstream of the DMS. They evaluated the compliance of driver with the Move Over law using logistic regression models considering factors such as vehicle type on the shoulder, and the displayed message on the DMS. The findings showed that the presence of a police vehicle on the shoulder has a significant impact on speed reduction compared to other responder vehicles such as transportation service vehicles. Additionally, it was discovered that the type of message shown on DMS did not have a notable influence on driver’s behavior. There was only one exception, where motorists drive below the speed limit when seeing a move over message on the DMS compared to general travel time messages.
Although previous studies have investigated Move Over law compliance and its impact on traffic safety, many of these studies have relied on traditional data analysis methods. In contrast, recent advancement in machine learning has shown that these models can be effective in the field of traffic safety [
10,
11,
12,
13,
14,
15,
16]. Many studies have utilized machine learning algorithms for prediction of traffic accidents or high-risk areas, prediction of lane-changing behavior, and traffic monitoring. For instance, Kan et al. [
17] explored the integration of YOLOv5 and DeepSORT within a digital twin framework to enhance urban traffic management, demonstrating how deep learning can be leveraged for comprehensive vehicle detection and movement analysis. A similar approach has been also utilized for real-time vehicle detection and accident risk evaluation using the COCO dataset, which achieved a high detection accuracy [
18]. The authors also evaluated the incident risk by computing detected object distances and potential accident points. Another study utilized Internet of Things (IoT) sensors with machine learning algorithms to detect potential hazards in roadway construction zones [
19]. The high accuracy of the model indicated reliable results that could provide alerts to construction workers and minimize accident risk. Furthermore, deep learning approaches have been employed to predict lane change behavior and have offered some insights into vehicle trajectory patterns and improvements for decision-making in autonomous driving [
20,
21]. Machine learning has also been applied in dynamic traffic management. One study utilized self-adaptive machine learning and real time traffic data, and it effectively detected and tracked vehicles moving in the wrong direction [
22]. The results emphasized the important role that machine learning models have in managing traffic flow and addressing safety concerns in transportation systems.
Despite significant advances in applying machine learning and deep learning algorithms for traffic safety purposes, previous studies have not used these tools for calculating Move over law compliance. This study introduces a deep learning framework that evaluates vehicle behavior and Move Over law compliance by using object detection and tracking algorithms and videos from the incident scenes. Moreover, previous studies have not comprehensively investigated influential factors on compliance rates of Move Over law; however, this study examines the effect of various factors such as incident scenes, responder types, and traffic flow characteristics on compliance rates.
3. Methodology
This section describes the methods and materials that were used during the data collection phase of the observational study.
3.1. Data Collection
The proposed method used multiple camera views (when they were available) to capture video of incident scenes from different perspectives. The primary camera used was the pole-mounted Traffic Message Channel (TMC) closed-circuit camera. These cameras were mounted high above the roadway and offered an elevated view of upstream traffic on their approach to the incident scene.
The following eight states/agencies participated by providing video incidents (
Table 1). The characteristics for each video—such as the number of lanes, weather, time of day, the geographical characteristics (rural vs. urban), and type of incident—were varied, allowing for a more detailed analysis.
3.2. Video Data Processing–Object Detection and Tracking
ODT is a software system developed by the University of Maryland (UMD) and specifically adapted to the evaluation of video to perform research of Move Over compliance. The software system was developed around the three primary challenges: object detection, object tracking, and assessment of Move Over law compliance. Through a series of tests, algorithm specifications were identified that were shown to provide a high degree of accuracy in the assessment of Move Over law compliance.
3.2.1. Object Detection
For object detection, several open-source and publicly available software were identified and evaluated, including but not limited to, the TensorFlow Object Detection API [
23]. To train the object detection model, we built a new dataset using MATLAB’s Ground Truth Labeler App to interactively label ground truth data for vehicles in each video. For each video, we defined the rectangular Region Of Interest (ROI) labels for two types of vehicles: passenger cars and trucks. Overall, we collected more than 100,000 objects, and they were used as the inputs for the object detection model.
After initial tests, the Faster Region-based Convolutional Neural Network (Faster R-CNN) [
24] Inception V2 [
25] model was selected. Since our study involved offline video processing rather than real-time inference, we prioritized accuracy over speed. Faster R-CNN, despite being computationally intensive, was chosen due to its superior ability to detect small and distant objects [
26,
27], which was critical for accurately identifying far-away vehicles in surveillance footage. While our pipeline supports YOLO and SSD, these models were less effective in capturing smaller objects under varying lighting conditions.
In addition, various online camera feeds, including existing Maryland State Highway Administration traffic cameras as well as standalone cameras, were used to test the object detection software and to assess the impact of video quality on detection accuracy. This helped to formulate minimal requirements for the processed videos.
3.2.2. Object Tracking
Several object tracking methodologies were assessed, including the use of Kernelized Correlation Filter (KCF) [
28,
29], Multiple Instance Learning (MIL) tracking [
30,
31], and Deep Simple Online Realtime Tracking (DeepSORT) [
32]. In addition, several methods were assessed on how to best identify the location of the tracked objects and visualize them on a dynamic mapping interface. For the presented application, DeepSORT turned out to be the best solution. It was selected due to its robustness in handling occlusions and maintaining consistent vehicle identities across frames. Given that Move Over law compliance analysis required tracking vehicles over multiple frames, ensuring high tracking accuracy was critical. Other tracking methods, KCF and MIL, were both considered, but during the initial research they showed inferior performance in maintaining vehicle identities across longer sequences.
3.2.3. Move Over Compliance Detection
Move Over compliance detection is based on vehicle position analysis with respect to a particular lane and the distance to a vehicle at a roadside incident. The algorithm’s logic is centered on three related classifications:
Determining if a vehicle is subject to the Move Over law;
Determining if the vehicle moved over, given that it was judged to be subject to the Move Over law;
Determining if the vehicle slowed down, given that it was judged to be subject to the Move Over law.
Move over laws vary from state to state, and at this stage of research, we are still not sure how to address these differences. Among the currently examined options the most promising ones seem to be the following:
Assume that everyone should Move Over (ignore the slow-down analysis).
Assume that slowing down is enough to comply with Move Over laws. In this case, we also need a slow-down threshold that determines whether the vehicles slowed down sufficiently. Such a threshold can be an absolute value (e.g., a vehicle slowed down by at least 20 mph) or relative (e.g., a vehicle slowed down by at least 20%).
Perform additional analyses that try to determine if it was possible to Move Over. Such analyses may be based on the particular scene characteristics (e.g., sufficient space on the adjacent lane) or on traffic volumes (e.g., if traffic volume is not excessive, we may believe that it is always possible to move over).
Bullets two and three require additional assumptions. Moreover, exploratory data analysis shows that in the majority of cases, the traffic was not close to capacity (in 94.6% of scenes the traffic was below 2000 vehicles/lane/hour), so it was probably usually possible to move over. Thus, in this study, we decided to assume that the vehicles comply with the Move Over law only if they physically moved over (changed a lane). Specifically, we defined a lane change as compliance only when the center of the vehicle fully shifted into an adjacent lane. Partial lane changes, such as slight drifting or straddling lane markers, were not considered compliance to ensure objective and consistent evaluation.
3.3. Evaluating Algorithm Accuracy
To evaluate algorithm accuracy, the base video was overlaid with bounding boxes for each vehicle moving through the frame. With this visual tool, an informed observer could reproduce the results of the algorithm. For the observational study, a small sample of each video was evaluated to establish that the ODT accuracy during the test was consistent with the ODT development and pilot testing. The ODT accuracy was evaluated from a partial, manual tabulation of each incident video. Results varied from 75% to 100%. The average accuracy across the 68 videos was 89%. A detailed accuracy analysis is presented in
Table 2.
4. Results
This section summarizes the findings of processing 68 incident scene videos to extract the Move Over law compliance pattern. We analyzed several important factors including responder vehicles types present at the incident site, vehicles affected by MO law, and advance warning signs (for details, see
Table 3). The results are presented below, including a brief analysis of each case. A summary of the results is presented in
Table 4.
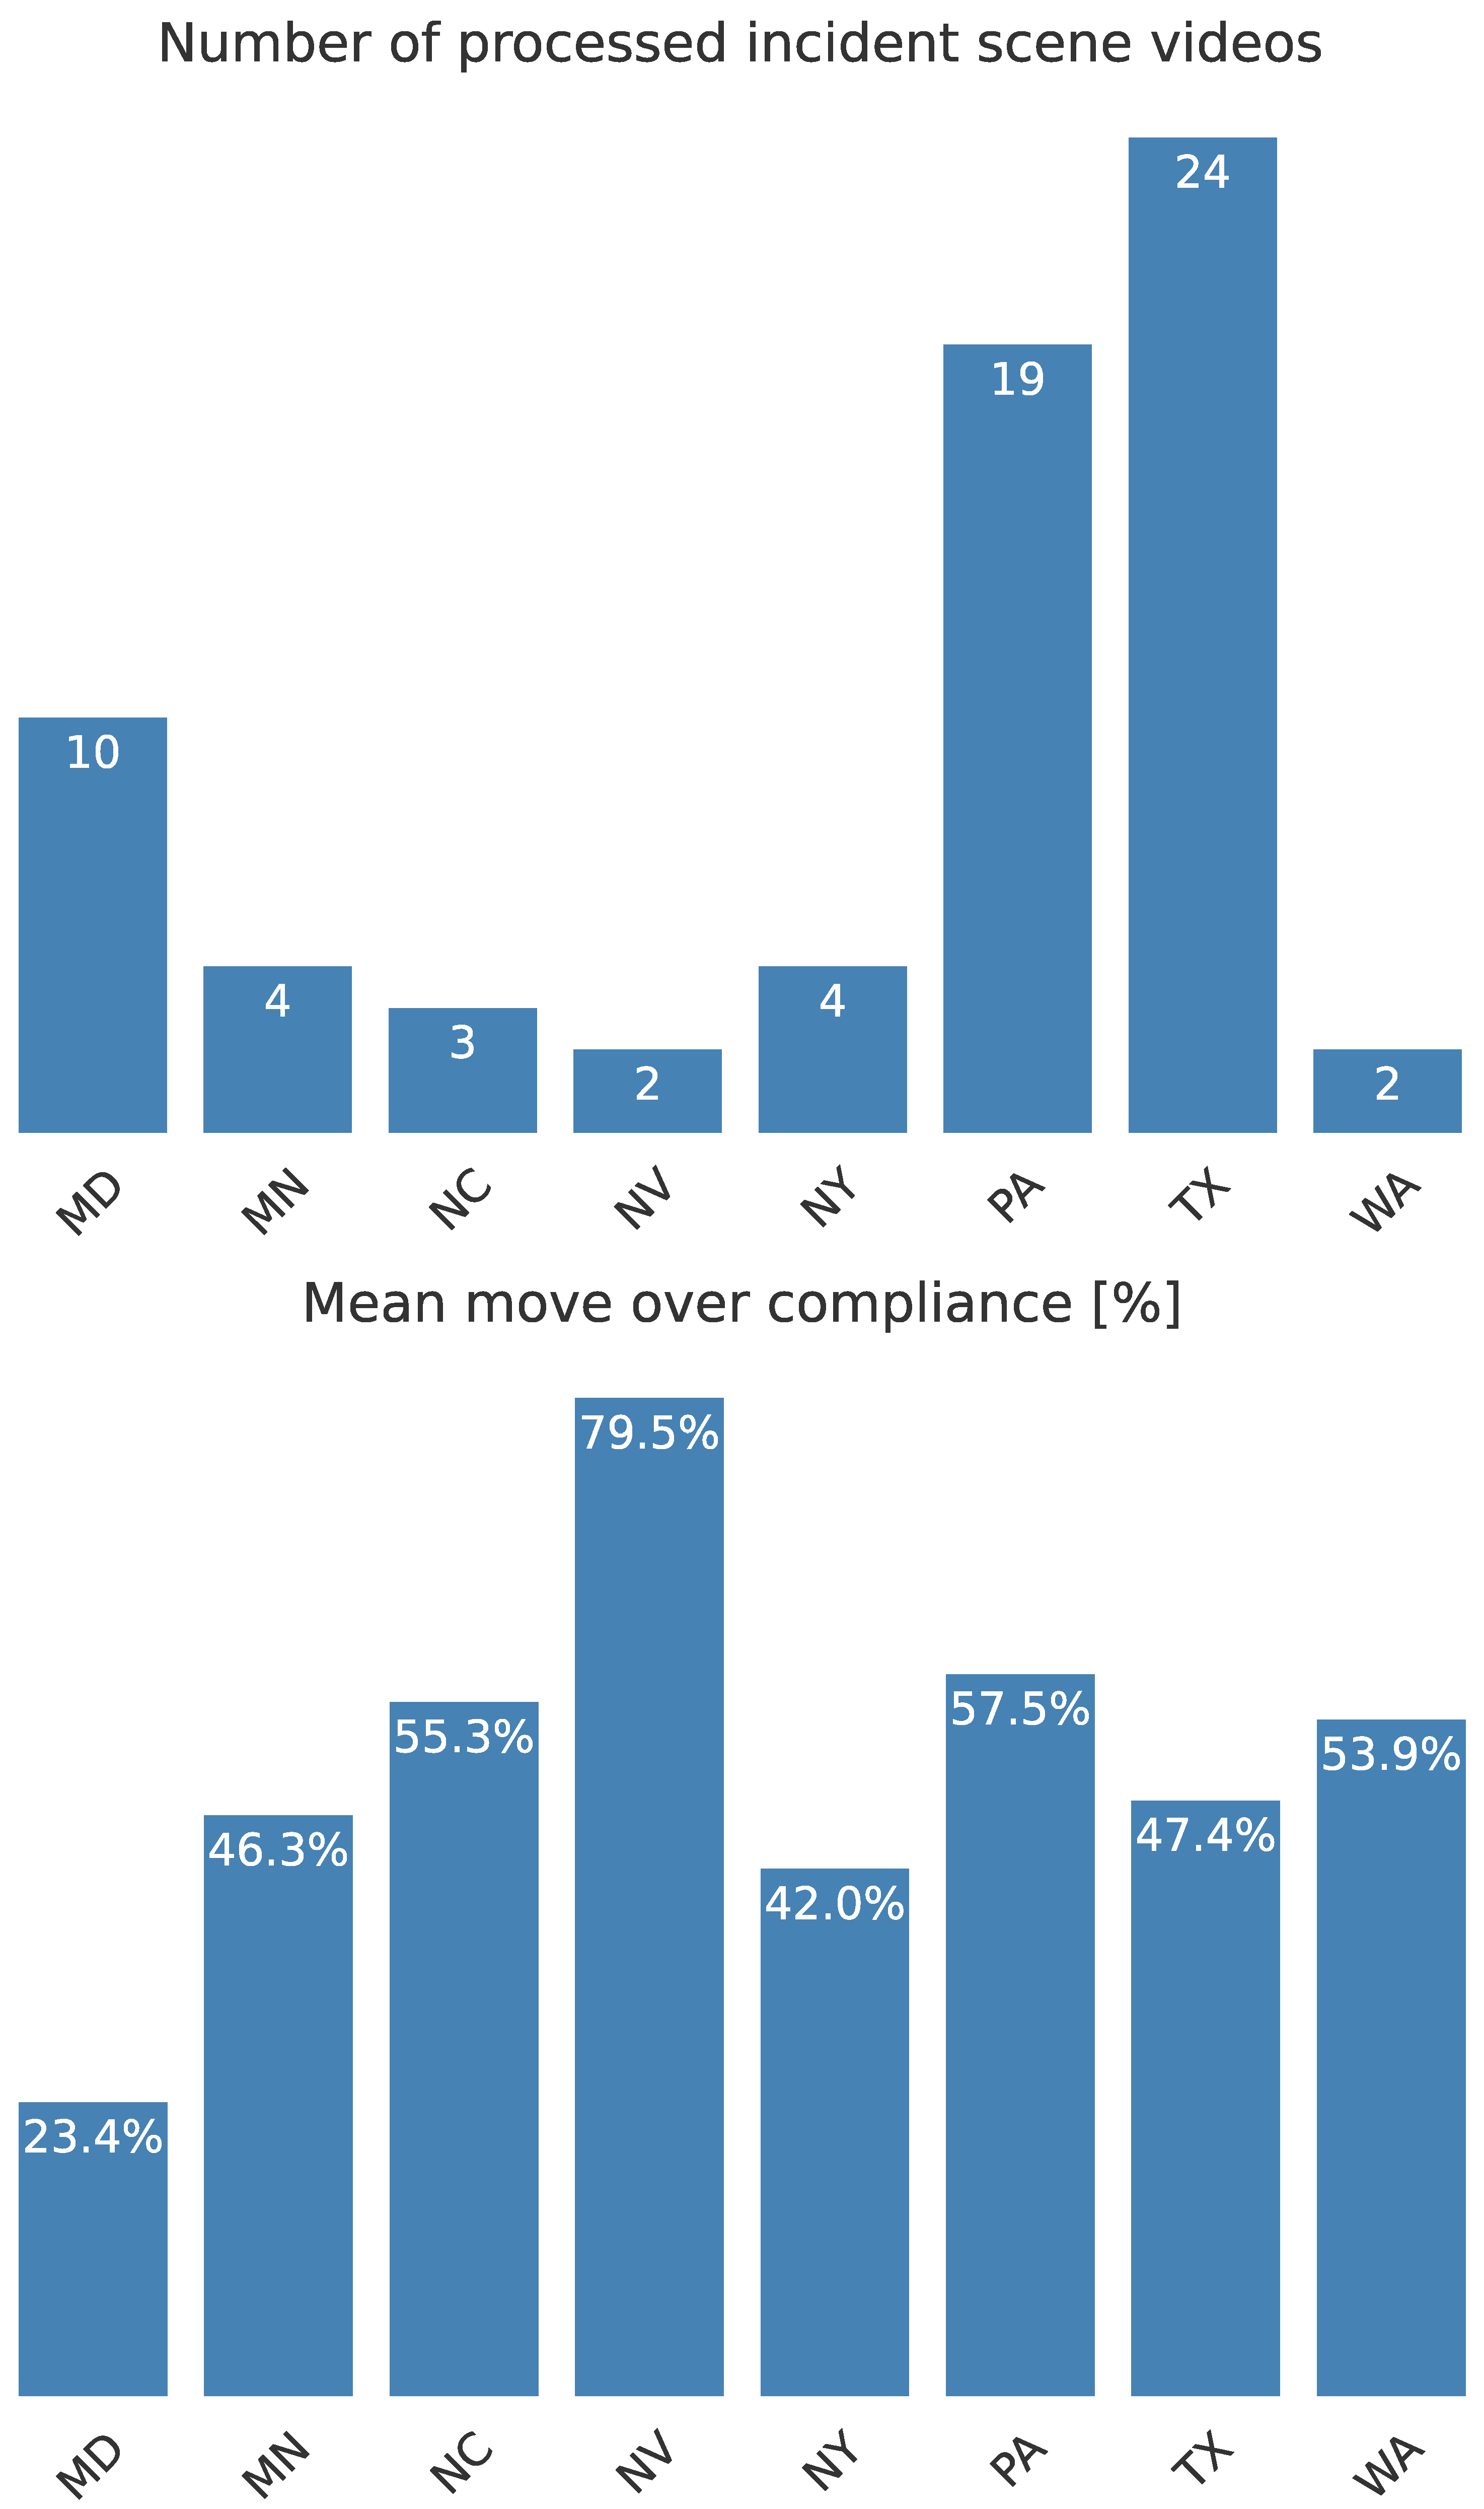
The geographical count distribution of the processed videos based on their state is presented in
Figure 1. Additionally, this figure shows the average compliance rate in the processed incident scene for each state. According to this figure, the compliance rate is around 50% for most states considered in this study. However, the amount of available data for the majority of these states was not enough to draw a general conclusion based on the state-specific policies. Nevertheless, there are other factors whose impact on the Move Over law compliance rate can be investigated given the available data. This study investigated the Move Over law compliance rate based on responder scene, incident location, and traffic flow characteristics. The considered variables and their categories are presented in
Table 3. The rest of this section provides visualizations and statistical analysis to compare the compliance rate between variable category pairs.
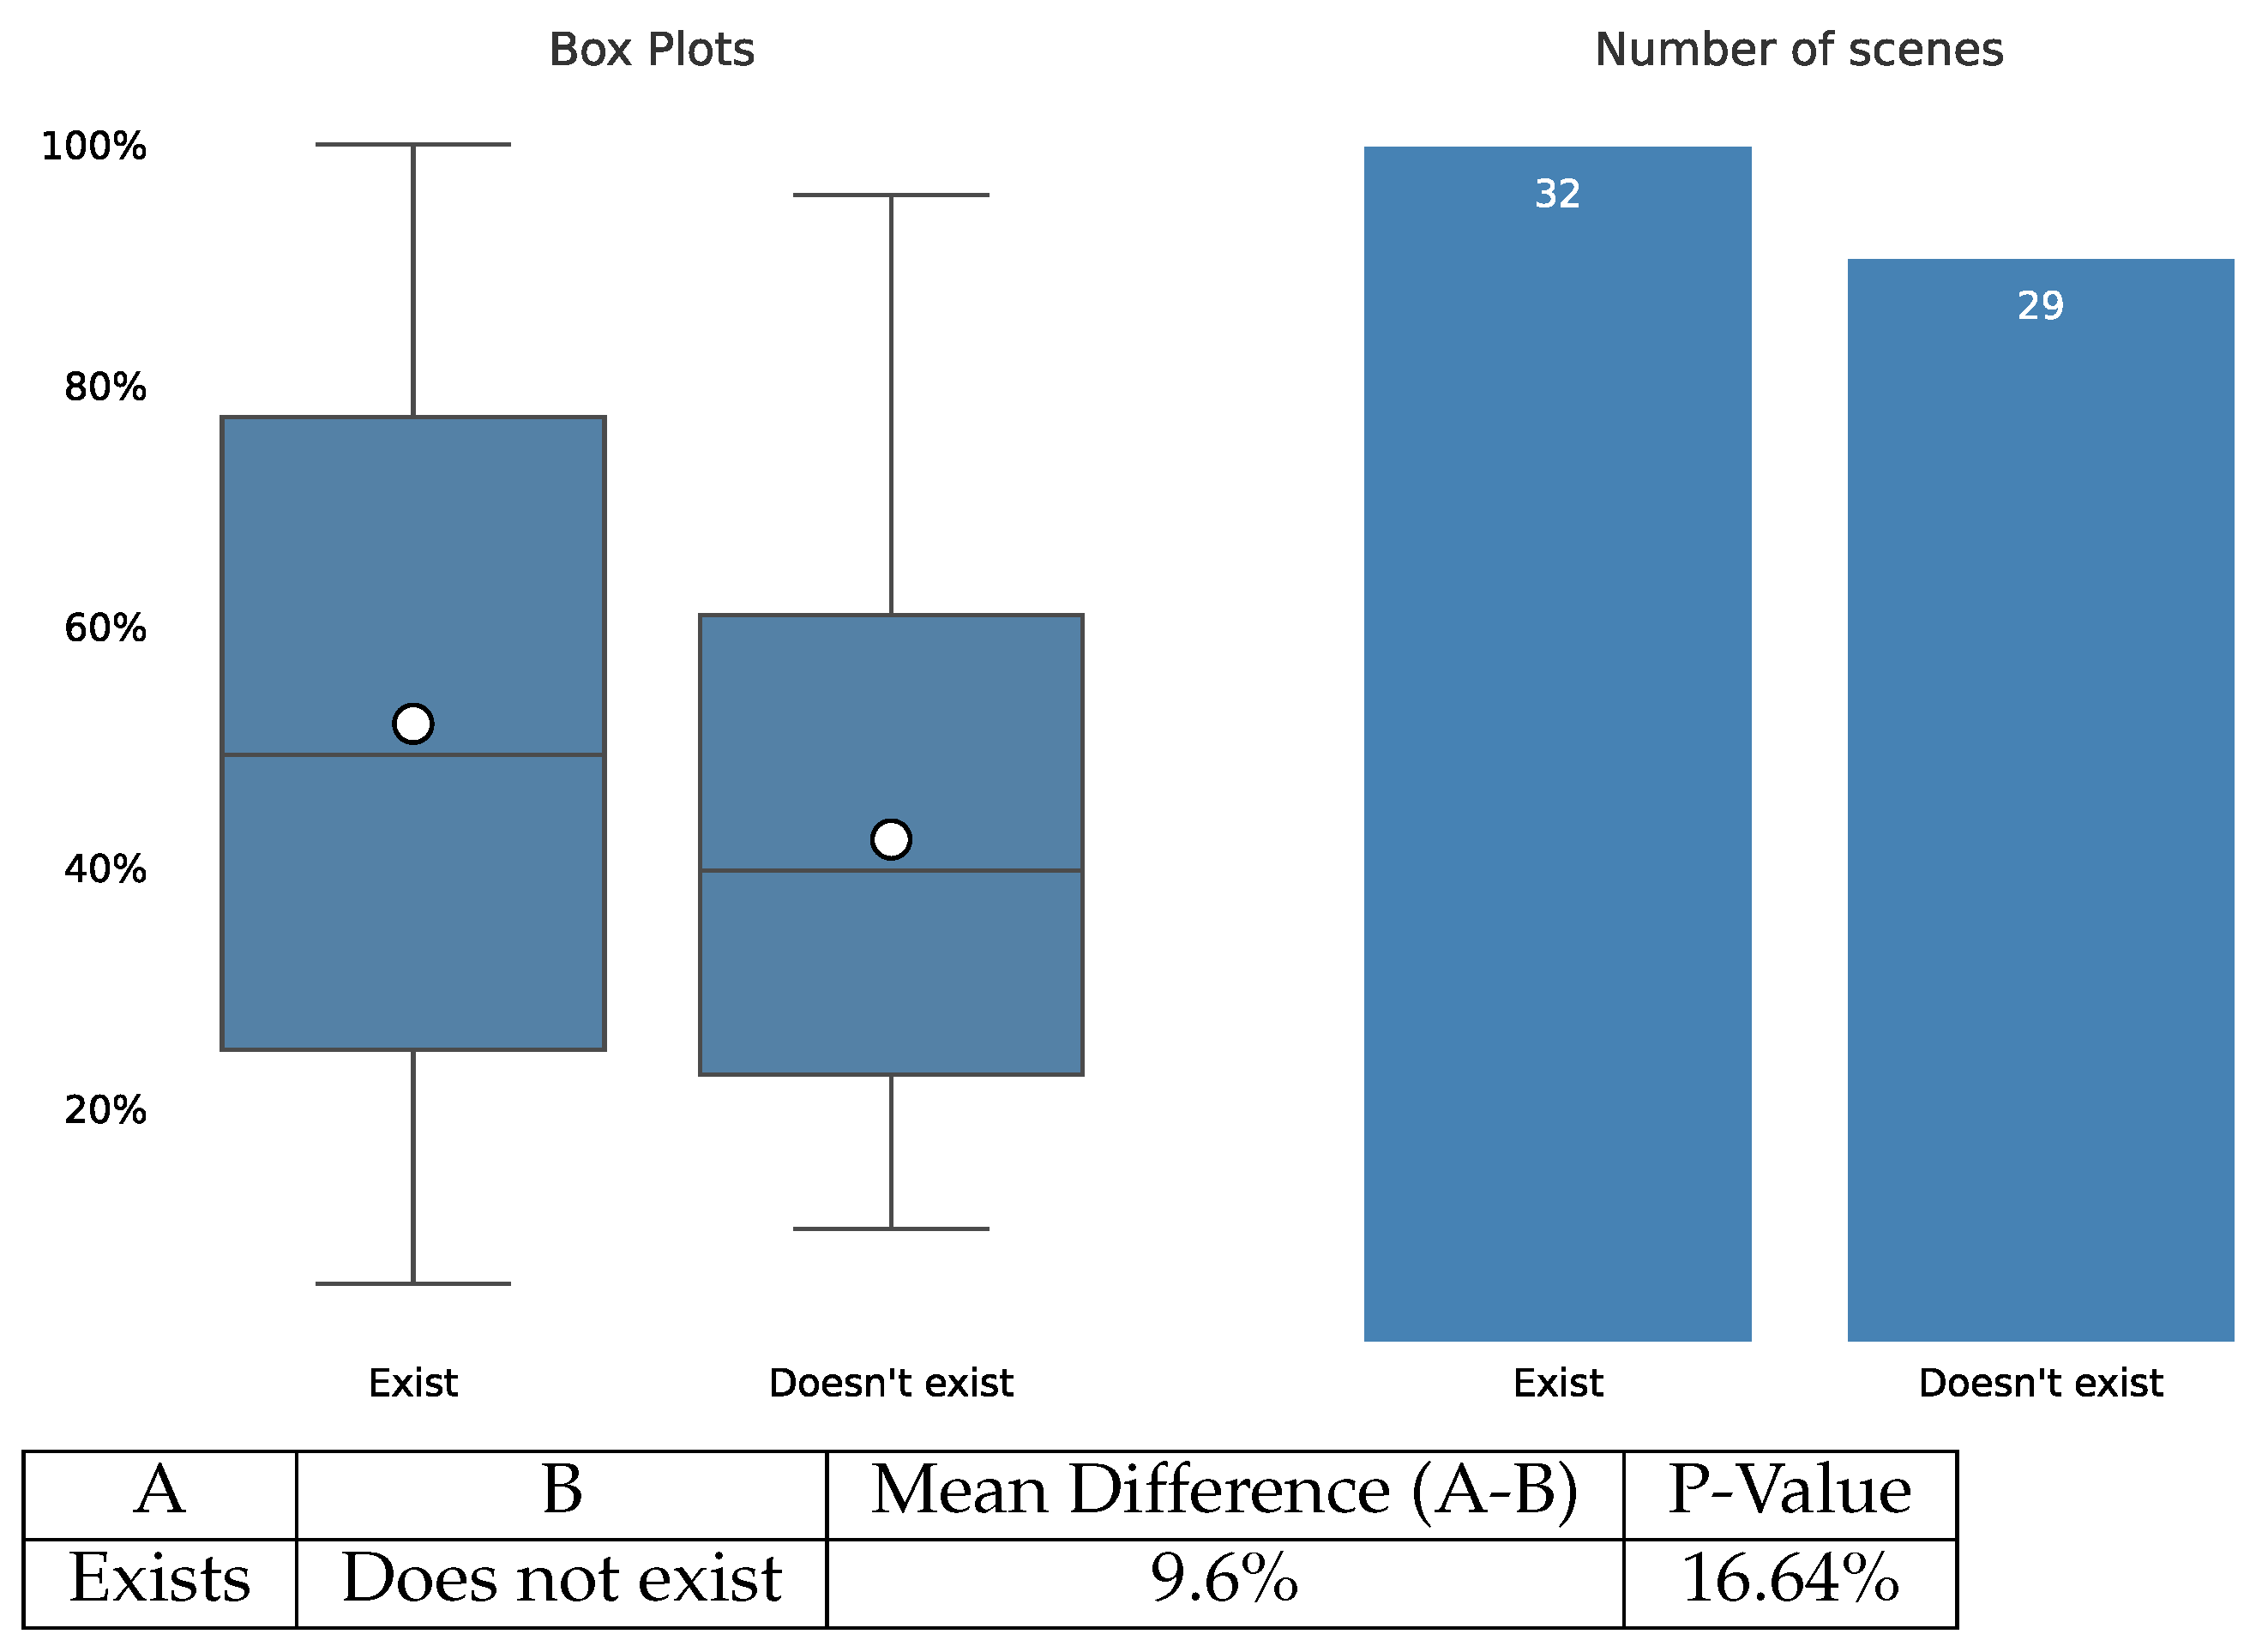
4.1. Advance Warning Sign
Figure 2 illustrates the compliance rate distribution for incident scenes when an advance warning sign (i.e., a flashing arrow sign) exists versus those cases where there was no warning sign at the scene. Additionally, this figure shows the count distribution of the incident scene based on the existence of the advance warning sign category and presents the
p-value of comparing the two categories’ compliance rate mean values using the t-test. According to this figure, the mean compliance rate is 9.6% higher when there is an advance warning sign at the incident scene. This difference is statistically significant, with a probability of 83.36%.
4.2. Responder Vehicle Type
Figure 3 illustrates the compliance rate distribution for the available incident scenes based on the responder vehicle type. According to the statistical analysis presented in this figure, the difference in compliance rate is not significant (i.e., high
p-values) when there is a safety patrol or a police vehicle or when both vehicle types are at the scene.
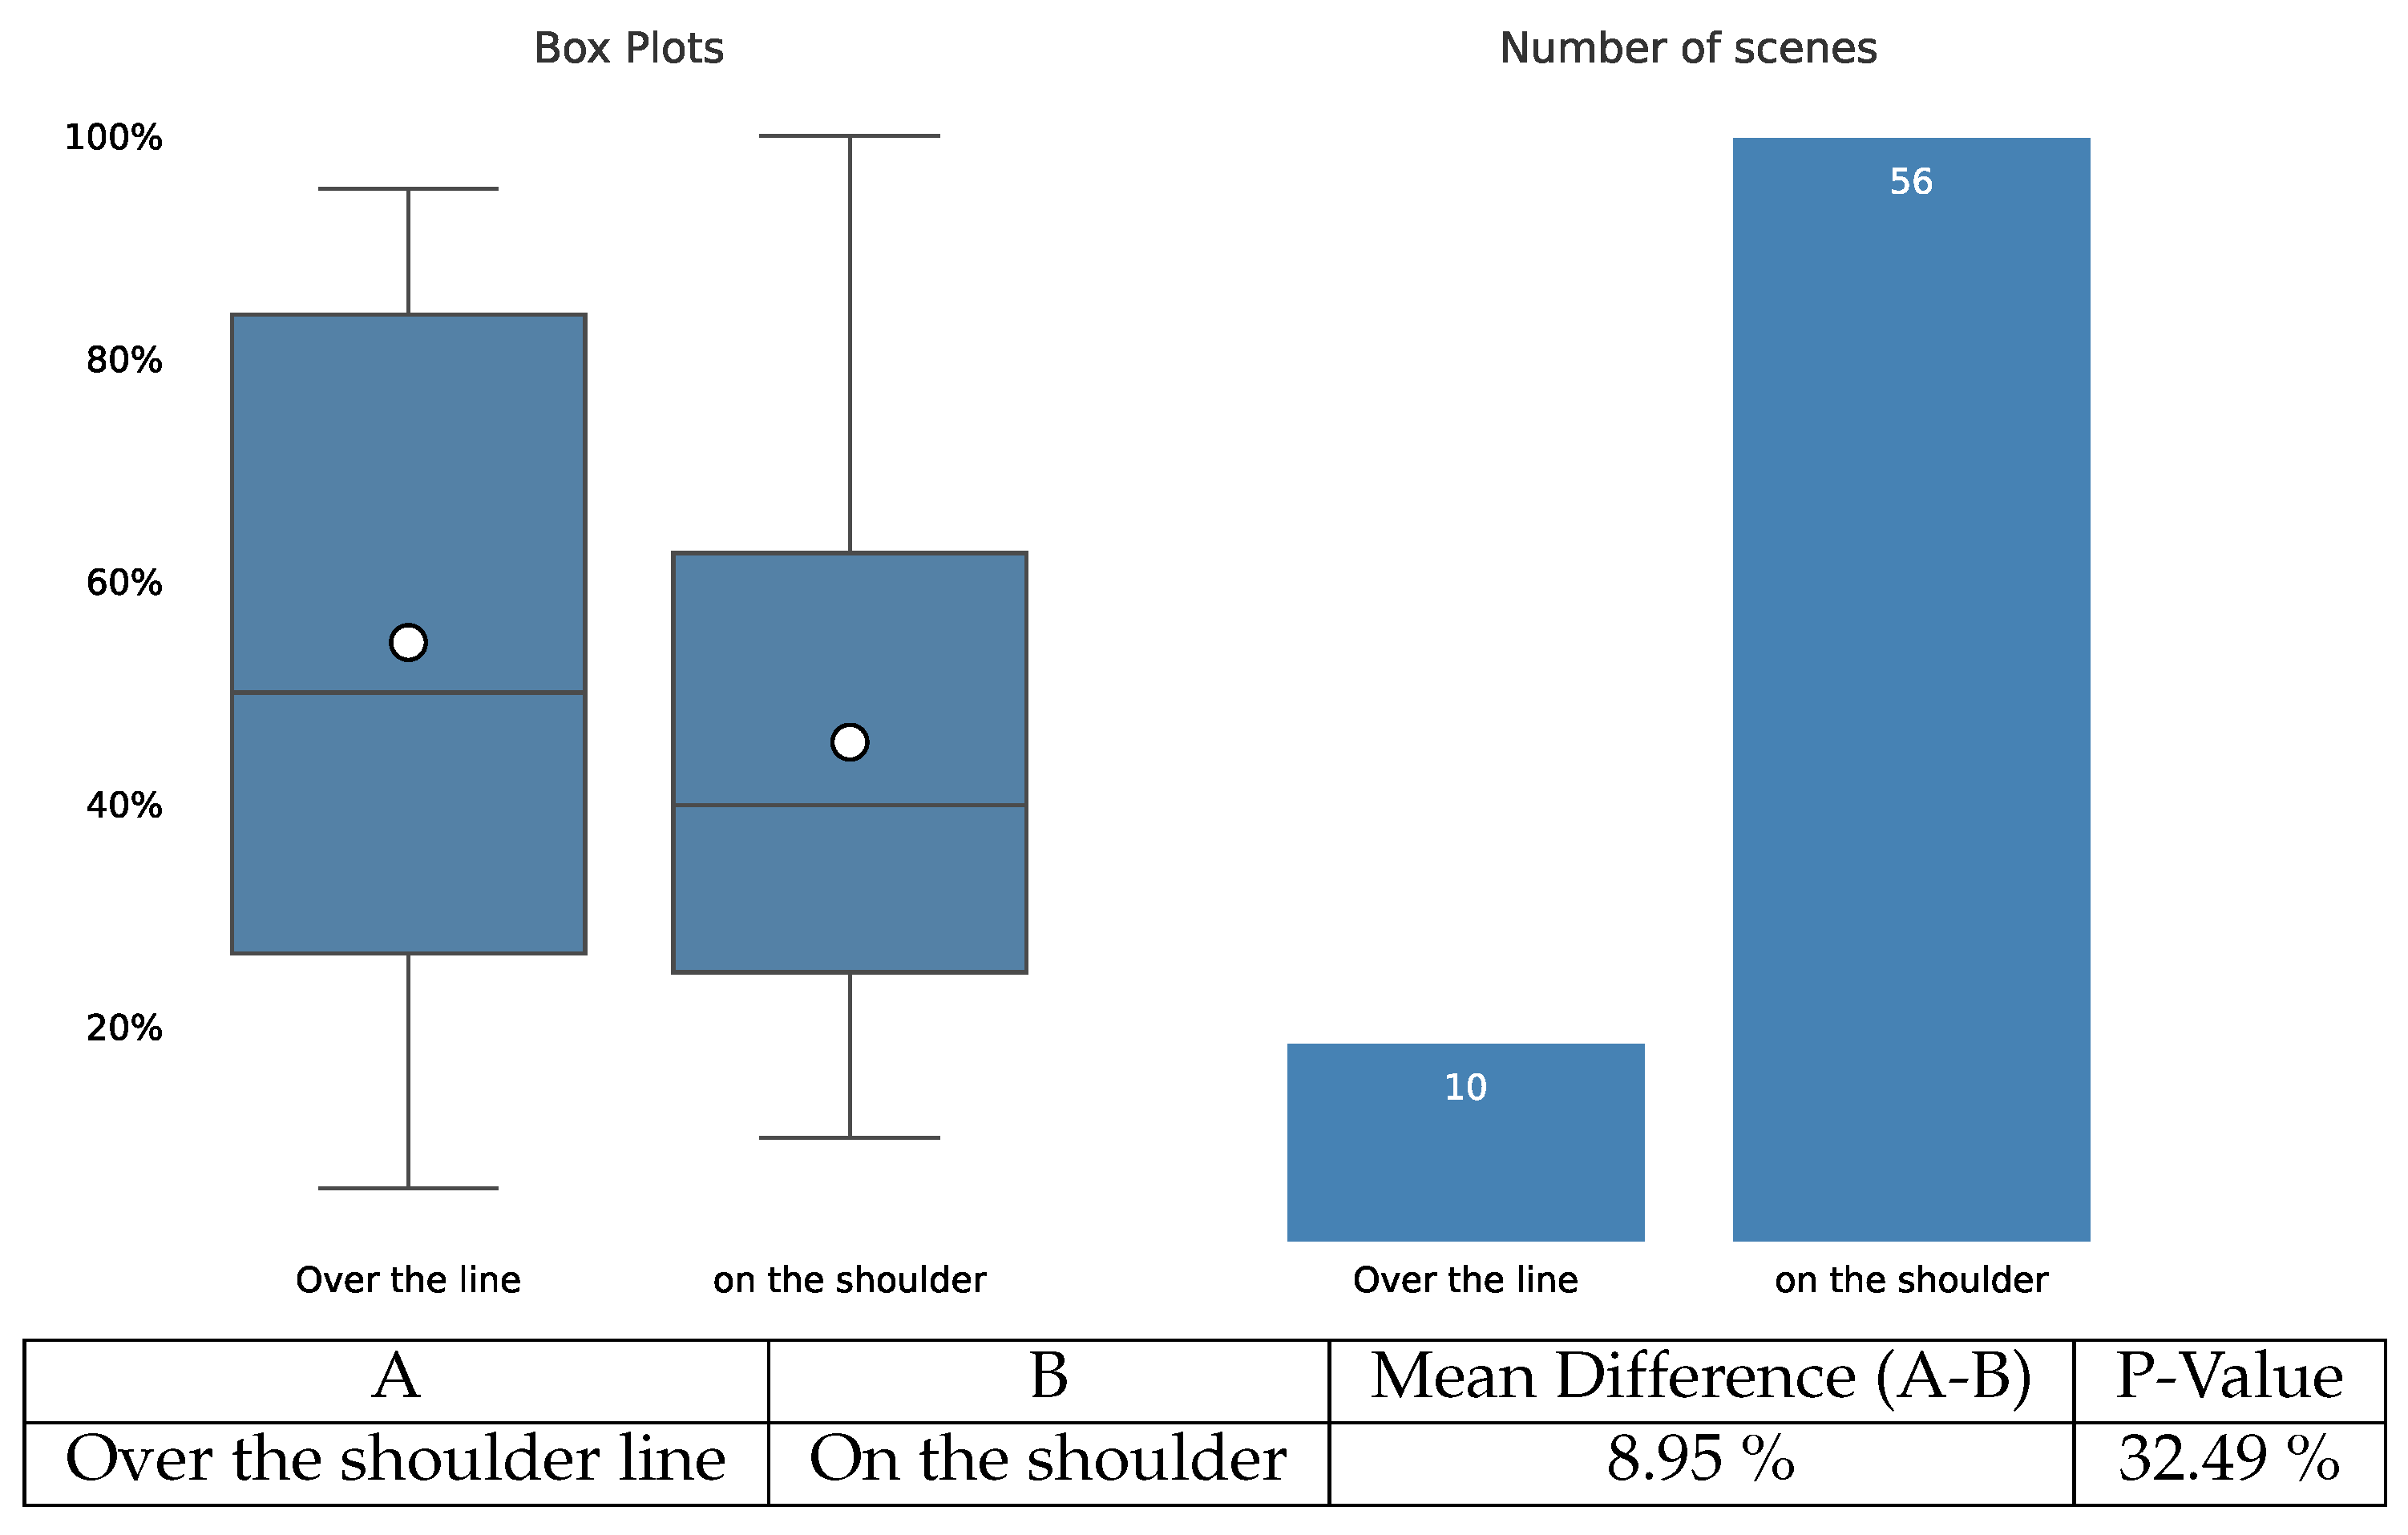
4.3. Responder Vehicle Position
Figure 4 illustrates the compliance rate distribution based on the position of the responder vehicle with respect to the shoulder line. For clarity,
Figure 5 shows an example of when a responder vehicle parks over the shoulder line. According to
Figure 4, the compliance rate distribution tends to be higher when the responder vehicle protrudes; however, the mean compliance rate difference between these two situations has a level of significance less than 70%.
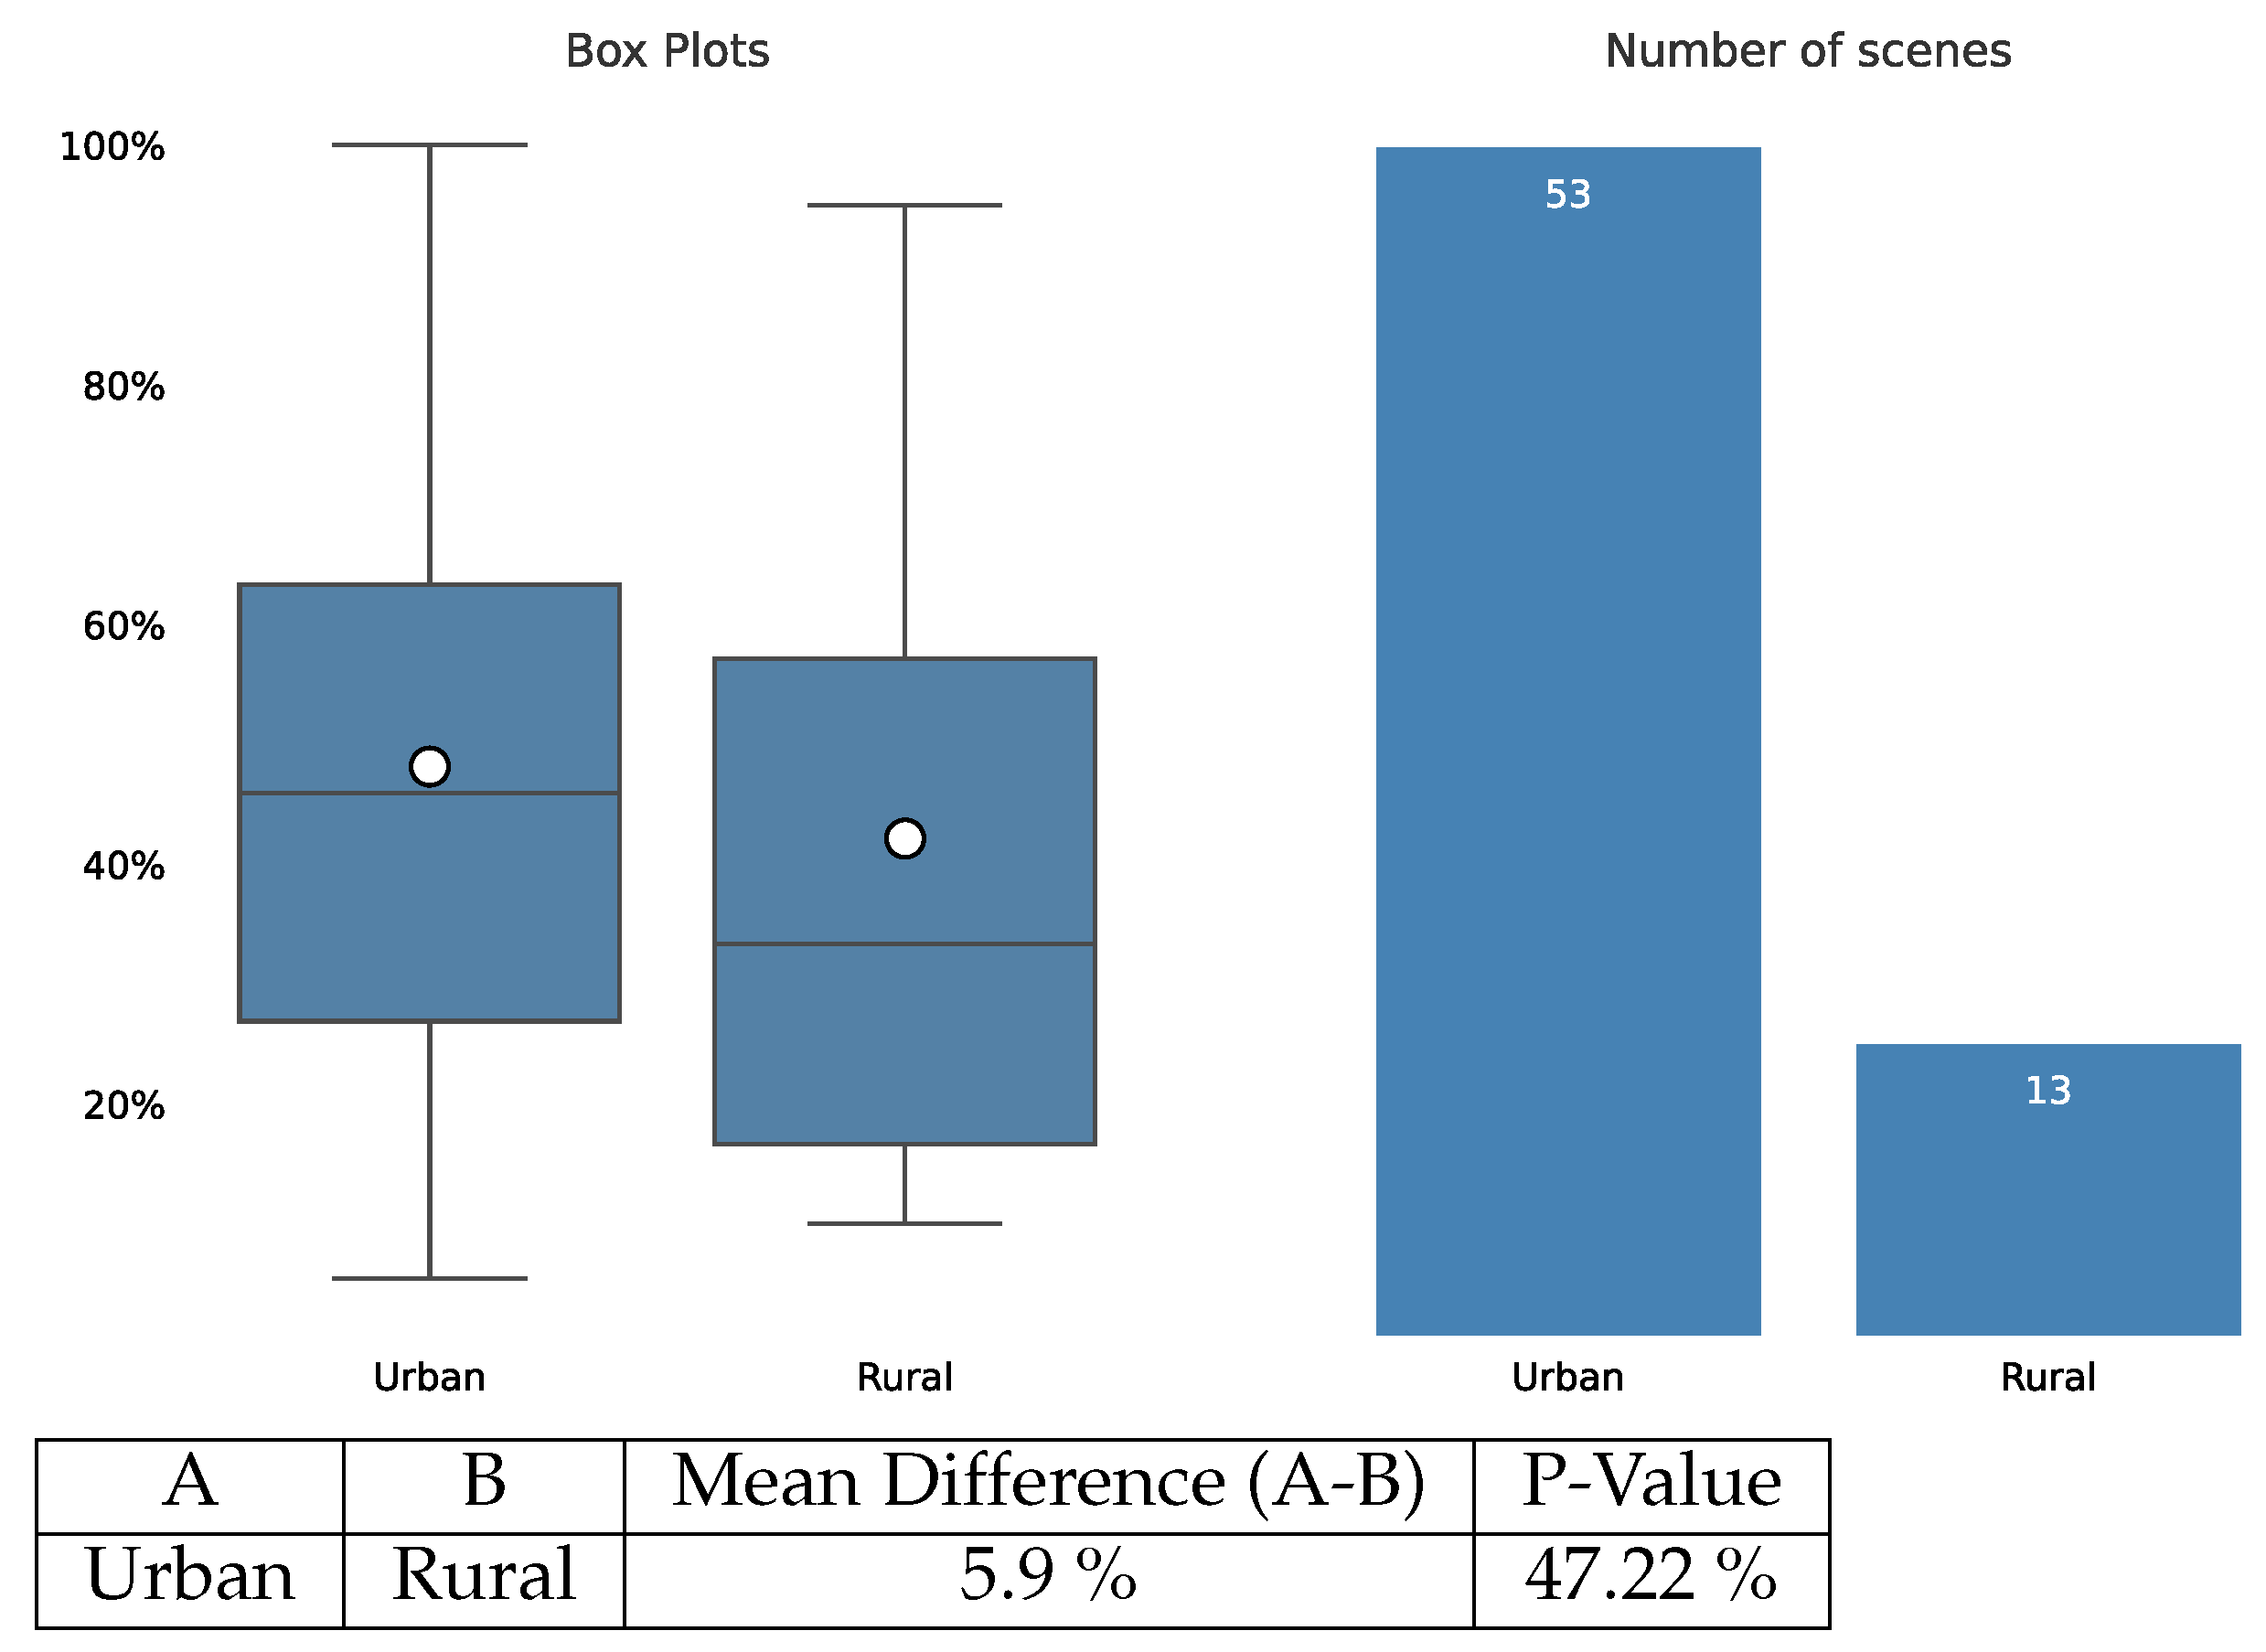
4.4. Incident Road Type
Figure 6 illustrates the compliance rate distribution based on the incidents’ geographical location. According to this figure, although the average compliance rate is slightly higher in urban areas (5.9%), the
p-value of 47.22% indicates that the level of significance of this difference is only around 50%.
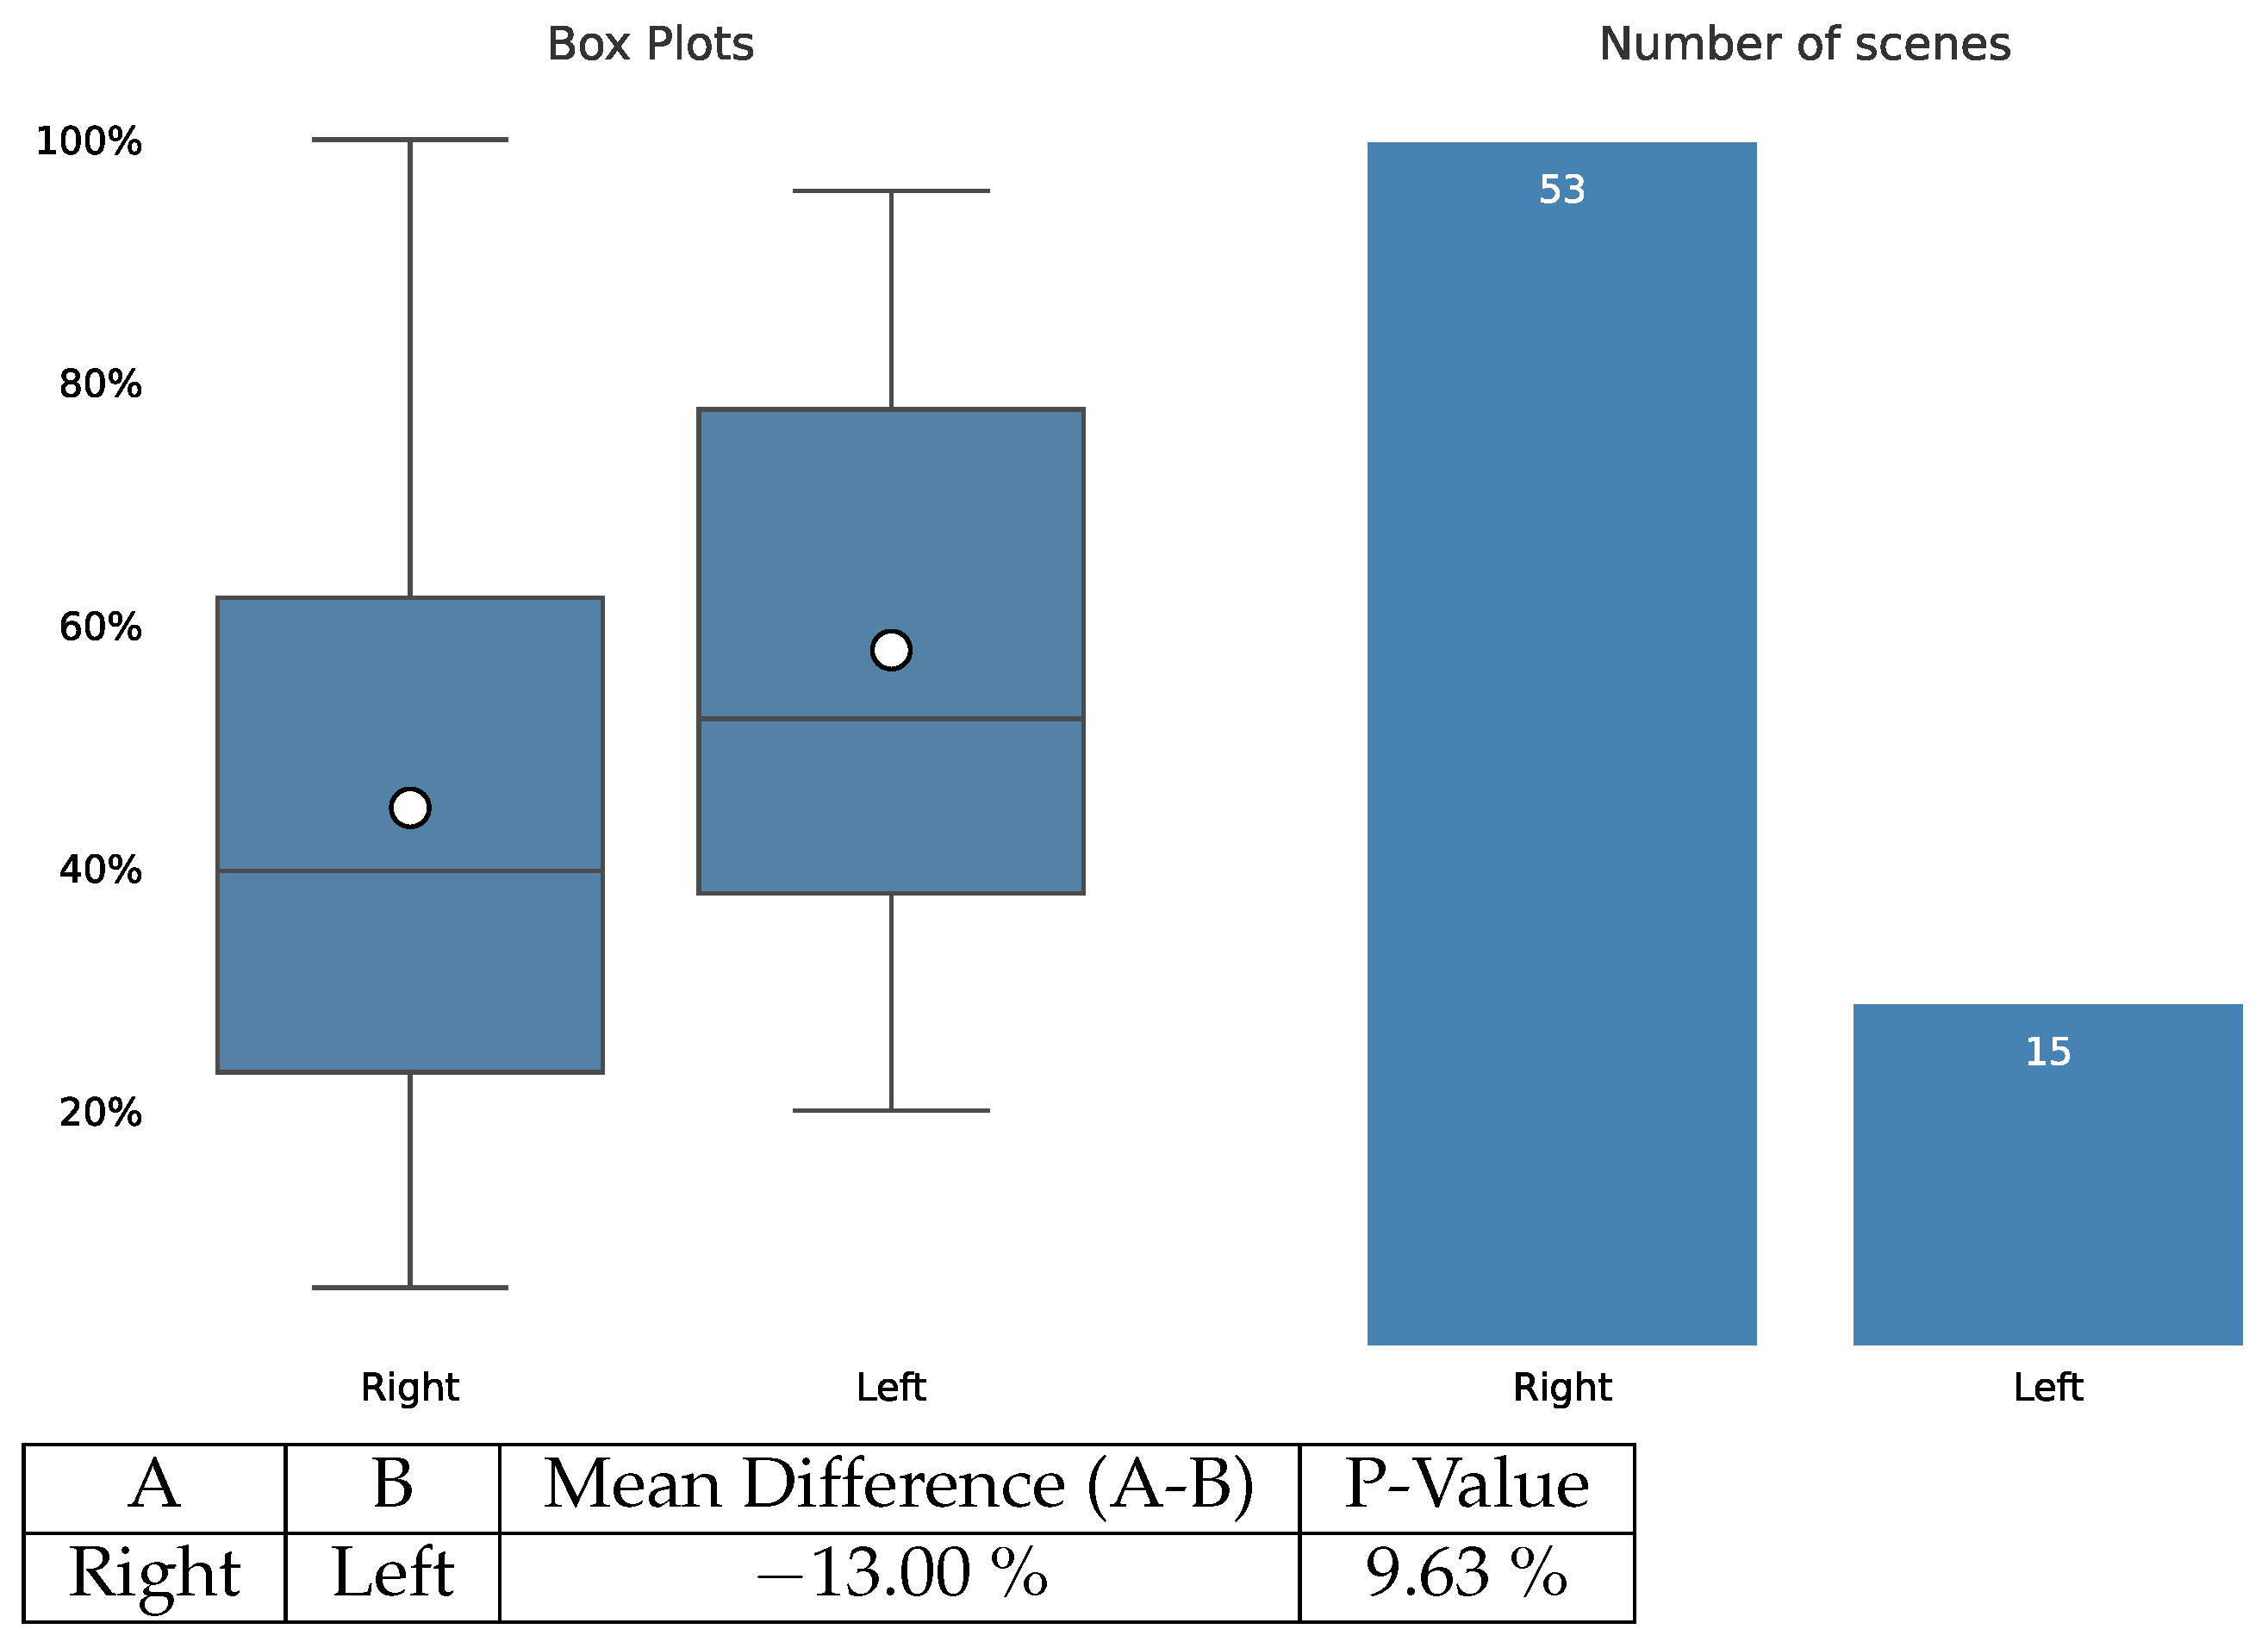
4.5. Shoulder Location
Figure 7 illustrates the compliance rate distribution based on the location of the occupied shoulder with respect to the main segment. According to this figure, the compliance rate seems to be significantly higher, with a significance level of 90%, when the vehicles involved in the incident scene are stopped on the left shoulder.
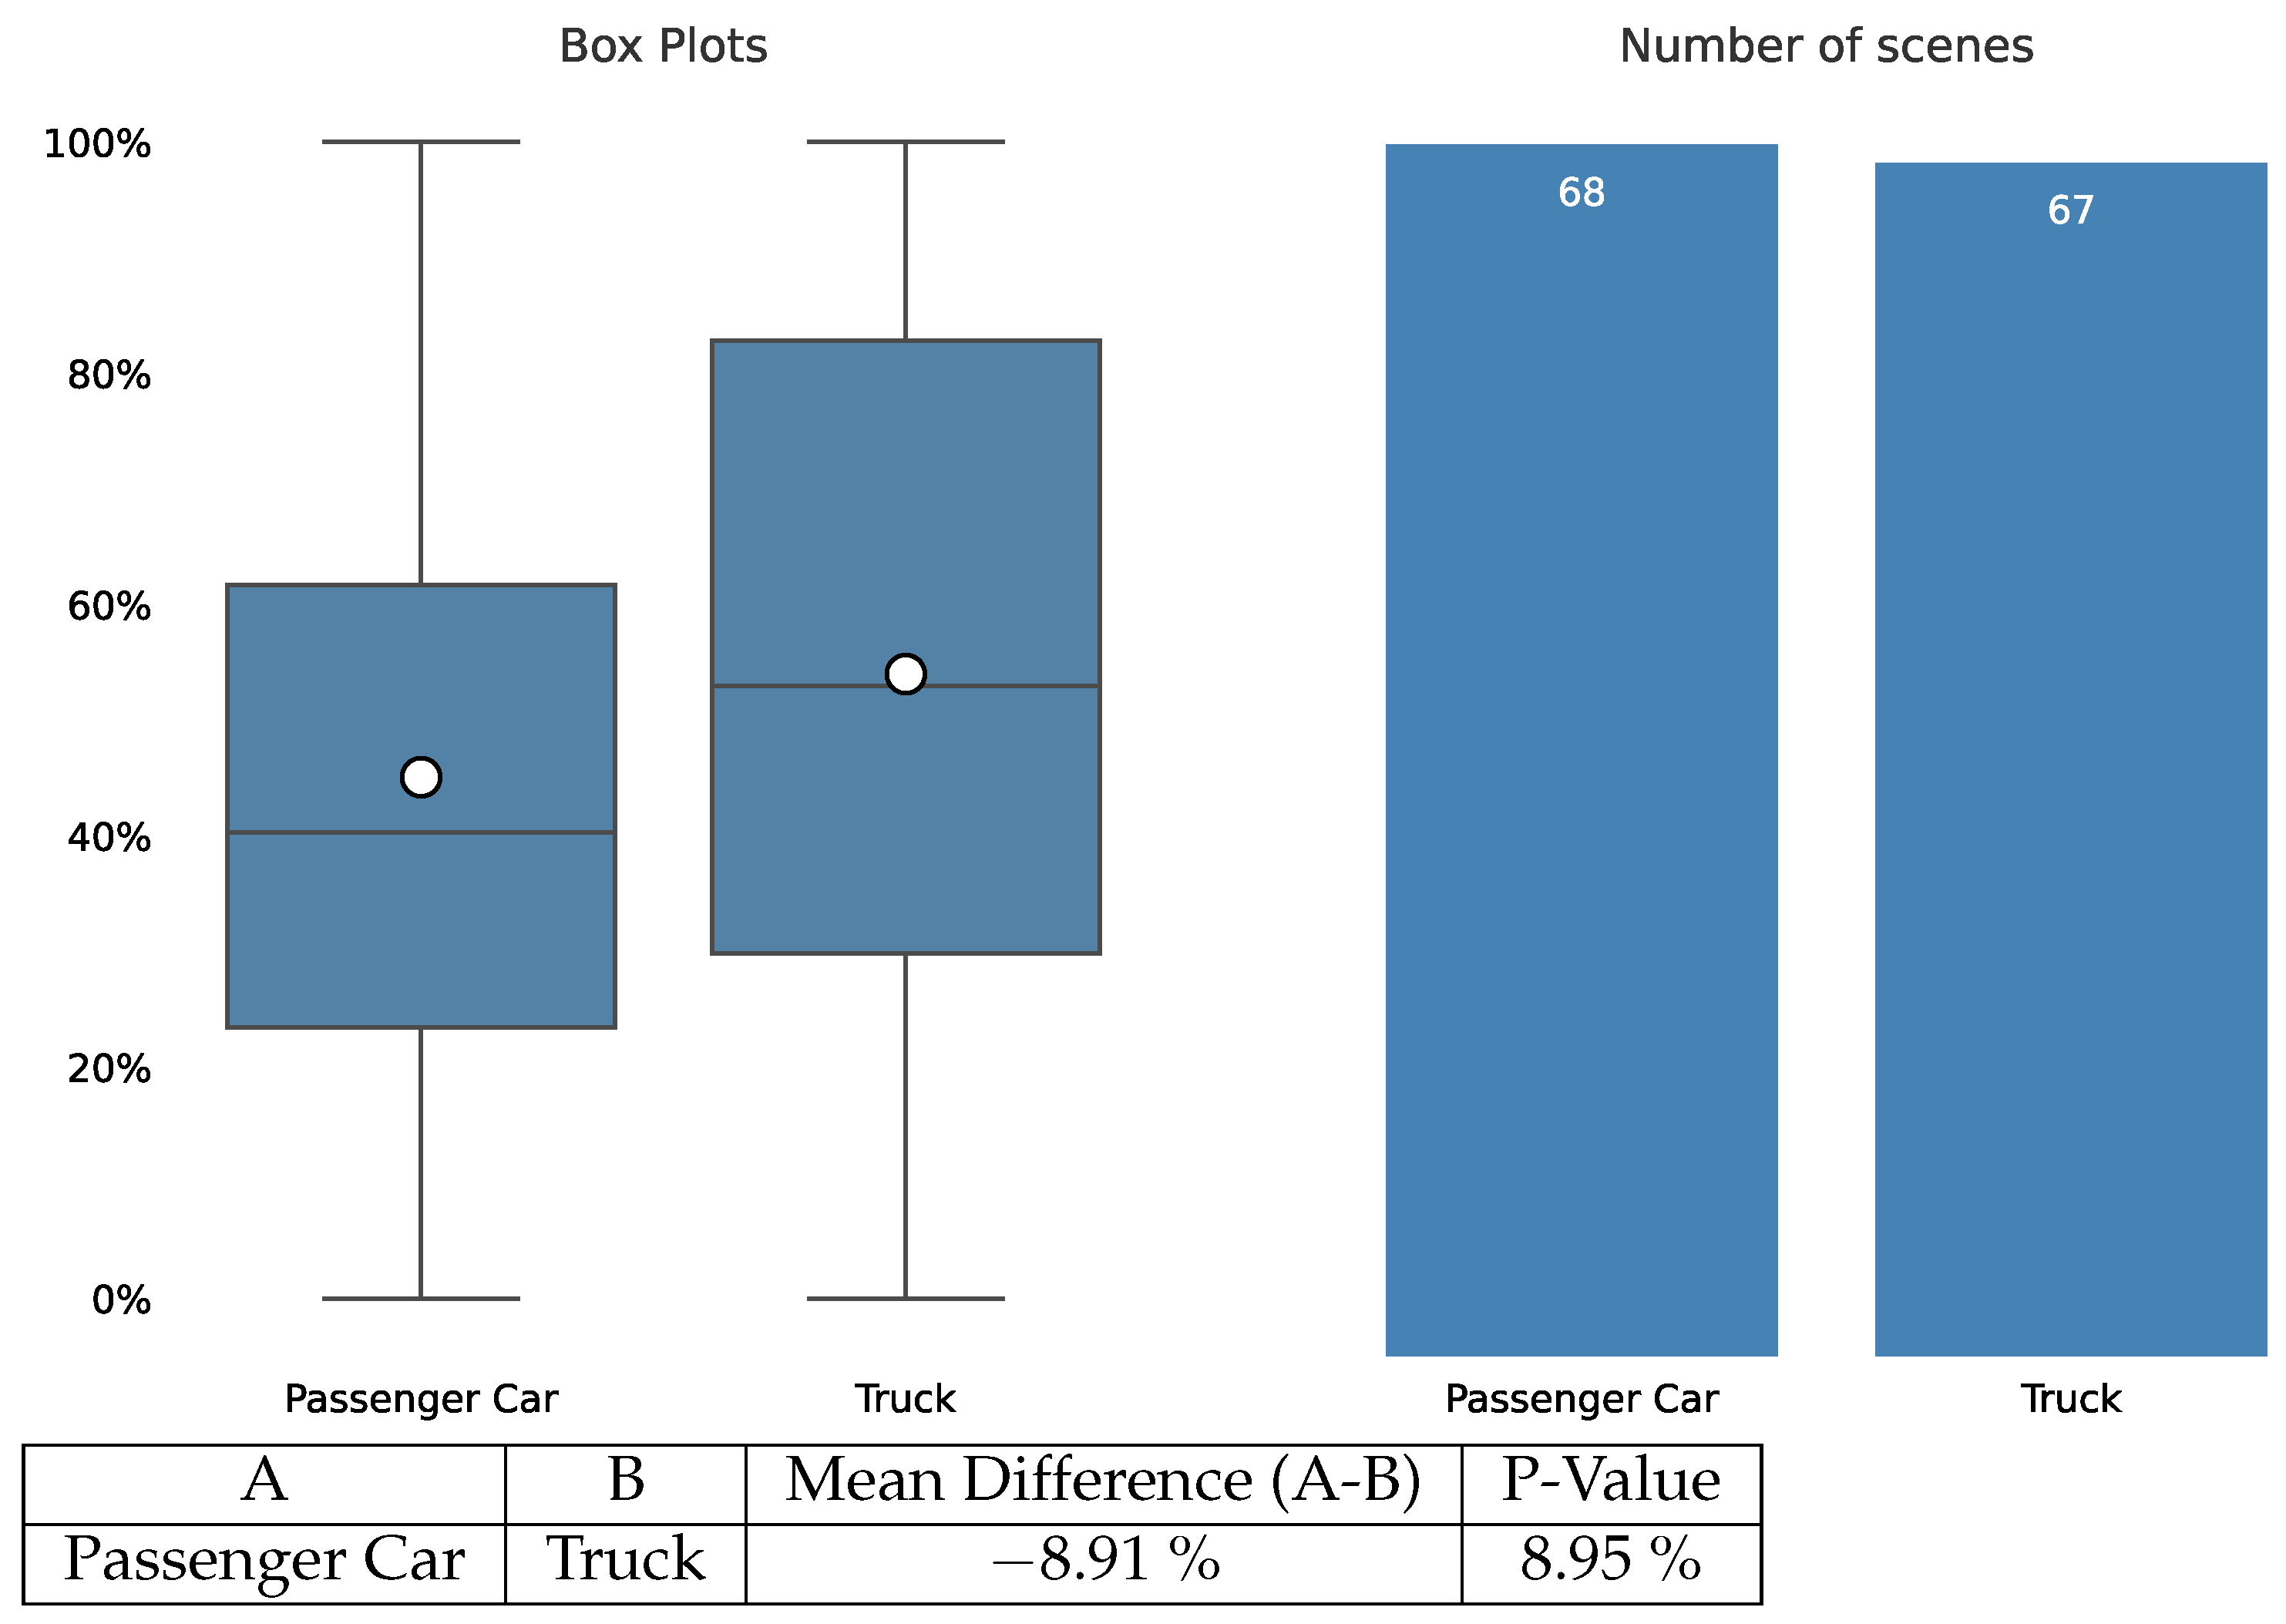
4.6. Approaching Traffic Vehicle Type
Figure 8 illustrates the compliance rate distribution based on the approaching traffic vehicle type. Unlike other variables discussed so far that were related to the incident scene, this variable is a traffic flow characteristic. According to
Figure 8, truck drivers are more likely to comply with the Move Over law. On average, truck drivers’ compliance rate is 8.91% higher than passenger car drivers. This difference is statistically meaningful at a 90% significance error.
4.7. Traffic Volume
Another traffic flow characteristic considered in this study is the approaching traffic volume. To check the possible dependencies, we computed the traffic flow per lane (number of vehicles/lane/hour) for each scene and then calculated correlation coefficients between the flow per lane and Move Over law compliance. The Pearson and Spearman correlation coefficients are −0.273 and −0.320. They are both negative, suggesting a decrease in the Move Over law compliance with traffic volume increase. However, the values of the correlations are relatively small, so the data did not show any strong patterns.
5. Discussion
Assuming a confidence level of 80%, the results demonstrate a significant association between the presence of advance warning signs and improved compliance rates, with a 9.6% increase in compliance when such signs are used. This finding underscores the pivotal role of visual cues in shaping driver behavior, as advance warning signs provide a preemptive alert, allowing drivers to respond safely and reduce the likelihood of roadside incidents. Additionally, the results highlight the influence of shoulder location, with a 13% lower compliance rate observed when vehicles involved in incidents are positioned on the left shoulder. This may reflect the difficulty drivers face in safely slowing down or changing lanes when responding to left-shoulder scenarios, given the higher traffic speeds in adjacent lanes. In contrast, vehicles on the right shoulder align with lower prevailing speeds, making compliance actions, such as lane changes or speed reductions, more manageable. These findings suggest prioritizing left-shoulder scenarios with advanced warning systems to enhance safety.
The data also indicate that trucks exhibit a significantly higher compliance rate with the Move Over law compared to passenger cars. This observation correlates with the fact that trucks predominantly travel in slower lanes, where lowering speed or changing lanes to comply is inherently more feasible. This finding highlights how lane usage and vehicle characteristics influence compliance behavior, offering insights for tailored traffic management strategies.
While the analysis of responder vehicle position and type did not yield statistically significant differences, this is likely due to limited data. A larger dataset is necessary to ensure the robustness of these findings. Similarly, road type showed no significant influence, though the slight 5.9% increase in compliance observed in urban areas compared to rural ones hints that urban drivers might be more familiar with traffic laws or encounter frequent campaigns promoting the “Move Over Law”. However, with a p-value of , this observation warrants further investigation into factors like road design and enforcement levels.
Lastly, the negative correlation coefficients ( and ) between compliance and traffic volume reveal that as traffic density increases, compliance decreases. This indicates that dense traffic limits drivers’ ability to change lanes or slow down safely. High-traffic areas might benefit from interventions such as automated enforcement systems or the deployment of additional responder vehicles to facilitate compliance and manage traffic flow effectively.
6. Conclusions
This study introduces an automated system to analyze the compliance rate in Move Over laws. This system provided an opportunity to investigate the impact of various incident scenes, responders, and traffic flow characteristics on compliance rates.
The median compliance with Move Over laws was 42.5% and varied heavily depending on diverse factors. The introduced system was able to extract patterns in compliance behavior based on variables such as the position of the responder vehicle, shoulder location, and vehicle types in the approaching traffic. This system can be used to process more data at minimal cost, allowing for large-scale compliance analysis. While the study provides valuable insights, several limitations must be acknowledged:
Geographic Scope: The dataset includes videos from a limited number of states, which may not fully capture regional variations in compliance behaviors.
Dataset Size: Although the study analyzed over 33,000 vehicles, increasing the dataset size would improve the robustness of the findings and reduce statistical uncertainties.
Compliance Definition: The study considered compliance only when a vehicle’s center fully shifted into an adjacent lane. Partial lane changes and speed reductions were not included, simplifying compliance assessment but potentially omitting some nuanced cases of adherence.
Further work is planned to expand data collection, refine the methodology, and address these limitations to provide a more comprehensive understanding of Move Over law compliance.
Author Contributions
Conceptualization, P.S.; methodology, P.S.; software, P.S.; validation, P.S. and M.C.; formal analysis, N.S., S.Z. and M.C.; resources, R.M.,investigation, P.S.; data curation, Q.H.; writing—original draft preparation, P.S., N.S., S.Z. and R.M.; writing—review and editing, N.S., S.Z., R.M. and M.C.; visualization, S.Z.; project administration, R.M.; funding acquisition, R.M. All authors have read and agreed to the published version of the manuscript.
Funding
This research was funded by Federal Highway Administration Contract or Grant No.DTFH6116D00049/693JJ320F000399.
Institutional Review Board Statement
Not applicable.
Informed Consent Statement
Not applicable.
Data Availability Statement
Raw data were obtained from the State Departments of Transportation and removed after determining the Move Over behaviors.
Acknowledgments
This work would not have been possible without the sponsorship of the U.S. Department of Transportation. The views expressed are those of the authors and do not reflect the official policy or position of the US Department of Transportation or the US Government. The authors also thank Robert Krile, Matt Austin, Tom Jacobs, Kaveh Farokhi, Mark Franz, Zachary Vander Laan, Binya Zhang, and Amir Noekhan for their cooperation and their contribution to the project.
Conflicts of Interest
The authors declare no conflicts of interest.
References
- Motor Vehicle Safety Issues. NSC Injury Facts. 2022. Available online: https://injuryfacts.nsc.org/motor-vehicle/motor-vehicle-safety-issues/work-zones/ (accessed on 31 July 2022).
- Traffic Incident Management. U.S. Department of Transportation, Federal Highway Administration. 2022. Available online: https://ops.fhwa.dot.gov/tim/ (accessed on 31 July 2022).
- Megat-Johari, N.; Megat-Johari, M.U.; Savolainen, P.; Gates, T.; Kassens-Noor, E. Examining Driver Compliance with a Move-Over/Slow Down Law in Consideration of Vehicle Type and Messages Displayed on Upstream Dynamic Message Signs. Transp. Res. Rec. 2021, 2675, 92–102. [Google Scholar] [CrossRef]
- LESSS. 2006 Staff Report. In Law Enforcement Stops and Safety Subcommittee; International Association of Chiefs of Police: Alexandria, VA, USA, 2006. [Google Scholar]
- Smith, M. First Responder Roadway Safety: Estimating the Financial Cost of First Responder Vehicle Crashes; Student Research Symposium 2022, Daytona Beach, FL, USA, 16 November 2022. Available online: https://commons.erau.edu/db-srs/2022/poster-session-one/34/ (accessed on 6 February 2025).
- GAO. Emergency Responder Safety: States and DOT Are Implementing Actions to Reduce Roadside Crashes; United States Government Accountability Office: Washington, DC, USA, 2020. [Google Scholar]
- CTC. State Move Over Laws (Subsection of Highway Worker Safety Preliminary Investigation); CTC and Associates LLC: Dallas, TX, USA, 2011. [Google Scholar]
- Carrick, G.; Washburn, S. The move over law: Effect of emergency vehicle lighting on driver compliance on Florida freeways. Transp. Res. Rec. 2012, 2281, 1–7. [Google Scholar] [CrossRef]
- Carrick, G.; Srinivasan, S. Characterizing incident responder crashes involving move over law violations. Transp. Res. Rec. 2023, 2677, 741–752. [Google Scholar] [CrossRef]
- Reddy, K.R.; Muralidhar, A. Machine Learning-Based Road Safety Prediction Strategies for Internet of Vehicles (IoV) Enabled Vehicles: A Systematic Literature Review. IEEE Access 2023, 11, 112108–112122. [Google Scholar] [CrossRef]
- Zia, H.; Hassan, I.U.; Khurram, M.; Harris, N.; Shah, F.; Imran, N. Advancing Road Safety: A Comprehensive Evaluation of Object Detection Models for Commercial Driver Monitoring Systems. Future Transp. 2025, 5, 2. [Google Scholar] [CrossRef]
- Kheder, M.Q.; Mohammed, A.A. Real-time traffic monitoring system using IoT-aided robotics and deep learning techniques. Kuwait J. Sci. 2024, 51, 100153. [Google Scholar] [CrossRef]
- Chughtai, B.R.; Jalal, A. Traffic Surveillance System: Robust Multiclass Vehicle Detection and Classification. In Proceedings of the 2024 5th International Conference on Advancements in Computational Sciences (ICACS), Lahore, Pakistan, 19–20 February 2024; pp. 1–8. [Google Scholar]
- Ali, Y.; Hussain, F.; Haque, M.M. Advances, challenges, and future research needs in machine learning-based crash prediction models: A systematic review. Accid. Anal. Prev. 2024, 194, 107378. [Google Scholar] [CrossRef] [PubMed]
- Santos, K.; Firme, B.; Dias, J.; Amado, C. Analysis of Motorcycle Accident Injury Severity and Performance Comparison of Machine Learning Algorithms. Transp. Res. Rec. J. Transp. Res. Board 2024, 2678, 736–748. [Google Scholar] [CrossRef]
- Malligere Shivanna, V.; Guo, J.I. Object Detection, Recognition, and Tracking Algorithms for ADASs—A Study on Recent Trends. Sensors 2024, 24, 249. [Google Scholar] [CrossRef] [PubMed]
- Kan, H.; Li, C.; Wang, Z. Enhancing urban traffic management through YOLOv5 and DeepSORT algorithms within digital twin frameworks. Mechatron. Intell Transp. Syst. 2024, 3, 39–54. [Google Scholar] [CrossRef]
- Saha, C.; Tran, T.H.; Syamal, S. Enhancing Automotive Safety Through Advanced Object Behaviour Tracking for Intelligent Traffic and Transport System. In Proceedings of the 2024 IEEE International Workshop on Metrology for Automotive (MetroAutomotive), Bologna, Italy, 26–28 June 2024; pp. 70–75. [Google Scholar] [CrossRef]
- Saillaja, V.; Rehaman Pasha, M.; Krishnaveni, S.; Ravinder, B.; Srinivasan, S.; Nandagopal, V. IoT-Embedded Traffic Cones with CNN-based Object Detection to Roadwork Safety. In Proceedings of the 2024 2nd International Conference on Intelligent Data Communication Technologies and Internet of Things (IDCIoT), Bengaluru, India, 4–6 January 2024; pp. 120–125. [Google Scholar] [CrossRef]
- Yu, H.; Huo, S.; Zhu, M.; Gong, Y.; Xiang, Y. Machine Learning-Based Vehicle Intention Trajectory Recognition and Prediction for Autonomous Driving. In Proceedings of the 2024 7th International Conference on Advanced Algorithms and Control Engineering (ICAACE), Shanghai, China, 1–3 March 2024; pp. 771–775. [Google Scholar]
- Sun, W.; Pan, L.; Xu, J.; Wan, W.; Wang, Y. Automatic driving lane change safety prediction model based on LSTM. In Proceedings of the 2024 7th International Conference on Advanced Algorithms and Control Engineering (ICAACE), Shanghai, China, 1–3 March 2024; pp. 1138–1142. [Google Scholar]
- Khan, H.; Thakur, J. Smart traffic control: Machine learning for dynamic road traffic management in urban environments. In Multimedia Tools and Applications; Springer: Berlin/Heidelberg, Germany, 2024; pp. 1–25. [Google Scholar] [CrossRef]
- Yu, H.; Chen, C.; Du, X.; Li, Y.; Rashwan, A.; Hou, L.; Jin, P.; Yang, F. TensorFlow Object Detection API 2017. Available online: https://github.com/tensorflow/models/tree/master/research/object_detection (accessed on 31 July 2022).
- Ren, S.; He, K.; Girshick, R.; Sun, J. Faster R-CNN: Towards Real-Time Object Detection with Region Proposal Networks. arXiv 2015, arXiv:1506.01497. [Google Scholar] [CrossRef]
- Szegedy, C.; Vanhoucke, V.; Ioffe, S.; Shlens, J.; Wojna, Z. Rethinking the Inception Architecture for Computer Vision. In Proceedings of the IEEE Conference on Computer Vision and Pattern Recognition (CVPR), Las Vegas, NV, USA, 27–30 June 2016; pp. 2818–2826. [Google Scholar] [CrossRef]
- Zhang, H.; Shao, F.; Chu, W.; Dai, J.; Li, X.; Zhang, X.; Gong, C. Faster R-CNN based on frame difference and spatiotemporal context for vehicle detection. Signal Image Video Process. 2024, 18, 7013–7027. [Google Scholar] [CrossRef]
- Aboyomi, D.D.; Daniel, C. A Comparative Analysis of Modern Object Detection Algorithms: YOLO vs. SSD vs. Faster R-CNN. ITEJ Inf. Technol. Eng. J. 2023, 8, 96–106. [Google Scholar] [CrossRef]
- Henriques, J.F.; Caseiro, R.; Martins, P.; Batista, J. High-Speed Tracking with Kernelized Correlation Filters. IEEE Trans. Pattern Anal. Mach. Intell. 2015, 37, 583–596. [Google Scholar] [CrossRef] [PubMed]
- Xia, R.; Chen, Y.; Ren, B. Improved anti-occlusion object tracking algorithm using Unscented Rauch-Tung-Striebel smoother and kernel correlation filter. J. King Saud-Univ.-Comput. Inf. Sci. 2022, 34, 6008–6018. [Google Scholar] [CrossRef]
- Babenko, B.; Yang, M.; Belongie, S. Visual tracking with online Multiple Instance Learning. In Proceedings of the 2009 IEEE Conference on Computer Vision and Pattern Recognition, Miami, FL, USA, 20–25 June 2009. [Google Scholar] [CrossRef]
- Fatima, S.; Ali, S.; Kim, H.C. A comprehensive review on multiple instance learning. Electronics 2023, 12, 4323. [Google Scholar] [CrossRef]
- Wojke, N.; Bewley, A. Deep Cosine Metric Learning for Person Re-identification. In Proceedings of the IEEE Winter Conference on Applications of Computer Vision (WACV), Lake Tahoe, NV, USA, 12–15 March 2018. [Google Scholar] [CrossRef]
Figure 1.
The number of processed incident scene videos and average compliance rates by state. Most incidents processed took place in TX (24) and PA (19), together totaling 43 of the 68 scenes. This distribution has an influence on the urban/rural division of the scenes. It is also visible that while the highest compliance rate (NV) is 79.5%, the percentage of compliance in those two states (TX and PA) are very close to the mean compliance shown in
Table 4.
Figure 2.
Compliance rate distribution categorized by the existence of an advance warning sign. The analyzed scenarios have a similar number of cases with advanced warning sign informing of the incident and those without. The difference in MO law compliance rate between them is small (9.6%) and statistically significant with 83.36 % probability.
Figure 3.
Compliance rate distribution categorized by the responder vehicle type. It does not show significant differences in responses depending on responder vehicle present, whether the responder vehicle is the police, safety patrol or both. This result can be called surprising, since it shows that actual presence of police officers who are also responsible for repercussion for breaking the laws does not have significant impact.
Figure 4.
Compliance rate distribution categorized by the responder vehicle position. The data show that there is a small difference in MO law compliance rates, with more drivers complying when the responder vehicle is parked across the shoulder line. The level of significance, though less than 70%, might suggest that it is in fact personal safety that influences drivers behavior, not the MO law.
Figure 5.
Example of responder vehicle parked over the shoulder line (Texas 4/7/22). The responder vehicle with warning sign attached is considered parked across the shoulder line—part of the vehicle is on the leftmost (rightmost from the POV of the camera) lane.
Figure 5.
Example of responder vehicle parked over the shoulder line (Texas 4/7/22). The responder vehicle with warning sign attached is considered parked across the shoulder line—part of the vehicle is on the leftmost (rightmost from the POV of the camera) lane.
Figure 6.
Compliance rate distribution categorized by the incidents’ geographical location. There are many more scenarios available taking place in urban environment than those in rural. The difference in response rate is small and with large p value, which suggests the difference is not significant.
Figure 7.
Compliance rate distribution categorized by the occupied shoulder location. It shows that if the compliance rate is significantly higher (with probability of 90%) when the vehicles involved are occupying the left shoulder.
Figure 7.
Compliance rate distribution categorized by the occupied shoulder location. It shows that if the compliance rate is significantly higher (with probability of 90%) when the vehicles involved are occupying the left shoulder.
Figure 8.
Compliance rate distribution categorized by the approaching vehicle type. On almost every scenario we have both passenger cars and trucks in the scene. There is a significantly higher compliance rate to MO law among truck drivers, which might be caused by the larger size of the trucks—which can cause fear of collision—as well as the possible higher level of scrutiny when it comes to law enforcement’s approach to transport vehicles drivers.
Table 1.
Participating Agencies. The participating agencies were selected to ensure diverse geographical coverage, allowing for a comprehensive analysis of Move Over law compliance across different roadway environments and traffic conditions. The readiness of cooperation was also considered.
Table 1.
Participating Agencies. The participating agencies were selected to ensure diverse geographical coverage, allowing for a comprehensive analysis of Move Over law compliance across different roadway environments and traffic conditions. The readiness of cooperation was also considered.
| State/Agency | Abbreviation |
|---|
| Maryland Department of Transportation State Highway Administration | MD |
| Minnesota Department of Transportation | MN |
| North Carolina Department of Transportation | NC |
| Nevada Department of Transportation | NV |
| New York Department of Transportation | NY |
| Pennsylvania Turnpike Authority | PA |
| North Texas Toll Authority | TX |
| Washington State Department of Transportation | WA |
Table 2.
Algorithm Accuracy. As can be seen, the ODT algorithm maintains high accuracy along all 68 videos with a minimum accuracy of 75% and an average accuracy of 89%. This shows that the proposed ODT method consistently achieves accuracy acceptable for analysis.
Table 2.
Algorithm Accuracy. As can be seen, the ODT algorithm maintains high accuracy along all 68 videos with a minimum accuracy of 75% and an average accuracy of 89%. This shows that the proposed ODT method consistently achieves accuracy acceptable for analysis.
| Metric | Value |
|---|
| Mean | 89% |
| Std. dev. | 8.7% |
| Min. | 75% |
| 1st quartile | 83% |
| Median | 89% |
| 3rd quartile | 92% |
| Max. | 100% |
Table 3.
List of the variables considered for Move Over law compliance rate analysis. The name of the variable (referenced in further analysis) is shown in column “Variables”. In the column “Definition”, we describe the actual description of what each variable represents. Then, in “Categories”, the possible values for each of the variables are presented.
| Variables | Categories | Definition |
|---|
| Advance warning sign | Exists
Does not exist | Whether a flashing arrow sign is present
at the scene |
| Responder vehicle type | Police
Safety Patrol
Both | The type of responder vehicle at the
incident scene |
| Responder vehicle position | Over the line
On the shoulder | Whether the responder vehicle parks
over the shoulder line or completely
stays on the shoulder and does not
occupy any portion of the next lane. |
| Incident road type | Urban
Rural | Incident location geographical area type |
| Occupied shoulder location | Left
Right | Whether the vehicles involved at the
incident scene are parked on the left or
right shoulder |
| Approaching Traffic vehicle type | Passenger car
Truck | Type of approaching traffic vehicles |
| Traffic volume | - | Flow rate of the approaching traffic |
Table 4.
The summary of the results of Move Over law compliance analysis. Of 7871 vehicles that were subjected to Move Over law, the average compliance rate for the scenario was less than 50 %, and while there existed a scenario with 100 % compliance rate, the very low minimum (5.4 %) and the high standard deviation value show that the actual compliance rate varies significantly from scenario to scenario.
| Metric | Value |
|---|
| No. of scenes | 68 |
| No. of tracked vehicles | 33,118 |
| No. of vehicles subject to the Move Over law | 7871 |
| Compliance rates (averaged by scenes): | |
| Mean | 47.8% |
| Std. dev. | 26.7% |
| Min. | 5.4% |
| 1st quartile | 24.9% |
| Median | 42.5% |
| 3rd quartile | 64.9% |
| Max. | 100% |
| Disclaimer/Publisher’s Note: The statements, opinions and data contained in all publications are solely those of the individual author(s) and contributor(s) and not of MDPI and/or the editor(s). MDPI and/or the editor(s) disclaim responsibility for any injury to people or property resulting from any ideas, methods, instructions or products referred to in the content. |
© 2025 by the authors. Licensee MDPI, Basel, Switzerland. This article is an open access article distributed under the terms and conditions of the Creative Commons Attribution (CC BY) license (https://creativecommons.org/licenses/by/4.0/).


 ,
, 


