Article

Developing Productivity–Safety Effectiveness Index Using Data Envelopment Analysis (DEA)

Department of Industrial & Systems Engineering, Dongguk University, 30, Pildong-ro 1-gil, Jung-gu, Seoul 04620, Republic of Korea
Appl. Sci. 2025, 15(4), 1989; https://doi.org/10.3390/app15041989
Submission received: 7 January 2025 / Revised: 1 February 2025 / Accepted: 12 February 2025 / Published: 14 February 2025

Abstract

:
The social value of corporate responsibilities has become increasingly important in recent years. Among these, safety performance stands out as a critical social mission for achieving business success in today’s economy. Enhancing safety capabilities can be regarded as a sustainable value embedded in production planning. However, despite the need to balance productivity and safety performance in the industrial sector, an integrated approach to measuring these dual aspects remains lacking. Therefore, this study aims to examine the relationship between productivity and safety performance while considering the characteristics of industrial production. To achieve this, the Productivity–Safety Effectiveness Index (PSEI), an integrated economic measure, is proposed based on safety performance inputs and productivity outputs. Data Envelopment Analysis (DEA) is employed to calculate and evaluate both productivity and safety effectiveness. The findings include patterns of input and output, industry benchmarking, and trend analyses.

1. Introduction

Conventionally, productivity has been regarded as a critical capability in the industrial economy. Recent concerns about productivity focus on enhancing business excellence through advanced production systems, including ICT, data analytics, and digitalization [1,2,3]. Many attempts to increase productivity have been conducted both theoretically and methodologically. Quality management has also been recognized as one of the most essential capabilities for structuring effective production systems [4,5]. Standards aimed at ensuring higher quality and productivity, such as ISO 9001, have been established, and key concepts like Six Sigma have been developed within companies [6].
Worker safety has become a critical concern in modern society, drawing increasing attention from both governments and industries [7,8]. As national economies mature, the importance of workplace safety for companies also grows [9]. The safety systems are recognized as important societal and political issues for business administration. Companies without occupational safety are blamed for worker’s life and welfare in society. The government could supervise these illegal firms to enhance the quality of the work environment [10,11]. The government could supervise these illegal firms to enhance the quality of work environment [12].
Safety issues have a significant impact on productivity losses, as production systems are often shut down to prevent human casualties until the problem is resolved [13,14]. In hazardous work environments, unsafe conditions and behaviors can lead to a loss of control over production systems. For instance, when a production line in a semiconductor factory is halted due to an incident caused by unsafe conditions and behaviors, it can cost millions of dollars to resume operations. Similarly, when a fatality occurs on a construction site, the work schedule is delayed to address the issues, leading to additional costs to follow the revised schedule [13,14]. Therefore, safety measures at industrial sites are critical for achieving business excellence and establishing high-productivity systems. Standards for safety management systems, such as OHSAS18001 and ISO45001, are widely adopted by global companies [15,16]. Additionally, with the growing importance of ESG (Environmental, Social, and Governance) criteria in international trade [17,18], safety performance has become an essential factor for business success.
In this respect, improvement of both productivity and safety performance is ideal and a goal of the mission of business success. Recently, many global firms have tried to enhance the condition of workplace safety environment for production and quality management [17,19]. When the industrial site maintains safety, the firms take advantage of preventing loss time of machines and improving labor motivation in terms of production capacity, operation ratio, and labor productivity, respectively [8,13]. Also, the reputation of companies can be upgraded by ensuring workers’ health and promoting laborers’ welfare [20]. As such, the relationship between productivity and safety was already unveiled in previous experiences [14,17]. Failure indeed leads to low productivity and fatal injury. The high productivity and workers’ safety are guaranteed by the high-quality process and system of industry sites.
At the national economic level, governments annually provide statistics on productivity and safety performance to monitor the state of national competitiveness. For example, productivity is measured using various indices, such as labor efficiency and industrial facility capacity [18,19]. Safety performance is assessed through occupational safety and health statistics, including injury frequency and severity rates, to track workplace safety conditions [21,22]. This study contributes to the development of integrated measures that help business managers and policymakers understand the relative value of productivity and safety performance across industries. These measures support decision-making for balancing performance through incident prevention and production investment.
However, the relationship between productivity and safety performance across different industries has been less reported, despite its significance for national competitiveness and business excellence. Previous studies have primarily focused on productivity or safety performance separately, lacking an integrated approach to measuring the socio-economic impact of both performances. Balancing productivity and safety is essential in industrial settings, yet existing research does not provide a comprehensive measure that captures both capabilities. To address this gap, a new economic measure should incorporate multiple inputs and outputs, enabling a more holistic assessment of industrial performance.
This study aims to identify the relationship between productivity and safety performance in industrial production economics by proposing the integrated economic measure of the Productivity–Safety Effectiveness Index (PSEI). The major tenet of this study is to define the PSE to find better units that have high productivity as output with a low accident rate (i.e., high safety performance) as input. For this, we use data envelopment analysis (DEA), which calculates the relative importance of analysis units based on the input and output of units [23,24]. It is especially noted that DEA is useful for calculating the proposed index among industries using multiple inputs and outputs simultaneously.
For this study, DEA enables researchers to identify the highly efficient industries that have higher productivity with fewer risks. During the DEA process, the PSEI is defined as a ratio of productivity to safety performance (or incident rate). In other words, the PSEI of industries answers the following question. Which industries have higher productivity, providing better safety conditions? Along with this question, the public database of both productivity and safety is collected. First, safety performance, as input, includes three indices: fatal rate (person), frequency rate (accident), and severity (loss time). Second, productivity, as output, is considered with three indices: labor productivity, production capacity, and operation ratio. This study also presents the effective manufacturing industries of South Korea that have outperformed in occupational safety performance and productivity.

2. Background

2.1. Importance of Safety Management for Social Responsibility

As the concept of ESG proliferated for international trade, the safety management for workers’ health and lives became very important [18]. The negative impact of fatal injury on corporations should be followed such as loss of human lives, regulatory costs, reputation damage, and financial losses. Thus, the CEO should consider the effectiveness of safety investment on productivity in terms of production economics [7,17]. Many firms have also tried to invest in these R&D projects on advanced technologies such as sensors, AR/VR, drones, and machine learning for structuring safety systems. For instance, sensor-based safety systems in construction sites are developed to detect the anomaly information derived from unsafe conditions and behaviors. CCTV-based surveillance systems are also adopted to detect dangerous situations in real-time monitoring, in which the workers do not wear safety helmets or fires occur.
Many benefits of safety management to increase productivity are reported in the previous literature. First, when the incident occurs in industrial sites, the manufacturing systems are stopped to treat the risky situation. It leads to the loss of working time and influences facility utilization [7,19]. The production schedule will be then delayed by this failure [14,25]. Second, fatal incidents leading to death hurt corporate brand image. As society matures, the compliance systems become rigorous. Society can blame the corporation due to the loss of workers [20]. For example, the Deepwater Horizon, an offshore drilling rig operated by BP (British Petroleum), experienced a catastrophic explosion and subsequent fire, leading to the deaths of 11 workers and causing one of the largest oil spills in history. Thus, the efficiency of both safety performance and productivity should be examined and the managerial implications should be given to the industry or company.

2.2. Methodological Background

2.2.1. Productivity and Safety Performance Indexes

There are many production economics indexes that explain productivity and safety performance; however this study chooses the representative indexes national statistics [18,19] and safety performance [21,22], as described in Table 1.
On the one hand, productivity is identified with three indexes: labor productivity (LP), production capacity (PC), and operation ratio (OR). The LP is the amount of output produced per unit of labor input and a measure of the efficiency of workers in producing goods or services. The PC is the concept of production capacity that refers to the maximum amount that a business can produce under normal operating conditions. It refers to the maximum amount of goods or services a business can produce with its resources, measuring the capability of a company or facility to generate output within a specified period. The OR, also known as the capacity or facility utilization rate, measures how effectively a company or a facility utilizes its production capacity; it is calculated as the actual production divided by the capacity.
On the other hand, safety performance is monitored with three indexes: injury rate (IR), frequency rate (FR), and severity rate (SR). The IR is defined as the rate of the number of workers injured by accidents in unit workers, specifically 1000 workers in South Korea. The FR is the measurement of the rate of the number of accidents in 200,000 work hours by the OSHA 1996 standard [26], but in South Korea, it is 1,000,000 work hours. The SR is the rate of losses per day caused by an accident, measured in unit working hours, specifically 1000 work hours in South Korea.

2.2.2. Data Envelopment Analysis (DEA)

DEA is a linear programming model for measuring the relative efficiency or performance of decision-making units (DMUs) [27]. The DMU represents each analysis target with multiple inputs and outputs. It reflects multiple outputs, allowing each DMU to select the optimal weights of multiple variables, which maximize the DMU’s efficiency [27,28]. With an efficiency range from 0% to 100%, the DMUs at 100% are completely efficient, but other DMUs with efficiency levels below 100% are relatively inefficient. As shown in Figure 1, the left-top elements can be better units because they have less input and high output. DEA solves the relative distance between better units and worse units using linear programming. This is the main concept of relative efficiency. This concept also extends to multiple inputs and outputs as one of the multiple criteria decision-making techniques. According to these advantages, DEA has been widely used in many studies to measure relative efficiency as well [28]. However, methodologically, DEA faces challenges in identifying cause-and-effect relationships between inputs and outputs, as it is a model-free approach. Additionally, when the number of DMUs with large inputs and outputs increases, the DEA model becomes more complex, making it difficult to compute the relative efficiency. Model-based approaches, such as regression analysis and neural networks, which construct relationships between inputs and outputs, are among the alternatives to DEA. These approaches offer a different perspective compared to DEA by modeling the functional relationships between variables. These approaches provide valuable insights into the relationship between productivity and safety performance. However, they require well-structured data and, in the case of neural networks, significant computational power for training the models. Unlike DEA, these model-based approaches typically do not provide a direct measure of relative efficiency across decision-making units (DMUs) but, rather, focus on understanding and predicting the relationships between inputs and outputs.
The types of DEA model are twofold: the CCR model (coined from the first letters of the authors’ names), which assumes production with constant returns to scale), and the BCC model (also coined from the first letters of its authors’ names) for cases involving variable returns to scale. When considering the nonlinear relationship between input and output, the BCC model has been widely applied in numerous studies [27,28]. The DEA models are also divided according to the purpose of the model: maximize outputs (output-oriented) or minimize inputs (input-oriented).
For the function, the efficiency is represented as Equation (1):
E f f i c i e n c y = k = 1 n u k · y k j i = 1 m v i · x i j ,
where
  • y k j : amount of output k produced by DMU j;
  • x i j : amount of input i used by DMU j;
  • u k : weight assigned to output k;
  • v i : weight assigned to input i;
  • n: number of outputs;
  • n: number of outputs;
  • m: number of inputs;
and the objective function and constraints of the CCR model of DEA are formulated as Equation (2):
min z = v x 0 v 0 .
Subject to u y 0 = 1 ,
v X u Y v 0 e 0 , v 0 , u 0 , v 0   i s   a   f r e e   s i g n .
In Equation (2), z is the efficiency score of each DMU, and v and u are the vectors of the weights in constraints given to the x 0 values of the inputs and the y 0 values of the outputs in the objective function, respectively. In addition, all DMUs’ inputs and outputs are denoted as a vector space of X and Y, respectively [22,28]. Also, v 0 is the scalar associated with e λ = 1, where λ is the vector of the intensity variables. The first constraint means that the total efficiency is equal to 1 (or sometimes represented as 100%). The second constraint indicates that the efficiency is expressed by the output over the input. The decision variables of the problem are the values of the weights v and u, which are chosen by assigning the best set of weights to each DMU [22,28,29].
Many studies have reviewed the applications of the DEA approach to identify the relative efficiency of units with multiple inputs and outputs as summarized in Table 2. The efficiency of activities of each topic is performed based on DEA at the national level, industry level, and corporate/project level. However, safety-related topics based on productivity have not been studied and this topic focuses on this gap.

2.3. Research Gap and Motivation

Most studies on safety management have focused on identifying the impact of safety management factors on business operations and production systems. However, quantitative analyses that explore the relationship between productivity and safety performance have received less attention. While the balance between productivity and safety has gained international interest, particularly in the context of ESG, few studies have specifically examined the relationship between productivity and safety in the safety management field. Government policy is also needed to enhance companies’ capabilities by balancing safety performance with productivity. This study focuses on a quantitative analysis aimed at evaluating the efficiency of the analysis targets by comparing production and safety activities. To achieve this, we selected DEA to assess the relative efficiency between productivity and safety performance.
The proposed approach, based on the DEA method, addresses this gap in three key areas, as illustrated in Figure 2: index, comparison, and variable. First, this study develops an integrated index that considers both productivity and safety performance to reflect socio-economic values. Based on this index, industries with an outstanding ratio between productivity and safety performance are identified. Second, the study conducts a relative comparison among industries, rather than an absolute comparison, as the cap on the ratio of productivity to safety performance is unknown. This approach is more effective in providing benchmarking information for controlling and improving the resources of inputs and outputs. The benchmarking function of DEA, based on optimization, is effectively applied in this context. Finally, multiple inputs and outputs are utilized to capture all resources that influence both productivity and safety. While previous research typically analyzed individual inputs and outputs separately, making it difficult to identify interaction effects, this study uses DEA to analyze the relationship between productivity and safety performance by developing an integrated index that allows for relative comparison using multiple inputs and outputs.

3. Proposed Approach

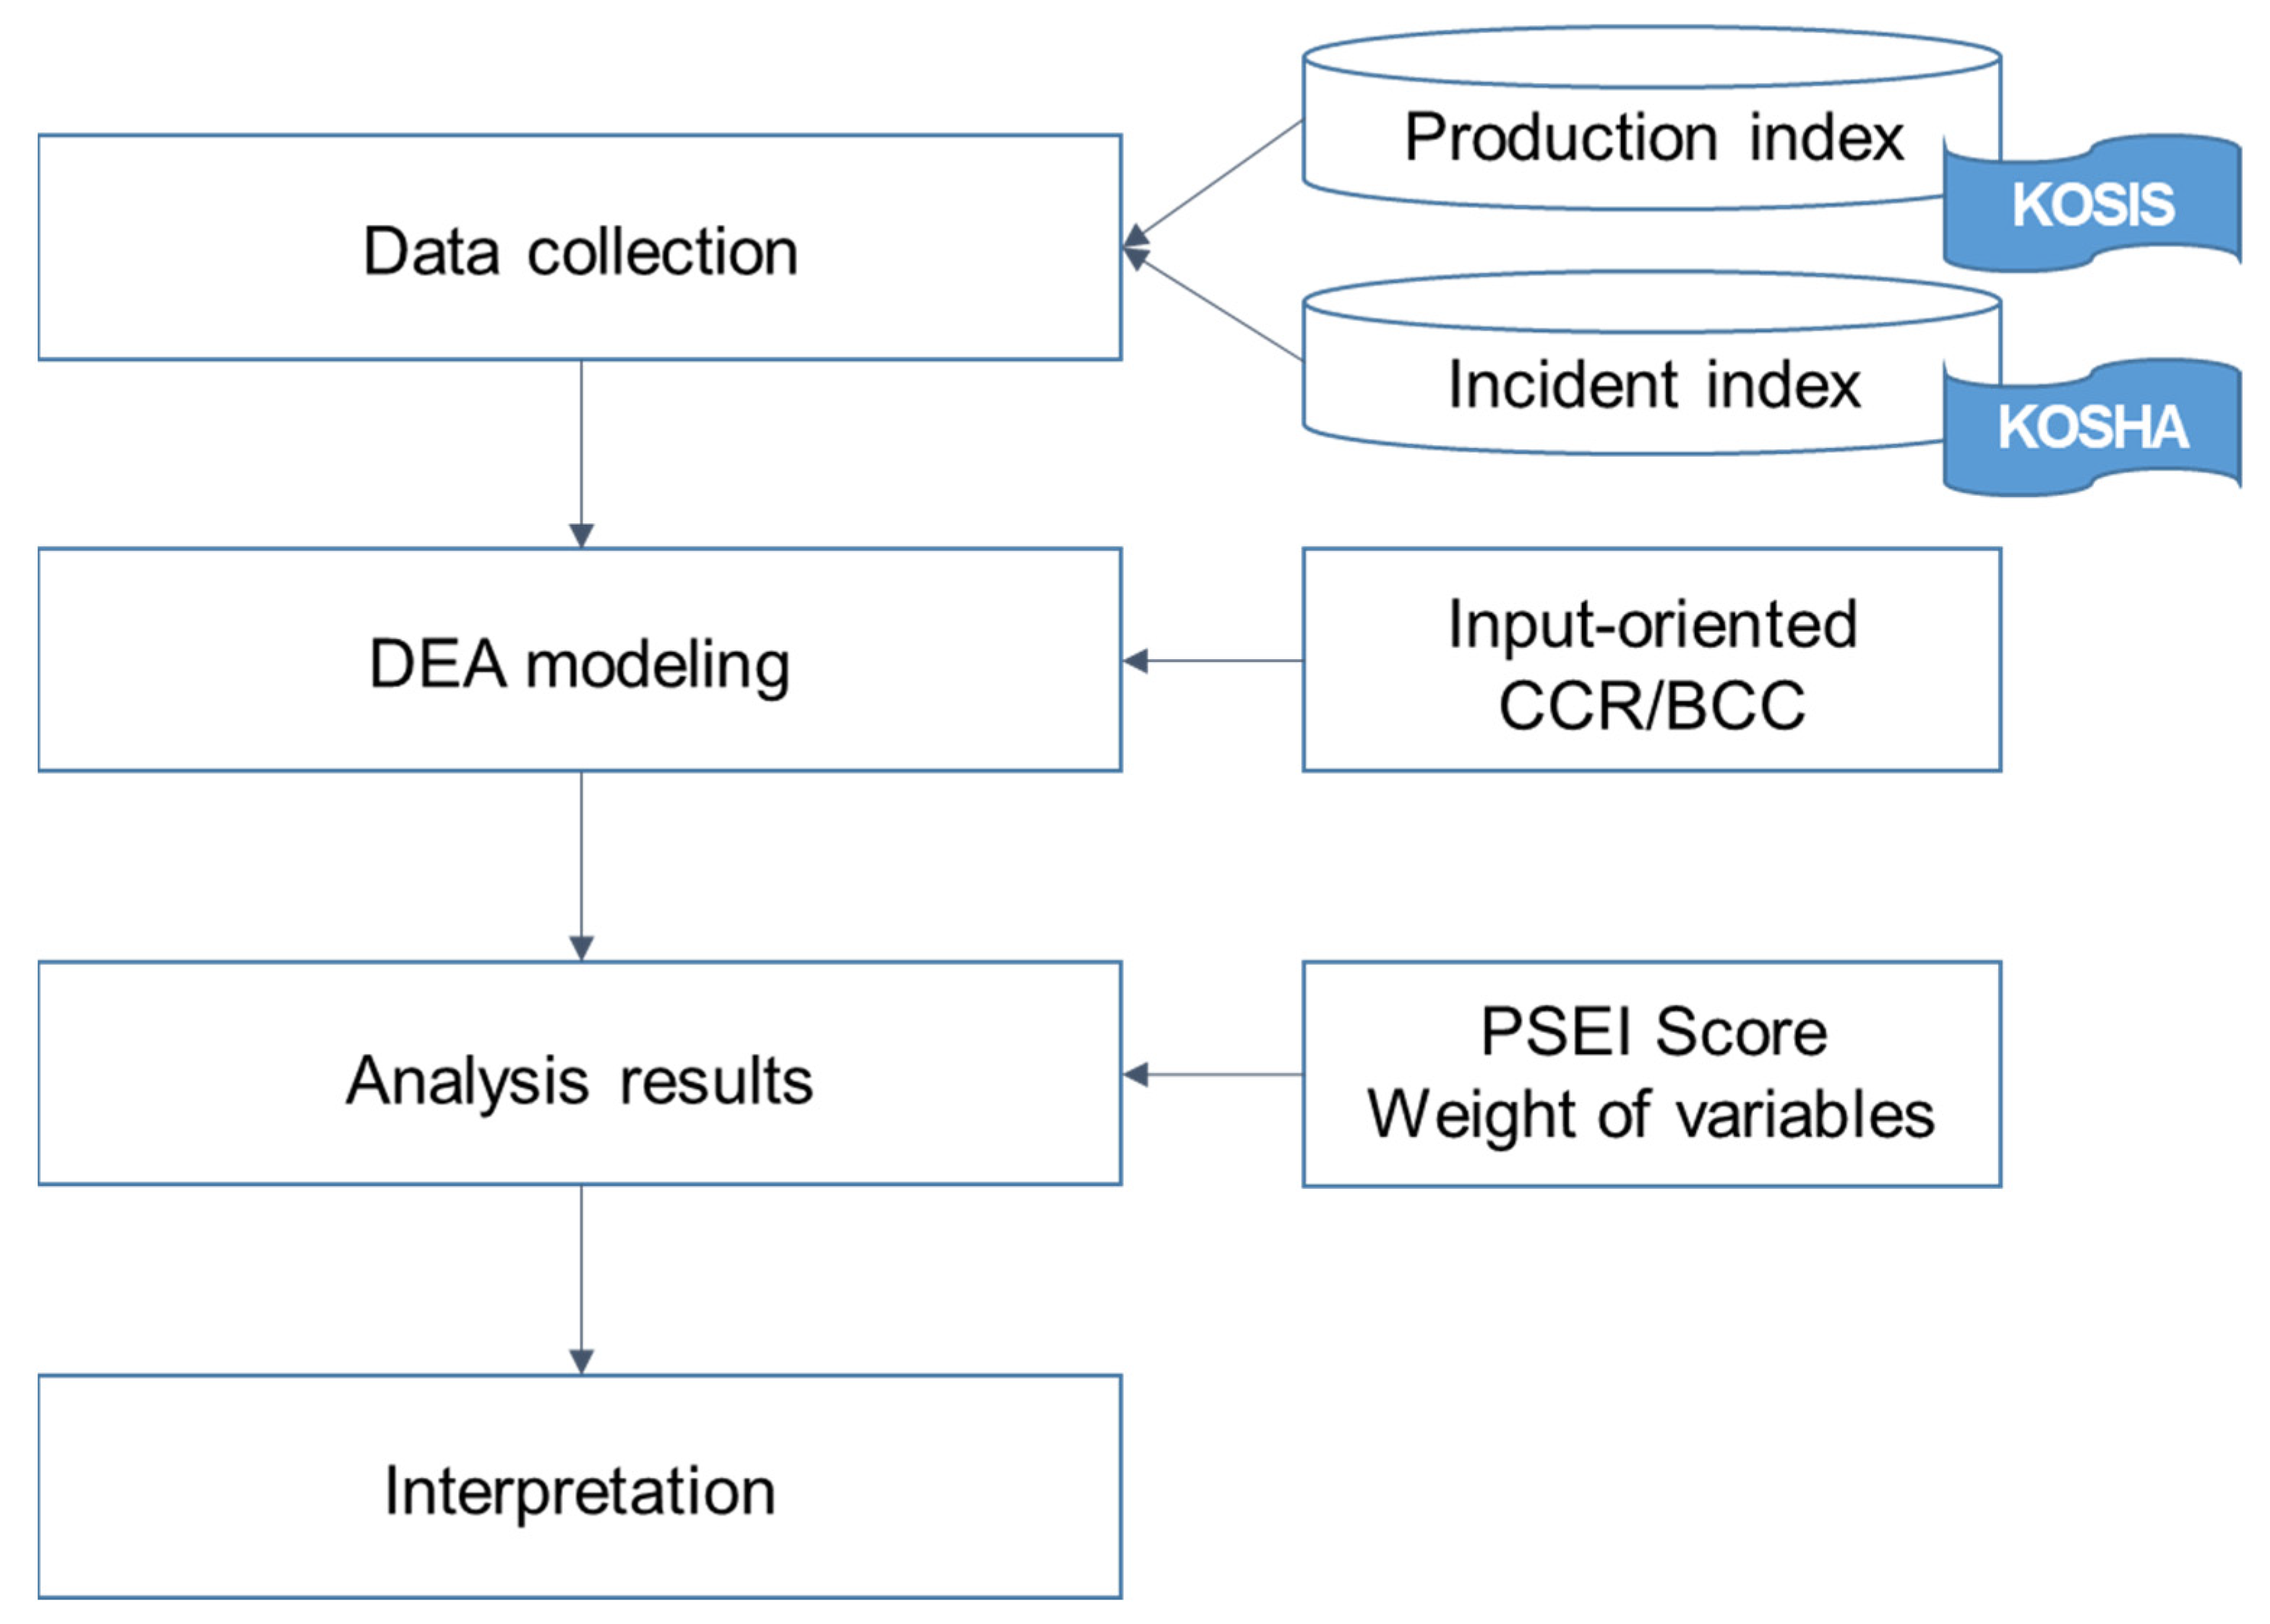
3.1. Research Framework

The research procedure consists of four steps to extract relative efficiency values of productivity over safety performance, as shown in Figure 3. First, the data comprise variables that include the production index and incident index, published by the Korean government organization of statistics, the Korean Statistical Information Services (KOSIS) through the Statistics Korea (KOSTAT), and the Korea Occupational Safety and Health Agency (KOSHA). The variables for production and incident indexes of manufacturing industries are selected. Second, the DEA is designed with an appropriate model, and we determine the use of input-oriented CCR/BCC models, for considering the importance of safety performance more than that of productivity performance. Using DEA, the relative efficiency is measured by developing productivity and safety performance efficiency indexes (PSEI), focusing on the safety performance. Also, the weights of input and output variables to the PSEI score are derived to understand the critical variables that can increase the PSEI score.

3.2. Data and Variables

For DEA to obtain the PSEI of each industry, we set the inputs and outputs. In general, safety performance is the result of the investment in safety measures and productivity is the total result. Thus, as inputs, we use the injury rate (IR), frequency rate (FR), and severity rate (SR), and as outputs, the labor productivity (LP), production capacity (PC), operation ratio (OR) are applied to satisfy the condition of definition. From the KOSIS and Korea Occupational Safety and Health Agency (KOSHA), three productivity indexes and safety performance indexes, respectively, of 15 manufacturing industries are gathered from 2015 to 2018 as summarized in Table 3. The mean value of each index, from 2015 to 2018, is shown in Table 3. Because the recent data are biased due to COVID-19, we use stable index data on the basis of 2015 for addressing a consistent national economy.
It is difficult to decide whether an industry shows good productivity with good safety performance because the rank of multiple variables is inconsistent. Some industries have low level of safety performance but indicate high level of productivity. To analyze these differences in performance among the multiple variables, the DEA can extract the integrated measures, considering three safety performance indexes and productivity indexes.

3.3. Productivity–Safety Effectiveness Index

In economics, the efficiency indexes are widely used to understand the value-based performance of targets and thus, the fewer inputs are, the better performances are concerning relative value. From the perspective of efficiency between productivity and safety, the lower the safety performance, the better the productivity, because the higher value of efficiency presents good condition. We developed a new index of industries in South Korea, the Productivity–Safety Effectiveness Index (PSEI), to measure the efficiency relationships between productivity and safety performance of industries. The relationship between inputs of safety performance and outputs of productivity can be presented as Equation (3).
P r o d u c t i v i t y S a f e t y   E f f e c t i v e n e s s = f ( L P , P C , F U ) f ( I R , F R , S R ) .
When PSEI is measured from the DEA model, we determine the x 0 values of the inputs and the y 0 values of the outputs in the objective function, respectively. Thus, three safety performance indexes are coded as inputs, and the remaining three productivity indexes are set as outputs. The z of the objective function indicates the PSEI score of each industry. Thus, we obtain the relative value of industries, comparing productivity and safety performance. The policymakers of government can obtain an understanding of the relationships between productivity and safety for managing the industries’ economy based on PSEI results, as shown in Table 4.

4. Result

4.1. Overall DEA

For calculating the PSEI, it is assumed that the objective of Productivity–Safety Effectiveness is more focused on effectively decreasing accident rates. Therefore, we adopt an input-oriented model, applying the DEA. It is noted that by using the DEA, the integrated value is presented regarding six indexes, divided into three inputs and three outputs. The DEA is conducted with average values of input and output variables from 2015 to 2018, as shown in Table 2. We can prioritize the industries based on PSEI.
As summarized in Table 5, the average score of PSEI in manufacturing industries is identified and the rank of PSEI is ordered in terms of CCR and BCC. Except for the non-metallic mineral industry, most industries have a consistent pattern in both CCR and BCC. The result shows that the industry that has the highest level of PSEI is precision instruments, followed by basic metal and electrical equipment for both CCR and BCC models. In contrast, the wood industry has the lowest level of PSEI for CCR, followed by non-metallic mineral and metal fabrication, but for BCC, it is followed by metal fabrication and rubber and plastic products. The non-metallic mineral industry has a big difference between CCR (14th) and BCC (6th) models, showing a rapid increase in output compared to the other industries.
The weights of each input and output, which present the information on the optimal state, are summarized in Table 6. The weight value of the variable close to 100 indicates that this variable is more critical to increasing the PSEI. For instance, for the food and beverage industry, SR and PC have the highest value among safety performance inputs and productivity outputs, respectively. It means that this industry has better SR compared to other input variables and better PC compared to other output variables. In overall industries, the SR and the OR are outperformed among other inputs and outputs in general, but some industries have more effective variables for increasing PSEI such as IR (coal and petroleum products, basic metal), FR (metal fabrication, transportation equipment), LP (general machinery and equipment, precision instrument, transportation equipment), and PC (food and beverage, automobile). These results imply that the industry should focus on improving inputs and outputs that have lower weight values for PSEI. The benchmarking will be illustrated in the Section 5.1.2.

4.2. Dynamic DEA

In addition to the overall DEA, with respect to the CCR model, the dynamic analysis of industries’ PSEI of all years, from 2015 to 2018, is conducted to understand the change in safety performance and productivity as presented in Table 7. As a result, the PSEI of 2017 is the highest than other years and the change in industries’ PSEI could be found concerning trends of increase and decrease. Some industries’ PSEI fluctuated, but we can find the overall trend from 2015 to 2018. For instance, several industries show an increase trend overall, such as food and beverage, wood, non-metallic minerals, precision instruments, and electrical equipment, while other industries indicate a decrease trend in general, such as textile, coal and petroleum products, general machinery, and equipment, and automobile. By using the dynamic analysis of PSEI, the policymakers prepare the enhancement strategy of productivity or safety performance, considering the weight of the inputs and outputs. This implication will be addressed in the Section 5.1.3.

5. Discussion

5.1. Implications

5.1.1. Pattern of Productivity–Safety Effectiveness

As a result of DEA, we found the weight of input and output variables influencing the PSEI in each of the industries. By combining these variables, the patterns can be defined with strength in safety performance and productivity. As described in Table 8, six patterns are derived from the results of DEA, and the industries’ patterns are found.
First, the pattern of worker-operation ratio means the industry that has less IR and higher OR. The coal and petroleum industry and basic metal industry are included in this pattern because these two industries have mostly continuous production systems, streamlining production from input to output. The second pattern focuses on the reduction in FR with higher LP. The transportation equipment, such as rail, subway, and wagon, is made by order in general. It means that this production is customized and labor-intensive. Third, in metal fabrication, the management of operation ratio, is important because most firms are second- or third-tier to meet the demand of assembly companies. The fourth pattern includes the precision instruments and electrical equipment industries that require skillful workers using numerical tools. The LP is thus important in these industries, and there is less possibility of serious accidents that influence the loss of time because most of the tasks are used by the numerical tools. Fifth, in the food and beverage industry and automobile industry, they have the advantage of high PC based on conveyor systems. Finally, the major patterns are unveiled as less loss time and higher OR. This result implies that most industries focus on increasing OR while trying to reduce the time lost due to incidents. By finding the strengthening and weakness of both safety performance and productivity in terms of production type, the policymakers gain insight into enhancing productivity and reducing injuries.

5.1.2. Benchmarking for Improving PSEI

As pointed out before, the DEA provides a powerful application for benchmarking the most efficient DMU. The DEA facilitates benchmarking by comparing the performance of similar units or organizations within an industry, enabling organizations to identify the best industry practices, set performance targets, and improve competitiveness. By finding the weaknesses of both safety performance and productivity in each industry, the policymakers gain insight into strengthening productivity and reducing incident injuries.
Table 9 shows the DMU that can improve the PSEI by reducing inputs or by increasing outputs. There are two types of benchmarking revealed from DEA results. The first type is to decrease input variables only. In the chemical industry in the year 2017 and the non-metallic mineral in the year 2018, we identify the need for a decrease in IR, FR, and SR. For instance, by decreasing the IR to 2.12, the FR to 0.96, and the SR to 0.24, the chemicals industry became the most efficient DMU, such as like precision instruments in the year 2018. The second type is to control both inputs and outputs. For example, to achieve an efficiency of 100, the textile industry in2015 should have decreased the IR by 0.91, the FR by 0.39, and the SR by 0.17, and increased the LP by 0.01 and PC by 4.17. This type could meet the need for more investment in both safety measures and production innovation to achieve PSEI improvement. Other cases also represent the amount of change in input and output variables. Concerning these two types of improvement, the support plan for industries should be formulated by prioritizing the safety and productivity factors.

5.1.3. Trend Adjustment of PSEI

The results of dynamic DEA imply that the policymakers formulate support strategy of controlling the safety performance and productivity of industries that have a trend of decreasing PSEI. For example, as shown in Table 10, the textile industry shows less IR, FR, and SR compared to those of other industries, while the productivity is lower than that of other industries. In this case, we formulate a strategy for enhanced productivity in the textile industry, rather than strengthening the safety regulation or supporting safety investment. In contrast, policymakers consider safety strategies to reduce injuries in the general machinery and equipment industry because this industry has a lower level of safety performance and a higher level of productivity than other industries. Thus, regarding the trends according to the degree of input and output variables, a balanced portfolio of political strategy can be developed.

5.2. Limitations

The study has limitations for data availability and the analysis level, although the integrated measure for evaluating the efficiency of productivity and safety activities is developed and effective methods are applied.
First, due to the difficulty in collecting data at the industry level, this study only uses public data of productivity and safety performance indexes. However, by collecting more information, we can suggest more useful implications for benchmarking and improving industries’ PSEI. Thus, we should consider more input and output variables, such as the amount of safety investment and the production of industries. Other economic indicators related to firm activities, such as technology investment and labor costs, can also be included. A long-term study monitoring the relationship between productivity and safety is effective in understanding the delayed impact of safety investments.
Second, from a microeconomic perspective, we consider how to internalize safety investments. Safety investments are difficult to prove their effect on firm performance in the short term. Additionally, since safety investments vary across companies in terms of technological, facility, and human aspects, it is also challenging to analyze them on a company-by-company basis. However, if data on a company’s safety investment performance are available, research could be conducted to assess the effects of reduced accident rates and increased productivity resulting from specific safety investment categories. This could serve as a basis for internalizing efficient safety investments.
Third, the PSEI can also be analyzed at different levels, such as the national level or the firm level. Although industry-level analysis provides relevant information for policymakers, a national comparison can be effective for strategy formulation of benchmarking developed countries. However, national economic indices differ in terms of definition criteria and data collection methods. To address this issue, we can use International Labour Organization (ILO) or Organisation for Economic Co-operation and Development (OECD) data to ensure consistency at the national level.

6. Conclusions

The study proposes a new integrated index that considers the efficiency between productivity and safety performance using the DEA. As interest in safety performance increases in developed countries due to the ESG, considering PSEI is timely. Through developed integrated measures based on the results of DEA, the PSEI of industries was compared with the weight of input and output variables. By extracting significant variables of input and output, the industries’ strengths and weaknesses can be found.
In addition, three key findings are proposed. First, the patterns of efficient activities are defined based on the characteristics of industrial production systems. Strategies can then be formulated to customize support activities, tailored to the differences in patterns related to labor and facility management. Second, the deficiencies in input and output activities across industries are identified to benchmark the most efficient Decision-Making Units (DMUs). The DEA results can provide valuable reference information to improve productivity and reduce incidents. Based on the benchmarking scores, policymakers can prioritize strategies for government supervision and support. Finally, the trend analysis highlights the industries that have seen a decline in the PSEI over time. Policymakers can use this information to target industries that need improvement. If trends in technology or management practices are identified as contributing to a reduction in incident rates, effective methods for managing both productivity and occupational risks can be suggested.
In this respect, we contribute by providing evidence for formulating strategies and policies to enhance both productivity and safety performance. By identifying patterns, benchmarking units, and trends of PSEI, it is expected that the policymakers can prioritize the industries that introduce the improvement plan. Also, safety is regarded as a key societal value for corporations, aligning with Corporate Social Responsibility (CSR). In Korea, safety performance is incorporated into the assessment criteria for bidding on construction projects. Therefore, the PSEI can serve as an integrated index that captures both productivity and safety within ESG activities.

Funding

This research was supported by the National Research Foundation of Korea (NRF) grant funded by the Korea government (MSIT: Ministry of Science and ICT) (NRF-2020R1C1C1007302).

Institutional Review Board Statement

Not applicable.

Informed Consent Statement

Not applicable.

Data Availability Statement

The raw data supporting the conclusions of this article will be made available by the author on request.

Conflicts of Interest

The author declares that he has no known competing financial interests or personal relationships that could have appeared to influence the work reported in this paper.

References

  1. Díaz-Chao, Á.; Sainz-González, J.; Torrent-Sellens, J. ICT, innovation, and firm productivity: New evidence from small local firms. J. Bus. Res. 2015, 68, 1439–1444. [Google Scholar] [CrossRef]
  2. Pan, W.; Xie, T.; Wang, Z.; Ma, L. Digital economy: An innovation driver for total factor productivity. J. Bus. Res. 2022, 139, 303–311. [Google Scholar] [CrossRef]
  3. Wu, L.; Hitt, L.; Lou, B. Data analytics, innovation, and firm productivity. Manag. Sci. 2020, 66, 2017–2039. [Google Scholar] [CrossRef]
  4. Psomas, E.; Antony, J. The effectiveness of the ISO 9001 quality management system and its influential critical factors in Greek manufacturing companies. Int. J. Prod. Res. 2015, 53, 2089–2099. [Google Scholar] [CrossRef]
  5. Su, H.C.; Kao, T.W.D.; Linderman, K. Where in the supply chain network does ISO 9001 improve firm productivity? Eur. J. Oper. Res. 2020, 283, 530–540. [Google Scholar] [CrossRef]
  6. Astrini, N. ISO 9001 and performance: A method review. Total Qual. Manag. Bus. Excell. 2021, 32, 5–32. [Google Scholar] [CrossRef]
  7. Feng, Y.; Teo, E.A.L.; Ling, F.Y.Y.; Low, S.P. Exploring the interactive effects of safety investments, safety culture and project hazard on safety performance: An empirical analysis. Int. J. Proj. Manag. 2014, 32, 932–943. [Google Scholar] [CrossRef]
  8. Shirali, G.A.; Salehi, V.; Savari, R.; Ahmadiangali, K. Investigating the effectiveness of safety costs on productivity and quality enhancement by means of a quantitative approach. Saf. Sci. 2018, 103, 316–322. [Google Scholar] [CrossRef]
  9. Song, B.; Suh, Y. Identifying convergence fields and technologies for industrial safety: LDA-based network analysis. Technol. Forecast. Soc. Change 2019, 138, 115–126. [Google Scholar] [CrossRef]
  10. Flynn, M.A.; Eggerth, D.E.; Jacobson, C.J., Jr. Undocumented status as a social determinant of occupational safety and health: The workers’ perspective. Am. J. Ind. Med. 2015, 58, 1127–1137. [Google Scholar] [CrossRef] [PubMed]
  11. Zanko, M.; Dawson, P. Occupational health and safety management in organizations: A review. Int. J. Manag. Rev. 2012, 14, 328–344. [Google Scholar] [CrossRef]
  12. Fan, D.; Yeung, A.C.; Yiu, D.W.; Lo, C.K. Safety regulation enforcement and production safety: The role of penalties and voluntary safety management systems. Int. J. Prod. Econ. 2022, 248, 108481. [Google Scholar] [CrossRef]
  13. Feng, Y. Effect of safety investments on safety performance of building projects. Saf. Sci. 2013, 59, 28–45. [Google Scholar] [CrossRef]
  14. Farid, M.; Neumann, W.P. Modelling the effects of employee injury risks on injury, productivity and production quality using system dynamics. Int. J. Prod. Res. 2020, 58, 6115–6129. [Google Scholar] [CrossRef]
  15. Abad, J.; Lafuente, E.; Vilajosana, J. An assessment of the OHSAS 18001 certification process: Objective drivers and consequences on safety performance and labor productivity. Saf. Sci. 2013, 60, 47–56. [Google Scholar] [CrossRef]
  16. Karanikas, N.; Weber, D.; Bruschi, K.; Brown, S. Identification of systems thinking aspects in ISO 45001: 2018 on occupational health safety management. Saf. Sci. 2022, 148, 105671. [Google Scholar] [CrossRef]
  17. Bautista-Bernal, I.; Quintana-García, C.; Marchante-Lara, M. Safety culture, safety performance, and financial performance. A longitudinal study. Saf. Sci. 2024, 172, 106409. [Google Scholar] [CrossRef]
  18. Deng, X.; Li, W.; Ren, X. More sustainable, more productive: Evidence from ESG ratings and total factor productivity among listed Chinese firms. Financ. Res. Lett. 2023, 51, 103439. [Google Scholar] [CrossRef]
  19. Fan, D.; Lo, C.K.; Ching, V.; Kan, C.W. Occupational health and safety issues in operations management: A systematic and citation network analysis review. Int. J. Prod. Econ. 2014, 158, 334–344. [Google Scholar] [CrossRef]
  20. Adaku, E.; Ankrah, N.A.; Ndekugri, I.E. Design for occupational safety and health: A theoretical framework for organizational capability. Saf. Sci. 2021, 133, 105005. [Google Scholar] [CrossRef]
  21. Laal, F.; Pouyakian, M.; Madvari, R.F.; Khoshakhlagh, A.H.; Halvani, G.H. Investigating the impact of establishing integrated management systems on accidents and safety performance indices: A case study. Saf. Health Work 2019, 10, 54–60. [Google Scholar] [CrossRef] [PubMed]
  22. Lee, S.; Chang, S.; Suh, Y. Developing concentration index of industrial and occupational accidents: The case of European countries. Saf. Health Work 2020, 11, 266–274. [Google Scholar] [CrossRef]
  23. Lampe, H.W.; Hilgers, D. Trajectories of efficiency measurement: A bibliometric analysis of DEA and SFA. Eur. J. Oper. Res. 2015, 240, 1–21. [Google Scholar] [CrossRef]
  24. Liu, J.S.; Lu, L.Y.; Lu, W.M.; Lin, B.J. A survey of DEA applications. Omega 2013, 41, 893–902. [Google Scholar] [CrossRef]
  25. Sousa, V.; Almeida, N.M.; Dias, L.A. Risk-based management of occupational safety and health in the construction industry–Part 2: Quantitative model. Saf. Sci. 2015, 74, 184–194. [Google Scholar] [CrossRef]
  26. OSHA 1996; Regulations (Standards-29 CFR). OSHA: Washington, DC, USA, 1996. Available online: https://www.osha.gov/laws-regs/regulations/standardnumber/1996 (accessed on 6 January 2025).
  27. Suh, Y.; Seol, H.; Bae, H.; Park, Y. Eco-efficiency based on social performance and its relationship with financial performance: A cross-industry analysis of South Korea. J. Ind. Ecol. 2014, 18, 909–919. [Google Scholar] [CrossRef]
  28. Lee, S.; Lee, H. Measuring and comparing the R&D performance of government research institutes: A bottom-up data envelopment analysis approach. J. Informetr. 2015, 9, 942–953. [Google Scholar]
  29. Erdin, C.; Çağlar, M. National innovation efficiency: A DEA-based measurement of OECD countries. Int. J. Innov. Sci. 2023, 15, 427–456. [Google Scholar] [CrossRef]
  30. Chen, X.; Liu, X.; Gong, Z.; Xie, J. Three-stage super-efficiency DEA models based on the cooperative game and its application on the R&D green innovation of the Chinese high-tech industry. Comput. Ind. Eng. 2021, 156, 107234. [Google Scholar]
  31. He, P.; Sun, Y.; Shen, H.; Jian, J.; Yu, Z. Does Environmental Tax Affect Energy Efficiency? An Empirical Study of Energy Efficiency in OECD Countries Based on DEA and Logit Model. Sustainability 2019, 11, 3792. [Google Scholar] [CrossRef]
  32. Sueyoshi, T.; Goto, M. Efficiency-based rank assessment for electric power industry: A combined use of Data Envelopment Analysis (DEA) and DEA-Discriminant Analysis (DA). Energy Econ. 2012, 34, 634–644. [Google Scholar] [CrossRef]
  33. Moon, H.; Min, D. A DEA approach for evaluating the relationship between energy efficiency and financial performance for energy-intensive firms in Korea. J. Clean. Prod. 2020, 255, 120283. [Google Scholar] [CrossRef]
  34. Wang, Q.; Tang, J.; Choi, G. A two-stage eco-efficiency evaluation of China’s industrial sectors: A dynamic network data envelopment analysis (DNDEA) approach. Process Saf. Environ. Prot. 2021, 148, 879–892. [Google Scholar] [CrossRef]
  35. Song, M.; Jia, G.; Zhang, P. An evaluation of air transport sector operational efficiency in China based on a three-stage DEA analysis. Sustainability 2020, 12, 4220. [Google Scholar] [CrossRef]
  36. Yu, M.; Xu, S.; Zhou, F.; Xu, H. A study on the relationship between urban spatial structure evolution and ecological efficiency in Shandong Province. Appl. Sci. 2024, 14, 818. [Google Scholar] [CrossRef]
  37. García-Quevedo, J.; Jové-Llopis, E. Environmental policies and energy efficiency investments. An industry-level analysis. Energy Policy 2021, 156, 112461. [Google Scholar] [CrossRef]
  38. Tong, H.; Hou, Q.; Dong, X.; Duan, Y.; Gao, W.; Lei, K. Assessing the spatial efficiency of Xi’an rail transit station areas using a data envelopment analysis (DEA) model. Appl. Sci. 2025, 15, 384. [Google Scholar] [CrossRef]
Figure 1. Relative efficiency: concept of the DEA.
Applsci 15 01989 g001
Figure 2. Research gap and purpose.
Applsci 15 01989 g002
Figure 3. Research procedure.
Applsci 15 01989 g003
Table 1. Operational definition of efficiency indexes.
VariablesOperational DefinitionNormal Formula
Labor Productivity (LP)The amount of output produced per unit of labor input.
It measures the efficiency of workers in producing goods or services.
(Total outputs/total man-hours of year)/(Total outputs/total man-hours of base year) × multiplier(100)
Production Capacity (PC)The maximum amount of goods or services that a business can produce given its resources. It measures the capability of a company or a facility to produce output within a specified period.(Production capacity of year/Production capacity of base year × weight of production items)/(Total weight of all production items) × multiplier(100)
Operation Ratio (OR)Also known as the capacity utilization rate, it measures how effectively a company or a facility is utilizing its production capacity.(Production outputs of year/Production capacity of year)/(production outputs of base year/Production capacity of base year) × weight of operation ratio of items)/(Total weight of all operation ratio of items) × multiplier(100)
Injury Rate (IR)The frequency of workplace injuries and illnesses within a specific time frame.The number of workers injured by incidents/The number of employees × multiplier(1000)
Frequency Rate (FR)It measures the number of workplace injuries or incidents relative to a standard unit of exposure, typically expressed per a certain number of hours worked or per a specific number of employees.The number of occupational incidents/The number of employees × multiplier(1,000,000)
Severity Rate (SR)The number of lost workdays associated with each incident.
The total severity scores are divided by the total number of hours worked or another unit of exposure.
The number of loss of working hours/The number of employees × multiplier(1000)
Table 2. Literature review of efficiency studies based on DEA.
TopicPurposeLevel
R&D R&D efficiency based investment and knowledge outputs (academic publication, patent, etc.)National [30],
Industry [31]
Corporate/Project [30]
Energy Energy efficiency based on raw material inputs and energy useNational [32]
Industry [33]
Corporate/project [34]
EcologyEco-efficiency based on raw material inputs and emission of greenhouse gasesIndustry [28,35]
National [36]
TransportTransportation service efficiency based on resources (e.g. capital, infrastructure) and quality of transportation services (e.g. speed, channel)Industry [37]
Corporate/project [38]
Table 3. Mean of productivity and incident indexes (2015~2018).
Manufacturing IndustryIRFRSRLPPCOR
1. Food and Beverage7.823.501.5898.45101.30101.53
2. Textile (except apparel)3.601.620.8398.2599.7095.95
3. Wood17.367.794.1397.73101.20100.45
4. Pulp and paper8.914.012.2897.1598.15100.13
5. Coal and petroleum products4.491.973.72105.05103.70105.13
6. Chemicals5.922.641.58105.13103.58101.53
7. Rubber and plastic products9.494.251.9797.53100.0398.85
8. Non-metallic mineral14.256.434.06106.50103.63103.90
9. Basic metal2.000.891.00102.20100.27101.30
10. Metal fabrication10.534.673.26101.18100.20101.81
11. General machinery and equipment7.393.331.77105.50100.3099.63
12. Precision instruments 2.451.110.51104.63106.5798.60
13. Electrical equipment2.941.320.61100.53100.87102.23
14. Automobile6.002.701.1698.49100.1590.98
15. Transportation equipment5.952.671.5898.5792.3788.43
Average7.273.262.00101.13100.8099.36
Standard deviation4.351.961.233.413.154.51
Table 4. Meaning of DEA measures for PSEI.
MeasuresExplanation
EfficiencyWhen the efficiency of DMU is higher, the lower the safety performance values, the higher the productivity values.
WeightWhen the weight of one variable of inputs (outputs) is higher than that of other variables of inputs (outputs) in the industry i, it means that this variable has relatively more influence on increasing PSEI of the industry i compared to other industries.
Table 5. Score of PSEI-based DEA.
Manufacturing IndustryAverage
% Score (CCR)
RankAverage
% Score (BCC)
Rank
1. Food and Beverage30.491034.5411
2. Textile (except apparel)61.88464.085
3. Wood13.101515.0015
4. Pulp and paper24.791125.8112
5. Coal and petroleum products45.57577.924
6. Chemicals38.28750.178
7. Rubber and plastic products24.351225.3313
8. Non-metallic mineral15.761460.276
9. Basic metal95.34296.522
10. Metal fabrication19.131320.1914
11. General machinery and equipment31.35953.587
12. Precision instruments 96.79198.291
13. Electrical equipment81.04391.143
14. Automobile40.62642.909
15. Transportation equipment35.49837.1510
Average41.86 50.30
Standard deviation26.41 27.18
Table 6. Average of CCR weight of safety performance (input) and productivity (output) (2015~2018).
Manufacturing IndustryInputOutput
IRFRSRLPPCOR
1. Food and Beverage0.026.473.616.445.038.7
2. Textile (except apparel)38.435.326.341.417.041.8
3. Wood0.044.156.00.07.392.7
4. Pulp and paper29.728.541.80.00.0100.0
5. Coal and petroleum products50.047.03.116.38.375.5
6. Chemicals0.047.452.615.30.384.4
7. Rubber and plastic products15.634.649.88.18.483.6
8. Non-metallic mineral0.018.381.724.60.475.0
9. Basic metal66.714.618.744.211.044.8
10. Metal fabrication0.080.219.816.329.254.6
11. General machinery and equipment0.043.856.250.10.049.9
12. Precision instruments 0.046.353.766.70.033.3
13. Electrical equipment0.041.258.88.00.092.0
14. Automobile0.026.473.616.445.038.7
15. Transportation equipment25.942.431.845.411.243.5
Average15.138.446.524.612.263.2
Standard deviation22.015.722.620.115.623.5
Table 7. Change in PSEI of industries from 2015 to 2018.
Industry2015201620172018Trend
1. Food and Beverage20.9922.1925.5824.41Increase
2. Textile (except apparel)54.7143.9345.6335.65Decrease
3. Wood8.29.3410.1310.57Increase
4. Pulp and paper17.617.719.1317.2Stable
5. Coal and petroleum products41.137.6246.3830.05Decrease
6. Chemicals26.1226.8629.3227.27Stable
7. Rubber and plastic products18.8319.617.4718.8Stable
8. Non-metallic mineral10.4812.0712.3516.27Increase
9. Basic metal75.3985.9381.4581.46Increase
10. Metal fabrication14.0516.0216.0216.27Stable
11. General machinery and equipment20.2121.4422.8516.27Decrease
12. Precision instruments 63.8990.4670.08100Increase
13. Electrical equipment58.2458.8663.6563.65Increase
14. Automobile30.8627.7741.7221.72Decrease
15. Transportation equipment23.6425.4823.0121.72Stable
Average32.2934.3534.9833.42
Table 8. Patterns of strength on safety performance and productivity.
PatternRespective IndustriesGeneral Production Type
1. Worker–Operation ratioCoal and petroleum, Basic metalContinuous production
Flow shop system
2. Injury–Labor productivityTransportation equipmentProject production
Job shop system
3. Injury–Operation ratioMetal fabricationMass production
Flow shop system
4. Loss time–Labor productivityPrecision instruments, Electrical equipmentBatch production
Job shop system
5. Loss time–Production capacityFood and beverage, AutomobileMass production
Flow shop system
6. Loss time–Operation ratioNon-metallic mineral, Rubber and plastic, Wood, Pulp and paper, Chemicals, Textile, General machinery and equipmentContinuous production
Flow shop system
Table 9. Benchmarking for improving the performance of industries.
TypeExample of IndustryYearScoreInputOutput
IRFRSRLPPCOR
Most efficient DMUPrecision instruments2018100000000
#1. Control only inputChemicals201782.49−2.12−0.96−0.24000
Non-metallic mineral201666.22−9.11−4.1−1.37000
#2
Control both input and output
Precision instruments201594.87−0.16−0.06−0.030.353.390
Electrical equipment201692.63−0.26−0.1−0.051.712.310
Electrical equipment201580.80−0.67−0.27−0.120.054.080
Textile201574.65−0.91−0.39−0.170.014.170
Coal and petroleum products201662.83−1.92−0.72−1.343.090.250
Table 10. Decrease trend and statistics of industries.
IndustryTrendIRFRSRLPPCOR
2. Textile(except apparel)Decrease3.601.620.8398.2599.7095.95
5. Coal and petroleum productsDecrease4.491.973.72105.05103.70105.13
11. General machinery and equipmentDecrease7.393.331.77105.50100.3099.63
14. AutomobileDecrease6.002.701.1698.49100.1590.98
Disclaimer/Publisher’s Note: The statements, opinions and data contained in all publications are solely those of the individual author(s) and contributor(s) and not of MDPI and/or the editor(s). MDPI and/or the editor(s) disclaim responsibility for any injury to people or property resulting from any ideas, methods, instructions or products referred to in the content.

