Article

Gram-Scale Green-Emission Carbon Quantum Dots Produced from Wood via the Hydrothermal Synthesis Method for the Detection of Fe (III)

1
College of Science, Northeast Forestry University, Harbin 150040, China
2
Northeast Forestry University Engineering Consulting Design and Research Institute Co., Ltd., Harbin 150040, China
*
Author to whom correspondence should be addressed.
Appl. Sci. 2025, 15(4), 1958; https://doi.org/10.3390/app15041958
Submission received: 16 January 2025 / Revised: 8 February 2025 / Accepted: 11 February 2025 / Published: 13 February 2025
(This article belongs to the Special Issue Innovative Approaches and Materials for Water Treatment)

Abstract

:

Featured Application

The gram-scale green-emission synthesis of carbon quantum dots not only facilitates environmental management, particularly in the detection of Fe (III) in water, but also holds potential for enhancing composite materials.

Abstract

Carbon quantum dots (CQDs), a distinctive class of fluorescent carbon nanomaterials, exhibit considerable potential for widespread application across several industries due to their safety, environmental sustainability, excellent water solubility, and tunable yet stable fluorescence properties. Nevertheless, the mass field is limited, and the cost of production is higher for the majority of methods. This study examines a cost-effective approach for the hydrothermal synthesis of nitrogen-doped carbon quantum dots (N-CQDs) from wood using NH3·H2O as the nitrogen precursor, facilitated by H2O2 and ultraviolet light. The produced N-CQDs demonstrate superior crystallinity and solubility in water, with the average particle size of 5.02 nm. After 10 experiments under the same conditions, a significant and stable yield of 5.04 g (42 wt%) was finally obtained by hydrothermal synthesis. The N-CQDs solution exhibits green fluorescence when exposed to ultraviolet light, and its fluorescence performance is influenced by concentration and excitation wavelength. Furthermore, it explores their application in identifying Fe (III) in water. The surface of N-CQDs is abundant in hydrophilic hydroxyl groups, distinctive nitrogen-containing groups, and various oxygen-containing functional groups. Fe (III) can extinguish fluorescence in water. The ratio of fluorescence intensity before and after to the addition of Fe (III) solution to the N-CQDs solution (F0/F) exhibits the effective linear correlation within the concentration range of 0.1 to 100 μmol/L. Within the concentration range of 100 to 1000 μmol/L, the increase in Fe (III) concentration results in substantial aggregation of Fe (III) and N-CQDs, along with a blue shift in the fluorescence wavelength. This discovery possesses significant potential for the synthesis and application of environmentally friendly, high-yield N-CQDs.

1. Introduction

Carbon quantum dots (CQDs) are a unique kind of zero-dimensional fluorescent carbon nanomaterials with high fluorescence intensity, excellent water solubility, biocompatibility [1], adjustable surface functionality, and excellent photostability [2,3]. CQDs can be used as an auxiliary material to enhance the performance of other materials. Their fluorescence properties not only enable efficient bioimaging and cell labeling, but also significantly improve the material’s performance by combining it with other materials. For example, in Fe3O4@mSiO2 composite, carbon dots are fluorescently labeled to achieve mitochondrial targeted imaging and long-term imaging [4]. In CDs@Mat-PANI, carbon dots enhance the magnetic and photoluminescence properties by electron transfer mechanism [5]. Furthermore, the fluorescence properties of CQDs can be affected by heavy metal ions, demonstrating considerable potential for detecting metal ions in water [6]. Fe (III) detection and measuring sensors are used in a wide range of environments, including environmental monitoring [7], biomedical [8], industrial testing [9], and food safety [10]. The CQDs based fluorescence sensor can detect not only Fe3+, but also other metal ions, such as AA (ascorbic acid), and this sensor shows a good linear relationship and low detection limits in both water samples and human serum [11]. These sensors are widely used in water pollution monitoring and environmental protection because of their high sensitivity and fast response time.
Regarding the requirement for particular alterations to carbon quantum dots and their enhanced fluorescence characteristics, as well as factors concerning experimental settings, safety, and cost-efficiency, hydrothermal synthesis has become the primary technique for CQDs preparation. A diversity of materials can function as precursors for the hydrothermal synthesis of carbon quantum dots, including glucose [12], citric acid [13], chitosan [14], coconut shells [15], banana peels [16], sugarcane [17], etc. Despite the hydrothermal method’s reputation for generating high-quality CQDs, there remain few reports that produce a significant quantity of these materials. Researchers initially extracted cellulose from bamboo waste using diluted hydrochloric acid, thereafter, introducing 2,4-diaminobenzenesulfonic acid to lignin for carbonization. This technique concurrently provides nitrogen and sulfur elements on the surface of nitrogen-doped carbon quantum dots (N-CQDs). The N-CQDs generated using this approach demonstrate proficient fluorescence detection skills for Fe (III), attaining a detection limit of 0.15 μmol/L [18]. Nonetheless, the yield of CQDs in that investigation was below 0.3 g, leading to a diminished overall mass yield owing to a substantial quantity of unutilized precursors.
Presently, numerous research efforts on fluorescence intensity, spectrum attributes, and application have been reported, with comparatively minimal attention given to the mass yield of CQDs. Liu et al. oxidized cellulose precursors with nitric acid and integrated nitrogen elements to simultaneously enhance the quality and mass yield of CQDs, increasing the total mass production of N-CQDs from 2.9 wt% to 16.1 wt% [19]. Certain researchers initially exposed glucose and other biomass to hydrothermal carbonization at 200 °C and then treated the resulting solid biochar with diluted sodium hydroxide and hydrogen peroxide at ambient temperature; this procedure increased the mass production of CQDs from 0.62 wt% to 43.8 wt% [20]. This discovery suggests significant potential for improving the mass yield of carbon-based precursors but requires the neutralization of Na+ with hydrochloric acid, followed by extended dialysis for its elimination. Qin et al. employed commercially available activated carbon as a precursor to synthesize CQDs using a weak base (H2O2), which does not produce by-products; nonetheless, their yield was restricted to milligram quantities [21].
To date, there have been no reports on hydrothermal methods that enable the high-yield synthesis and modification of carbon quantum dots using raw wood without the need for strong acids or bases. This study focuses on the synthesis of fluorescent nitrogen-doped carbon quantum dots (N-CQDs) from poplar wood, abundant in lignin and cellulose, utilizing a mild base oxidation technique. This method offers simplicity, high mass yield, and numerous benefits for environmental sustainability and cost-effectiveness. The weak base treatment involves diluted hydrogen peroxide and a minimal amount of ammonia solution, resulting in reduced hazards and the absence of challenging waste byproducts. The synthesized N-CQDs are then employed for the detection of Fe (III).

2. Materials and Methods

2.1. Materials

Poplar blocks (20 mm × 20 mm × 40 mm). Aqueous Ammonia Standard Solution (25% purity) and hydrogen peroxide (30 % purity), FeCl3·6H2O were purchased from Shanghai Aladdin Agent Co., Ltd. (Shanghai, China).

2.2. Synthesis Methods of N-CQDs

Scheme 1a illustrates the preparation process of carbon quantum dots. Poplar wood is immersed in deionized (DI) water until it reaches saturation and subsequently sinks, a process that typically requires one week. The wood is subsequently positioned in a teflon-lined stainless steel autoclave. After being heated at 200 °C for 10 h, the autoclave cools naturally to room temperature. The heating rate of the blast drying oven is 5 °C/min and the volume of the polytetrafluoroethylene inner liner is 100 mL. The resultant carbonized wood block is next crushed and cleaned with water through agitation, followed by vacuum filtration conducted at least three times. The filtered solid biocarbon was subsequently combined in a beaker with a solution of deionized water (40%), hydrogen peroxide (40%), and ammonia solution (20%) by volume, and agitated under Ultraviolet (UV) light for 4 h. The CQDs solution is further dried in a vacuum oven at 95 °C for 12 h to obtain N-CQDs powder.

2.3. Characterization

The XRD pattern was obtained by Cu Kα radiation diffractometer (XRD-6100, Shimadzu, Kyoto, Japan). The morphology of N-CQDs was investigated by FEI Tecnai G2 F30 transmission electron microscopy (TEM) (FEI Company’s technology brand, Hilson, TN, USA). The UV-Vis spectra were obtained by TU-1901 spectrophotometer. X-ray photoelectron spectroscopy (XPS) was performed by Thermo Scientific ESCALAB 250Xi (Cambridge, UK). FTIR spectra were recorded on a 400-50 (Fisher) spectrometer Tianjin Topu Instrument Co., Ltd., Tianjin, China) in the range of 400–4000 cm−1. The fluorescence emission spectra were recorded on a LS55 fluorescence spectrometer (Prekin Elmer, Waltham, MA, USA).

2.4. Determination of Fluorescence Quantum Yield

Quantum yield (QY) of N-CQDs was determined using quinine sulfate dispersed in 0.1 M H2SO4 (QY 54%). The calculation formula for the QY of fluorescent substances is provided in Equation (1) [22]:
Y 1 = Y 2 · ( I 1 I 2 ) · ( A 2 A 1 ) · ( n 1 2 n 2 2 )
where 1 and 2 denote the N-CQDs solution and the quinine sulfate standard solution, respectively. Y represents the quantum yield. I signifies the integral intensity of the emission spectrum. A (<0.05) indicates the absorbance at 360 nm; n refers to the refractive index, which is approximately 1.33.

2.5. Detection of the Concentration of Fe (III)

Generally, 10 mL of N-CQDs solution with 0.25 mg/mL was accurately measured using a pipette. This process can involve taking 0.25 g of N-CQDs and placing it in 1000 mL of deionized water. Then, subject the solution to ultrasonic treatment at room temperature for 10 min, and a uniform N-CQDs solution can be obtained. Mixed solutions of FeCl3·6H2O with varying Fe (III) concentrations (1000, 800, 600, 400, 200, 100, 75, 50, 25, 10, 7.5, 5, 2.5, 1, and 0.1 μmol/L) were added. Fluorescence intensities for 0.25 mg/mL N-CQDs solution be denoted as F0, and the concentration of the Fe (III) solution is represented by F. The Stern–Volmer equation can be expressed as follows in Formula (2) [23]:
F 0 / F = 1 + K s [ Q ]
where Ks represents the Stern–Volmer quenching constant, whereas [Q] denotes the concentration of the quenching agent (Fe (III)). Initially, a linear relationship between these two variables is established. Subsequently, the LOD (limit of detection) for 0.25 mg/mL N-CQDs solution is calculated using the formula D = 3δ/k [24] (where δ is the standard deviation of F0 for the 0.25 mg/mL N-CQDs solution and k is the slope of the fitted curve).

3. Results and Discussion

3.1. Structure and Morphology of N-CQDs

The N-CQDs solution exhibited stability and homogeneity at room temperature for two months, with no notable precipitation detected. Figure 1a illustrates the morphology of the N-CQDs by TEM, revealing evenly spherical particles. A total of 181 particle size data (N = 181) were obtained from Figure 1a. Figure 1b indicates that the particle size varies from 1.86 nm to 8.62 nm, and the arithmetic mean value of particle size is D = 4.69 nm. Then, the grain size histogram was drawn by Sturges method. The bin-width (W) is obtained from the relation W =(Dmax − Dmin)/k, where k = 1 + 3.322log(N) [25]. From the Gaussian curve fitting formula y = A × exp(−2 ((x − x0)/2σ)2) + C, we obtained a median particle size of D0 = 4.53 ± 0.1 nm and σ = 3.38 ± 0.7 nm. Given that the values of D0 and σ are of comparable magnitude and the differences are not statistically significant, it is inappropriate to approximate the CQDs as an ideal system with a single particle size, because variations in particle size may lead to distinct effects. The clearly defined lattice fringes in the high-resolution TEM (HRTEM) image (Figure 1c) correspond to the lattice spacing of the graphene (100) faces, measuring 0.21 nm [26]. The XRD result of the CQDs have a part of graphite oxide carbon structure, so there is a diffraction peak of (002), and the wide peak (2θ = 15~30°) can be attributed to the amorphous carbon structure [22,27,28].

3.2. Surface Functional Characteristics and Elemental Analysis

The surface functional properties have been investigated using Fourier transform infrared spectroscopy (FTIR). Figure 2 illustrates that the absorption maxima at 3190 cm−1 and 2990 cm−1 correspond to the stretching vibrations of O-H and N-H bonds, respectively. The absorption peak at 2150 cm−1 is ascribed to the stretching vibration of the triple bond ν(C≡C). Additionally, the absorption peaks observed at 1670 cm−1, 1560 cm−1, and 1380 cm−1 correspond to the stretching vibrations of carbonyl (C=O), C=C, and C-N bonds, respectively. The absorption peak at 1060 cm−1 is ascribed to the symmetrical stretching vibration of the ether bond (R-O-C). The shoulder peak in the 650 cm−1 area is attributed to the out-of-plane bending vibration of unsaturated δ(C-H) in the benzene ring and the out-of-plane rocking vibration absorption peak of NH2 groups in secondary amides. By integrating these data with the stretching vibration attributes of N-H, C=O, and C-N bonds, it can be deduced that N-CQDs molecules exhibit the amide structure (-CO-NH), signifying successful nitrogen doping in the N-CQDs [29].
The elemental composition of N-CQDs was analyzed using X-ray photoelectron spectroscopy (XPS). Figure 3a illustrates three distinct peaks at 285 eV, 401 eV, and 533 eV, corresponding to C1s, N1s, and O1s, respectively [19]. A minimal quantity of nitrogen elements persists on the surface of N-CQDs, resulting from the reaction between NH3·H2O and H2O2 during the degradation of bulk carbon materials. Additionally, Figure 3b displays the peak-fitting results of the high-resolution C1s spectrum, indicating five discrete peaks associated with sp2-hybridized carbon (C=C/C-C) [30], sp3-hybridized carbon (C-O/C-N) [27], imine carbon (C=N) [31], carbonyl carbon (C=O) [23], and carboxyl carbon (-COOH) [32]. The N 1s spectrum illustrated in Figure 3c can be deconvoluted into three different peaks, representing amine nitrogen, amino nitrogen, and pyrrole nitrogen [23,30,33]. In the O1s spectrum (Figure 3d), three peaks are discernible: C=O, C-O [33], and N=O [23], with the N=O peak displaying the greatest strength.
The findings from FTIR and XPS demonstrate the successful execution of amination and carbonization processes for the creation of nitrogen-doped and extremely hydrophilic N-CQDs.

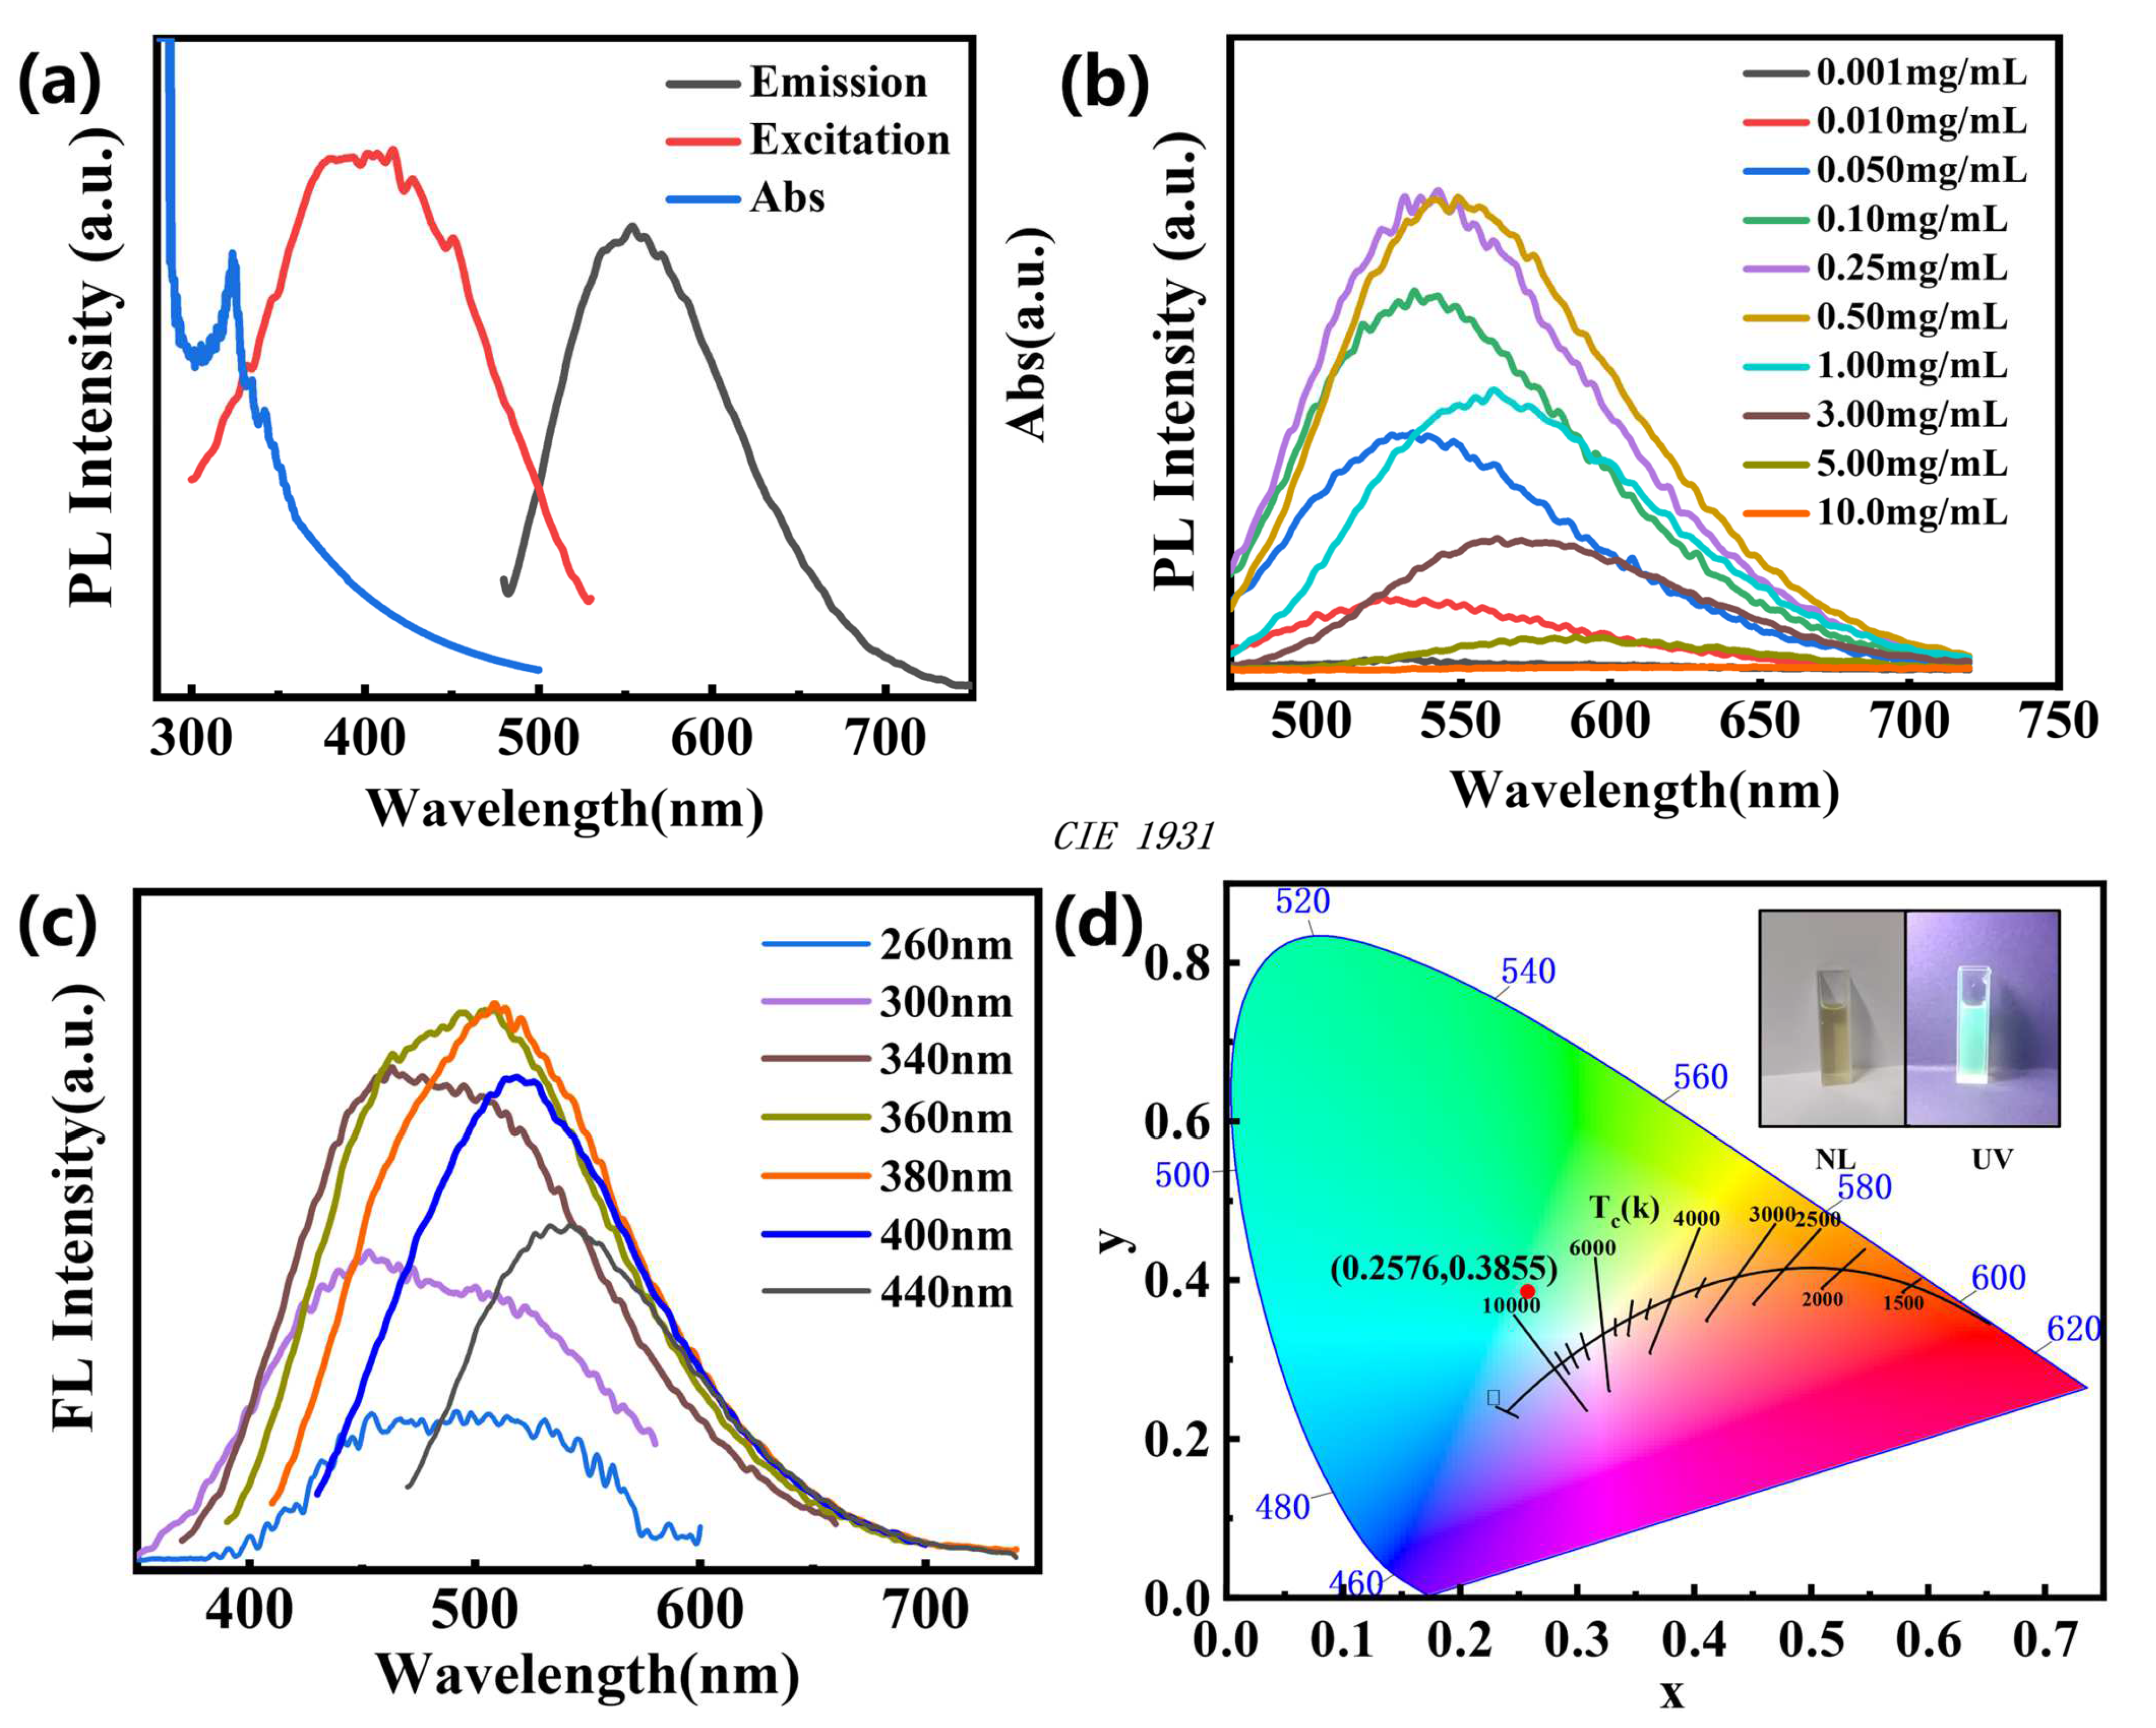
3.3. Optical Properties of N-CQDs

The optical characteristics of N-CQDs were analyzed by Ultraviolet visible (UV-vis) absorption spectroscopy, photoluminescence (PL) excitation spectroscopy, and emission spectroscopy. The UV-Vis absorption spectrum of N-CQDs was examined, showing a prominent absorption peak between 300 and 350 nm, as illustrated in Figure 4a. This signifies that N-CQDs possess the ability to absorb ultraviolet energy. The excitation wavelength of the 1 mg/mL N-CQDs solution shown in Figure 4a is around 380 nm, but the peak emission wavelength is about 550 nm. The Stokes shift between the excitation and emission wavelengths is considerable, approximately 170 nm. This phenomenon indicates that there is a large energy loss between absorption and emission in the fluorescence process of CQDs. From the perspective of individual carbon point, the influence of molecular structure of carbon point is mainly manifested as energy dissipation in the process of vibration relaxation and radiation transition [34,35]. N-CQDs often exhibit a range of oxygen-containing functional groups. The distinctive fluorescence band of CQDs originates from particular electron transitions between the anti-bonding and bonding molecular orbitals of functional groups, including π*-π, σ*-n, and π*-σ [36,37]. Figure 2 and Figure 3 demonstrate that the incorporation of a minimal quantity of nitrogen elements results in the creation of novel functional groups and chemical bonds (including C=O and C-N). The newly formed intermediate states efficiently reduce the HOMO-LUMO gap, while surface states diminish the band gap of N-doped carbon quantum dots (N-CQDs), leading to a substantial Stokes shift [38,39].
The concentration of N-CQDs markedly affects the fluorescence (FL) intensity and emission wavelength of the solution. Figure 4b illustrates the effect of solutions with differing N-CQD concentrations on the fluorescence peak. With illumination at a consistent wavelength of 440 nm, a rise in N-CQD concentration led to a progressive redshift of the fluorescence wavelength and the initial enhancement in fluorescence intensity. The fluorescence intensity maximizes at a concentration of 0.25 mg/mL of N-CQDs. Nevertheless, as the concentration of N-CQDs increased more, the intensity began decreasing. At high concentrations, the fluorophores in the N-CQDs can absorb excitation light and emit light reciprocally, leading to the internal filter effect [24]. Thus, when the fluorescence intensity attains its maximum, the increase in concentration leads to the emission of fluorescence exclusively at longer wavelengths. This illustrates the phenomena wherein the increase in concentration causes a decrease in fluorescence intensity and a redshift in the emission wavelength.
Figure 4c demonstrates the N-CQDs solution at a concentration of 0.25 mg/mL being excited at different wavelengths. With the shift in the excitation wavelength from 280 nm to 360 nm, the fluorescence peak progressively broadened and intensified accordingly. The peak’s shape displayed considerable asymmetry, being broader on the left and slenderer on the right. At the excitation wavelength of 380 nm, the fluorescence peak was seen at around 500 nm, where its intensity was maximized. As the excitation wavelength escalates from 380 to 440 nm, the fluorescence peak’s shape becomes progressively symmetrical, whereas its intensity starts to decline. The emission wavelength redshift from 500 to 600 nm. Quantum effects elucidate this phenomena; under conditions of quantum confinement, reduced diameters of nitrogen-doped carbon quantum dots (N-CQDs) correlate with broader band gaps, requiring shorter excitation wavelengths and yielding shorter emission wavelengths [40]. Figure 4c demonstrates that when the fluorescence peak attains its maximum, the emission energy of the major N-CQDs (4–6 nm) across all sizes is anticipated to be at its peak, with the emission wavelength primarily focused in the blue-green light spectrum. This elucidates the presence of a matching peak in fluorescence intensity at 510 nm.
Figure 4d distinctly illustrates the exceptionally bright green luminescence of the 0.25 mg/mL N-CQDs solution when subjected to ultraviolet (365–395 nm) light irradiation, whereas under visible light, the N-CQDs aqueous solution appears light yellow. The quantum yield (QY) of the N-CQDs was determined to be 3.65%. Furthermore, as depicted in Figure 4d, the chromaticity coordinate of this fluorescent solution is (0.2576, 0.3855). According to the CIE 1931 standard [41] chromaticity values, its chromaticity coordinate predominantly falls within the green light emission region [20].

3.4. Formation Mechanism of N-CQDs

The process of generating fluorescent carbon quantum dots can be divided into two stages in this study. Since cellulose and hemicellulose have lower thermal stability than lignin, most of the cellulose and hemicellulose and a small amount of lignin in poplar wood are first carbonized under high pressure and high temperature conditions, thus obtaining abundant bulk carbon materials. Then, NH3·H2O served as the nitrogen source, while H2O2 and ultraviolet light facilitated the treatment of the solid biological carbon. During the experiment, H2O2 and NH3·H2O are mixed together according to the volume ratio of 2:1, and H2O2 will accelerate the decomposition under alkaline conditions and gradually react violently with NH3·H2O to heat up. This promotes H2O2 to absorb the high energy of ultraviolet light under the light of UV-LED lamps (385~395 nm, 30 W), which causes the electrons inside its molecules to be excited to a high energy state, resulting in the break of the peroxygen bond (O-O bond) (NH3·H2O provides an alkaline environment, hydrogen peroxide plays the oxidation role, and diluted with water to balance the reaction strength) [42,43]. During this reaction, H2O2 decomposes to form intermediates including generate hydroxyl (HO·) and hydroperoxyl (HOO•) radicals, then to form oxygen and water [44,45]. The HO· radical exhibits strong oxidative properties that can effectively break down larger carbon sources into smaller fragments [46,47]. The FTIR and XPS data indicate that the HO· radical simultaneously cleaves both sp2 and sp3 hybridized carbons, resulting in the breakdown of certain C-C and C=C bonds into oxygen-containing functional groups. Furthermore, the HO· radical further disassembles the already formed small carbon particles, transforming them into even smaller CQDs, which leads to their contraction into diminutive CQDs. However, the self-assembly of these tiny particles into larger structures is facilitated by ammonia. The CQDs size can be controlled below 10 nm and concentrated in the range of 4–5 nm, which is the result of the simultaneous action of NH3·H2O and H2O2. The synthesized N-CQDs exhibit a significant presence of oxygen-containing functional groups and numerous defects, which facilitate electron transitions between bonding and antibonding energy levels. The characterization of FTIR and XPS showed the formation of –COOH and –NH2 groups on the surface of CQDs, where pyrrole nitrogen (-C-N-C) often existed in conjugated form in the graphite structure of CQDs during doping [33,48,49,50]. The content of nitrogen in lignin of poplar wood was 0.20 to 0.44%, which further confirmed the presence of nitrogen doping on the surface of CQDs [51,52,53,54]. This characteristic enables N-CQDs to emit green fluorescence signals under specific excitation wavelengths. Under the combined effects of ultraviolet light and ammonia, both components in the solution promote the decomposition of H2O2, leading to a rapid and substantial production of CQDs.
In the process of preparing CQDs, poplar wood with the same weight was selected as far as possible to carry out experiments under the same conditions. The serial number in Table 1 represents the sequence of experiments. After many experiments, the mass yield of CQDs obtained with 12 g poplar wood block was basically stable at about 42 wt%.
Table 2 describes a comparative analysis of the mass yield of CQDs obtained in this study with the mass yield of CQDs recorded in the existing literature. It is evident that among the various methods for synthesizing CQDs, the hydrothermal method usually exhibits a superior quality yield compared to other techniques, and the sources of precursor materials are also notably more diverse. Specifically, in the context of the hydrothermal approach, the mass yield of CQDs synthesized from pure compounds generally surpasses that derived from natural biomass mixtures; indeed, synthetic methodologies employing biomass mixtures generally produce yields below 40%. Only one study in the detection limit column was used to detect Fe (III). At present, CQDs prepared by various methods are mostly used in the field of fluorescence labeling. The detection limit of this study is within the same order of magnitude as those reported in other studies, but slightly higher. Regarding fluorescence performance in CQD synthesis, carbon quantum dots produced from biomass mixtures frequently exhibit multifunctionality due to self-doping effects, whereas pure compounds typically excel in terms of singular optical properties and quantum efficiency. Nevertheless, when considering environmental sustainability and cost-effectiveness, biomass mixtures align well with green chemistry principles [55,56]; notably, their abundance and economic viability significantly exceed those associated with pure compounds requiring specialized extraction processes [57,58]. To evaluate the mass yield of CQDs, as illustrated in Scheme 1a, two poplar blocks (about 12 g) were utilized as precursor materials and placed into a 100 mL Teflon-lined stainless-steel autoclave. Approximately 5.04 g of CQDs was acquired post-drying. After numerous tests conducted under identical conditions, the maximum mass production of CQDs was ultimately established at 42 wt%.

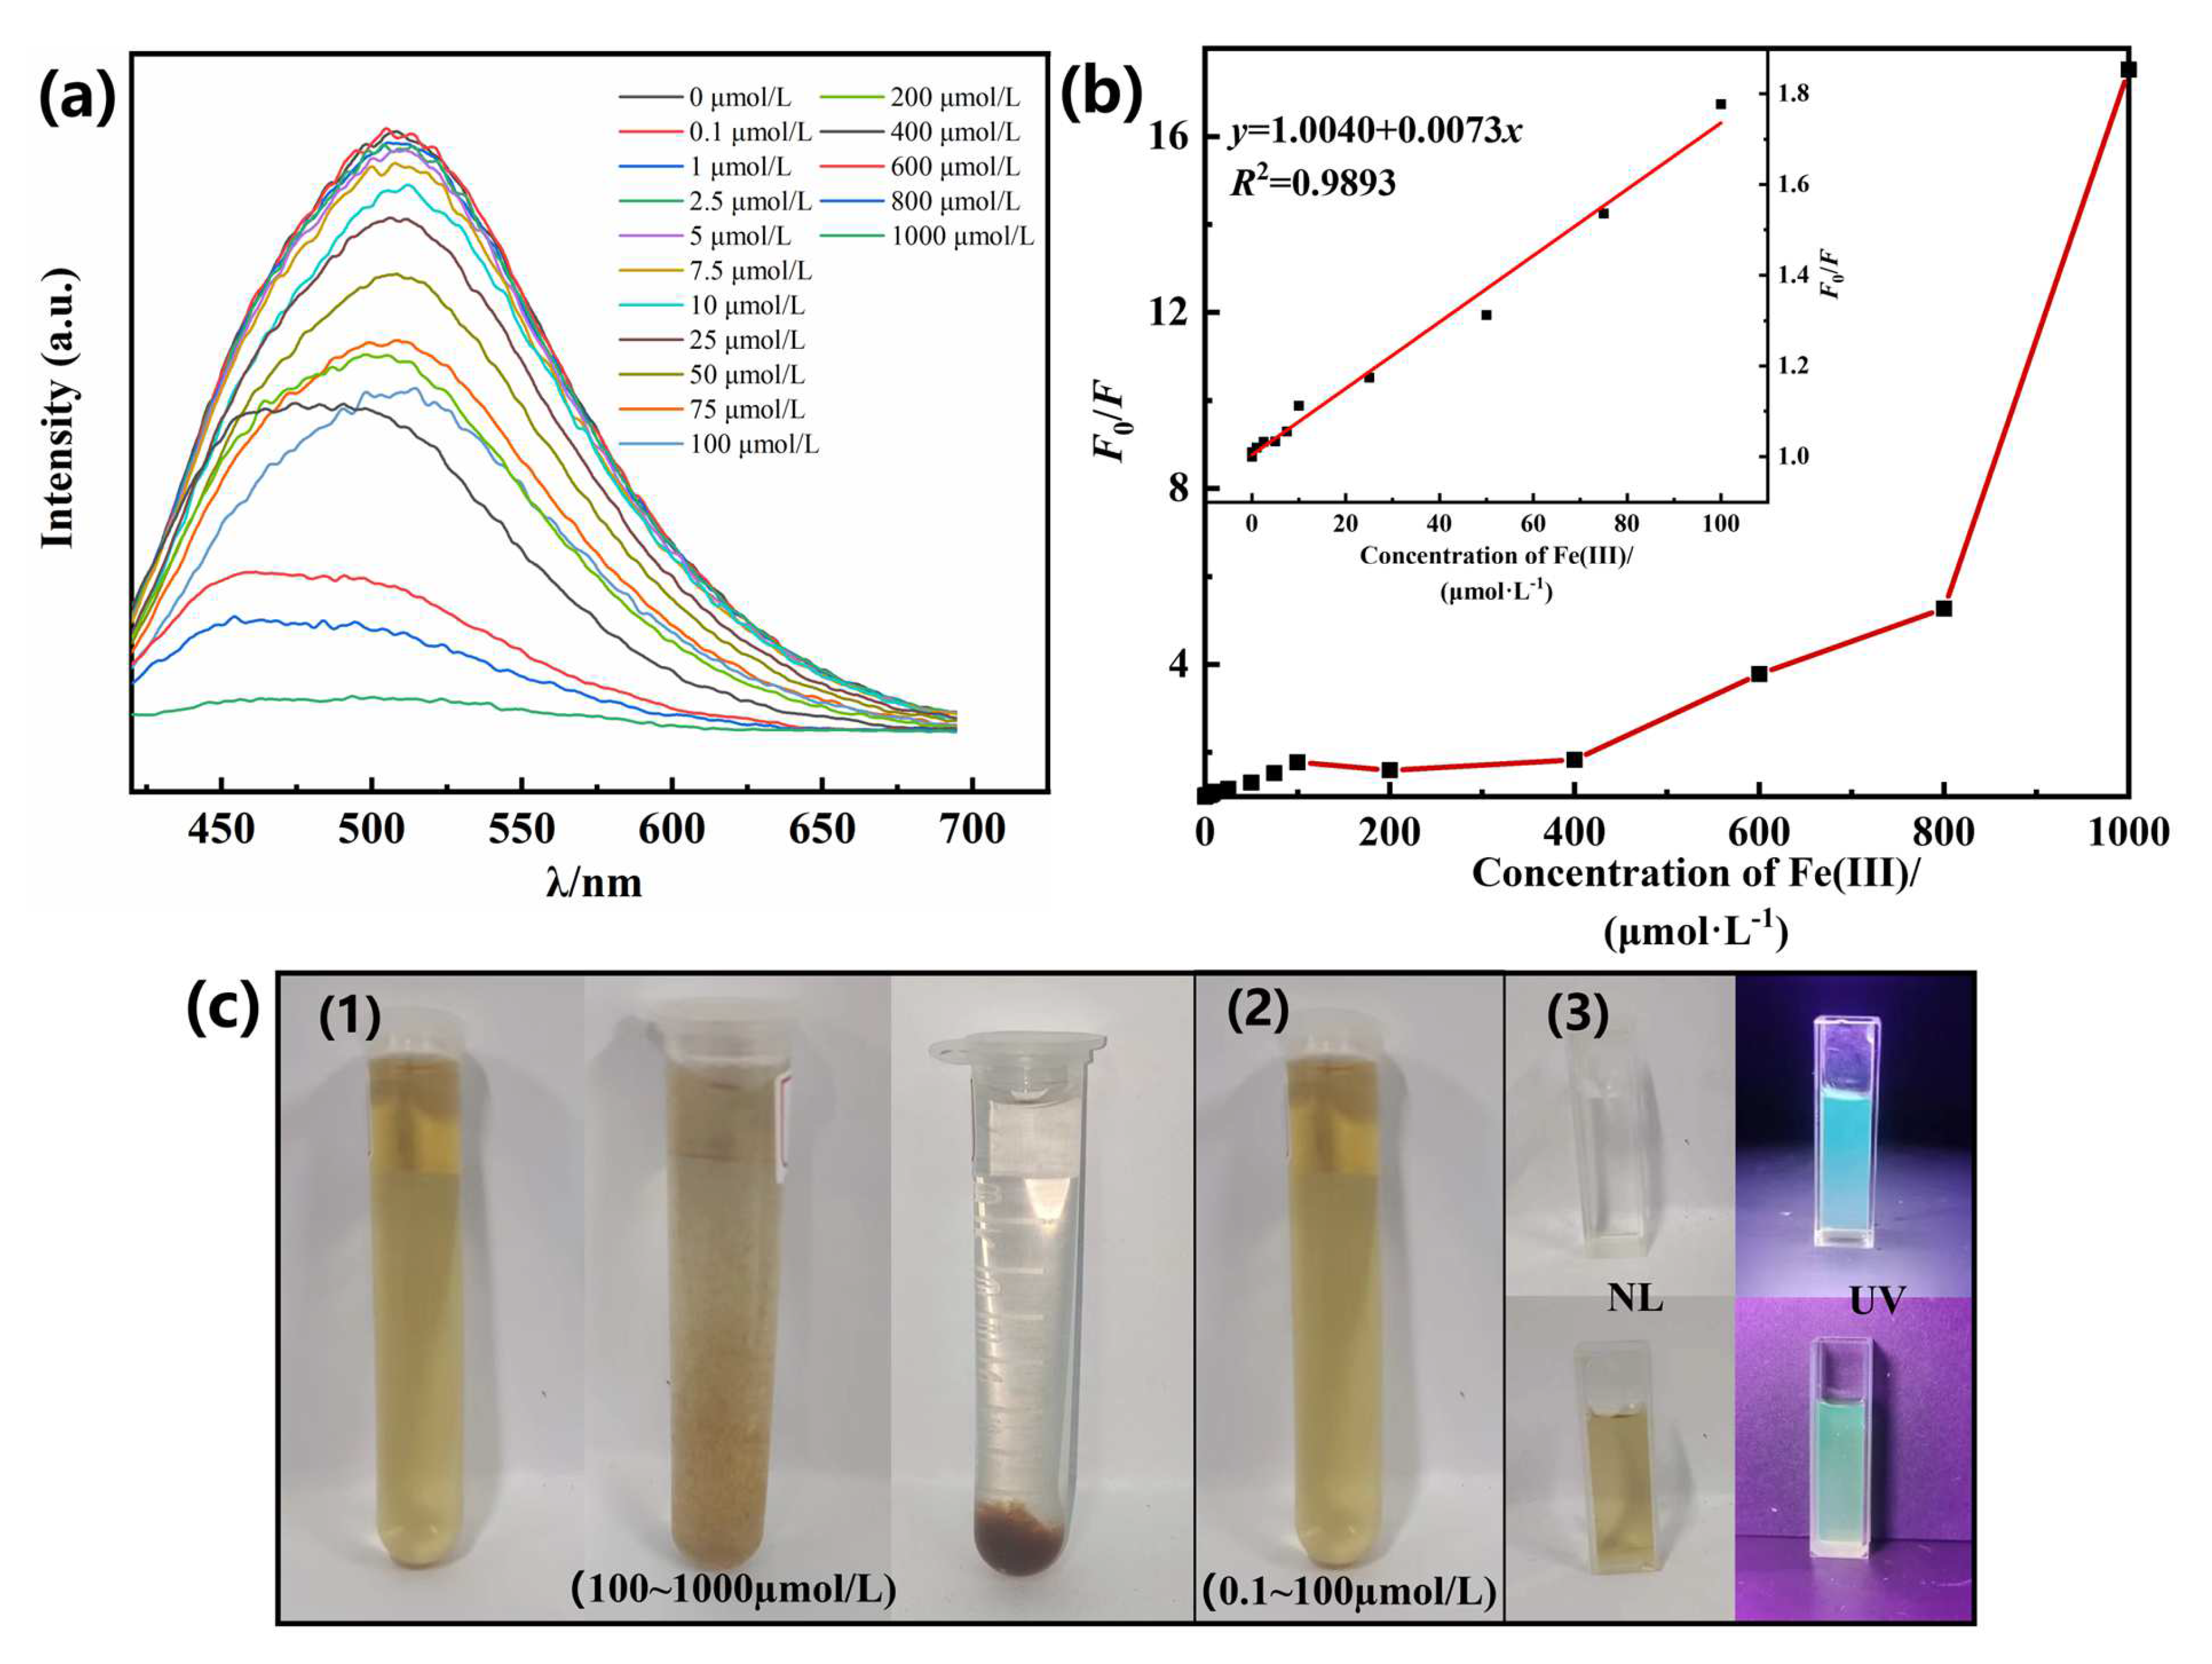
3.5. Detection of the Concentration of Fe (III) by N-CQDs

Figure 5a demonstrates that the fluorescence peak in the spectra of N-CQDs solutions reduces with increased concentrations of Fe (III). The fluorescence peak in the Fe (III) concentration range of 200 to 1000 μmol/L exhibits reduced peak intensities and shorter emission wavelengths compared to the range of 0.1 to 100 μmol/L, along with a weakened correlation between fluorescence intensity and Fe (III) concentration. The peak emission wavelength in the fluorescence spectra across the Fe (III) concentration range of 0.1 to 100 μmol/L remains mostly invariant, whereas the fluorescence intensity exhibits a notable correlation with the Fe (III) concentration. Figure 5b demonstrates that the ratio F0/F (with F0 represents the fluorescence peak value of a blank N-CQDs solution at a concentration of 0.25 mg/mL, and F represents the fluorescence peak values of N-CQDs solutions at varying Fe (III) concentrations) exhibits a strong linear correlation with Fe (III) concentrations ranging from 0.1 to 100 μmol/L. As shown in the inset of Figure 5b, the linear equation is expressed as y = 0. 0073x+1.0040, with the R2 value of 0.9893 (where y represents the ratio of F0 to F, x represents the concentration of Fe (III), and R2 represents the standard deviation of the linear equation). By combining Formula (2) with the detection limit calculation formula D = 3δ/k, the detection limit of Fe (III) is determined to be D = 4.1 μmol/L.
It can be observed from Figure 5c(1) that when Fe (III) concentration ranges from 200 to 1000 μmol/L, flocculation begins to appear in the originally suspension, and colorless transparent supernatant begins to appear in the solution after standing for 30 min. In Figure 5c(2), it can be observed that N-CQDs solution has no significant change when the concentration of iron ion ranges from 0.1 to 100mol/L. However, its green fluorescence under ultraviolet light is weaker than that of blank samples. As shown in Figure 5c(3)(UV), the fluorescence effects of some 200 to 1000mol/L samples are similar. When exposed to natural light and ultraviolet light (Figure 5c(3)), the colorless and transparent supernatant of the former displayed a distinct blue luminescence under ultraviolet light, whereas the latter continued to emit green light, with its fluorescence intensity being weaker than that of the blank sample shown in Figure 4d. In accordance with Scheme 1b, Fe (III) not only inhibits the fluorescence performance of N-CQDs but also induces aggregation among them. Based on the impact of N-CQDs size on fluorescence performance, it can be inferred that Fe (III) preferentially aggregates larger-sized N-CQDs. Conversely, solutions containing smaller-sized N-CQDs that remain unaggregated exhibit stronger blue fluorescence than those doped with a lower concentration of Fe (III).

4. Conclusions

In summary, this paper provides a method for producing nitrogen-doped carbon quantum dots with a high mass yield using ordinary poplar wood as the carbon source, coupled with diluted ammonia and hydrogen peroxide, under UV radiation in a mild manner. After ten experiments under the same conditions, the mass yield of CQDs prepared by this scheme ranges from 37 to 50.6 wt%, but mainly concentrates on about 42 wt%. The mass yield attained in this study exceeds that documented in the majority of previous research employing biomass mixes as carbon source materials. Characterization using TEM, FTIR, and XPS revealed that the N-CQDs had superior water solubility, the average particle size of 5.02 nm, and the presence of nitrogen elements on their surface. Fluorescence spectrometry and UV spectrophotometry tests demonstrated that the N-CQDs solution exhibited significant UV absorption and tunable fluorescence emission capabilities; both fluorescence intensity and wavelength were dependent on N-CQDs concentration and excitation wavelength. The fluorescence emission band of N-CQDs was predominantly located within green spectrum, with a quantum yield (QY) of 3.6%. In evaluating Fe (III) detection in water, N-CQDs exhibited a strong linear correlation over a Fe (III) concentration range of 0–100 μmol/L, attaining a detection limit of 4.1 μmol/L. This study’s technique effectively accomplished the hydrothermal synthesis of N-CQDs, distinguished by high mass yield, cheap cost, and simple operational procedures, offering novel perspectives for the large-scale production and modification of N-CQDs with abundant fluorescence characteristics.

Author Contributions

Funding acquisition, J.W.; Investigation, Y.H.; Methodology, P.M.; Project administration, J.W.; Supervision, J.W.; Validation, P.M.; Visualization, P.M.; Writing—original draft, P.M., Y.H. and J.W.; Writing—review and editing, P.M., Y.H. and J.W. All authors have read and agreed to the published version of the manuscript.

Funding

This work is financially supported by the Fundamental Research Funds for the Central Universities, grant number 2572023DJ03.

Institutional Review Board Statement

Not applicable.

Informed Consent Statement

Not applicable.

Data Availability Statement

The data presented in this study are available on request from the corresponding author. The data are not publicly available due to they are the part of an ongoing study.

Conflicts of Interest

Author Yu Han was employed by the company Northeast Forestry University Engineering Consulting Design and Research Institute Co., Ltd. But the remaining authors declare that the research was conducted in the absence of any commercial or financial relationships that could be construed as a potential conflict of interest.

Abbreviations

CQDsCarbon quantum dots
N-CQDsNitrogen-doped carbon quantum dots
UVUltraviolet
NLNatural light
QYQuantum yield
LODLimit of detection
PLPhotoluminescence
FLFluorescence
CIECoherent Infrared Energy

References

  1. Ramanan, V.; Thiyagarajan, S.K.; Raji, K.; Suresh, R.; Sekar, R.; Ramamurthy, P. Outright green synthesis of fluorescent carbon dots from eutrophic algal blooms for in vitro imaging. ACS Sustain. Chem. Eng. 2016, 4, 4724–4731. [Google Scholar] [CrossRef]
  2. Baker, S.N.; Baker, G.A. Luminescent carbon nanodots: Emergent nanolights. Angew. Chem. Int. Ed. 2010, 49, 6726–6744. [Google Scholar] [CrossRef] [PubMed]
  3. Lim, S.Y.; Shen, W.; Gao, Z. Carbon quantum dots and their applications. Chem. Soc. Rev. 2015, 44, 362–381. [Google Scholar] [CrossRef] [PubMed]
  4. Zhang, Y.; Shen, Y.; Teng, X.; Yan, M.; Bi, H.; Morais, P.C. Mitochondria-targeting nanoplatform with fluorescent carbon dots for long time imaging and magnetic field-enhanced cellular uptake. ACS Appl. Mater. Interfaces 2015, 7, 10201–10212. [Google Scholar] [CrossRef]
  5. Liu, J.; Bi, H.; Cesar Morais, P.; Zhang, X.; Zhang, F.; Hu, L. Room-temperature magnetism in carbon dots and enhanced ferromagnetism in carbon dots-polyaniline nanocomposite. Sci. Rep. 2017, 7, 2165. [Google Scholar] [CrossRef]
  6. Shi, J.; Ni, G.; Tu, J.; Jin, X.; Peng, J. Green synthesis of fluorescent carbon dots for sensitive detection of Fe2+ and hydrogen peroxide. J. Nanopart. Res. 2017, 19, 1–10. [Google Scholar] [CrossRef]
  7. Qiu, X.; Huang, J.; Wang, N.; Zhao, K.; Cui, J.; Hao, J. Facile synthesis of water-soluble rhodamine-based polymeric chemosensors via schiff base reaction for Fe3+ detection and living cell imaging. Front. Chem. 2022, 10, 845627. [Google Scholar] [CrossRef]
  8. Mohan, B.; Shanmughan, A.; Krishna, A.V.; Noushija, M.K.; Umadevi, D.; Shanmugaraju, S. Porous organic polymers-based fluorescent chemosensors for Fe (III) ions-a functional mimic of siderophores. Front. Chem. 2024, 12, 1361796. [Google Scholar] [CrossRef]
  9. Chen, J.; Shu, H.; Niu, P.; Chen, P.; Jiang, H. Highly sensitive detection of trace tetracycline in water using a metal-organic framework-enabled sensor. Adsorpt. Sci. Technol. 2021, 2021, 1462107. [Google Scholar] [CrossRef]
  10. Su, B.-L.; Moniotte, N.; Nivarlet, N.; Chen, L.-H.; Fu, Z.-Y.; Desmet, J.; Li, J. Fl–DFO molecules@ mesoporous silica materials: Highly sensitive and selective nanosensor for dosing with iron ions. J. Colloid Interface Sci. 2011, 358, 136–145. [Google Scholar] [CrossRef]
  11. Xu, C.; Hei, Y.; Liu, J.; Sun, M.; Sha, T.; Wang, N.; Hassan, M.; Bo, X.; Zhou, M. Synthesis of a three-dimensional interconnected carbon nanorod aerogel from wax gourd for amperometric sensing. Microchim. Acta 2018, 185, 1–12. [Google Scholar] [CrossRef]
  12. Shen, T.; Wang, Q.; Guo, Z.; Kuang, J.; Cao, W. Hydrothermal synthesis of carbon quantum dots using different precursors and their combination with TiO2 for enhanced photocatalytic activity. Ceram. Int. 2018, 44, 11828–11834. [Google Scholar] [CrossRef]
  13. Xie, Y.; Zheng, J.; Wang, Y.; Wang, J.; Yang, Y.; Liu, X.; Chen, Y. One-step hydrothermal synthesis of fluorescence carbon quantum dots with high product yield and quantum yield. Nanotechnology 2019, 30, 085406. [Google Scholar] [CrossRef] [PubMed]
  14. Wang, L.; Li, B.; Xu, F.; Shi, X.; Feng, D.; Wei, D.; Li, Y.; Feng, Y.; Wang, Y.; Jia, D. High-yield synthesis of strong photoluminescent N-doped carbon nanodots derived from hydrosoluble chitosan for mercury ion sensing via smartphone APP. Biosens. Bioelectron. 2016, 79, 1–8. [Google Scholar] [CrossRef]
  15. Abinaya, K.; Rajkishore, S.; Lakshmanan, A.; Anandham, R.; Dhananchezhiyan, P.; Praghadeesh, M. Synthesis and characterization of carbon dots from coconut shell by optimizing the hydrothermal carbonization process. J. Appl. Nat. Sci. 2021, 13, 1151–1157. [Google Scholar] [CrossRef]
  16. Atchudan, R.; Edison, T.N.J.I.; Shanmugam, M.; Perumal, S.; Somanathan, T.; Lee, Y.R. Sustainable synthesis of carbon quantum dots from banana peel waste using hydrothermal process for in vivo bioimaging. Phys. E Low-Dimens. Syst. Nanostruct. 2021, 126, 114417. [Google Scholar] [CrossRef]
  17. Mehta, V.N.; Jha, S.; Kailasa, S.K. One-pot green synthesis of carbon dots by using Saccharum officinarum juice for fluorescent imaging of bacteria (Escherichia coli) and yeast (Saccharomyces cerevisiae) cells. Mater. Sci. Eng. 2014, 38, 20–27. [Google Scholar] [CrossRef]
  18. Farid, M.A.A.; Lease, J.; Yoshito, A. Lignocellulosic biomass-derived carbon quantum dots (CQDs): A novel approach utilizing organosolv lignin from Moso bamboo waste. J. Clean. Prod. 2024, 467, 142852. [Google Scholar] [CrossRef]
  19. Liu, Z.; Chen, M.; Guo, Y.; Zhou, J.; Shi, Q.; Sun, R. Oxidized nanocellulose facilitates preparing photoluminescent nitrogen-doped fluorescent carbon dots for Fe3+ ions detection and bioimaging. Chem. Eng. J. 2020, 384, 123260. [Google Scholar] [CrossRef]
  20. Jing, S.; Zhao, Y.; Sun, R.-C.; Zhong, L.; Peng, X. Facile and high-yield synthesis of carbon quantum dots from biomass-derived carbons at mild condition. ACS Sustain. Chem. Eng. 2019, 7, 7833–7843. [Google Scholar] [CrossRef]
  21. Qin, J.L.; Li, S.J.; Yuan, N.N.; Chen, Y.; Lei, B.F.; Hu, C.F.; Liu, Y.L. Rapid hydrothermal method for the preparation of carbon quantum dots in the presence of hydrogen peroxide. Micro Nano Lett. 2020, 15, 465–468. [Google Scholar] [CrossRef]
  22. Liu, G.; Li, B.; Liu, Y.; Feng, Y.; Jia, D.; Zhou, Y. Rapid and high yield synthesis of carbon dots with chelating ability derived from acrylamide/chitosan for selective detection of ferrous ions. Appl. Surf. Sci. 2019, 487, 1167–1175. [Google Scholar] [CrossRef]
  23. Chellasamy, G.; Arumugasamy, S.K.; Govindaraju, S.; Yun, K. Green synthesized carbon quantum dots from maple tree leaves for biosensing of Cesium and electrocatalytic oxidation of glycerol. Chemosphere 2022, 287, 131915. [Google Scholar] [CrossRef] [PubMed]
  24. Sun, S.; Guo, S.; Qin, Q.; Liao, Y.; Li, M.; Du, F. Box–Behnken Design Optimizing Sugarcane Bagasse-Based Nitrogen-Doped Carbon Quantum Dots Preparation and Application in Ferric Ion Detection. Chemosensors 2022, 10, 453. [Google Scholar] [CrossRef]
  25. Aragón, F.; Coaquira, J.; Villegas-Lelovsky, L.; Da Silva, S.; Cesar, D.; Nagamine, L.; Cohen, R.; Menéndez-Proupin, E.; Morais, P. Evolution of the doping regimes in the Al-doped SnO2 nanoparticles prepared by a polymer precursor method. J. Phys. Condens. Matter 2015, 27, 095301. [Google Scholar] [CrossRef]
  26. Fu, M.; Ehrat, F.; Wang, Y.; Milowska, K.Z.; Reckmeier, C.; Rogach, A.L.; Stolarczyk, J.K.; Urban, A.S.; Feldmann, J. Carbon dots: A unique fluorescent cocktail of polycyclic aromatic hydrocarbons. Nano Lett. 2015, 15, 6030–6035. [Google Scholar] [CrossRef]
  27. Gan, J.; Wu, Y.; Yang, F.; Zhang, H.; Wu, X.; Wang, Y.; Xu, R. Wood-cellulose photoluminescence material based on carbon quantum dot for light conversion. Carbohydr. Polym. 2022, 290, 119429. [Google Scholar] [CrossRef]
  28. Tohamy, H.-A.S.; El-Sakhawy, M.; Kamel, S. Microwave-assisted synthesis of amphoteric fluorescence carbon quantum dots and their chromium adsorption from aqueous solution. Sci. Rep. 2023, 13, 11306. [Google Scholar] [CrossRef]
  29. Peng, J.; Gao, W.; Gupta, B.K.; Liu, Z.; Romero-Aburto, R.; Ge, L.; Song, L.; Alemany, L.B.; Zhan, X.; Gao, G. Graphene quantum dots derived from carbon fibers. Nano Lett. 2012, 12, 844–849. [Google Scholar] [CrossRef]
  30. Shi, Y.; Liu, X.; Wang, M.; Huang, J.; Jiang, X.; Pang, J.; Xu, F.; Zhang, X. Synthesis of N-doped carbon quantum dots from bio-waste lignin for selective irons detection and cellular imaging. Int. J. Biol. Macromol. 2019, 128, 537–545. [Google Scholar] [CrossRef]
  31. Zeng, X.; Meng, S.; Liu, J.; Chen, N. Tribological and Grinding Properties of Spherical Diamond Grown on a Rough Discontinuous Surface. Coatings 2023, 13, 1735. [Google Scholar] [CrossRef]
  32. Zhao, S.; Song, X.; Chai, X.; Zhao, P.; He, H.; Liu, Z. Green production of fluorescent carbon quantum dots based on pine wood and its application in the detection of Fe3+. J. Clean. Prod. 2020, 263, 121561. [Google Scholar] [CrossRef]
  33. Dini, Z.; Afsharpour, M.; Tabar-Heydar, K. UV-assisted functionalization of carbon nanotube for synthesis of efficient desulfurization catalysts (NH2/COOH)-MWNT/MoO3. Diam. Relat. Mater. 2019, 91, 237–246. [Google Scholar] [CrossRef]
  34. Chen, T.-H.; Zhang, S.; Jaishi, M.; Adhikari, R.; Bi, J.; Fang, M.; Xia, S.; Zhang, Y.; Luck, R.L.; Pati, R. New near-infrared fluorescent probes with single-photon anti-stokes-shift fluorescence for sensitive determination of pH variances in lysosomes with a double-checked capability. ACS Appl. Bio Mater. 2018, 1, 549–560. [Google Scholar] [CrossRef]
  35. Pournaki, M.; Fallah, A.; Gülcan, H.O.; Gazi, M. A novel chitosan based fluorescence chemosensor for selective detection of Fe (III) ion in acetic aqueous medium. Mater. Technol. 2021, 36, 91–96. [Google Scholar] [CrossRef]
  36. Xing, Y.; Wang, Y.; Li, H. Synthesis of carbon quantum dots based on quinoa straw and their application in alkali metal ions detection. BioResources 2024, 19, 3319. [Google Scholar] [CrossRef]
  37. Deng, Y.; Chen, M.; Chen, G.; Zou, W.; Zhao, Y.; Zhang, H.; Zhao, Q. Visible–ultraviolet upconversion carbon quantum dots for enhancement of the photocatalytic activity of titanium dioxide. ACS Omega 2021, 6, 4247–4254. [Google Scholar] [CrossRef]
  38. Zhao, X.; Wang, H.; Liu, Q.; Chen, X. Nitrogen, sulfur-doped carbon quantum dots with large Stokes shift for real-time monitoring of pH in living cells. Talanta 2024, 269, 125479. [Google Scholar] [CrossRef]
  39. Ali, M.; Anjum, A.S.; Riaz, R.; Bibi, A.; Sun, K.C.; Jeong, S.H. Unraveling the surface states related Stokes shift dependent electrocatalytic activity of N-doped carbon quantum dots for photovoltaic applications. Carbon 2021, 181, 155–168. [Google Scholar] [CrossRef]
  40. Hao, Y.; Gan, Z.; Xu, J.; Wu, X.; Chu, P.K. Poly (ethylene glycol)/carbon quantum dot composite solid films exhibiting intense and tunable blue–red emission. Appl. Surf. Sci. 2014, 311, 490–497. [Google Scholar] [CrossRef]
  41. CIE (Commission Internationale de l'Eclairage); CIE 1931 Standard Book Information; Commission Internationale de l 'Eclairage Proceedings; Cambridge University Press: Cambridge, UK, 1931. [Google Scholar]
  42. Jenzer, H.; Sadeghi-Reeves, L. Nutrigenomics-associated impacts of nutrients on genes and Enzymes with special consideration of Aromatase. Front. Nutr. 2020, 7, 37. [Google Scholar] [CrossRef] [PubMed]
  43. Zhao, C.; Qiao, X.; Shao, Q.; Hassan, M.; Ma, Z.; Yao, L. Synergistic effect of hydrogen peroxide and ammonia on lignin. Ind. Crops Prod. 2020, 146, 112177. [Google Scholar] [CrossRef]
  44. Jahani, R.; Dhib, R.; Mehrvar, M. Photochemical degradation of aqueous artificial sweeteners by UV/H2O2 and their biodegradability studies. J. Chem. Technol. Biotechnol. 2020, 95, 2509–2521. [Google Scholar] [CrossRef]
  45. Gould, J.M. Studies on the mechanism of alkaline peroxide delignification of agricultural residues. Biotechnol. Bioeng. 1985, 27, 225–231. [Google Scholar] [CrossRef]
  46. Lu, Q.; Wu, C.; Liu, D.; Wang, H.; Su, W.; Li, H.; Zhang, Y.; Yao, S. A facile and simple method for synthesis of graphene oxide quantum dots from black carbon. Green Chem. 2017, 19, 900–904. [Google Scholar] [CrossRef]
  47. Halder, A.; Godoy-Gallardo, M.; Ashley, J.; Feng, X.; Zhou, T.; Hosta-Rigau, L.; Sun, Y. One-pot green synthesis of biocompatible graphene quantum dots and their cell uptake studies. ACS Appl. Bio Mater. 2018, 1, 452–461. [Google Scholar] [CrossRef]
  48. Abu, N.; Chinnathambi, S.; Kumar, M.; Etezadi, F.; Bakhori, N.M.; Zubir, Z.A.; Salleh, S.N.M.; Shueb, R.H.; Karthikeyan, S.; Thangavel, V. Development of biomass waste-based carbon quantum dots and their potential application as non-toxic bioimaging agents. RSC Adv. 2023, 13, 28230–28249. [Google Scholar] [CrossRef]
  49. Nguyen, K.G.; Huš, M.; Baragau, I.A.; Bowen, J.; Heil, T.; Nicolaev, A.; Abramiuc, L.E.; Sapelkin, A.; Sajjad, M.T.; Kellici, S. Engineering Nitrogen-Doped Carbon Quantum Dots: Tailoring Optical and Chemical Properties through Selection of Nitrogen Precursors. Small 2024, 20, 2310587. [Google Scholar] [CrossRef]
  50. Raju, K.S.; Das, G.S.; Tripathi, K.M. Nitrogen-doped carbon quantum dots from biomass as a FRET-based sensing platform for the selective detection of H2O2 and aspartic acid. RSC Sustain. 2024, 2, 223–232. [Google Scholar] [CrossRef]
  51. Bouxin, F.P.; Jackson, S.D.; Jarvis, M.C. Isolation of high quality lignin as a by-product from ammonia percolation pretreatment of poplar wood. Bioresour. Technol. 2014, 162, 236–242. [Google Scholar] [CrossRef]
  52. Gonçalves, A.C.; Malico, I.; Sousa, A.M. Solid biomass from forest trees to energy: A review. In Renewable Resources and Biorefineries; IntechOpen: London, UK, 2018; Volume 2013, pp. 1–25. [Google Scholar] [CrossRef]
  53. Euring, D.; Bai, H.; Janz, D.; Polle, A. Nitrogen-driven stem elongation in poplar is linked with wood modification and gene clusters for stress, photosynthesis and cell wall formation. BMC Plant Biol. 2014, 14, 391. [Google Scholar] [CrossRef] [PubMed]
  54. Paris, E.; Carnevale, M.; Vincenti, B.; Palma, A.; Guerriero, E.; Borello, D.; Gallucci, F. Evaluation of VOCs emitted from biomass combustion in a small CHP plant: Difference between dry and wet poplar woodchips. Molecules 2022, 27, 955. [Google Scholar] [CrossRef] [PubMed]
  55. Man, H.; Chaima, M.; Wang, X.; Xiu, L.; Yang, L.; Huang, J. Fluorescent detection of organophosphorus pesticides using carbon dots derived from broccoli. Arab. J. Sci. Eng. 2023, 48, 8315–8324. [Google Scholar] [CrossRef]
  56. Zhang, H.; Zhou, Q.; Han, X.; Li, M.; Yuan, J.; Wei, R.; Zhang, X.; Wu, M.; Zhao, W. Nitrogen-doped carbon dots derived from hawthorn for the rapid determination of chlortetracycline in pork samples. Spectrochim. Acta Part A Mol. Biomol. Spectrosc. 2021, 255, 119736. [Google Scholar] [CrossRef]
  57. Nandihalli, N. Microwave-driven synthesis and modification of nanocarbons and hybrids in liquid and solid phases. J. Energy Storage 2025, 111, 115315. [Google Scholar] [CrossRef]
  58. Ganesan, S.; Kalimuthu, R.; Kanagaraj, T.; Kulandaivelu, R.; Nagappan, R.; Pragasan, L.A.; Ponnusamy, V.K. Microwave-assisted green synthesis of multi-functional carbon quantum dots as efficient fluorescence sensor for ultra-trace level monitoring of ammonia in environmental water. Environ. Res. 2022, 206, 112589. [Google Scholar] [CrossRef]
  59. Zheng, J.; Xie, Y.; Wei, Y.; Yang, Y.; Liu, X.; Chen, Y.; Xu, B. An efficient synthesis and photoelectric properties of green carbon quantum dots with high fluorescent quantum yield. Nanomaterials 2020, 10, 82. [Google Scholar] [CrossRef]
  60. Choi, Y.; Jo, S.; Chae, A.; Kim, Y.K.; Park, J.E.; Lim, D.; Park, S.Y.; In, I. Simple microwave-assisted synthesis of amphiphilic carbon quantum dots from A3/B2 polyamidation monomer set. ACS Appl. Mater. Interfaces 2017, 9, 27883–27893. [Google Scholar] [CrossRef]
  61. Zhu, L.; Shen, D.; Liu, Q.; Luo, K.H.; Li, C. Mild acidolysis-assisted hydrothermal carbonization of lignin for simultaneous preparation of green and blue fluorescent carbon quantum dots. ACS Sustain. Chem. Eng. 2022, 10, 9888–9898. [Google Scholar] [CrossRef]
  62. Martindale, B.C.; Hutton, G.A.; Caputo, C.A.; Reisner, E. Solar hydrogen production using carbon quantum dots and a molecular nickel catalyst. J. Am. Chem. Soc. 2015, 137, 6018–6025. [Google Scholar] [CrossRef]
  63. Zhao, Y.; Jing, S.; Peng, X.; Chen, Z.; Hu, Y.; Zhuo, H.; Sun, R.; Zhong, L. Synthesizing green carbon dots with exceptionally high yield from biomass hydrothermal carbon. Cellulose 2020, 27, 415–428. [Google Scholar] [CrossRef]
  64. Cui, Y.; Hu, Z.; Zhang, C.; Liu, X. Simultaneously enhancing up-conversion fluorescence and red-shifting down-conversion luminescence of carbon dots by a simple hydrothermal process. J. Mater. Chem. B 2014, 2, 6947–6952. [Google Scholar] [CrossRef]
  65. Yang, H.; Liu, Y.; Li, J.; Wang, C.; Li, Y. Full-wood photoluminescent and photothermic materials for thermal energy storage. Chem. Eng. J. 2021, 403, 126406. [Google Scholar] [CrossRef]
  66. Park, S.Y.; Lee, H.U.; Park, E.S.; Lee, S.C.; Lee, J.-W.; Jeong, S.W.; Kim, C.H.; Lee, Y.-C.; Huh, Y.S.; Lee, J. Photoluminescent green carbon nanodots from food-waste-derived sources: Large-scale synthesis, properties, and biomedical applications. ACS Appl. Mater. Interfaces 2014, 6, 3365–3370. [Google Scholar] [CrossRef] [PubMed]
Scheme 1. (a) Preparation process of N-CQDs; (b) reaction mechanism diagram illustrating the interaction between N-CQDs and Fe3+ in aqueous solution.
Applsci 15 01958 sch001
Figure 1. (a) TEM image of N-CQDs; (b) particle size distribution; (c) high-resolution transmission electron microscopy (HRTEM) image of N-CQDs; (d) XRD pattern of N-CQDs.
Applsci 15 01958 g001
Figure 2. The FTIR spectrum of the N-CQDs.
Applsci 15 01958 g002
Figure 3. (a) The complete XPS spectrum of N-CQDs, high-resolution XPS spectra for (b) C1s, (c) N1s, and (d) O1s of N-CQDs.
Applsci 15 01958 g003
Figure 4. (a) Absorption spectrum of N-CQDs and the excitation and emission spectra of a 1 mg/mL N-CQDs solution; (b) emission spectra of N-CQDs solutions at varying concentrations under 440 nm light excitation; (c) emission spectra of a 0.25 mg/mL N-CQDs solution excited at different wavelengths; (d) CIE 1931 chromaticity diagram for a 0.25 mg/mL N-CQDs solution (NL and UV denote N-CQDs solutions under natural light and ultraviolet light irradiation, respectively).
Applsci 15 01958 g004
Figure 5. (a) Fluorescence spectra of N-CQDs solutions with varying concentrations of Fe (III); (b) the relationship curve depicting the ratio F0/F against Fe (III) concentration, with the inset illustrating the linear fitting graph for Fe (III) concentrations ranging from 0 to 100 μmol/L; (c) fluorescence visualization of N-CQDs solutions at different Fe (III) concentrations under both natural and ultraviolet light.
Applsci 15 01958 g005
Table 1. The results of 10 repeated experiments under the same experimental conditions.
Serial Number 1 2 3 4 5 6 7 8 9 10
Mass Yield/% 37.4 40.2 43 50.6 39 41.8 43 42 42.8 42
Table 2. The summary of carbon sources, preparation methods and mass yield of CQDs.
Serial NumberPrecursorSynthesis MethodMass Yield/%LOD/μmol/LReference
1 2,7-dihydroxynaphthalene One-step hydrothermal 70.9none[59]
2Citric acid and 4,7,10-trioxa-1,13-tridecanediamineMicrowave assisted66.4none[60]
3LigninAcid pretreatment/hydrothermal synthesis45.8none[61]
4Citric acidStraightforward thermolysis45none[62]
5GlucoseHydrothermal44.31.3–106.7[20]
6Lignin, celluloseSolvothermal carbonization42.50.085[63]
7Ammonium citrateHydrothermal34none[64]
8Poplar leafHydrothermal 30none[65]
9CelluloseHydrothermal16.11.14 (Fe3+)[19]
10Durian pulpHydrothermal6.83.5[11]
11Food waste, ethanolHydrothermal0.12none[66]
12Poplar woodHydrothermal424.1 (Fe3+)This paper
Disclaimer/Publisher’s Note: The statements, opinions and data contained in all publications are solely those of the individual author(s) and contributor(s) and not of MDPI and/or the editor(s). MDPI and/or the editor(s) disclaim responsibility for any injury to people or property resulting from any ideas, methods, instructions or products referred to in the content.

