1. Introduction
Today, diverse methods exist for analyzing and publishing data among academic domains. Usually, values are categorized by classes (groups) or are transformed into intervals (discretized) to be understood by people (e.g., dogs are part of the animal class). However, some objects do not have precisely defined membership criteria in the real world (e.g., come home soon). To deal with these cases, Lotfi A. Zadeh addressed the uncertainty between objects and science in 1965 [
1], when a new theory, called fuzzy logic and approximate reasoning, originated, which has been used to address uncertainty through mathematical functions.
Approximate reasoning and fuzzy logic have been probed in multiple knowledge domains, such as chemical science, the healthcare industry, agriculture, political science, operations research, households, and, of course, environmental sciences [
2]. They generate well-accepted, traceable, and robust solutions to complex problems using human logic with low computing costs. Fuzzy logic itself is not fuzzy. It is focused on dealing with the fuzziness in data. To achieve this, a fuzzy controller has three core tasks: the fuzzification methods, the inference mechanism (a base of rules), and the defuzzification methods.
For the fuzzification task, it is known that a membership function characterizes fuzziness. Therefore, this leads to representing Membership Functions (MF)s as the degree of truth in fuzzy logic. MFs are used to convert the supplied crisp sets into the fuzzy inference system, allowing the MFs to describe the fuzziness in the data. Graphical forms can represent many MFs. In the context of the work of [
3], who also evaluated MFs for their study field, it is possible to list the following forms of MFs: triangular, trapezoidal, Gaussian, two-sided Gaussian, bell-shaped, sigmoid-right, sigmoid-left, difference-sigmoid, polynomial-Z, polynomial-S, and polynomial-pi. However, according to a review of real-world applications by [
4], the first four MFs are used in production environments.
Concerning the inference mechanism, three main approaches are present in the literature: (a) Zadeh–Mamdani’s fuzzy inference, developed using a set of linguistic variables, where the fuzzy rules in such a control system are obtained from experienced human operators; (b) the Takagi–Sugeno fuzzy method, where the antecedent of the rule is in fuzzy form, but the consequent of the rule is represented by a function
; if
is constant, then the inference system is zero order, which is a particular case of the Mamdani fuzzy model, making this the best option for mathematical analysis; and (c) the Tsukamoto fuzzy inference, where a fuzzy set with a monotonic MF represents the rule. This system is not commonly used because it is less transparent than the Mamdani fuzzy model [
5].
In a subsequent scenario, an output generated by the inference system is classified as a fuzzy set; consequently, it necessitates the conversion into a crisp value. The defuzzification process is implemented in this context, wherein a mathematical function facilitates this conversion. The established methods include the centroid, bisector, Largest Of Maximum (LOM), Smallest Of Maximum (SOM), and Middle Of Maximum (MOM) [
6]. These three fundamental tasks enable the development of diverse fuzzy systems for prediction, optimization, estimation, control, selection, and monitoring [
4]. Nevertheless, it is imperative to ascertain the appropriate method for each task to achieve a high-quality system, irrespective of its intended purpose, as required from a standard perspective.
Empirical evaluations of MFs to identify the most effective estimator predicated on fuzzy logic and approximate reasoning have been conducted in various domains, including controlled induction motor drives [
3], electronic controller performance [
7], and power systems [
8]. Nonetheless, a comprehensive assessment of the relationship between MFs and defuzzification methodologies is lacking. The membership functions are grounded in metrics such as the standard deviation, static values, or bell function parameters; hence, these characteristics can significantly influence the accuracy of a fuzzy system owing to their intrinsic properties [
9]. In this context, the present paper appraises the functions of a standard Air Quality Fuzzy System (AQFS) to identify the optimal combination that enhances the accuracy and capitalizes on the benefits of a fuzzy system. This evaluative approach and its findings may serve as a reference in the design of fuzzy systems.
This paper is structured as follows:
Section 2 discusses notable works associated with fuzzification and the identification of membership functions.
Section 3 presents the methodology and its application in elucidating an appropriate membership function concerning air pollution.
Section 4 elaborates on the discourse surrounding the methodology, including its limitations. Finally,
Section 5 articulates the conclusions drawn from the analysis.
2. Related Work
Zadeh published theorems related to fuzzy algorithms [
10]. These theorems emphasize the significance of fuzzy problems instead of those involving uncertain data, including information processing, artificial intelligence, or decision-making processes. These concepts are called fuzzy algorithms, where fuzzification is the foundational method for converting conventional (non-fuzzy) data into fuzzy statements that encompass fuzzy sets. Following this, fuzzification is continually refined and examined due to its ability to transform a precise quantity into a fuzzy representation [
11], with the fuzzification process most accurately described by a membership function that indicates the degree of truth within fuzzy logic [
12]. Graphical representations, such as membership functions, serve to illustrate fuzzy sets. An extensive literature review of fuzzy logic modeling identifies five principal types of membership functions frequently employed in industrial applications: triangular, trapezoidal, Gaussian, bell-shaped, and polynomial [
4].
Evaluating and selecting an appropriate MF is critical to the modeling phase of an inference system. Numerous contributions have emerged within this framework to recommend MFs tailored to specific challenges in fuzzy logic controllers. Ali et al. [
7] present a study grounded in simulations regarding the fuzzy control of antenna azimuth positioning, where three membership functions—triangular, trapezoidal, and Gaussian—were assessed. The input and output variables of the Universe of Discourse (UoD) included the error (in degrees), the change in the error (in degrees), and the control action (in volts). This research effectively illustrated the impact of MFs on the problem at hand, revealing that the triangular MF exhibited superior performance concerning steady-state behavior. Conversely, the Gaussian MF performed inadequately, demonstrating that it is more suitable for systems dealing with probabilities and statistics.
Similarly, it is feasible to examine other studies that have assessed MFs, including an evaluation of MFs in the context of induction motor drives, where five MFs were analyzed, one of which was the sigmoidal function. The findings indicate that the triangular MF yielded the most favorable performance. Nonetheless, the trapezoidal approach also demonstrated commendable results, facilitating the implementation of this category of control systems [
3]. The portfolio optimization problem is characterized as a selection process whereby the investor determines the appropriate proportion of securities and other assets. Four MFs were scrutinized, and the numerical simulation indicated that the triangular MF adequately addressed the problem. However, uncertain measures exhibit greater resilience to alterations in shape, underscoring the need for thorough analysis of the number of triangles involved [
13].
Furthermore, Prajapati and Fernandez [
14] conducted a comparative evaluation of the MFs used to analyze the output performance of a solar photovoltaic array panel. The Mean Square of the Errors (MSE) was employed to correct the trends and assess the effectiveness of each method. The findings indicated that the triangular MF yielded the most favorable results, closely followed by the trapezoidal MF, while the Gaussian MF produced the least favorable outcomes. A similar comparison was conducted concerning the construction of a fuzzy logic controller to optimize the Maximum Power Point Tracking (MPPT) of solar photovoltaics. The results of various MFs were evaluated to facilitate a comparison and select the optimal one. The triangular, trapezoidal, Gaussian, and GBell functions were considered using analogous data. According to the results, applying trapezoidal and GBell functions surpassed the triangular and Gaussian methods. Although these two methods exhibited identical results at lower frequencies (5 and 10 kHz), when the frequency of change was increased to 20 kHz, the GBell method demonstrated superior outcomes compared to the trapezoidal method [
15].
An additional evaluation of various MFs was conducted to facilitate a simulation of inflation growth utilizing an Adaptive Neuro-Fuzzy Inference System (ANFIS). This network structure employs a modified set of parameters to ascertain the overall input–output behavior. Tests were performed to identify the most suitable MF, which included triangular, trapezoidal, and Gbell MFs. Among the three techniques evaluated, only the Gbell function did not yield a convergent graph, whereas the most favorable error rate was achieved with a triangular MF [
16].
Conversely, in contrast to the knowledge of the modeler, certain studies employ computational methods for selecting MFs in fuzzy logic. Genetic algorithms, founded on genetic rules and natural selection principles, are utilized across various applications, including modifying MF shapes. This methodology can identify the optimal solution; while triangular MFs are commonly employed, it remains suitable for MFs defined by a mathematical model [
17]. Another recognized technique for identifying MFs is the tabu search algorithm, which is regarded as an intelligent optimization strategy to navigate local minima. Simulation results demonstrate the efficacy of this approach. Nevertheless, the performance can be influenced by the calibration of the control parameters, including the type of move, algorithmic conditions, initial solutions, and stopping criteria [
18].
The evaluation methodologies delineated herein seek to enhance the quality of their respective tasks, including forecasting and, in certain instances, data description pertaining to fuzzy clustering [
19]. However, the fundamental architecture remains unaltered; therefore, it is pertinent to assess the core functions. This assessment may be accomplished by testing the outputs of a system while systematically varying the core functions. The literature review in this section substantiates the notion that multiple factors continue to underlie the enhancement of fuzzy systems.
3. Methodology
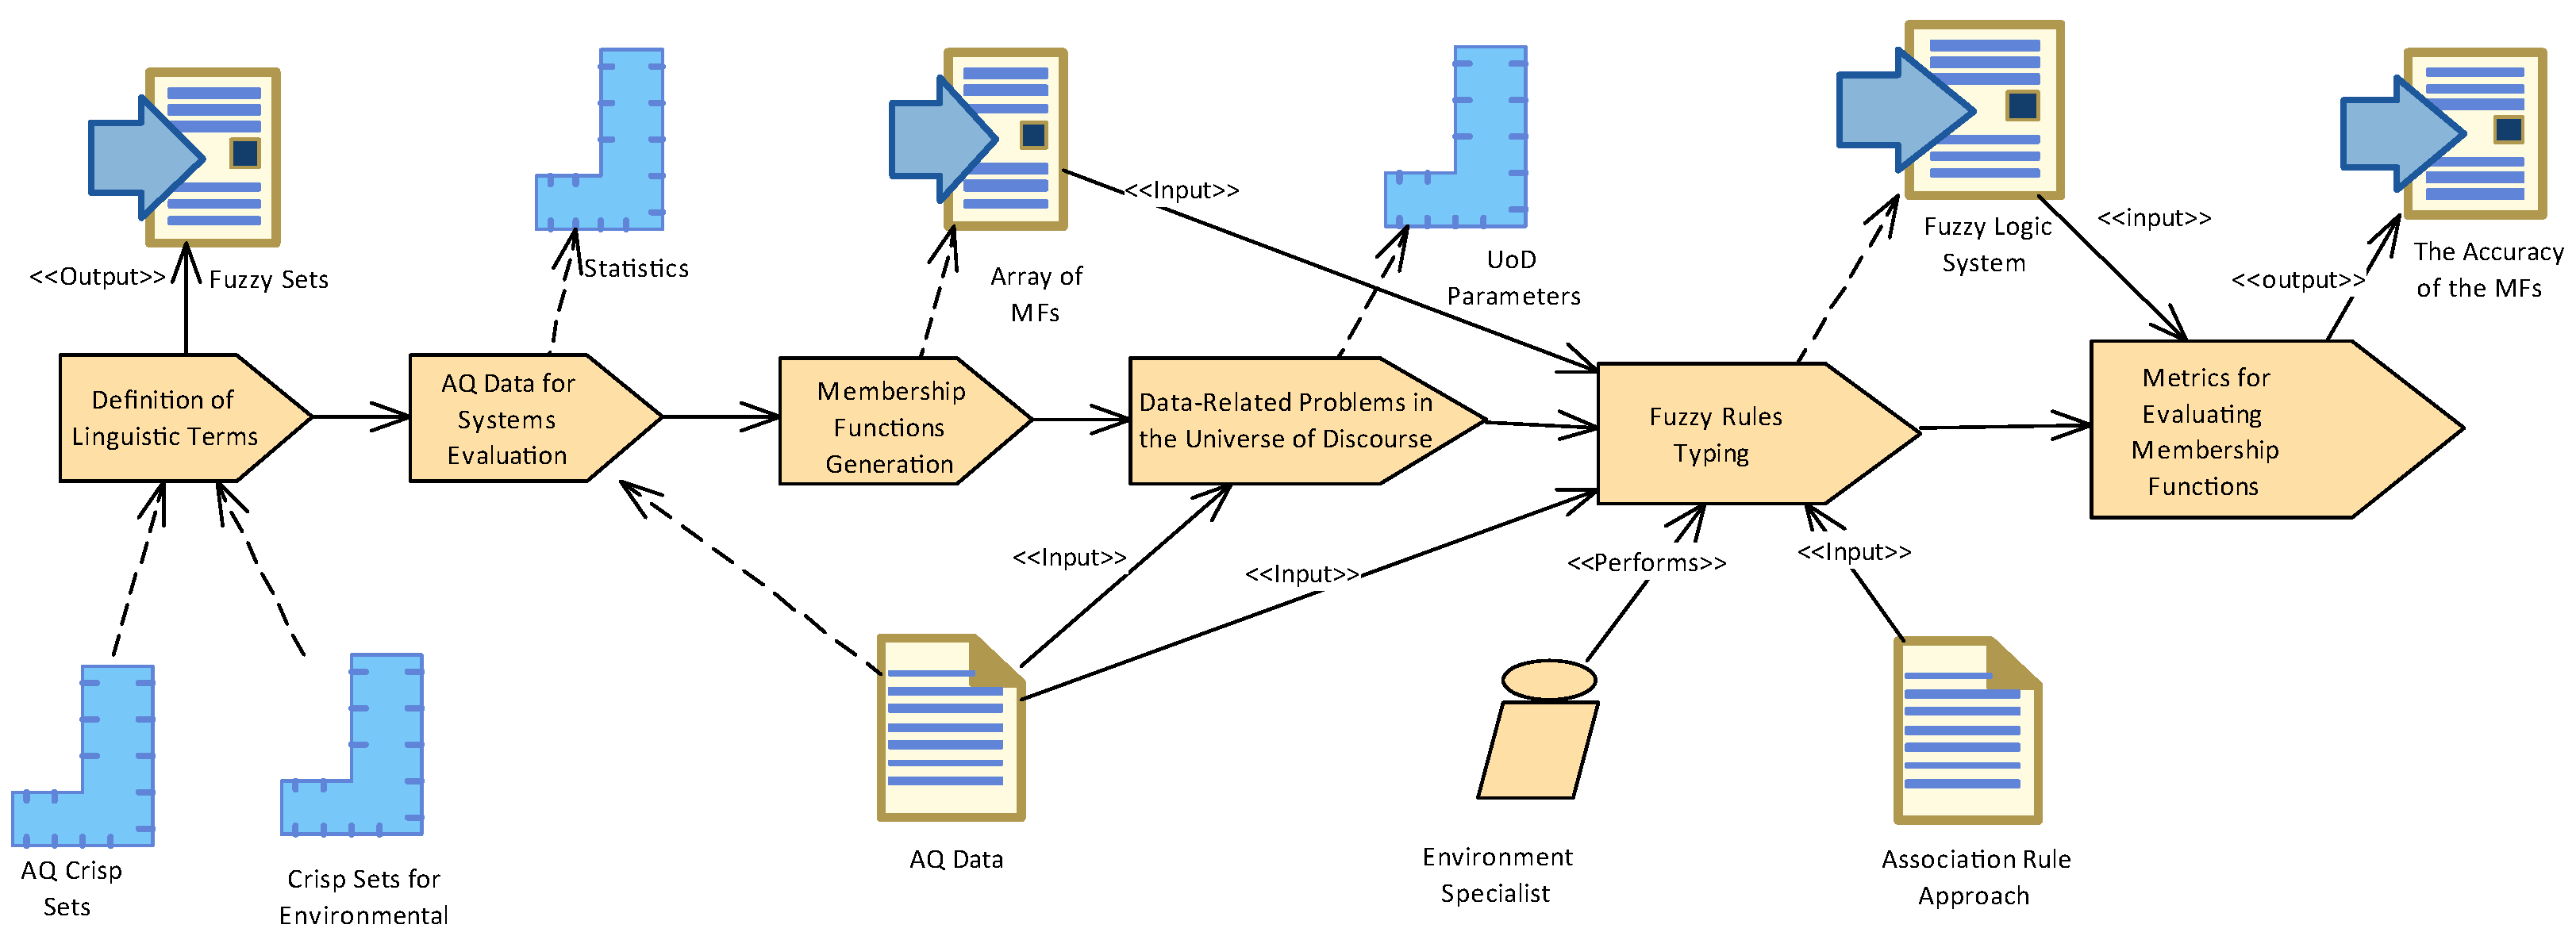
To assess the impact of the fundamental methods of a fuzzy system, a sequence of stages or steps must be executed in a predetermined order. In this respect, various approaches exist for delineating a methodology. Nevertheless, within this context, the Software & Systems Process Engineering Metamodel (SPEM2.0) serves as an exemplary framework that delineates the guided steps towards fulfilling the objectives of this paper. Its clarity and adaptability to real-world information systems render it a fitting choice [
20,
21]. Based on the modeling specification,
Figure 1 illustrates the primary activities, stakeholders, inputs, and outputs associated with this evaluation method. These steps are specifically designed to address and analyze in detail the principal activities involved in the design of a fuzzy system, including the definition of linguistic terms, the data utilized for process validation, the MFs to be evaluated along with their corresponding defuzzification methods, and finally, the scoring system for assessing the MFs.
Each activity described in
Figure 1 is developed in-depth as a subsection in this section. In addition, the evaluation results are detailed.
3.1. Definition of the Linguistic Terms
Linguistic terminology constitutes the primary input within any fuzzy logic system, as it facilitates the modeling and categorizing of the problem at hand. Numerous definitions of crisp sets have been proposed, notably with connections to knowledge engineering [
22]. In the Air Quality (AQ) analysis domain, the United States Environmental Protection Agency (USEPA) employs a standard for air pollution concerning levels of concern for human health. The components of AQ are presented in
Table 1, and the linguistic terms enable their representation as fuzzy sets. The principal components include Particulate Matter sized 2.5 microns (
), Ozone (
), Carbon Monoxide (CO), Sulfur Dioxide (
), and Nitrogen Dioxide (
). These components are measured using scales such as micrograms per cubic meter (
g/m
3), Parts Per Million (ppm), or Parts Per Billion (ppb). A comprehensive description of the criteria and associated color codes is available in the technical document [
23].
Conversely,
Table 2 presents the linguistic terms associated with the meteorological variables. The international standards for their representation are additionally utilized as input; however, in this instance, the air Equivalent-Effective Temperature (EET) Scale and the Beaufort wind scale are applied for air temperature and wind speed, respectively.
3.2. Air Quality Data for Systems Evaluation
At this stage, the descriptive values of the collected data are presented, because these values are utilized in the subsequent two sections (a) to elucidate an issue concerning the generation of the fuzzy sets, as detailed in
Section 3.4.1, and (b) to assess the evaluation method of the system’s accuracy in
Section 3.7. In total, 52,560 data points were collected in 2021 in Cuenca, Ecuador, which has relatively satisfactory AQ. Nevertheless, the municipality consistently monitors the AQ and meteorological variables to alert the population regarding significant changes. An example of the data is available on GitHub (
https://github.com/LIDI-UDA/airfuzzy, accessed on 16 December 2024).
In the initial phase of data preprocessing, data conversion to standard international units of measurement was executed. Subsequently, due to the satisfactory AQ of the variables within the city, a substantial number of values exist within the lower intervals, namely the good, moderate, and unhealthy groups. Consequently, the subsequent task involved scaling these values to align with the minimum and maximum values of the standardized metrics delineated in
Table 1 and
Table 2, aiming to augment the sample size for each interval of the linguistic terms while preserving the original dispersion characteristics of the data. The descriptive statistics of the variables are presented in
Table 3, facilitating the identification of the behavior of the input data.
3.3. Membership Functions Generation
The literature shows several MFs, but the most used are the triangular, trapezoidal, Gaussian, and bell. Each has a particularity in its construction parameters, giving different calculated fuzzy values. Their main advantage is that these could be plotted in different intervals over the UoD, making it easy to understand the behavior inside the inference engine. In this study, the MFs were built according to the linguistic terms (), and their parameters were calculated using the upper (u) and lower (l) boundaries of the relative . In the specific case of triangular and trapezoidal MFs, an extra margin of the interval in the linguistic term was used to consider the possible sensor failures.
3.3.1. Triangular
It necessitates a vector of elements
to regulate its configuration, as demonstrated in Equation (
1).
3.3.2. Trapezoidal
This has a vector comprising four elements
designed to regulate its shape, as illustrated in Equation (
2).
3.3.3. Gaussian
This MF necessitates solely the center (
) and the standard deviation (
). Consequently, it is imperative to employ the gathered data as input to ascertain the corresponding parameters for each linguistic term, following Equation (
3).
3.4. Data-Related Problems in the Universe of Discourse
Prior to outlining the fuzzy rules, it is pertinent to emphasize that certain programming interfaces for fuzzy logic (for instance, fuzzy clips) are limited to the definition of fuzzy sets and association rules necessary for conducting inferences. In contrast, alternative interfaces (such as skfuzzy [
24]) necessitate the establishment of a sequence for the UoD as the initial phase in generating visual representations for fuzzy sets and fuzzy rules, subsequently displaying the inference output through control system simulation.
3.4.1. Structure and Visualization Issues by a Noncontinuous Sequence
As described in
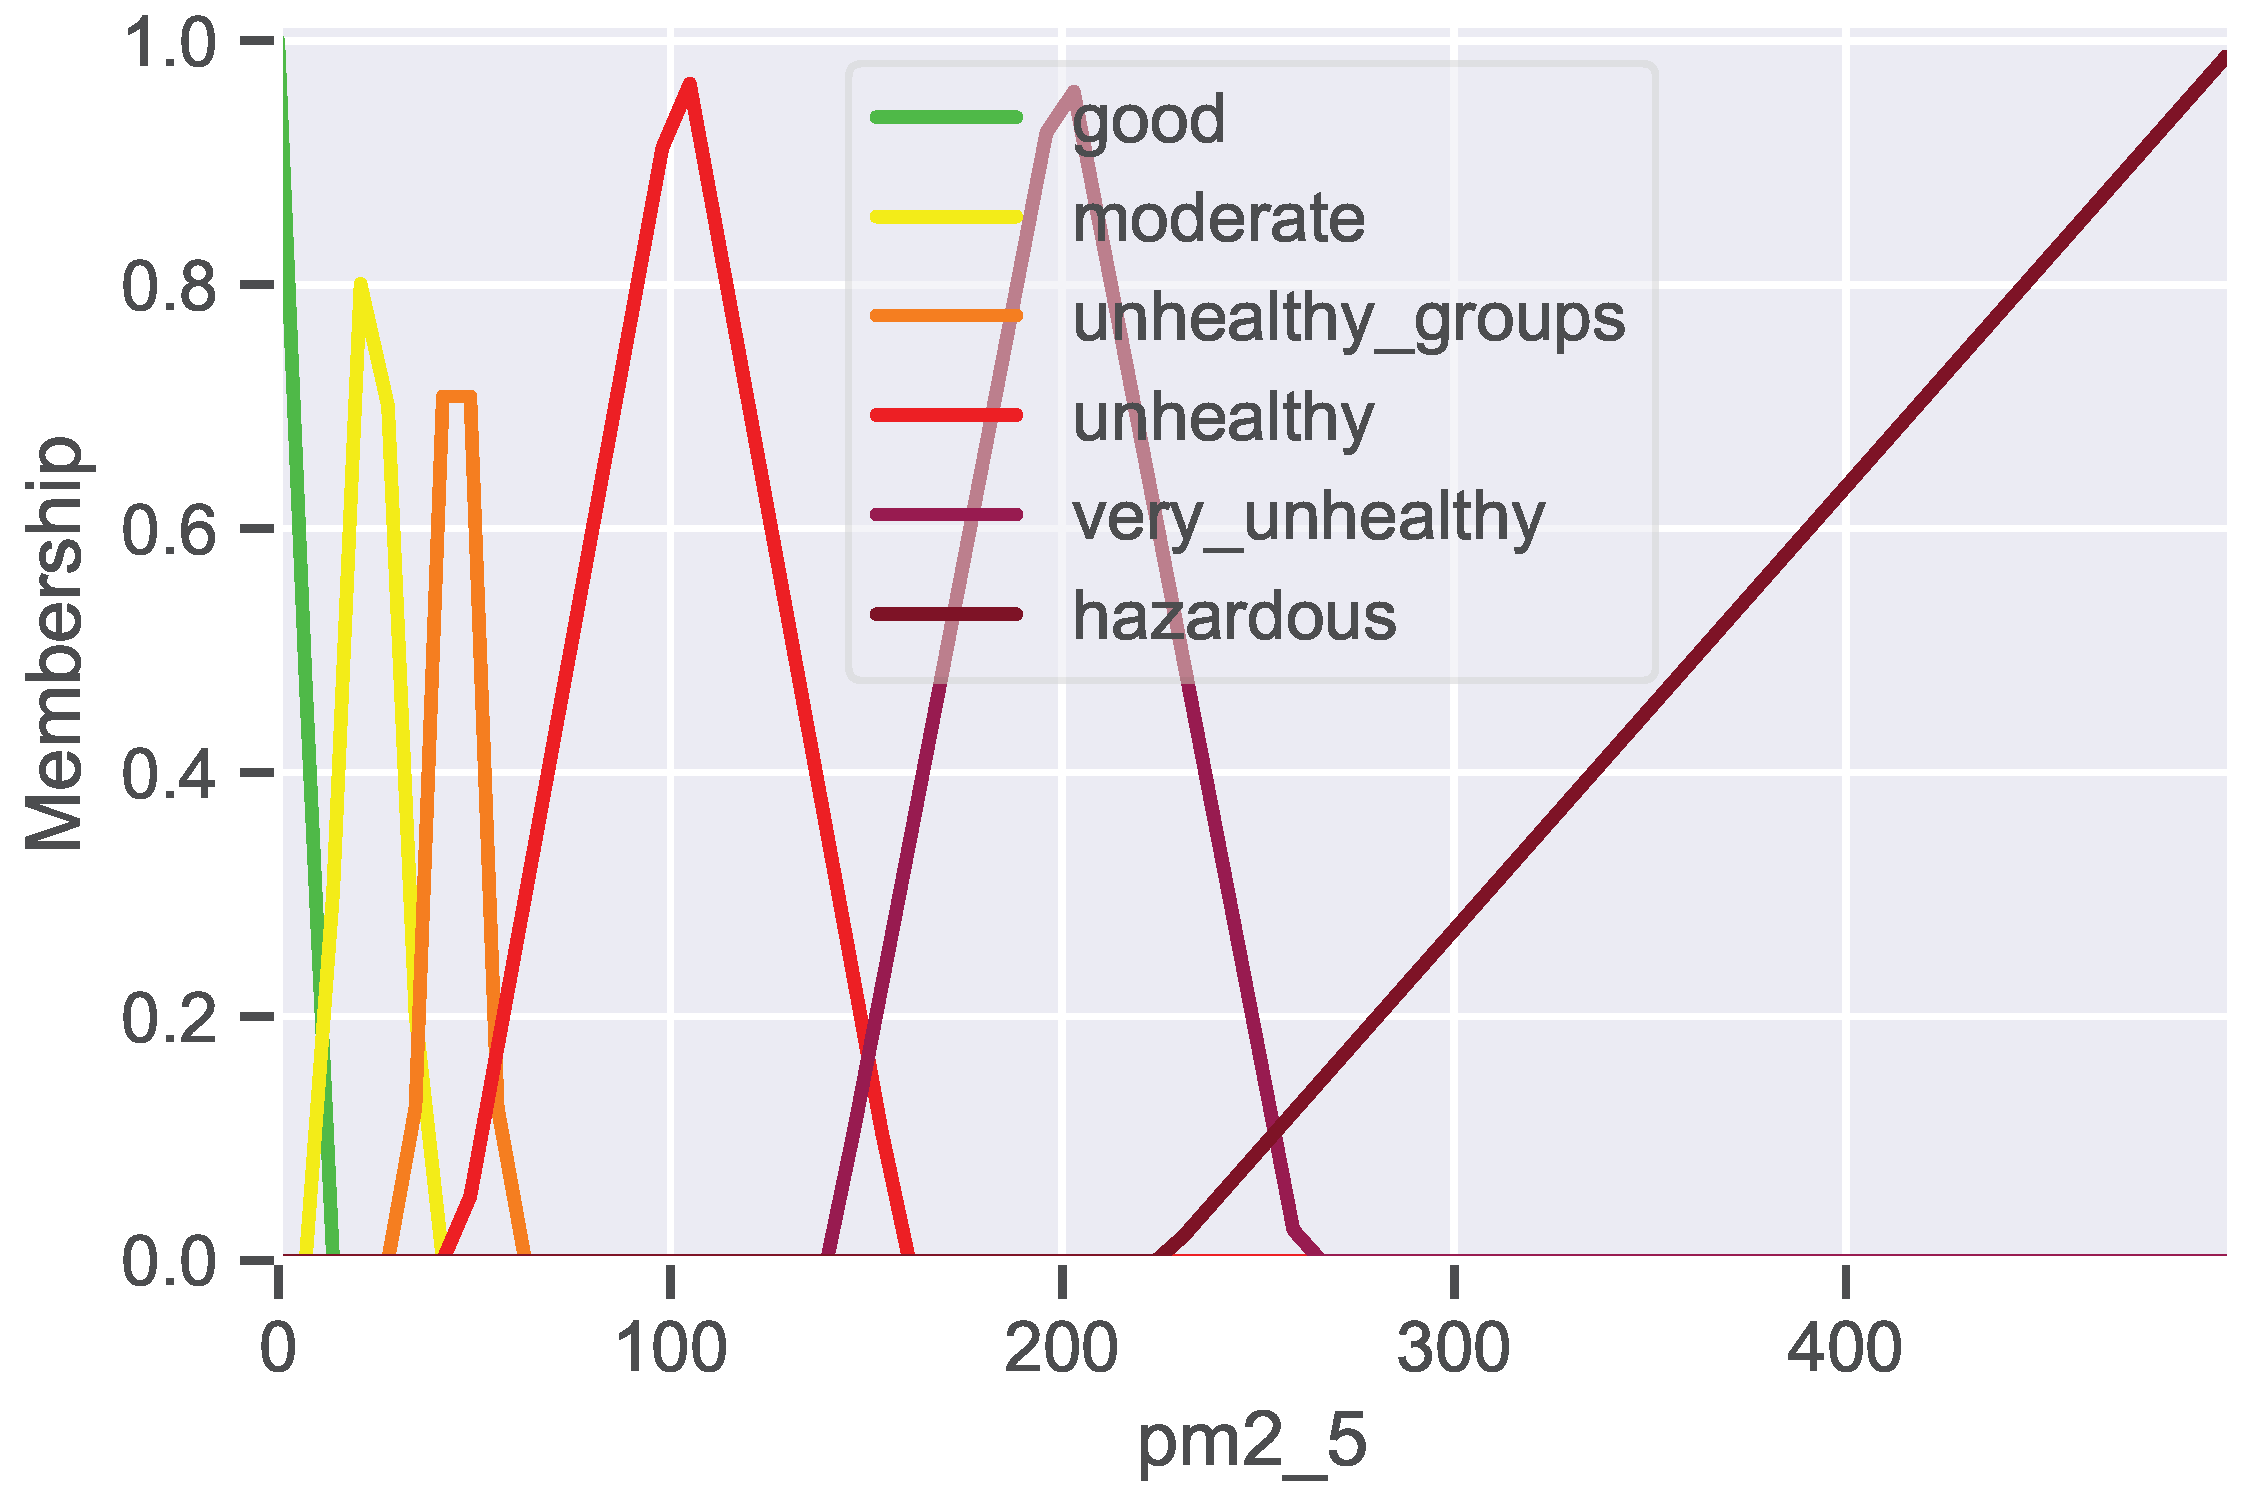
Section 3.2, data are obtained from Internet of Things (IoT) devices. A straightforward approach involves utilizing these collected values as inputs to represent the UoD through novel programming libraries. However, applying this method may result in distorted term lines in the plot, leading to a misleading perception of the visualization or erroneous typing. For example,
Figure 2 was generated using the collected IoT data of
, with the triangular membership functions defined based on the median values. It is imperative to acknowledge that the conducted analysis must be applied comprehensively to all variables to ensure that all Universes of Discourse are constructed accurately.
3.4.2. Building a New Sequence for a Universe of Discourse
To prevent the occurrence of an infinite sequence of numbers, a data analytics phase is implemented to establish a finite sequence from the collected data, thereby facilitating the visualization of linguistic terms without complications. Based on these findings, two behaviors can be elucidated: Firstly, as illustrated in
Figure 3a, it is feasible to identify outliers, evidenced by a significant interval between the measurements of 50 and 60. Furthermore, in
Figure 3b, the histogram reveals intervals within the measured AQ values, characterized by a short range exhibiting high data concentration. It can be noted that these intervals predominantly encompass values around 0 and 1.
In order to rectify the definition of the UoD, it is essential to generate a new UoD comprising an equivalent number of points as the collected real-world values while ensuring minimal spacing between the points. The median is employed to mitigate the influence of outliers, with the minimum value serving as the initial reference. These newly established sequences are characterized by Equation (
4), which facilitates the management of both narrow and extensive ranges for other variables.
For instance, the
,
, and
values were set so that the minimum is
and the median is
. Subsequently, a new UoD can be implemented;
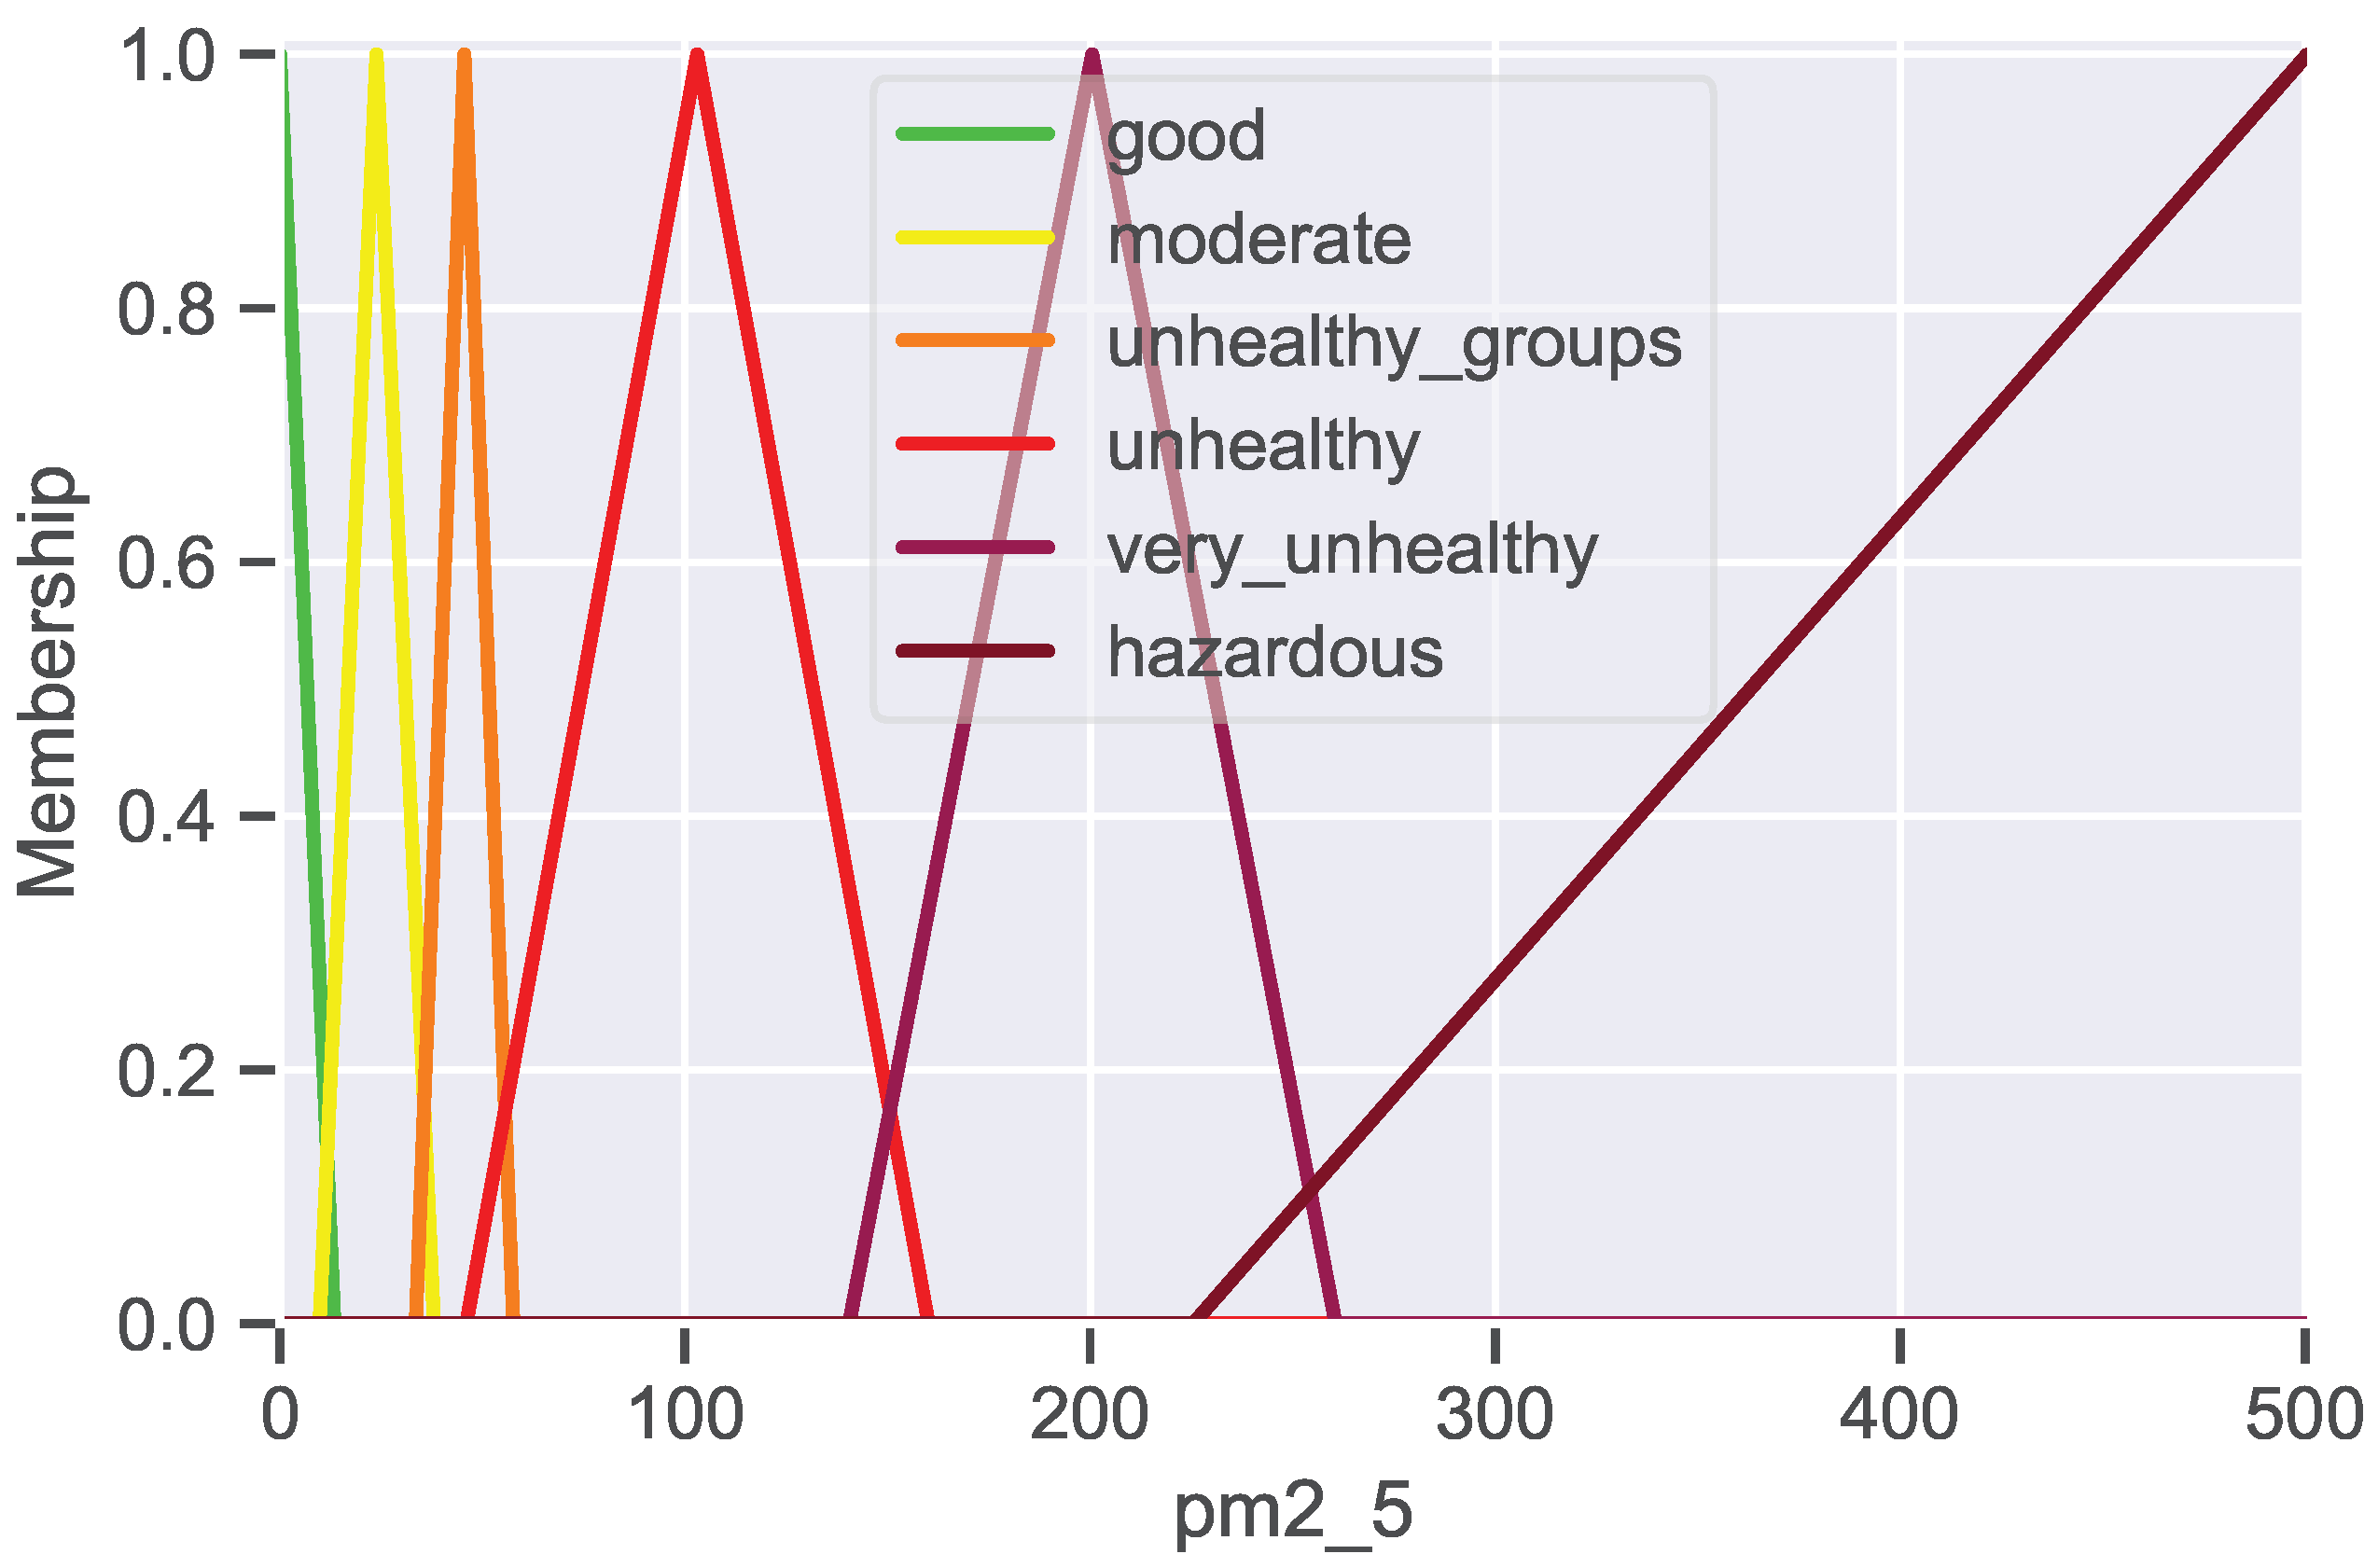
Figure 4 illustrates the results derived from this procedure.
Figure 4 depicts the outcome of the methodology derived from Equation (
4), which was utilized to formulate the sequence of the UoD. In this instance, the fuzzy sets are distinctly articulated and devoid of the visualization complications attributable to the novel characteristics of the UoD’s domain. Consequently, this output prompted the subsequent generation of new sequences for the remaining variables.
3.5. Fuzzy Rules Typing
The primary advantage of fuzzy logic and its associated fuzzy rules is that the premise “X” is A, and the consequent “Y” is B can be true to a certain degree rather than strictly true or strictly false regarding the rule. Nevertheless, there are typically two approaches to generating and proceeding with the formulation of these rules.
3.5.1. Definition of Rules According to Association Rules Mining
Various authors have proposed methodologies to automatically generate precise association rules. This endeavor is fundamentally grounded in data mining techniques [
25] and optimization methods, such as genetic algorithms [
26]. The data mining approach utilizes data solely as input, wherein the quality of the rules is contingent upon the quality of the data and the metrics of association, including the support, confidence, and lift for association rules. Per the work presented in [
25], utilizing our AQ data as outlined in
Section 3.2, 26 association rules were obtained with support values greater than or equal to
and lift values greater than or equal to
. Based on the existing literature, one particular rule concerning the association between
and
[
27] was selected as representative due to its significance in the literature and the observed data behavior in Algorithm 1.
| Algorithm 1 Rule of particulate matter () behavior |
| _ | ▹Rule 1 |
| if is “good” then | |
| is “good” | |
| end if | |
3.5.2. Definition of Rules Through Knowledge Engineering
A traditional methodology for the development of Artificial Intelligence (AI) systems involves the integration of knowledge engineering principles, which encompass activities such as knowledge acquisition, representation, validation, inference, and explanation [
28]. Specifically, the rules are delineated during the representation phase, and this methodology facilitates the generalization of certain associations that the aforementioned computational approach fails to incorporate due to the lack of tangible behavior at the time of data collection.
Collaborating with specialists in the urban AQ sector, particularly individuals holding master’s or doctoral degrees in environmental science, it became feasible to identify a regulation characterized as “… when temperatures are high, sunlight is strong, and winds are weak, ozone can build up to unhealthy levels. The formation of tropospheric ozone depends on the conjunction of high temperatures, the absence of winds, and the emission of primary pollutants into the atmosphere (from cars and industries), so the existence of rains contributes to reducing its level…” This was obtained through Algorithm 2.
| Algorithm 2 Rules of Ozone () behavior |
| _ | ▹Rule 2 |
| if Temp is “warm” and WindS is “light air” then | |
| is “unhealthy groups” | |
| end if | |
| _ | ▹Rule 3 |
| if Temp is “hot” and WindS is “calm” then | |
| is “unhealthy” | |
| end if | |
3.6. Incorporating Defuzzification Methods
Section 1 shows that only a specific number of functions are used in the design of fuzzy systems. Unlike the fuzzification functions, there is a set of defuzzification functions, each developed to improve the conversion according to the fuzzy system’s application. This stage describes the defuzzification (output) functions to evaluate a fuzzy system’s input and output functions.
Talon and Curt [
29] introduced thirty-one theoretical defuzzification functions derived from fuzzy set theory. These functions are categorized into four primary classes: those associated with the mean (22), those associated with the minimum (2), those associated with the maximum (2), and finally, other methods (5). However, in order to streamline the evaluation process, five functions were selected due to their relevance in industrial applications [
4]:
Centroid or center of gravity. This is ssociated with the mean, also named the center of area, Sugeno developed this technique as the most popular for defuzzification tasks.
Bisector. This is a vertical line that divides the region into two similar sub-regions, sometimes coincident with the centroid.
MOM. Associated with the maximum, only active rules with the highest degree of fulfillment are considered.
SOM. This is associated with the maximum. It chooses the smallest output with the maximum MF as the crisp value.
LOM. Associated with the maximum, this takes the largest among all z that belong to [, ] as the crisp value called Z (LOM).
3.7. Metrics for Evaluating Membership Functions
The primary objective of this stage is to evaluate the accuracy of various combinations of membership functions and defuzzification methods. Consequently, it delineates the different metrics available for assessing the system and the criteria for selecting the appropriate metric. Numerous methodologies for evaluating forecasting systems have been proposed throughout the years in this context. However, a concise literature review facilitates selecting one such approach from the many available. Relevant literature highlights metrics such as the Root Mean Square Error (RMSE), Mean Absolute Percentage Error (MAPE), Relative Absolute Error (RAE), Median Relative Absolute Error (MdRAE), Median Absolute Percentage Error (MdAPE), and the Geometric Mean of the Relative Absolute Error (GMRAE) [
30]. In this instance, the evaluation concentrated on identifying the minimum error in the forecast; therefore, the MAPE metric was deemed suitable for this objective, as in Equation (
5).
where
n is the number of fitted points,
is the actual value,
is the forecast value,
∑ is the summation of the absolute value summed for every forecasted point in time.
Consequently, the MAPE will exhibit diminished values for the optimal combination of the membership and defuzzification functions.
4. Results and Discussion
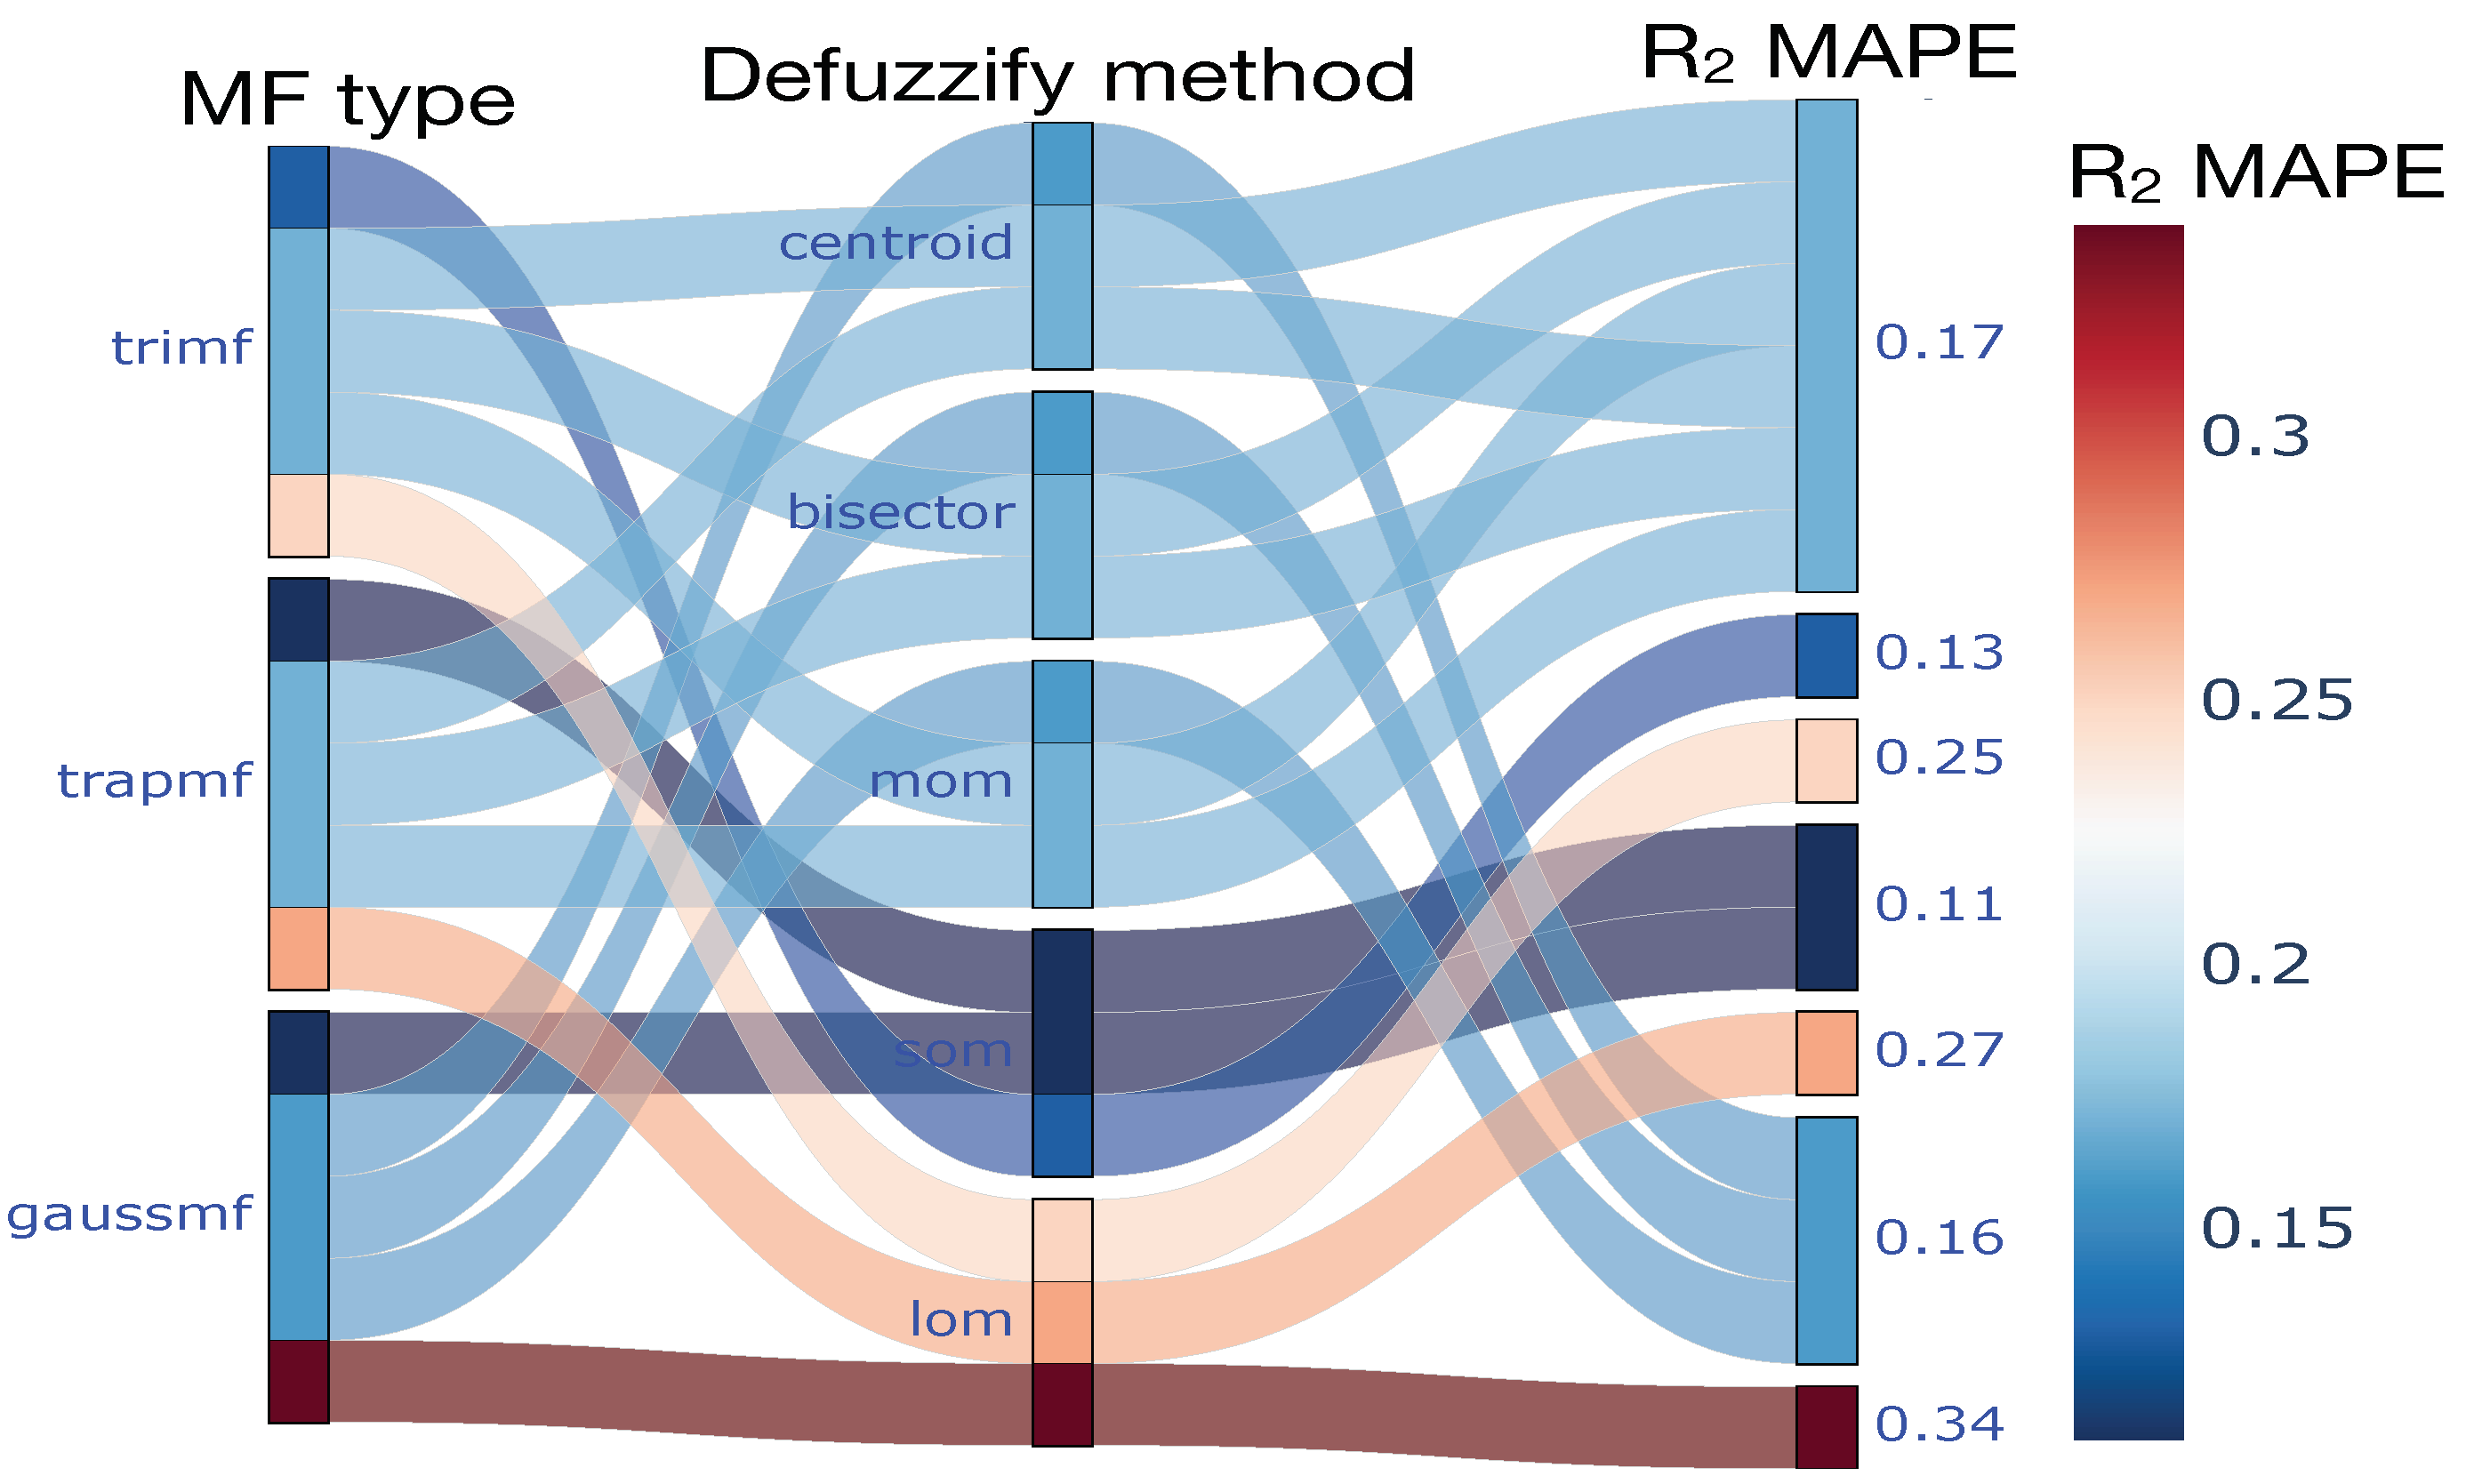
Upon the completion of the methodology, the outputs consist of various forecasting systems resulting from the combinations of each MF with each defuzzification method. Consequently, a data synthesis approach was proposed to demonstrate the accuracy of each system. Accordingly, parallel coordinate plots were utilized to perform this synthesis; this tool possesses several advantages, including result integrity, connectivity of results, and the significance of the results. The latter advantage bolstered this evaluation, as the addressed dimensions are essential for data exploration [
31].
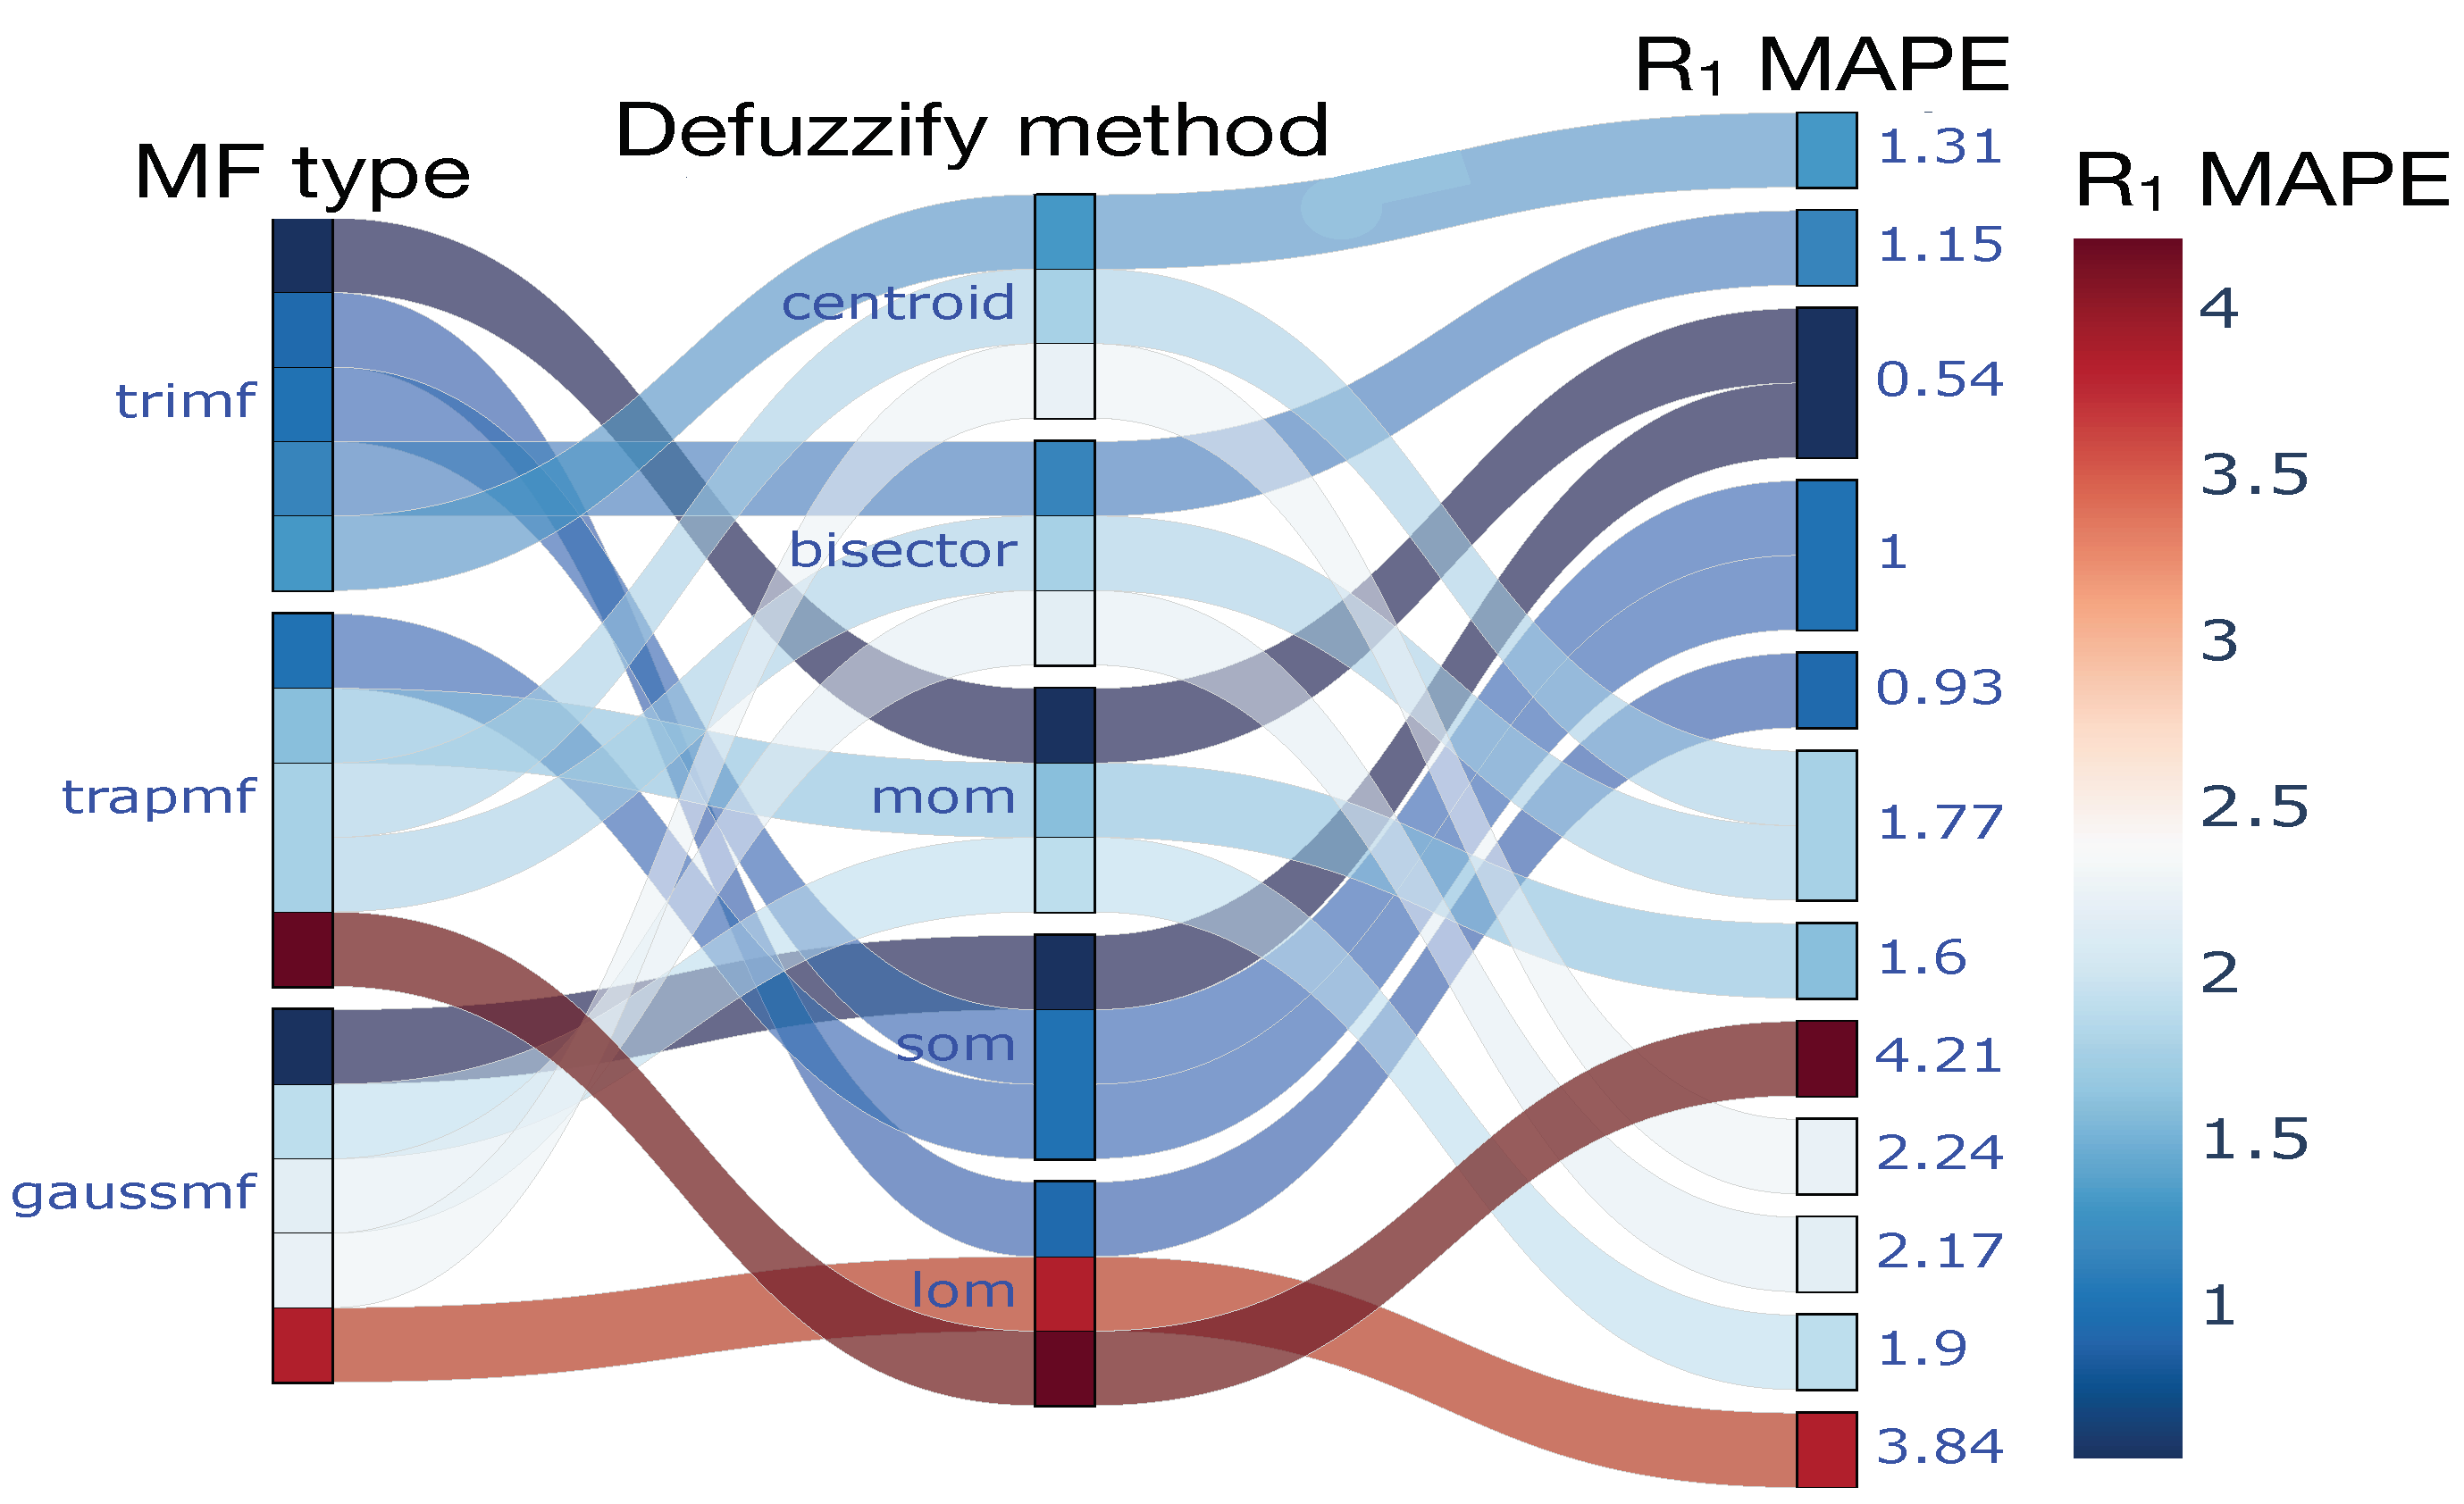
The fuzzy systems were analyzed in accordance with the process of the association mining rules (see Algorithms 1 and 2). For the initial group,
Figure 5 illustrates the forecasts produced by the fuzzy systems based on Rule 1, derived from the association rule mining of
. Additionally,
Figure 6 depicts the precision of Rule 2 concerning
. The accuracy of the forecasting systems was quantified using the MAPE.
In group one of the systems, an important finding is illustrated in
Figure 5, which emphasizes the features of the defuzzification method. Consequently, the LOM approach proves inadequate when applied to two MFs (trapezoidal and Gaussian), resulting in the lowest forecasting accuracy. Conversely, it is noteworthy that combining the SOM with a triangular MF yields significantly improved performance results, thereby enhancing the systems’ accuracy.
When a fuzzy system employs fundamental conditional rules, it is imperative to integrate triangular or Gaussian MFs within its architecture and to combine these with the methods of defuzzification known as the MOM or SOM. Both approaches yield comparable accuracy metrics. The approximation of reasoning enables the achievement of uncertain outcomes contingent upon the precision of the fuzzy system [
32].
In addition to the aforementioned results,
Figure 6 was constructed based on the conjunctive rules, with an additional grade of complexity incorporated. Moreover, evaluating and integrating the SOM methodologies in complex systems is of considerable relevance. In this context, all the MFs significantly enhanced the prediction accuracy when applying the SOM method Concurrently, the LOM defuzzification technique illustrated the prediction loss when utilized. The outcomes produced, in conjunction with the trapezoidal and Gaussian MFs, yielded lower values of the MAPE, thereby clarifying the appropriate core functions to be implemented in such systems.
In this context, the defuzzification method is paramount in enhancing the design outcomes of an air pollution behavior system, which is explicitly based on the
,
, temperature, wind speed, and
variables. The findings presented in
Figure 5 and
Figure 6 support this assertion. This represents a pertinent conclusion regarding the defuzzification method due to the absence of non-interval data, whereby there is no significant variation in the results across different defuzzification methods [
33].
Fuzzy systems are being developed to address various industrial domains, including power compression, valve actuation, temperature escalation, humidity enhancement, air propagation angles, and motor damper voltage [
34]. Additionally, environmental systems, encompassing ecological impacts, water quality indices, renewable energy, and the forecasting of material concentrations, are also addressed by fuzzy systems [
35,
36]. For numerical values, a study has investigated the application of fuzzy logic in a load-balancing scenario to mitigate uncertainty in decentralized decision making, utilizing the states of all nodes to ascertain the global condition of the system. In this context, the defuzzification methods employed were consistent with those utilized in this research. The centroid, bisector, and MOM were identified as the most effective techniques for calculating the crisp value [
37].
In the context of this evaluation, we enhanced the design of our AQFS to achieve the highest accuracy in forecasting the behavior of its components. A fundamental aspect of this process involved a comparative analysis of the core methodologies. Ultimately, the proposed architecture offers superior results for this task when contrasted with a fuzzy design employing traditional MF and defuzzification techniques.
5. Conclusions
This paper assessed the influence of membership functions in the design of a fuzzy system. Specifically, a fuzzy system for forecasting air materials was developed, utilizing five air variables alongside two meteorological variables. The intervals for the UoD for each variable were calculated using novel fuzzy libraries that necessitate a sequence of points for their representation. However, the original data failed to satisfy this requirement.
An analysis was conducted on three MFs and five defuzzification methods. The findings indicated that for an AQFS, the selection of the defuzzification method should be prioritized during the system’s design phase. Conversely, the SOM approach demonstrated superior performance compared to the LOM approach, which produced the least favorable results. Furthermore, enhancement of the predictive system can be achieved by combining the SOM method with the triangular MF.
Furthermore, the seven activities associated with this approach can be employed. Concurrently, a fuzzy system is being developed in alternative domains, which opens new avenues for evaluating membership functions and defuzzification methodologies. In fuzzy system design, our subsequent objective is to evaluate knowledge engineering and enhance the inference engine propelled by a Natural Language Processing (NLP) tool influenced by AI technology.


 ,
, 

