1. Introduction
The need for personal safety is increasingly being recognized by victims of various crimes, including dating violence, sexual assault, domestic violence, and retaliation crimes, as well as minor stalking [
1]. Personal safety smartwatches are equipped with real-time location tracking and emergency reporting capabilities [
2,
3]. Although these devices ensure the safety of victims through location-based services, they have limitations in recognizing and preventing at-risk situations in advance. Therefore, this paper focuses on acquiring new data for accident prevention and aims to develop an easily usable smartwatch application based on this research. Since the smartwatch application interacts with the user based on autonomy, it can be personalized to the situation without the need for direct control [
4] and can send appropriate emergency SOS signals, providing an effective personal safety measure.
This study proposes a threatened behavior detection algorithm and application that operates in real-time on a smartwatch. It utilizes the acceleration sensor of an inertial measurement unit (IMU). The accelerometer in an IMU can measure linear accelerations, including gravitational accelerations [
5]. Typically, fall detection research involves attaching sensors to the waist or chest, where it is easier for the system to detect falls. However, in real-life environments, this may reduce usability or comfort [
6]. Considering the ease of wear and sustainability, this study conducts data collection and testing using a wearable watch that can be worn on the wrist.
This study categorizes four main movements: walking, running, desk work, and at-risk movements, and analyzes time series data in the time domain and frequency domain to distinguish these behaviors. This research primarily investigates the effectiveness of 1D convolutional neural networks (CNNs) in processing frequency domain data. It is hypothesized that this approach facilitates efficient computation even with limited training datasets. Furthermore, we consider different input time settings, ranging from 1 to 6 s, to determine their impact on the accuracy of behavior recognition. The ultimate goal is to develop a real-time motion detection application suitable for wearable watch environments, aimed at enhancing personal safety by recognizing potentially at-risk movements.
This paper is structured as follows.
Section 2 presents the related work from the literature.
Section 3 describes the data collection method, the machine learning model used, the 1D CNN structure, and the algorithm of the real-time validation app. The experimental results and real-time verification results of the proposed model are analyzed in
Section 4. The research directions and conclusions are proposed in
Section 5 and
Section 6.
2. Related Work
Rising concerns about women’s safety have led to the development of IoT-based safety devices [
7,
8]. With the assistance of the global positioning system (GPS), tracking users’ locations and timelines has become feasible. Mobile applications on smartphones or smartwatches allow users to send emergency alerts to law enforcement. However, in critical situations, manually operating these applications may not be practical. Therefore, an advanced application to automatically detect threats is essential for crime prevention.
Fall detection technology has primarily been used for older adults, demonstrating that machine learning techniques—such as convolutional neural networks (CNNs) combined with time-series data—are effective for early detection and prevention. Wearable devices equipped with this technology can provide real-time alerts when a fall occurs or predict potential falls in advance, enabling proactive intervention. These advancements significantly improve emergency response capabilities [
9,
10,
11]. However, while falling is a specific behavior that can be relatively straightforward to detect using estimators, distinguishing high-risk movements from ordinary ones is more complex. This requires extensive research, including data collection, in-depth analysis, and the development of a new predictive model.
In public safety, deep learning models are employed to identify hazardous situations in CCTV footage. Systems like SpotCrime autonomously analyze surveillance video to detect potential threats. These models utilize relational inference, which assesses object relationships (e.g., proximity and interaction), allowing accurate risk evaluation even in cases of low object detection accuracy. Such technology is increasingly integrated into smart cities and surveillance infrastructures to enhance public security [
12,
13].
Human behavior recognition through sensor data has applications beyond security, extending to user interaction systems. Deep learning models are widely used to classify human behavior, from simple gestures to complex activities. Our research explores the effectiveness of neural networks in recognizing human movements from sensor data, demonstrating their ability to accurately detect even subtle actions in real time [
14,
15].
This study focuses on policing science with a particular emphasis on women’s safety, as they constitute the majority of personal protection requests. It is crucial to develop machine learning models capable of detecting high-risk movements using motion data from women. Unlike previous systems that primarily collect and analyze static data, this research employs a one-dimensional convolutional neural network (1D CNN) to continuously process accelerometer data. This approach enables real-time recognition of hazardous movements, enhancing personal safety for women in both public and private settings. By leveraging machine learning techniques, this method improves both the accuracy and response speed of threat detection.
3. Materials and Methods
3.1. Experimental Data
This study conducted a comprehensive data collection to analyze various types of movements, specifically designed to distinguish between normal and at-risk activities. The dataset comprises a total of 5534 instances of motion data, segmented into four primary categories: walking, running, desk work, and at-risk situations. Each category includes approximately 1399 samples for walking and running, 1361 samples for desk work, and 1375 samples for hazardous situations.
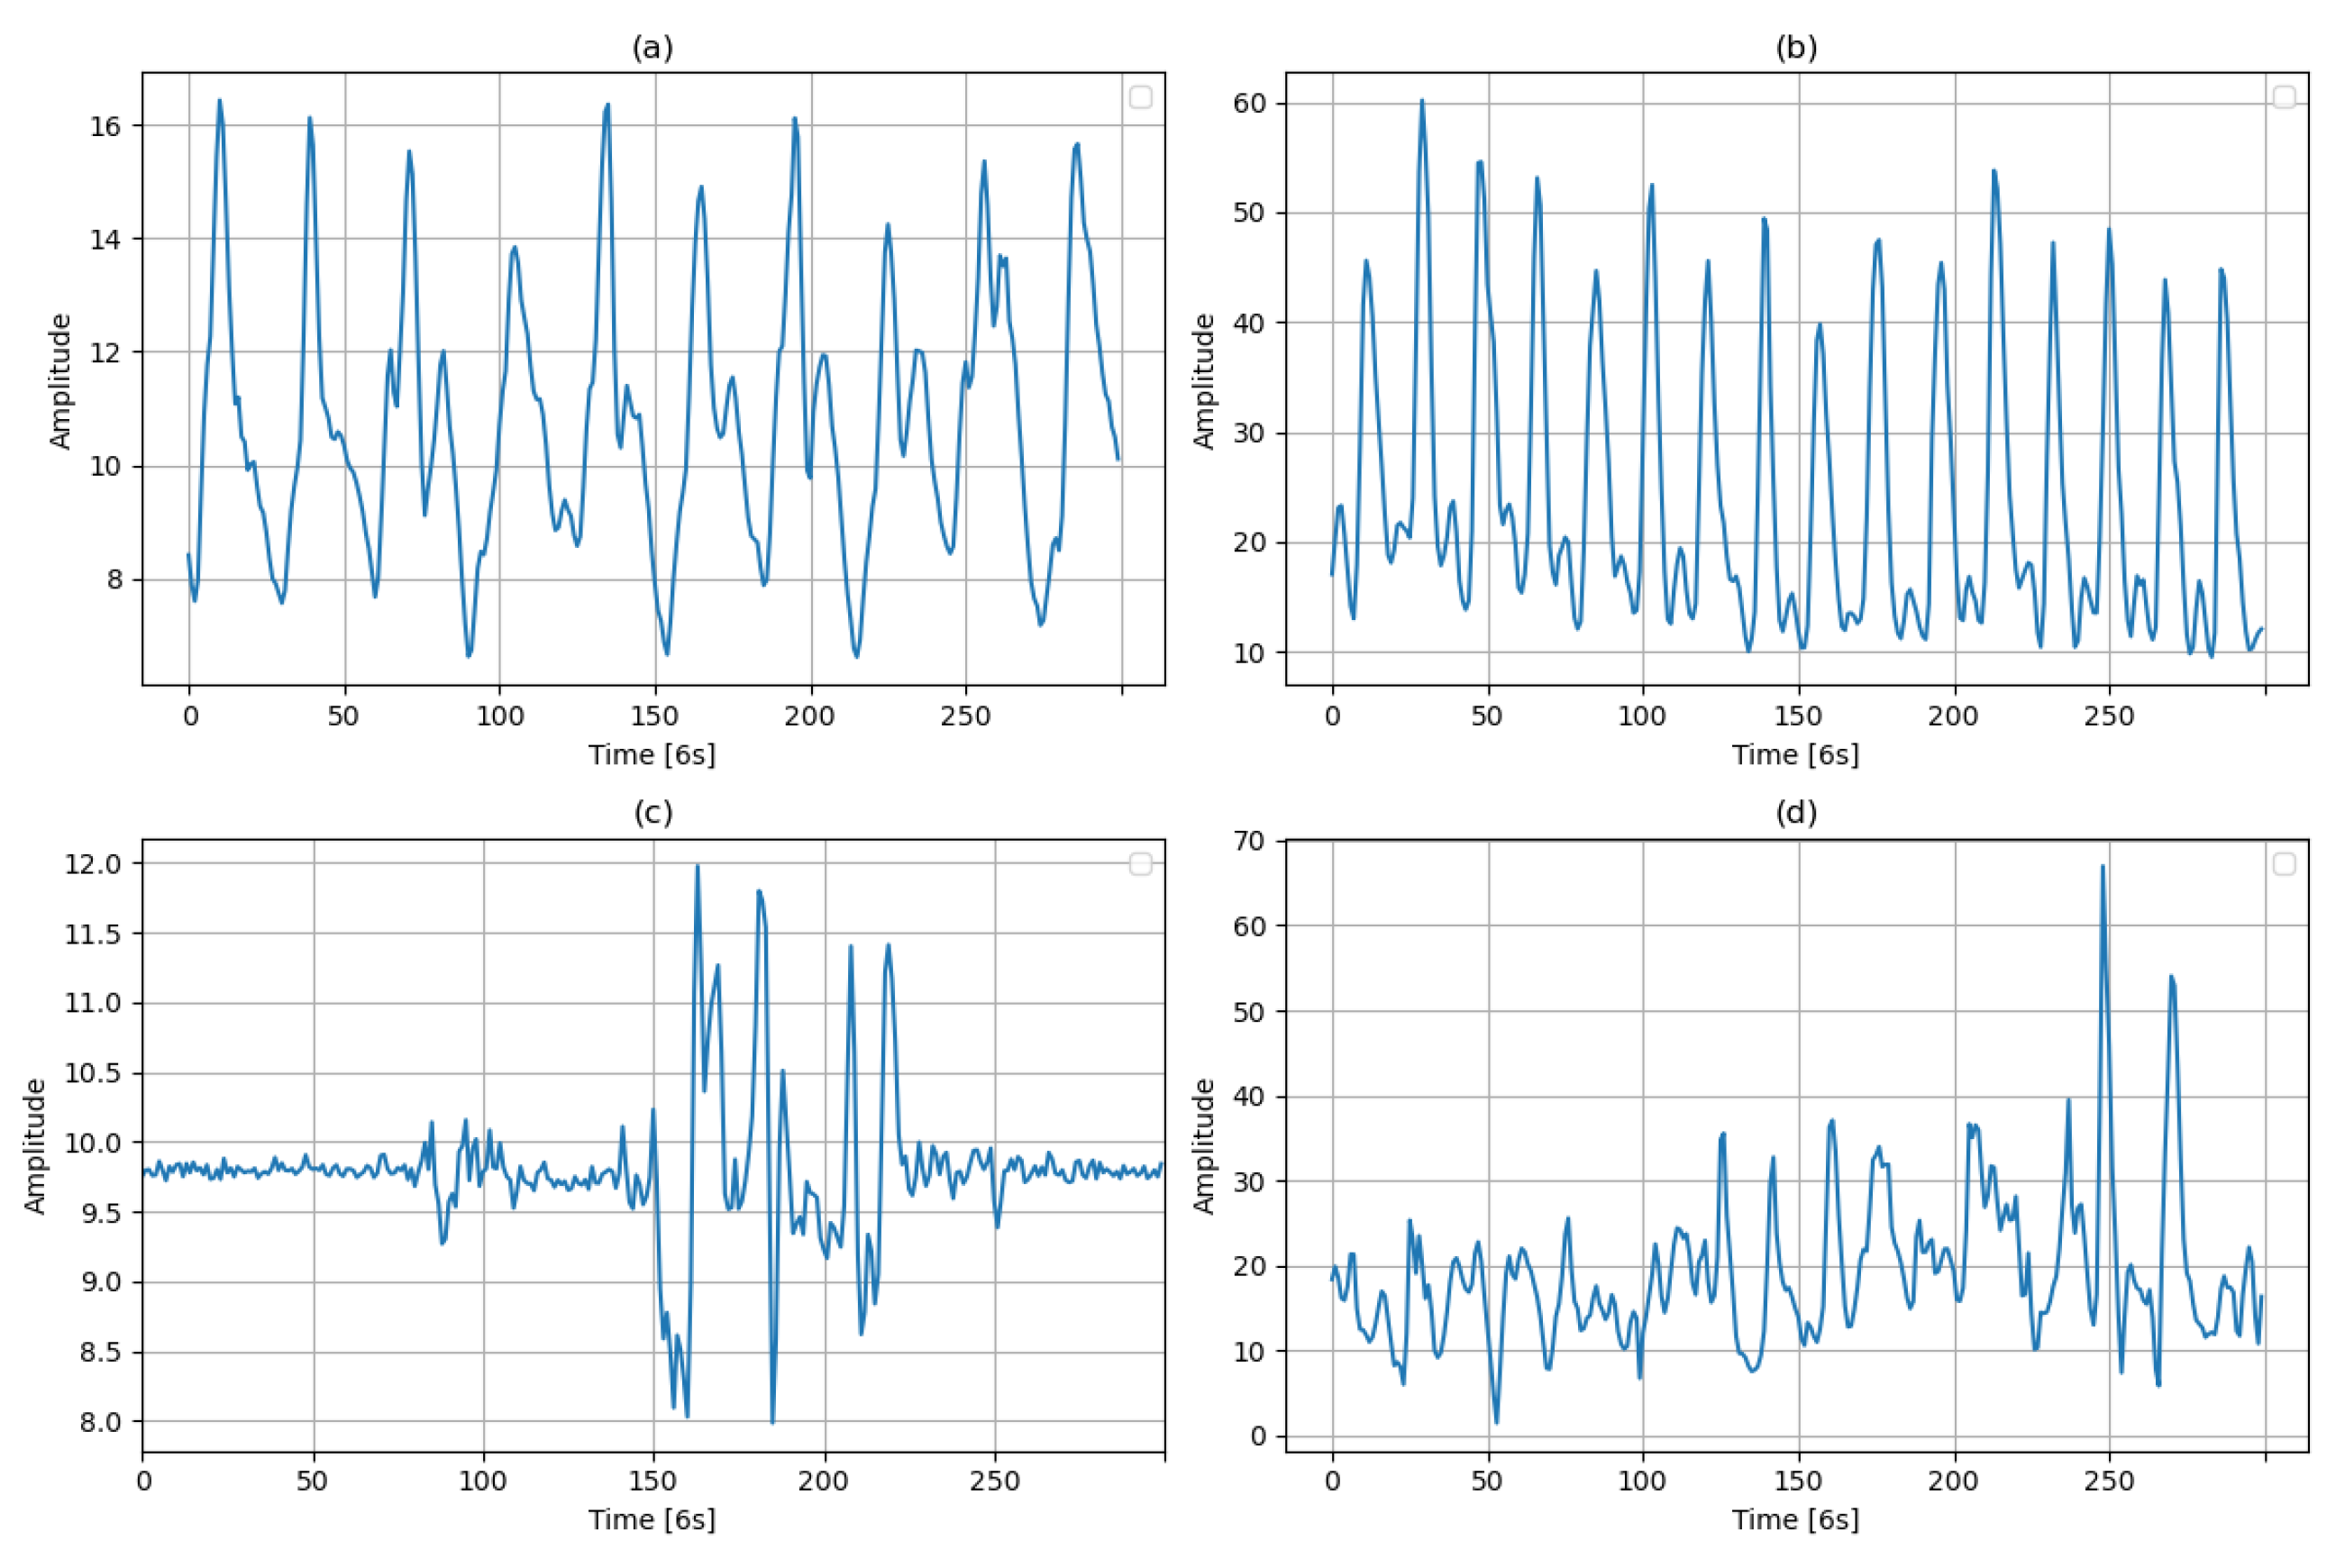
Data were collected from 12 female participants, each contributing to the dataset for durations ranging from 10 to 11 min. This setup allowed us to capture a wide range of naturalistic movements in a controlled environment. The participants were instructed to perform specific tasks associated with each category under monitored conditions to ensure data consistency and reliability. After converting the raw data collected for each class into one-dimensional feature vectors, the data representative of the behaviors are shown in
Figure 1. The figure shows the results of converting the 3-axis acceleration data into one-dimensional feature vectors. The x-axis represents the time collected at 50 Hz for 6 s, and the y-axis represents the amplitude. The transformation process is described in more detail in
Section 3.2.
The entire dataset was divided into subsets for training and testing to evaluate the performance of the machine learning models developed in this study. Moreover, 90% of the data were used for training, allowing the models to learn and adapt to the patterns of motion associated with each category. The remaining 10% constituted the test set, used to assess the effectiveness of the models.
3.2. Learning Algorithm for At-Risk Situation Classification
The data were collected at 50 Hz using the acceleration sensor of the wearable watch SM-R900. The three-dimensional acceleration data were transformed into a one-dimensional signal vector magnitude (SVM) by calculating the Euclidean norm of the x, y, and z values, as shown in Equation (
1). The one-dimensional data reduction is advantageous for designing real-time algorithms on smartwatches with limited memory and computing power.
This transformation minimizes rotational interference, ensuring an accurate representation of a user’s movement to recognize various physical activities. This process is essential as the triaxial data include rotational components that could otherwise distort movement recognition [
15].
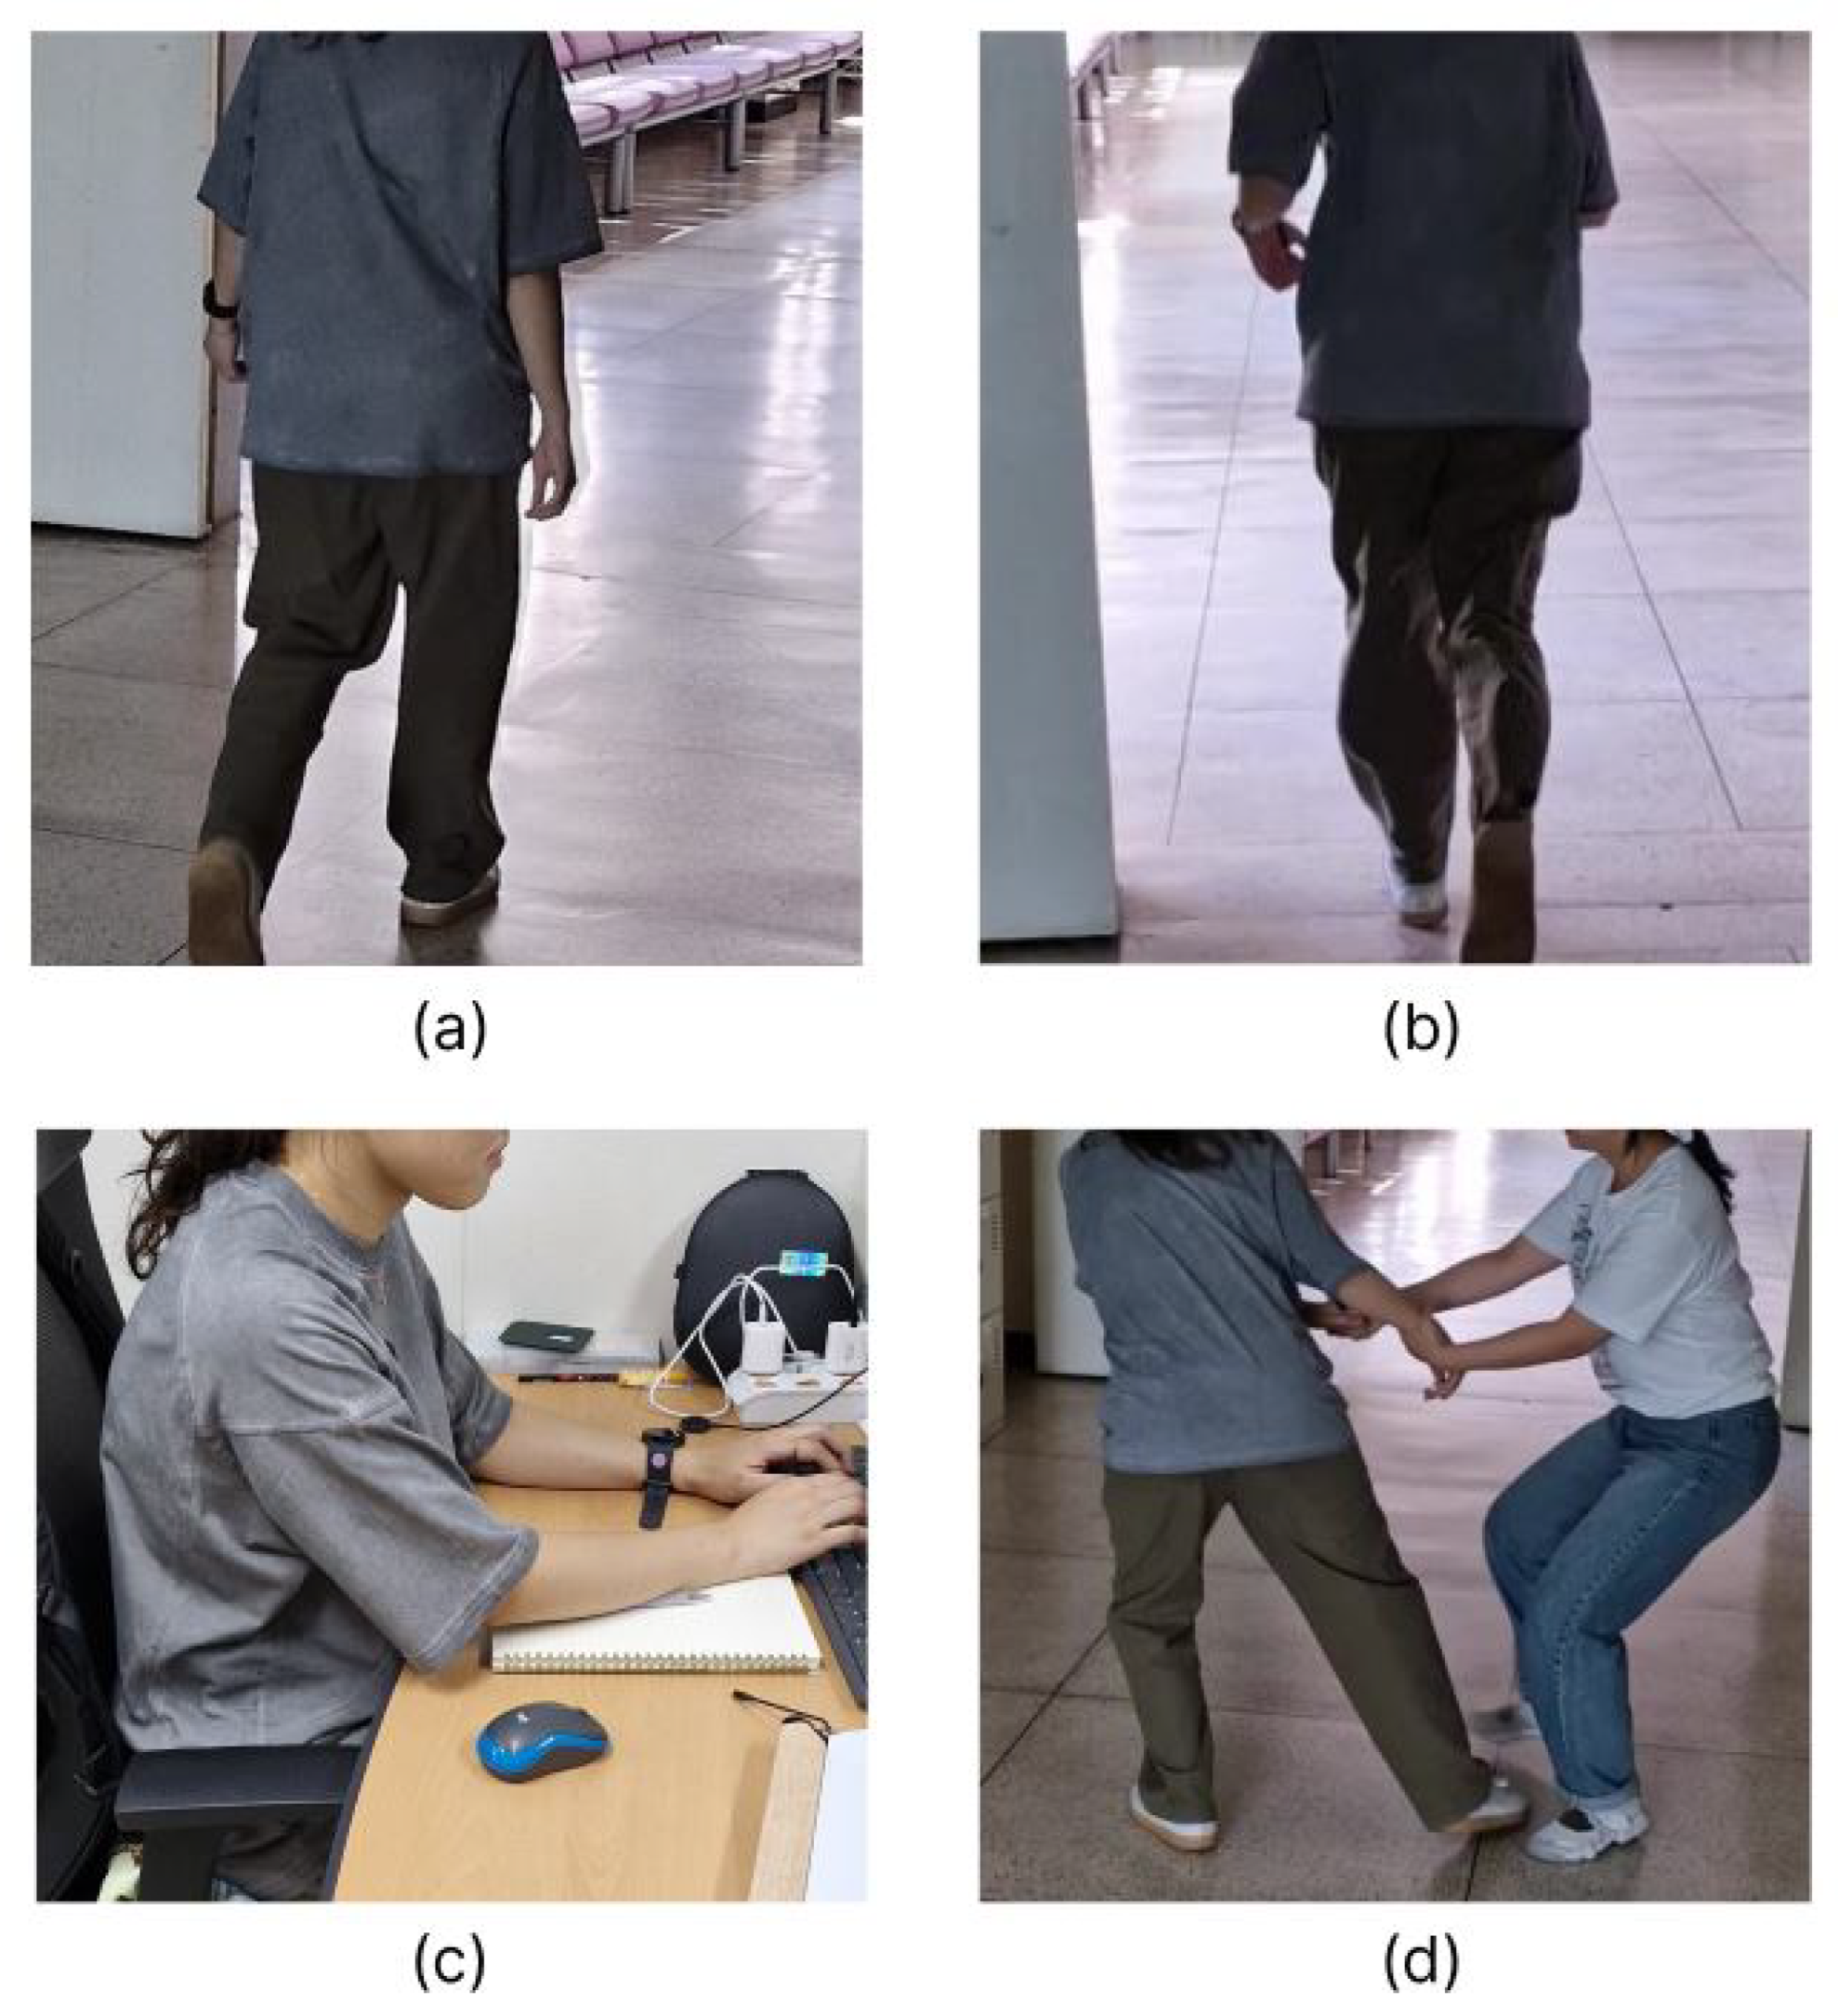
To distinguish at-risk situations in daily life, actions were divided into normal behaviors and at-risk behaviors. Normal activities were collected through walking, running, and desk work (typing, writing, stretching, etc.), and at-risk situations were collected by simulating threatening situations such as picking up, pushing, and shaking. Each action maintained data collection for a duration of 6 s.
As a neural network model, we used a 1D CNN (one-dimensional convolutional neural network) because it can effectively analyze time series data. This model is specialized in processing one-dimensional time series data, and the experimental data were transformed into a one-dimensional SVM signal. A simple 1D CNN with two convolutional layers was constructed to fit the one-dimensional data characteristics.
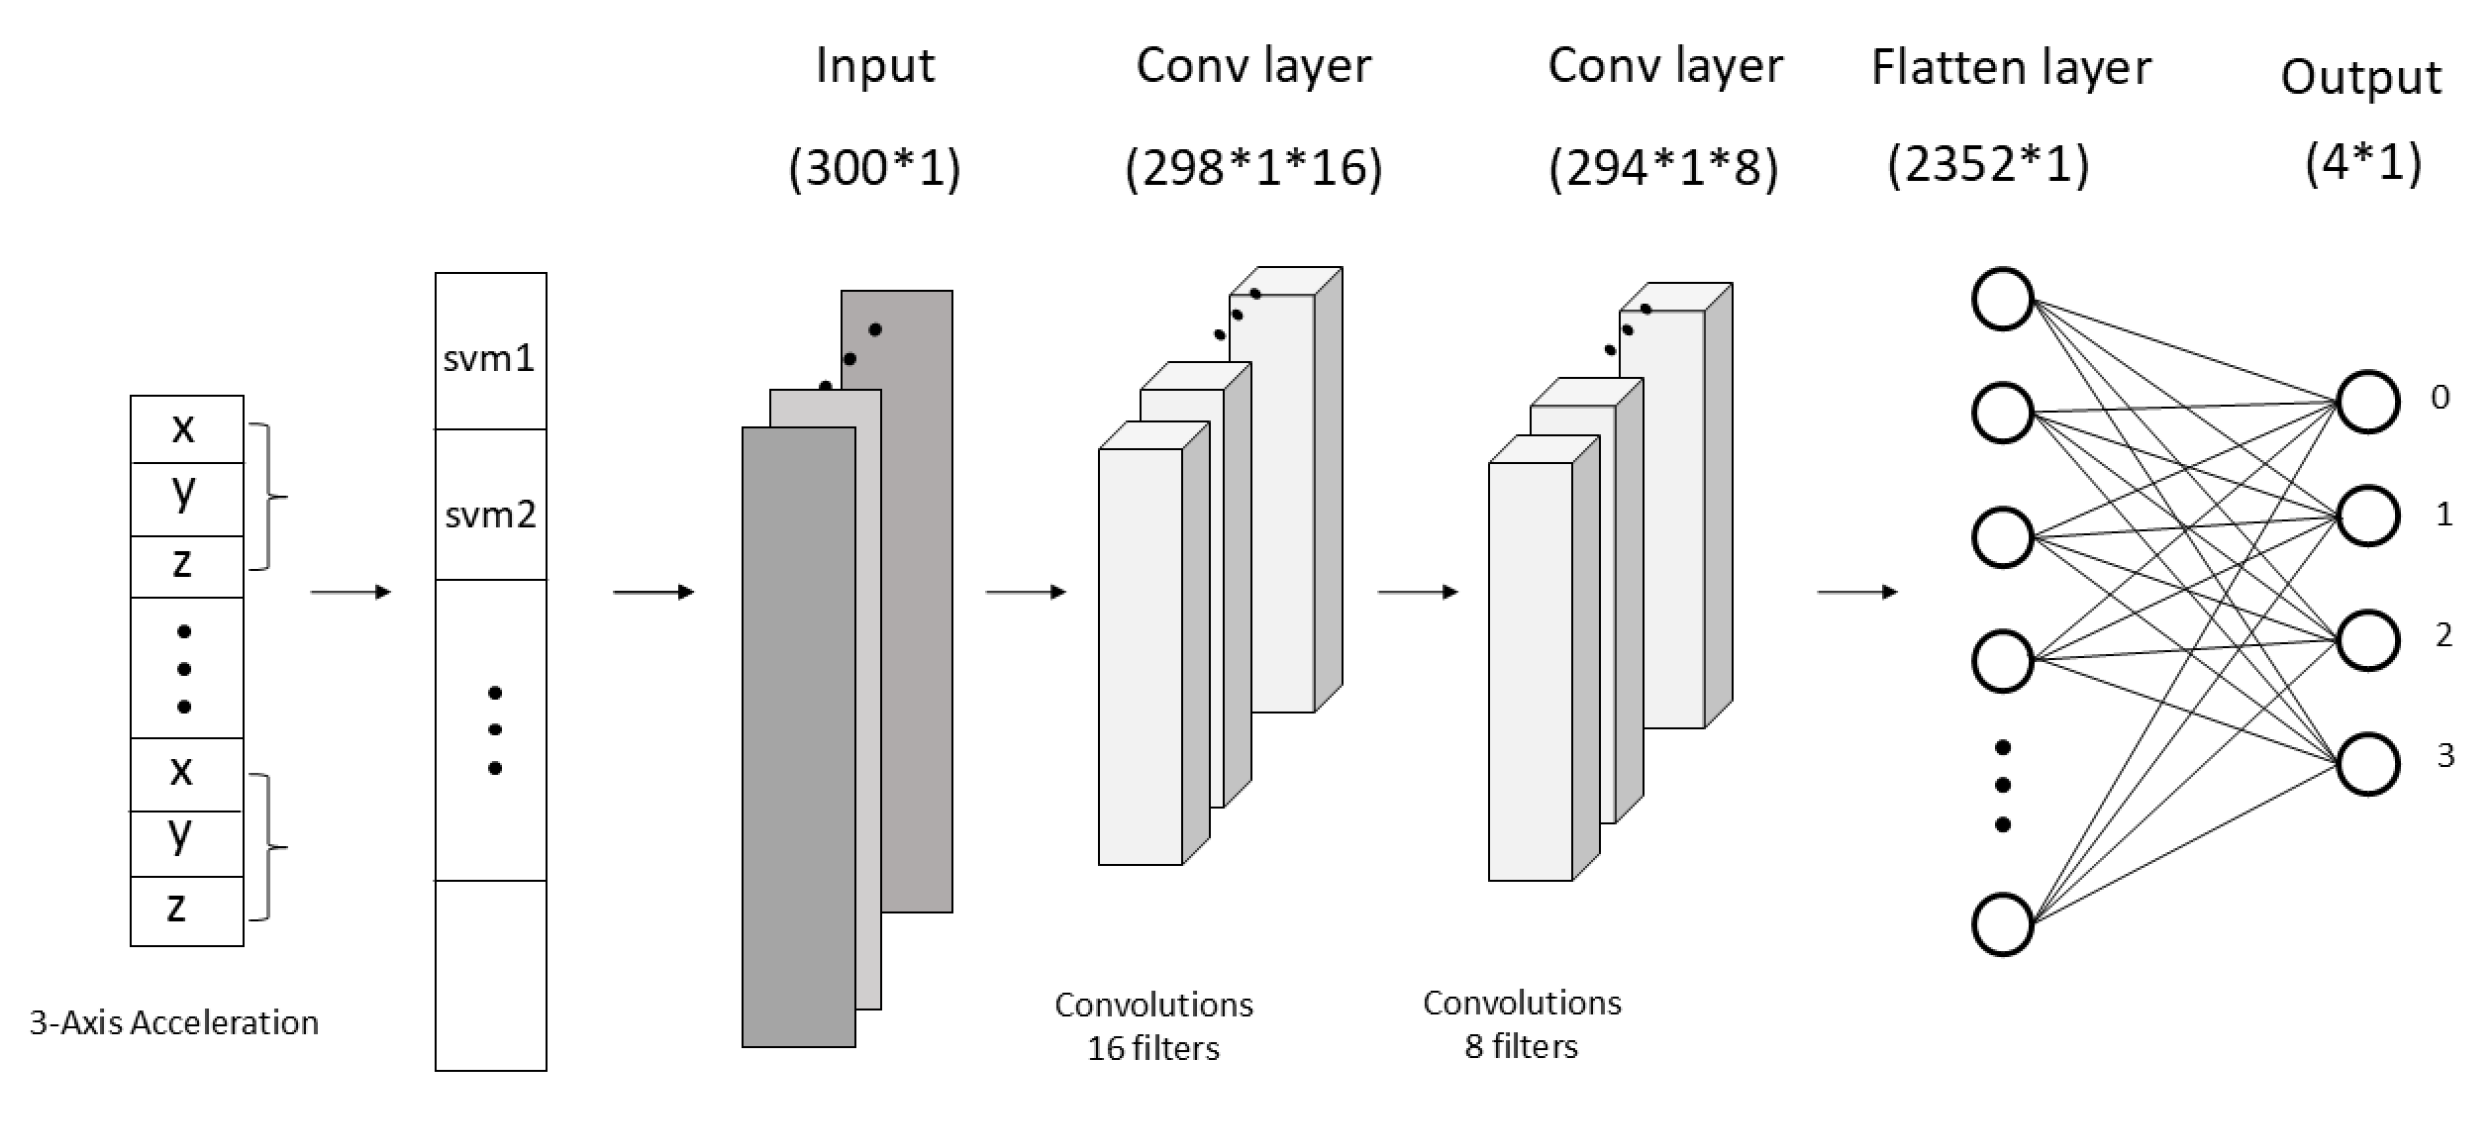
The 1D CNN structures in the time domain and frequency domain are shown in
Figure 2 and
Figure 3, respectively. The dataset collected to train the 1D CNN consisted of 5534 samples. Each sample has three axes of acceleration data (ax, ay, az), which are integrated into one value through SVM transformation, i.e., a size of (300 × 1), corresponding to a time of 6 s per sample. As shown in
Figure 2, the 1D CNN structure in the time domain takes the collected time series data directly as input. These data are then processed within the network layers to perform feature extraction. The hidden layers use the ReLU activation function. The output from the convolutional layers passes through the flatten and dropout layers; finally, the softmax activation function outputs the prediction values corresponding to four behavioral classifications.
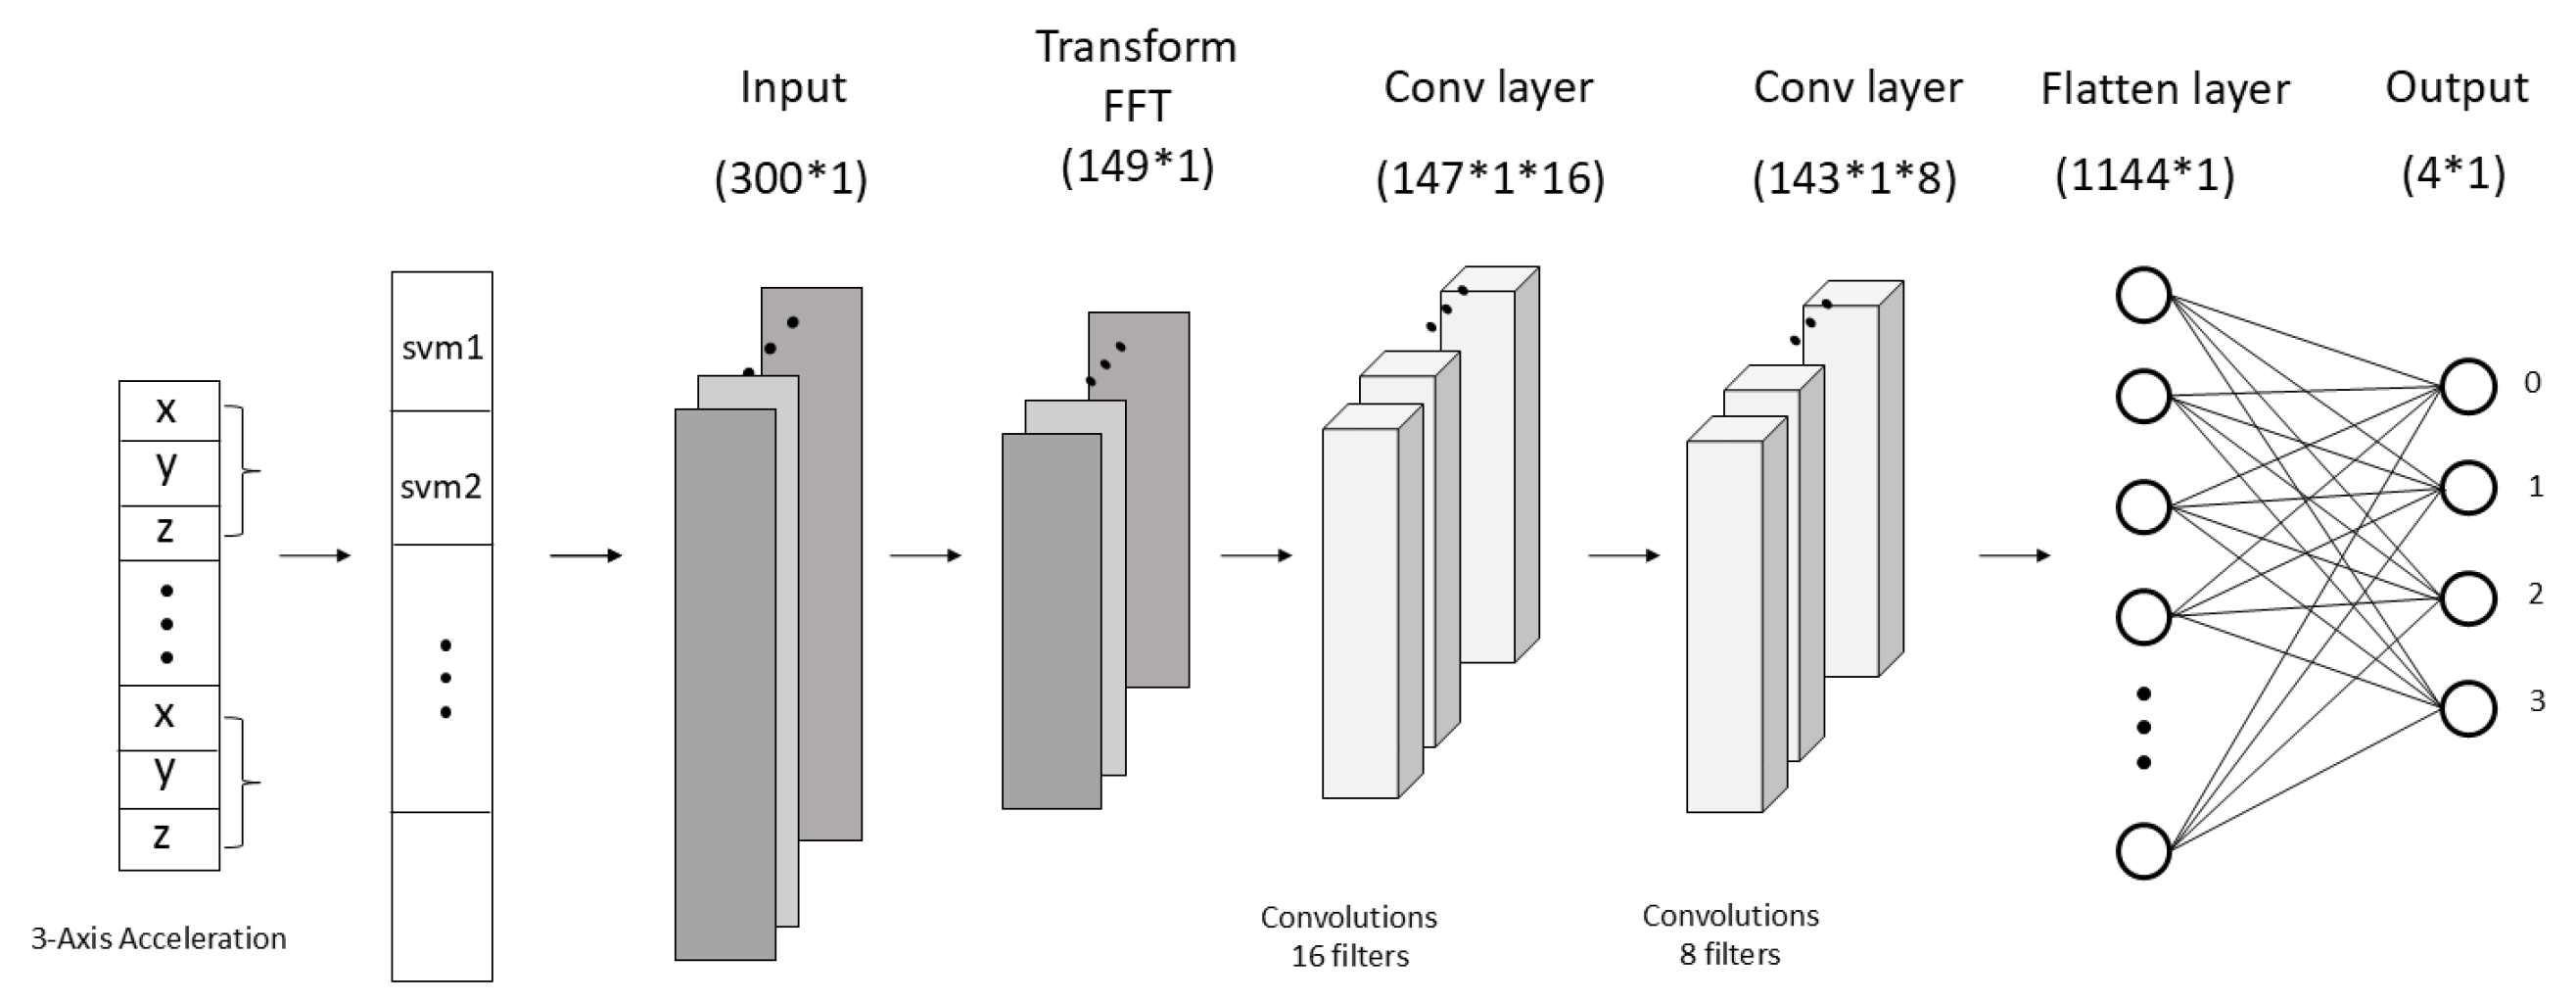
In the frequency domain, the data collected over a period of time are subjected to a fast Fourier transform (FFT) to extract the frequency components. Only the magnitude of these components is used as input to the model, as shown in
Figure 3. As a result, excluding phase and the DC component, which represents the average signal, the remaining data are used as the input for the 1D CNN.
In the frequency domain, the data collected over a given period undergo a fast Fourier transform (FFT) to extract their frequency components, with only the magnitude being used as input for the model in this paper. Consequently, excluding the phase and the DC component, representing the average signal, the remaining data serve as input for the 1D CNN as shown in
Figure 3.
3.3. Real-Time Inference Algorithms on Smartwatches
We developed real-time inference apps using 1D CNN models in the time domain and frequency domain, respectively, and compared their performance. By leveraging TensorFlow Lite’s 16-bit quantization [
16], the 1D CNN model performs efficiently on wearable devices with limited battery capacity.
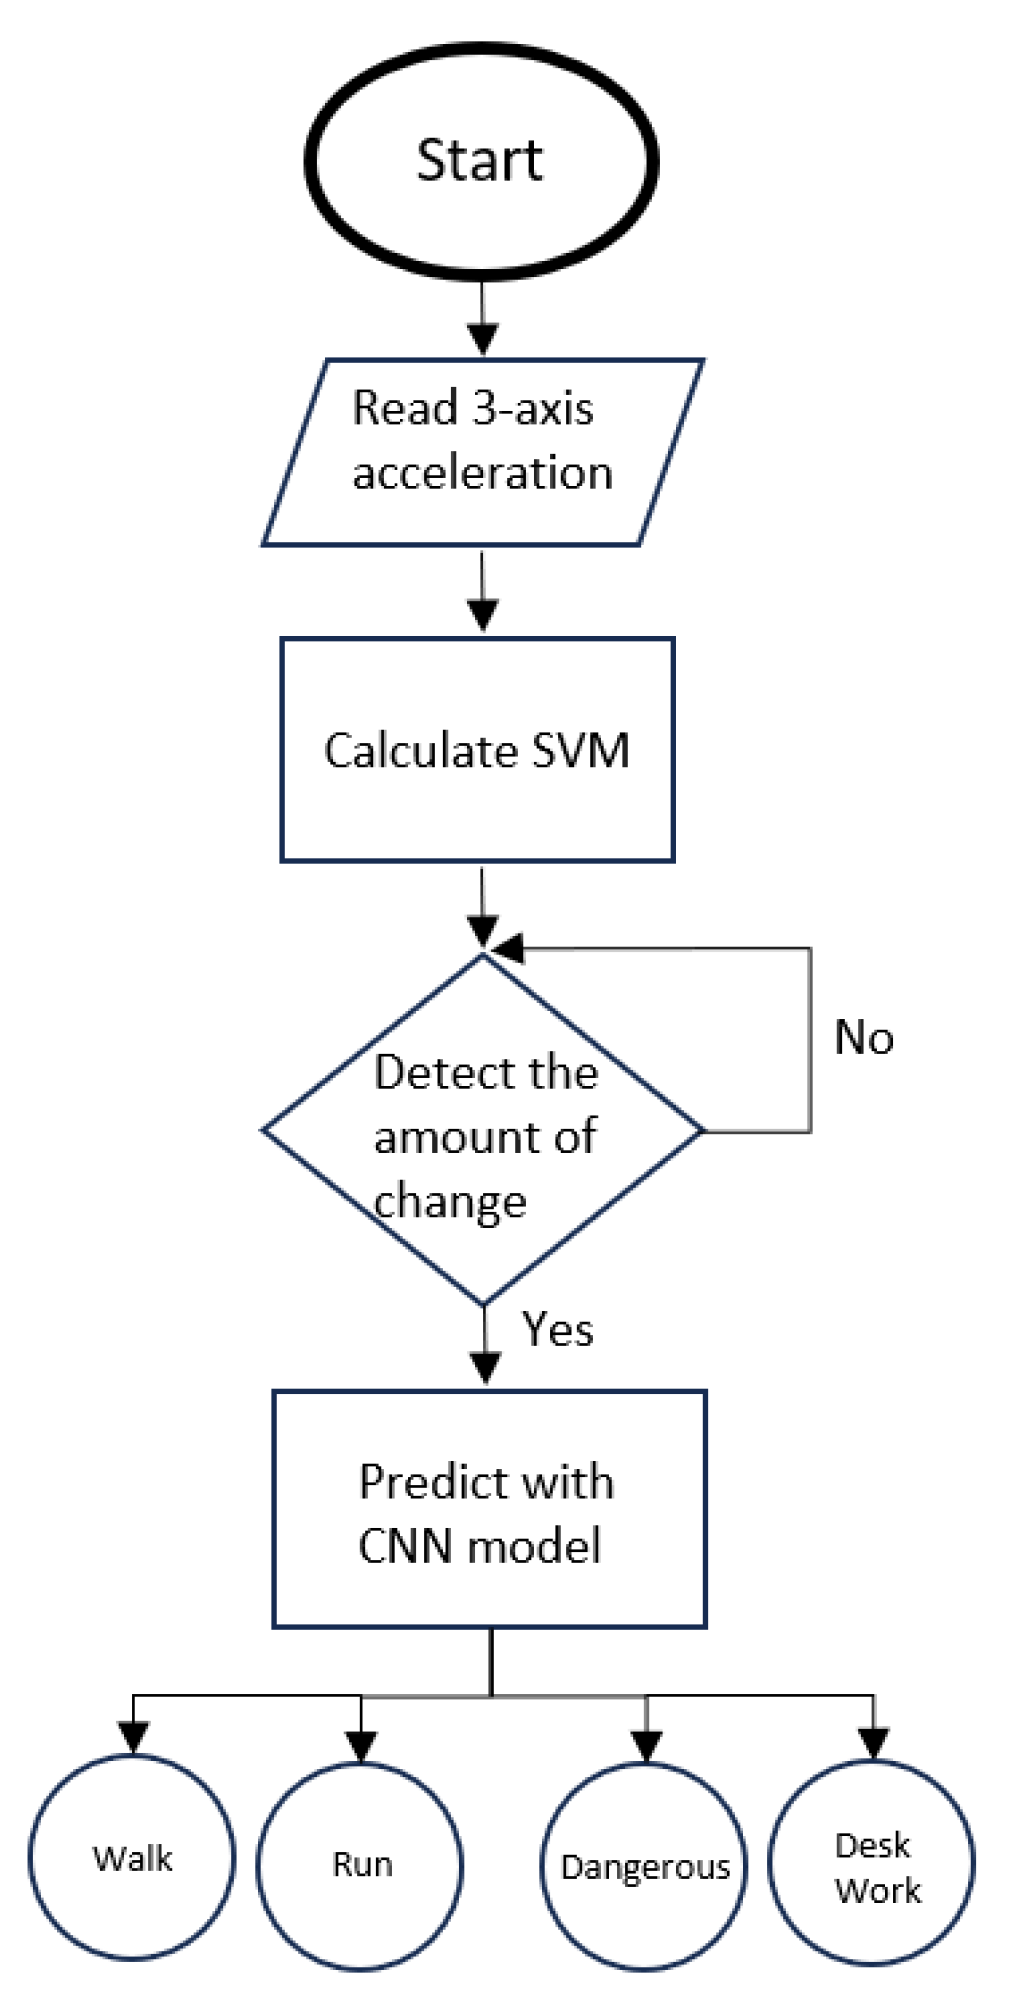
Figure 4 shows the algorithm flowchart for the wearable watch application. The app begins by collecting data from start to stop and computes an SVM (signal vector magnitude) from these data. To detect motion, the accelerometer values are continuously read during operation; however, the issue of low battery power is not addressed in this study. Next, it calculates the amount of change in the SVM to limit unnecessary computation by not running inferences when there is no movement. To do this, we use a sliding window method that calculates the change in recent motion using the sum of the absolute differences between consecutive accelerometer values within the last 150 data points, which corresponds to 3 s. In this paper, a value of 5 is set experimentally; it suggests that there is some movement (not static). The app uses a 1D CNN to infer motion in real time and displays the result on the screen. If no motion is detected, it continues to collect data until further changes occur.
4. Results
Section 4.1 presents the performance evaluation of each model.
Section 4.2 shows the differences in each signal region as a function of the amount of training data. In addition,
Section 4.3 compares the accuracy in each signal region as a function of input time.
Section 4.4 presents the performance evaluation of each model and selects the model that shows the highest accuracy, which is used for the real-time verification test.
4.1. Comparative Experimental Results of Algorithms
First, we evaluated the performance of each model. For machine learning models, The support vector machine (SVM) methods [
17], which used both linear and RBF kernels, were configured with a regularization parameter (C) of 10 and a kernel coefficient (gamma) of 0.001. For the
k-nearest neighbors (
k-NN) model [
18], we opted for a simplistic approach by selecting only a single neighbor (
k = 1) and used the Manhattan distance. The random forest model [
19] was robustly set up with 450 trees and a maximum depth of 20. Lastly, stochastic gradient descent (SGD) [
20] was implemented with a log loss function and an elastic net regularization. The learning rate was set at 0.01 with a maximum iteration count of 3000. These models are generally recognized for their low computational costs, making them particularly suitable for embedded systems due to their lightweight nature. For neural network models, we used a one-dimensional convolutional neural network (1D CNN) from the deep learning models for our analysis. The 1D CNN is favored in time series data analysis among other deep learning models due to its relative computational efficiency.
Table 1 shows that the SGD model shows the greatest improvement in the frequency domain, with about a 34% improvement over the time domain. Most of the models show better results in the frequency domain. This is because the frequency transform creates a sparse representation, which allows for efficient computation by removing or compressing unimportant coefficients [
21]. However, the SVM model with the RBF kernel actually decreased the accuracy in the frequency domain by 28.67%. The RBF kernel is designed for nonlinear classification and works based on the similarity between data points in an infinite number of dimensions. Based on this, it can be seen that the transformed frequency domain data are more intuitive in the time domain data and are advantageous for linear data classification problems.
In both the time and frequency domains, the 1D CNN model shows the highest accuracy. This is because 1D CNN models learn while preserving the temporal order and structure of the input data. Notably, the accuracy in the frequency domain exceeds that in the time domain. This can be explained by the frequency domain’s ability to provide vital information about periodic components and other significant features of time series data, which are less discernible in the time domain [
22].
4.2. Training Results of 1D CNN Based on Data Quantity
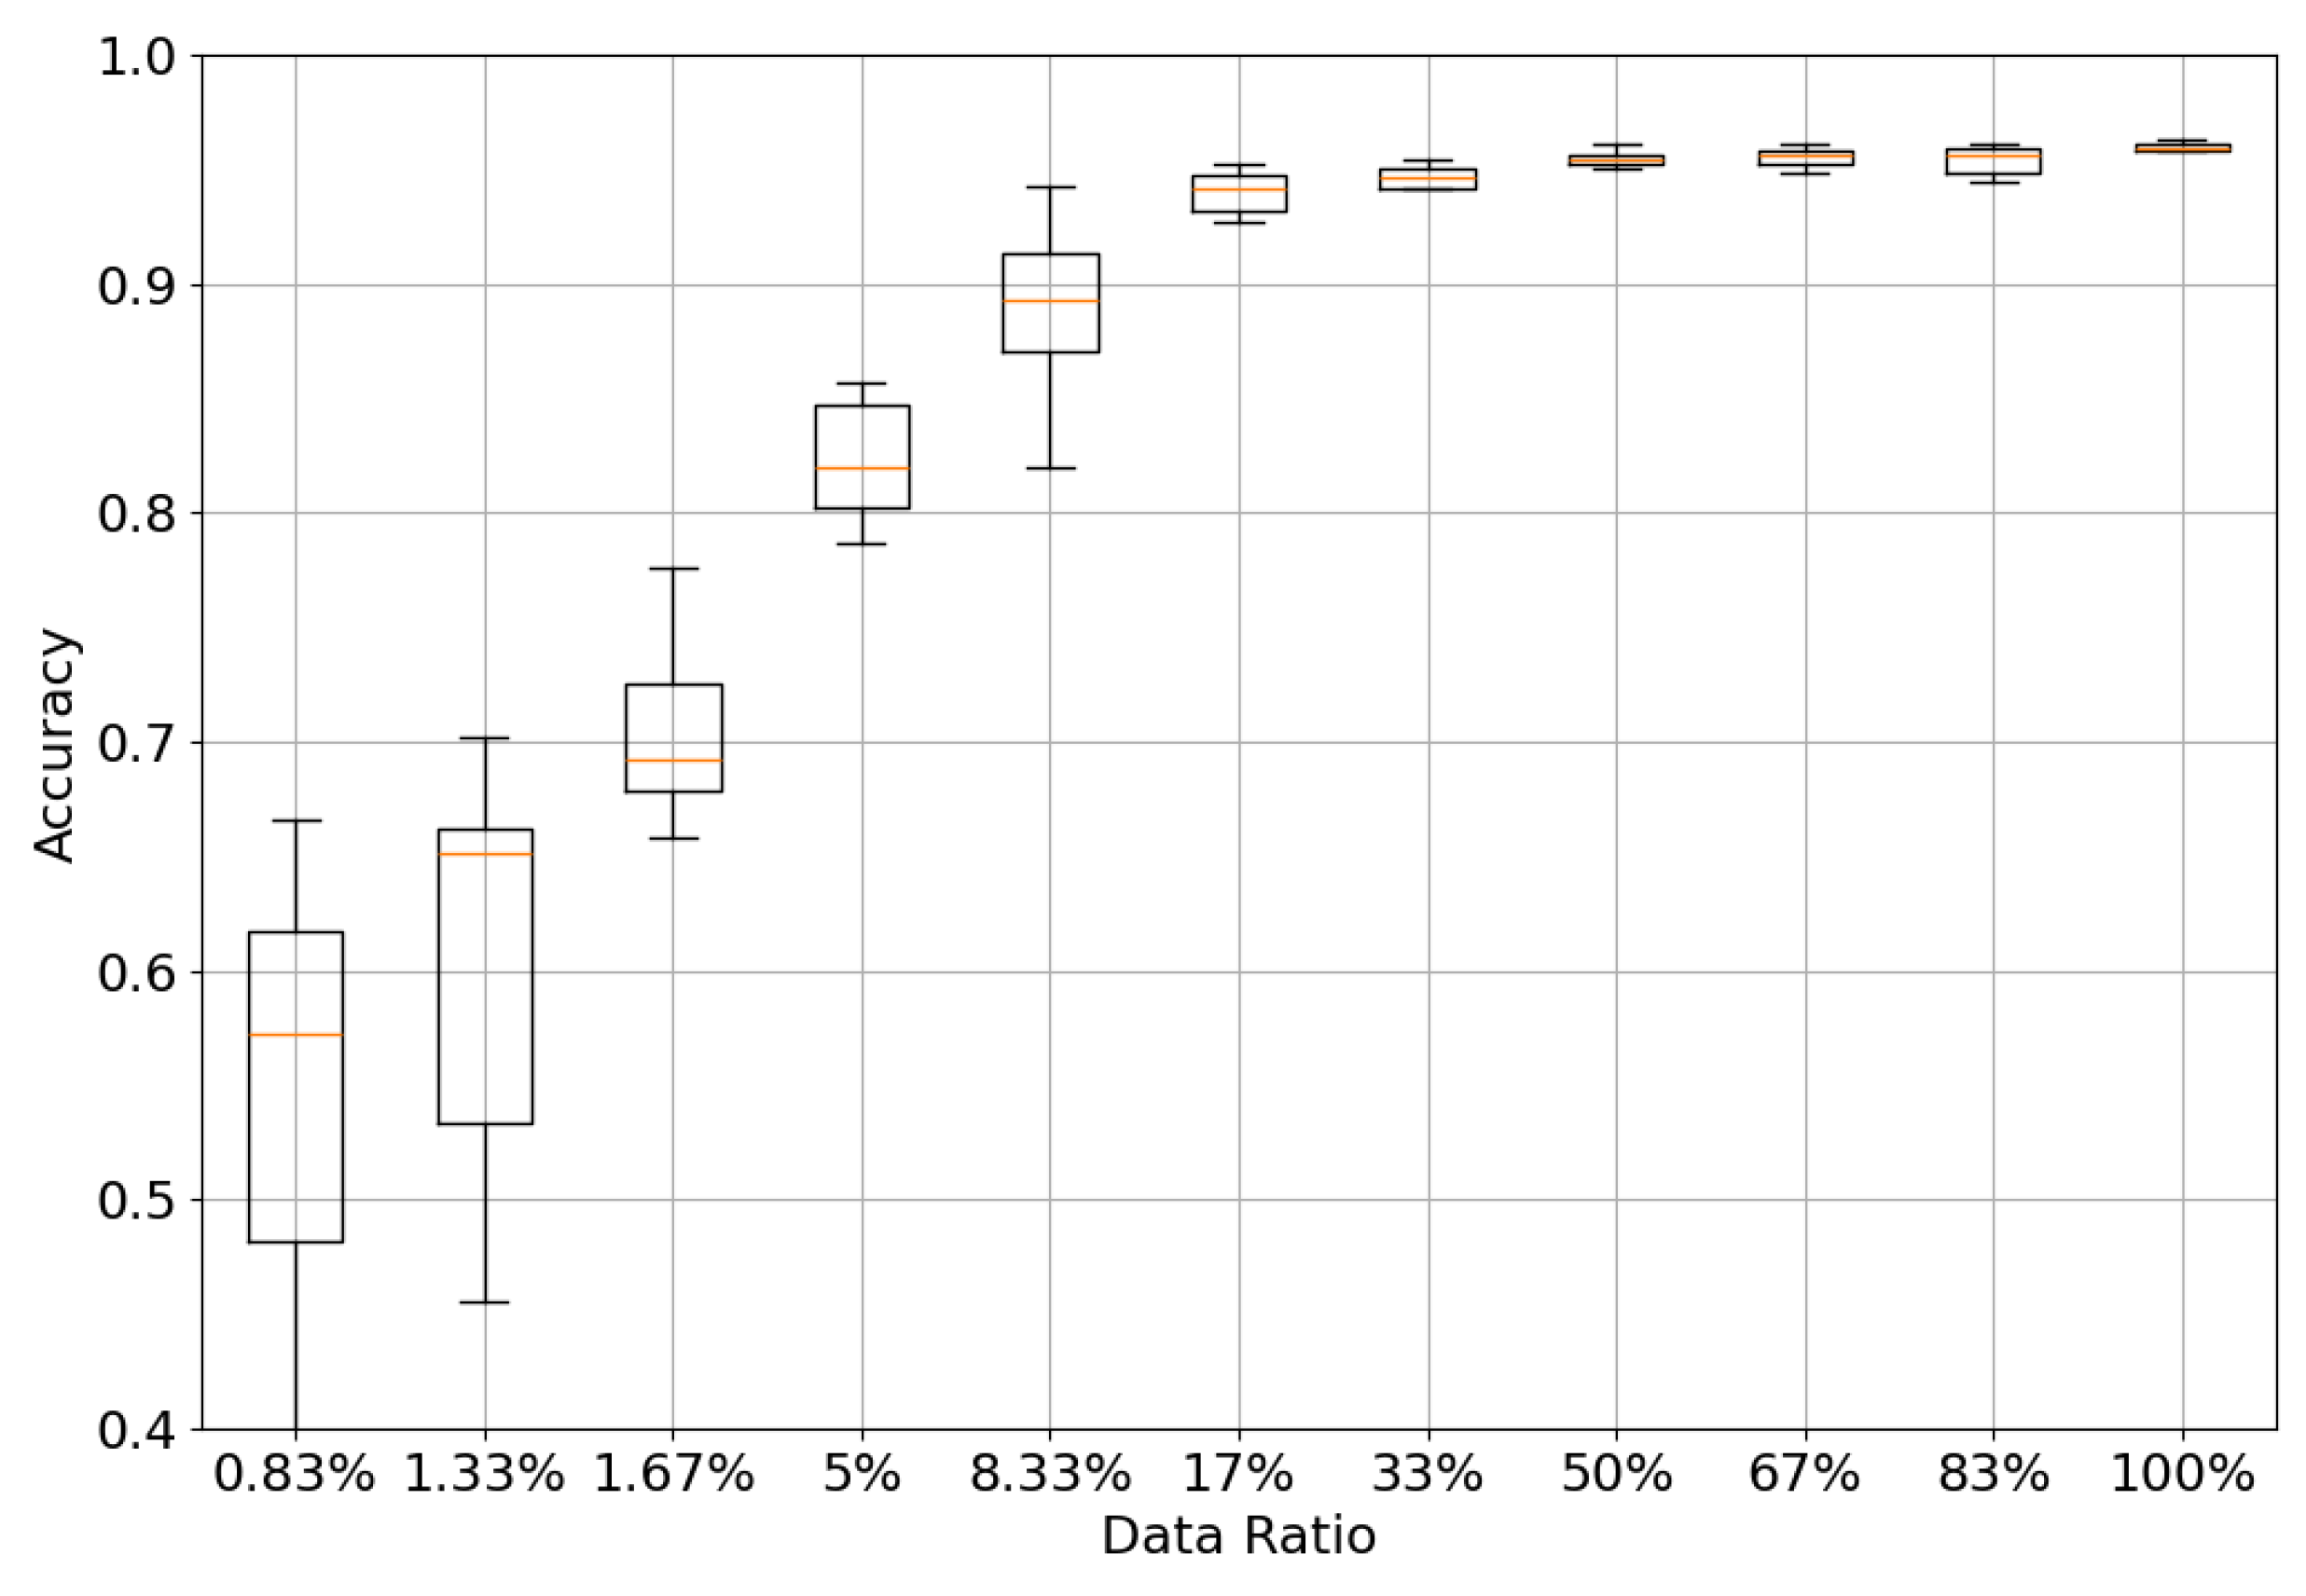
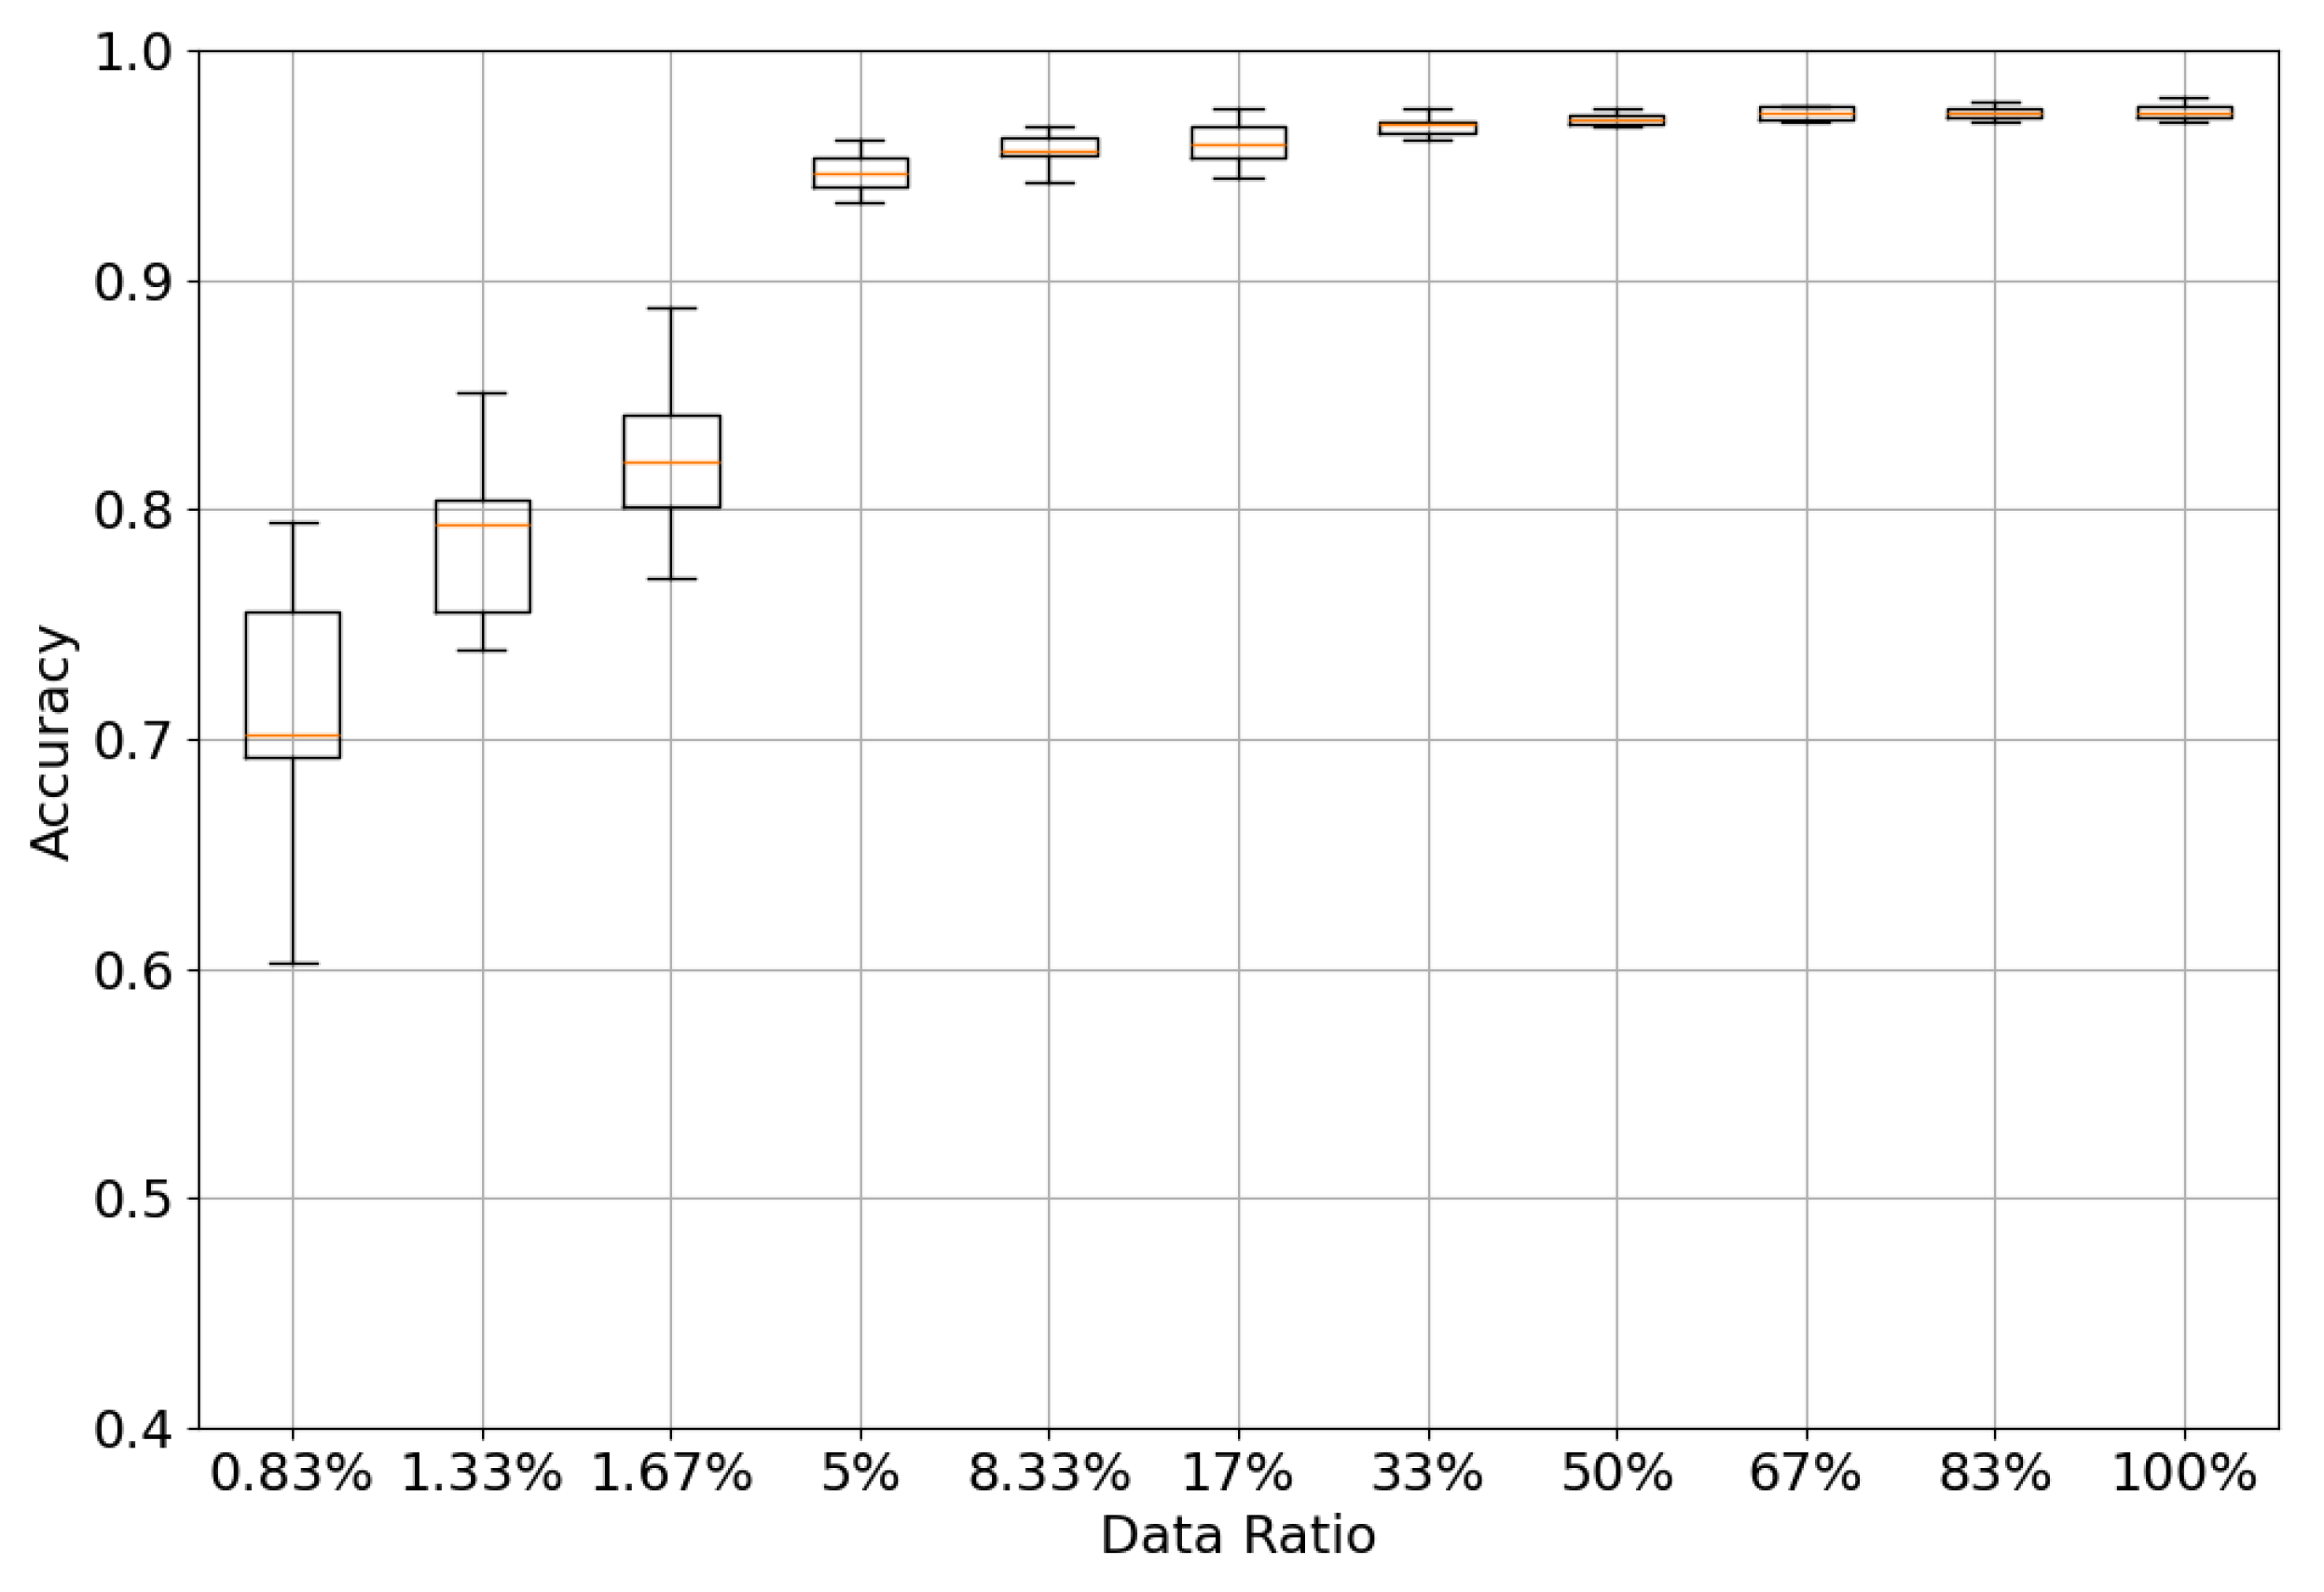
Figure 5 and
Figure 6 show the test results according to the amount of training data in the signal region. Each model was tested 10 times according to the proportion of training data. A ratio of 100% on the rightmost x-axis means a total of 4983 data points, with the same ratios in the four classes. The leftmost x-axis proportion of 0.83% also represents a total of 40 data points with a one-to-one ratio in each class.
In both the time and frequency domains, we can see that the deviation between the maximum and minimum values increases as the amount of training data decreases. At 100% data coverage, the accuracy in the time domain is 95.90% on average, with a minimum of 94.85% and a maximum of 96.88%. In the frequency domain, the average accuracy is 97.19%, with a minimum of 95.77% and a maximum of 97.98%. Each deviation is within about 3%. Gradually, the deviation in accuracy increases from 8.33% of the data in the time domain and 1.67% of the data in the frequency domain. The largest deviations in each domain are 27.02% in the time domain at a rate of 0.83% and 19.12% in the frequency domain at a rate of 0.83%.
4.3. Adjusting Data Input Duration for 1D CNN Training Results
Table 2 shows the results of analyzing the accuracy of the 1D CNN model with varying data input durations.
Table 3 shows the accuracy of only the at-risk movement class among the total behaviors in
Table 2. The classification accuracy heatmap for each behavior is shown in
Figure A1,
Figure A2,
Figure A3,
Figure A4,
Figure A5,
Figure A6,
Figure A7 and
Figure A8. Unlike the initial experiments documented in
Table 1, where the data input duration was fixed at 6 s, this study varied the input durations to 1 s, 2 s, 3 s, and 6 s. The results showed that the accuracy improved in all signal regions as the input time increased. Notably, as shown in
Table 3, even at shorter durations like 2 s, the model maintained an accuracy rate of over 94%, indicating its high applicability in real-time applications that require rapid responses.
4.4. Real-Time Data Inference Validation
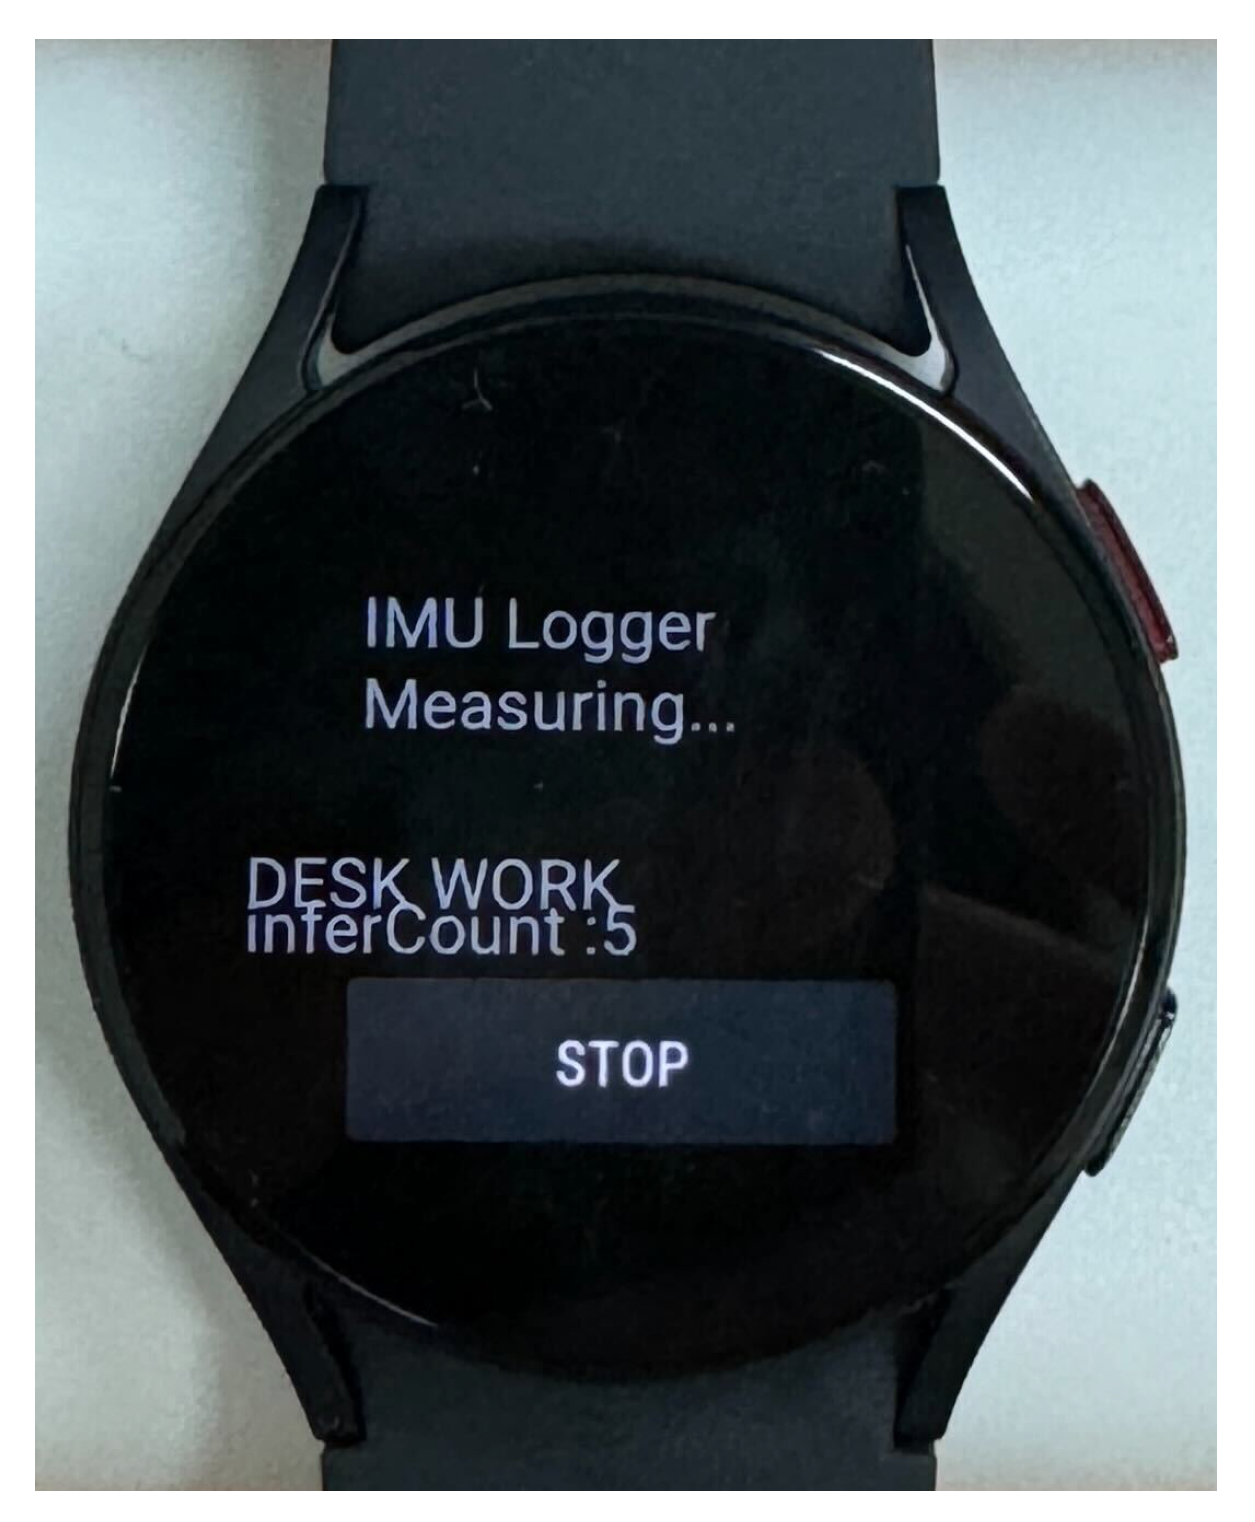
Figure 7 and
Figure 8 show the app inferring based on the 1D CNN model for real-time validation and testing with it. Each action was recognized every 6 s as in the training phase, and each action lasted for 5 min.
Table 4 presents the results of the real-time tests performed with
Figure 7 and
Figure 8. Comparing the results of the simulation of the 1D CNN model trained in
Table 1 with its real-world inference performance using the application, the latter shows a decrease in accuracy in both signal domains. In the training phase, the accuracy was 95.64% in the time domain and 97.46% in the frequency domain, which decreased to 89.25% and 94%, respectively, in the real-time validation. In a real-world wearable environment, irregular movements of the user can affect performance. It has been observed that if a large arm movement is detected during the action, the model misclassifies it as an at-risk movement. This is due to the increased diversity of test data that are continuously input as they pass through the logic of the real-time operating application in
Figure 4. Although the accuracy decreases in both signal domains, the analysis in the frequency domain still performs better in a real-time inference environment. For the classification of at-risk behavior, which had the largest error margin as shown in
Table 4, there were 22 instances where at-risk behavior was misclassified as running in the time domain, but this was reduced to 4 instances in the frequency domain. This shows that frequency domain analysis clearly characterizes certain behaviors.
5. Discussion
We conducted an experiment to detect at-risk situations using IMU sensors for personal safety. Based on the experimental results, we developed a real-time motion detection application and demonstrated its motion recognition accuracy and real-time response capabilities.
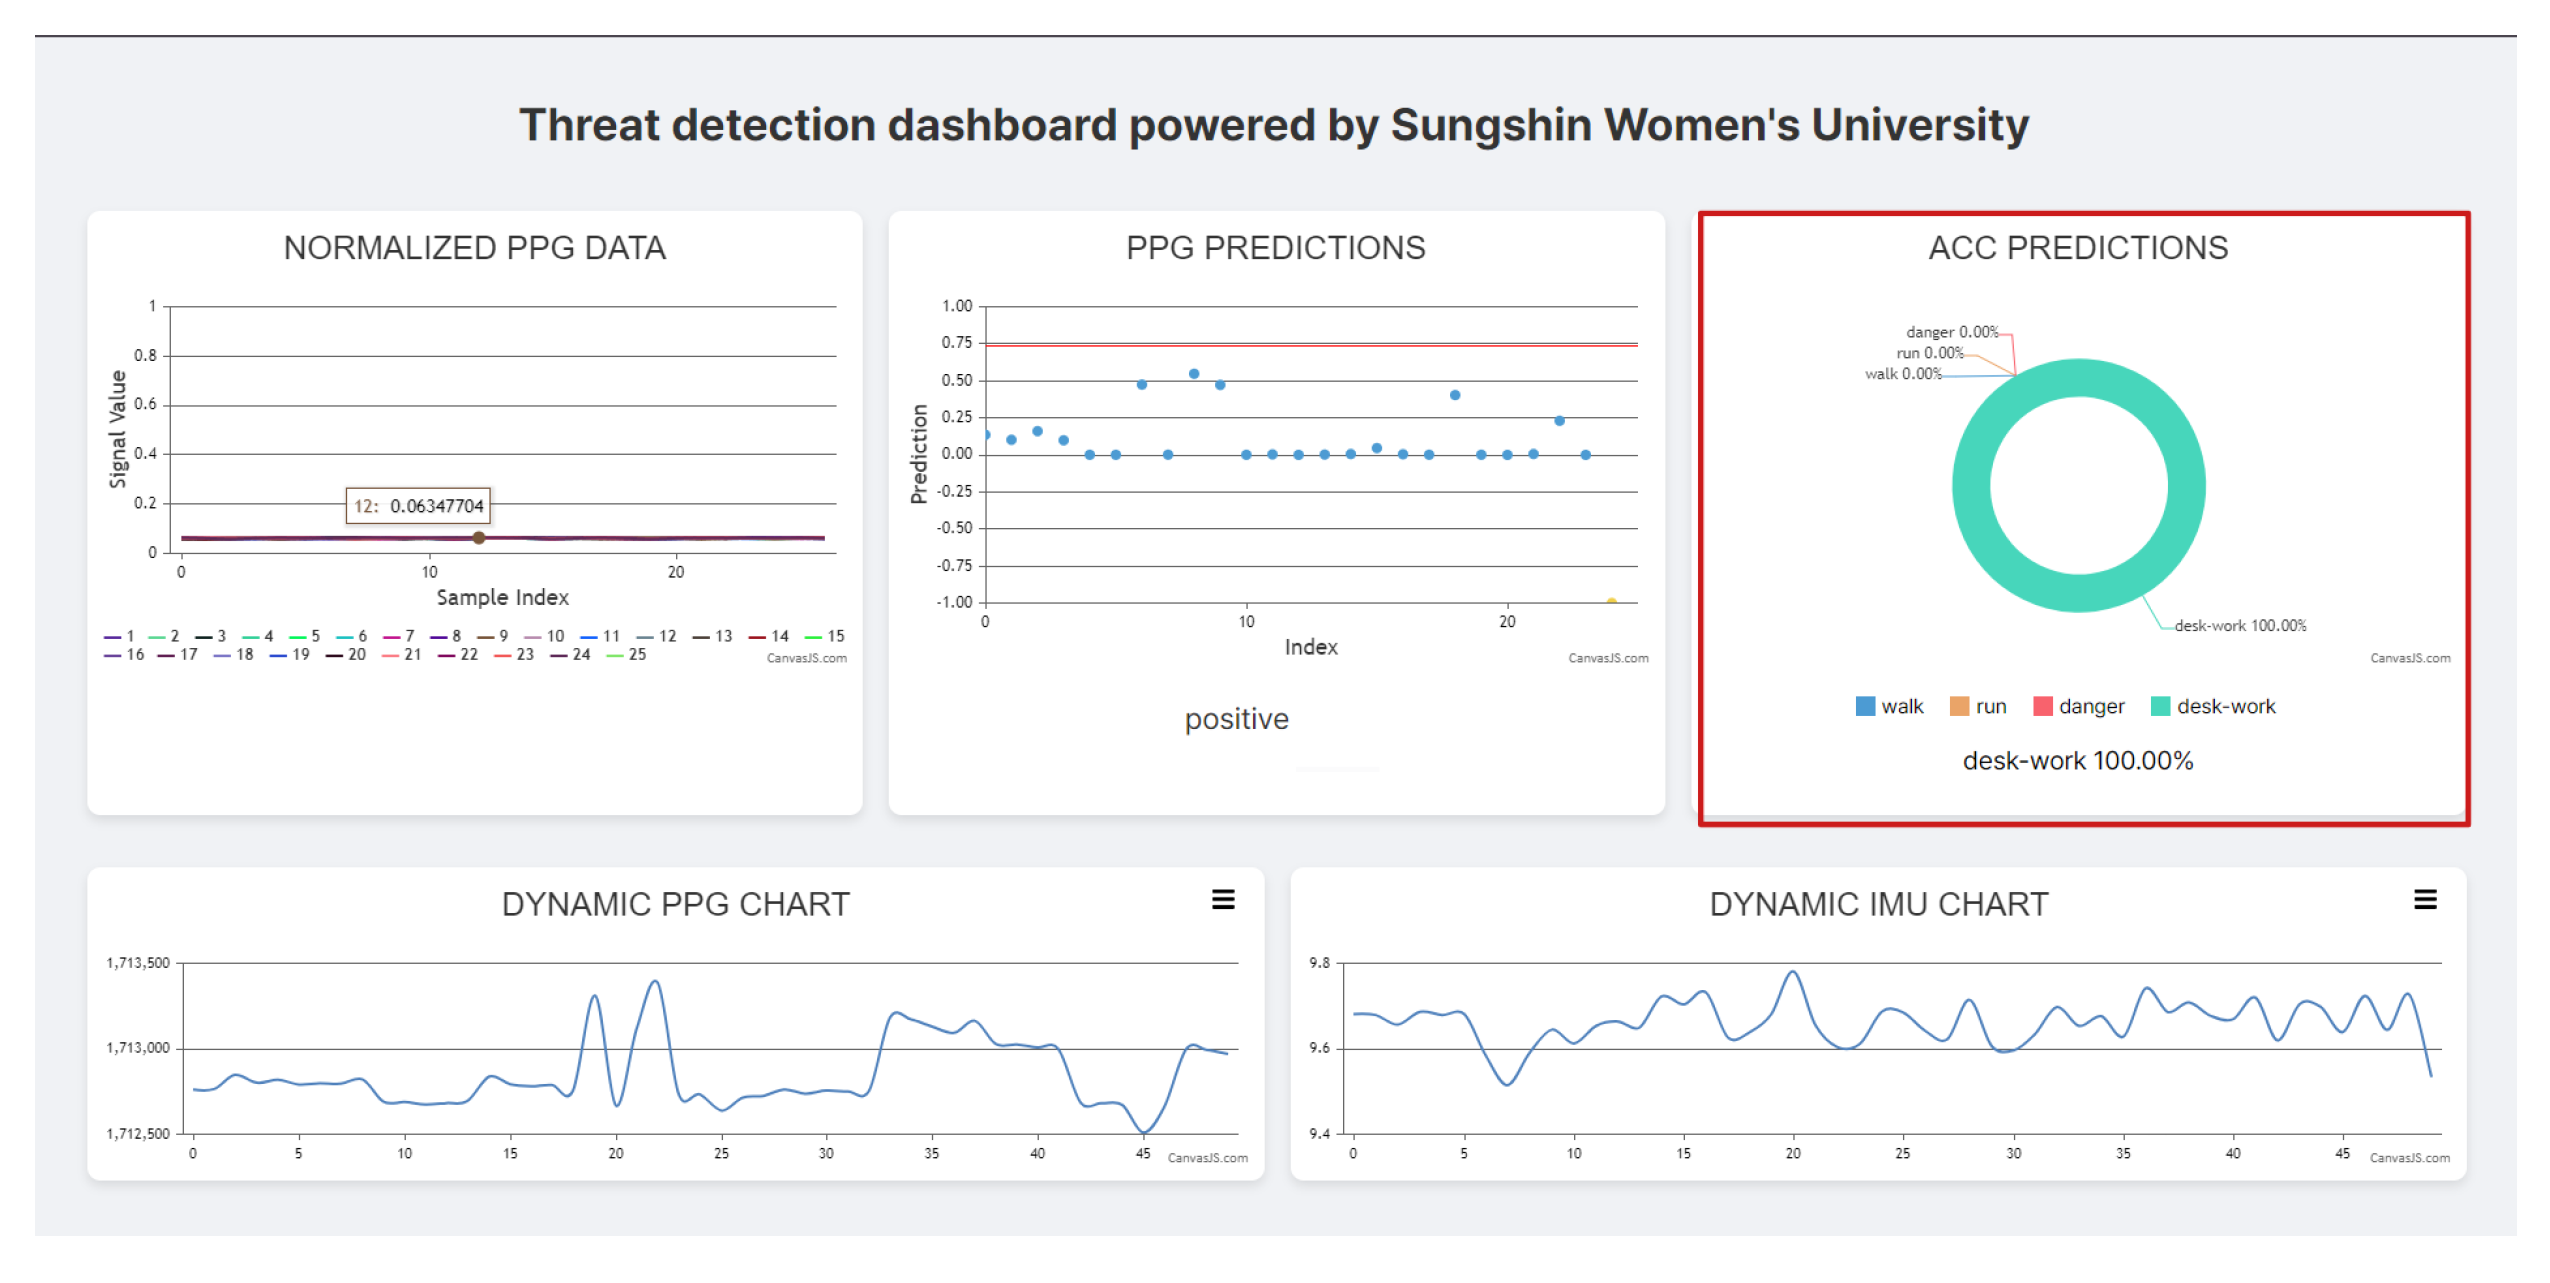
Figure 9 presents an example of a real-time biomonitoring dashboard that combines IMU-based at-risk motion detection with PPG-based health monitoring, which will be developed for future research, although the PPG study is not included in this research. The web-based dashboard visually demonstrates the potential applications of this hazard detection technology. This dashboard can be used to analyze the wearer’s movements in real time and alert police administrators to at-risk situations. This is significant as it allows administrators to monitor the status of the personal safety wearer and take necessary actions, thereby expanding the application scope of personal safety technologies. This study analyzes the raw signals from IMUs by converting them into SVM (signal vector magnitude) and considers using a variety of data sources such as GPS and biometric signals for detecting public safety hazards. The issue of motion misclassification discussed could be addressed by integrating these diverse data sources.
However, the limitations of this study are also clear. In real wearable environments, unexpected large movements caused errors in the model, leading to discrepancies with the simulation results. This issue became more pronounced as the diversity of continuously input data increased. Future research should involve data collection from a variety of environments and situations to overcome these problems. Furthermore, continual optimization of the algorithms is necessary to enhance accuracy, and technology development should prioritize user convenience. Through these efforts, we expect to increase the practical utility of personal safety technologies.
6. Conclusions
We evaluated the efficacy of an application for personal safety watches using time-series analysis based on IMU sensors to classify everyday movements and at-risk situations. We analyzed data that included routine actions such as walking, running, and desk work, as well as at-risk motions like lifting and pushing. Various machine learning models (SVM, SGD, k-NN, random forest, and 1D CNN) were tested for classification accuracy. Notably, the 1D CNN model demonstrated superior performance, especially in analyzing the characteristics of time-series data in the frequency domain. By adjusting the input timing and amount of training data, we maintained high accuracy even with short input times, proving effective for real-time detection of at-risk situations. The developed smartwatch application was tested in real environments, detecting at-risk situations in daily life and providing appropriate alerts. These results not only advance personal safety technology but also highlight the potential for application in various real-time monitoring systems.
Author Contributions
Conceptualization, J.Y.; methodology, H.O. and J.Y.; software, H.O.; validation, H.O. and J.Y.; formal analysis, J.Y.; resources, H.O.; data curation, H.O.; writing—original draft preparation, H.O.; writing—review and editing, H.O. and J.Y.; funding acquisition, J.Y. All authors have read and agreed to the published version of the manuscript.
Funding
This work was supported by the Protection Technology for Socially Vulnerable Individuals program (
www.kipot.or.kr) funded by the Korean National Police Agency (KNPA, Korea) [Project Name: Development of an Integrated Control Platform for Location Tracking of Crime Victim based on Low-Power Hybrid Positioning and Proximity Search Technology/Project Number: RS-2023-00236101].
Institutional Review Board Statement
This study was conducted in accordance with the Declaration of Helsinki and approved by the Institutional Review Board (or Ethics Committee) of Sungshin Women’s University (SSWUIRB-2024-061, approved on 20 November 2024).
Informed Consent Statement
Informed consent was obtained from all subjects involved in the study.
Data Availability Statement
The data presented in this study are available upon reasonable request made to the corresponding author. The data are not publicly available due to privacy restrictions.
Conflicts of Interest
The authors declare no conflicts of interest.
Appendix A
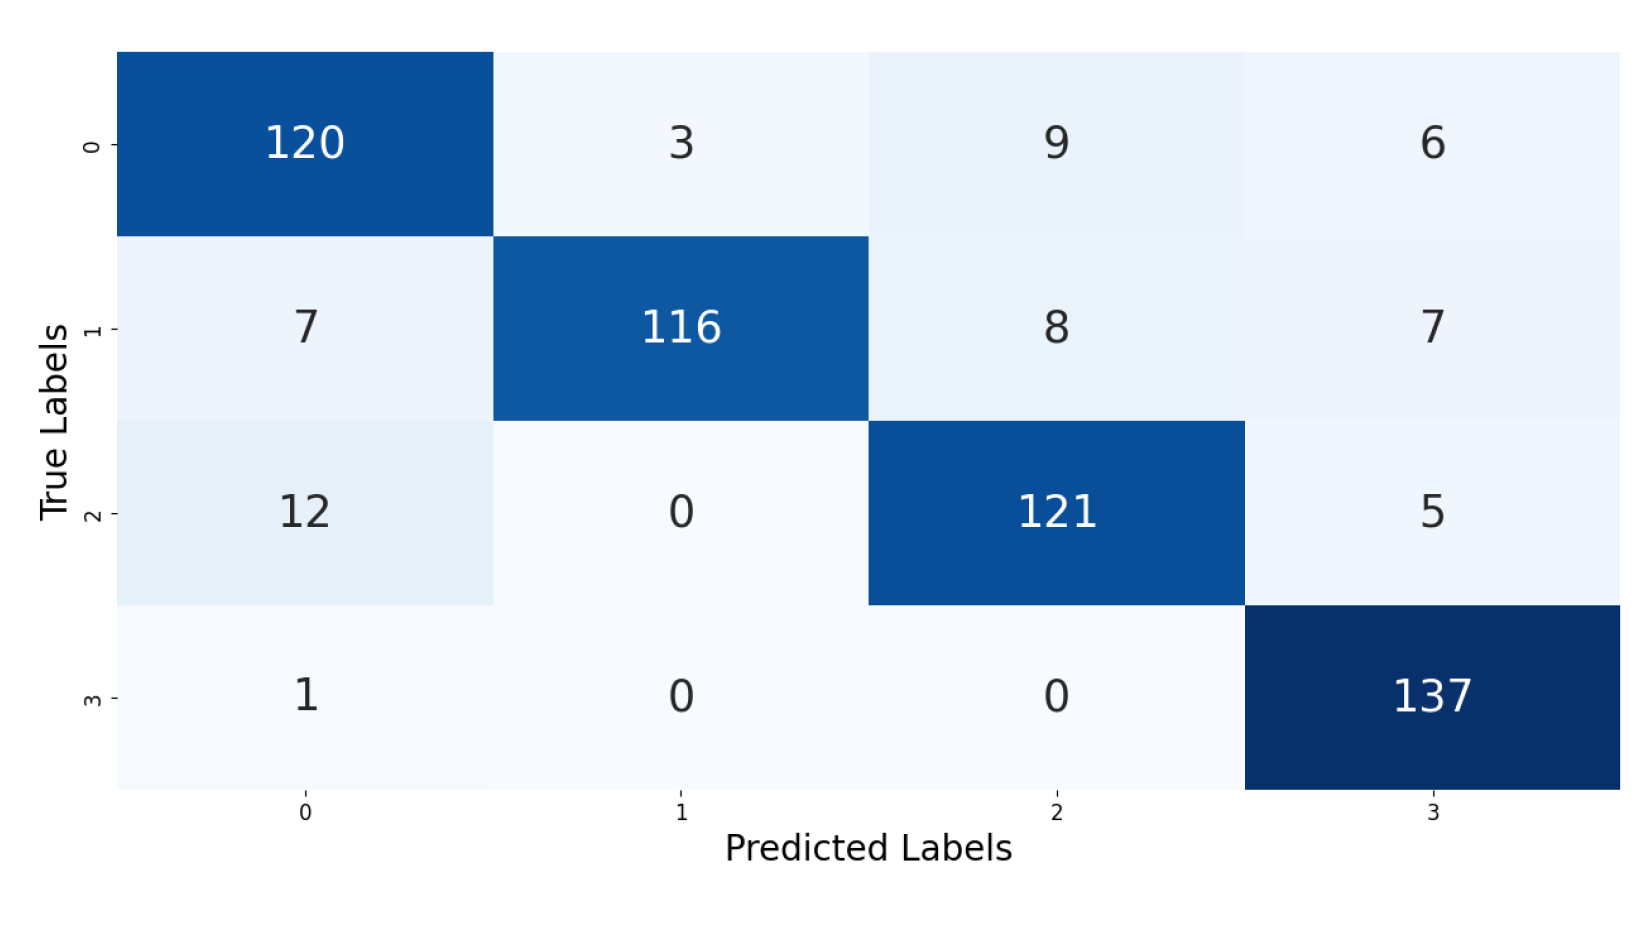
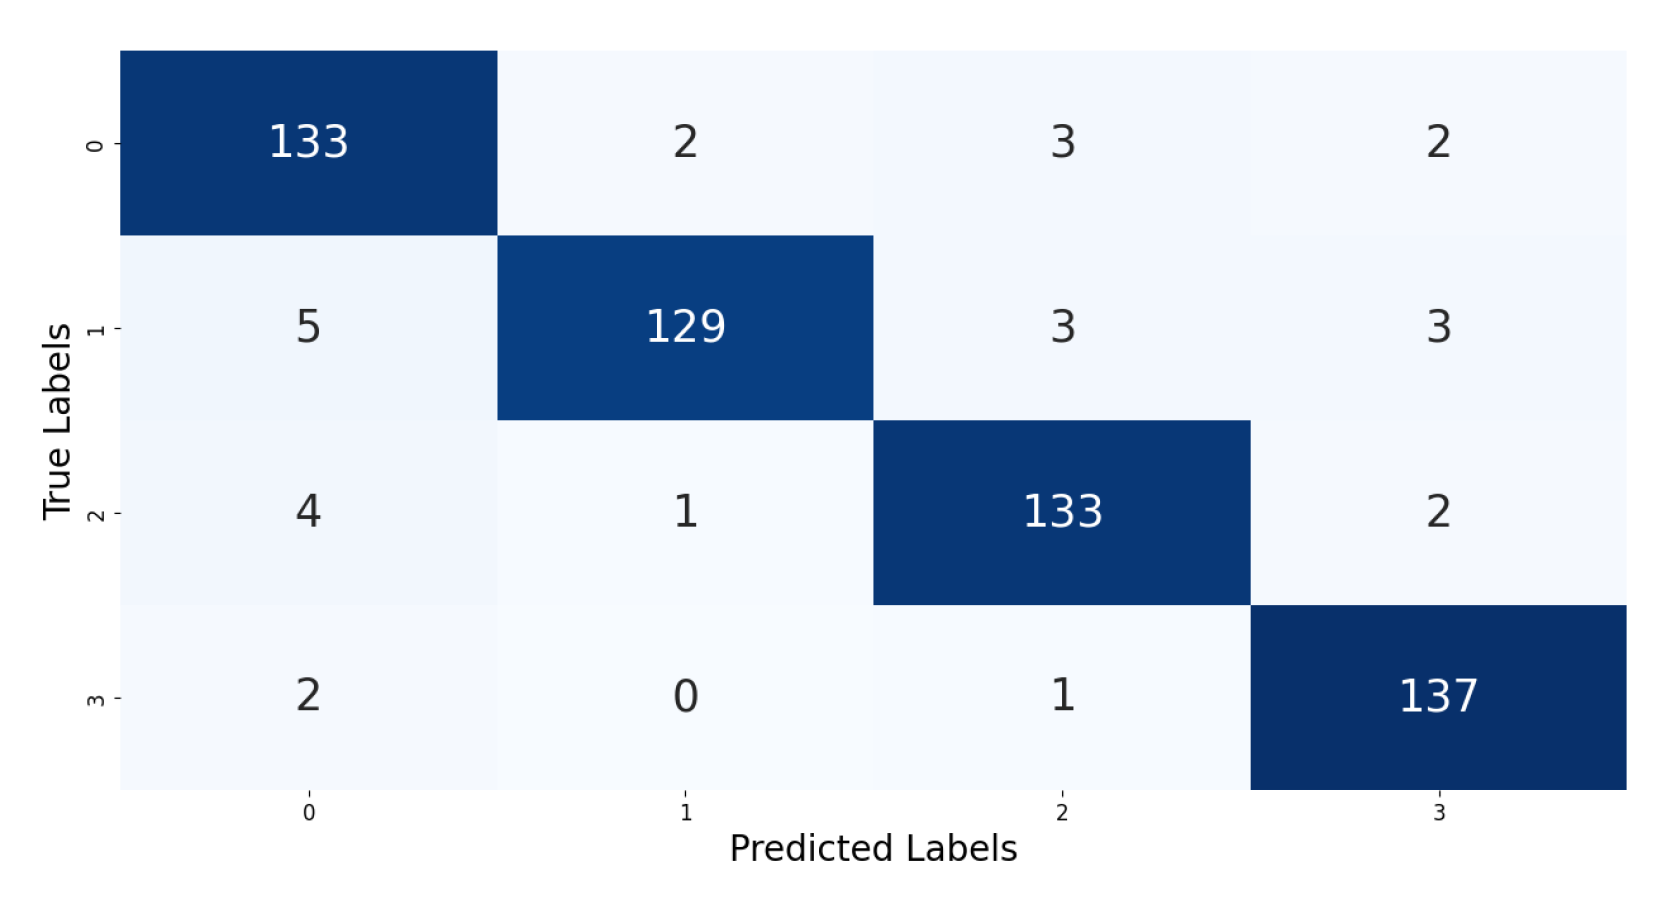
Appendix A.1. Average Accuracy Heatmap of 1D CNN in the Time Domain Based on an Input Interval (0: Walking, 1: Running, 2: At-Risk Movements, 3: Desk Work)
Figure A1.
Based on a 1 s input interval.
Figure A1.
Based on a 1 s input interval.
Figure A2.
Based on a 2 s input interval.
Figure A2.
Based on a 2 s input interval.
Figure A3.
Based on a 3 s input interval.
Figure A3.
Based on a 3 s input interval.
Figure A4.
Based on a 6 s input interval.
Figure A4.
Based on a 6 s input interval.
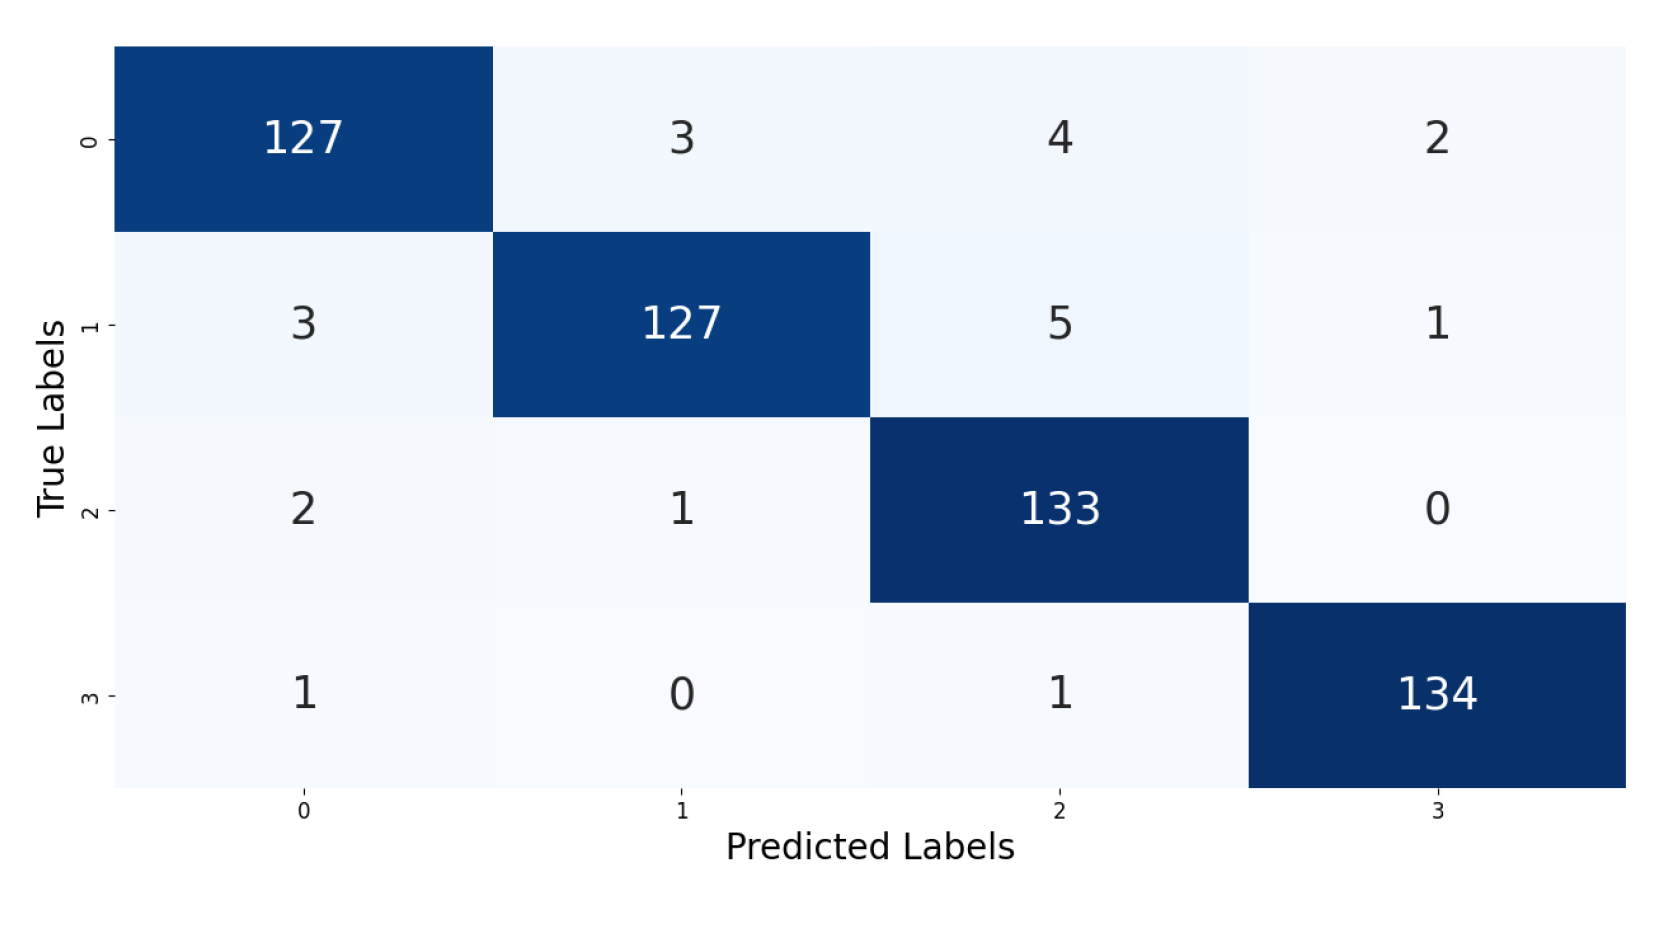
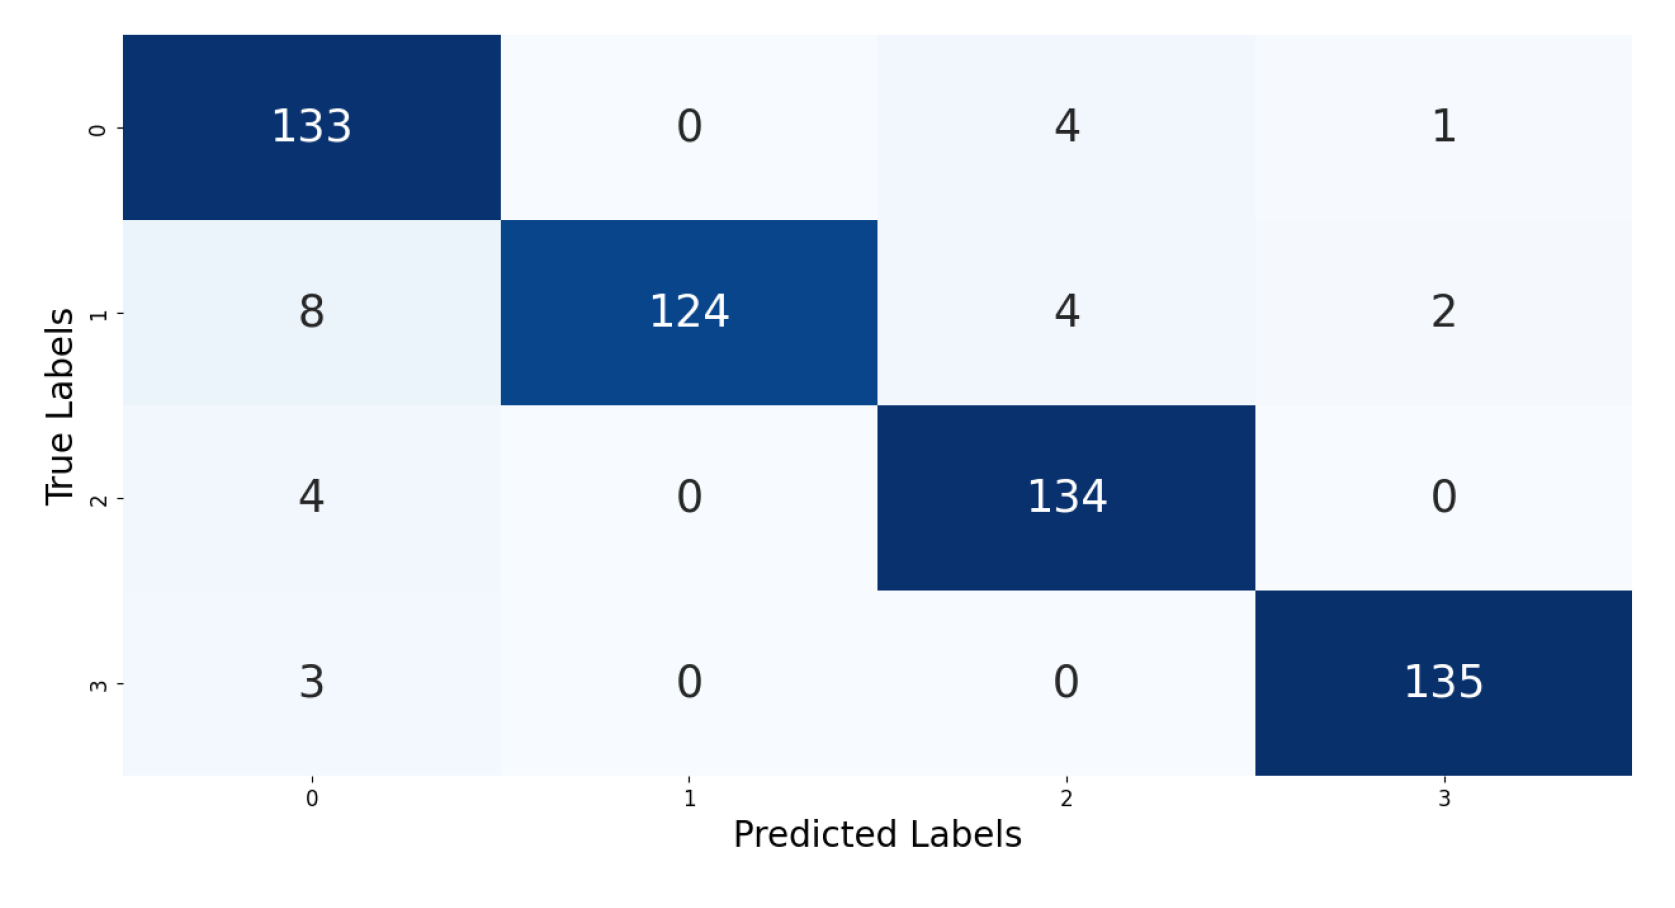
Appendix A.2. Average Accuracy Heatmap of 1D CNN in the Frequency Domain Based on an Input Interval (0: Walking, 1: Running, 2: At-Risk Movements, 3: Desk Work)
Figure A5.
Based on a 1 s input interval.
Figure A5.
Based on a 1 s input interval.
Figure A6.
Based on a 2 s input interval.
Figure A6.
Based on a 2 s input interval.
Figure A7.
Based on a 3 s input interval.
Figure A7.
Based on a 3 s input interval.
Figure A8.
Based on a 6 s input interval.
Figure A8.
Based on a 6 s input interval.
References
- Lee, S.D. A study on improvement direction for personal safety measures for crime victims. Korean J. Vict. 2021, 29, 109–131. [Google Scholar] [CrossRef]
- Lee, J.W. The Current Legal Problems and an Improvement of Personal Protection System of Police for Crime Victim and Witness. Korean J. Vict. 2019, 27, 1–47. [Google Scholar] [CrossRef]
- Lee, J.Y.; Kim, Y.S. A Study on the Perception and Improvement of Police Personal Protection Service of Crime Victims. Korean Assoc. Police Sci. Rev. 2020, 22, 261–288. [Google Scholar] [CrossRef]
- Maglogiannis, I.; Ioannou, C.; Spyroglou, G.; Tsanakas, P. Fall Detection Using Commodity Smart Watch and Smart Phone. In Artificial Intelligence Applications and Innovations; Maglogiannis, I.L., Papadopoulos, H., Sioutas, S., Makris, C., Eds.; Springer: Berlin/Heidelberg, Germany, 2014; pp. 70–78. [Google Scholar]
- Bae, H.W.; Kim, Y.H.; Song, J.W. 3D Indoor Relative Position Estimation Method Based on Multi-agent UWB-IMU Fusion. J. Inst. Control. Robot. Syst. 2023, 29, 1080–1089. [Google Scholar] [CrossRef]
- Khojasteh, S.B.; Villar, J.R.; Chira, C.; González, V.M.; De la Cal, E. Improving fall detection using an on-wrist wearable accelerometer. Sensors 2018, 18, 1350. [Google Scholar] [CrossRef]
- Sharma, S.; Salunke, D.; Haldar, E.; Mandlik, R.; Salke, N. A comprehensive survey on IoT based smart safety devices for women. In Proceedings of the 2022 International Conference on Augmented Intelligence and Sustainable Systems (ICAISS), Trichy, India, 24–26 November 2022; pp. 1101–1109. [Google Scholar]
- Farooq, M.S.; Masooma, A.; Omer, U.; Tehseen, R.; Gilani, S.A.M.; Atal, Z. The Role of IoT in Woman’s Safety: A Systematic Literature Review. IEEE Access. 2023, 11, 69807–69825. [Google Scholar] [CrossRef]
- Kim, J.K.; Lee, K.; Hong, S.G. Detection of important features and comparison of datasets for fall detection based on wrist-wearable devices. Expert Syst. Appl. 2023, 234, 121034. [Google Scholar] [CrossRef]
- Jatesiktat, P.; Ang, W.T. An elderly fall detection using a wrist-worn accelerometer and barometer. In Proceedings of the 39th Annual International Conference of the IEEE Engineering in Medicine and Biology Society (EMBC), Seogwipo, Republic of Korea, 11–15 July 2017; pp. 125–130. [Google Scholar]
- Usmani, S.; Saboor, A.; Haris, M.; Khan, M.A.; Park, H. Latest Research Trends in Fall Detection and Prevention Using Machine Learning: A Systematic Review. Sensors 2021, 21, 5134. [Google Scholar] [CrossRef]
- Sivakumar, P. Real time crime detection using deep learning algorithm. In Proceedings of the 2021 International Conference on System, Computation, Automation and Networking (ICSCAN), Puducherry, India, 30–31 July 2021; Volume 7, pp. 205–214. [Google Scholar]
- Jang, S.; Battulga, L.; Nasridinov, A. Detection of Dangerous Situations using Deep Learning Model with Relational Inference. Multimed. Inf. Syst. 2020, 7, 205–214. [Google Scholar] [CrossRef]
- Ito, C.; Cao, X.; Shuzo, M.; Maeda, E. Application of CNN for Human Activity Recognition with FFT Spectrogram of Acceleration and Gyro Sensors. In Proceedings of the 2018 ACM International Joint Conference and 2018 International Symposium on Pervasive and Ubiquitous Computing and Wearable Computers, Singapore, 8–12 October 2018; pp. 1503–1510. [Google Scholar]
- Lee, S.; Yoon, S.; Cho, H. Human activity recognition from accelerometer data using convolutional neural network. In Proceedings of the 2017 IEEE International Conference on Big Data and Smart Computing (BigComp), Jeju, Republic of Korea, 13–16 February 2017; pp. 131–134. [Google Scholar]
- Post-Training Quantization. Available online: https://ai.google.dev/edge/litert/models/post_training_quantization (accessed on 9 December 2024).
- SVC. Available online: https://scikit-learn.org/1.5/modules/generated/sklearn.svm.SVC.html#sklearn.svm.SVC (accessed on 9 December 2024).
- KNeighborsClassifier. Available online: https://scikit-learn.org/1.5/modules/generated/sklearn.neighbors.KNeighborsClassifier.html (accessed on 9 December 2024).
- RandomForestClassifier. Available online: https://scikit-learn.org/1.5/modules/generated/sklearn.ensemble.RandomForestClassifier.html (accessed on 9 December 2024).
- SGDClassifier. Available online: https://scikit-learn.org/1.5/modules/generated/sklearn.linear_model.SGDClassifier.html (accessed on 9 December 2024).
- Oktar, Y.; Turkan, M. A review of sparsity-based clustering methods. Signal Process. 2018, 148, 20–30. [Google Scholar] [CrossRef]
- Yi, K.; Zhang, Q.; Cao, L.; Wang, S.; Long, G.; Hu, L.; He, H.; Niu, Z.; Fan, W.; Xiong, H. A Survey on Deep Learning based Time Series Analysis with Frequency Transformation. arXiv 2023, arXiv:2302.02173. [Google Scholar]
| Disclaimer/Publisher’s Note: The statements, opinions and data contained in all publications are solely those of the individual author(s) and contributor(s) and not of MDPI and/or the editor(s). MDPI and/or the editor(s) disclaim responsibility for any injury to people or property resulting from any ideas, methods, instructions or products referred to in the content. |
© 2025 by the authors. Licensee MDPI, Basel, Switzerland. This article is an open access article distributed under the terms and conditions of the Creative Commons Attribution (CC BY) license (https://creativecommons.org/licenses/by/4.0/).


