Abstract
Previous EEG studies using graph analysis have revealed altered functional brain networks in children with developmental dyslexia (DD). The influence of sex on these networks within this childhood disorder remains unclear. The study emphasizes the importance of considering sex and individual differences by investigating brain connectivity in 8-year-old children (42 controls and 72 children with DD, half girls) during a task involving low- and high-contrast discrimination of low-spatial frequency illusion (LSFI). Understanding these variations is crucial for elucidating the neurobiological underpinnings of developmental disabilities. Control children showed sex differences in association networks, while children with DD exhibited them in sensorimotor networks. The control boys’ α, β2-frequency functional networks were more integrated than control girls in low-contrast LSFI and in β and γ2-networks in high-contrast LSFI. Boys exhibited stronger anterior connectivity (language, visual motion), while girls showed stronger posterior connectivity (visuospatial, visuomotor attention). There was a notable overlap in association networks between boys and girls. Sex-related differences were pronounced in the γ2 frequency sensorimotor, and association cortical networks exhibited dispersion in both hemispheres for boys and in the left hemisphere for girls (both contrast LSFIs). Boys with DD exhibited hubs in α-sensorimotor networks (low-contrast LSFI) and β1-networks (high-contrast LSFI) in the right brain hemisphere, while girls’ hubs with DD were in the left hemisphere. The differing rates of cortical network maturation between sexes with DD during childhood contribute to variations linked to disruptions in brain network development, even within sensorimotor networks. The study showed that this task enhanced even minor individual differences in functional connectivity characteristics and revealed subtle differences in brain connectivity, especially in children with DD.
1. Introduction
Developmental dyslexia (DD) is a specific learning difficulty primarily affecting reading and writing. Characterized by difficulties with decoding words, spelling, reading fluency, and comprehension, dyslexia is not caused by a lack of intelligence or effort but rather by neurological differences that affect how the brain processes language. Dyslexia, a heritable neurodevelopmental disorder, affects approximately 10% of the population, significantly impacting their acquisition of reading skills. The neurological model of reading [1] emphasizes the crucial role of functional connections between the left angular gyrus and visual processing areas in the occipital and temporal lobes. The angular gyrus links visual information to language representations in areas like Wernicke’s area. In dyslexia, functional networks within brain regions associated with phonological processing (frontal, occipital, angular, inferior temporal, fusiform, supramarginal gyrus, and cerebellum) exhibit significantly reduced activation compared to good readers [2]. Impaired automatic visual word processing is a hallmark of dyslexia, evidenced by functional deficits within the “visual word form area” (VWFA) in the left occipitotemporal system [3]. Disrupted connectivity between the VWFA and crucial language areas in the left frontal and parietal lobes emerges early in reading development, coinciding with deficits in orthographic and phonological processing, highlighting its connections in the development of fluent reading. Difficulties in perceiving letters and their order may stem from abnormal development of magnocellular (M) nerve cells, crucial for rapid letter identification, visual attention, and eye fixations [4]. Evidence for M-cell impairment has been found throughout the visual system, from the retina and lateral geniculate nucleus to the primary visual cortex, and the dorsal “where” pathway, which processes spatial visual information. This impairment destabilizes visual perception, with the severity of M-cell weakness correlating with the severity of reading difficulties. Genetic vulnerabilities may contribute to this abnormality by disrupting the proper migration of cortical neurons during development. Altered visual perception in reading difficulties, specifically a preference for local over global visual processing, suggests a strong link between global-before-local perception and reading proficiency [5].
A recent study suggests that dyslexia may have a different neurological basis in women and men [6]. In healthy men, strong functional connectivity exists between the left angular gyrus and extrastriate occipital and temporal regions during single-word reading [1]. This functional connectivity between the left angular gyrus and the reading network is disrupted in men with DD. Understanding DD requires examining sex differences in neurobiological research. This variation could influence current models of dyslexia and the treatment strategies used for reading difficulties. For instance, global-before-local perceptual training has shown promise in improving reading skills in dyslexic children, and a strong preference for local processing in pre-readers is a significant predictor of future reading difficulties [5]. These findings challenge the traditional view of dyslexia as primarily a left-hemisphere, phonological-based deficit. They highlight the importance of an efficient right-hemisphere network for global visual scene analysis in successful reading acquisition. These new insights into the multifaceted nature of dyslexia have important implications for early identification and development of effective prevention and intervention programs.
A review of recent evidence on sex differences in dyslexia discusses their impact on understanding the brain basis of DD, providing a framework for development of differential neuroanatomical profiles [7]. Over the past two decades, research has produced conflicting results concerning sex differences in the relationship between sex, neurobiology, and behavior. An important question is whether observed differences are attributed to biology (biological sex) or social constructions (social sex). Sex differences are primarily identified through genetic studies that explore the genetic predispositions associated with each sex. Factors such as genes, hormones, and environment influence brain morphology. It remains uncertain whether there are sex differences in the adolescent personalized network or significant individual variations in the spatial distribution of functional networks or their cortical topology.
The brain’s associative networks, including the ventral and dorsal attention networks, as well as frontoparietal networks, are particularly effective in distinguishing the sex of young individuals [8] because sex hormones (progesterone, estrogen) impact connectivity within these networks. Additionally, these networks are connected to mood and fear symptoms linked to psychopathology. Research indicates that females exhibit greater abnormalities in connectivity related to fear symptoms within the frontoparietal, ventral attentional, and default networks. Sex differences in multivariate functional topology patterns are spatially associated with X chromosome gene expression [8,9].
Variation in brain topology among individuals is particularly evident in associative networks (default mode, ventral attention networks). Motor and sensory networks typically demonstrate more consistency among individuals [8]. Group map similarity of functional topology across 17 networks was lowest in the associative network and highest in the sensorimotor network, indicating greater interindividual differences in the topology of associative networks [8]. Regions in the frontoparietal network demonstrate the highest degree of interindividual heterogeneity in various characteristics, which can explain why variability in functional topology in association cortices is closely linked to individual differences in cognitive abilities particularly with reading. While it is impossible to discriminate among individuals solely based on sex, research has shown normative sex differences in the functional topology of adolescent personalized associative networks, suggesting that interindividual differences in functional topology are partially influenced by sex. Individual differences in cognitive abilities during childhood influence adult life’s physical, social, and mental outcomes.
The cortical surface during development reflects the functional reorganization of the brain. Determining changes in the topology of functional brain networks in the growing cortex of children aged 9 and 10 provides insight into their individual variation and differences in cognitive abilities before the crucial transition to adolescence [7,10]. These variations are best predicted by the frontoparietal and ventral attentional networks, while the visual and somatomotor networks have the lowest predictive accuracy. Considering the degree of maturation of the central nervous system and age-related functional changes, even in normally developed children, it is essential to establish the relationship between a child’s age and the frequency functional networks (α, θ, and δ rhythms of the EEG, most clearly reflecting age-related changes in brain activity), as well as the peculiarities of the development of reading abilities in childhood. In children with learning disabilities, high θ and low α frequency activities suggest a delay in the development of cognitive neural networks [11,12]. However, the effect of increased effort on discriminating a more difficult task on the activity of stimulus-related brain regions is poorly understood. In achieving fully automated multisensory integration, behavioral assessments are not as sensitive as they could be [13]. There is a growing search for new, more effective methods to modify the brain’s neural networks and promote the development of reading abilities.
In our previous study [14], we characterized functional brain networks using graph theory, analyzing their small-world propensity (SWP, ϕ). SWP quantifies a network’s efficiency in transferring information [15], reflecting a balance between high clustering (strong local connections) and short path lengths (fast global communication). This analysis revealed differences in network integration and segregation of functional networks between a control group of children and one with DD [14]. By focusing on tasks that highlight deficits in the selection of visual stimuli (low-spatial-frequency illusion), the research explored visual perception problems using a functional analysis method that identifies the deactivation or suppression of certain brain centers and their connections within networks affected by DD. During contrast discrimination of this specific visual task, the control group exhibited greater segregation in the δ, α, β2 (low-contrast illusion), and θ, γ1 networks (high-contrast illusion), as well as greater integration in the γ2 network (both contrasts) compared to children with DD. The present study investigates interindividual variations in children with DD and their typically developing peers, focusing on changes in functional brain networks related to sex in 8- to 9-year-old children This study also explores the functional brain connectivity in children with DD, using EEG measurements during specific visual task. Unsolved issues in DD include the research of possible pathological changes in weak and strong connections within functional networks during this specific visual task and their impact on the overall functioning of the investigated neural network influenced by sex and inter-individual variations. The challenges of interpreting results within the specific context of this visual task should be carefully balanced with the need for robust methods to characterize functional networks, identify key hubs, and analyze their interactions within the network.
The main research questions concern the following: (i) whether brain network analysis can provide new insights into the neurophysiological origins of DD; (ii) how specific tasks affect the activity of neural frequency networks in children within a particular age group; (iii) the extent to which the deficits observed in DD can be attributed to variations in the strength and connectivity of different brain regions, particularly hubs within these networks; (iv) the relationship between the functional visual network and the oscillatory activity of specific local brain hubs.
The study aims to study the functional brain connectivity in children with DD using graph theory and the small-world propensity technique. Our goals are to provide an objective interpretation of the findings, demonstrate the potential and limitations of these techniques, and determine whether any significant variability in brain networks among control children and those with DD is associated with a specific experimental paradigm.
We hypothesize the following: (1) compared to typically developing children (normolexics), children with DD have different “small-world properties” and weaker connections in various frequency sub-networks which may vary by sex; (2) the personalized frequency functional networks within separate sex groups during the experimental task will not change if they do not associate with the age-related functional brain organization; (3) rather, the changes of specific local hubs in certain frequency networks will be related to the brain’s functional network during the task, if the functional networks of children with DD differ from those of normolexics.
2. Materials and Methods
2.1. Contrast Discrimination of Low-Spatial-Frequency Illusions
The experimental task was a contrast discrimination of low-spatial-frequency (LSF) illusions (Figure S1). The illusions were flickering sinusoidal gratings with a spatial frequency of two cycles per degree, (2 cpd) and a high temporal frequency of counter-phase flicker of 15 Hz. The ‘frequency-doubling’ illusion effect, where a low-spatial-frequency sinusoidal grating appears to have twice its actual spatial frequency, arises when the grating is counter-phase flickered at a high temporal frequency. The experimental task investigated how the perceived spatial frequency of sinusoidal gratings changes when presented at two different contrast levels. The detection threshold was determined in a previous psychophysical procedure with a two-alternative forced-choice design [16,17,18]. The perceived contrasts of low-spatial-frequency (LSF) illusions were evaluated using stimuli presented at six and twelve times the respective detection threshold. The low- and high-contrast conditions of the discrimination task were presented in 40 realizations (20 realizations per condition) in a pseudorandomized sequence with an interstimulus interval of 1.5–3.5 s. These stimuli maximally activate magnocellular cells [19,20]. Each realization begins with a fixation white cross for 100 ms on a gray background. After 200 ms, the illusion appears for 200 ms in the center of a square noise field (11 cm × 11 cm) on a screen [14] (60 Hz refresh rate, pixels of 1920 × 1080), located at a distance of 210 cm. The child discriminates the two contrast illusions by pressing a button with the left hand for a low-contrast and with the right hand for a high-contrast illusion. A short beep signaled the end of each realization. Correct responses and corresponding reaction times were included in the statistics, excluding reaction times less than 0.100 s and greater than 1.5 s as outliers. The numbers of correct trials for each condition were 525 for controls and 772 for children with DD in the LSF illusion.
2.2. Selection of Groups
All children underwent a neuropsychological examination [21] to ensure their eligibility for participation in the quantitative cross-sectional study. Data were for the group with DD (n = 72; 52 boys and 20 girls; mean age ± s.d., 103 ± 7 months) and the control group (normolexics: n = 42; 26 boys and 16 girls; mean age ± s.d., 101 ± 6 months) of second-graders. Children had normal or corrected-to-normal vision, without neurological and psychological deficits, were Bulgarian speakers as their first language, and were right-handed [22].
2.3. Instruments
The dyslexic group comprised children with reading difficulties, characterized by below-average performance in reading speed or accuracy on both the DDE-2 battery and the “Reading Abilities” test ([23,24,25], Table S1). These children scored more than one standard deviation below the mean of age-matched standardized controls. The control group consisted of age-matched children from the same socio-demographic background as the group with DD. The children demonstrated typical reading performance, with within-norm scores in reading speed and accuracy on both the DDE-2 and “Reading Abilities” tests. No child in the control group had a diagnosis of dyslexia or co-occurring language disorders.
A standardized test battery, DDE-2 for the assessment of developmental dyslexia [23,24], “Reading Abilities” tests [25], and the Girolami-Boulinier’s test for non-verbal perception with “differently oriented signs” [26,27], identified deficits with a wide range of difficulties in reading and writing for children with DD (Table S1). All participants were administered a nonverbal intelligence test with Raven’s Progressive Color Matrices [28].
Psychometric tests included assessment of reading, writing, and phonological awareness with a test battery for studying written speech in primary school age [25] (Table S1). Assessment of phonological awareness was by identifying words and omitting the first sound/last syllable of words), reading fluency (reading a text aloud), and writing (dictation of sentences). The test battery “Reading abilities” comprised phonological tasks, each with 10 words; reading aloud a text with 133 words and dictation of 30 sentences filling in the missing compound word. Two tasks were administered for the phonological awareness: “without the first sound-letter” and “without the last syllable”: (i) the children identified the word and then omitted the first sound of the heard word in his/her answer; (ii) the children fragmented the word into syllables and then omitted the last syllable of the word in his/her answer (Table S1).
Significant group differences were observed in both the number of correct answers and the time to complete the tests between the group with DD and the control group [F(2, 113) > 4.43, p < 0.048; ANOVA; Table S1]. No significant sex differences were found within either group. All examined children with DD showed a normal IQ with the Raven test, corresponding to the number of points determined for the child’s respective age (F(2, 113) = 1.4, p = 0.86).
Children participated in the EEG study after signing informed consent from their parents according to the Declaration of Helsinki. The study was approved by the Ethics Committee of the Institute of Neurobiology (No. 41/12-07-2019).
2.4. EEG Data Acquisition and Processing
A 40-channel wireless EEG system [29] with star-shaped dry gold sensors was used to record electroencephalographic (EEG) signals with a sampling rate of 250 Hz. Electrodes were positioned according to the 10-10 and 10-20 systems (ref. Figure S1; 10/10: AF3-AF4, F7-F8, FT9-F10, FC3-FC4, FC5-FC6, C1-C2, C5-c6, CP1- CP2, CP3 -CP4, TP7-TP8, P7-P8, PO3-PO4, PO7-PO8: Fz, F3-F4, C3-C4, Cz, T7-T8, P3-P4, Pz, O1-O2, Oz; [30,31]), with reference sensors on the processus mastoidei and ground electrode placed on the forehead. Skin impedance was kept below 5 kΩ to ensure signal quality. Individual trials were segmented into 800-ms windows, with stimulus onset. EEG signals were filtered (bandpass: 1–70 Hz; cutoff filter for 50 Hz) and artifacts rejected above ±200 µV. To evaluate the quality of the signal, the signal-to-noise ratio (SNR) was calculated according to the following formula: SNR = A/(2 × SDnoise) [32]. The amplitude A was the peak-to-peak potential of the mean ERP, and the SD of the noise (ε) was obtained by subtracting the mean from each ERP. Only trials with good SNR and correct responses were included in the analysis. After preprocessing, the average number of realizations per condition and group was 525 for controls and 772 for children with DD artifact-free data epochs. The frequency bands in which the EEG transforms were filtered were δ(1.5–4), θ(4–8), α(8–13), β1(13–20), β2(20–30), γ1(30–48), and γ2(52–70) Hz.
2.5. Application of Small-World Propensity Method to Experimental Design
To assess the functional connectivity between different brain regions, we calculated the phase lag index (PLI) for each possible pair of EEG electrodes in different frequency bands and trials [33]. PLI measures the phase synchronization between two signals by indicating whether one signal leads or lags the other. Small-world propensity (SWP, ϕ) is a measure of the network’s efficiency in transferring information [15]. The determination is made through analysis of the clustering coefficient and characteristic path length. The clustering coefficient measures the degree to which nodes in a network tend to cluster together. The characteristic path length measures the average length of the shortest path between any two nodes in the network. Small-world networks exhibit a balance between these two properties: high clustering and short path lengths. This enables both efficient local information processing and fast global communication. To calculate the SWP, the observed network is compared to two reference models: a random network and a regular network. A random network has randomly distributed connections, while a regular network has highly structured connections. The nodes of model graphs such as random lattice and regular lattice have the same number of nodes and probability distribution of degrees as observed graphs [15]. The deviation of the observed network clustering coefficient (∆C) and characteristic path length (∆L) from these reference models (Crand, Lrand; Clatt, Llatt) quantifies its small world. In the weighted network, the observed edge weights of the lattice model are ordered, with the highest weight assigned to the edges with the shortest Euclidean distance between nodes, and the edge weights are ordered in descending order. Higher weights in the network are assigned to distances that correspond to higher strength of nearby edges. The edges with the highest strength in the lattice network are located along the diagonal of the adjacency matrix. The network is in a transient state when the deviation ΔC is maximum. Lattice networks are characterized by low Llatt and high Clatt. A random network has links randomly distributed in the matrix, with small Crand values and long Lrand lengths. In the absence of local clustering between nodes, the random network model is highly integrated and unsegregated. At the maximum deviation of the clustering coefficient from its null model, the network switches to another model. In real networks, large values of φ indicate small-world characteristics. Real networks with φ close to 1 are characterized by large Cobs and short Lobs or moderate Lobs, as well as moderate Cobs and short Lobs. Smaller small-world propensity with φ values close to 0 is supported by larger deviations (ΔL, ΔC) from the corresponding null models [15].
Weighted adjacency matrices (40 × 40) were created based on the weighted phase lag index (wPLI) calculated for all pairs of sensors and evaluated in the δ- to γ-frequency networks in contrast discrimination tasks of LSF illusions. Φ, ∆L, and ∆C were defined for controls and children with DD (MATLAB functions from the Brain Connectivity Toolbox 2019; [15]). Local measures characterized each node, such as the strength of its connection with all other nodes and the centrality of the line spacing (BC), as the fraction of all shortest path lengths crossing the node in the network [34,35,36]. The weights of the adjacency matrix are converted to the central centers (BCs) of the nodes. The node is determined by the sum of all link weights for a node (the BC values) divided by the average local measures of all nodes. Nodes with high strength (high BC) play a significant role in information processing in the graph and are involved in many shortest paths [37]. Graphs are more integrated when they have a higher maximum BC or strength [34,36]. The most important nodes of the network are the hubs [35]. The characteristics in individual brain networks were determined using combinations of brain mapping techniques, anatomical parcellation methods, and connectivity measures using the MATLAB BrainNet Viewer functional package 1.7 [37]. BrainNet Viewer visualizes networks with the topological features of the brain, built using region- or voxel-based techniques, mapping edges and nodes to corresponding brain regions, and according to their defined properties gives them a certain size and color.
2.6. Statistical Analysis
Statistical analysis comparing global connectivity measures (φ, ΔL, ΔC) measures was performed using nonparametric bootstrap procedures with 1000 random permutations for each frequency and condition [38,39]. Independent permutation tests required corrections for multiple comparisons. Bonferroni correction was applied to the significance level (p = α/3 = 0.017; α = 0.05). Statistical analysis of local SWP measures (inter-group design) was carried out. An essential role in information processing in the network is played by high BC/stronger nodes through which the shortest paths pass. The strength and BC of the nodes were estimated using statistics based on non-parametric permutation clusters [39]. This analysis was performed for the hubs defined by nodes with maximum strength/BC selectively crossing the threshold criteria (one s.d. relative to the strength (BC) of a group node). Significant clusters were identified by applying a critical value for the maximum cluster statistic. By controlling the false alarm rate with multiple comparison corrections, the repeated clusters significantly exceed the threshold criteria and determine an ordered order in whose histograms the nodes have indices corresponding to the sensors. The medians of their distributions are sensitive to hemispheric differences. Controlling for multiple selected thresholds required a Bonferroni correction (p = α/2 = 0.025). Given the exploratory nature of this initial investigation and building upon the research group’s prior hypotheses, we adjusted for multiple comparisons to mitigate the risk of Type I errors while minimizing the risk of Type II errors by avoiding overly stringent significance thresholds. The nonparametric size effect (analog of Cohen’s d, [40,41,42]) was applied to assess the sample size and sufficient power to detect meaningful differences, particularly given the small subgroups. The nonparametric size effect (Q) was small: Q = 0.1; medium: Q = 0.3; large: Q = 0.5. Nonparametric statistics were performed in MATLAB. The selective criteria were also applied to the links and edges with BC and strength (Str) presented in the figures below.
The degree of participation (in percent) of each measure in the comparisons was performed on an individual-level analysis for each pair of children. Single-level global and local characteristics were nonparametrically compared between two subjects in each subgroup. The number of network measures for performers in a given subgroup that differed significantly from those of other performers was displayed compared to the total number of performers in the given subgroup (in percentage) for each network.
3. Results
Behavioral parameters for the task were compared within groups (controls and children with DD) to ensure that there were no large differences among children. There were no significant differences between the children in the groups regarding the number of correct answers when completing the task. The children in the groups were also well sorted by age. There were some sex differences in both reaction time and some network parameters of functional networks at certain frequencies. However, the functional analysis appears to “eliminate this effect”; the sex was included in the analysis below of both behavioral parameters in this task and functional characteristics.
3.1. Within-Group Design of Behavioral Parameters in Contrast Illusion Discrimination
Boys with DD are faster than girls with DD for both conditions:
(1) low-contrast illusion: boys with DD, median ± CI, 544.28 (520.28, 562.43), girls with DD, 695.72 (673.97, 728), p = 1.42 × 10⁻¹⁶; χ2 = 68.27, Q = 0.85;
(2) high-contrast illusion: boys with DD, 555.61 (547.01, 564.23), girls with DD, 661.33 (653.27, 669.4), p = 3.54 × 10⁻⁸, χ2 = 30.39, Q = 0.7 (Figure 1; Table S2).
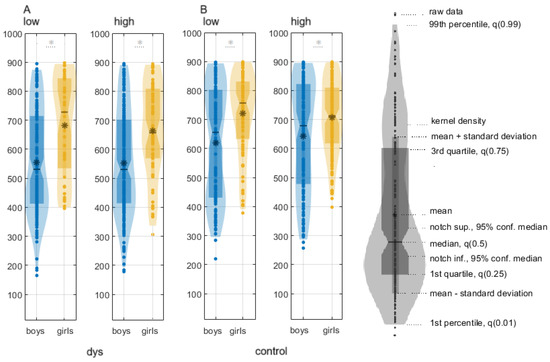
Figure 1.
Reaction times (median, -; mean, *) of boys (blue) vs. girls (yellow) in the contrast illusion discrimination task: (A) boys with DD vs. girls with DD; (B) control boy vs. control girl. The stars above the violins indicate statistically significant differences, p < 0.0001.
Control boys were faster than control girls:
(1) low-contrast illusion: 624.9207 (614.77, 635.14) ms; 727.31 (719.93, 734.68) ms; χ2 = 24.69, p = 7.03 × 10⁻⁷, Q = 0.3;
(2) high-contrast illusion: 645.4887 (635.67, 655.31) ms; 714.4453 (708, 720.9) ms; χ2 = 62, p = 3.4178 × 10⁻¹⁵, Q = 0.3 (Table S2).
3.2. Within-Group Comparison of Global SWP Measures of Functional Connectivity
There were no statistically significant differences in network measures between boys with DD and girls with DD in both task conditions (Figure 2A,B; Tables S3 and S4).
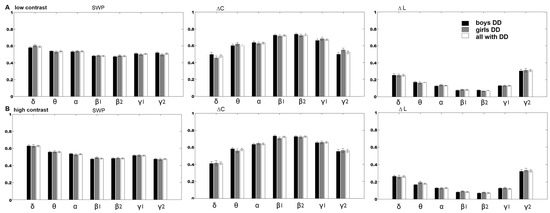
Figure 2.
The global measures (SWP, ∆C, ∆L; means ± s.e.) of the frequency networks of boys with DD (black color) versus girls with DD (gray color) and all children with DD (white columns) in the discrimination of: (A) the low-contrast illusion; (B) the high-contrast illusion. There was no significant difference between boys and girls with DD (Tables S3 and S4).
Control boys exhibited statistically higher ∆C and smaller SWP (ϕ) than control girls in low-contrast LSFI:
(1) The α-frequency network: ∆C of the (∆C: χ2 = 8.48; p = 0.001; Q = 0.48; Table S3);
(2) the β2-frequency network: ϕ, ∆C of only in the low-contrast (ϕ, ∆C: χ2 > 8.07; p < 0.005, Q = 0.6; Table S3).
Sex differences were found in the high-contrast SLF at:
(1) β-frequencies ϕ, ∆C, ∆L (β1: ϕ, ∆C: χ2 > 13.86 p = 0.002, Q > 0.58; β2: ϕ, ∆C, ∆L: χ2 > 8.87, p < 0.003, Q > 0.43; Figure 3, Table S4);
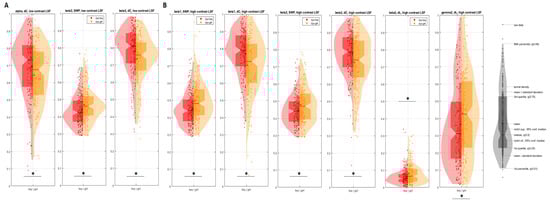
Figure 3.
Significant difference of global measures (median, -; mean, *): (A) low-contrast LSF illusion (α frequency network, ∆C; β2 frequency, ɸ, ∆C); (B) high-contrast: β1 frequency, ɸ, ∆C; β2-frequency network ɸ, ∆C ∆L; γ2 frequency, ∆L) between control boys (red) vs. control girls (yellow). The stars above the violins indicate statistically significant differences, p < 0.001.
3.3. Within-Group Comparison of Local Measures of Frequency Networks
3.3.1. Sex Differences in DD Group
There were statistically significant differences between the distribution of the hubs with the greatest betweenness centrality (BC) of the boys and girls with DD in the α-frequency network (Figure 4, Table S5) in the low-contrast illusion; χ2 = 5.84, p = 0.015, Q = 0.3. Boys with DD had more hubs with the greatest BC in this network, and they were in areas related to language, auditory, motor, motion-sensitivity, and visual attentional processing (FT9-10, C3, C5, C2, CP2, PO4, P8; Figure S2); and for the girls with DD, in areas related to language processing, sensitivity to movement, and visual attention (FT9-10, P7, PO7, O1; ref. Figures S2 and S3).
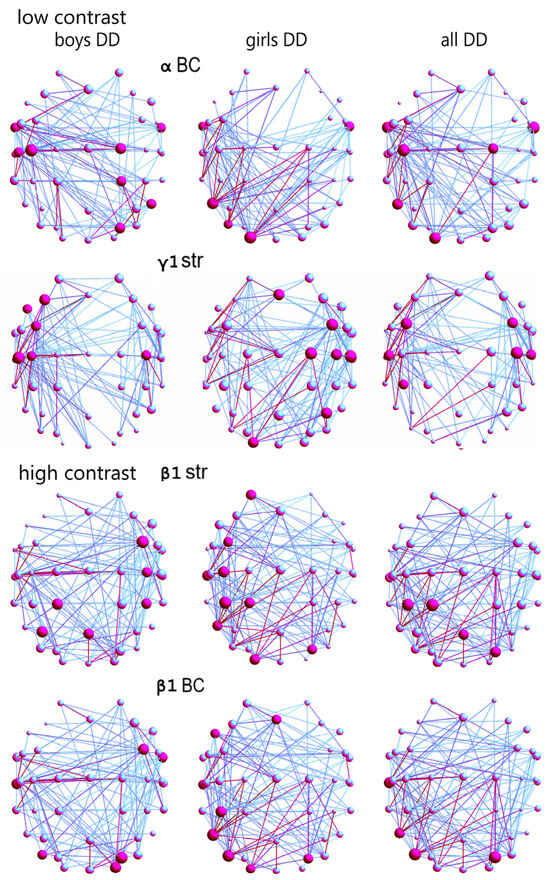
Figure 4.
Frequency networks in boys with DD (first column; main hubs and strong connections in red color), girls with DD (second column), and mixed group with DD (girls and boys with DD, third column): (1) low-contrast LSF illusion: BC of hubs of α-network (larger in boys: FT9-10, C3, C5, C2, CP2, PO4, P8; girls: FT9-10, P7, PO7, O1), and all DD: FT9-10, C2, C3, P7, O1; Str of hubs of γ1-network (larger in girls: Fz, FC4, C2, C4, C6, P4, O1; boys: F3, FC3, F7, C3-C4, C5), all DD: FC3-4, C4, C5-6, CP3; (2) high-contrast LSF illusion: Str of hubs in β1-network (larger Str in boys: FC4, C4, CP4, P3, Pz, Oz; girls: AF3, FC3, C3, CP1, T7, CP3, P7 O1, PO4), all DD (CP1, CP3, PO4, Pz); and BC of the hubs of β1-network (larger in boys: FC4, FT10, T7, PO4, PO7, O2; girls: Fz, F7, CP3, T7, PO4 P7, PO7, O1), all DD (T7, PO4, PO7, P7; ref. Figure S2).
The hub distribution between boys and girls with DD was statistically different in the γ1-frequency network (according to hub strength; χ2 = 7.26, p = 0.007, Q = 0.4; Table S5); as in girls with DD, it was in areas related to language processing, reading, motor, auditory processing, sensitivity to visual information and that to optic flow in the right hemisphere (Fz, FC4, C2, C4, C6, P4, O1), and in boys, in language processing, reading, motor, and auditory sub-networks in the left hemisphere (F7, F3, FC3, C3-C4, C5; ref. Figures S2 and S3).
The hub distribution between the two DD sex groups was statistically different in the β1-frequency network, relative to hub strength, in the high-contrast illusion (χ2 = 9.65, p = 0.001, Q = 0.3; Table S6): for boys with DD, in areas related to motor processing, language comprehension, expression, and reading (FC4, C4, CP4, P3, Pz, Oz); for the girls with DD, in more areas related to language comprehension, expression, reading, basic and complex auditory, visual motion processing, and visual attention, mostly in the left hemisphere (AF3, FC3, C3, CP1, CP3, T7, PO4, P7, O1; Figure 4).
In the β1-frequency network of boys and girls with DD, the hubs distributions with the greatest BC were statistically different (χ2 = 8.37, p = 0.003, Q = 0.3; Table S6). In the boys with DD, the hubs were related to language comprehension, expression, reading, integration of auditory and visual information, auditory feedback, and sensitivity to visual attention, areas predominantly in the right hemisphere (FC4, FT10, T7, PO4, PO7, O2), compared to the hubs for girls in the left hemisphere, in areas for language, writing, auditory, and sensitivity to motion and visual attention (Fz, F7, CP3, T7, PO4, PO7, P7, O1; Figure 4).
3.3.2. Sex Differences in the Control Group
In the γ2-network (according to the hub strength; low-contrast illusion), the control boys demonstrated a greater distribution of hubs across areas related to language (comprehension, expression, reading), visual motion processing, and visual attention, mostly in the left hemisphere (FC3, FT9, C1-2, Cz, CP1; Figure 5; ref. Figures S2 and S3). Control girls exhibited a more concentrated hub distribution within motor areas, visuomotor, and visuospatial attention-related regions, predominantly in the right hemisphere (C1-2, C3, CP2, CP4, PO4; Figure 5). This difference in hub distribution between sexes was statistically significant (χ2 = 9.8, p = 0.002, Q = 0.3; Table S5).
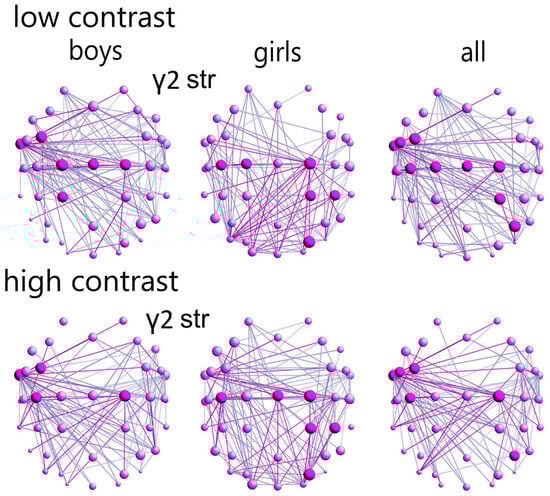
Figure 5.
Frequency networks of control boys (first column; main hubs and strong connections in red color), control girls (second column), and mixed group (control girls and boys, third column): (1) low contrast-contrast illusion—strength of hubs in γ2-network at FC3, FT9, C1-2, Cz, CP1; for girls at C1-2, C3, CP2, CP4, PO4; all controls at FC3, FC5, FT9, C1-2, Cz, C3, CP2, P4; (2) high-contrast LSF illusion: strength of hubs in γ2—network of boys at FC3 FT9 C2 C3, and for the girls at C2, Cz, C3, CP2, CP4, PO4, (3) all controls (FC3 FC5 FT9 C2 C3 P4; ref. Figure S2).
In the high-contrast LSF illusion, control girls showed a stronger γ2-frequency network with higher hub strength in motor areas, visuomotor, and visuospatial attention-related regions, predominantly in the right hemisphere (C2, Cz, C3, CP2, CP4, PO4). Control boys exhibited a greater network strength in areas related to language (comprehension, expression, reading), primarily in the left hemisphere (FC3, FT9, C2, C3); this sex difference in network strength was also statistically significant (p = 0.001, χ2 = 10.9, Q = 0.3; Table S6).
3.4. Exploring Interindividual Variation of Functional Networks
Interindividual heterogeneity in functional brain networks for 9–10-year-olds is also related to individual differences in their cognition, according to the model for the contribution of different networks along the axis of somatosensory association to cognitive functioning [10,43,44,45,46].
Individual variations of global and local measures at the level of 8-year-old single individuals were examined for two cases. Each bar on the subplots illustrates the proportion of significantly different pairs of functional (global, local) measures within each comparison (boys; girls; boys vs. girls), expressed as a percentage. This percentage is derived by dividing the number of pairs exhibiting significant differences by the total number of pairs examined.
Without sensorimotor network contribution (children had close reaction times, no statistical difference of RTs, p ≥ 0.05, Figure 6), i.e., the influence of frontoparietal networks was investigated: (a) the subgroup of boys with DD (both contrasts) in 3–5% of children (Figure 6A); (b) the subgroup of girls with DD—up to 1% of children (Figure 6B); (c) the subgroup of boys versus girls with DD—up to 2% (Figure 6C); (d) the subgroup of controls boys—up to 2% (Figure 6D); (e) the subgroup of controls, girls—1% (Figure 6E); (f) the subgroup of control boys vs. girls—up to 3% (Figure 6F).
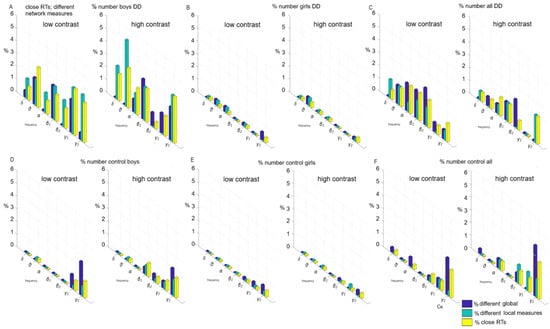
Figure 6.
Individual variations of global and local measures with close reaction times (p ≥ 0.05) in low-contrast and high-contrast illusion. Each bar illustrates the number of pairs exhibiting significant differences dividing by the total number of pairs examined, expressed as a percentage: (A) within a subgroup of boys with DD); (B) within a subgroup of girls with DD; (C) between boys vs. girls with DD; (D) within control boys; (E) within control girls; (F) between control boys vs. girls.
With an equal contribution of the sensorimotor network in both sex groups, the contribution of the frontoparietal and associative networks is equally underdeveloped in all sex subgroups as yet. Associative networks have not undergone plasticity compared to other parts of the cortex under the influence of the environment, children’s experiences, and interventions targeting these systems effective in supporting cognitive development.
The contribution of the sensorimotor network to the individual variations of global and local measures at the level of personalized networks (Figure 7); statistically different reaction times were found among the children; p ≤ 0.05: (a) a subgroup of boys with DD—between 10–12% (Figure 7A); (b) a subgroup of girls with DD—1% (Figure 7B); (c) subgroup of boys versus girls with DD—up to 8% (Figure 7C); (d) a subgroup of control boys—up to 3% (Figure 7D); (e) a subgroup of controls girls—1% (Figure 7E); (f) a subgroup of control boys vs. girls—up to 5% (Figure 7F).
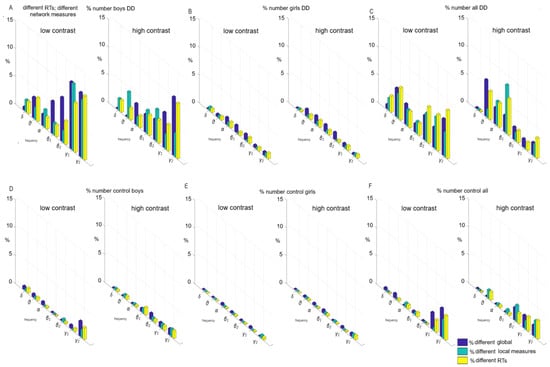
Figure 7.
Individual variations in global and local measures with different reaction times (p ≤ 0.05) in low-contrast and high-contrast illusions. Each bar illustrates the number of pairs exhibiting significant differences divided by the total number of pairs examined, expressed as a percentage: (A) within a subgroup of boys with DD); (B) within a subgroup of girls with DD; (C) within a subgroup of boys vs. girls with DD; (D) within a subgroup of control boys; (E) within a subgroup of control girls; (F) within control boys vs. girls.
The sex is preferably related to sensorimotor network. These associations, related to individual functional connectivity, may underlie the sex differences that exist in an immature brain in DD. Children with DD (mostly boys) have not reached the development of the sensorimotor network, which later leads to a decrease in interindividual heterogeneity. At this age, associative and sensorimotor networks have not yet matured enough to observe individual and sex differences.
4. Discussion
Functional brain topology is affected by sex, a biological characteristic that leads to differences in the organization of individual cortical and subcortical networks [46]. These variations can explain normative differences in cognitive or socioemotional abilities, executive functions, and sex differences in psychopathology at a given age, likely linked to gene expression [8,9]. A limitation of these studies is that the relationship between sex differences in brain topology and gene expression was assessed at the group level rather than the individual level [8,9].
The sensorimotor association axis in the hierarchical cortical organization, passing from the unimodal visual and somatomotor cortex to the transmodal association cortex, shows the greatest variability in functional topology among these networks that support cognition [10]. The observed individual variances in associative network topology may be crucial for predicting variations in cognition, as different networks probably contribute differently to cognitive processes. Functional brain topology is affected by sex, a biological characteristic that leads to differences in the organization of individual cortical and subcortical networks [46].
4.1. Relationship Between Variability in Network Connectivity and Sex
The present study investigated global and local functional connections related to sexual differences. Our findings indicated a significant overlap in the association networks for control boys and girls, with only 4% of them (see Figure 6F). The sex of 8-year-old children is preferentially linked to sensorimotor, visual, and control networks in the brain and more closely linked to individualized functional connectivity. The observed sex differences between the children with DD are related more to specific brain deficits.
4.2. Relationship Between Variability in Network Connectivity During the Low-Contrast LSF Illusion and the Development in the Control Group
Control boys’ global α, β, and γ2-networks exhibited a reduced small-world propensity, indicating a deviation from the typical balance of high clustering and short path lengths observed in small-world architecture (Figure 3). A greater deviation in the clustering coefficient suggested greater variability in the interconnectivity of neighboring brain areas. Smaller deviations in characteristic path lengths implied a more efficient and integrated network with shorter average distances between brain regions. This type of network topology of α, β1, β2, and γ2-frequency networks for the control boys were more integrated than those for the control girls.
Within the γ2-network, a sex-dependent pattern of hub connectivity emerged. Boys exhibited stronger connectivity within anterior hubs, primarily associated with left-hemisphere language and visual motion processing, across both high- and low-contrast LSF illusions. Notably, posterior hubs, implicated in visuospatial attention, were specifically involved in the low-contrast illusion for boys. Within both conditions, girls demonstrated enhanced connectivity within posterior brain regions, predominantly linked to right-hemispheric visuospatial and visuomotor attention.
In control boys, local γ2-network variations mainly involved connections within and between the frontal, temporal and motor networks in the left hemispheres (both contrast LSF illusions, Figure 5 and Figure 7A). Local functional γ2- (low-contrast), θ-, and β2-frequency differences (high-contrast) within motor networks among control subgroups were attributed to a sex difference within the control group (up to 5%; Figure 7). Global functional differences in α-frequency networks and variations in γ-networks between sexes involved connections within and between frontoparietal and associative networks, affecting up to 3% of children (both contrast LSF illusions, Figure 6F). Additionally, θ-, β2-, and γ-frequency network sex differences were observed within and between motor networks among 5% of children in the control group (high-contrast, Figure 7F).
4.3. Relationship Between Variability in Network Connectivity During Low-Contrast LSF Illusion to DD Deficits
In boys with DD, individual differences in local α network characteristics (Figure 6A and Figure 7A) were primarily driven by variations in hub betweenness centrality within and between temporal, parietal, dorsal attentional, and sensorimotor networks in the right hemisphere. In contrast, these differences in girls with DD (Figure 6B and Figure 7B) were observed primarily within temporal and visual networks in the left hemisphere (low-contrast, Figure 4). Local γ1 network variations in boys with DD were associated with changes in hub strength within frontal, motor, and auditory networks of the left hemisphere (low-contrast). Conversely, in girls with DD, these variations were linked to changes within and between frontoparietal, motor, somatosensory, auditory, and visual networks in the right hemisphere (low-contrast, Figure 4).
Within motor networks in individuals with DD, local α network variations across subgroups were primarily driven by sex differences in hub betweenness centrality (BC), accounting for less than 5% of the children. Individual differences in hub strength within the group of boys with DD had a minimal impact (low-contrast; compare Figure 7A with Figure 7C). In contrast, local γ1 network differences across subgroups were mainly attributable to individual variations in frontoparietal and associative networks within the group of boys with DD.
For θ- and β-frequency networks, subgroup differences in network connectivity (low-contrast) were primarily driven by the following: (1) sex differences in connections between hubs with high strength or BC within and between motor networks, frontoparietal, and associative networks, observed in 10% of individuals with DD (low-contrast, Figure 6 and Figure 7); (2) individual variations in connections among hubs with high strength or BC within and between motor networks, observed in 8% of boys with DD.
4.4. Relationship Between Variability in Network Connectivity During High-Contrast LSF Illusion and DD Deficits
In boys with DD, local functional variations within the β1-frequency network (high-contrast, Figure 4) were observed within the right hemisphere’s frontoparietal, motor, visual, and dorsal attention networks, as well as within temporal networks in the left hemisphere. In girls with DD, similar variations were observed within and between lateral frontoparietal, motor, and temporal networks in the left hemisphere and within visual networks in both hemispheres (high-contrast, Figure 4). These findings suggest that sex-related differences may exist in functional connectivity within and between local unimodal and heteromodal networks, affecting up to 8% of children with DD.
In motor networks of individuals with DD, local β1-network variations between subgroups were primarily attributed to sex differences in hub strength and BC, accounting for up to 8% of the children. These variations were not significantly influenced by individual differences within the group of boys with DD (high-contrast; compare Figure 7A with Figure 7C).
In other frequency networks, subgroup differences were largely driven by the following: (1) individual variations in connections among hubs with high strength or BC within and between frontoparietal and association networks in 10% of boys with DD; (2) individual variations in connections between hubs with high strength or BC within motor networks in 8% of these boys (Figure 7).
In θ- and α-frequency networks (high-contrast LSF, Figure 7), network differences between subgroups of individuals with DD were primarily influenced by the following: (1) sex differences in the connectivity between hubs with high strength, or high BC, within and between motor networks and other brain networks, observed in 10% of children with DD; and (2) individual variations in the connectivity between hubs with high strength, or high BC, within and between motor networks, observed in 8% of boys with DD. For β2-frequency networks, subgroup differences primarily arose from sex differences in the connectivity of hubs within and between frontoparietal and associative networks (high contrast, Figure 6).
4.5. Limitation of Variability in Functional Connectivity Across Sex
A variability in global functional connectivity was observed in associative networks among girls and boys for both groups (Figure 6C,F), but a greater variability in local functional connectivity was found in motor networks among boys and girls within both controls and children with DD (Figure 7), as reported by Long et al., 2017 [46].
These findings indicate that the influence of sex on functional brain connectivity may be more intricate than initially anticipated. It is possible that sex-related differences in brain function, as reflected in functional cortical networks, may not yet be fully manifested in 8-year-old children. The lack of significant associations between sex and functional connectivity could be attributed to the limited variability in these measures, which may arise from the immature development of cortical areas at age 8 or a relatively small sample size of children (DD and controls, 114). It is not surprising that the proportion of internal variation in boys with DD (unrelated to sex, rather related to different maturation) was relatively small (12%). In the girls, it was even lower (1%), likely due to the smaller subgroup. Our findings indicate that the associations between functional connectivity and sex of 8-year-old children influence the organization of brain networks in a minority of children because functional brain networks mature unevenly in cortical networks across genders during childhood [47].
Stimulus-responsive unimodal sensory networks within a given sensory modality mature first, followed by heteromodal associative networks involved in cognitive processes. All networks with different sets of functional connections contribute to local functional variation between sexes.
The relationship between sex and connectivity within and between sensorimotor, visual, and motor networks is stronger than other connections. In girls, the strongest connections and main hubs were found within and between temporal, parietal, and attentional networks, predominantly located in the right hemisphere for typically developing children, and in different brain sides among the significantly different frequency networks for dyslexics. In contrast, boys exhibited a more diffuse connectivity pattern that spanned several heteromodal networks and sensorimotor networks, primarily in the left hemisphere for controls and with varying hemispheric dominance in dyslexic boys across different frequency bands. Sex-specific differences in functional capacities between the association and sensorimotor cortices may stem from regional variations in functional connectivity profiles across hemispheres. These variations could arise from differential refinement of connectivity during brain development. A study of the development of cortico-cortical functional connectivity confirmed that this variability varies across the cortical hierarchy [46].
Children’s sex expression from 9- to 10-year-olds undergoes significant changes during puberty, marked by both structural and functional maturation of the brain [47].
The interplay of childhood development before puberty with brain maturation and their relationship to emerging developmental disorders influences brain network sensitivity to individual and sex differences. Understanding this variation in childhood brain development can help capture the biological variation associated with emerging psychopathology. Moreover, findings related to psychopathological associations indicate sensitivity to subtle manifestations of psychopathological issues that may not yet reach clinical thresholds. It is important to note that brain maturation and sex differences introduce further variation into these outcomes.
5. Conclusions
We found that the cognitive task amplifies even the small individual differences in functional connectivity characteristics among 8-year-old children and also predicts developmental problems in a sex-dependent manner, which aligns with findings from fMRI task data [47]. Notably, our approach outperformed models constructed from resting-state data [47].
Although this study included a small sample, similar to Luo et al. [45], we observed that differences in functional capacity between sensorimotor and association cortices partly stem from regional variations in functional connectivity profiles. These differences are influenced by connectivity maturation during brain development [10]. During development, sensory-motor networks exhibit increasing connectivity and become integrated with other networks, while associative networks show decreased connectivity and remain more segregated from other networks during childhood [45]. The different development of functional integration and segregation can be related to the variability of functional connectivity development between boys and girls with DD. Furthermore, the development of functional connectivity varies even at the level of sensorimotor networks in boys with DD and does not demonstrate the expected age-related maturation effect.
Supplementary Materials
The following supporting information can be downloaded at: https://www.mdpi.com/article/10.3390/app15041797/s1, Figure S1. Experimental diagram of the contrast discrimination of low-spatial-frequency (LSF) illusion, presented in a pseudorandomized sequence. The illusions were flickering sinusoidal gratings with a spatial frequency of two cycles per degree and a high temporal frequency 15 Hz of counter phase flicker. The left hand was used to respond to a low-contrast LSF illusion and the right hand to respond to a high-contrast illusion. A short beep signaled the end of each realization. The inter trial intervals (ITI) were 1.5–3.5 s. A fixation cross was presented during the ITI, marking the beginning of each realization; Figure S2. The positions of the 40 EEG sensors are according to the international systems 10/20 (green circles) and 10/10 (yellow circles); Figure S3. Electrode positions and cytoarchitectural areas according to Brodmann; Figure S4. Mean of global measures φ, ΔC, ΔL of frequency δ, θ, α, β1, β2, γ1, and γ2 networks for all Controls (gray) and all DD (black) under low-contrast LSF illusion (upper panel) and under high-contrast LSF illusion (lower panel). Only those frequency ranges are presented where there is a significant difference for at least one of the global measures (marked with bold text in Tables S3 and S4); Table S1. Psychological scores of the groups in standard scores (mean ± s.d.; second and fifth column). The statistics (F, p) of boys with DD vs. girls with DD (third, fourth column); control boys vs. girls (sixth, seventh columns); statistics of controls vs. group with DD (eighth and ninth columns); Table S2. Statistical comparisons of the means of behavioral parameters (p, χ2, Kruskal–Wallis test; significance level, p < 0.05; number of correct trials for each condition: 525 for Control, 792 for children with DD) in the LSF illusion. Nonparametric size effect (analog of Cohen’s d): small effect: Q = 0.1; medium effect: Q = 0.3; large effect: Q = 0.5 [40,41,42]; Table S3. Statistical comparison of global measures φ, ΔC, ΔL (means ± s.e.; Kruskal–Wallis Test: χ2 statistic, p-value, significance threshold 0.0167) of frequency δ, θ, α, β1, β2, γ1, and γ2 networks for Control and DD for low-contrast LSF illusion. Nonparametric size effect (analog of Cohen’s d) was as follows: small effect: Q = 0.1; medium effect: Q = 0.3; large effect: Q = 0.5 [40,41,42]; Table S4. Statistical comparisons of global measures φ, ΔC, ΔL (means ± s.e.; Kruskal–Wallis Test: χ2 statistic, p-value, significance threshold 0.0167) of frequency δ, θ, α, β1, β2, γ1, and γ2 networks for Control and DD for high-contrast LSF illusion. Nonparametric size effect (analog of Cohen’s d): small effect: Q = 0.1; medium effect: Q = 0.3; large effect: Q = 0.5 [40,41,42]; Table S5. Statistical comparisons of the distributions of hubs with respect to local measures (strength: Str; betweenness centrality: BC; significance threshold p < 0.025) of the functional networks (for frequencies δ, θ, α, β1, β2, γ1, and γ2) of controls and the group with DD in the low-contrast LSF illusion. Nonparametric size effect (analog of Cohen’s d) small effect: Q = 0.1; medium effect: Q = 0.3; large effect: Q = 0.5 [40,41,42]; Table S6. Nonparametric statistical comparisons of functional networks based on local measures (Str; BC; p < 0.025) of controls and the DD group at high-contrast LSF illusion for frequencies: δ, θ, α, β1, β2, γ1, and γ2. Nonparametric Cohen’s Q small effect: Q = 0.1; medium effect: Q = 0.3; large effect: Q = 0.5. References [21,22,23,24,25,26,27,28,40,41,42] are cited in the Supplementary Materials.
Author Contributions
J.D. and T.T. were responsible for conceiving and designing this study. J.D. and T.T. were in charge of the surveys and the data acquisition. T.T. analyzed the data. T.T. and J.D. wrote and revised the manuscript. J.D. was responsible for the study concept, the manuscript preparation, the manuscript authorization. T.T was responsible obtaining funding support. All authors have read and agreed to the published version of the manuscript.
Funding
This research has no funding.
Institutional Review Board Statement
This study was conducted in accordance with the Declaration of Helsinki and approved by the Ethics Committee of the Institute of Neurobiology, BAS (protocol code № 02-41/12.07.2019) on 12 July 2019.
Informed Consent Statement
Informed consent was obtained from all subjects in the study.
Data Availability Statement
The data are not publicly available due to the restrictions applied to the availability of the data.
Acknowledgments
This research is supported by the Bulgarian Ministry of Education and Science under the National Program “Young Scientists and Postdoctoral Students-2”.
Conflicts of Interest
The authors declare no conflicts of interest.
References
- Horwitz, B.; Rumsey, J.M.; Donohue, B.C. Functional connectivity of the angular gyrus in normal reading and dyslexia. Proc. Natl. Acad. Sci. USA 1998, 95, 8939–8944. [Google Scholar] [CrossRef] [PubMed]
- Stanberry, L.I.; Richards, T.L.; Berninger, V.W.; Nandy, R.R.; Aylward, E.H.; Maravilla, K.R.; Stock, P.S.; Cordes, D. Low-frequency signal changes reflect differences in functional connectivity between good readers and dyslexics during continuous phoneme mapping. Magn. Reson. Imaging 2006, 24, 217–229. [Google Scholar] [CrossRef] [PubMed]
- van der Mark, S.; Klaver, P.; Bucher, K.; Maurer, U.; Schulz, E.; Brem, S.; Martin, E.; Brandeis, D. The left occipitotemporal system in reading: Disruption of focal fMRI connectivity to left inferior frontal and inferior parietal language areas in children with dyslexia. Neuroimage 2011, 54, 2426–2436. [Google Scholar] [CrossRef] [PubMed]
- Stein, J. Dyslexia: The Role of Vision and Visual Attention. Curr. Dev. Disord. Rep. 2014, 1, 267–280. [Google Scholar] [CrossRef]
- Franceschini, S.; Bertoni, S.; Gianesini, T.; Gori, S.; Facoetti, A. A different vision of dyslexia: Local precedence on global perception. Sci. Rep. 2017, 7, 17462. [Google Scholar] [CrossRef]
- Dhamala, E.; Bassett, D.S.; Yeo, B.T.T.; Homes, A.J. Functional brain networks are associated with both sex and gender in children. Sci. Adv. 2024, 10, eadn4202. [Google Scholar] [CrossRef]
- Krafnick, A.J.; Evans, T.M. Neurobiological Sex Differences in Developmental Dyslexia. Front. Psychol. 2019, 11, 2669. [Google Scholar] [CrossRef]
- Shanmugan, S.; Seidlitz, J.; Cui, Z.; Adebimpe, A.; Bassett, D.S.; Bertolero, M.A.; Davatzikos, C.; Fair, D.A.; Gur, R.E.; Gur, R.C. Sex differences in the functional topography of association networks in youth. Proc. Natl. Acad. Sci. USA 2022, 119, e2110416119. [Google Scholar] [CrossRef]
- Weis, S.; Patil, K.R.; Hoffstaedter, F.; Nostro, A.; Yeo, B.T.T.; Eickhoff, S.B. Sex Classification by Resting State Brain Connectivity. Cereb. Cortex 2020, 30, 824–835. [Google Scholar] [CrossRef]
- Keller, A.S.; Sydnor, V.J.; Pines, A.; Fair, D.A.; Bassett, D.S.; Satterthwaite, T.D. Hierarchical functional system development supports executive function. Trends Cogn. Sci. 2023, 27, 160–174. [Google Scholar] [CrossRef]
- Roca-Stappung, M.; Fernández, T.; Bosch-Bayard, J.; Harmony, T.; Ricardo-Garcell, J. Electroencephalographic characterization of subgroups of children with learning disorders. PLoS ONE 2017, 12, e0179556. [Google Scholar] [CrossRef] [PubMed]
- Bosch-Bayard, J.; Galán-García, L.; Fernandez, T.; Lirio, R.B.; Bringas-Vega, M.L.; Roca-Stappung, M.; Ricardo-Garcell, J.; Harmony, T.; Valdes-Sosa, P.A. Stable Sparse Classifiers Identify qEEG Signatures that Predict Learning Disabilities (NOS) Severity. Front. Neurosci. 2018, 11, 749. [Google Scholar] [CrossRef] [PubMed]
- Fraga González, G.; Žarić, G.; Tijms, J.; Bonte, M.; Blomert, L.; van der Molen, M.W. A Randomized Controlled Trial on The Beneficial Effects of Training Letter-Speech Sound Integration on Reading Fluency in Children with Dyslexia. PLoS ONE 2015, 10, e0143914. [Google Scholar] [CrossRef]
- Taskov, T.; Dushanova, J. Improving functional connectivity in developmental dyslexia through combined neurofeedback and visual training. Symmetry 2022, 14, 369. [Google Scholar] [CrossRef]
- Muldoon, S.F.; Bridgeford, E.W.; Bassett, D.S. Small-world propensity and weighted brain networks. Sci. Rep. 2016, 6, 22057. [Google Scholar] [CrossRef]
- Lalova, J.; Dushanova, J.; Kalonkina, A.; Tsokov, S.; Hristov, I.; Totev, T.; Stefanova, M. Vision and visual attention of children with developmental dyslexia. Psychol. Res. 2018, 21, 247–261. [Google Scholar]
- Michael, R.; Guevara, O.; de la Paz, M.; Alvarez de Toledo, J.; Barraquer, R.I. Neural contrast sensitivity calculated from measured total contrast sensitivity and modulation transfer function. Acta Ophthalmol. 2011, 89, 278–283. [Google Scholar] [CrossRef]
- Sukha, A.Y.; Rubin, A. Psychophysical aspects of contrast sensitivity. Afr. Vis. Eye Health S. Afr. Optom. 2013, 72, 76–85. [Google Scholar] [CrossRef][Green Version]
- Pammer, K.; Wheatley, C. Isolating the M(y)-cell response in dyslexia using the spatial frequency doubling illusion. Vis. Res. 2001, 41, 2139–2147. [Google Scholar] [CrossRef]
- Sperling, A.J.; Lu, Z.L.; Manis, F.R.; Seidenberg, M.S. Deficits in perceptual noise exclusion in developmental dyslexia. Nat. Neurosci. 2005, 8, 862–863. [Google Scholar] [CrossRef]
- Raichev, P.; Geleva, T.; Valcheva, M.; Rasheva, M.; Raicheva, M. Protocol on neurological and neuropsychological studies of children with specific learning disabilities. In Integrated Learning and Resource Teacher; Evgenieva, E., Ed.; Publishing House “Dr. Ivan Bogorov”: Sofia, Bulgaria, 2005; pp. 82–105. (In Bulgarian) [Google Scholar]
- Annett, A. A classification of hand preference by association analysis. Br. J. Psychol. 1970, 61, 303–321. [Google Scholar] [CrossRef] [PubMed]
- Matanova, V.; Todorova, E. DDE-2 Test Battery for Evaluation of Dyslexia of Development—Bulgarian Adaptation; OS Bulgaria Ltd.: Sofia, Bulgaria, 2013; Available online: https://www.giuntipsy.bg/bg/prod-19-testova-bateriq-za-ocenka-nadisleksiq-na-razvitieto.htm (accessed on 1 October 2013).
- Sartori, G.; Remo, J.; Tressoldi, P.E. Updated and revised edition for the evaluation of dyslexia. In DDE-2, Battery for the Developmental Dyslexia and Evolutionary Disorders-2, 1995; Giunti O.S.: Florence, Italy, 2007. [Google Scholar]
- Kalonkina, A.; Lalova, J. Normative indicators for the test battery for a written speech assessment. In Proceedings of the International Conference “Speech Therapy Diagnostics”; Rommel Publuling House: Sofia, Bulgaria, 2016; pp. 30–38, ISBN 978-954-9458-23-7. (In Bulgarian). [Google Scholar]
- Girolami-Boulinier, A. Contrôle des Aptitudes à la Lecture et à l’Ecriture (CALE); CALE: Paris, France, 1985. (In French) [Google Scholar]
- Yakimova, R. Abnormalities of Written Speech; Rommel Publuling House: Sofia, Bulgaria, 2004; ISBN 954-91270-6-0. (In Bulgarian) [Google Scholar]
- Raven, J.; Raven, J.C.; Court, J.H. Manual for Raven’s Progressive Matrices and Vocabulary Scales. Section 2: The Colored Progressive. Patrices; Oxford Psychologists Press: Oxford, UK; The Psychological Corporation: San Antonio, TX, USA, 1998. [Google Scholar]
- Totev, T.; Taskov, T.; Dushanova, J.A. Wireless EEG System for Neurofeedback Training. Appl. Sci. 2023, 13, 96. [Google Scholar] [CrossRef]
- Koessler, L.; Maillard, L.; Benhadid, A.; Vignal, J.P.; Felblinger, J.; Vespignani, H.; Braun, M. Automated cortical projection of EEG sensors: Anatomical correlation via the international 10-10 system. NeuroImage 2009, 46, 64–72. [Google Scholar] [CrossRef] [PubMed]
- Giacometti, P.; Perdue, K.L.; Diamond, S.G. Algorithm to find high density EEG scalp coordinates and analysis of their correspondence to structural and functional regions of the brain. J. Neurosci. Methods 2014, 229, 84–96. [Google Scholar] [CrossRef] [PubMed]
- Dushanova, J.; Christov, M. Auditory event-related brain potentials for an early discrimination between normal and pathological brain aging. Neural Regen. Res. 2013, 8, 1390–1399. [Google Scholar]
- Stam, C.J.; Nolte, G.; Daffertshofer, A. Phase lag index: Assessment of functional connectivity from multi-channel EEG and MEG with diminished bias from common sources. Hum. Brain Mapp. 2007, 28, 1178–1193. [Google Scholar] [CrossRef]
- Bullmore, E.; Sporns, O. Complex brain networks: Graph theoretical analysis of structural and functional systems. Nat. Rev. Neurosci. 2009, 10, 186–198. [Google Scholar] [CrossRef]
- Rubinov, M.; Sporns, O. Complex network measures of brain connectivity: Uses and interpretations. NeuroImage 2010, 52, 1059–1069. [Google Scholar] [CrossRef]
- Stam, C.J.; van Straaten, E.C. The organization of physiological brain networks. Clin. Neurophysiol. 2012, 123, 1067–1087. [Google Scholar] [CrossRef]
- Xia, M.; Wang, J.; He, Y. BrainNet Viewer: A network visualization tool for human brain connectomics. PLoS ONE 2013, 8, e68910. [Google Scholar] [CrossRef]
- Mason, D.M.; Newton, M.A. A Rank Statistics Approach to the Consistency of a General Bootstrap. Ann. Stat. 1992, 20, 1611–1624. [Google Scholar] [CrossRef]
- Maris, E.; Oostenveld, R. Nonparametric statistical testing of EEG-and MEG-data. J. Neurosci. Methods 2007, 164, 177–190. [Google Scholar] [CrossRef] [PubMed]
- Cohen, J. Statistical Power Analysis for the Behavioral Sciences; Routledge Academic: New York, NY, USA, 1988. [Google Scholar]
- Wilcox, R. A robust nonparametric measure of effect size based on an analog of Cohen’s d, plus inferences about the median of the typical difference. J. Mod. Appl. Stat. Methods 2018, 17, eP2726. [Google Scholar] [CrossRef]
- Akinshin, A. Finite-sample bias-correction factors for the median absolute deviation based on the Harrell-Davis quantile estimator and its trimmed modification. arXiv 2022, arXiv:2207.12005. [Google Scholar]
- Hagler, D.J.; Hatton, S.; Cornejo, M.D.; Makowski, C.; Fair, D.A.; Dick, A.S.; Sutherland, M.T.; Casey, B.J.; Barch, D.M.; Harms, M.P.; et al. Image processing and analysis methods for the Adolescent Brain Cognitive Development Study. NeuroImage 2019, 202, 116091. [Google Scholar] [CrossRef]
- Luo, A.C.; Sydnor, V.J.; Pines, A.; Larsen, B.; Alexander-Bloch, A.F.; Cieslak, M.; Covitz, S.; Chen, A.A.; Esper, N.B.; Feczko, E.; et al. Functional connectivity development along the sensorimotor-association axis enhances the cortical hierarchy. Nat. Commun. 2024, 15, 3511. [Google Scholar] [CrossRef]
- Long, X.; Benischek, A.; Dewey, D.; Lebel, C. Age-related functional brain changes in young children. Neuroimage 2017, 155, 322–330. [Google Scholar] [CrossRef]
- Kraft, D.; Alnæs, D.; Kaufmann, T. Domain adapted brain network fusion captures variance related to pubertal brain development and mental health. Nat. Commun. 2023, 14, 6698. [Google Scholar] [CrossRef]
- Greene, A.S.; Gao, S.; Scheinost, D.; Constable, R.T. Task-induced brain state manipulation improves prediction of individual traits. Nat. Commun. 2018, 9, 2807. [Google Scholar] [CrossRef]
Disclaimer/Publisher’s Note: The statements, opinions and data contained in all publications are solely those of the individual author(s) and contributor(s) and not of MDPI and/or the editor(s). MDPI and/or the editor(s) disclaim responsibility for any injury to people or property resulting from any ideas, methods, instructions or products referred to in the content. |
© 2025 by the authors. Licensee MDPI, Basel, Switzerland. This article is an open access article distributed under the terms and conditions of the Creative Commons Attribution (CC BY) license (https://creativecommons.org/licenses/by/4.0/).