
From Vine to Wine: Coloured Phenolics as Fingerprints


Abstract
Featured Application
Abstract
1. Introduction
2. Materials and Methods
2.1. Wine Samples
2.2. Analytical Methods
2.3. Statistical Analysis
3. Results
3.1. Univariate Analysis
3.1.1. Cultivar Analysis
3.1.2. Geographical Origin
Island of Precedence
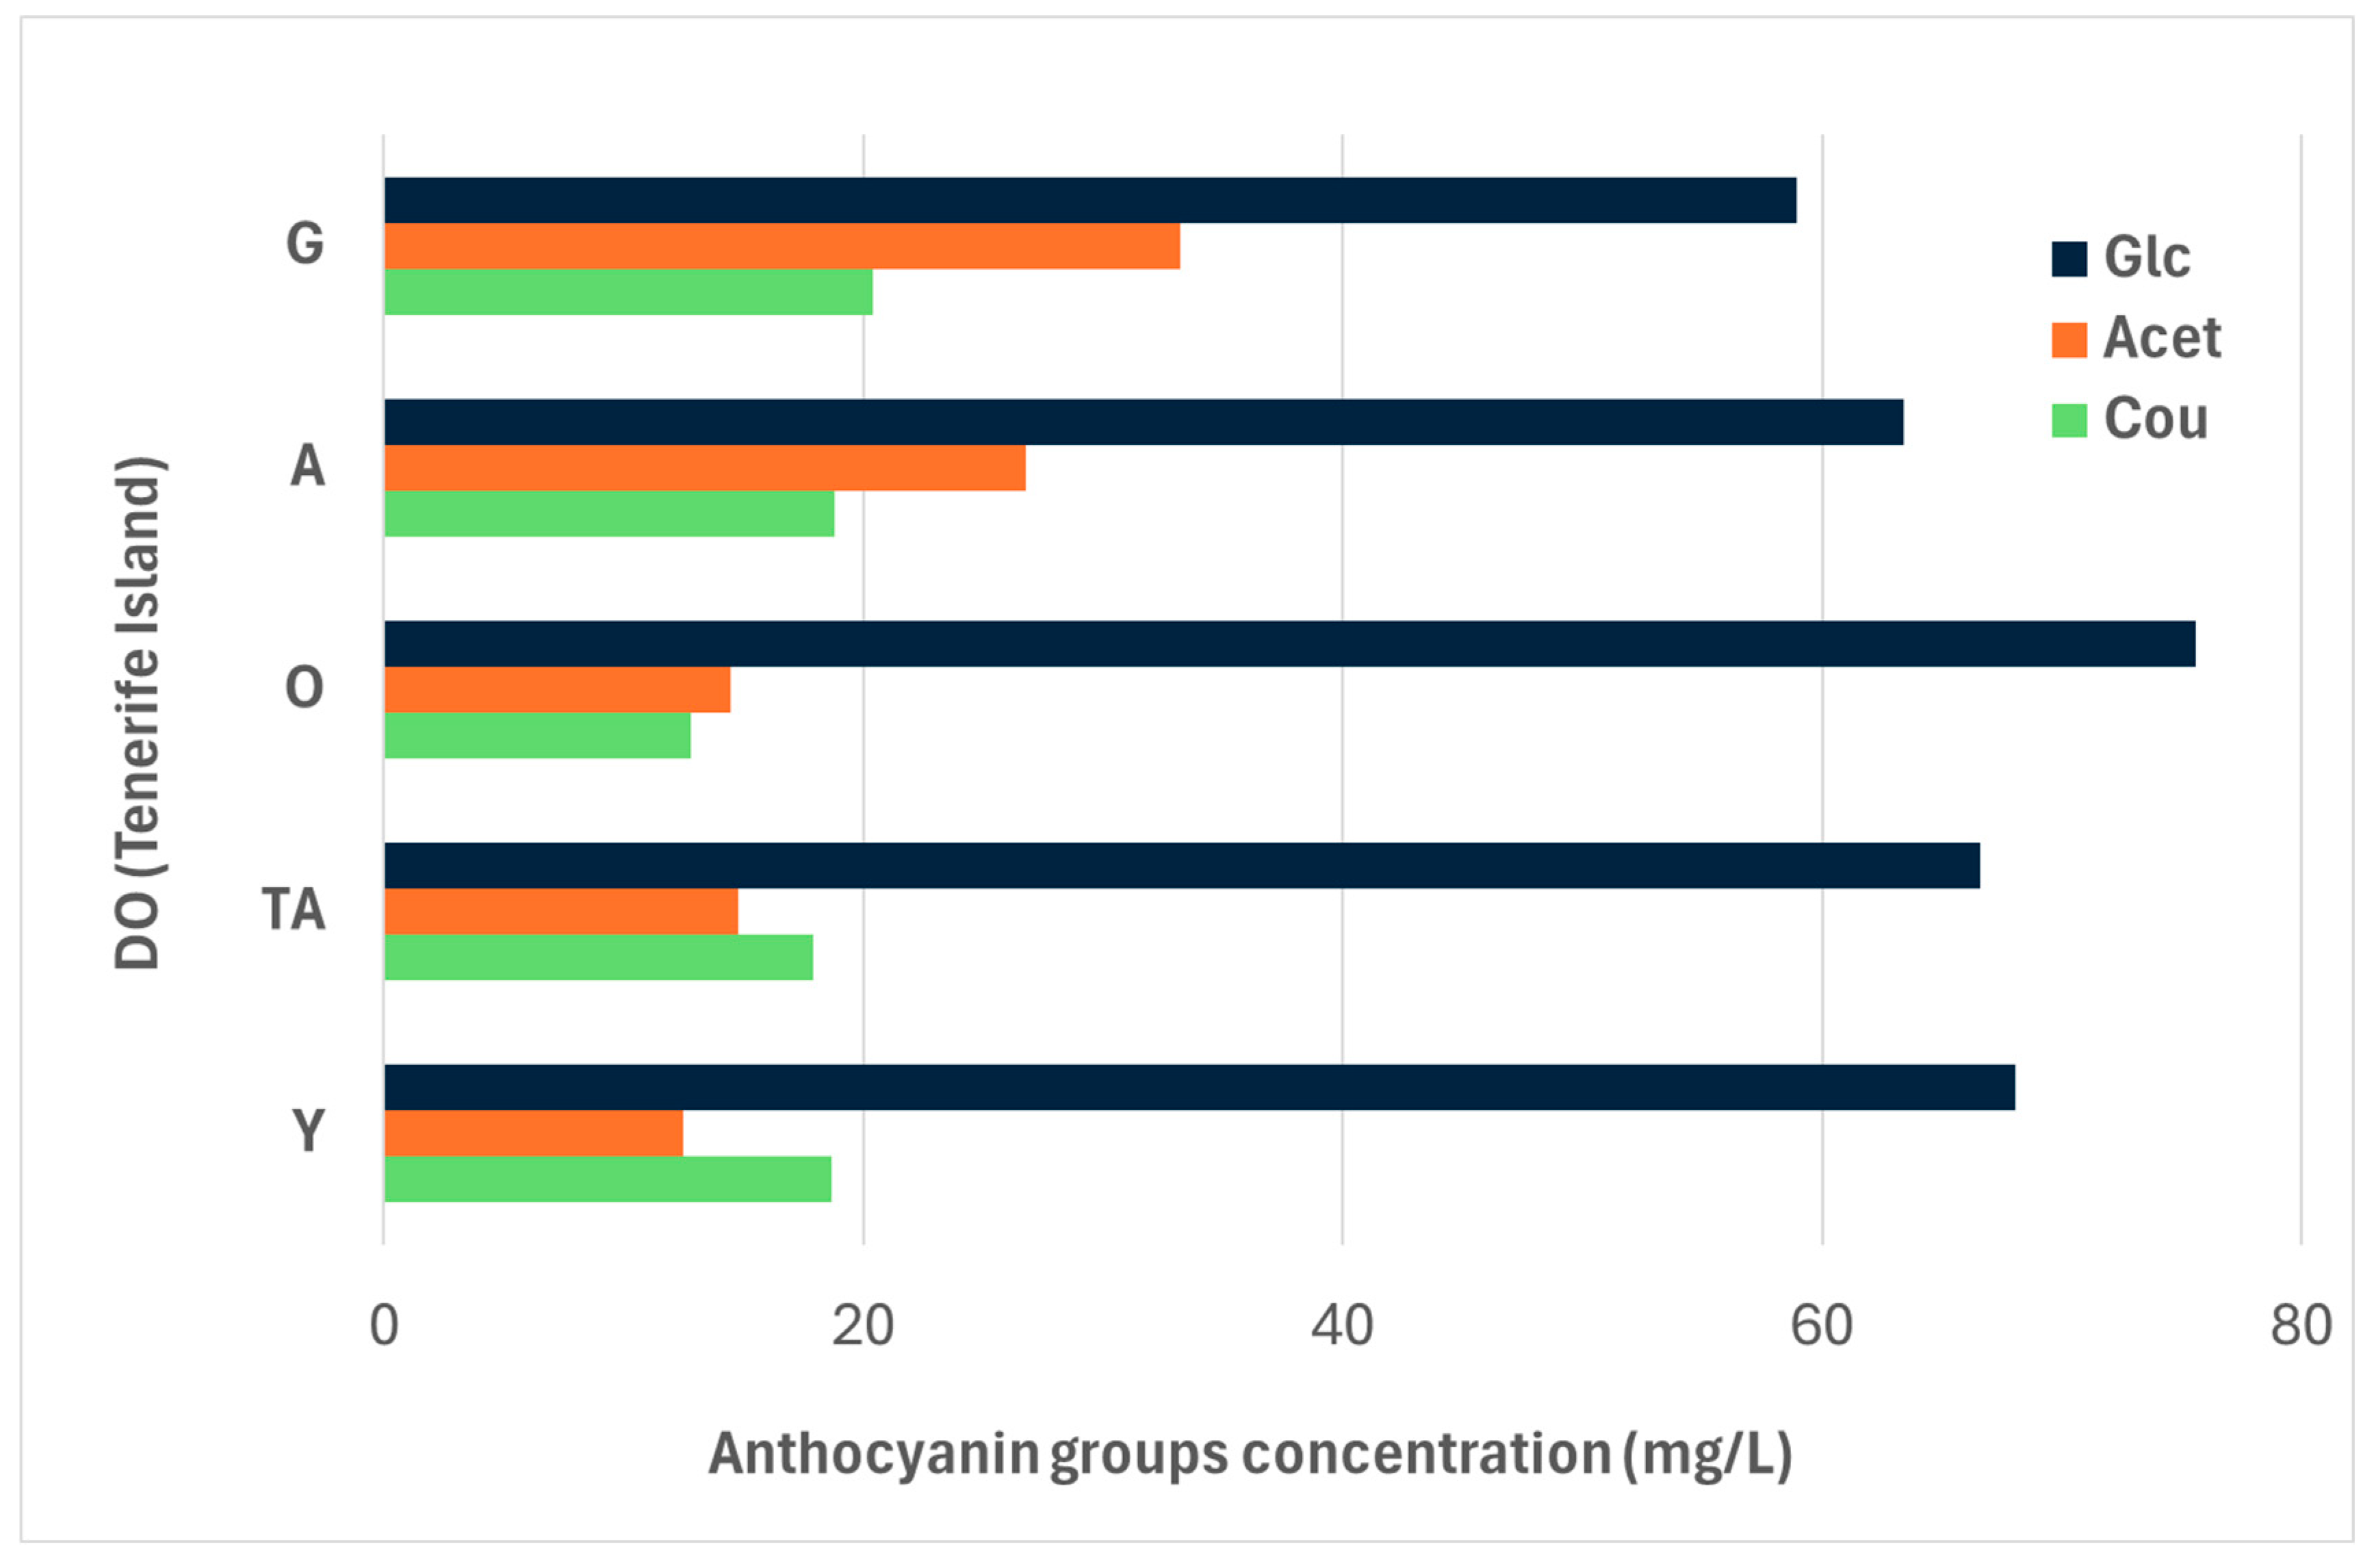
Denomination of Origin into Tenerife Island
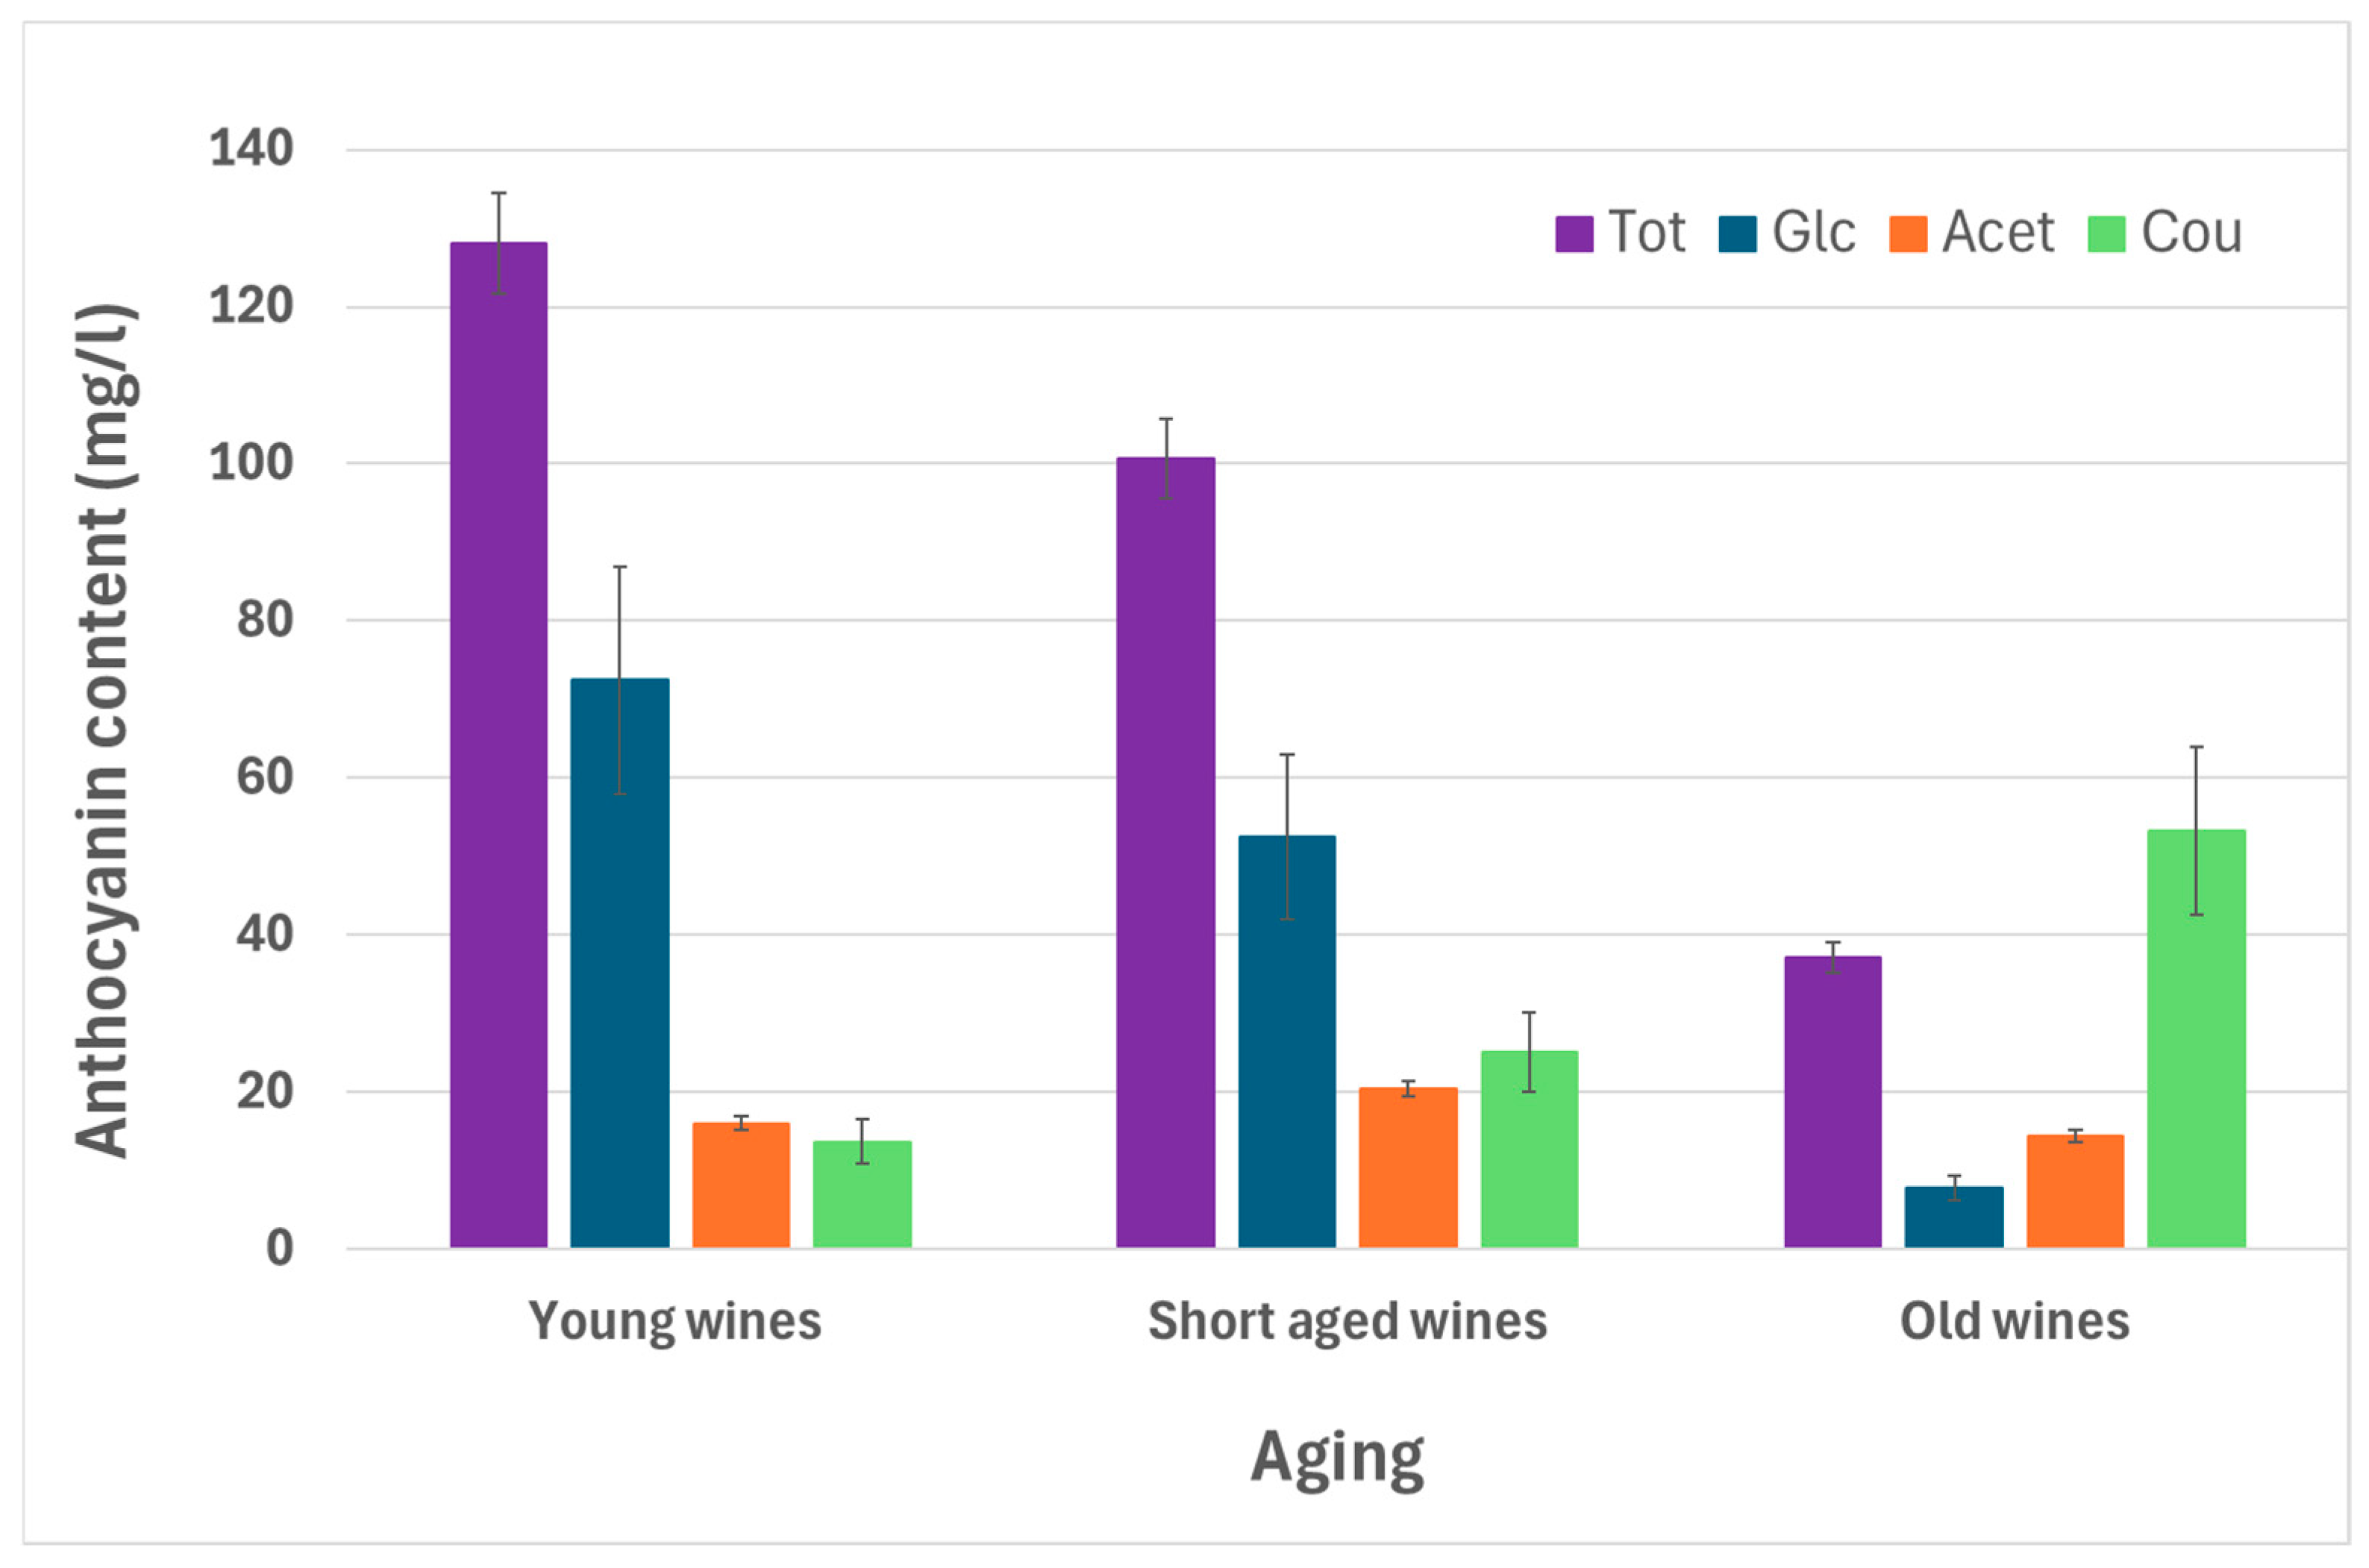
3.1.3. Aging Analysis
3.2. Correlation Study
3.3. Multivariate Analysis
3.3.1. Principal Compound Analysis
3.3.2. Linear Discriminant Analysis
4. Discussion
4.1. Univariate Analysis
4.1.1. Cultivar Analysis
4.1.2. Geographical Origin
4.1.3. Aging
4.2. Correlation Study
4.3. Multivariate Analysis
4.3.1. Principal Compound Analysis
4.3.2. Discriminant Analysis
5. Conclusions
Supplementary Materials
Author Contributions
Funding
Institutional Review Board Statement
Data Availability Statement
Acknowledgments
Conflicts of Interest
References
- Villegas-Aguilar, M.d.C.; Sánchez-Marzo, N.; Fernández-Ochoa, Á.; Del Río, C.; Montaner, J.; Micol, V.; Herranz-López, M.; Barrajón-Catalán, E.; Arráez-Román, D.; Cádiz-Gurrea, M.d.l.L. Evaluation of Bioactive Effects of Five Plant Extracts with Different Phenolic Compositions against Different Therapeutic Targets. Antioxidants 2024, 13, 217. [Google Scholar] [CrossRef] [PubMed]
- Huang, Y.; Zhang, Y.; Zhang, T.; Chen, X. Fingerprint and difference analysis of flavonoids of Hippophae plants grown on the Tibetan plateau. J. Food Compos. Anal. 2024, 128, 106010. [Google Scholar] [CrossRef]
- Alimoglu, G.; Guzelmeric, E.; Yuksel, P.I.; Celik, C.; Deniz, I.; Yesilada, E. Monofloral and polyfloral bee pollens: Comparative evaluation of their phenolics and bioactivity profiles. LWT 2021, 142, 110973. [Google Scholar] [CrossRef]
- Blasi, F.; Ianni, F.; Cossignani, L. Phenolic profiling for geographical and varietal authentication of extra virgin olive oil. Trends Food Sci. Technol. 2024, 147, 104444. [Google Scholar] [CrossRef]
- Lucini, L.; Rocchetti, G.; Kane, D.; Trevisan, M. Phenolic fingerprint allows discriminating processed tomato products and tracing different processing sites. Food Control 2017, 73, 696–703. [Google Scholar] [CrossRef]
- Zhao, Y.; Wang, C.; Huang, X.; Hu, D. Anthocyanin stability and degradation in plants. Plant Signal. Behav. 2021, 16, 1987767. [Google Scholar] [CrossRef]
- Sacchi, K.L.; Bisson, L.F.; Adams, D.O. A review of the effect of winemaking techniques on phenolic extraction in red wines. Am. J. Enol. Vitic. 2005, 56, 197–206. [Google Scholar] [CrossRef]
- Castellarin, S.D.; Pfeiffer, A.; Sivilotti, P.; Degan, M.; Peterlunger, E.; Di Gaspero, G. Transcriptional regulation of anthocyanin biosynthesis in ripening fruits of grapevine under seasonal water deficit. Plant Cell Environ. 2007, 30, 1381–1399. [Google Scholar] [CrossRef]
- Kobayashi, S.; Ishimaru, M.; Ding, C.K.; Yakushiji, H.; Goto, N. Comparison of UDP-glucose: Flavonoid 3-O-glucosyltransferase (UFGT) gene sequences between white grapes (Vitis vinifera) and their sports with red skin. Plant Sci. 2001, 160, 543–550. [Google Scholar] [CrossRef]
- Azuma, A.; Yakushiji, H.; Koshita, Y.; Kobayashi, S. Flavonoid biosynthesis-related genes in grape skin are differentially regulated by temperature and light conditions. Planta 2012, 236, 1067–1080. [Google Scholar] [CrossRef]
- Ortega-Regules, A.; Romero-Cascales, I.; López-Roca, J.M.; Ros-García, J.M.; Gómez-Plaza, E. Anthocyanin fingerprint of grapes: Environmental and genetic variations. J. Sci. Food Agric. 2006, 86, 1460–1467. [Google Scholar] [CrossRef]
- Shi, T.; Su, Y.; Lan, Y.; Duan, C.; Yu, K. The molecular basis of flavonoid biosynthesis response to water, light, and temperature in grape berries. Front. Plant Sci. 2024, 15, 1441893. [Google Scholar] [CrossRef]
- de Rosas, I.; Deis, L.; Baldo, Y.; Cavagnaro, J.B.; Cavagnaro, P.F. High temperature alters anthocyanin concentration and composition in grape berries of Malbec, Merlot, and Pinot Noir in a cultivar-dependent manner. Plants 2022, 11, 926. [Google Scholar] [CrossRef]
- Rienth, M.; Vigneron, N.; Darriet, P.; Sweetman, C.; Burbidge, C.; Bonghi, C.; Walker, R.P.; Famiani, F.; Castellarin, S.D. Grape berry secondary metabolites and their modulation by abiotic factors in a climate change scenario—A review. Front. Plant Sci. 2021, 12, 643258. [Google Scholar] [CrossRef]
- Naing, A.H.; Kim, C.K. Abiotic stress-induced anthocyanins in plants: Their role in tolerance to abiotic stresses. Physiol. Plant. 2021, 172, 1711–1723. [Google Scholar] [CrossRef]
- Cheynier, V.; Duenas-Paton, M.; Salas, E.; Maury, C.; Souquet, J.; Sarni-Manchado, P.; Fulcrand, H. Structure and properties of wine pigments and tannins. Am. J. Enol. Vitic. 2006, 57, 298–305. [Google Scholar] [CrossRef]
- Koljančić, N.; Furdíková, K.; de Araújo Gomes, A.; Špánik, I. Wine authentication: Current progress and state of the art. Trends Food Sci. Technol. 2024, 150, 104598. [Google Scholar] [CrossRef]
- Garcia-Viñola, V.; Ruiz-de-Villa, C.; Gombau, J.; Poblet, M.; Bordons, A.; Reguant, C.; Rozès, N. Simultaneous Analysis of Organic Acids, Glycerol and Phenolic Acids in Wines Using Gas Chromatography-Mass Spectrometry. Foods 2024, 13, 186. [Google Scholar] [CrossRef]
- Bambina, P.; Spinella, A.; Lo Papa, G.; Chillura Martino, D.F.; Lo Meo, P.; Cinquanta, L.; Conte, P. 1H-NMR Spectroscopy Coupled with Chemometrics to Classify Wines According to Different Grape Varieties and Different Terroirs. Agriculture 2024, 14, 749. [Google Scholar] [CrossRef]
- Ianeselli, A.; Longo, E.; Poggesi, S.; Montali, M.; Boselli, E. A Complete Analysis Pipeline for the Processing, Alignment and Quantification of HPLC–UV Wine Chromatograms. Chromatographia 2024, 87, 159–166. [Google Scholar] [CrossRef]
- Merkytė, V.; Longo, E.; Windisch, G.; Boselli, E. Phenolic compounds as markers of wine quality and authenticity. Foods 2020, 9, 1785. [Google Scholar] [CrossRef]
- Ibern-Gómez, M.; Andrés-Lacueva, C.; Lamuela-Raventós, R.M.; Waterhouse, A.L. Rapid HPLC analysis of phenolic compounds in red wines. Am. J. Enol. Vitic. 2002, 53, 218–221. [Google Scholar] [CrossRef]
- Baiano, A.; Terracone, C. Varietal differences among the phenolic profiles and antioxidant activities of seven table grape cultivars grown in the south of Italy based on chemometrics. J. Agric. Food Chem. 2011, 59, 9815–9826. [Google Scholar] [CrossRef]
- Ginjom, I.; D’Arcy, B.; Caffin, N.; Gidley, M. Phenolic compound profiles in selected Queensland red wines at all stages of the wine-making process. Food Chem. 2011, 125, 823–834. [Google Scholar] [CrossRef]
- Vivar-Quintana, A.M.; Santos-Buelga, C.; Rivas-Gonzalo, J.C. Anthocyanin-derived pigments and colour of red wines. Anal. Chim. Acta 2002, 458, 147–155. [Google Scholar] [CrossRef]
- Theocharis, S.; Gkrimpizis, T.; Karadimou, C.; Alatzas, A.; Koundouras, S.; Taskos, D. Modulating ‘Xinomavro’(Vitis vinifera L.) Vine Growth and Berry Composition: A Comparative Analysis of Rootstock Effects. Horticulturae 2024, 10, 490. [Google Scholar] [CrossRef]
- de Oliveira, J.B.; Egipto, R.; Laureano, O.; de Castro, R.; Pereira, G.E.; Ricardo-da-Silva, J.M. Chemical composition and sensory profile of Syrah wines from semiarid tropical Brazil–Rootstock and harvest season effects. LWT 2019, 114, 108415. [Google Scholar] [CrossRef]
- Stavridou, K.; Soufleros, E.H.; Bouloumpasi, E.; Dagkli, V. The phenolic potential of wines from French grape varieties Cabernet Sauvignon, Merlot and Syrah cultivated in the region of Thessaloniki (Northern Greece) and its evolution during aging. Food Nutr. Sci. 2016, 7, 122–137. [Google Scholar] [CrossRef]
- Ponder, A.; Frąckowiak, M.; Kruk, M.; Hallmann, E. Estimation of Chemical Compounds in Selected Italian and French Wines Produced through Organic and Conventional Methods. Appl. Sci. 2024, 14, 2466. [Google Scholar] [CrossRef]
- Díaz-Fernández, Á.; Díaz-Losada, E.; Moreno, D.; Sánchez, M.E.V. Anthocyanin profile of Galician endangered varieties. A tool for varietal selection. Food Res. Int. 2022, 154, 110983. [Google Scholar] [CrossRef]
- Núñez, V.; Monagas, M.; Gomez-Cordovés, M.C.; Bartolomé, B. Vitis vinifera L. cv. Graciano grapes characterized by its anthocyanin profile. Postharvest Biol. Technol. 2004, 31, 69–79. [Google Scholar] [CrossRef]
- LaFountain, A.M.; Yuan, Y. Repressors of anthocyanin biosynthesis. New Phytol. 2021, 231, 933–949. [Google Scholar] [CrossRef]
- Spanish Meteorological Agency (AEMET). Available online: https://www.aemet.es/es/serviciosclimaticos/datosclimatologicos/valoresclimatologicos?k=coo (accessed on 12 February 2024).
- Jiang, M.; Ren, L.; Lian, H.; Liu, Y.; Chen, H. Novel insight into the mechanism underlying light-controlled anthocyanin accumulation in eggplant (Solanum melongena L.). Plant Sci. 2016, 249, 46–58. [Google Scholar] [CrossRef]
- An, J.; Qu, F.; Yao, J.; Wang, X.; You, C.; Wang, X.; Hao, Y. The bZIP transcription factor MdHY5 regulates anthocyanin accumulation and nitrate assimilation in apple. Hortic. Res. 2017, 4, 17023. [Google Scholar] [CrossRef]
- Prat-García, S.; Oliveira, J.; del Alamo-Sanza, M.; de Freitas, V.; Nevares, I.; Mateus, N. Characterization of anthocyanins and anthocyanin-derivatives in red wines during ageing in custom oxygenation oak wood barrels. Molecules 2020, 26, 64. [Google Scholar] [CrossRef]
- He, F.; Liang, N.; Mu, L.; Pan, Q.; Wang, J.; Reeves, M.J.; Duan, C. Anthocyanins and their variation in red wines I. Monomeric anthocyanins and their color expression. Molecules 2012, 17, 1571–1601. [Google Scholar] [CrossRef] [PubMed]
- He, F.; Liang, N.; Mu, L.; Pan, Q.; Wang, J.; Reeves, M.J.; Duan, C. Anthocyanins and their variation in red wines II. Anthocyanin derived pigments and their color evolution. Molecules 2012, 17, 1483–1519. [Google Scholar] [CrossRef]
- Yang, P.; Basílio, N.; Liao, X.; Xu, Z.; Dangles, O.; Pina, F. Influence of Acylation by Hydroxycinnamic Acids on the Reversible and Irreversible Processes of Anthocyanins in Acidic to Basic Aqueous Solution. J. Agric. Food Chem. 2024, 72, 25955–25971. [Google Scholar] [CrossRef]
- Cosme, F.; Milheiro, J.; Pires, J.; Guerra-Gomes, F.I.; Filipe-Ribeiro, L.; Nunes, F.M. Authentication of Douro DO monovarietal red wines based on anthocyanin profile: Comparison of partial least squares–discriminant analysis, decision trees and artificial neural networks. Food Control 2021, 125, 107979. [Google Scholar] [CrossRef]


| V | N | LP | B | T | LN | M | S | C | R | |
|---|---|---|---|---|---|---|---|---|---|---|
| D-3-glc | 2.26 a (3.27) | 2.27 a (1.33) | 3.37 ab (3.33) | 4.25 ab (3.28) | 4.58 ab (3.42) | 6.84 bc (5.17) | 7.35 bc (5.40) | 9.06 c (6.04) | 9.23 c (5.89) | 16.94 d (2.57) |
| C-3-glc | 0.46 a (1.46) | 0.44 a (0.45) | 1.56 a (1.49) | 1.22 a (2.08) | 0.72 a (0.79) | 1.07 a (1.20) | 0.79 a (0.44) | 1.68 a (2.64) | 1.03 a (1.61) | 1.10 a (0.40) |
| Pt-3-glc | 2.30 a (3.27) | 2.50 a (1.84) | 4.18 ab (3.41) | 5.38 ab (5.03) | 5.22 ab (3.89) | 8.16 bc (6.19) | 6.69 abc (5.56) | 10.71 cd (7.17) | 14.62 de (8.98) | 16.84 e (2.77) |
| Pe-3-glc | 2.51 a (4.17) | 1.97 a (1.62) | 5.21 a (10.23) | 6.45 a (6.47) | 2.80 a (2.34) | 6.46 a (6.04) | 3.73 a (2.13) | 6.44 a (3.52) | 6.84 a (3.38) | 7.56 a (1.84) |
| M-3-glc | 22.76 a (28.37) | 18.95 a (16.30) | 42.92 ab (36.67) | 49.86 ab (47.42) | 53.54 ab (57.02) | 63.40 ab (46.46) | 31.44 ab (28.64) | 74.75 b (51.69) | 138.72 c (65.03) | 122.95 c (43.93) |
| C-6-ac-3-glc | 1.99 abc (1.46) | 0.78 a (0.56) | 3.44 cd (2.17) | 3.12 bcd (2.46) | 2.82 bcd (1.97) | 1.62 ab (1.40) | 2.63 bcd (1.48) | 3.77 d (1.36) | 4.02 d (3.19) | 3.26 bcd (0.84) |
| Pt-6-ac-3-glc | 2.54 abc (1.88) | 1.87 ab (1.20) | 1.78 a (1.71) | 3.52 abcd (2.86) | 3.94 bcde (3.24) | 2.24 abc (1.63) | 4.15 cde (1.94) | 5.64 e (3.57) | 2.07 abc (1.28) | 5.50 de (2.01) |
| Pe-6-ac-3-glc | 3.01 ab (1.68) | 1.67 a (1.37) | 2.64 ab (2.13) | 4.47 b (3.51) | 4.00 ab (2.73) | 2.88 ab (1.94) | 4.50 b (2.69) | 7.80 c (4.64) | 1.90 a (1.19) | 6.86 c (1.29) |
| M-6-ac-3-glc | 5.30 ab (3.38) | 3.10 a (1.51) | 3.77 a (2.84) | 6.14 ab (4.55) | 9.36 ab (6.14) | 8.03 ab (8.62) | 11.17 b (7.12) | 21.73 c (11.89) | 6.19 ab (4.87) | 27.54 c (10.46) |
| Pe-6-co-3-glc | 6.75 abc (7.36) | 2.91 a (1.27) | 6.06 ab (4.08) | 6.88 abc (7.00) | 8.20 abc (7.56) | 4.02 a (3.14) | 10.14 bcd (10.26) | 10.28 bcd (9.43) | 11.84 cd (9.61) | 14.47 d (9.18) |
| M-6-co-3-glc | 9.43 ab (6.84) | 5.85 a (5.05) | 10.89 ab (9.92) | 12.18 ab (8.54) | 12.45 ab (8.27) | 12.39 ab (8.15) | 14.07 ab (11.88) | 17.87 b (11.53) | 10.08 ab (5.27) | 17.19 b (6.53) |
| Glc/oenin | 7.52 a (9.67) | 7.17 a (4.59) | 14.33 abc (16.65) | 17.29 abc (14.18) | 13.32 ab (9.03) | 22.80 bcd (16.23) | 18.56 abcd (12.57) | 27.89 cd (16.72) | 31.72 de (17.51) | 42.44 e (4.20) |
| Glc | 43.92 a (21.88) | 57.02 ab (21.80) | 61.99 ab (22.19) | 56.62 ab (27.05) | 55.03 ab (23.20) | 70.20 bc (15.55) | 53.06 ab (25.01) | 57.60 ab (12.06) | 81.69 c (3.63) | 68.81 bc (4.54) |
| Acet | 12.85 ab (6.87) | 7.42 a (3.36) | 11.64 ab (7.32) | 17.26 ab (10.54) | 20.12 b (10.72) | 14.77 ab (11.74) | 22.45 b (11.92) | 38.94 c (18.86) | 14.18 ab (6.86) | 43.16 c (12.86) |
| Cou | 30.29 b (17.51) | 22.93 ab (12.80) | 21.98 ab (15.76) | 23.04 ab (16.74) | 22.96 ab (11.66) | 15.83 a (10.37) | 23.32 ab (17.83) | 17.55 ab (7.95) | 10.74 a (3.47) | 13.39 a (2.91) |
| Tot | 59.31 ab (47.57) | 42.30 a (20.68) | 85.84 ab (63.78) | 103.47 abc (71.47) | 107.6 abc (70.45) | 117.1 bc (75.81) | 96.66 ab (60.31) | 169.74 cd (92.00) | 206.54 de (90.13) | 240.21 e (61.43) |
| El Hierro | La Gomera | La Palma | Gran Canaria | Lanzarote | Tenerife | |
|---|---|---|---|---|---|---|
| D-3-glc | 1.56 a (1.40) | 2.57 ab (1.09) | 2.72 ab (1.55) | 3.41 abc (3.37) | 6.99 bc (5.16) | 7.48 c (5.65) |
| C-3-glc | 0.49 a (0.58) | 1.62 a (1.42) | 0.86 a (1.04) | 1.01 a (1.17) | 1.19 a (1.01) | 1.19 a (1.83) |
| Pt-3-glc | 1.55 a (1.54) | 3.54 a (1.10) | 3.17 a (2.20) | 3.42 a (3.12) | 6.92 ab (4.68) | 9.00 b (6.83) |
| Pe-3-glc | 1.79 a (2.30) | 2.62 ab (1.05) | 2.47 ab (1.82) | 2.44 ab (2.14) | 5.34 ab (3.44) | 7.17 b (6.68) |
| M-3-glc | 14.61 a (17.46) | 30.27 a (10.02) | 25.25 a (18.79) | 26.12 a (23.63) | 40.96 ab (17.57) | 73.00 b (53.20) |
| C-6-ac-3-glc | 2.14 a (1.57) | 1.93 a (0.91) | 0.94 a (0.73) | 1.46 a (0.66) | 2.53 a (2.27) | 2.54 a (2.08) |
| Pt-6-ac-3-glc | 2.76 ab (2.31) | 1.34 a (0.99) | 1.88 ab (1.75) | 2.38 ab (1.76) | 3.60 b (3.17) | 2.98 ab (2.42) |
| Pe-6-ac-3-glc | 2.94 ab (1.76) | 2.03 a (1.17) | 1.94 a (2.22) | 3.22 ab (2.70) | 4.73 b (5.32) | 3.87 ab (2.98) |
| M-6-ac-3-glc | 4.42 a (2.59) | 3.94 a (2.45) | 3.66 a (3.37) | 6.30 a (5.26) | 7.65 a (7.95) | 10.38 a (10.33) |
| Pe-6-co-3-glc | 4.85 a (2.70) | 2.72 a (1.61) | 2.95 a (1.41) | 4.93 a (4.30) | 2.94 a (3.10) | 6.80 a (6.74) |
| M-6-co-3-glc | 10.40 ab (5.93) | 6.54 ab (6.77) | 5.48 a (5.88) | 6.61 ab (7.31) | 9.89 ab (12.72) | 13.86 b (8.47) |
| Glc/oenin | 5.39 a (5.47) | 10.35 ab (3.45) | 9.23 ab (5.52) | 10.28 ab (8.69) | 20.44 bc (13.47) | 25.24 c (18.34) |
| Glc | 38.20 a (28.40) | 69.73 c (11.08) | 64.25 ab (17.24) | 52.79 ab (21.62) | 71.31 c (10.90) | 66.66 bc (18.37) |
| Acet | 12.27 a (6.70) | 9.24 a (3.95) | 8.42 a (6.15) | 13.36 a (8.97) | 18.51 a (17.94) | 19.78 av (15.07) |
| Cou | 34.44 b (20.14) | 14.89 a (9.92) | 18.06 a (11.24) | 20.98 a (12.13) | 11.45 a (7.89) | 17.58 a (11.47) |
| Tot | 47.52 a (27.47) | 59.12 a (17.86) | 51.33 a (29.14) | 61.29 a (38.78) | 92.74 ab (60.69) | 138.50 b (84.93) |
| D-3-glc | C-3-glc | Pt-3-glc | Pe-3-glc | M-3-glc | C-6-ac-3-glc | Pt-6-ac-3-glc | Pe-6-ac-3-glc | M-6-ac-3-glc | Pe-6-co-3-glc | M-6-co-3-glc | Glc/oenin | Glc | Acet | Cou | Tot | |
|---|---|---|---|---|---|---|---|---|---|---|---|---|---|---|---|---|
| D-3-glc | 1 | 0.205 ** | 0.936 ** | 0.648 ** | 0.804 ** | 0.462 ** | 0.407 ** | 0.462 ** | 0.695 ** | 0.309 ** | 0.472 ** | 0.922 ** | 0.403 ** | 0.690 ** | −0.393 ** | 0.882 ** |
| C-3-glc | 0.002 | 1 | 0.209 ** | 0.338 ** | 0.192 ** | 0.286 ** | 0.010 | 0.037 | 0.108 | −0.022 | −0.037 | 0.369 ** | 0.263 ** | 0.121 | −0.281 ** | 0.213 ** |
| Pt-3-glc | 0.000 | 0.002 | 1 | 0.665 ** | 0.931 ** | 0.470 ** | 0.297 ** | 0.369 ** | 0.689 ** | 0.296 ** | 0.436 ** | 0.915 ** | 0.482 ** | 0.649 ** | −0.454 ** | 0.948 ** |
| Pe-3-glc | 0.000 | 0.000 | 0.000 | 1 | 0.644 ** | 0.390 ** | 0.160 * | 0.302 ** | 0.326 ** | 0.112 | 0.374 ** | 0.845 ** | 0.438 ** | 0.360 ** | −0.386 ** | 0.687 ** |
| M-3-glc | 0.000 | 0.005 | 0.000 | 0.000 | 1 | 0.486 ** | 0.193 ** | 0.279 ** | 0.620 ** | 0.303 ** | 0.398 ** | 0.835 ** | 0.541 ** | 0.569 ** | −0.485 ** | 0.957 ** |
| C-6-ac-3-glc | 0.000 | 0.000 | 0.000 | 0.000 | 0.000 | 1 | 0.380 ** | 0.462 ** | 0.398 ** | 0.389 ** | 0.374 ** | 0.483 ** | 0.027 | 0.562 ** | −0.073 | 0.567 ** |
| Pt-6-ac-3-glc | 0.000 | 0.881 | 0.000 | 0.018 | 0.005 | 0.000 | 1 | 0.751 ** | 0.552 ** | 0.491 ** | 0.553 ** | 0.320 ** | −0.311 ** | 0.742 ** | 0.210 ** | 0.407 ** |
| Pe-6-ac-3-glc | 0.000 | 0.588 | 0.000 | 0.000 | 0.000 | 0.000 | 0.000 | 1 | 0.636 ** | 0.465 ** | 0.632 ** | 0.421 ** | −0.277 ** | 0.820 ** | 0.159 * | 0.501 ** |
| M-6-ac-3-glc | 0.000 | 0.114 | 0.000 | 0.000 | 0.000 | 0.000 | 0.000 | 0.000 | 1 | 0.419 ** | 0.484 ** | 0.613 ** | 0.017 | 0.944 ** | −0.120 | 0.755 ** |
| Pe-6-co-3-glc | 0.000 | 0.753 | 0.000 | 0.100 | 0.000 | 0.000 | 0.000 | 0.000 | 0.000 | 1 | 0.237 ** | 0.242 ** | −0.200 ** | 0.511 ** | 0.226 ** | 0.423 ** |
| M-6-co-3-glc | 0.000 | 0.586 | 0.000 | 0.000 | 0.000 | 0.000 | 0.000 | 0.000 | 0.000 | 0.000 | 1 | 0.453 ** | −0.204 ** | 0.597 ** | 0.294 ** | 0.566 ** |
| Glc/oenin | 0.000 | 0.000 | 0.000 | 0.000 | 0.000 | 0.000 | 0.000 | 0.000 | 0.000 | 0.000 | 0.000 | 1 | 0.471 ** | 0.615 ** | −0.445 ** | 0.897 ** |
| Glc | 0.000 | 0.000 | 0.000 | 0.000 | 0.000 | 0.689 | 0.000 | 0.000 | 0.809 | 0.003 | 0.003 | 0.000 | 1 | −0.095 | −0.924 ** | 0.385 ** |
| Acet | 0.000 | 0.077 | 0.000 | 0.000 | 0.000 | 0.000 | 0.000 | 0.000 | 0.000 | 0.000 | 0.000 | 0.000 | 0.165 | 1 | −0.022 | 0.752 ** |
| Cou | 0.000 | 0.000 | 0.000 | 0.000 | 0.000 | 0.285 | 0.002 | 0.019 | 0.078 | 0.001 | 0.000 | 0.000 | 0.000 | 0.748 | 1 | −0.353 ** |
| Tot | 0.000 | 0.002 | 0.000 | 0.000 | 0.000 | 0.000 | 0.000 | 0.000 | 0.000 | 0.000 | 0.000 | 0.000 | 0.000 | 0.000 | 0.000 | 1 |
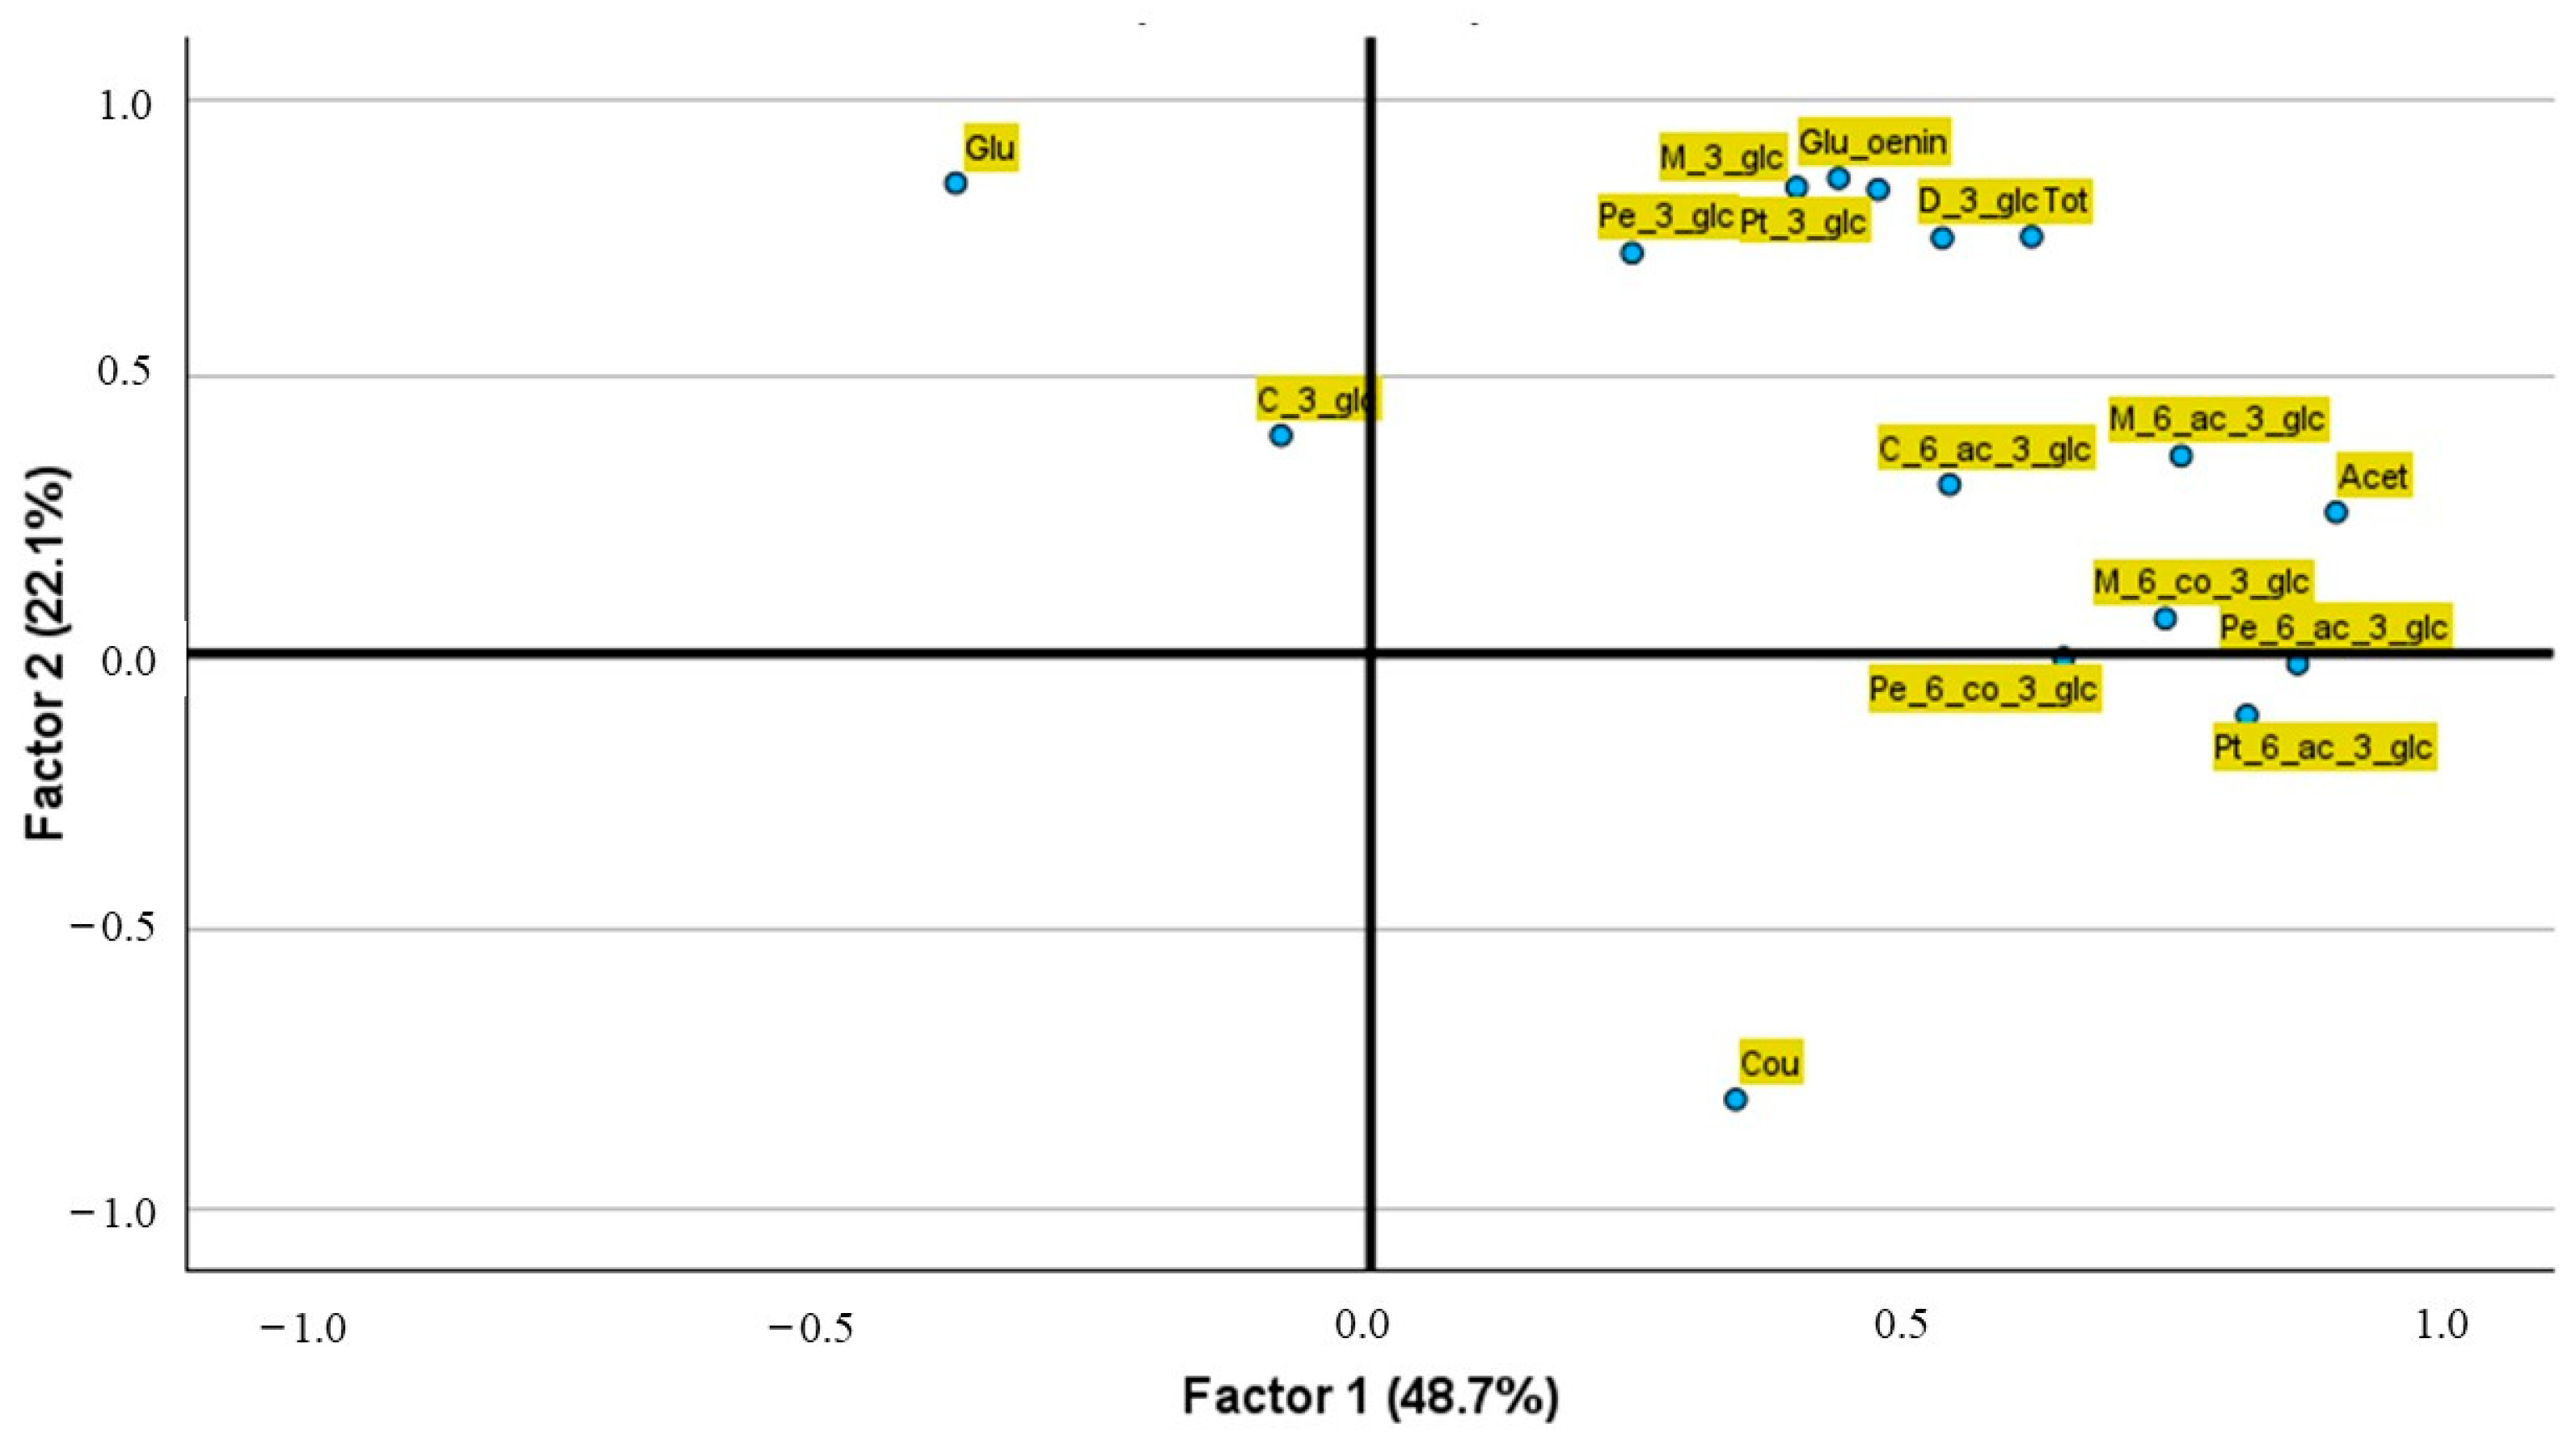
| Influencing Factors | Type of LDA | Correct Classification (% After Cross-Validation) | Selected Variables for F1 and F2 |
|---|---|---|---|
| 1. Grape Cultivar | |||
| All variables | 75.6% (64.1%) | F1: M-6-ac-3-gluc, Acet; F2: Glc. Pt-6-ac-3-glc, | |
| Stepwise | 55.6% (50.7%) | F1: Acet, M-3-glc; F2: M-3-glc, | |
| 2. Precedence Island | |||
| All variables | 75.9% (69.2%) | F1: Tot, M-3-glc, Pt-3-glc; F2: Cou; | |
| Stepwise | 71.8% (56.7%) | F1: M-3-glc, Pt-3-glc; F2: Acet, Glc, Cou; | |
| 3. Tenerife. DO | |||
| All variables | 66.7% (57.9%) | F1: Acet, Pe-6-ac-3-glc; F2: C-3-glc, | |
| Stepwise | 43.9% (40.5%) | F1: Acet, M-6-ac-3-glc; F2: D-3-glc, Cou, | |
| 4. Wine Aging | |||
| All variables | 86.3% (83.4%) | F1: Glc, Cou; F2: Pt-6-ac-3-glc, Glc; | |
| Stepwise | 82.9% (80.3%) | F1: Glc, Cou; F2: Pt-6-ac-3-glc, Cou, |
| Original → ↓ Predicted | LN | N | B | LP | T | C | R | M | V | S |
|---|---|---|---|---|---|---|---|---|---|---|
| LN | 81.7 | 0.0 | 20 | 28.6 | 0.0 | 14.3 | 0.0 | 40 | 17.6 | 16.7 |
| N | 2.2 | 100 | 3.3 | 0.0 | 0.0 | 0.0 | 0.0 | 0.0 | 5.9 | 0.0 |
| B | 6.5 | 0.0 | 46.7 | 0.0 | 0.0 | 0.0 | 0.0 | 0.0 | 0.0 | 0.0 |
| LP | 5.4 | 0.0 | 6.7 | 64.3 | 0.0 | 0.0 | 0.0 | 0.0 | 0.0 | 0.0 |
| T | 0.0 | 0.0 | 0.0 | 0.0 | 100 | 0.0 | 0.0 | 0.0 | 0.0 | 0.0 |
| C | 0.0 | 0.0 | 0.0 | 0.0 | 0.0 | 85.7 | 0.0 | 0.0 | 0.0 | 0.0 |
| R | 0.0 | 0.0 | 0.0 | 0.0 | 0.0 | 0.0 | 100 | 0.0 | 0.0 | 0.0 |
| M | 1.1 | 0.0 | 6.7 | 0.0 | 0.0 | 0.0 | 0.0 | 60 | 0.0 | 16.7 |
| V | 3.2 | 0.0 | 16.7 | 7.1 | 0.0 | 0.0 | 0.0 | 0.0 | 76.5 | 8.3 |
| S | 0.0 | 0.0 | 0.0 | 0.0 | 0.0 | 0.0 | 0.0 | 0.0 | 0.0 | 58.3 |
Disclaimer/Publisher’s Note: The statements, opinions and data contained in all publications are solely those of the individual author(s) and contributor(s) and not of MDPI and/or the editor(s). MDPI and/or the editor(s) disclaim responsibility for any injury to people or property resulting from any ideas, methods, instructions or products referred to in the content. |
© 2025 by the authors. Licensee MDPI, Basel, Switzerland. This article is an open access article distributed under the terms and conditions of the Creative Commons Attribution (CC BY) license (https://creativecommons.org/licenses/by/4.0/).
Share and Cite
Heras-Roger, J.; Díaz-Romero, C. From Vine to Wine: Coloured Phenolics as Fingerprints. Appl. Sci. 2025, 15, 1755. https://doi.org/10.3390/app15041755
Heras-Roger J, Díaz-Romero C. From Vine to Wine: Coloured Phenolics as Fingerprints. Applied Sciences. 2025; 15(4):1755. https://doi.org/10.3390/app15041755
Chicago/Turabian StyleHeras-Roger, Jesús, and Carlos Díaz-Romero. 2025. "From Vine to Wine: Coloured Phenolics as Fingerprints" Applied Sciences 15, no. 4: 1755. https://doi.org/10.3390/app15041755
APA StyleHeras-Roger, J., & Díaz-Romero, C. (2025). From Vine to Wine: Coloured Phenolics as Fingerprints. Applied Sciences, 15(4), 1755. https://doi.org/10.3390/app15041755