Article

Cultural Heritage Color Regeneration: Interactive Genetic Algorithm Optimization Based on Color Network and Harmony Models

1
College of Textile Engineering, Taiyuan University of Technology, Jinzhong 030600, China
2
Newton Business School, Central European Fashion Institute, Shenzhen 518000, China
3
School of Software, Taiyuan University of Technology, Jinzhong 030600, China
4
School of Artificial Intelligence, Taiyuan University of Technology, Jinzhong 030600, China
5
College of Textile and Clothing Engineering, Soochow University, Suzhou 215021, China
6
ENSAIT, GEMTEX, 2 Allee Louise & Victor Champier, 59056 Roubaix, France
*
Authors to whom correspondence should be addressed.
Appl. Sci. 2025, 15(4), 1720; https://doi.org/10.3390/app15041720
Submission received: 19 December 2024 / Revised: 1 February 2025 / Accepted: 5 February 2025 / Published: 8 February 2025

Abstract

:
In response to the inadequate color-matching effectiveness and the difficulty of restoring color intentions in cultural heritage recreation, a Cultural Color Interactive Genetic Algorithm (Cultural Color IGA) is proposed, which combines a color network model and a color harmony prediction model. First, the role of the color network model in providing color genes for subsequent design is emphasized. Then, a dataset of 10,743 color and color rating data points is used to train 12 color harmony prediction models, with the most efficient stacking model selected to improve the efficiency of user evaluation of color schemes. A prototype system for color regeneration is built in Python, and a user interface is designed. The example analysis is conducted using the Yungang Grottoes as the source of color imagery, and image colorization is tested. Independent experiments compare the proposed method with traditional IGA in terms of average fitness, maximum fitness, and evaluation time. Fuzzy evaluation is applied to assess the effectiveness of cultural heritage color regeneration design. The results show that the trained stacking model achieves an accuracy of 65.52% in color harmony prediction, outperforming previous methods. Compared to the traditional IGA algorithm, Cultural Color IGA reduces the number of user evaluations by 67.4%, improves the average fitness by 22.68%, and increases the maximum fitness by approximately 13.37%. Regarding cultural heritage color regeneration effectiveness, 80.6% of respondents considered the generated color schemes to be of good or higher quality. This method not only generates design solutions with high cultural representation and color harmony but also improves the efficiency and sustainability of the design process by reducing trial numbers and manual evaluation workload. It demonstrates the potential of digital technologies in the protection and sustainable application of cultural heritage color, offering valuable references for the digital preservation and innovative design of cultural heritage.

1. Introduction

Cultural sustainability is a comprehensive concept that emphasizes the need to focus not only on protecting and preserving the core values of traditional culture in heritage conservation but also on its adaptability and sustainable development in the context of modern society. This concept aims to ensure that traditional culture, while maintaining its authenticity and core spirit, can be harmonized with contemporary life and social needs, thereby enabling the dynamic transmission of cultural heritage and infusing it with new vitality and value [1,2].
In the practical implementation of cultural heritage conservation, science, and technology provide essential support for achieving cultural sustainability. Advanced methods such as digital technologies, 3D scanning, and artificial intelligence analysis enable more accurate reproduction and optimization of the unique characteristics of traditional arts. Beyond physical preservation, these technologies further offer possibilities for the creative transmission of cultural heritage [3,4]. For example, scientific technologies can assist in restoring or recreating art features that have become blurred or damaged, accurately analyzing the forms and color logic in traditional culture, and using modern techniques to transform them into more accessible and contemporary art forms. This innovative practice opens new pathways for the sustainable transmission of cultural heritage while enhancing public awareness and participation in traditional culture.
In recent years, the widespread application of intelligent algorithms in art design has injected new momentum and possibilities into cultural heritage conservation. In the realm of cultural innovation and transmission, artificial intelligence technology is gradually demonstrating its unique advantages by analyzing artistic rules through deep learning algorithms and generating design solutions that align with both traditional artistic features and modern aesthetic demands [5]. Among these, color regeneration and design play a key role. The color art of traditional cultural heritage often carries profound historical and cultural meanings. Color regeneration technology not only allows for the precise restoration of the colors of historical artifacts but also integrates modern design language to imbue them with new aesthetic value. This intelligent algorithm-based color regeneration technology provides crucial support for the dynamic protection and innovative transmission of cultural heritage, fostering dialogue and symbiosis between traditional arts and modern society [6,7]. However, the current approach still exhibits certain limitations in the automation of color regeneration, optimization of user interaction, and accuracy of color harmony prediction.
To address the aforementioned issues, this study proposes the Cultural Color IGA algorithm, which integrates an interactive genetic algorithm (IGA) as the core, a color network model as the source of initial color genes, and a color harmony prediction model as the fitness evaluation surrogate. By leveraging the color characteristics of cultural heritage, this approach facilitates the regeneration and modernization of cultural heritage colors. Specifically, the objectives of this study include the following:
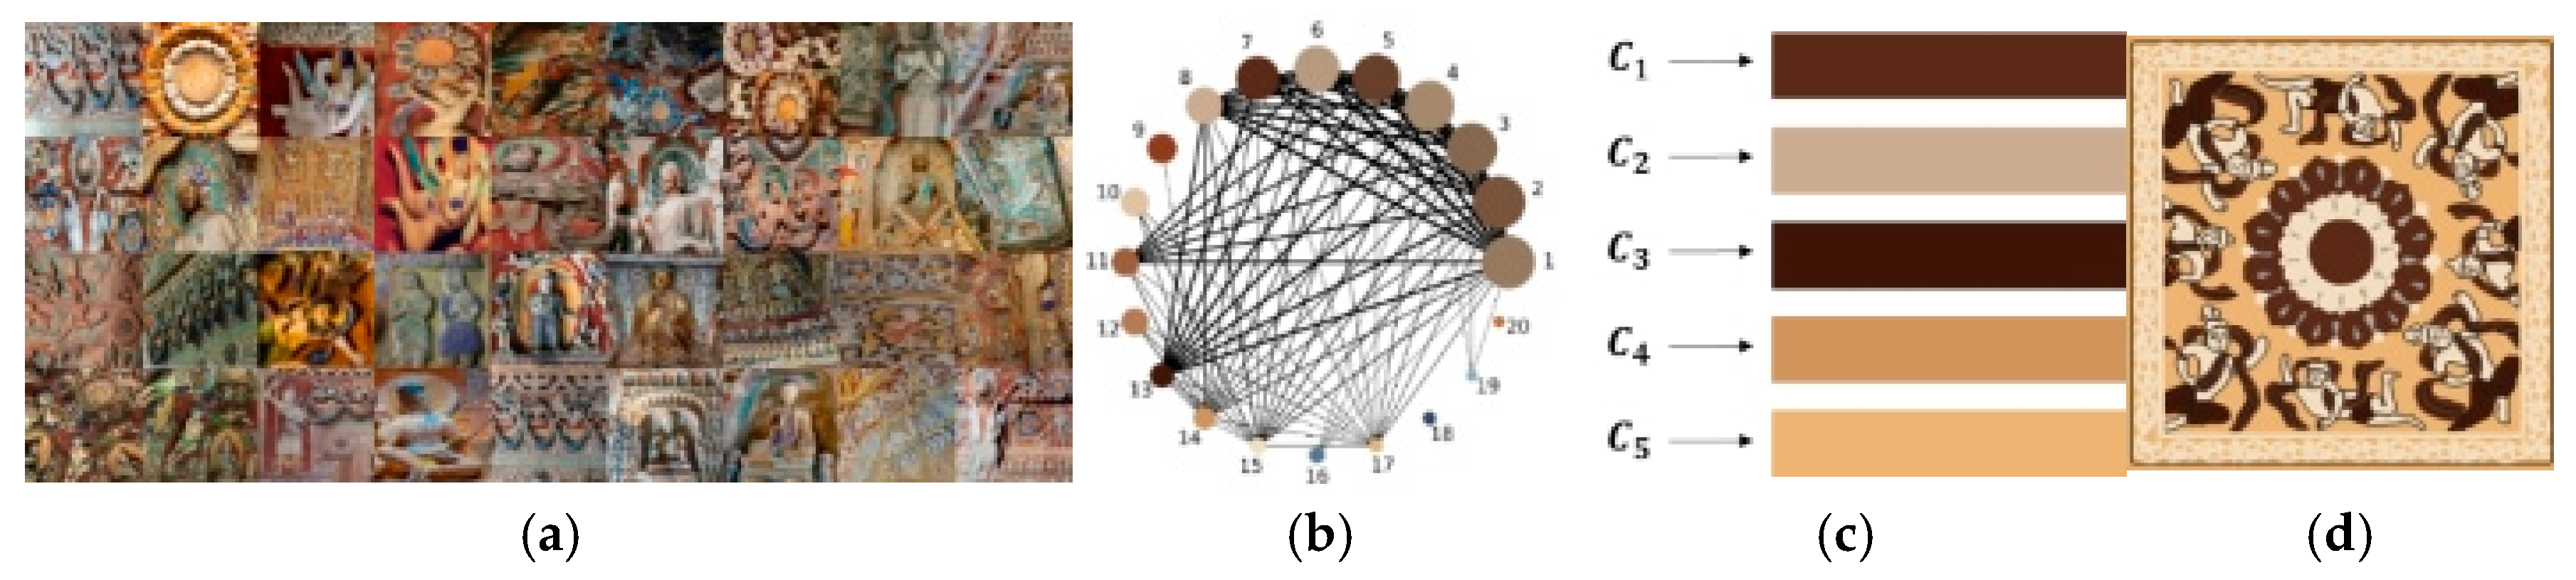
  • Enhancing the cultural adaptability of color-matching—Extracting color features specific to cultural contexts based on the color network model to construct an initial color gene set that aligns with traditional color imagery;
  • Improving the automation of color evaluation—Employing a color harmony prediction model to partially replace manual evaluation, thereby reducing user fatigue and enhancing optimization efficiency;
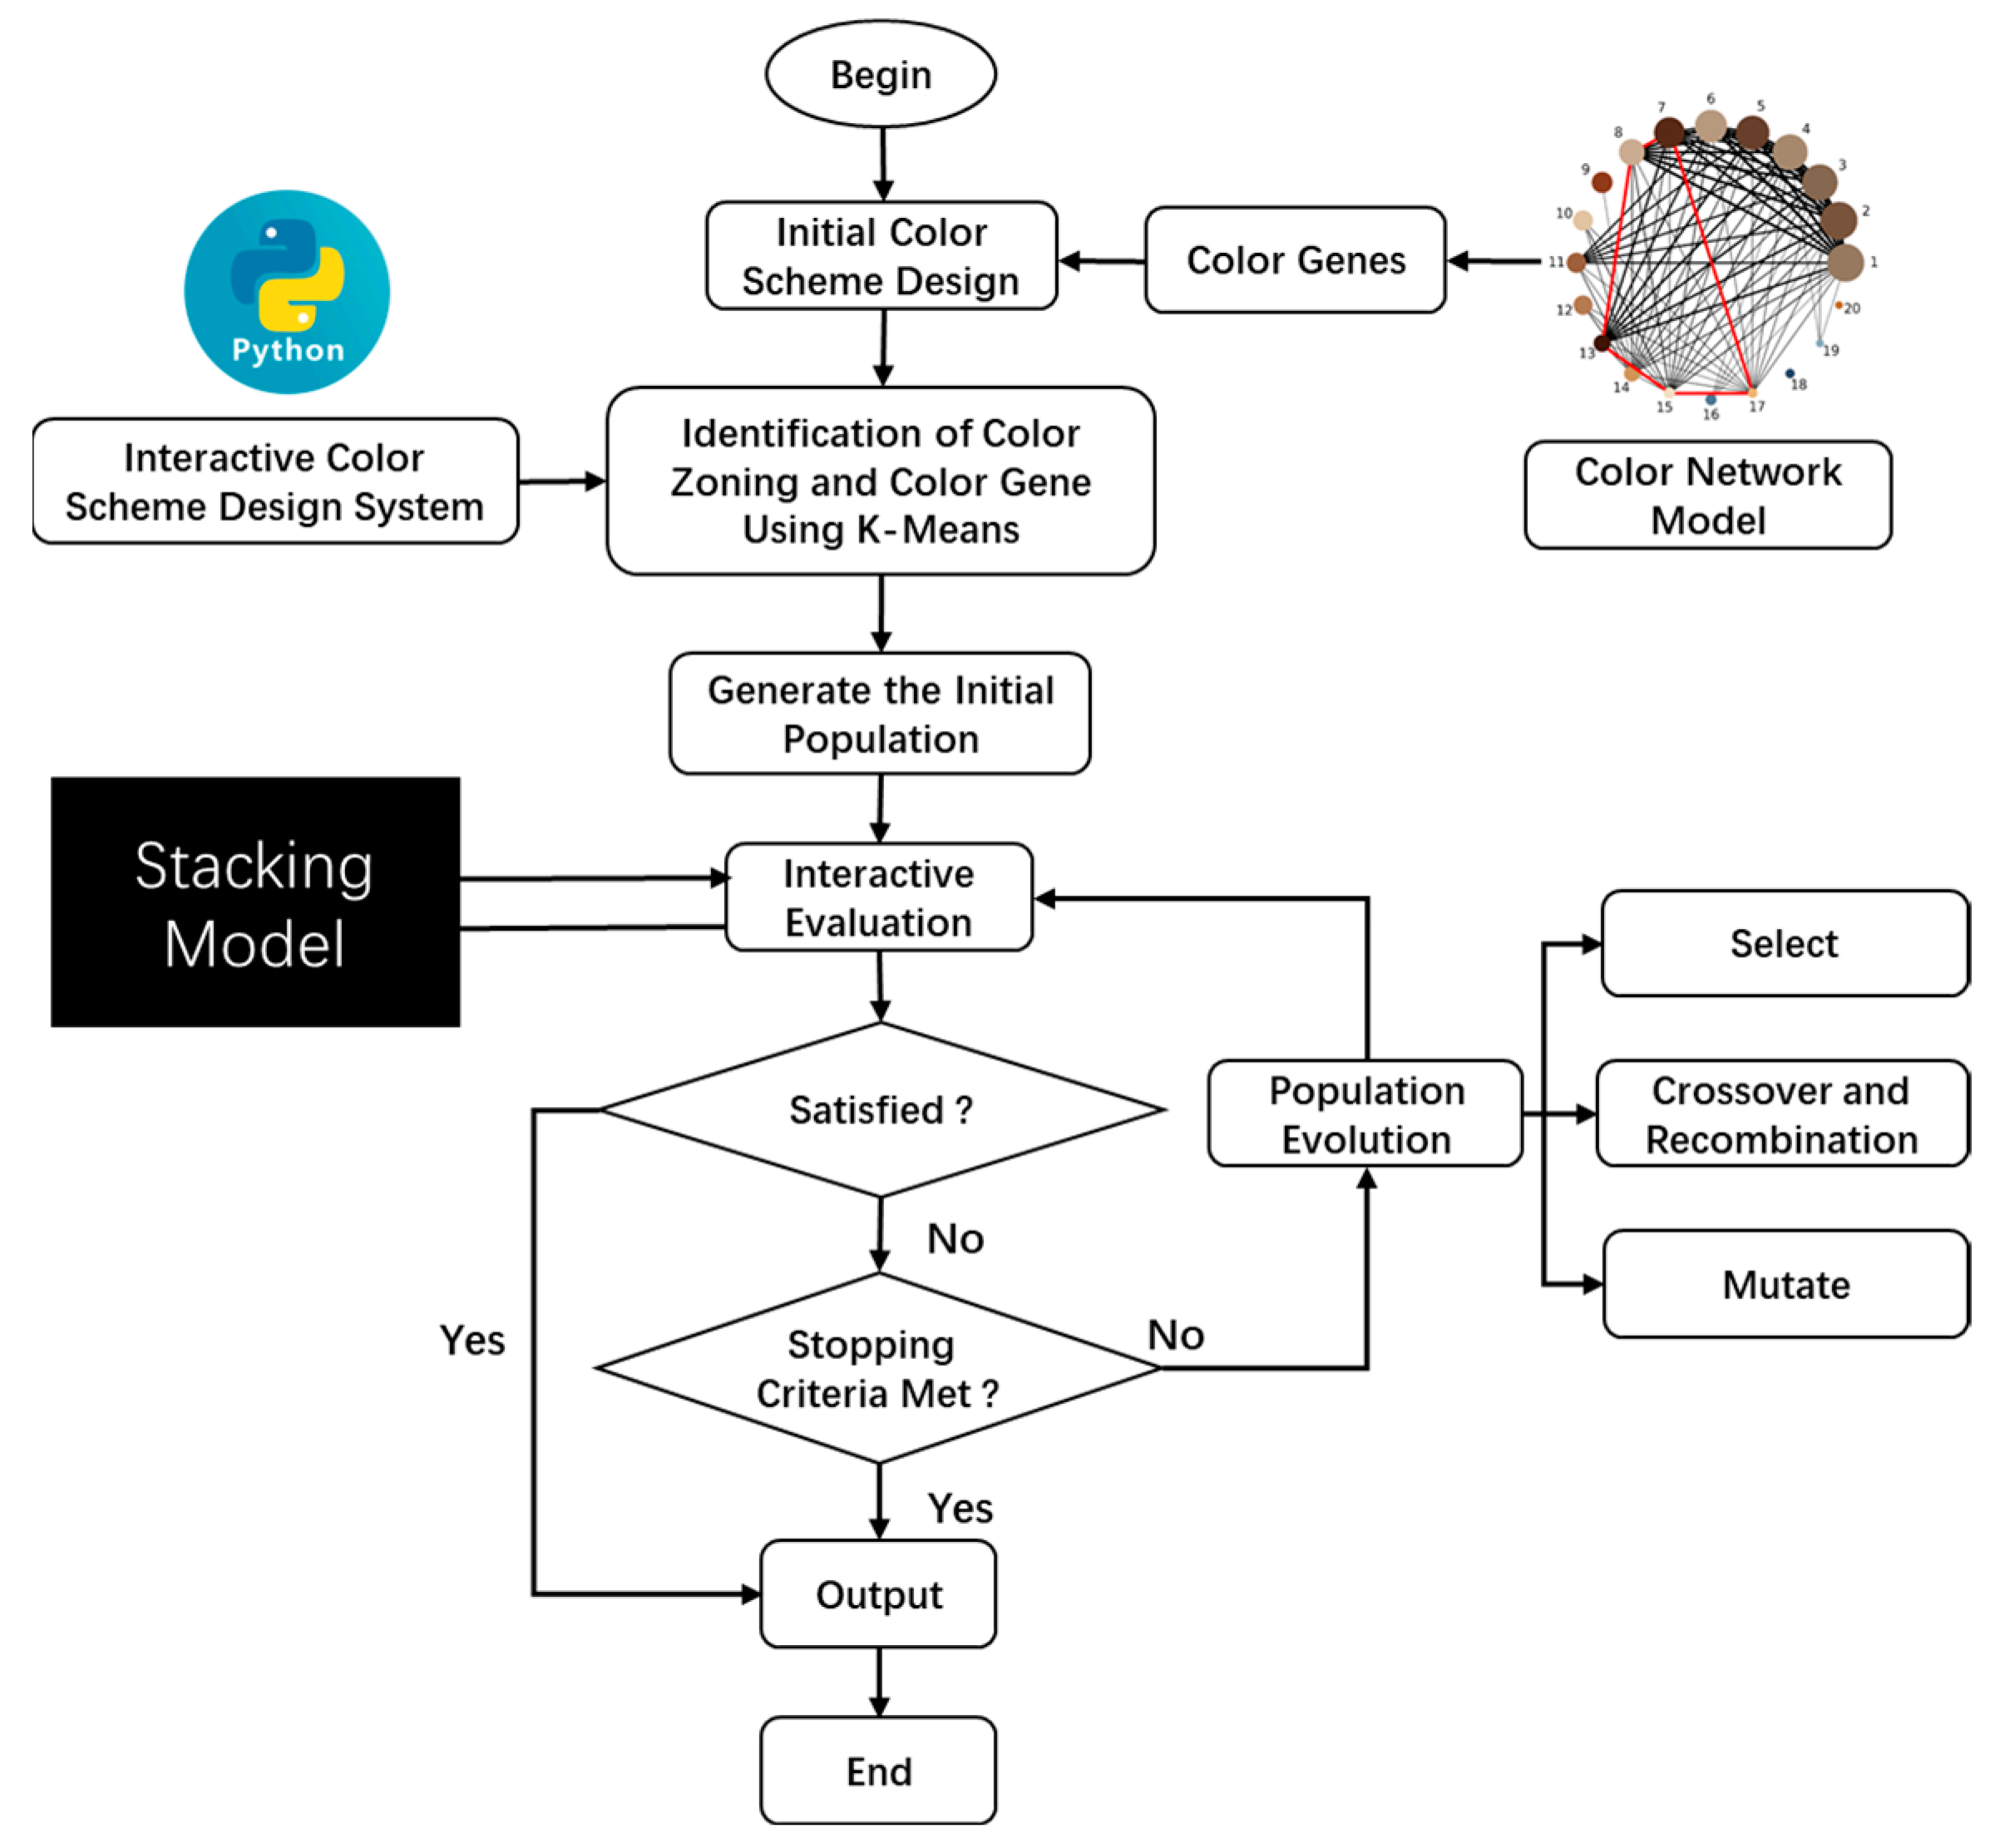
  • Developing an efficient color regeneration system—Building a Python-based color optimization system (Python 3.9.7.) and conducting case studies and comparative analyses using the Yungang Grottoes as an experimental subject.
The main contributions of this study are as follows:
  • Proposing an optimized IGA framework—This study integrates the color network model and the color harmony prediction model to refine the application of IGA in cultural heritage color regeneration, improving both automation and accuracy in color-matching;
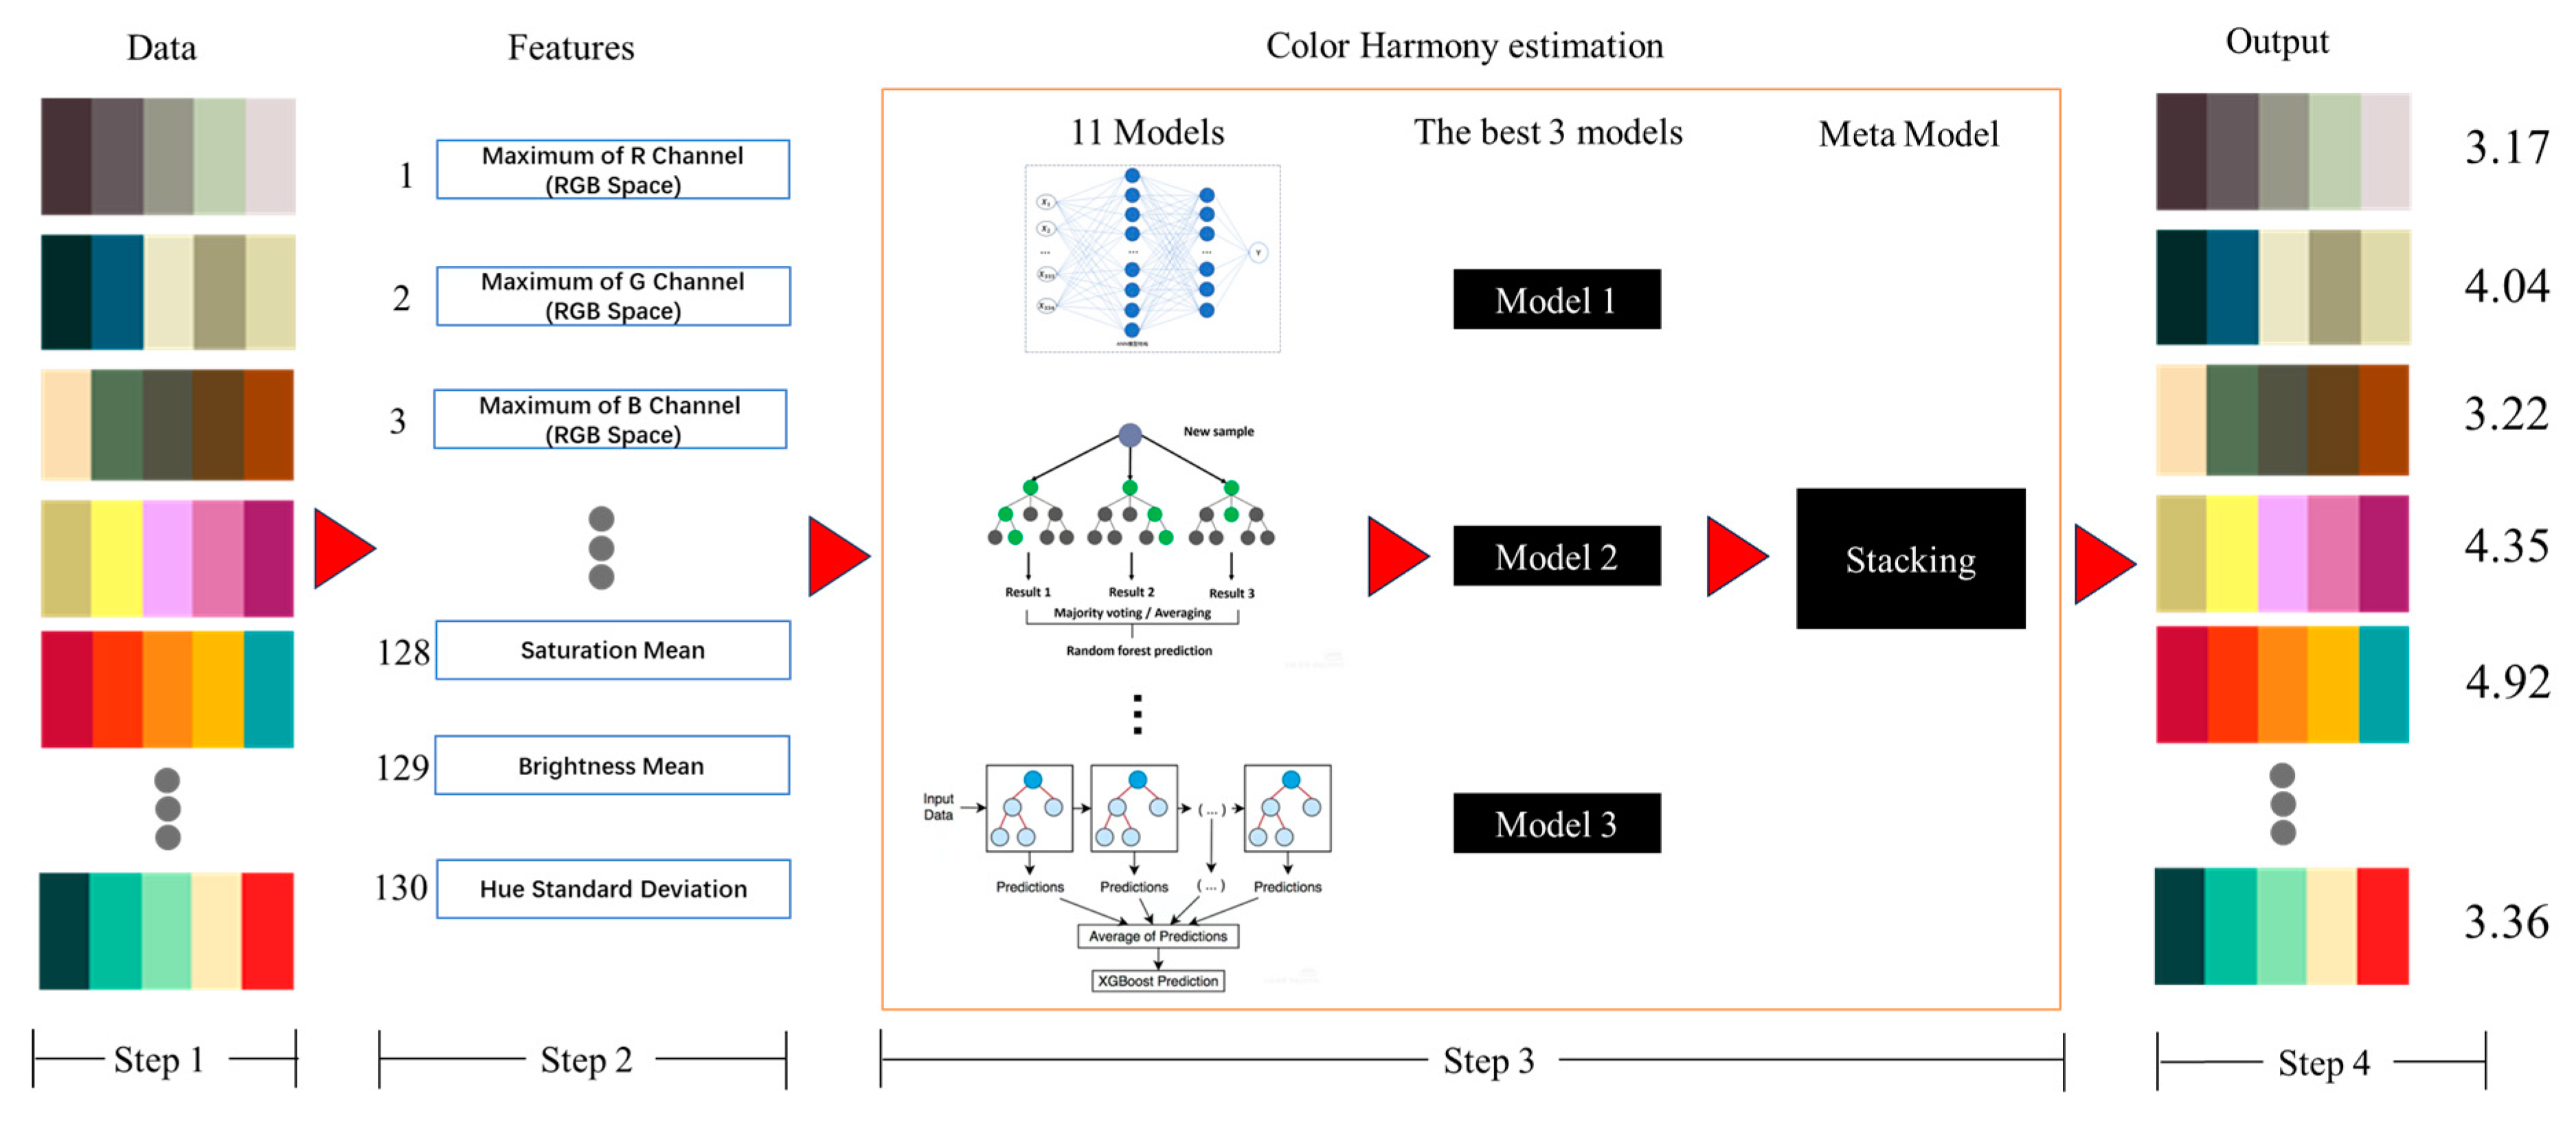
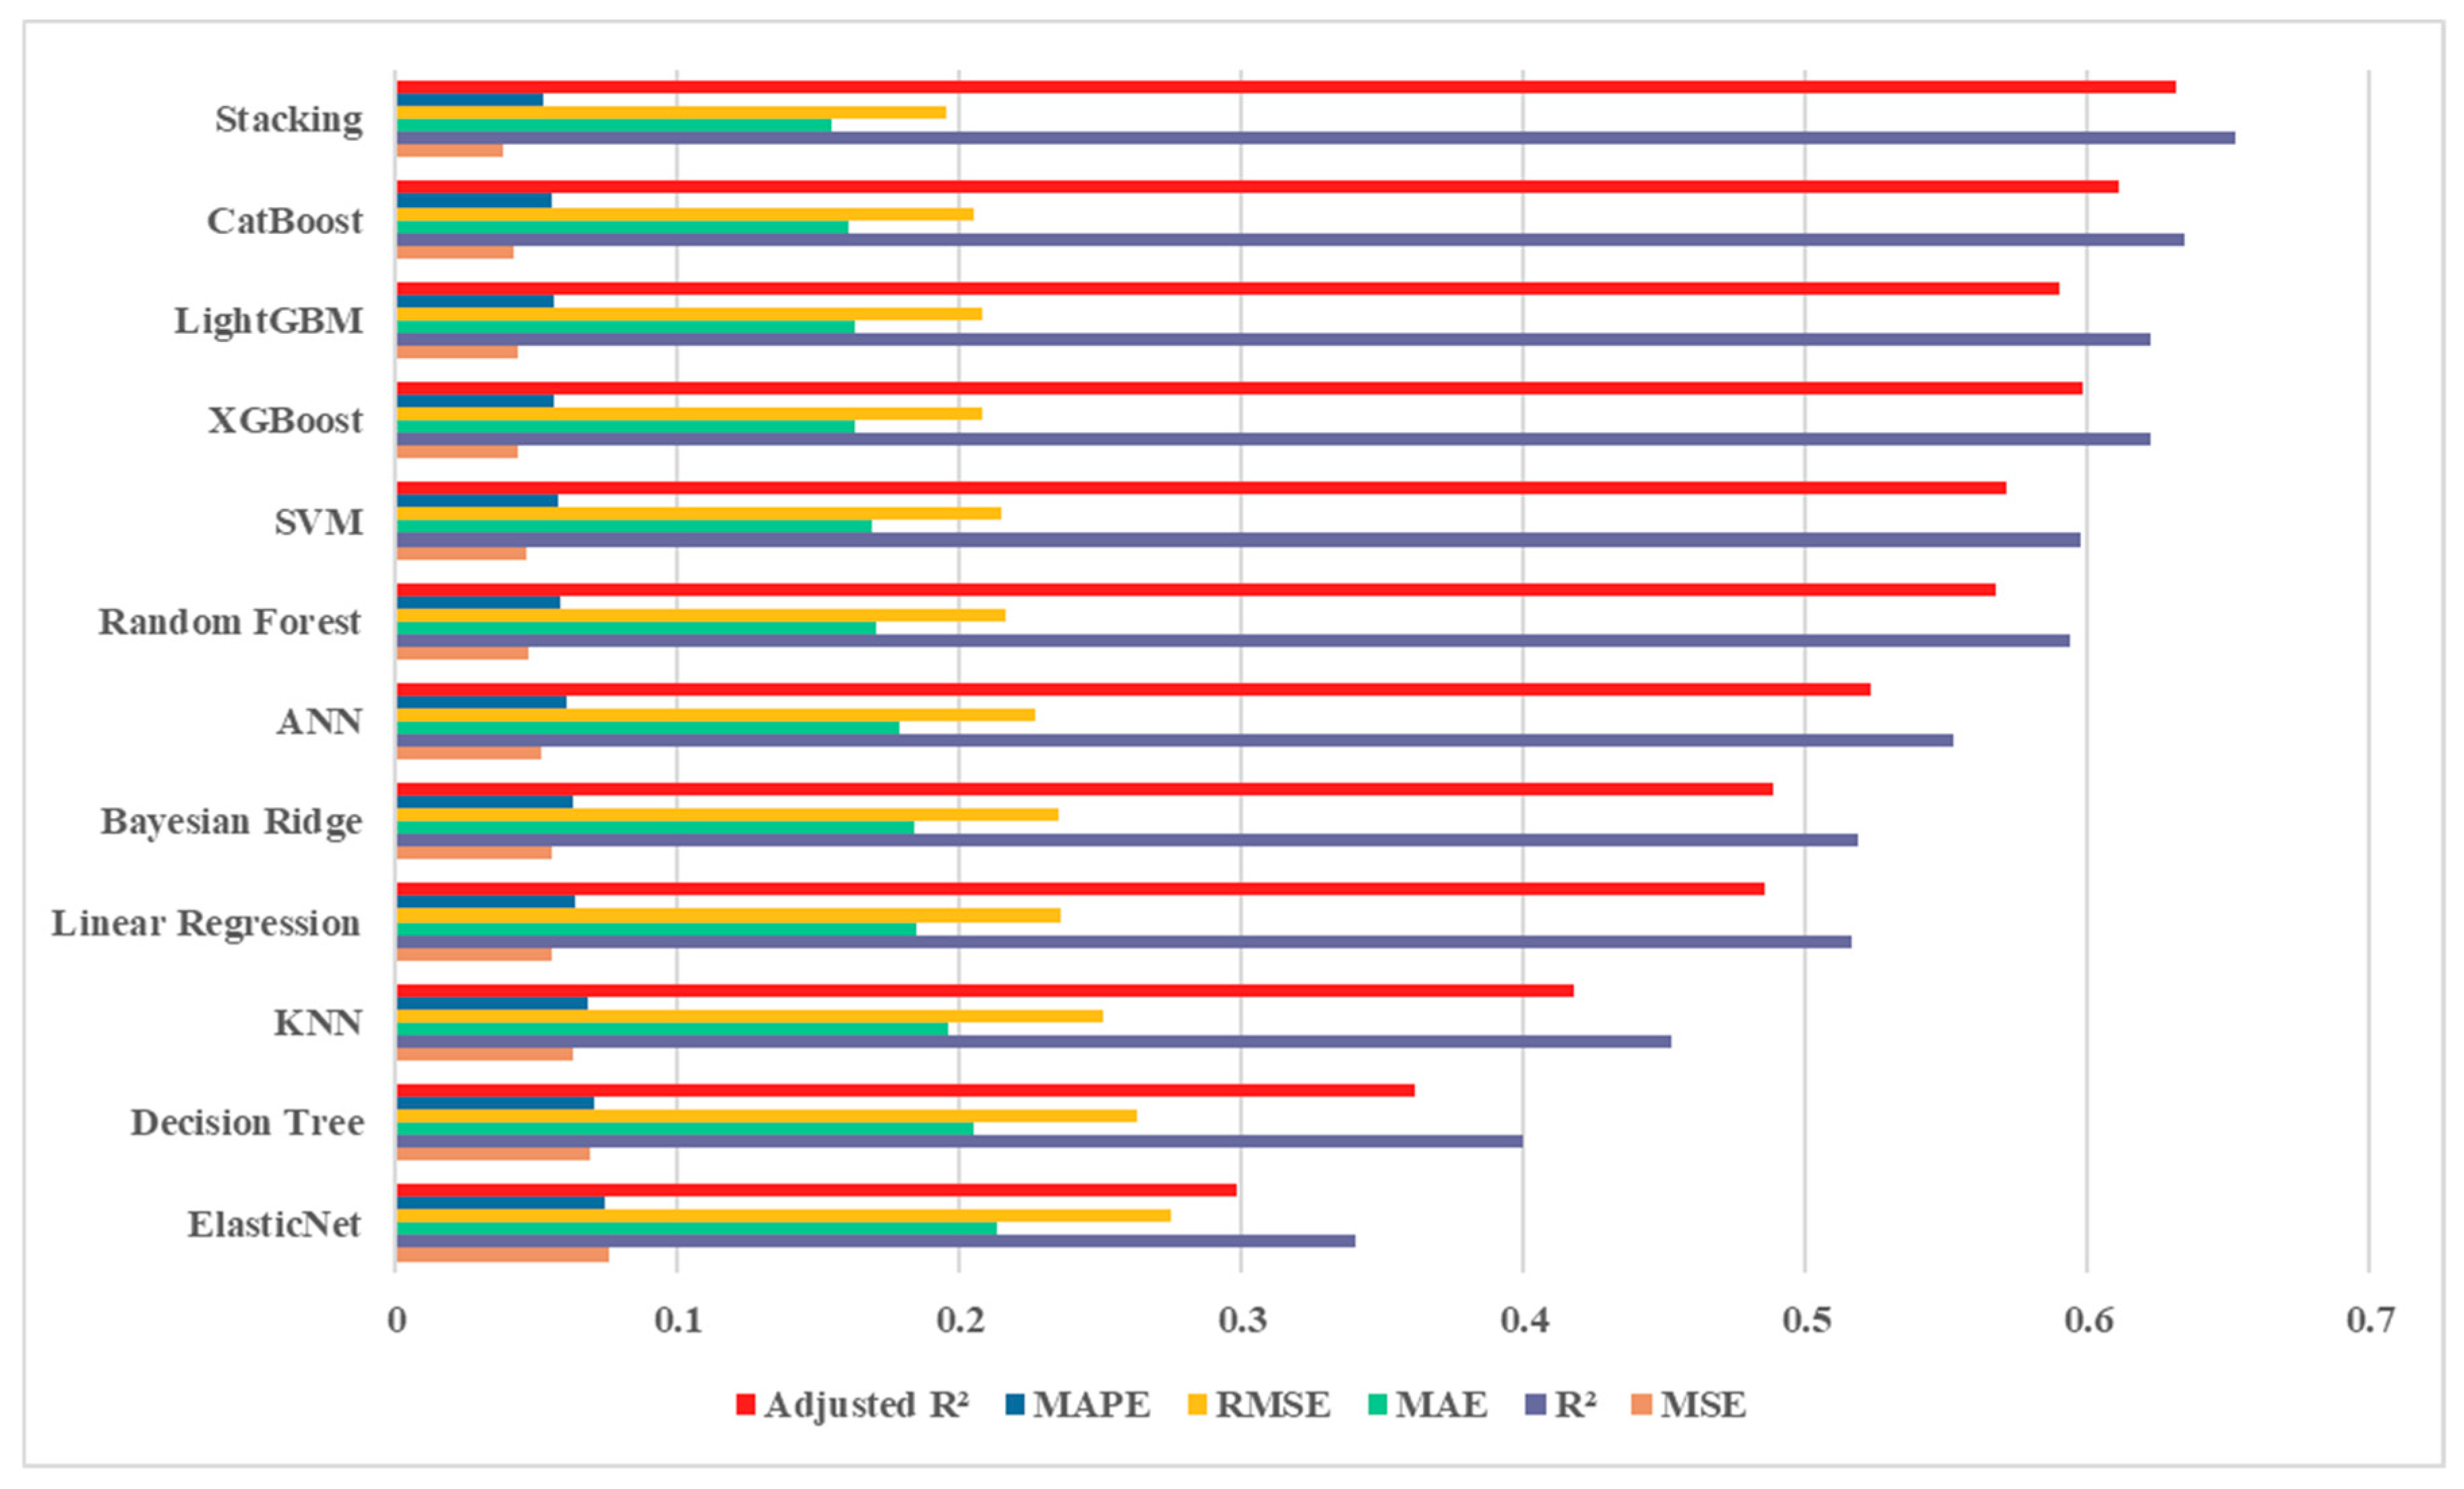
  • Introducing a stacking-based color harmony prediction model—Training 12 color harmony prediction models on a dataset of 10,743 color records and selecting the optimal stacking model, which achieves a color harmony prediction accuracy of 65.52%, significantly outperforming traditional methods;
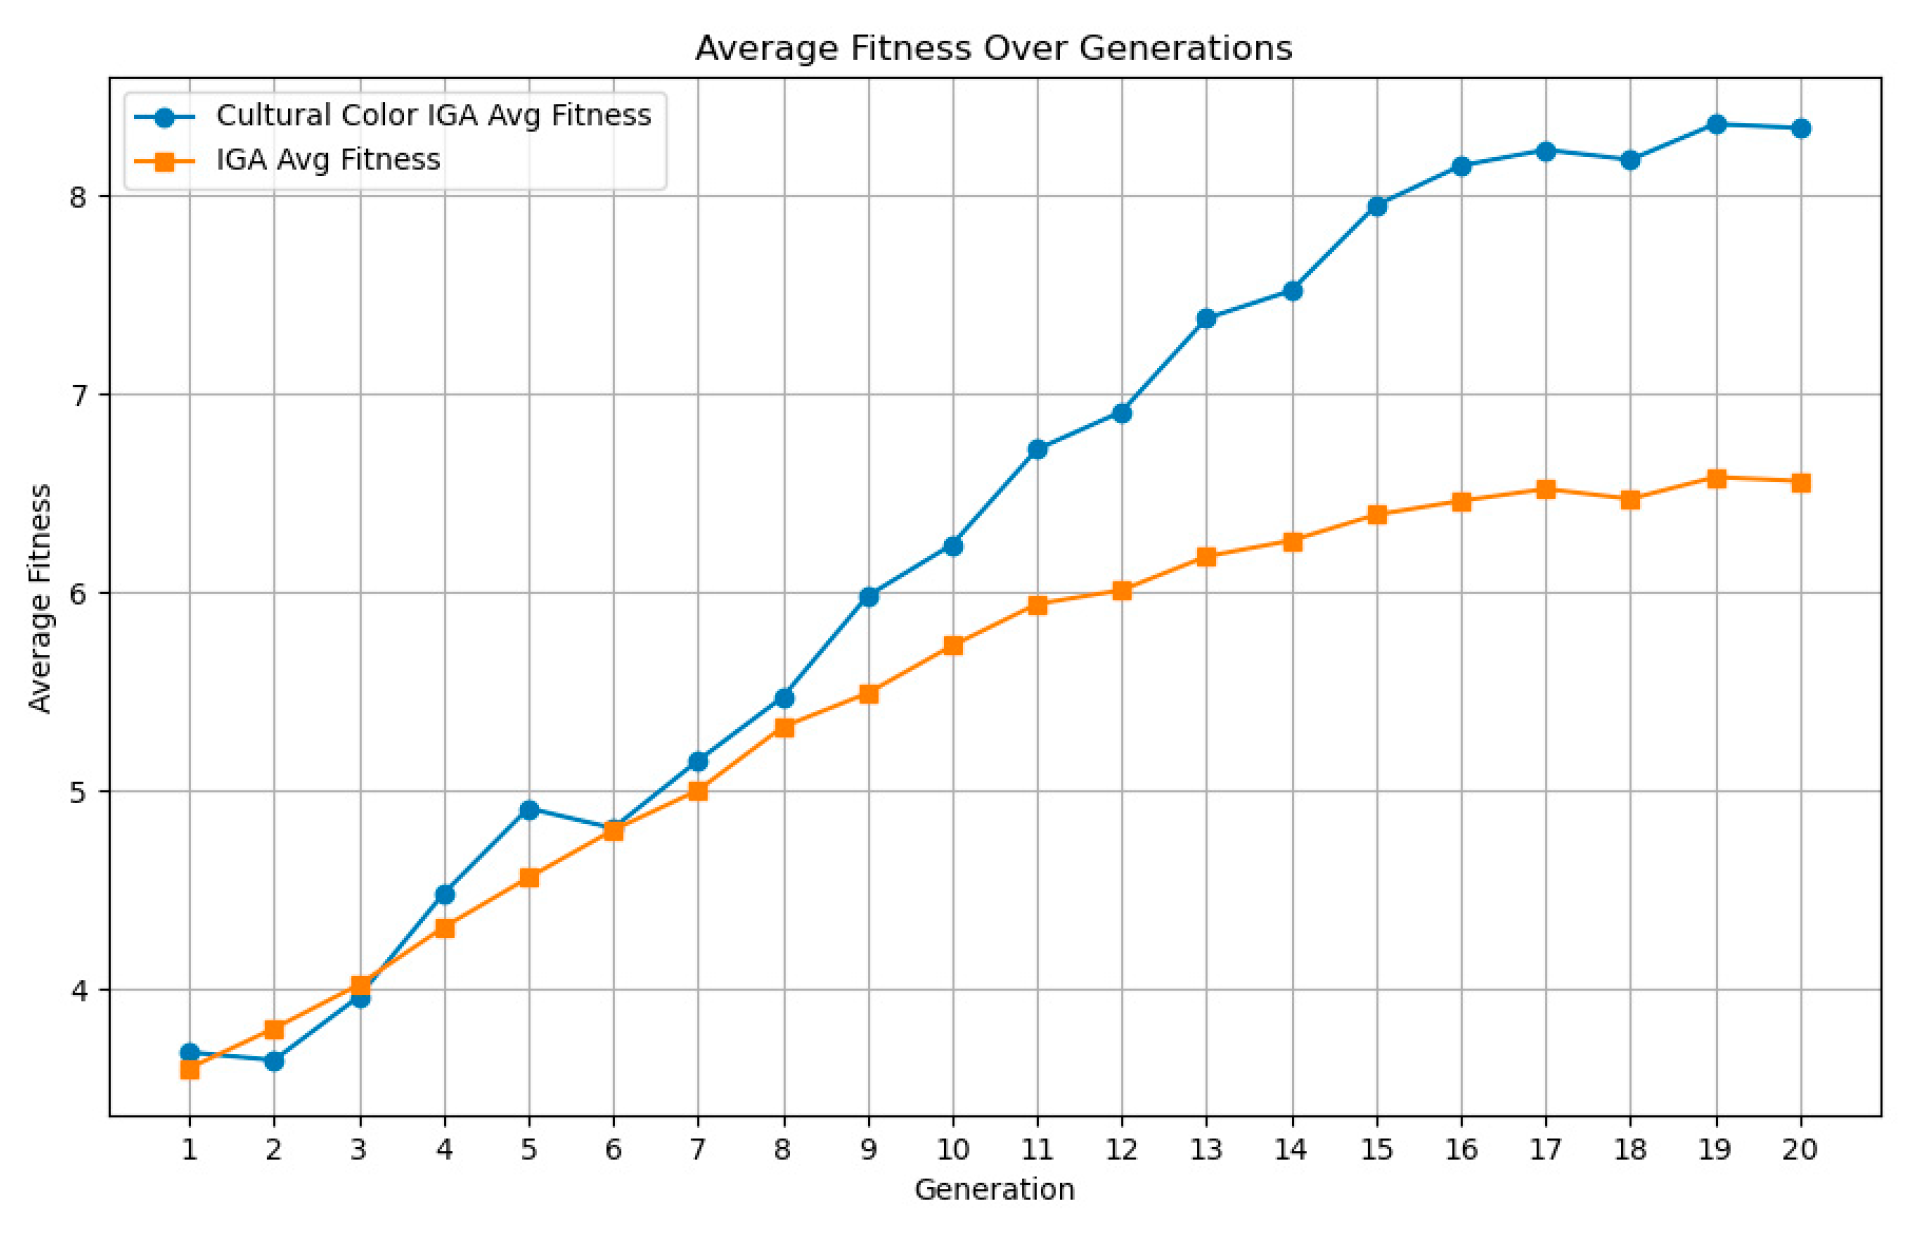
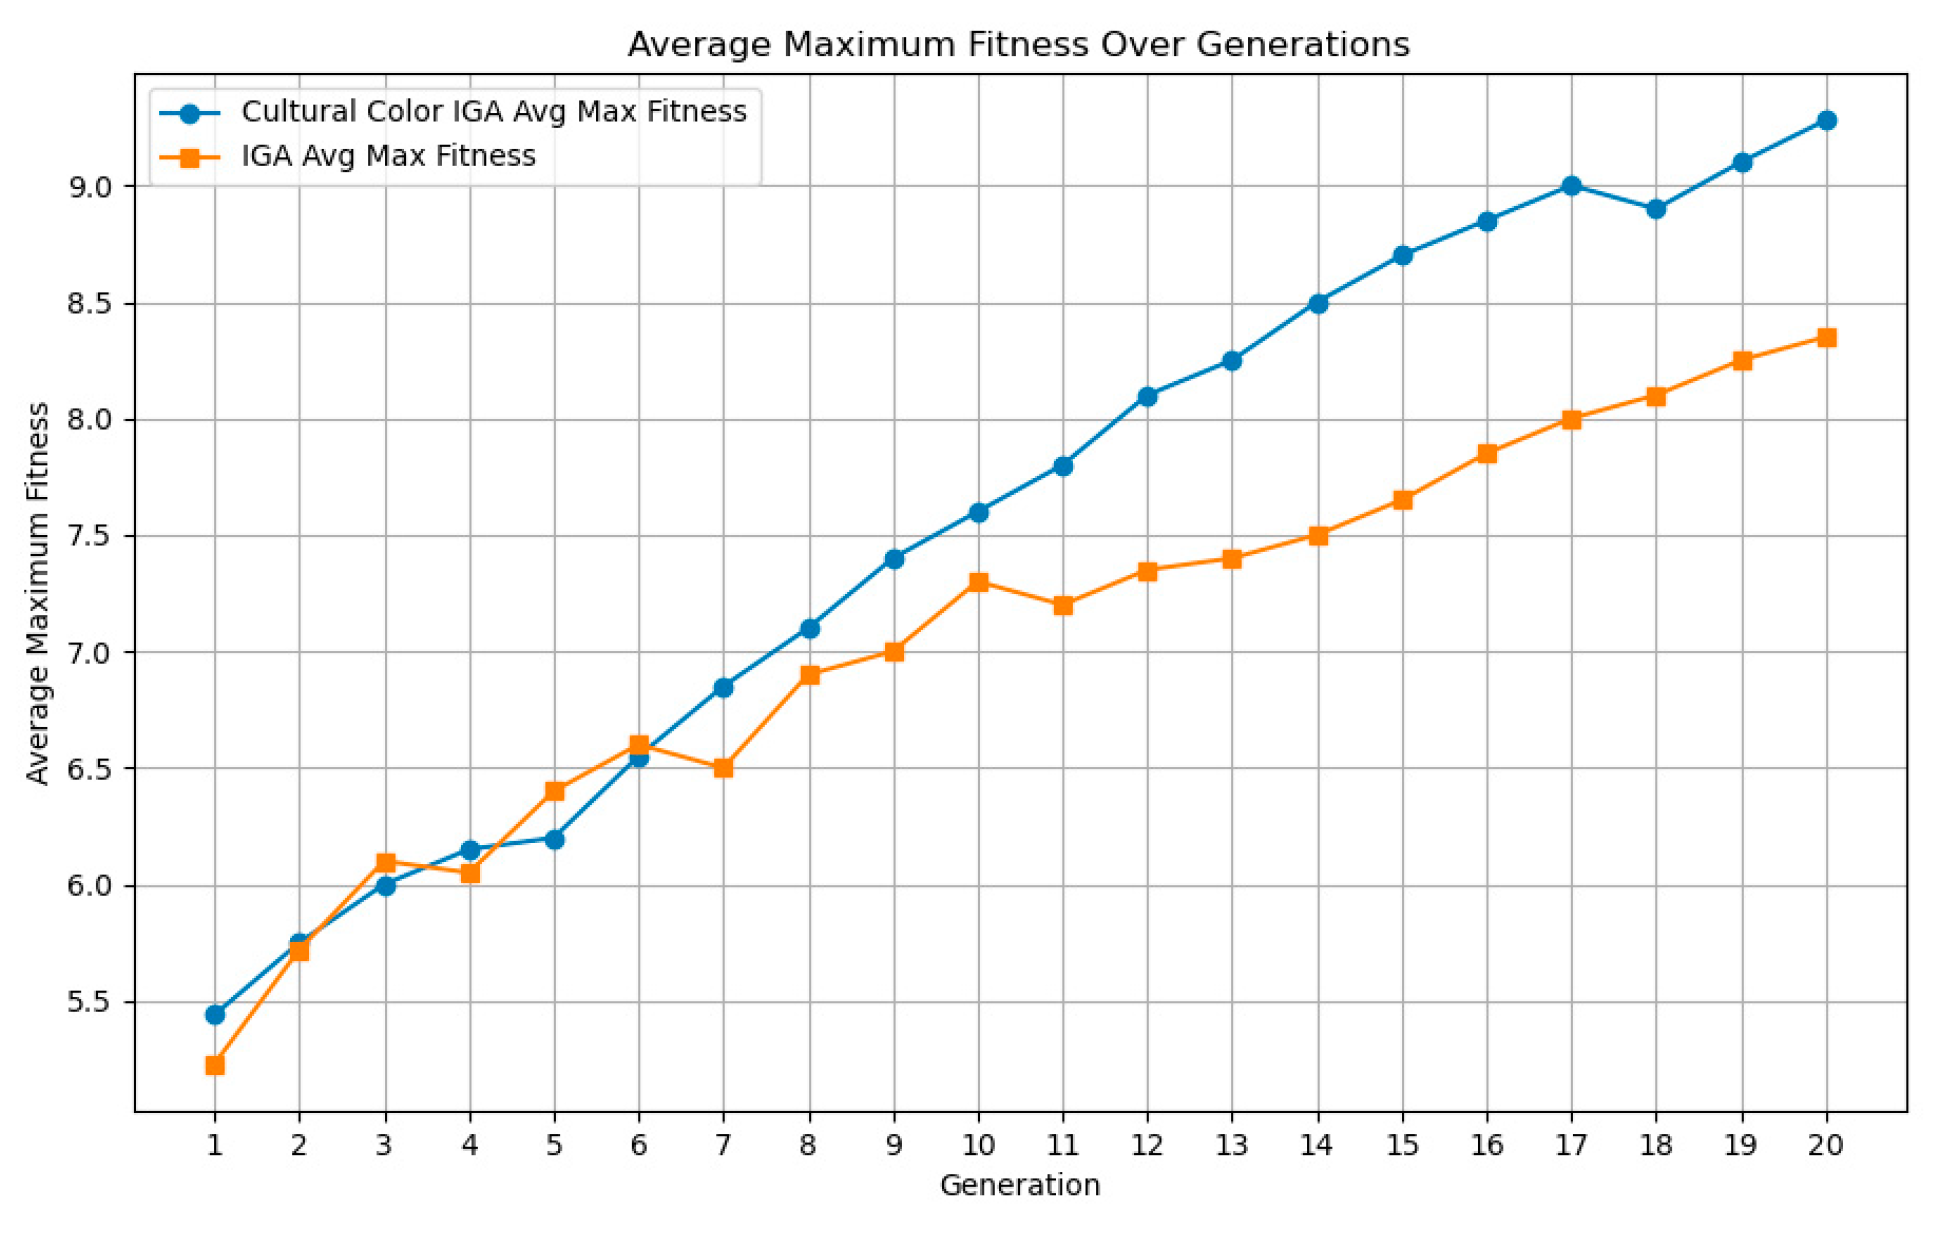
  • Significantly reducing manual evaluation workload—Experimental results demonstrate that Cultural Color IGA reduces the number of user evaluations by 67.4%, effectively alleviating evaluation fatigue while increasing the late-stage average fitness by 22.68% and maximum fitness by 13.37%;
  • Enhancing the effectiveness of cultural heritage color regeneration—Independent experiments and fuzzy evaluation methods were employed to assess the quality of color schemes, with 80.6% of users rating the generated schemes as aesthetically pleasing and culturally appropriate, indicating the method’s effectiveness in color regeneration and cultural application.
In summary, this study proposes Cultural Color IGA to optimize the automation and cultural adaptability of cultural heritage color regeneration. By integrating the color network model and the color harmony prediction model, this approach minimizes manual intervention, enhances optimization efficiency, and generates high-quality color schemes that align with cultural imagery. The findings not only provide new insights into the digital preservation and regeneration of cultural heritage but also demonstrate the potential of digital technology in promoting cultural sustainability.

2. Literature Review

In recent years, the rapid development of digital technologies and intelligent algorithms has provided more scientific and efficient support for the protection and transmission of cultural heritage. This review focuses on the role of color network models, interactive genetic algorithms (IGA), and color harmony prediction models in the color analysis and design applications of cultural heritage.
Firstly, color network models are widely used in the extraction and composition analysis of color features in cultural heritage. For example, Chen et al. [8] used a color network model to construct the color network of She ethnic clothing. By extracting color proportions, binary color co-occurrence rates, and other color features, they demonstrated the color differences in garments from different regions, presenting the color composition intuitively. However, this model faces challenges in large-scale regeneration design due to its low degree of automation, making it difficult to meet the demands of efficient design.
To improve design efficiency, Zhu et al. [9] combined the color network model with IGA for the regeneration design of Dunhuang colors. Although this method performed well in color feature regeneration and innovation, the traditional IGA it employed still relied on manual evaluation [10,11,12], which can lead to user fatigue and affect efficiency. To address this issue, some researchers have introduced intelligent algorithms as proxy evaluation mechanisms within IGA to replace some manual evaluations, effectively enhancing the automation level. For example, Zhu et al. [13] proposed a clothing customization platform that integrates typical styles with IGA, significantly reducing user fatigue. Jia et al. [14] used an aesthetic measurement formula to evaluate color quality in IGA and constructed an automatic color evaluation model for Hanfu, enabling the rapid generation of color schemes. However, the model remains simple, and the evaluation effect is still insufficient.
The emergence of machine learning-based color harmony prediction models has provided new perspectives for the automation of color evaluation. Notably, O’Donovan et al. [15] collected a large dataset of five-color palettes from online platforms such as Adobe Kuler and COLOURLovers and utilized Amazon Mechanical Turk (“MTurk”) to create a dataset for predicting color harmony. They extracted color features through a data-driven approach, Matsuda’s color wheel templates, and color harmony theory, training a five-color harmony prediction model that achieved a prediction accuracy of 56%. Building on O’Donovan et al.’s research, N. Kita et al. [16] further refined the analysis by reducing the number of features from 334 to 118 and trained a multivariate regression model capable of predicting the harmony of arbitrary color combinations, achieving a prediction accuracy of 52%. Bailin Yang et al. [17] proposed a color theme evaluation method combining a backpropagation neural network with a kernel probability model, enhancing the automation of color harmony assessment. While these models have significantly contributed to automating color evaluation, there remains room for improvement in prediction accuracy, and their applications in cultural heritage color regeneration remain underexplored.
In summary, the color network model effectively extracts the color characteristics of cultural heritage but remains insufficient for fully automated design. Traditional interactive genetic algorithms (IGA) can be applied to color regeneration but suffer from user fatigue due to their reliance on manual evaluation, ultimately affecting efficiency. In recent years, researchers have introduced color harmony prediction models to assist evaluation through intelligent algorithms. However, these models still require further improvement and have yet to form a comprehensive framework for precise color regeneration in cultural heritage applications.
To address these challenges, this study proposes an interactive genetic algorithm, Cultural Color IGA, which integrates the color network model and a color harmony prediction model. Centered on the color characteristics of cultural heritage, this approach employs the color network model to extract color genes and utilizes a stacking-based modern color harmony prediction model as a fitness evaluation surrogate. This method reduces the burden of manual evaluation while enhancing the intelligence of color regeneration. Compared to traditional IGA, Cultural Color IGA effectively decreases the number of required user evaluations, improves the accuracy of color optimization, and offers a viable technological solution for the digital preservation and innovative design of cultural heritage.

3. Methodology

3.1. Theoretical Model of Color Network

The color network model is a color-matching model that integrates color theory with computer image processing techniques, aiming to infer the relationships and patterns between characteristic colors [18]. Traditional color-matching methods often rely on designers’ experience, color wheels, and contrast rules. While these approaches are simple to apply, they lack systematic methodology and scientific rigor when dealing with complex color schemes. In contrast, the color network model adopts a data-driven approach, leveraging computer image processing techniques to extract color features from images, automatically identifying dominant colors and their matching patterns. This provides designers with a more scientific, systematic, and quantifiable color reference.
The model consists of two main stages: color feature extraction and color network representation. During the color feature extraction stage, image processing techniques are used to extract key color attributes from samples, including the number of characteristic colors, their color values, and the proportion of each color. In the color network representation stage, the extracted characteristic colors are represented as network nodes, where node size reflects the proportion of each color. The relationships between colors are illustrated using connecting lines, forming a color network model that visualizes the matching patterns among characteristic colors [18]. Additionally, the model marks frequently paired colors with thicker connecting lines, assisting designers in identifying patterns within complex color compositions, drawing inspiration, and making innovative breakthroughs.
Unlike traditional color-matching methods, the color network model provides designers with a more operational and scientifically grounded color scheme, overcoming the limitations of conventional approaches in complex color-matching scenarios. This method offers a new perspective and tool for color design, particularly excelling in predefined color application contexts.

3.2. Construction of Color Harmony Prediction Model

3.2.1. Model Construction Preparation

Interactive genetic algorithms (IGA) can apply patterns [19], shapes [20], colors [21], and structural designs [22] from cultural heritage to modern products, optimizing designs with cultural characteristics through user interaction. For instance, elements from the Yungang Grottoes are incorporated into contemporary products, architecture, or fashion designs, bringing new life to this heritage in a modern context. This innovative application promotes the sustainable transmission of cultural heritage, imbuing it with new meaning in modern life.
However, traditional interactive genetic algorithms (IGA) often rely on subjective judgment from designers to evaluate fitness, which not only increases the workload of the designers but also leads to fatigue, thus affecting design efficiency [23,24,25,26].
To improve the sustainability of the design process, researchers have introduced proxy evaluation models into IGAs [27,28] to reduce the frequency of designer involvement in the evaluation, thereby enhancing the automation level and accuracy of the design process. The application of these proxy models not only improves efficiency during the design phase but also significantly lightens the workload of designers. Specifically, Li Yu [29] and others established evaluation indicators based on color sequence and adjacency calculations for quick assessment of color-matching effects, reducing reliance on manual evaluations during the design process. However, their method still faced challenges such as insufficient sample size and model accuracy, especially in multi-dimensional feature and complex color-matching scenarios, where further optimization is needed.
Figure 1 illustrates the main components of our framework and the training process. Our algorithm framework consists of several steps:
Step 1: Based on the MTurk dataset, this study collected 10,743 color samples along with their corresponding rating data.
Step 2: A novel feature selection framework was developed, building upon the feature extraction methodologies of O’Donovan [15], N. Kita [16], and Wei Tianxiang [30]. The framework includes the following criteria:
  • Validation from previous studies: Priority is given to effective features that have been verified in the research of O’Donovan, N. Kita, and Wei Tianxiang;
  • Predictive performance significance: Features are iteratively evaluated throughout feature set construction and model training to assess their impact on predictive performance;
  • Statistical descriptiveness: Preference is given to features that accurately describe color distribution, variability, or complexity;
  • Relevance to human visual perception: Features must align with human color perception principles, such as the impact of hue, brightness, and saturation variations on visual experience;
  • Association with color harmony theories: Features should align with core principles of harmony theory, such as contrast, balance, and complexity.
Based on these criteria, feature selection was conducted on the initial feature set, resulting in the extraction of 130 color features per sample from the MTurk dataset. These features include 107 color space features (such as the mean, standard deviation, minimum, maximum, range, skewness, and kurtosis of RGB, HSV, LAB, LCH, and CHSV spaces), 12 color-pair features (e.g., Delta E, Delta H), 4 entropy features (e.g., hue entropy, brightness entropy), 3 visual balance features (e.g., symmetry index, color distribution uniformity), 1 emotional feature (warm-cool contrast index), and 3 color aesthetic features (aesthetic measure M, order factor O, complexity factor C). These features were not only derived from previous research but also incorporated innovative applications of color harmony theories.
Step 3: After constructing the feature engineering framework, the extracted features were normalized to eliminate discrepancies in different feature scales, preventing features with larger numerical values from dominating the model training process. This improves model stability and training efficiency. The Min-Max normalization technique was used, which was defined by the following formula:
x = x min ( x ) max ( x ) min ( x )
where x represents the original feature value, max ( x ) and min ( x ) denote the maximum and minimum values of the feature, respectively, and x is the normalized feature value, which is scaled to the range [0, 1].
Then, we trained 11 evaluation proxy models for the automated assessment of color harmony. These models include three classic linear machine learning algorithms—ElasticNet, linear regression, and Bayesian Ridge—as well as eight nonlinear machine learning algorithms: Decision Tree, KNN, ANN, Random Forest, SVM, XGBoost, LightGBM, and CatBoost. Based on the performance of these 11 models, the top three models were selected for ensemble training to further enhance the model’s performance.
Step 4: For each color theme, we predicted the harmony score and output the model-based harmony assessment results.

3.2.2. Model Training

This study attempts to apply both linear and nonlinear machine learning algorithms to regression model construction to explore the relationship between multi-color physical features and color harmony. After loading the dataset, data preprocessing was performed, including removing non-numeric columns and imputing missing values to ensure data integrity. The target variable and feature variables were separated, and the dataset was randomly split into a training set (80%) and a test set (20%). After training the 11 machine learning models, a comparison of the prediction results is shown in Table 1.
From the model evaluation results, nonlinear algorithms (such as CatBoost, XGBoost, and LightGBM) outperformed linear algorithms overall. Specifically, CatBoost achieved the best performance across all evaluation metrics, exhibiting the lowest MSE, MAE, RMSE, and MAPE while maintaining high R2 and adjusted R2 values, indicating its superior data fitting and predictive accuracy. XGBoost and LightGBM followed closely, performing slightly worse than CatBoost but still proving to be strong candidates. In contrast, linear algorithms such as ElasticNet showed weaker performance, particularly in MSE and R2, leading to higher prediction errors and weaker fitting ability.
In summary, nonlinear models, particularly CatBoost, demonstrated the best performance in color harmony prediction tasks, effectively capturing complex relationships in the data. For large-scale datasets, XGBoost and LightGBM also present promising alternatives. Overall, selecting an appropriate model significantly impacts task performance.
To further improve the prediction performance, we selected the three best-performing models from individual training: CatBoost, XGBoost, and LightGBM. These three models performed better than others based on mean squared error (MSE) and the coefficient of determination (R2), so we chose them as base learners for ensemble training, with the aim of improving prediction accuracy through ensemble learning. We adopted a stacking model as the ensemble method, which combines the predictions from multiple base learners and feeds them into a meta-learner for the final prediction. Stacking effectively leverages the independent advantages of each base learner, while the meta-learner adaptively learns how to optimally combine their predictions to maximize the model’s prediction performance. In this experiment, we selected a linear regression model as the meta-learner to combine the outputs from the base learners for final regression prediction. The ensemble model was trained using the training set. Each base learner was trained individually and generated its predictions. Then, the meta-learner used these predictions as inputs to generate the final prediction. After training the ensemble model, we evaluated it on the test set. By calculating several evaluation metrics, we obtained MSE = 0.0382, R2 = 0.6552, MAE = 0.1543, RMSE = 0.1954, MAPE = 0.0524, and adjusted R2 = 0.6312. The results showed that the ensemble model outperformed the individual base learners, especially in terms of MSE and R2, demonstrating that ensemble learning can improve the model’s accuracy and generalization ability to some extent.
Figure 2 shows a line graph comparing the predicted values and actual values. The red line represents the predictions from the stacking model, while the blue line represents the actual values, making it easier to visually assess the predictive capability of the stacking model.
The fitting performance of all models is shown in Figure 3, where the X-axis represents the true values of color harmony, and the Y-axis represents the predicted values corresponding to the proposed regression models. It demonstrates the relationship between the actual target values and the model’s predicted values.
Figure 4 shows a performance comparison of all 12 models, including stacking, allowing for a more intuitive observation of the performance metrics of each model.

3.3. Cultural Color IGA System Technical Architecture

Based on the traditional IGA, the technical architecture has been optimized, as detailed in Table 2.
Based on the analysis in Table 2, we further refine the evolutionary operation process of Cultural Color IGA, as illustrated in Figure 5.
First, a cultural color network model is generated based on cultural heritage images provided by the user. Since the color network model reflects the color-matching patterns of a specific culture, a set of color nodes can be selected from it as the initial color genes.
Next, the user designs the line drawing of the object to be colored and defines color zones (specific zones designated for specific colors). The designer then applies the initial color genes to create the first color scheme. To ensure clear segmentation, the system uses the K-means clustering algorithm to divide the image into color zones. These zones serve as the “color structures” recognizable by the interactive genetic algorithm (IGA), where different color structures correspond to different color schemes.
The system then initializes the first population using IGA, incorporating a stacking model as the fitness evaluation proxy to predict the color harmony score of each scheme. Fitness scores are calculated, and designers can manually adjust certain evaluations before executing crossover and mutation operations to optimize the color scheme.
As evolutionary generations progress, the process stops once a predefined termination condition is met, or a satisfactory color scheme is obtained. This method enables rapid evaluation of color schemes, reduces the workload for designers, and ensures that even less experienced designers can create high-quality cultural heritage color schemes.

3.4. System Development and Technology Realization

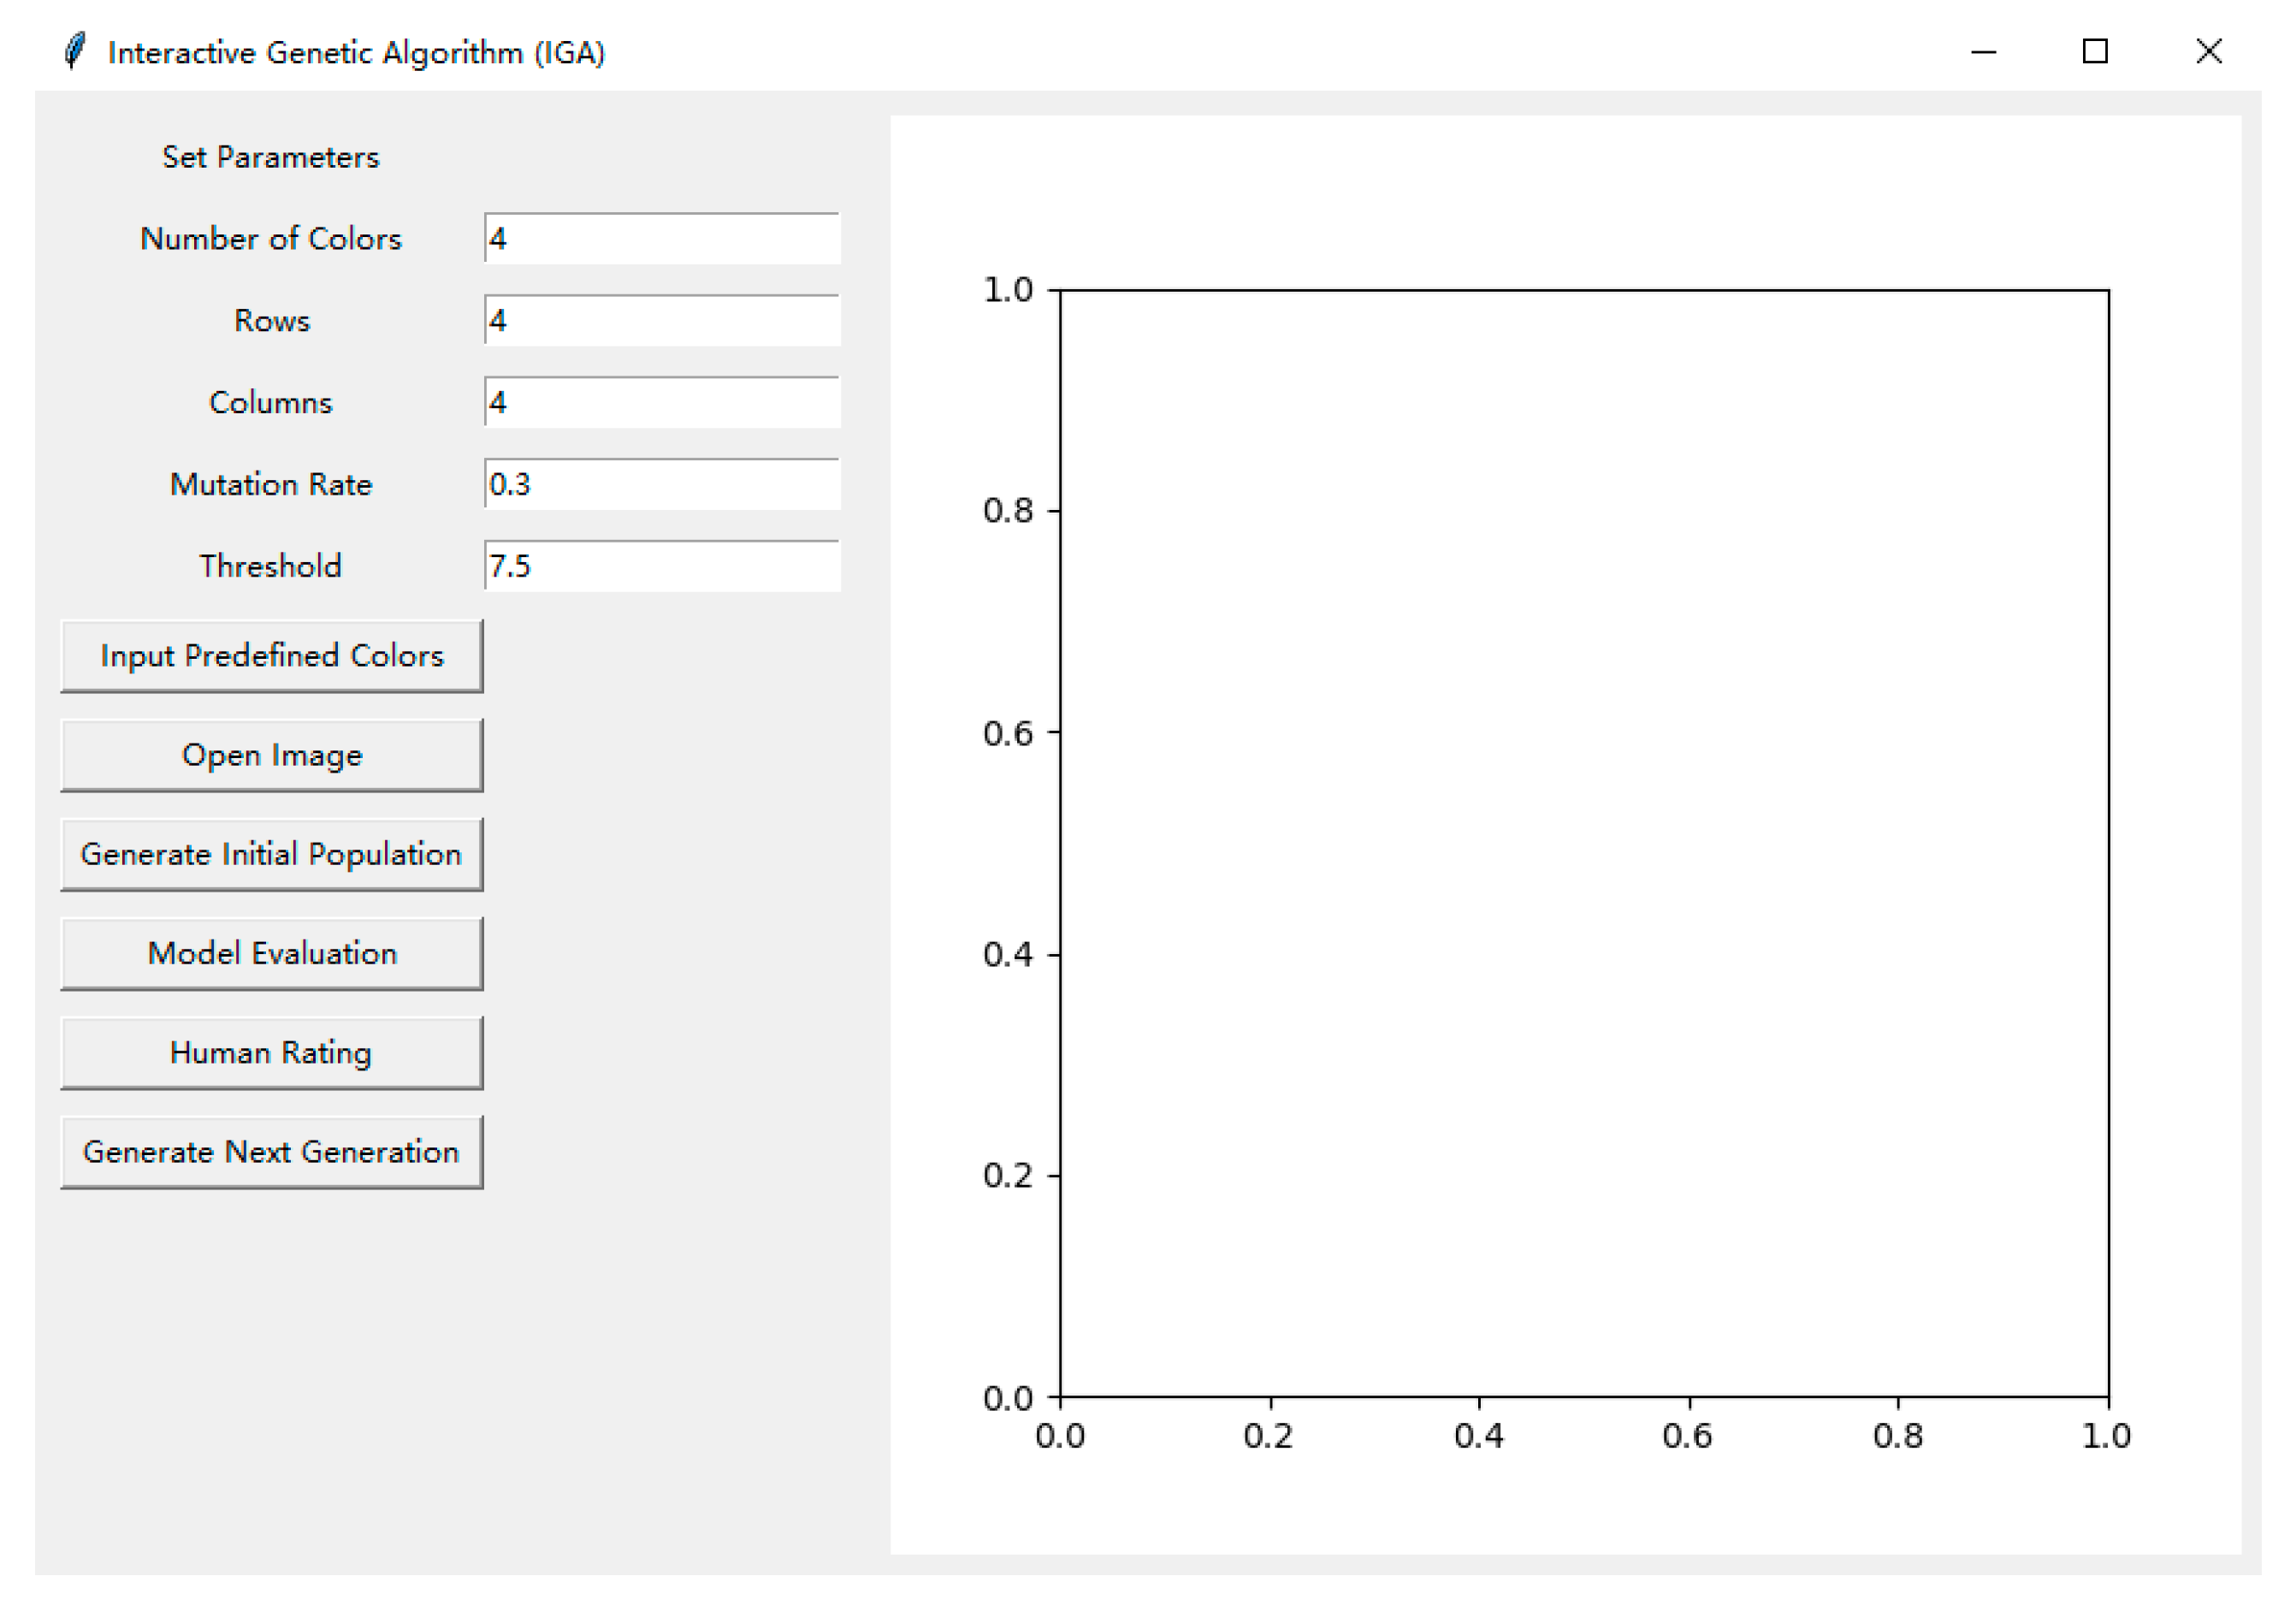
3.4.1. User Interface

The interactive genetic color-matching system was developed in a Python environment using the Tkinter graphical interface, integrating GUI operations with Matplotlib chart visualization for execution.
As shown in Figure 6, the user interface adopts a modular layout with clearly defined functional areas for easy operation. The main components of the interface include the left-side parameter settings area, the function button panel, and the right-side display area.
The left-side parameter settings area allows users to adjust multiple parameters to influence the generation and optimization of color schemes. These parameters include the number of colors, grid rows and columns, mutation rate, and scoring threshold. By customizing these settings, users can control the complexity and diversity of the generated color schemes, allowing for more personalized optimization through the genetic algorithm.
The function button panel, located in the left toolbar, includes essential operations such as Input Predefined Colors, Open Image, Generate Initial Population, Model Evaluation, and Human Rating. Each button is designed with a simple and user-friendly interface to ensure efficient task execution. Notably, the “Model Evaluation” and “Human Scoring” buttons allow users to rate the generated color schemes, enabling the system to refine and improve the results based on user feedback.
On the right-side display area, the system integrates a fitness curve graph that visualizes the evolutionary trend of the population in real time. The generated color populations are displayed as images and interactive elements, allowing for easy visual management. To enhance the user experience, the system supports dynamic zooming and scrolling, enabling users to adjust the view scale and position.
Overall, this system provides a fully visualized workflow for color scheme generation, evaluation, and optimization. Its intuitive operations and real-time feedback significantly improve usability, making it an effective tool for genetic algorithm research in color design.

3.4.2. Initial Color Scheme Design

The user first extracts color information from a designated cultural scene image to construct a color network model. Then, by combining personal expertise with the degree of connection between color nodes, a selection of color nodes is made as the initial color genes.
For example, in the color network model of the Yungang Grottoes (Figure 7), considering the closeness of connections between color nodes and personal experience, the designer selects nodes 7, 8, 13, 15, and 17 as the initial color genes.
As shown in Figure 8a, the initial color scheme is designed using a line drawing, which is then divided into five color zones, as illustrated in Figure 8b. After filling the initial color genes into the line drawing, the initial color scheme is obtained, as shown in Figure 8d. Once the initial color genes are determined through the color network model, the color zones are defined, and the initial color scheme is generated, the K-means algorithm is applied to extract the color zone information and initial color genes embedded in the scheme. This process completes the encoding of the color scheme for use in the interactive genetic algorithm, as detailed in Section 3.4.3.

3.4.3. Obtaining the Color-Matching Object Code

After generating the initial color scheme, click the “Open Image” button in Figure 6 to load the initial color scheme and convert the image data into a format suitable for genetic algorithm processing. The specific process is as follows:
  • Image loading and color space conversion
After loading the initial color scheme object, the program converts it into a three-dimensional array in the RGB space, represented as P = p 1 , p 2 , p i , p m , where p i = r i , g i , b i is the RGB value of the i-th pixel point in the image.
2.
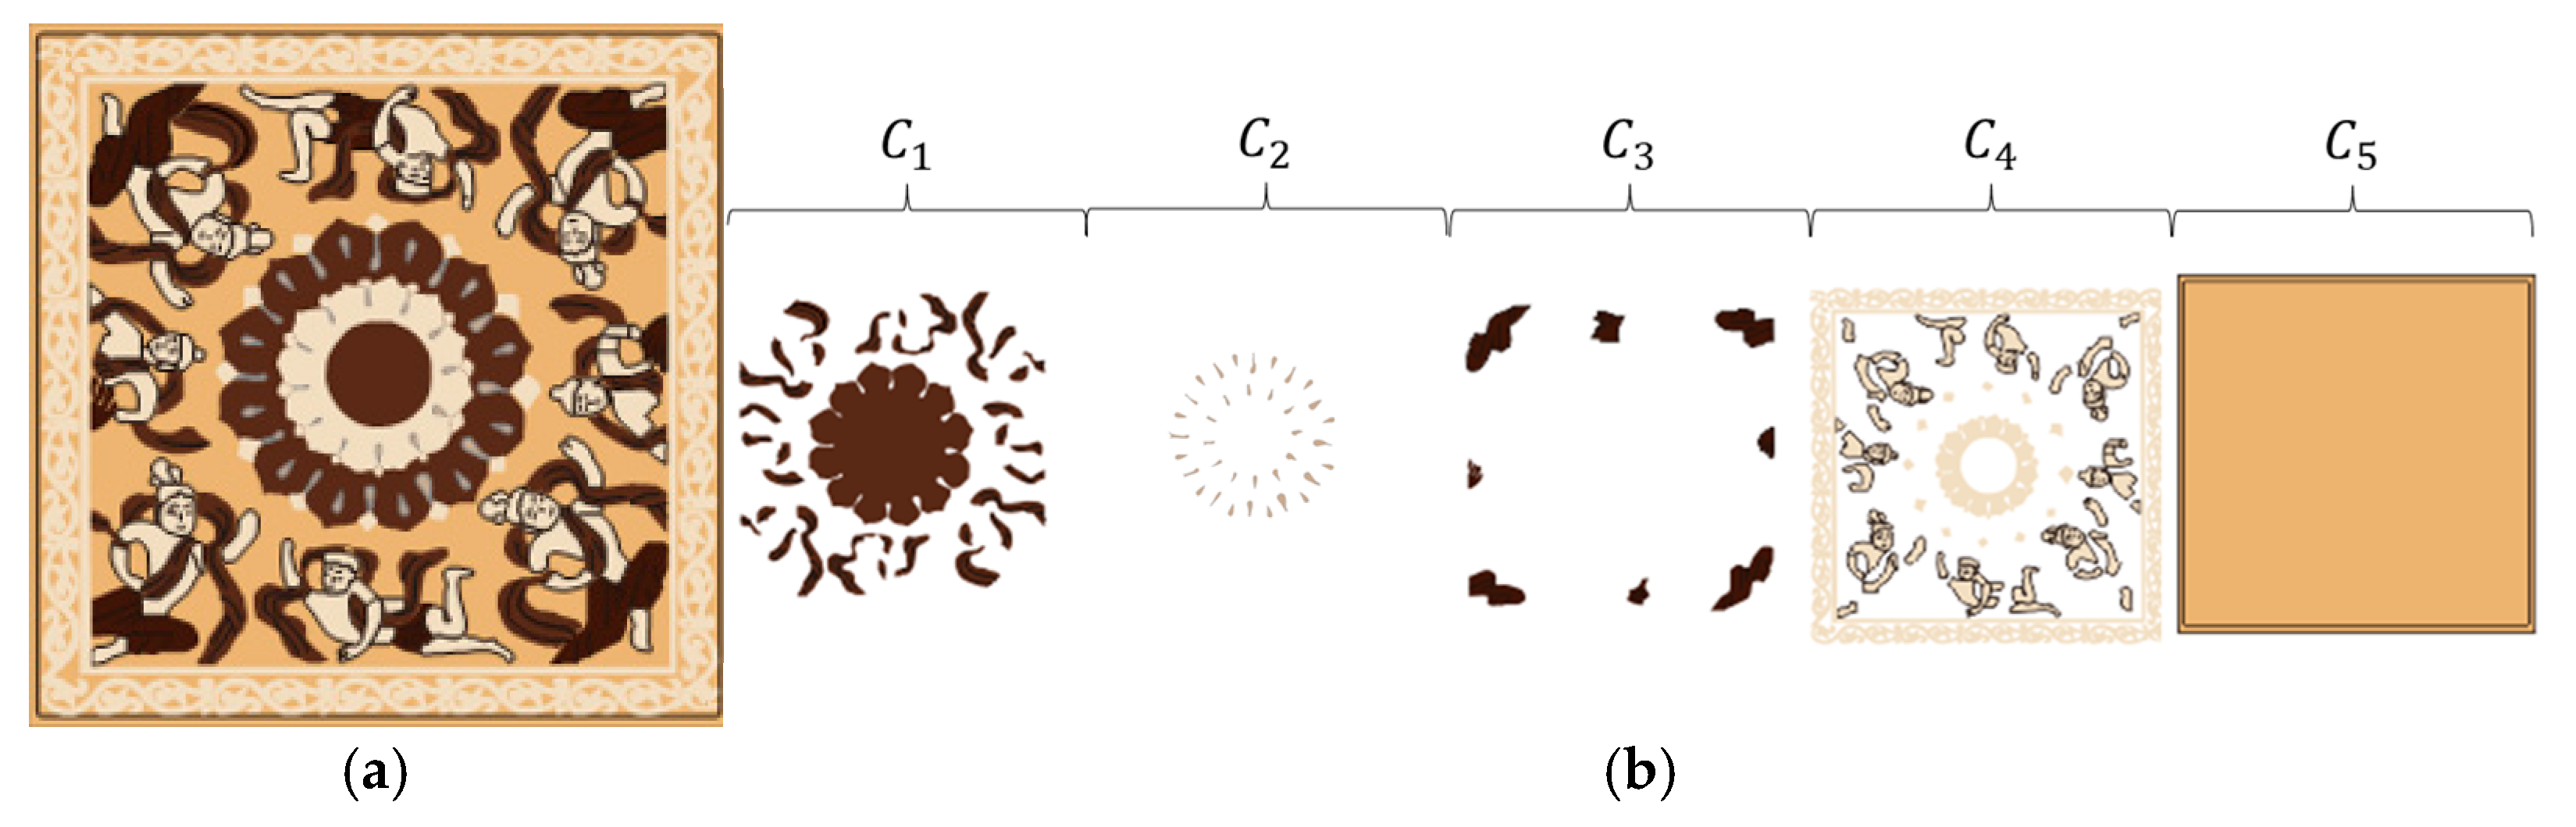
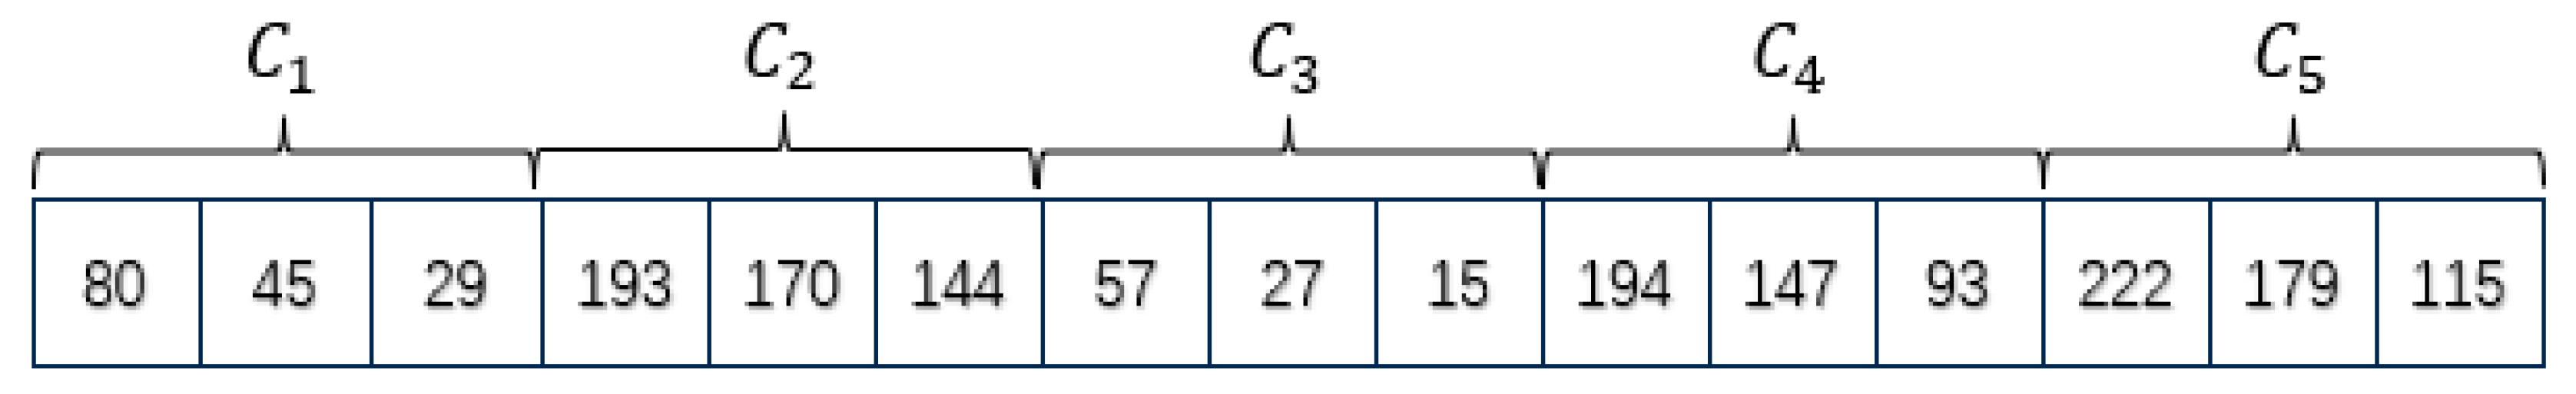
Color clustering coding
After the user loads the color scheme object, they can first set the number of clusters, n , which represents the number of colors allowed in the color scheme (at least 1 color and at most n colors). After preprocessing the image, the K-means algorithm is used to cluster the image. This algorithm divides the image pixels into several color zones based on color similarity and assigns each pixel the corresponding color zone label. The core goal of clustering is to divide the color areas in the image into multiple color zones, with each zone representing a primary color in the image.
Then, the RGB values of each color zone extracted by the clustering algorithm are encoded. The gene sequence of each color consists of three gene positions, representing the intensity of the red (r), green (g), and blue (b) channels of the color, with values ranging from 0 to 255. Assuming there are n color zones in the clustering result, the total length of the color gene encoding is n × 3, with the gene of each color zone represented by an RGB value. The encoding is defined as C = c 1 , c 2 c i c n , where c i = r i , g i , b i represents the RGB value of the i-th color zone. Each of the three components of the RGB value (r, g, b) corresponds to the intensity of the red, green, and blue channels. Through this gene encoding, the color information of each color zone in the image can be represented.
Taking Figure 9a as an example, the user selects Figure 9a as the initial color scheme. Since there are 5 colors, the user sets the number of clusters n to 5. The K-means algorithm is then used for image segmentation, dividing the color scheme object into 5 color zones based on color, as shown in Figure 9b.
As shown in Figure 10, the initial color gene encoding obtained after extraction is displayed. The final color gene encoding has a total length of 5 × 3, which consists of 15 gene positions. The value 80 represents the R value of the first color zone, 45 represents the G value, and 29 represents the B value. These genes, through different color gene combinations, form a complete color scheme, ultimately forming a chromosome. Through the division of color zones and color gene encoding, a foundation is provided for optimizing color combinations in subsequent genetic algorithm processing.

3.4.4. Generate Initial Population

The initial population is generated by randomly arranging the initial color genes obtained in Section 3.4.3, with each arrangement representing a color scheme. Users can set parameters such as the number of colors ( n ), rows and columns, and mutation rate to determine the scale and diversity of the population.
These color schemes will be displayed in a grid format, making it easy for users to observe and compare them. Each grid represents an independent color scheme, and a color card will be displayed on the right side of each grid to help users better understand the color composition of each scheme. Users can adjust parameters such as the number of rows and columns and the number of colors, and they can also support zooming and dragging to view all the schemes. This method not only simplifies the color extraction process but also ensures the diversity and scalability of the generated initial population.
The generated initial population is shown in Figure 11, allowing users to clearly see the performance of different color schemes and make corresponding adjustments.

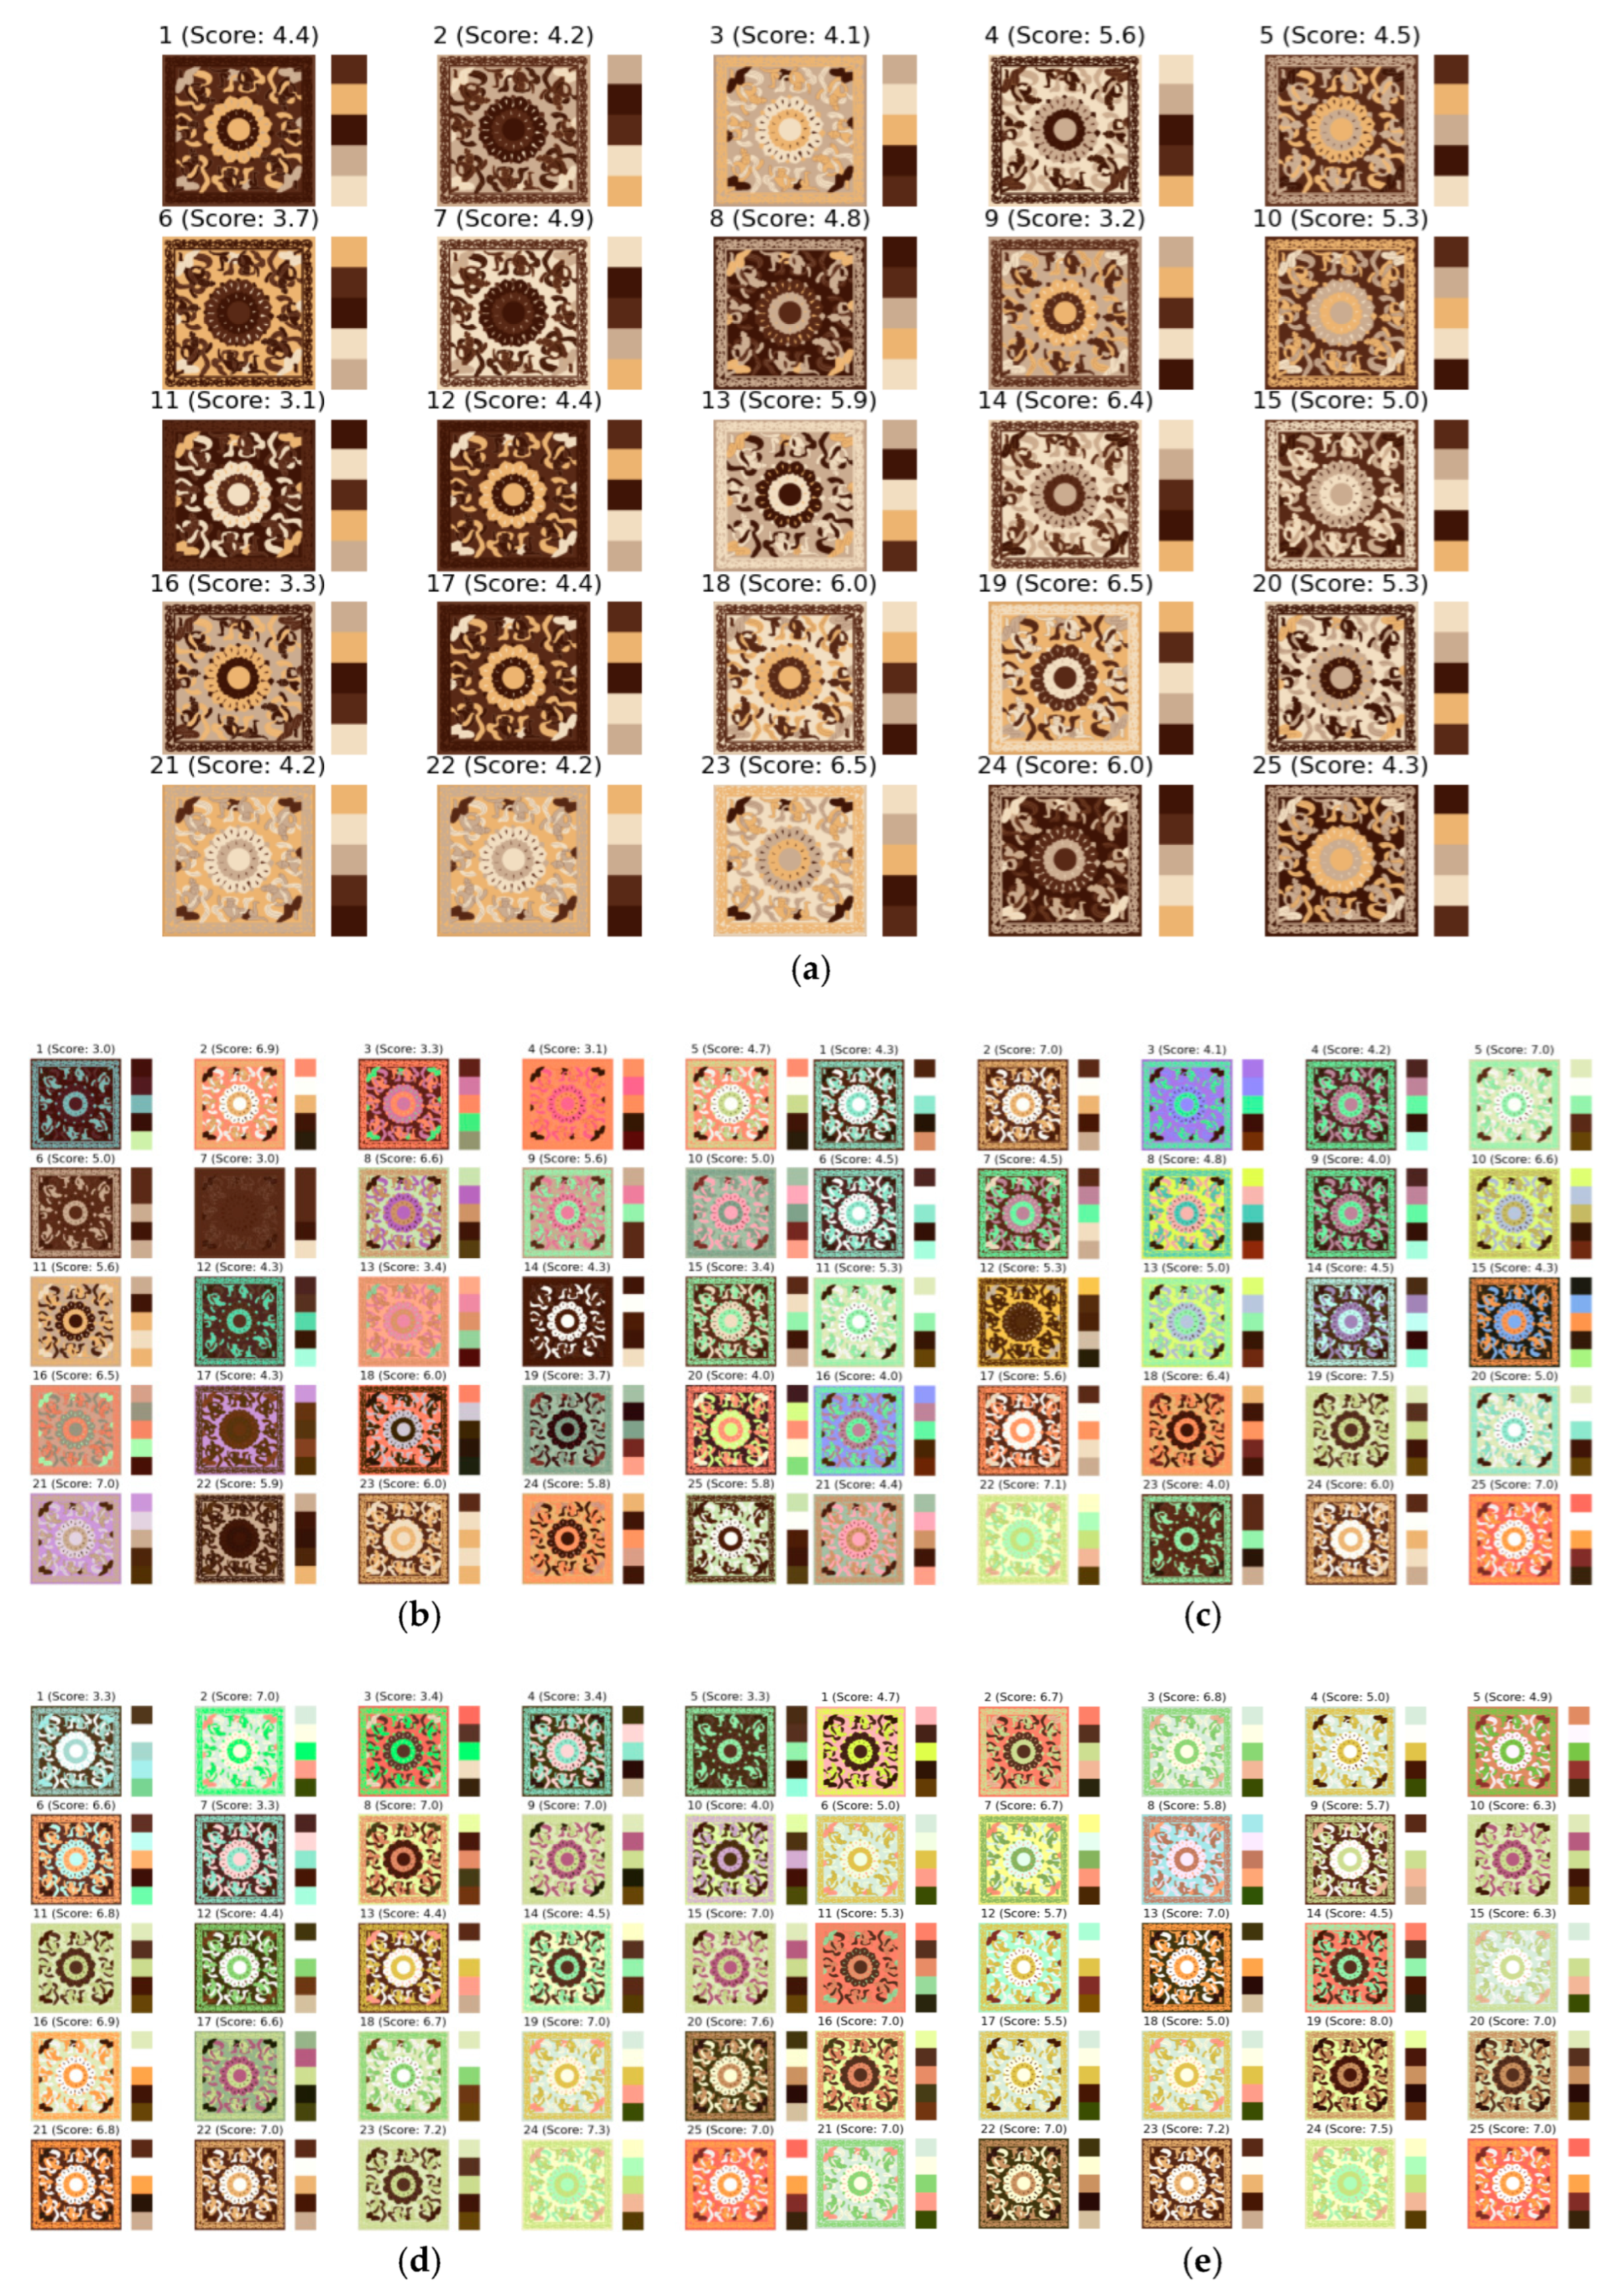
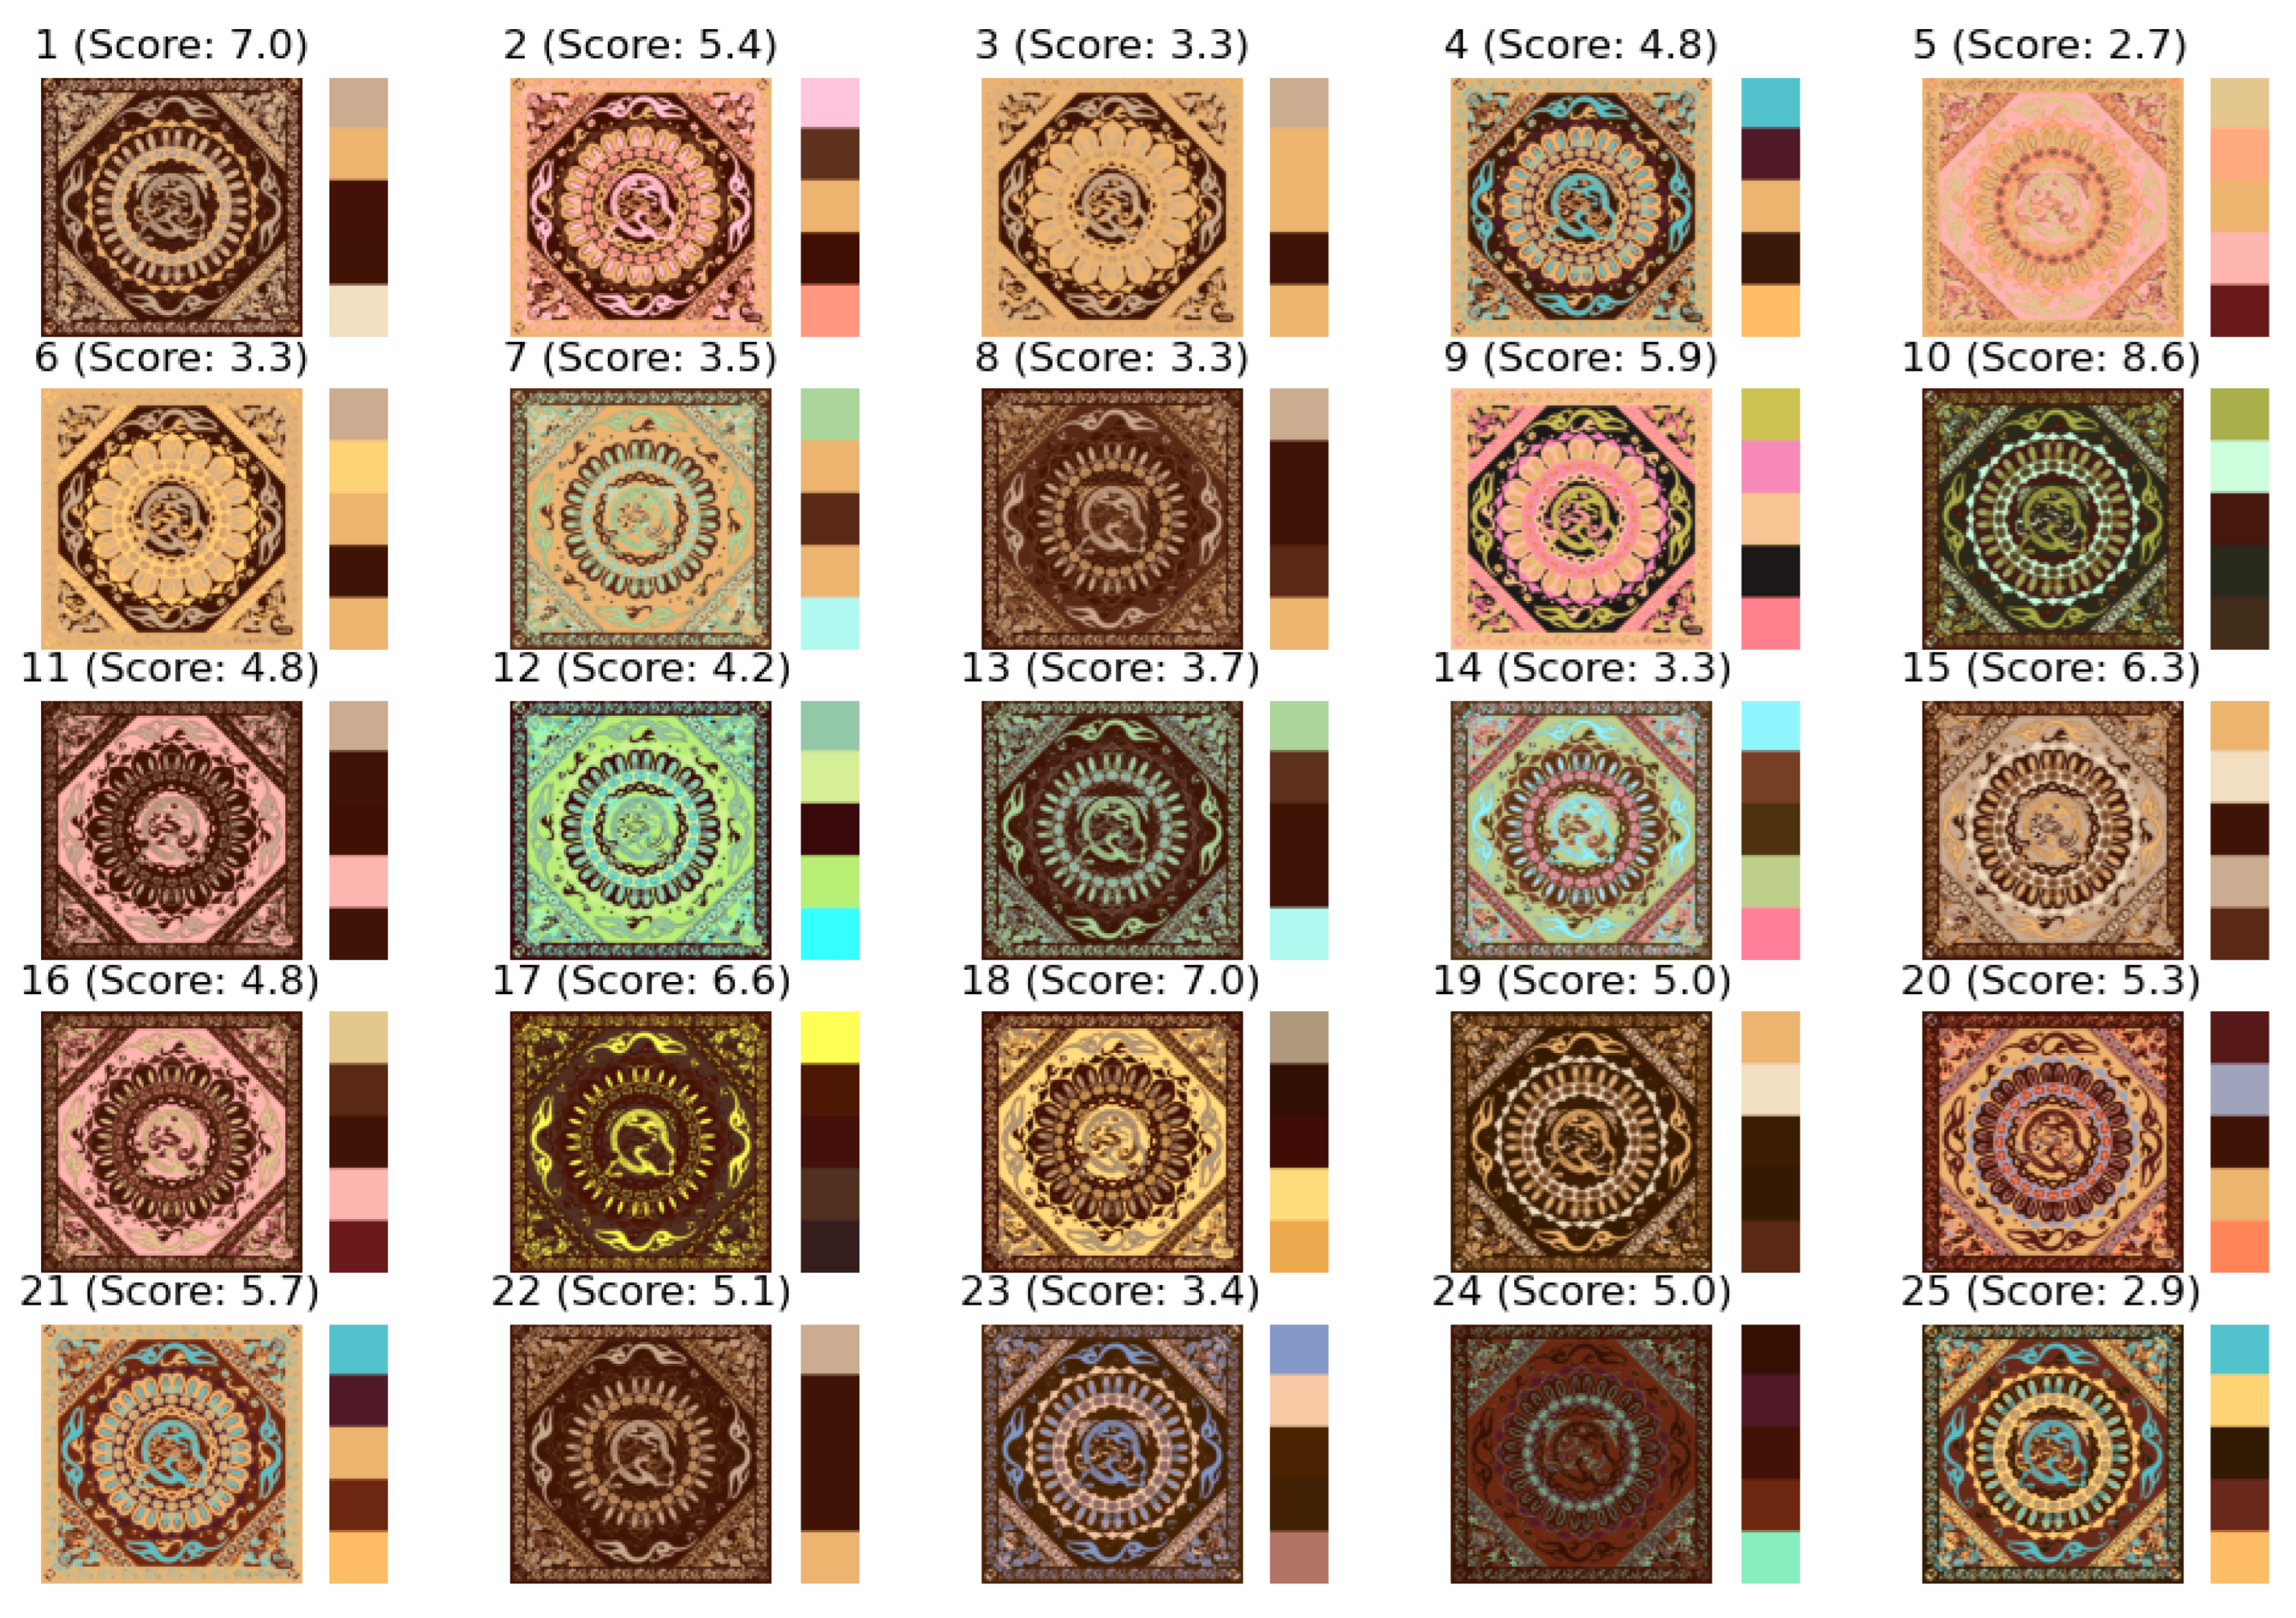
3.4.5. Scheme Evaluation

In the system, the initial scores for all generated color schemes are automatically generated by a color harmony evaluation proxy model to reduce the user’s workload of rating each scheme individually. The user only needs to adjust the scores of particularly excellent or poor schemes, while the other schemes retain their initial scores. The scoring process is as follows: After each color scheme is generated, the initial score is obtained through the proxy model and stored in the score array. The user can rate any scheme by clicking the “Human Rating” button, with a rating range from 0 to 10. After the user clicks “Submit Scores”, the system updates the scores of the rated schemes.
If the same scheme is rated multiple times, the program takes the last inputted score. When a rating is invalid, the system will prompt the user to re-enter the score. After the scoring is completed, the scores of all schemes will be displayed in the score window. Through the combined scoring mechanism of the proxy model and user adjustments, the program improves the efficiency of fitness setting while ensuring the precise evaluation of scheme quality. The population score display window is shown in Figure 12.

3.4.6. Population Replacement

The “Generate Next Generation” button in the program can be used to achieve the genetic generation operation of the population after the completion of the scheme score. This process is based on fitness evaluation, combined with elite strategy, cross-recombination, and mutation mechanism to generate a new generation of populations, providing iterative support for optimizing color schemes. The specific process is as follows:
  • Elite Strategy: Survival of the Fittest and Retention Mechanism
The program uses the elite strategy to retain high-fitness color schemes for the next generation. The user can set a fitness threshold, and schemes with scores above the threshold are directly retained without undergoing crossover and mutation, ensuring that excellent genes are not lost. Schemes that do not meet the threshold are eliminated and replaced by newly generated offspring.
2.
Crossover Recombination: Generating Offspring
As shown in Figure 13, the eliminated schemes generate offspring through crossover recombination. The roulette selection method is used to choose parent schemes based on fitness, with higher-scoring schemes having a greater probability of being selected. The crossover operation ensures that offspring retain characteristics from their parents while introducing randomness, promoting the optimization process. Each color is randomly selected for inheritance from the parents, ensuring the transmission of genetic traits and diversity, which leads to the generation of potentially better color schemes.
3.
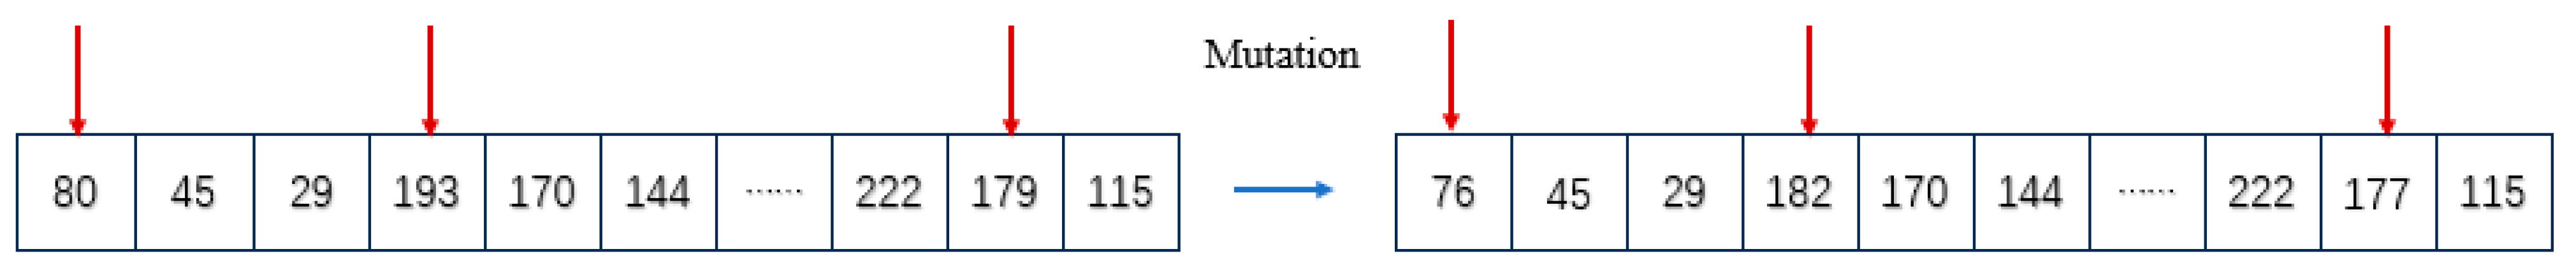
Variation mechanism: Introducing randomness
In the resulting offspring, some schemes undergo variation to increase population diversity (Figure 14): the user can set the proportion of variation (the default value is 30%); that is, about 30% of schemes in the new population will undergo variation. Variation is achieved by introducing a random variation to the RGB value of the color, and the amplitude of the variation is limited by the maximum variation ratio (the default maximum variation is 30%). The randomness of variation introduces new possibilities to the optimization process and helps to escape local optimality.
4.
Population renewal and display
After selection, crossover, and mutation, a new generation of the population is generated, including the retained elite schemes and newly generated offspring schemes. The user can view the new schemes by clicking the “Generate Next Generation” button, and the program will display the color schemes in a grid format. After the new population is generated, the user can continue with scoring, elimination, and replacement, with the program continuously optimizing to achieve iterative scheme improvement. The elite strategy ensures the transmission of excellent schemes, crossover recombination brings new combinations, and the mutation mechanism maintains diversity until a satisfactory color scheme is generated.

4. Experiments and Discussion

Yungang Grottoes is one of the representatives of ancient Chinese cave art, and its sculptures have a deep cultural heritage and artistic value in their use of color, reflecting the uniqueness and richness of traditional Chinese art colors. Choosing a sufficient number of Yungang Grottoes images can provide ample color data, making the color network model more comprehensive when extracting color genes, thus avoiding insufficient representation due to a small sample size. Therefore, this study collected 120 images of Yungang Grottoes as samples through methods such as online downloads, book scans, and on-site photography. Based on data quality requirements, the selected images must meet the following principles:
  • Images downloaded from the internet should be clear or relatively clear, with a resolution higher than 72 dpi;
  • For book scans, good natural lighting conditions should be selected, avoiding artificial light sources to reduce color distortion. A 50 mm prime lens should be used, with a shooting distance of 0.3–0.5 m, ensuring the clarity of image details and color restoration;
  • For on-site photography, even indoor lighting should be used, with a shooting distance of 0.5–1 m.
Using the 120 Yungang Grottoes statues as the reference source for color-matching, the color network model is extracted, and five nodes, 7, 8, 13, 15, and 17, are selected as the color genes for IGA. The color-matching design is demonstrated using the flat pattern in Figure 15d as an example.
The experimental subjects of the system’s operation include 10 volunteers (five males and five females) who evaluate the generated color schemes. To ensure the scientific and representative nature of the research, the selection of these 10 volunteers takes into account diversity in gender, region, and professional background.
Gender and Regional Distribution: The volunteers include five males and five females from Taiyuan, Beijing, Suzhou, Wuhan, and Guangzhou in China, covering different cultural backgrounds and geographical areas to ensure diversity in the rating results.
Professional Composition: four art and design professionals, three art school teachers and students, two cultural and heritage conservation workers, and one representative from the general public.
To ensure the accuracy and reliability of the evaluation results, we performed a two-step screening of the participants’ color vision abilities. First, we asked participants if they had any known color vision impairments. Second, a strict color vision ability screening was conducted using the Ishihara color blindness test charts (Kanehara & Co., Tokyo, Japan). These steps ensured that all participants had no color blindness or color vision defects, thereby eliminating potential interference from insufficient color vision ability on the research results.
In the experiment, volunteers completed the rating task based on their professional background and aesthetic preferences. The results were mainly compared in the following three aspects: average fitness (overall population optimization effect), average maximum fitness (degree of improvement in the optimal scheme), and user rating frequency (frequency of user participation in rating). By analyzing the operation results from diversified users, the strengths and weaknesses of the two algorithms in optimization capability and user interaction experience were comprehensively evaluated, providing a scientific basis for verifying the effectiveness of the intelligent color-matching method.
This study strictly defined and controlled the rating scale. The rating range was from 0 to 10, where 0 represents complete disharmony, 10 represents perfect harmony, and 5 represents moderate harmony. Before rating, volunteers underwent a brief training to understand the specific meanings of the rating levels. To ensure the distinction and accuracy of the ratings, this study explicitly encouraged volunteers to make reasonable use of the rating range.
After the experiment officially began, the Cultural Color IGA system first automatically rated the color schemes, with scores ranging from 0 to 10. Then, the experimental subjects adjusted the scores according to their personal aesthetic preferences. Figure 16 shows the evolution of some of the populations during the color-matching process. Figure 16a shows the initial population, while b, c, d, and e represent the population evolution of the 5th, 10th, 15th, and 20th generations, respectively.
In order to show the color-matching effect produced under different patterns, the Yungang dragon pattern and chess pattern are taken as the center, the Yungang lotus pattern, honeysuckle pattern, and banana leaf pattern are extracted as decoration, and the flying sky image is surrounded by the color-matching effect, as shown in Figure 17. The resulting satisfactory color scheme is shown in Figure 18.
In order to verify the effectiveness of this method, traditional IGA, and Cultural Color IGA were compared. The parameter configuration of the two algorithms is unified as follows: a single-point crossover method is adopted, the population number is 25, the roulette selection method and elite strategy are adopted, the crossover probability P r = 50%, the mutation probability P m = 20%, and the elimination score is 7.5 [31].
The two methods were independently operated by 10 users once, and the population evolution ended after the 20th generation. The experimental results are compared mainly from three aspects—average fitness, average maximum fitness, and evaluation times—so as to compare the optimization ability of the algorithm. To ensure a fair comparison, the two methods used the same reference source images to avoid potential biases introduced by image differences.
Figure 19 shows the change trend of average fitness between the traditional interactive genetic algorithm (IGA) and the interactive genetic algorithm (Cultural Color IGA) that introduces the color harmony prediction model, aiming to evaluate how to improve the efficiency of color application by improving the algorithm, so as to promote the sustainability of cultural heritage conservation.
Initial stage (1–5 generations): In the early stage of the algorithm, the average fitness change trend of Cultural Color IGA and traditional IGA is relatively close, the fitness fluctuates between 3 and 4, and the growth rate of both is similar. This phase reflects the preliminary optimization of the model, indicating that although the stacking agent model has been embedded in the algorithm, its advantages are not fully apparent, and no significant performance gaps are visible.
In the middle stage (5–10 generations), the average fitness of Cultural Color IGA increases rapidly, and by the 10th generation, Cultural Color IGA has surpassed the traditional IGA, reaching a fitness of about 7, while the traditional IGA’s fitness is about 6. At this time, the role of the stacking agent model gradually appears, which promotes the optimization process of algorithms, reduces human interference in design evaluation, and provides more efficient and sustainable design optimization support.
Late stage (10–20 generations): After the 10th generation, the average fitness of Cultural Color IGA continued to rise, reaching about 8 by the 20th generation, while the traditional IGA stayed at about 7. This trend shows that Cultural Color IGA can converge to high-fitness solutions faster, which not only improves the efficiency of the algorithm but also reduces the number of evaluations and makes the optimization process more intelligent. Overall comparison: From the whole evolutionary process, the average fitness of Cultural Color IGA was significantly higher than that of traditional IGA, showing an improvement of about 14.60%, especially reaching 22.68% in the later stage. The introduction of the color harmony proxy model in the stacking algorithm enhances the optimization capability and makes it more efficient and sustainable in color application design.
Figure 20 shows the variation of the three algorithms on the average maximum fitness, which reflects the quality of the optimal solution found by the algorithm in each generation.
Initial stage (1–5 generations): In the first few generations, the maximum mean fitness of Cultural Color IGA and IGA performed similarly, with a fitness between 5.5 and 6.5. At this time, although the stacking agent model is introduced, its advantages are not fully apparent, and the performance of the algorithm is not significantly improved.
Middle stage (5–10 generations): Starting with the 5th generation, the maximum average fitness of Cultural Color IGA gradually exceeds that of IGA and opens the gap by the 10th generation, reaching about 7.5 compared to about 6.8 for IGA. At this stage, the stacking agent model gradually shows advantages, which improves the efficiency of fitness growth and enables algorithms to approach high-fitness solutions more quickly.
Late stage (10–20 generations): From the 10th generation, Cultural Color IGA continues to lead the fitness growth rate, reaching 9.28 in the 20th generation, while IGA is 8.35. This result shows that Cultural Color IGA can improve fitness faster in the later stages, significantly improving the efficiency of the optimization process and reducing the number of trials and errors in the design.
Overall comparison: From the average of all algebras, the average maximum fitness of Cultural Color IGA is about 9.03% higher than that of traditional IGA, especially in the last 10 generations, the average maximum fitness of Cultural Color IGA is about 13.37% higher than that of IGA. It further embodies its efficient optimization ability. It shows the significant advantages of the stacking agent model in reducing the burden of manual evaluation and improving the optimization efficiency. This model provides important support for the sustainable inheritance of cultural heritage design by reducing resource consumption and improving design efficiency.
Figure 21 compares the number of user reviews required for a traditional IGA versus a Cultural Color IGA. From the figure, we can observe the following points:
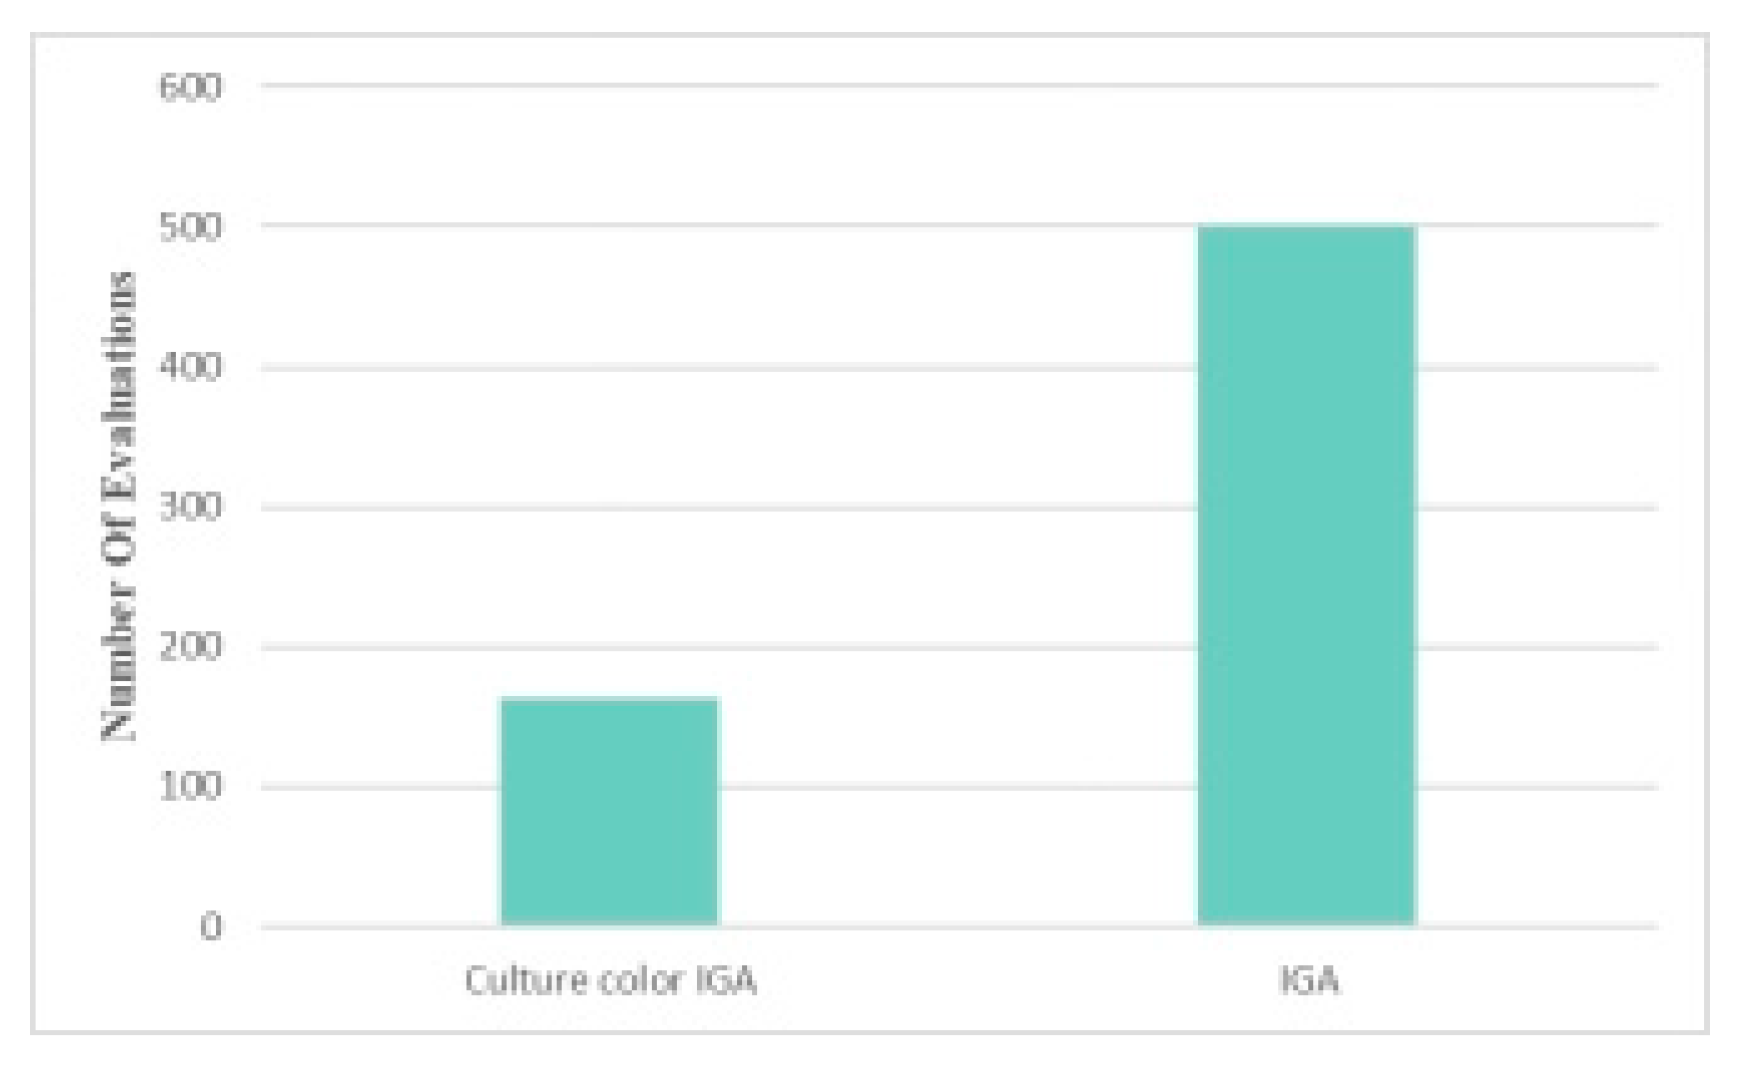
  • Number of reviews for traditional IGA: The traditional IGA algorithm requires a large number of user reviews, totaling about 500. This high-frequency evaluation requirement stems from the fact that traditional IGA relies on direct feedback from users for fitness evaluation in each generation, which greatly increases the workload of users;
  • Evaluation times of Cultural Color IGA: After the introduction of the stacking agent model, the user evaluations of Cultural Color IGA are reduced to about 163 times. The stacking proxy model is trained with large amounts of data to predict and simulate user evaluations of color schemes, replacing direct user evaluations in most generations. This significantly reduces the number of times users actually participate in the evaluation, alleviates user fatigue, and reduces the workload.
  • Impact of reduced reviews: Cultural Color IGA has approximately 67.4% fewer user reviews compared to traditional IGA. This significant reduction not only improves the efficiency of the algorithm but also provides a more user-friendly evaluation experience for users. This approach is particularly important in the process of generating color schemes for the preservation of cultural heritage, as it represents an efficient and sustainable approach to design optimization while ensuring design quality and significantly reducing manual input.
Figure 22 shows the distribution of the average fitness values of 10 users with the increase in algebra when the Cultural Color IGA algorithm is used. By analyzing the figure, we can observe the following points:
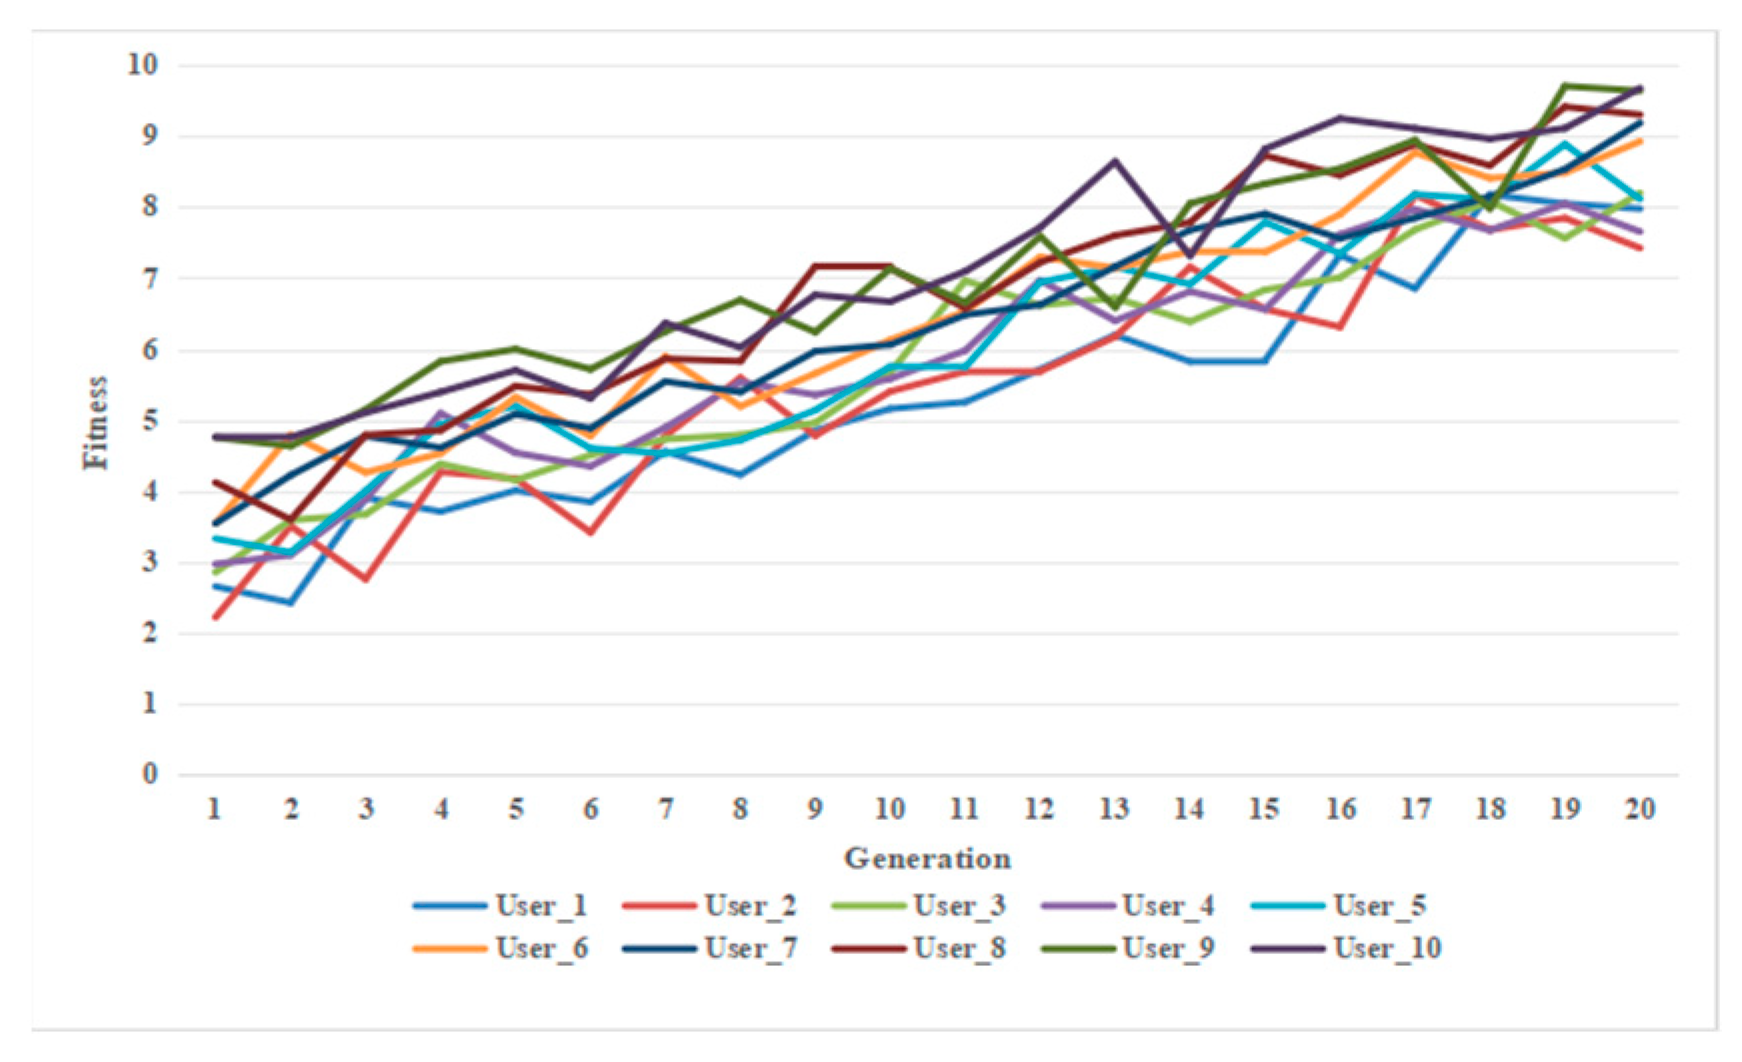
  • Overall upward trend: The 10 user fitness curves in the figure show an overall upward trend, indicating that the Cultural Color IGA algorithm is continuously improving the fitness value of each user with the increase in algebra. This gradual upward trend reflects that the algorithm continues to optimize the design scheme of each user, making the fitness improve from generation to generation;
  • Fluctuations and peaks: In the rising process, each curve has certain fluctuations, and the average fitness value is not monotonically increased but accompanied by certain ups and downs. This fluctuation may be due to the fitness changes of the algorithm in the process of searching for different solutions, reflecting the dynamic adjustment ability of Cultural Color IGA between local solutions and global solutions. Each curve also exhibits some peaks in different algebras, and these peaks correspond to relatively high fitness solutions found by the algorithm in these algebras;
  • Distribution range of fitness: In the evolution process from 1 to 20 generations, the fitness value gradually increased from close to 3 points to more than 7 points in 20 generations. By the 20th generation, the fitness value of all users reached more than 7, and the highest fitness was close to 9.6. This shows that after 20 generations of optimization, the Cultural Color IGA algorithm can significantly improve fitness, making the final design scheme reach a high level in the evaluation of users;
  • Individual differences: Although the 10 curves show similar overall trends, each curve fluctuates slightly differently in magnitude and growth rates, reflecting individual differences between users. For example, the fitness of some users grows faster in the first few generations, while the fitness of others grows more significantly in the later generations. This difference may reflect the adaptive adjustment ability of the Cultural Color IGA algorithm under different user needs or preferences so that the evaluation results of each user can be personalized in the optimization process;
  • Peak and final fitness: In the 20th generation, the fitness of all users has exceeded 7 points, indicating that the Cultural Color IGA algorithm can provide a design scheme with high fitness for all users under a certain algebra and meet the quality requirements of cultural design. The highest fitness reaches 9.6, which shows the ability of the Cultural Color IGA algorithm to explore the optimal solution.
In order to verify the effectiveness of the proposed intelligent dynamic color-matching method, the fuzzy comprehensive evaluation method [32,33] was used to evaluate the color application scheme in Figure 18, and the evaluation index U = u 1 , u 2 , u 3 = (color richness, color harmony, and color reproduction) was determined. A five-component scale was used to determine the rating of the evaluation, V = v 1 , v 2 , v 3 , v 4 , v 5 = (excellent, good, fair, poor, very poor). To ensure the scientific nature of the evaluation and the rationality of the weight distribution, three types of experts were invited to assign weight scores to each indicator: experts in traditional culture and art research on Yungang, experts in color design and visual communication, and experts in color science and data analysis.
During the weight distribution process, experts from various fields discussed the importance of color richness, color harmony, and color reproduction based on their professional knowledge and practical needs. They ultimately reached a consensus and determined the weight coefficients as W = 0.3 , 0.3 , 0.4 . This weight allocation scheme reflects a balance between traditional cultural and design needs while also considering the scientific and rational aspects of the evaluation process. It provides a solid theoretical foundation for verifying the effectiveness of the intelligent color-matching method.
Then, an explanation of relevant terminology and training on grading scales were provided to 100 design major university students who participated in the survey, aiming to minimize the influence of subjective factors on the evaluation results. The training covered the following content:
  • Color Richness: Refers to the diversity and saturation level of the colors in a color scheme, reflecting the visual expressiveness and attractiveness of the scheme;
  • Color Harmony: Measures the coordination and visual balance between the colors in a color scheme, involving contrast, gradient, and equilibrium;
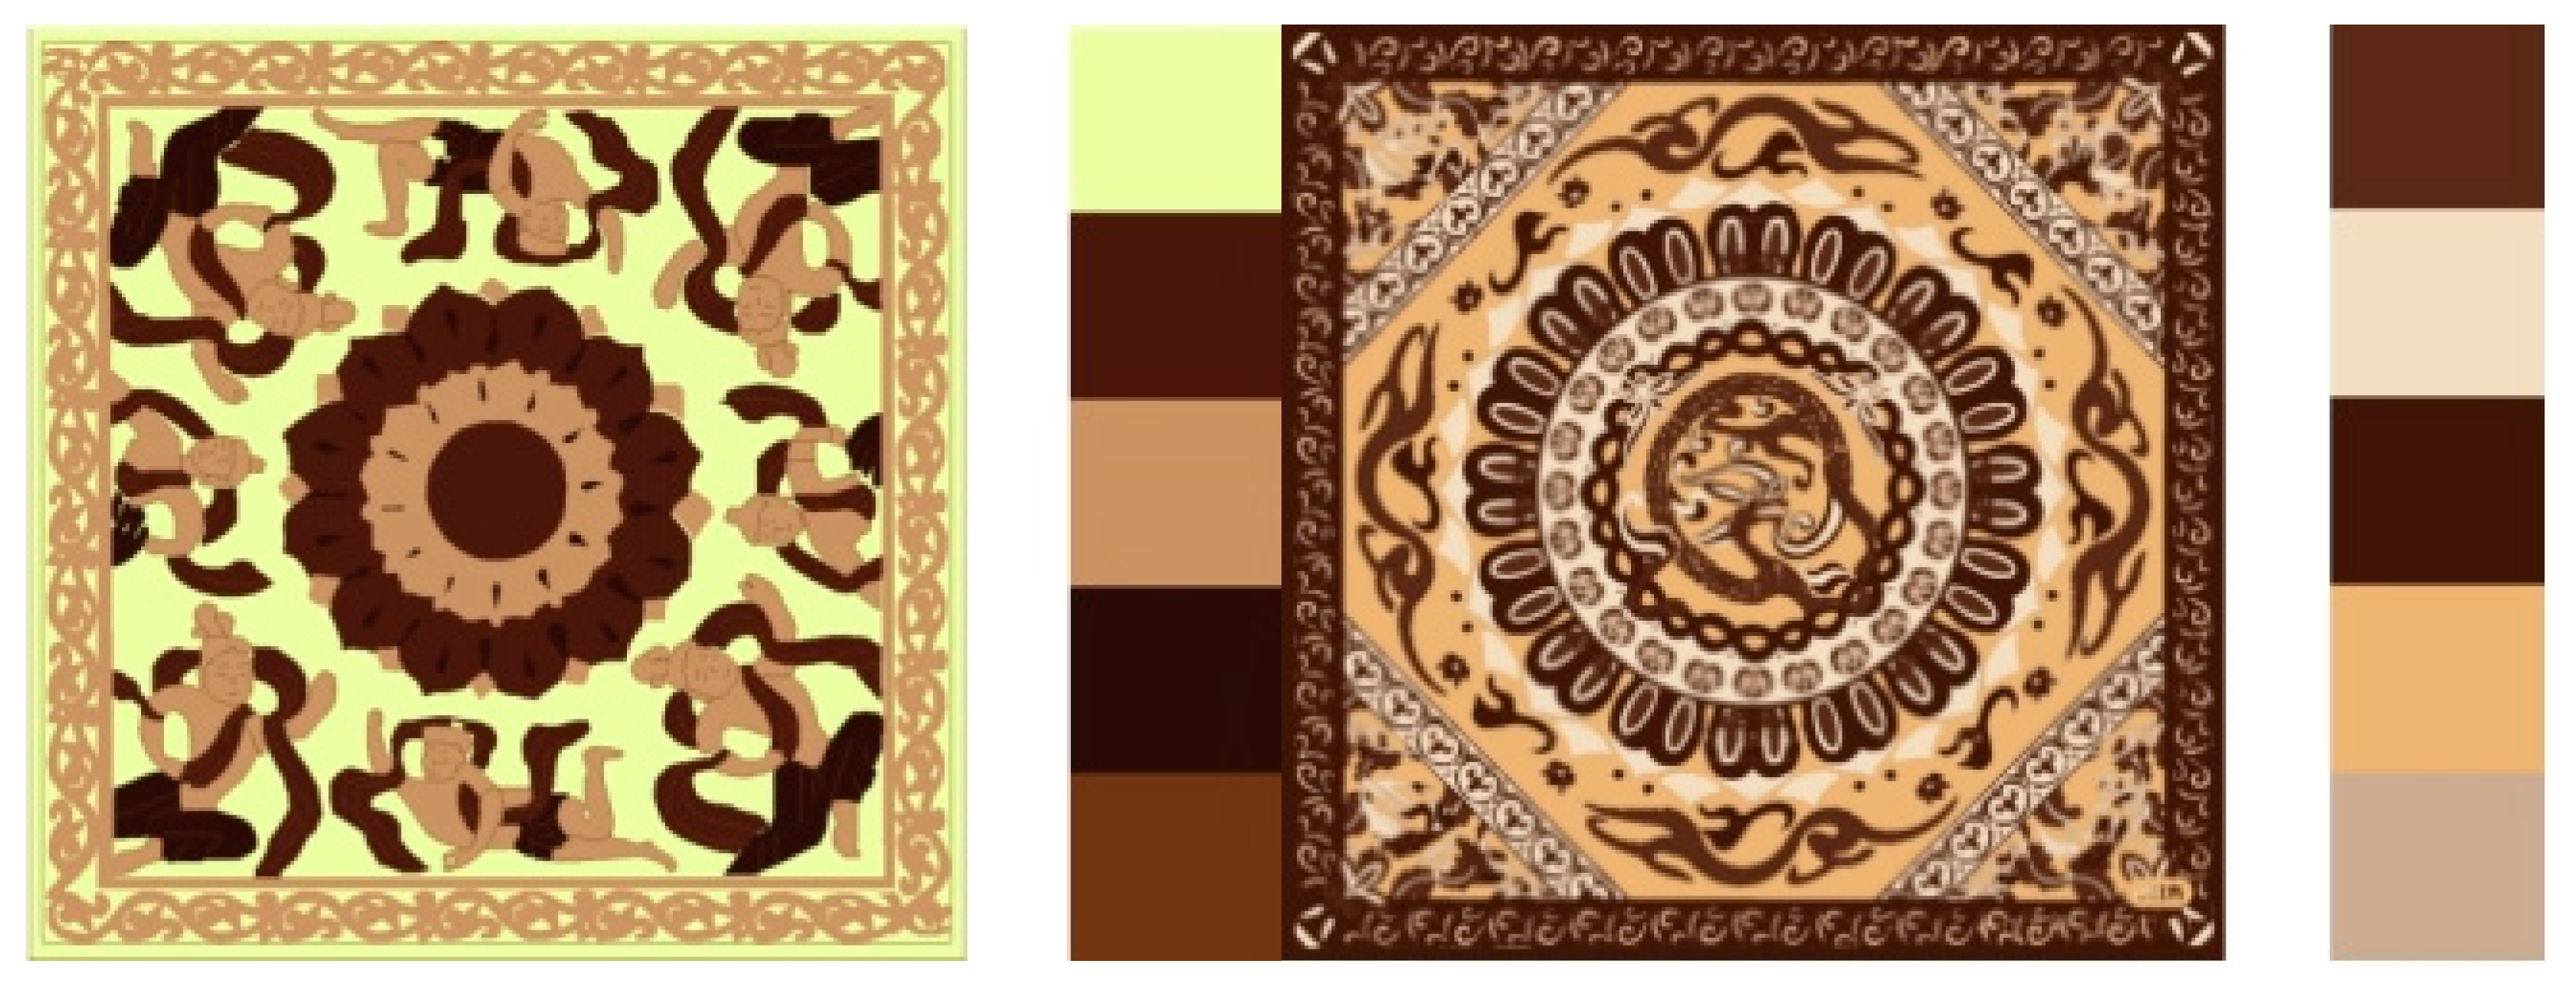
  • Color Reproduction: Refers to how faithfully the color scheme reflects the original color features of the Yungang Grottoes, embodying its historical and artistic value.
Before the survey, to ensure participants had normal color recognition abilities, all respondents underwent a pre-screening for color vision. First, participants were asked if they had known color vision impairments; then, they underwent a further color recognition ability screening using standard Ishihara color blindness charts. This rigorous screening process ensured that all participants had no color blindness or color vision deficiencies, thus ensuring the scientific and effective nature of the survey results.
The survey was conducted in the form of a questionnaire, and the evaluation data for each indicator were collected. The survey results are shown in Table 3.
The fuzzy comprehensive evaluation matrix R can be obtained from Table 3. The comprehensive evaluation value B of the color application scheme is calculated using the following formula:
B = W R
where W is the weight coefficient, and R is the fuzzy comprehensive evaluation matrix. B = [0.328, 0.478, 0.15, 0.032, 0.012]. The overall evaluation results show that 32.8% of people think that the color scheme is excellent, 47.8% think that the color scheme is good, 15% think that the color scheme is average, 3.2% think that the color scheme is poor, and 1.2% think that the color scheme is very poor. Additionally, 80.6% of people think that the generated color scheme has a good level above, which verifies the effectiveness of the proposed intelligent dynamic color scheme.

5. Conclusions

This paper combines the color network model and the color harmony prediction model to propose an innovative Cultural Color IGA algorithm for the optimized design of cultural heritage color regeneration. By integrating interactive genetic algorithms, culturally contextual color networks, and color harmony prediction models, this approach can automatically generate color schemes that are both in line with cultural heritage styles and visually harmonious, significantly improving the efficiency and quality of color design.
First, this paper designs a multi-layered color relationship network to accurately model the interrelationships between colors and their cultural contexts, providing strong data support for the regeneration of cultural heritage colors. Second, the proposed color harmony prediction model plays a key role in the design process. By training a deep learning model on large-scale datasets, we significantly enhance the accuracy and computational efficiency of color-matching. A stacking-based multi-model ensemble method is used to predict color harmony, effectively improving both the precision and stability of the predictions. Compared to traditional methods, the ensemble model handles complex color combinations better, optimizes the computational efficiency in the color design process, and reduces the need for manual intervention.
In terms of algorithm optimization, this paper combines the strengths of genetic algorithms to simulate the processes of natural selection and gene mutation, optimizing the generation of color schemes. The Cultural Color IGA can quickly converge to high-harmony design solutions within a few generations. Experimental results show that this method significantly outperforms traditional genetic algorithms in terms of maximum fitness and average fitness. The color schemes it generates not only meet the cultural heritage style requirements but also exhibit high color harmony and visual appeal.
Through comparative experiments, this paper validates the advantages of Cultural Color IGA in image color-matching, particularly in the context of cultural heritage applications. The method can accurately reproduce traditional colors according to the specific requirements of different cultural backgrounds while also aligning the design outcomes with modern aesthetic demands. Experimental results indicate that Cultural Color IGA generates higher-quality color schemes in fewer iterations compared to traditional methods, and the user evaluations are generally favorable. Specifically, 80.6% of participants were satisfied with the generated color schemes, believing they both respect the uniqueness of cultural heritage and possess modern design appeal. Most users felt that the color schemes generated by the algorithm effectively merged tradition with modernity, preserving cultural heritage while meeting contemporary design expectations. This provides new ideas and methods for the digital preservation of cultural heritage colors.
Overall, Cultural Color IGA offers an innovative technical pathway for the regeneration of cultural heritage colors, enabling not only the automation of color design but also the improvement of design quality and efficiency. This method is applicable not only to the regeneration of cultural heritage colors but also offers potential applications in other artistic fields such as fashion, industrial design, and digital media.
Future research could further optimize and expand the work presented in this paper in the following ways:
Optimization of the color harmony prediction model: The current model still has limitations in handling certain complex color combinations. Future work could incorporate more color models, deep learning methods, and user preference data to further improve prediction accuracy.
Cross-cultural heritage color regeneration: The current model is optimized primarily for the regeneration of specific cultural heritage colors. Future research could extend this method to accommodate a broader range of cultural contexts, particularly for cross-cultural heritage color regeneration, to enhance its generalizability and application scope.
Optimization of user interaction and experience: Although Cultural Color IGA improves design efficiency through automation, user experience remains an area of focus. Future work could leverage technologies such as augmented reality (AR) to provide more intuitive user interfaces, further enhancing user engagement and satisfaction.
Promotion and validation in practical applications: Future work can combine this method with real-world cultural heritage preservation projects to further validate its effectiveness in practical applications. Specifically, in fields like digital preservation of cultural heritage and virtual museum construction, Cultural Color IGA has vast application potential.
Through these optimizations, Cultural Color IGA will better serve the protection and regeneration of cultural heritage, promoting deeper integration between culture and technology and providing sustainable momentum for the innovative design of cultural heritage.

Author Contributions

Conceptualization, Q.X., Y.H. (Yan Hong) and Z.J.; data curation, Q.S. and J.W.; formal analysis, Q.X. and Z.W.; funding acquisition, B.W.; methodology, Q.X. and K.Z.; software, Y.H. (Yirui Huang); supervision, Y.H. (Yan Hong); validation, Q.X., Z.J. and Z.W.; writing—original draft, Q.X.; writing—review and editing, Z.J., Z.W. and Q.X. All authors have read and agreed to the published version of the manuscript.

Funding

This research was funded by the National Natural Science Foundation of China (Grant Number: 61906129), the China Association for Science and Technology Youth Support Talent Project (Grant Number: 2021-298), and the Hong Kong Polytechnic University GBA Startup Postdoc Programme 2022 (Grant Number: SP-22-13).

Institutional Review Board Statement

Not applicable.

Informed Consent Statement

Not applicable.

Data Availability Statement

The original contributions presented in this study are included in the article. Further inquiries can be directed to the corresponding authors.

Acknowledgments

The author would like to thank the tutors, editors, and anonymous reviewers for their helpful suggestions.

Conflicts of Interest

The authors declare no conflicts of interest.

References

  1. Shi, G.; Feng, Z.; Zhang, J.; Xu, J.; Chen, Y.; Liu, J.; Wang, Y. An Analysis of the Spatiotemporal Distribution and Influencing Factors of National Intangible Cultural Heritage Along the Grand Canal of China. Sustainability 2024, 16, 9138. [Google Scholar] [CrossRef]
  2. Wang, X.; Zhu, B.; Chen, Z.; Ma, D.; Sun, C.; Wang, M.; Jiang, X. Landscape Perception in Cultural and Creative Industrial Parks: Integrating User-Generated Content (UGC) and Electrodermal Activity Insights. Sustainability 2024, 16, 9228. [Google Scholar] [CrossRef]
  3. Zhang, Y.; Dong, C. Sustainable Development of Digital Cultural Heritage: A Hybrid Analysis of Crowdsourcing Projects Using fsQCA and System Dynamics. Sustainability 2024, 16, 7577. [Google Scholar] [CrossRef]
  4. Yang, R.; Li, Y.; Wang, Y.; Zhu, Q.; Wang, N.; Song, Y.; Tian, F.; Xu, H. Enhancing the Sustainability of Intangible Cultural Heritage Projects: Obtaining Efficient Digital Skills Preservation through Binocular Half Panoramic VR Maps. Sustainability 2024, 16, 5281. [Google Scholar] [CrossRef]
  5. Li, F.; Gao, Y.; Candeias, A.J.E.G.; Wu, Y. Virtual Restoration System for 3D Digital Cultural Relics Based on a Fuzzy Logic Algorithm. Systems 2023, 11, 374. [Google Scholar] [CrossRef]
  6. Liu, Z.; Zhao, A.-R.; Liu, S.-L. Prediction of Fading for Painted Cultural Relics Using the Optimized Gray Wolf Optimization-Long Short-Term Memory Model. Appl. Sci. 2024, 14, 9735. [Google Scholar] [CrossRef]
  7. Sarakinos, A.; Lembessis, A. Color holography for the documentation and dissemination of cultural heritage: OptoclonesTM from four museums in two countries. J. Imaging 2019, 5, 59. [Google Scholar] [CrossRef] [PubMed]
  8. Chen, X.; Zhao, S.; Gu, B. Color Analysis of Digital Printing Xiangyun Silk Qipao Based on Color Network. Adv. Text. Technol. 2022, 30, 176–185. [Google Scholar] [CrossRef]
  9. Zhu, Y.; Xu, B.; Liu, X. Reference Image-Assisted Color Matching Design Based on Interactive Genetic Algorithm. Packag. Eng. 2020, 41, 181–188. [Google Scholar] [CrossRef]
  10. Wang, P.-K.; Hong, C.-F.; Lin, M.-H. Interactive genetic algorithm joining recommender system. In Proceedings of the Intelligent Information and Database Systems: 11th Asian Conference, ACIIDS 2019, Yogyakarta, Indonesia, 8–11 April 2019; Proceedings, Part II 11 2019. pp. 40–48. [Google Scholar]
  11. Zeng, D.; Liu, K.; Liang, C.; He, M.-E.; Tang, C. Interactive evolutionary design method of product modeled based on interactive three-dimensional spherical interface. Oper. Manag. Res. 2024, 1–21. [Google Scholar] [CrossRef]
  12. Deng, L.; Wang, G. Application of EEG and interactive evolutionary design method in cultural and creative product design. Comput. Intell. Neurosci. 2019, 2019, 1860921. [Google Scholar] [CrossRef] [PubMed]
  13. Zhu, X.; Li, X.; Chen, Y.; Liu, J.; Zhao, X.; Wu, X. Interactive genetic algorithm based on typical style for clothing customization. J. Eng. Fibers Fabr. 2020, 15, 1558925020920035. [Google Scholar] [CrossRef]
  14. Jia, J.; Xu, P.; Cui, R.; Cao, J.; Sun, X. Coloration Parsing and Transfer Design of Han Folk Costumes. J. Comput. Cult. Herit. 2023, 16, 64. [Google Scholar] [CrossRef]
  15. O’Donovan, P.; Agarwala, A.; Hertzmann, A. Color compatibility from large datasets. In Proceedings of the ACM SIGGRAPH 2011 Papers, Vancouver, BC, Canada, 7–11 August 2011; pp. 1–12. [Google Scholar] [CrossRef]
  16. Kita, N.; Miyata, K. Aesthetic Rating and Color Suggestion for Color Palettes. Comput. Graph. Forum 2016, 35, 127–136. [Google Scholar] [CrossRef]
  17. Yang, B.; Wei, T.; Li, F.W.; Liang, X.; Deng, Z.; Fang, Y. Color Theme Evaluation through User Preference Modeling. ACM Trans. Appl. Percept. 2024, 21, 1–35. [Google Scholar] [CrossRef]
  18. Xiaojian, L.; Yujing, C.; Luxi, Z. Color network model of traditional patterns and auxiliary technology of color matching design. Comput. Integr. Manuf. Syst. 2016, 22, 899–907. [Google Scholar] [CrossRef]
  19. Cong, X.; Zhang, W. Design of geometric flower pattern for clothing based on deep learning and interactive genetic algorithm. J. Intell. Syst. 2024, 33, 20230269. [Google Scholar] [CrossRef]
  20. Huang, D.; Xu, X. An Online Design Framework for Interactive Genetic Algorithms/IGAOD. SoftwareX 2022, 19, 101205. [Google Scholar] [CrossRef]
  21. Ma, X.; Chen, Y.; Liang, Q.; Wang, J. Wardrobe Furniture Color Design Based on Interactive Genetic Algorithm. BioResources 2024, 19, 6230. [Google Scholar] [CrossRef]
  22. Tang, L.; Liu, X.; Hu, F. Research on Optimal Design of Rail Train Shape Based on Interactive Genetic Algorithm. Mech. Des. 2020, 37, 123–128. [Google Scholar] [CrossRef]
  23. Wang, D.; Xu, X. 3D Vase Design Based on Interactive Genetic Algorithm and Enhanced XGBoost Model. Mathematics 2024, 12, 1932. [Google Scholar] [CrossRef]
  24. Gypa, I.; Jansson, M.; Wolff, K.; Bensow, R. Propeller optimization by interactive genetic algorithms and machine learning. Ship Technol. Res. 2023, 70, 56–71. [Google Scholar] [CrossRef]
  25. Huang, D.; Xu, X.; Zhang, Y.; Xia, X. Improved Interactive Genetic Algorithm for Three-Dimensional Vase Modeling Design. Comput. Intell. Neurosci. 2022, 2022, 6315674. [Google Scholar] [CrossRef]
  26. Zeng, D.; Guan, M.; He, M.; Tian, Z. An interactive evolutionary design method for mobile product customization and validation of its application. Int. J. Comput. Intell. Syst. 2022, 15, 16. [Google Scholar] [CrossRef]
  27. Liu, J.; Zhi, Q.; Ji, H.; Li, B.; Lei, S. Wheel hub customization with an interactive artificial immune algorithm. J. Intell. Manuf. 2021, 32, 1305–1322. [Google Scholar] [CrossRef]
  28. Dou, R.; Zhang, Y.; Nan, G. Application of combined Kano model and interactive genetic algorithm for product customization. J. Intell. Manuf. 2019, 30, 2587–2602. [Google Scholar] [CrossRef]
  29. Li, Y.; Liu, X.; Sun, Y.; Lu, C. Color adjacent network model for product color design. Comput. Integr. Manuf. Syst. 2019, 25, 2255–2364. [Google Scholar] [CrossRef]
  30. Wei, T. Research and Application of Five-color Color Theme Harmony Prediction Algorithm. Master’s Thesis, Zhejiang Gongshang University, Hangzhou, China, 2020. [Google Scholar]
  31. Liu, J.; Jituo; Lu, G. Color Semantics-Driven Product Interactive Genetic Color Matching Design. J. Comput.-Aided Des. Graph. 2012, 24, 669–676. [Google Scholar] [CrossRef]
  32. Xie, X.-H.; Xu, Y.; Guo, S.; Zhu, H.; Yan, H. Evaluation and Decision of a Seat Color Design Scheme for a High-Speed Train Based on the Practical Color Coordinate System and Hybrid Kansei Engineering. Systems 2024, 12, 316. [Google Scholar] [CrossRef]
  33. Huang, Z.; Shi, Y.; Lu, F.; Li, Q.; Xue, Z. Digital Restoration of Ladies’ Costumes in Palace Music Painting. J. Text. Res. 2024, 6, 155–164. [Google Scholar] [CrossRef]
Figure 1. Color harmony prediction algorithm framework.
Applsci 15 01720 g001
Figure 2. Actual vs. predicted line plot.
Applsci 15 01720 g002
Figure 3. Fit quality plot.
Applsci 15 01720 g003
Figure 4. Model performance horizontal bar chart.
Applsci 15 01720 g004
Figure 5. Cultural Color IGA color scheme algorithm process.
Applsci 15 01720 g005
Figure 6. Interactive genetic color-matching system user interface.
Applsci 15 01720 g006
Figure 7. Initial color gene selection process based on the color network model. (a) Color network model; (b) selection of initial color genes.
Applsci 15 01720 g007
Figure 8. Initial color scheme design. (a) Line drawing; (b) color zone division; (c) initial color genes; (d) initial color scheme.
Applsci 15 01720 g008
Figure 9. Color scheme initialization. (a) Initial color scheme; (b) K-means color zone division.
Applsci 15 01720 g009
Figure 10. Initial color genes encoding.
Applsci 15 01720 g010
Figure 11. Initial population.
Applsci 15 01720 g011
Figure 12. Scheme scoring interface.
Applsci 15 01720 g012
Figure 13. Crossover and recombination.
Applsci 15 01720 g013
Figure 14. Mutation.
Applsci 15 01720 g014
Figure 15. Analysis of color genes and initial scheme in Yungang Grottoes statues. (a) Yungang Grottoes statues; (b) color network model; (c) color genes; (d) initial color scheme.
Applsci 15 01720 g015
Figure 16. Color scheme designed by a test subject.
Applsci 15 01720 g016
Figure 17. Yungang dragon pattern and plain chessboard design color scheme.
Applsci 15 01720 g017
Figure 18. Satisfactory color scheme.
Applsci 15 01720 g018
Figure 19. Comparison of the average fitness.
Applsci 15 01720 g019
Figure 20. Comparison of the average maximum fitness.
Applsci 15 01720 g020
Figure 21. Comparison of user evaluation numbers.
Applsci 15 01720 g021
Figure 22. Average fitness distribution of 10 users.
Applsci 15 01720 g022
Table 1. Model performance.
ModelMSER2MAERMSEMAPEAdjusted R2
ElasticNet0.07570.34010.21290.27520.0740.2979
Decision Tree0.06890.39950.2050.26250.07030.3612
KNN0.06280.45250.19620.25060.06820.4175
Linear Regression0.05550.5160.18450.23570.06330.4851
Bayesian Ridge0.05520.51880.18360.2350.0630.4881
ANN0.05140.5520.17830.22670.06060.5233
Random Forest0.0470.5940.17060.2160.05840.5676
SVM0.04620.59720.16850.2150.05760.5714
XGBoost0.0430.6220.16280.20820.05580.5982
LightGBM0.04330.62240.16280.20820.05570.59
CatBoost0.04190.6340.16060.20480.0550.6111
Table 2. System technical architecture.
ModuleFunction and ImplementationKey Features
Platform SelectionImplement color extraction, optimization, and display processes using the Python platform.Modular development and efficient support for color optimization tasks.
Use of Color Reference SourcesUse images provided by designers as reference sources to extract color network model and generate initial color genes through the color network model.Combining traditional culture with modern applications, ensuring the richness and diversity of the schemes.
Designer Interaction DesignThe system automatically evaluates the harmony of the color schemes through machine learning models, allowing designers to adjust and select their preferred schemes, reducing workload.Enhances efficiency, optimizes the interaction experience, and ensures optimization results.
Genetic Algorithm Optimization ProcessThe genetic algorithm gradually optimizes the color schemes through selection, crossover, and mutation operations with multiple iterations, balancing traditional aesthetics and modern innovation.Ensures the practicality of the optimized results, making the schemes more culturally valuable and innovative.
Color Scheme FunctionalityColor schemes are displayed intuitively, supporting designers in comparing, adjusting, and optimizing. The final optimized schemes can be directly used in actual design projects.Quickly generates high-quality schemes, lowers the design threshold, and meets multi-level user needs.
Table 3. Color scheme evaluation scoring.
U v 1 v 2 v 3 v 4 v 5
u 1 0.290.510.180.020
u 2 0.310.470.120.060.04
u 3 0.370.460.150.020
Disclaimer/Publisher’s Note: The statements, opinions and data contained in all publications are solely those of the individual author(s) and contributor(s) and not of MDPI and/or the editor(s). MDPI and/or the editor(s) disclaim responsibility for any injury to people or property resulting from any ideas, methods, instructions or products referred to in the content.

