1. Introduction
As the demand for waterway transport continues to grow, the inland shipping industry is rapidly expanding, making vessel safety and efficient navigation central to the sector’s priorities. For instance, in the Yangtze River system, the total number of inland transport vessels reached 93,400 in 2022, with a combined deadweight of 125 million tons. This represents a 49% increase in carrying capacity compared to 2012, while the average tonnage of cargo ships rose by 129%. However, with the ongoing expansion of inland shipping, high-density traffic in waterways have introduced significant safety risks. Between 2018 and June 2022, a total of 563 waterway accidents occurred along the Yangtze River main line, with collisions accounting for 48.31% of these incidents [
1]. These frequent traffic accidents result in substantial economic losses and decreased navigational efficiency, underscoring the urgent need to enhance existing waterway traffic awareness technologies and improve the service capabilities of inland vessels.
Currently, traditional waterway traffic awareness services predominantly rely on vessel traffic service (VTS) systems to provide traffic control and navigational guidance, ensuring navigational safety. However, these services typically depend on a limited number of sensors as data sources, which introduces significant limitations in the complex inland waterway environment of today [
2]. For instance, AIS receivers collect data on vessel position, speed, and heading, offering basic dynamic monitoring capabilities. Nevertheless, the transmission of AIS data is subject to latency, and in high-density traffic environments, data congestion can occur, compromising real-time performance [
3].
Video monitoring data can directly capture the visual appearance and dynamic behavior of vessels, providing the advantage of obtaining detailed, fine-grained information. However, traditional video monitoring systems face significant limitations in today’s complex inland waterway environment. In expansive waterway settings, multi-camera systems struggle to detect small vessels due to constraints in resolution, frame rate, and equipment performance. Additionally, complex background noise and dynamic occlusion further degrade the recognition accuracy of target detection algorithms [
4]. Furthermore, a large volume of existing video data is often not effectively analyzed, processed, or utilized, and relying on manual monitoring for comprehensive surveillance has made real-time, efficient operation increasingly challenging.
The limitations of relying on a single data source can no longer meet the service demands of today’s complex inland waterway environment. As a result, effectively integrating data from diverse sensors has become crucial for enhancing the safety and efficiency of inland waterways. In recent years, the rapid advancement of deep learning technology has introduced new methodologies for waterway traffic perception. With its powerful feature extraction and pattern recognition capabilities, deep learning has led to significant breakthroughs in areas such as object detection, object tracking, and multi-source data fusion. Deep learning enables the processing of large-scale heterogeneous data from multiple sensors, such as AIS and video monitoring, to uncover potential correlations between data, facilitating the seamless integration of dynamic information and visual features and thereby providing a comprehensive perception of complex dynamic scenes.
Currently, multi-source data fusion for waterway traffic situation awareness faces several challenges in practical applications. The format, temporal resolution, and spatial frequency of different data sources vary significantly. Additionally, environmental differences in waterways during data collection complicate the temporal and spatial synchronization of multi-source data. To address these challenges, this paper proposes a waterway traffic situation awareness method based on multi-source sensor data collected through an intelligent navigation marker system. By integrating an edge server equipped with Jetson Orin into the intelligent beacon, AIS data and video surveillance data are fused. Furthermore, an improved single-stage object detection algorithm enhances the detection of small targets and complex backgrounds. A target-tracking algorithm ensures continuous vessel trajectory tracking, improving tracking stability in multi-ship encounter scenarios. Additionally, this paper introduces a matching method based on trajectory prediction and regional set partitioning, effectively mitigating AIS data latency and achieving temporal and spatial synchronization between AIS and video data. In recent years, augmented reality (AR) technology has gained increasing attention in spatial perception. By integrating virtual information with the real environment, AR technology enhances spatial awareness, improves navigation and positioning accuracy, and provides innovative solutions for visualizing complex spatial information. These advancements highlight AR’s potential applications in waterway traffic situation awareness [
5,
6,
7,
8]. Building upon this, we have developed a traffic situation awareness framework utilizing AR. By dynamically displaying vessel types, navigation speed, and traffic flow, the framework provides traffic statistics and periodic predictions, offering more comprehensive and intelligent service support for inland waterway vessels.
2. Related Work
Inland waterways, due to their unique geometry and high traffic density, place significant pressure on waterway traffic situation awareness [
9]. Traditional waterway information perception primarily relies on manual monitoring and the transmission of information via optical signals, which are not only inefficient but also susceptible to human error and environmental factors, making real-time, precise monitoring challenging. With the rapid advancement of deep learning technology, methods based on object detection, tracking, and multi-source data fusion have progressively been applied to waterway monitoring, substantially enhancing perception capabilities and management efficiency.
In recent years, deep learning, leveraging the remarkable potential of convolutional neural networks (CNNs) in computer vision tasks, has been widely applied in image classification, image enhancement, and other image processing domains [
10]. Numerous deep learning methods have been developed for object detection, including R-CNN [
11], Fast-RCNN [
12], Faster-RCNN [
13], SSD [
14], and the YOLO [
15] series. Enhancements based on these object detection algorithms have found widespread application in the maritime domain. For instance, Liu et al. incorporated the CA attention mechanism into YOLOv7-tiny, modified the SPP structure, and replaced the loss function with SIoU, significantly improving the model’s performance [
16]. Woo et al. introduced ConNextV2 and applied it to the YOLO network, effectively enhancing the model’s performance across various recognition benchmarks [
17]. Kim et al. designed the channel attention pyramid structure of ECAP-YOLO, reducing information loss and optimizing detection accuracy [
18]. Cai proposed the FE-YOLO model, which combines feature fusion and enhancement techniques to notably improve marine target detection accuracy [
19]. Wang et al. introduced the Asymptotic Feature Pyramid Network (AFPN) and Large Selection Kernel Attention Mechanism (LSK) into YOLOv8, improving multi-scale feature fusion and suppressing background interference. This significantly enhanced the precision of multi-scale vessel target detection and the ability to recognize small targets, addressing issues related to small target miss detection and false alarms in complex environments [
20]. Wu proposed a network structure (CTF-Net) that integrates convolution and a transformer for ship detection, enhancing detection accuracy and robustness by balancing local feature extraction and global information modeling [
21]. Huang combined convolutional neural networks (CNNs) and the Swin transformer to achieve fine-grained vessel classification, improving recognition accuracy for various vessel types and optimizing the model’s performance across diverse scenarios [
22]. Zhou proposed a method for detecting dense inshore ships based on edge semantic decoupling and transformers, effectively improving detection accuracy and reducing false alarms and missed detections by incorporating ship edge semantic information and contextual information [
23].
In the complex traffic environment of inland waterways, stable and accurate target-tracking technology is crucial for achieving fine-grained situation awareness. Computer vision-based target-tracking algorithms focus on specific targets, providing dynamic traffic situation information [
24]. For instance, Hu presents a vessel detection and tracking scheme for cage aquaculture visual surveillance, which effectively improves the accuracy and efficiency of vessel detection and tracking through robust foreground detection, background updating, fast four-connected component labeling, and wave ripple removal, thereby enhancing the security of cage aquaculture [
25]. Park proposes four YOLO-based object recognition models and a new tracking algorithm to improve recognition accuracy and tracking stability in high-dynamic environments [
26]. Yang addresses the challenges in coastal ship tracking and proposes an enhanced SiamMask network. By integrating visual object tracking with segmentation and leveraging a refined feature pyramid network (FPN) and a multidimensional attention module (MDAM), the method effectively addresses issues such as scale variation and edge information loss. This approach significantly improves tracking accuracy and robustness, achieving state-of-the-art results on the LMD-TShips dataset [
27]. Huo et al. proposed the PF-TBD method based on spectral residual bivariate entropy, enabling target detection and tracking without prior knowledge of sea clutter by extracting salient maps and calculating information entropy [
28]. Shan et al. developed the SiamFPN deep learning tracking method, modifying the Siamese network, combining candidate region selection with historical influences, and facilitating real-time maritime vessel tracking [
29]. Shan introduces LMD-TShip, a large-scale, high-resolution benchmark dataset for maritime ship tracking, designed to provide effective means for training and testing ship-tracking models in autonomous navigation applications. Through a detailed analysis of the dataset’s characteristics and challenging attributes, it lays the foundation for developing advanced maritime ship-tracking methods [
30]. Pujara reviews real-time multi-object detection and tracking technology based on YOLO and DeepSORT, analyzing the application, advantages, and disadvantages of different algorithms in object detection, classification, and tracking and exploring the practical application potential of these technologies in various fields [
31].
The complexity and high traffic density of inland waterways demand multi-source data fusion technologies to enhance overall perception capabilities and decision support. By integrating data from different sensors, the comprehensive monitoring and precise localization of vessels can be achieved, thereby improving waterway efficiency and safety. In recent years, researchers have proposed various methods to fuse AIS data and visual data in order to enhance perception capabilities in inland waterways. For example, Chen presents a method for tracking a vessel by combining video surveillance and shipborne AIS (automatic identification system) reports. It dynamically adjusts the camera’s focus and orientation and applies a Kalman filter to smooth video images, achieving the automatic positioning and tracking of specific vessels while enhancing the tracking accuracy and user-friendliness of video surveillance systems [
32]. Man, based on AIS and video data, employs the Kalman filter algorithm to fuse the two data sources, optimizing vessel trajectory estimation [
33]. Hu presents a maritime surveillance framework that fuses camera-based vessel detection with the automatic identification system (AIS) to achieve accurate and reliable vessel identification, providing effective technical support for maritime safety monitoring [
34]. Guo presents a multimodal maritime data fusion method based on asynchronous trajectory matching for vessel traffic surveillance in inland waterways, utilizing deep learning techniques to integrate automatic identification system (AIS) and video data in order to enhance the accuracy and robustness of vessel detection, tracking, and data fusion [
35]. Ding presents a method for assessing the risk of vessel collision in inland waterways based on the fusion of AIS and visual data, effectively improving the accuracy and reliability of collision risk assessment by integrating the strengths of both data sources and providing more reliable decision support for navigation safety in inland waterways [
36]. Qu proposes an anti-occlusion tracking algorithm based on visual trajectory analysis, which uses multi-dimensional feature analysis and the Hungarian algorithm to match data from different sensors, effectively reducing detection omissions caused by vessel overlap [
37]. Liu et al.’s intelligent, edge-driven, multi-source data fusion framework, combining the lightweight YOLOX-s network and transfer learning, achieves real-time vessel detection and the efficient fusion of AIS data, enhancing the navigation capabilities of autonomous surface vessels [
38].
Despite significant progress in waterway perception, some limitations persist. For example, in vessel detection within inland waterways, vessels vary considerably in size, and some targets exhibit small features and low resolution. The loss of target feature information caused by convolution and pooling operations often results in misdetection and the missed detection of small targets. To address these challenges, this paper proposes a target detection algorithm designed to enhance the features of small targets and low-resolution objects. Additionally, due to the inherent latency of AIS data, real-time matching with video data remains challenging in practical applications. To overcome this issue, this paper predicts historical AIS data to synchronize with video data, followed by data integration using a region-based partitioning matching method.
3. Intelligent Navigation Marker System
The intelligent navigation marker system retains the existing navigational assistance functions of traditional markers while enhancing their capabilities through the integration of navigation information devices within perception systems. This enhancement aims to meet the service requirements of digital waterways and intelligent shipping conditions.
In our experiment, we deployed a series of intelligent navigation markers in the navigation area near Wugong Railway Bridge #4 in the Wuhu section of the Yangtze River. These markers are equipped with advanced sensors and communication devices, allowing for the real-time monitoring of waterway conditions and the collection of traffic data.
3.1. Overall Structure of the Intelligent Navigation Marker System
The overall architecture of the intelligent navigation marker system is illustrated in
Figure 1. It is primarily divided into shore-based support modules, hardware device modules, functional implementation modules, and application scenarios.
The intelligent navigation marker system is first equipped with various hardware devices, including a VHF module for voice communication between the markers and vessels, an automatic identification system (AIS) for the real-time collection of dynamic data such as vessel location, speed, and heading, a multi-camera module to capture video of the waterway to enable target detection and identification, and a hydrometeorological detection module to collect waterway hydrological data.
The intelligent navigation marker system features scene perception capabilities and an augmented reality (AR) module. Scene perception leverages video object recognition and multi-source data fusion techniques to enable the precise monitoring of vessels and the surrounding environment, including target identification and integrated perception. The AR module dynamically displays key information such as the vessel type, heading, speed, and traffic flow.
The overall architecture facilitates efficient information transmission and processing through multi-layered technologies. The fleet of lightships, consisting of intelligent navigation marker nodes, is connected to the cloud data center via 4G/5G base stations. Data are stored and processed in the cloud, while the shore-based support provides monitoring interfaces and decision support functions. This architecture fully utilizes multi-source data fusion, edge computing, and cloud collaboration technologies, enabling the effective deployment of the intelligent navigation marker system in inland waterway transportation and thereby significantly enhancing waterway safety and service capabilities.
3.2. Design for Intelligent Waterway Services
The intelligent navigation marker system enables the implementation of advanced waterway perception technology, offering more comprehensive and efficient services to vessels navigating the waterway. Vessels in transit require real-time and accurate waterway information, such as water flow, weather conditions, and navigation warnings, to ensure safe passage. Traditional information services may suffer from delays and fail to meet the immediate needs of vessels. The intelligent navigation marker integrates various sensors and communication technologies, enabling real-time data collection and processing, and it delivers services to vessels through VHF broadcasting. This system primarily gathers waterway information through three modules.
The multi-camera system is a crucial perception module within the intelligent navigation marker system. It is capable of identifying and tracking vessels on the waterway while capturing dynamic changes. In dense and complex environments, the system significantly improves vessel detection and tracking accuracy by integrating data from multiple perspectives.
- 2.
AIS Receiver Device
The AIS reception module is a core component of the intelligent navigation marker system, playing a critical role in vessel dynamic monitoring and traffic management. This module receives and decodes signals transmitted from nearby vessels in real time, extracting key information such as the position, speed, heading, and vessel type. Such information is essential for assessing vessel distribution, speed, and relative position within the waterway, enabling the early prediction of potential navigation conflicts and collision risks.
- 3.
Hydrological Information Receiver Device
The hydrological information reception module is equally crucial for waterway environment perception, particularly in dynamic environments where weather and hydrological conditions fluctuate significantly. This module receives and analyzes real-time hydrological data, such as water levels, flow rates, and tidal changes, providing vessels with accurate information regarding navigational conditions. Hydrological data are vital for ensuring safe navigation, especially under conditions of high flow rates or low water levels, where vessels must adjust their navigation plans based on real-time data.
By leveraging the multi-camera system, hydrological and meteorological detection modules, and the automatic identification system (AIS), the intelligent navigation marker can collect real-time environmental data and vessel dynamic behavior information along the waterway. The marker monitors waterway conditions through cameras and the AIS system, identifying and tracking vessels and other objects. By integrating multiple data sources, it combines visual data and AIS information, enabling more precise traffic situation awareness concerning the waterway. Additionally, the marker can receive and analyze weather data, providing vessels with timely weather updates and navigation warnings.
4. Methodology
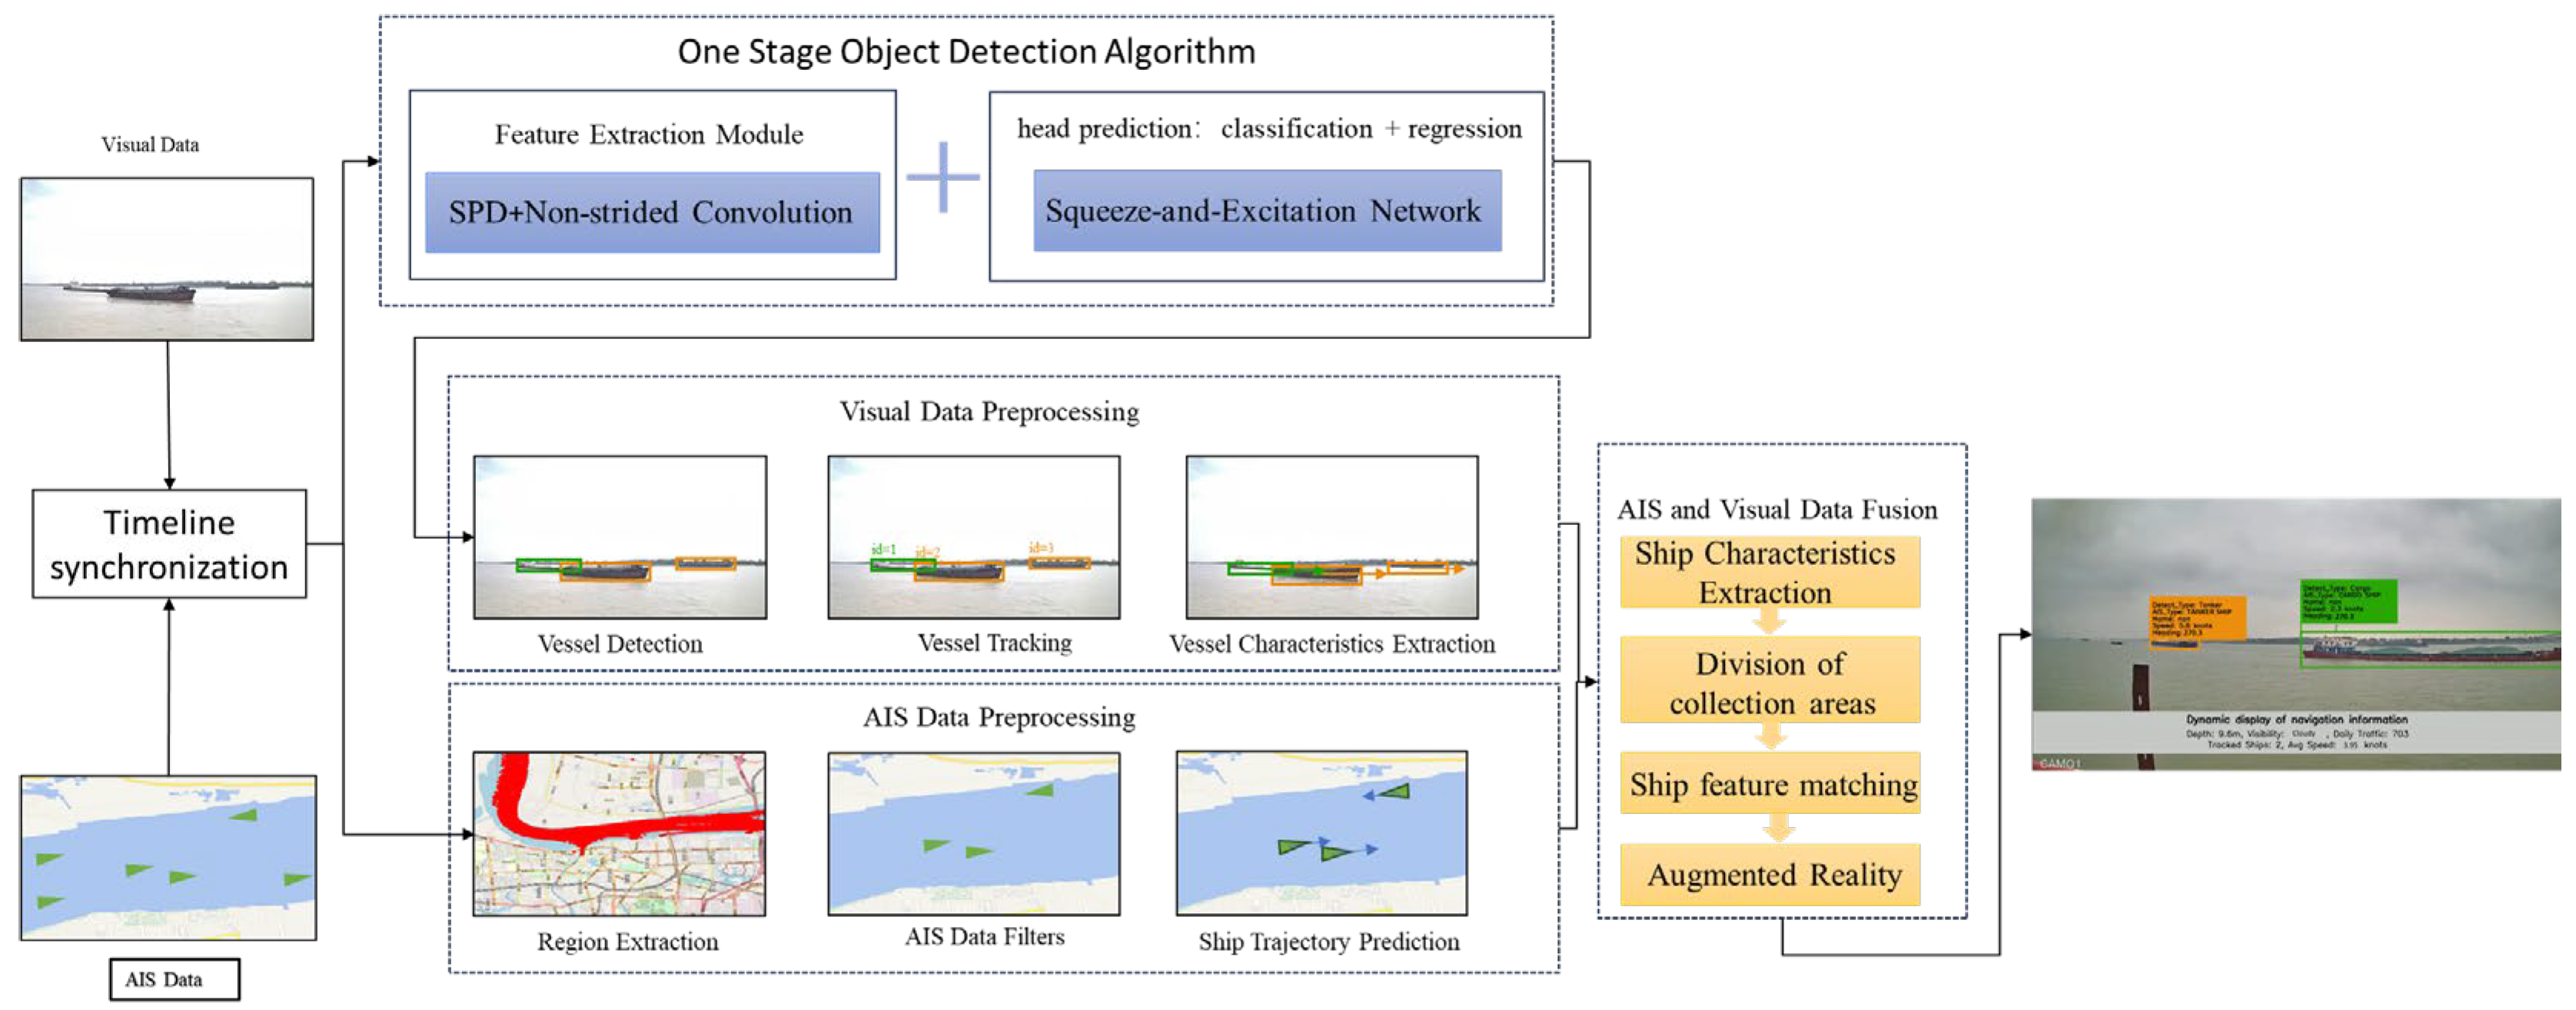
This paper improves a one-stage object detection algorithm and a vessel trajectory tracking algorithm to achieve accurate vessel detection and tracking along a waterway. Additionally, a trajectory prediction algorithm is employed to forecast vessel AIS data, facilitating the integration of waterway video imagery and AIS data. Finally, to enhance the accuracy of inland waterway traffic situation awareness, we have developed an augmented reality (AR) framework for traffic situation perception.
The overall framework of our waterway traffic situation awareness architecture is shown in
Figure 2 below:
4.1. Ship Detection Based on One-Stage Object Detection Model
Video monitoring data provide real-time dynamic information about vessel movement, which is essential for waterway traffic situation awareness. To enable efficient and real-time vessel detection in a waterway, this section focuses on employing a one-stage object detection algorithm for vessel detection.
The workflow of the one-stage object detection algorithm is illustrated in
Figure 3. First, the input image is resized to a fixed dimension, followed by data augmentation to enhance the model’s generalization capability. The image is then passed through the backbone network for feature extraction, generating multi-level feature maps that capture rich spatial and semantic information. These feature maps are subsequently processed via the neck network, typically utilizing a feature pyramid network (FPN) or path aggregation network (PAN) to integrate features from different scales and improve detection performance for multi-scale objects. In the detection head, the algorithm divides the feature map into multiple grid cells, with each grid cell responsible for predicting several anchor boxes and outputting the corresponding class probabilities, bounding box offsets, and confidence scores. These predictions are then refined through post-processing steps, such as non-maximum suppression (NMS), to select the final detection results. The loss function of the algorithm accounts for classification error, localization error, and confidence error. By jointly optimizing these losses, the algorithm achieves efficient and accurate detection performance.
4.1.1. Feature Learning Enhancement Module
Given that some vessels in inland waterways exhibit low resolution and small sizes during object detection, we propose replacing the strided convolution and pooling layers in the convolutional neural network (CNN) of the e-stage object detection algorithm with the SPD-Conv module. This modification aims to mitigate the loss of fine-grained information in CNNs when processing low-resolution images and small targets.
The SPD-Conv module employed in this study was proposed by Raja Sunkara to address the performance degradation of CNNs when processing low-resolution images or small detection targets [
39]. SPD-Conv utilizes spatial-to-depth transformation and non-strided convolution to reduce the spatial dimensions of feature maps while retaining all channel information. This method mitigates the loss of fine-grained details caused by strided operations, enhancing the model’s ability to learn features from low-resolution images and small targets and thereby improving detection accuracy. SPD-Conv consists of an SPD layer and a non-strided convolutional layer. This section provides a detailed introduction and optimization tailored to the practical scenarios of inland waterway environments.
The space-to-depth (SPD) component utilizes image transformation techniques to sample feature maps within a CNN and across the entire network. It splits an intermediate feature map X of size S into a series of sub-feature maps. Considering the characteristics of inland waterway scenarios, we modified the SPD component’s sub-feature map formula by incorporating dynamic offsets o
i and o
j, allowing for better adaptation to complex backgrounds and multi-target occlusions. The specific formula is as follows:
where
, and
is the scaling factor that controls the sparsity of sampling. In inland waterway scenarios where vessel targets are small in size, appropriately lowering the scale helps preserve sufficient detail features while improving computational efficiency. Building on this, we introduce dynamic adjustments for the offsets
and
, with their values determined by the size distribution of vessel targets in the inland waterway environment:
The dimensions of the newly generated feature map,
, change from
to the following:
Non-strided convolution is a technique used in convolutional neural networks (CNNs) characterized by a stride of 1. This configuration ensures that the convolutional kernel slides over the input feature map without skipping any pixels, thereby preserving the spatial information.
Non-strided convolution is applied following the SPD (space-to-depth) layer to process the high-dimensional feature maps generated via SPD. It helps in extracting features while utilizing learnable parameters to reduce the number of channels. This process ensures the preservation of discriminative features without the information loss typically associated with strided convolutions. Consequently, all distinguishing feature information is effectively retained. The layer consists of filters, where . The objective is to transform into . This design allows the non-strided convolution layer to effectively reduce the number of channels in the feature map without losing information. Since the stride of the non-strided convolution is 1, the convolutional kernel slides over the feature map without skipping any pixels, thereby preserving its spatial resolution.
4.1.2. Squeeze-And-Excitation (SE) Module
Traditional object detection algorithms primarily focus on extracting spatial dimensional features, often neglecting the dependencies between channels. This limitation may hinder the performance of the network in complex tasks, particularly in the context of intricate waterway scenarios. To address this, this paper proposes the use of the squeeze-and-excitation (SE) network module to dynamically adjust the feature weights between channels, thereby enhancing the representational power of the convolutional neural network (CNN). The SE module introduces a feature recalibration mechanism, dynamically adjusting the weights of each channel. This enables the network to focus more on valuable features and suppress redundant or irrelevant information, ultimately improving the overall performance of the model.
The workflow of the SE module can be summarized as two core operations. First, the input
is a multi-dimensional tensor, typically represented as
. Then, the input
undergoes a convolution operation,
, to generate the output feature map,
, as follows:
where
denotes the feature map of the
-th channel, and
represents the convolutional kernel for the
-th channel.
In the context of inland waterway scenarios, the SE module replaces traditional global average pooling with global weighted pooling to capture global information and emphasize key regions, such as vessels and obstacles. For each channel,
, global weighted pooling computes a channel descriptor,
, which represents the global information of that channel. The specific formula is as follows:
In this case, represents the spatial weights, which effectively increase the importance of specific regions in waterway monitoring. The SE module then constructs a nonlinear mapping through two fully connected layers, transforming these global descriptors into weight coefficients for each channel. Finally, feature dynamic recalibration is achieved by applying the weight coefficients to the input features.
4.1.3. Activation Functions and Loss Functions
A narrow waterway and heavy vessel traffic limit the available navigation space, leading to frequent vessel overlaps in certain sections. However, traditional loss functions present limitations in object detection, particularly when handling small objects, highly overlapped targets, or significant bounding-box deformations. These challenges can impede the model’s convergence speed and generalization capability, especially in such unpredictable scenarios.
To address these challenges, this paper proposes replacing the loss function in the algorithm with Focal-EIoU. Focal-EIoU is an enhanced object detection loss function that combines the advantages of focal loss and EIoU, aiming to improve the performance of object detection models, particularly in challenging scenarios. It is specifically designed to overcome the limitations of traditional loss functions in small object detection and high-density target environments. The Focal-EIoU loss function is as follows:
Furthermore, this study replaces the activation function in the detection algorithm with RReLU (randomized ReLU). RReLU is a variant of the ReLU activation function that introduces a random slope in the negative value range to mitigate the vanishing gradient problem. During training, RReLU randomly selects a slope value, enabling the network to maintain a larger gradient in the negative region and thereby enhancing the model’s learning capacity. Compared to traditional ReLU, RReLU effectively prevents gradient vanishing in the negative range and introduces randomness into the model, which improves its generalization ability and accelerates convergence. The formula is as follows:
In this context,
indicates that the slope
is randomly sampled from the interval
. To address the complex dynamic background and deformation issues in the inland waterway scenario, this study enhances the dynamic adjustment mechanism for the negative slope of RReLU. The adjustment is based on the absolute value distribution of the input features:
In this context, represents the input feature value of the current batch. The higher the proportion of negative values in the absolute value distribution, the larger the random slope. This mechanism helps maintain gradient propagation in the negative region under dynamic backgrounds, thereby enhancing stability and accelerating convergence.
4.2. Ship Target Detection Under Low Visibility Conditions
The enhanced single-stage object detection algorithm effectively captures the visual information of waterway vessels. However, in real-world vessel detection, varying weather conditions significantly degrade image quality and reduce detection accuracy. To improve robustness under adverse weather conditions, we apply image enhancement techniques to vessel images affected by heavy fog and low-light environments, followed by object recognition.
4.2.1. Ship Detection Under Foggy Conditions
Under foggy conditions, reduced maritime visibility significantly degrades the accuracy of the target detection algorithm. To mitigate this issue, we employ image enhancement techniques based on the dark channel prior and guided filtering to enhance vessel image clarity.
The dark channel prior is an image restoration method based on the atmospheric scattering model, designed to enhance image quality. For any given input image,
, its dark channel is defined as follows:
Here,
represents each channel of the color image, and
denotes a window centered at pixel
. In computer vision and computer graphics, the atmospheric scattering model is widely used to describe foggy images, necessitating pixel-wise image modeling:
Here,
represents the observed foggy image,
is the original, undistorted image,
is the transmission, which indicates the proportion of light passing through the fog, and
denotes the atmospheric light, representing light pollution in a foggy environment. The brightest part of the foggy image is typically the atmospheric light. Next, we aim to estimate
based on the known value of
. The formula is then transformed to derive Equation (13):
Suppose that the transmission,
, of each window is constant, denoted as
, and the value of
is given. By applying two minimum operations on both sides of the equation, we obtain Equation (14):
Based on the dark channel prior theory, the following can be derived:
Substituting Equation (14) into Equation (13) yields the atmospheric transmission
With the image’s depth under consideration, a parameter,
, is introduced to correct for this. The estimation of transmission is as follows:
If the transmission value is too small, it can lead to an overestimation of
. To address this, a threshold,
, is set to ignore the minimum transmission values. When
, we set
. The final image restoration dehazing formula is then:
4.2.2. Ship Target Detection in Nighttime Environments
In environments with insufficient lighting, the performance of object detection algorithms often deteriorates. To address this, we process low-light or high-contrast images to restore the true visual perception of the image. First, given an image
, its brightness value can be decomposed into the product of the reflection component
and the illumination component
:
Here, represents the reflection component, and represents the illumination component. The goal is to recover the reflection component from the observed image while suppressing the influence of the illumination component .
To extract the reflection component from
, the Retinex algorithm employs a logarithmic transformation. First, the original image
is log-transformed to obtain the following:
Then, the image is processed using filters at different scales to estimate the illumination component
Here,
is the Gaussian kernel, and
denotes the convolution operation. In this way, the illumination component is estimated through filtering, and the reflection component
is obtained.
To further enhance low-light images, we need to process the extracted reflection component. At this point, the reflection component
represents the object features of the image but may still lack brightness or detail. To address this issue, we can apply local contrast enhancement techniques to adjust the brightness or contrast of the reflection component, further enhancing the image. Finally, by combining the illumination component
with the enhanced reflection component
, the enhanced image is restored. The final enhanced image can be expressed as follows:
4.3. Ship Trajctory Tracking Based on Multi-Objiect Tracking Algorithm
After performing vessel detection, we extract visual features of the vessels from a single frame image. To track vessels across video frames, it is essential to establish associations between vessels in consecutive frames. The vessel tracking process consists of three main stages: detection, association, and trajectory update. In the detection stage, the object detection algorithm identifies vessels in each frame, generating bounding boxes and associated confidence scores. Vessel trajectory tracking in this study is based on the detection results obtained from a one-stage object detection algorithm. First, the object detection algorithm processes the input image
, producing multiple detection boxes,
, where each detection box contains the following information:
where
and
represent the center coordinates of the
-th detection box,
and
denote the width and height of the
-th detection box, and
indicates the probability that the
-th detection box corresponds to a valid detection. This probability, typically output through the object detection model, takes values in the range [0,1]. The Kalman filter predicts the next state of the target using the state transition model:
where
is the state transition matrix,
is the process noise, and
is the covariance matrix. In the data association phase, the Hungarian algorithm is used to solve the matching problem between detection results and predicted trajectories. The key to the matching process lies in the computation of the cost matrix
, which is obtained through a weighted calculation of motion information and appearance features:
where
represents the intersection over union (IoU) between the detection and prediction boxes, which is used to measure the positional matching accuracy;
is the cosine distance of the deep features between the detection target and the tracked target, used to measure the similarity of appearance features. The weight parameter
determines the relative importance of these two types of information. Finally, through continuous trajectory updates, the complete trajectory of each target in the video is output.
4.4. Multi-Source Data Fusion
To integrate AIS and video data, this paper proposes a matching method that combines camera view partitioning with pixel coordinate mapping. The method divides the video frame into multiple smaller regions, and by linking the vessel’s pixel coordinates with its actual geographical location, it identifies the region to which the vessel belongs and performs the matching process. The specific implementation is outlined as follows.
4.4.1. Camera View Partitioning
To begin, the camera’s visible range must be modeled as a set of regions. Its center is denoted as
, with the starting angle of the camera’s field of view as
and the maximum angular range as
. The camera’s field of view is then uniformly divided into
smaller regions, each spanning an angular range of
, and each region is labeled as
. The specific formula is as follows:
The width,
, and height,
, of the video frame define the pixel coordinate system. The video frame is then divided into an equal number of regions based on the number of partitions in the real camera’s field of view. The baseline is set to
, and each region is labeled as
. The specific calculation formula is as follows:
The starting boundary of the video frame is ; represents the pixel width of each region.
4.4.2. Multi-Source Data Timeline Synchronization
Due to the inconsistent time intervals in the transmission of AIS data, we first need to synchronize the AIS data with the video data along the time axis to avoid insufficient fusion accuracy during the data fusion stage caused by these time discrepancies.
At the initial stage of collecting video timestamps, we are actually collecting AIS data from both before and after the timestamp. Therefore, we first need to calculate the vessel’s position at the video’s starting timestamp and then perform interval sampling of the subsequent AIS data at consistent time intervals. The specific calculation formula is as follows:
Here, and are two time points, with and representing the vessel’s positions at these two time points, and is the timestamp to be calculated.
4.4.3. AIS and Video Data Matching Method
In the pixel coordinate system of the video data, the vessel’s position and motion trajectory are obtained in real time through object detection and tracking. By using the vessel’s current pixel coordinates , the specific region in which the vessel is located can be identified.
Within the actual camera view region set, the vessel’s latitude and longitude from historical AIS data are first predicted using a prediction model to obtain the latitude and longitude coordinates
synchronized with the video timestamp. These coordinates are then converted into polar coordinates
using the camera’s installation position
and azimuth angle,
. Finally, the set number,
, of the region in which the vessel is located, is determined based on the polar coordinates. The specific conversion formula is as follows:
If a region set contains multiple vessels simultaneously, the angle-first matching rule can effectively prioritize vessel targets, ensuring more accurate matching between AIS and video data. Initially, vessels are prioritized based on the baseline priority of the vessel targets and the region set to which they belong, sorted from nearest to farthest, with the closest vessel matched first.
Suppose that there are
detected vessel targets in a region set,
, denoted as
. The baseline angle of each target in the region set
is
, where the calculation formula for each target relative to the baseline is as follows:
According to the angle-first matching principle, we sort the features of all target vessels
in the region set
by the angle interval
in ascending order, denoted as follows:
Here, represents the AIS feature of the -th vessel in the region set , sorted by the angle interval in increasing order relative to the baseline angle. Starting from the baseline of the pixel interval in the pixel coordinate system, vessel feature matching is performed from left to right. The first vessel pixel coordinate encountered is matched with the first vessel feature, , in the distance-sorted list, and this process continues for all vessels in the region.
This study validates the matching through the distance between the vessel and the camera. First, multiple vessels within the same region set are sorted in ascending order based on their distances from the camera position. The distances between these targets and the camera are denoted as
. Following the distance-prioritized matching principle, the features,
, of all target vessels are sorted in ascending order of their distance intervals
, denoted as follows:
Next, starting from the baseline in the pixel coordinates, vessel feature matching is performed from bottom to top. The first vessel pixel coordinate encountered is matched with the first vessel feature, , from the distance-sorted list, and the process continues accordingly. Finally, the vessel features matched based on the angle-prioritized principle and the vessel features matched based on the distance-prioritized principle are compared. If they correspond to the same vessel, the match is considered successful.
5. Experiments
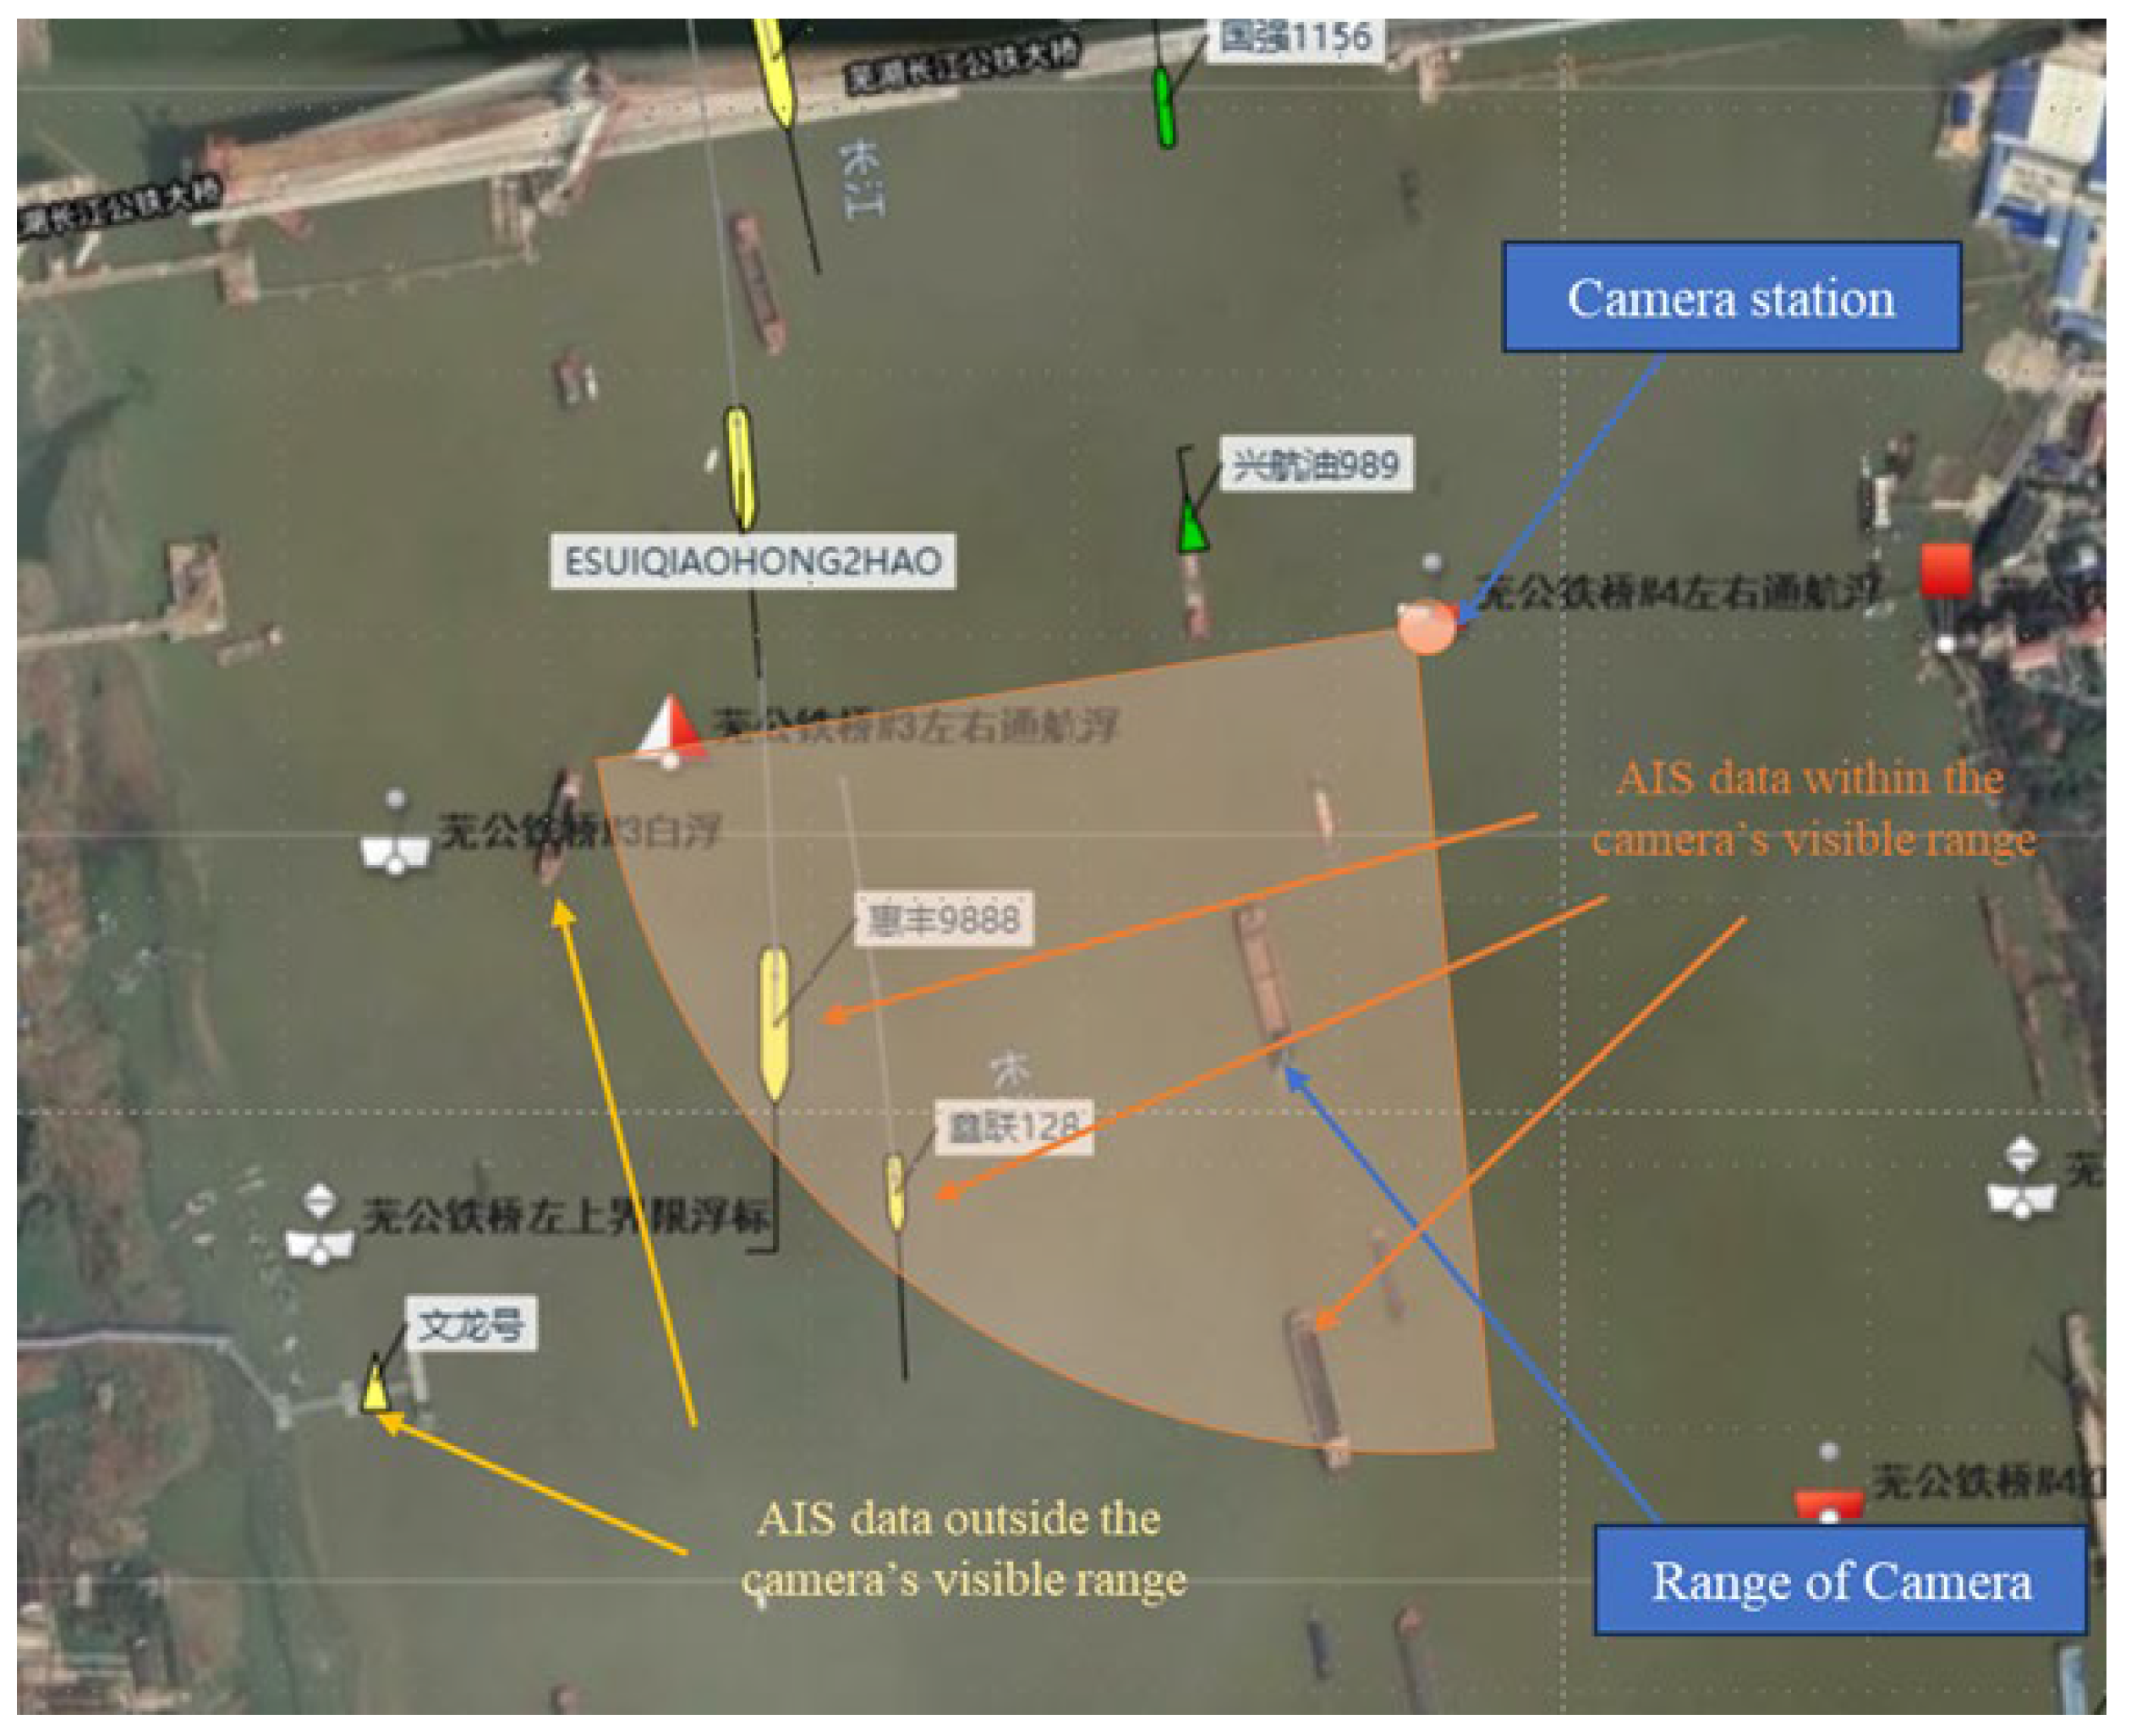
5.1. Experimental Data and Environment
In this section, we present a benchmark dataset for vessel detection, tracking, and data fusion, which is used to evaluate the proposed augmented reality (AR) architecture for waterway traffic situation awareness. The dataset comprises 30 videos along with corresponding AIS data, all collected from the Wuhu section of the Yangtze River waterway in China. The AIS and video data were captured using network cameras and AIS receivers located at the #4 navigation marker of the Wugong Railway Bridge. The data were transmitted to the local system via an SSH remote tunnel. The scope of the dataset is illustrated in
Figure 4.
During the data collection process, due to the inherent time delay in AIS data transmission, the actual AIS data collected correspond to moments before and after the video start timestamp. To mitigate the errors caused by this time delay, we first calculate the vessel’s position at the video start timestamp using interpolation. Then, we improve the fusion accuracy by setting up equal-time interval sampling. Our experimental dataset is available at
https://github.com/20221095/AIS-CV (accessed on 28 December 2024).
The AIS data collected for this experiment comprise over 100,000 records spanning from 22–24 October 2024. These records include information such as vessel MMSI, heading, speed, latitude, longitude, and vessel type. The main vessel categories are cargo ships, tankers, yachts, fixed navigation aids, and tugboats. Since the majority of vessels in the waterway are cargo ships and tankers, other vessel types, such as yachts, fixed navigation aids, and tugboats, are categorized as “Unknown” to mitigate the imbalance caused by significant differences in the number of records across categories. The AIS data were filtered based on completeness and the camera detection range to eliminate entries with missing key data, outliers, and corrupted records. After filtering, we obtained 28,216 AIS records for cargo vessels, 22,584 for tankers, and 8431 for unknown vessels. A sample of the collected AIS data is shown in the
Table 1 below.
This study extracts frames from waterway monitoring video, saving one image every 60 frames based on the video length. Intervals were used to create an image dataset, consisting of 56,874 images. The dataset includes three vessel categories: Cargo, Tanker, and Unknown, with each image having a resolution of 1980 × 1080. The dataset is divided into training, validation, and test sets at a ratio of 8:2:1.
The operating system used in this study is Linux, version 5.4.0-200-generic, with a CPU version of E5-2698 v4 @ 2.20GHz, a Tesla V100-DGXS-32GB GPU with 32 GB of memory, and an Intel(R) Xeon(R) CPU. The programming language is Python 3.10.15, the deep learning framework is PyTorch 2.5.0, and the CUDA version is 12.4.
5.2. Evaluation Metrics
To validate the effectiveness of the proposed method, we randomly selected five congested segments from the Wuhu waterway dataset for comparative experiments on vessel detection, tracking, and data fusion. The detailed information of the test set is shown in
Table 2, where NOV and NOA represent the number of detected vessels and the number of vessels with AIS data, respectively:
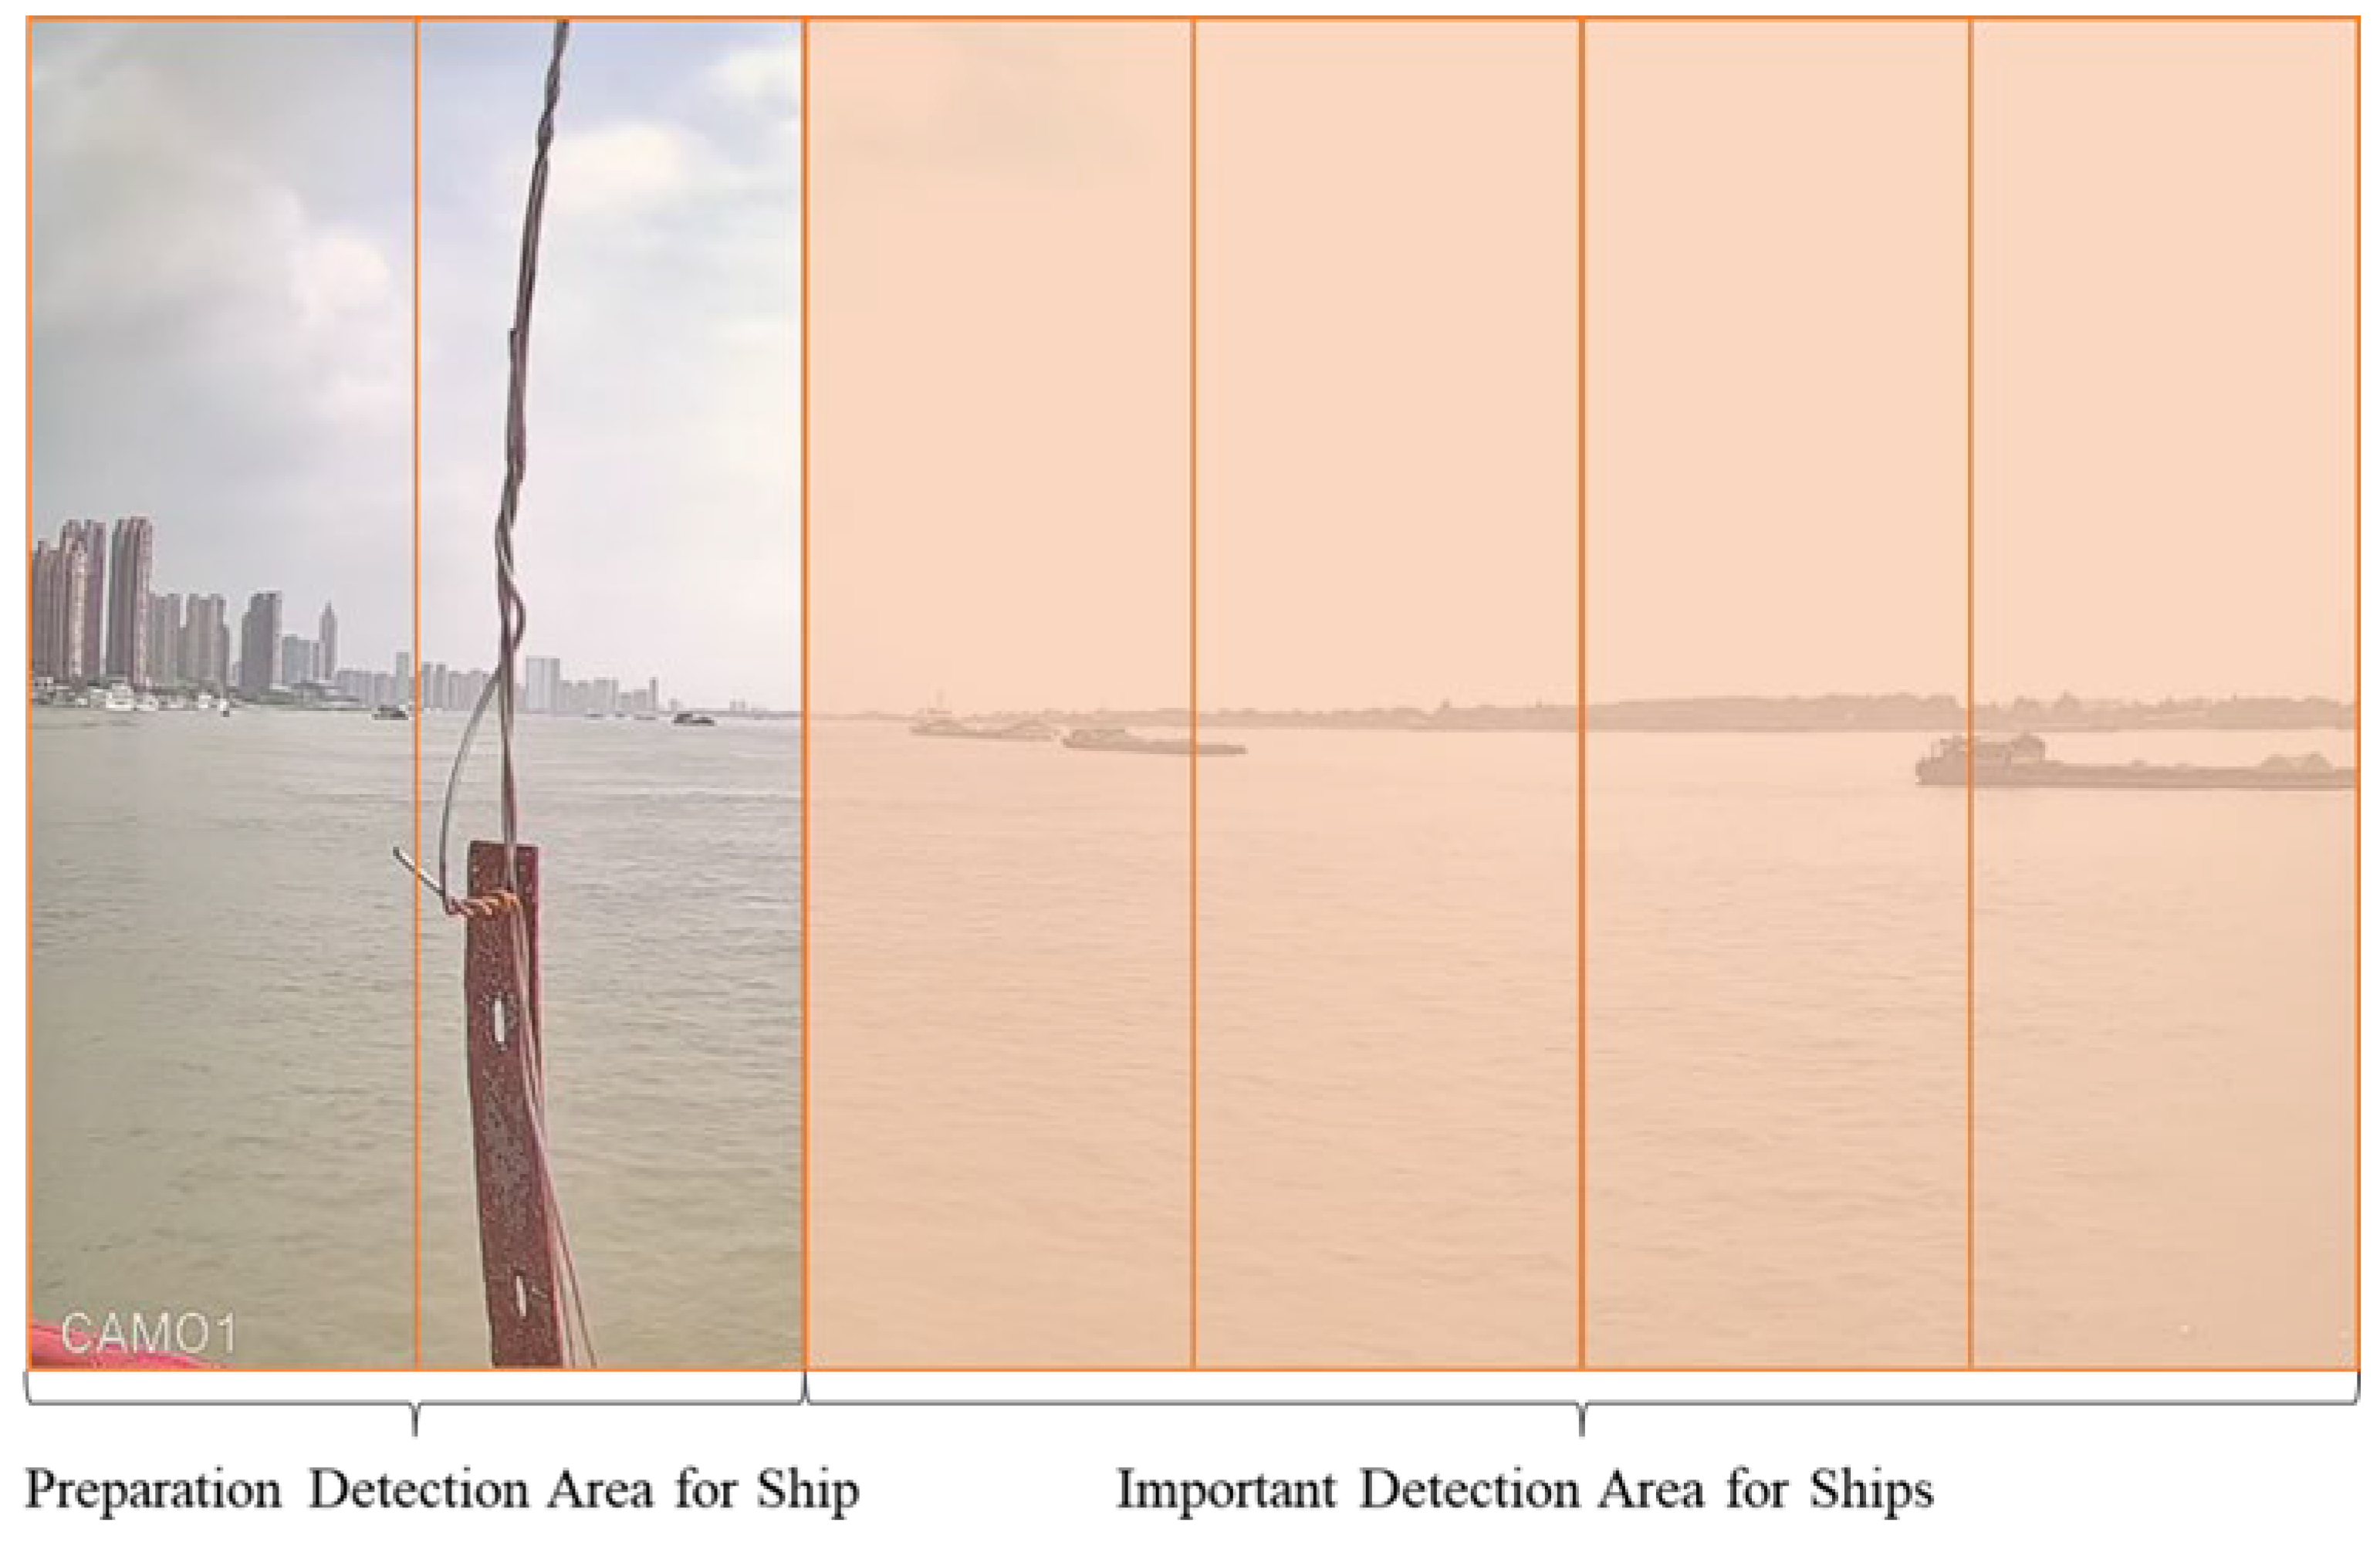
This study divides the two small subregions within the waterway vessel detection area into key and regular detection zones to enhance the accuracy of vessel identification within the visual range. The regular detection zones are denoted as
and
, while the key detection zones are represented by
,
, , and
. Computational resources are primarily focused on the key detection zones, and if no vessels are detected in these zones, resources are reallocated to the remaining detection areas. The allocation of regions is depicted in
Figure 5.
The experiment evaluated the model’s performance based on precision, recall, and mean average precision (mAP).
Precision represents the false detection rate when the model detects targets, while recall indicates the missed detection rate. mAP@0.5 is the sum of the average precision (AP) for all labels divided by the total number of categories. A higher mAP@0.5 value indicates better detection accuracy for the model.
The calculation formulas for precision (P), recall (R), and mAP are shown below:
Here, P represents precision, R represents recall, TP is the number of true positives, FN is the number of false negatives, FP is the number of false positives, and n is the total number of categories.
To evaluate the performance of ship consistency labeling in the waterway, we use Multi-Object Tracking Accuracy (MOTA) and modified Multi-Object Detection Accuracy (MOCA) as evaluation metrics. These metrics assess the detection results for each frame in the five test videos by comparing them with the actual ground truth. Additionally, we employ identification precision (IDP), identification recall (IDR), and the IDF
1 score as evaluation criteria for maintaining consistent ship identities. The calculation formulas are as follows:
In this context, “type” refers to the category of the detected vessel, while ,,,, and represent the number of vessels of each type that are incorrectly classified as positives, incorrectly classified as negatives, correctly classified as positives, misallocated vessel types, and the total number of ground truth instances, respectively. Higher values of MOCA, IDP, IDR, and IDF1 indicate better fusion performance and improved consistency in vessel detection.
In the evaluation of data fusion performance, we performed a frame-by-frame analysis of the five videos in the test set, using fusion accuracy, IDP, IDR, and the IDF
1 score as evaluation metrics. The specific calculation formulas are as follows:
In the data fusion evaluation, we replaced the ship type with the ship’s MMSI, which represents the identity information of the tracked vessel. , and represent the number of MMSI incorrectly classified as negative examples, the number of MMSI incorrectly classified as positive examples, and the number of MMSI true ground truth values, respectively. Additionally, we also combine IDP, IDR, and IDF1 as metrics for fusion accuracy; a better fusion model is characterized by higher FA, IDP, IDR, and IDF1.
5.3. Multi-Source Data Fusion Experiment
This paper’s multi-source data fusion model training process focuses on three key aspects. First, to address the challenge of poor detection accuracy for small vessels with significant scale variations in complex nearshore backgrounds, we adjusted the feature weights between channels. Second, recognizing the inherent latency in AIS data transmission, we used a trajectory prediction model to forecast AIS data, enabling synchronization that facilitates matching with vessels in real-time video data. Finally, we proposed a fusion method based on region set partitioning. By dividing the visible range of visual detection and the pixel coordinate regions of the video monitoring system, we performed feature matching between AIS data collected via the AIS receiver and visual information captured through the camera. Additionally, we conducted spatiotemporal consistency checks by comparing pixel coordinates with the geographic locations of AIS trajectories.
During the training of the model-driven visual detection model, the number of iterations was set to 300, with an input batch size of 16 and an initial learning rate of 0.001.
The experimental results are shown in
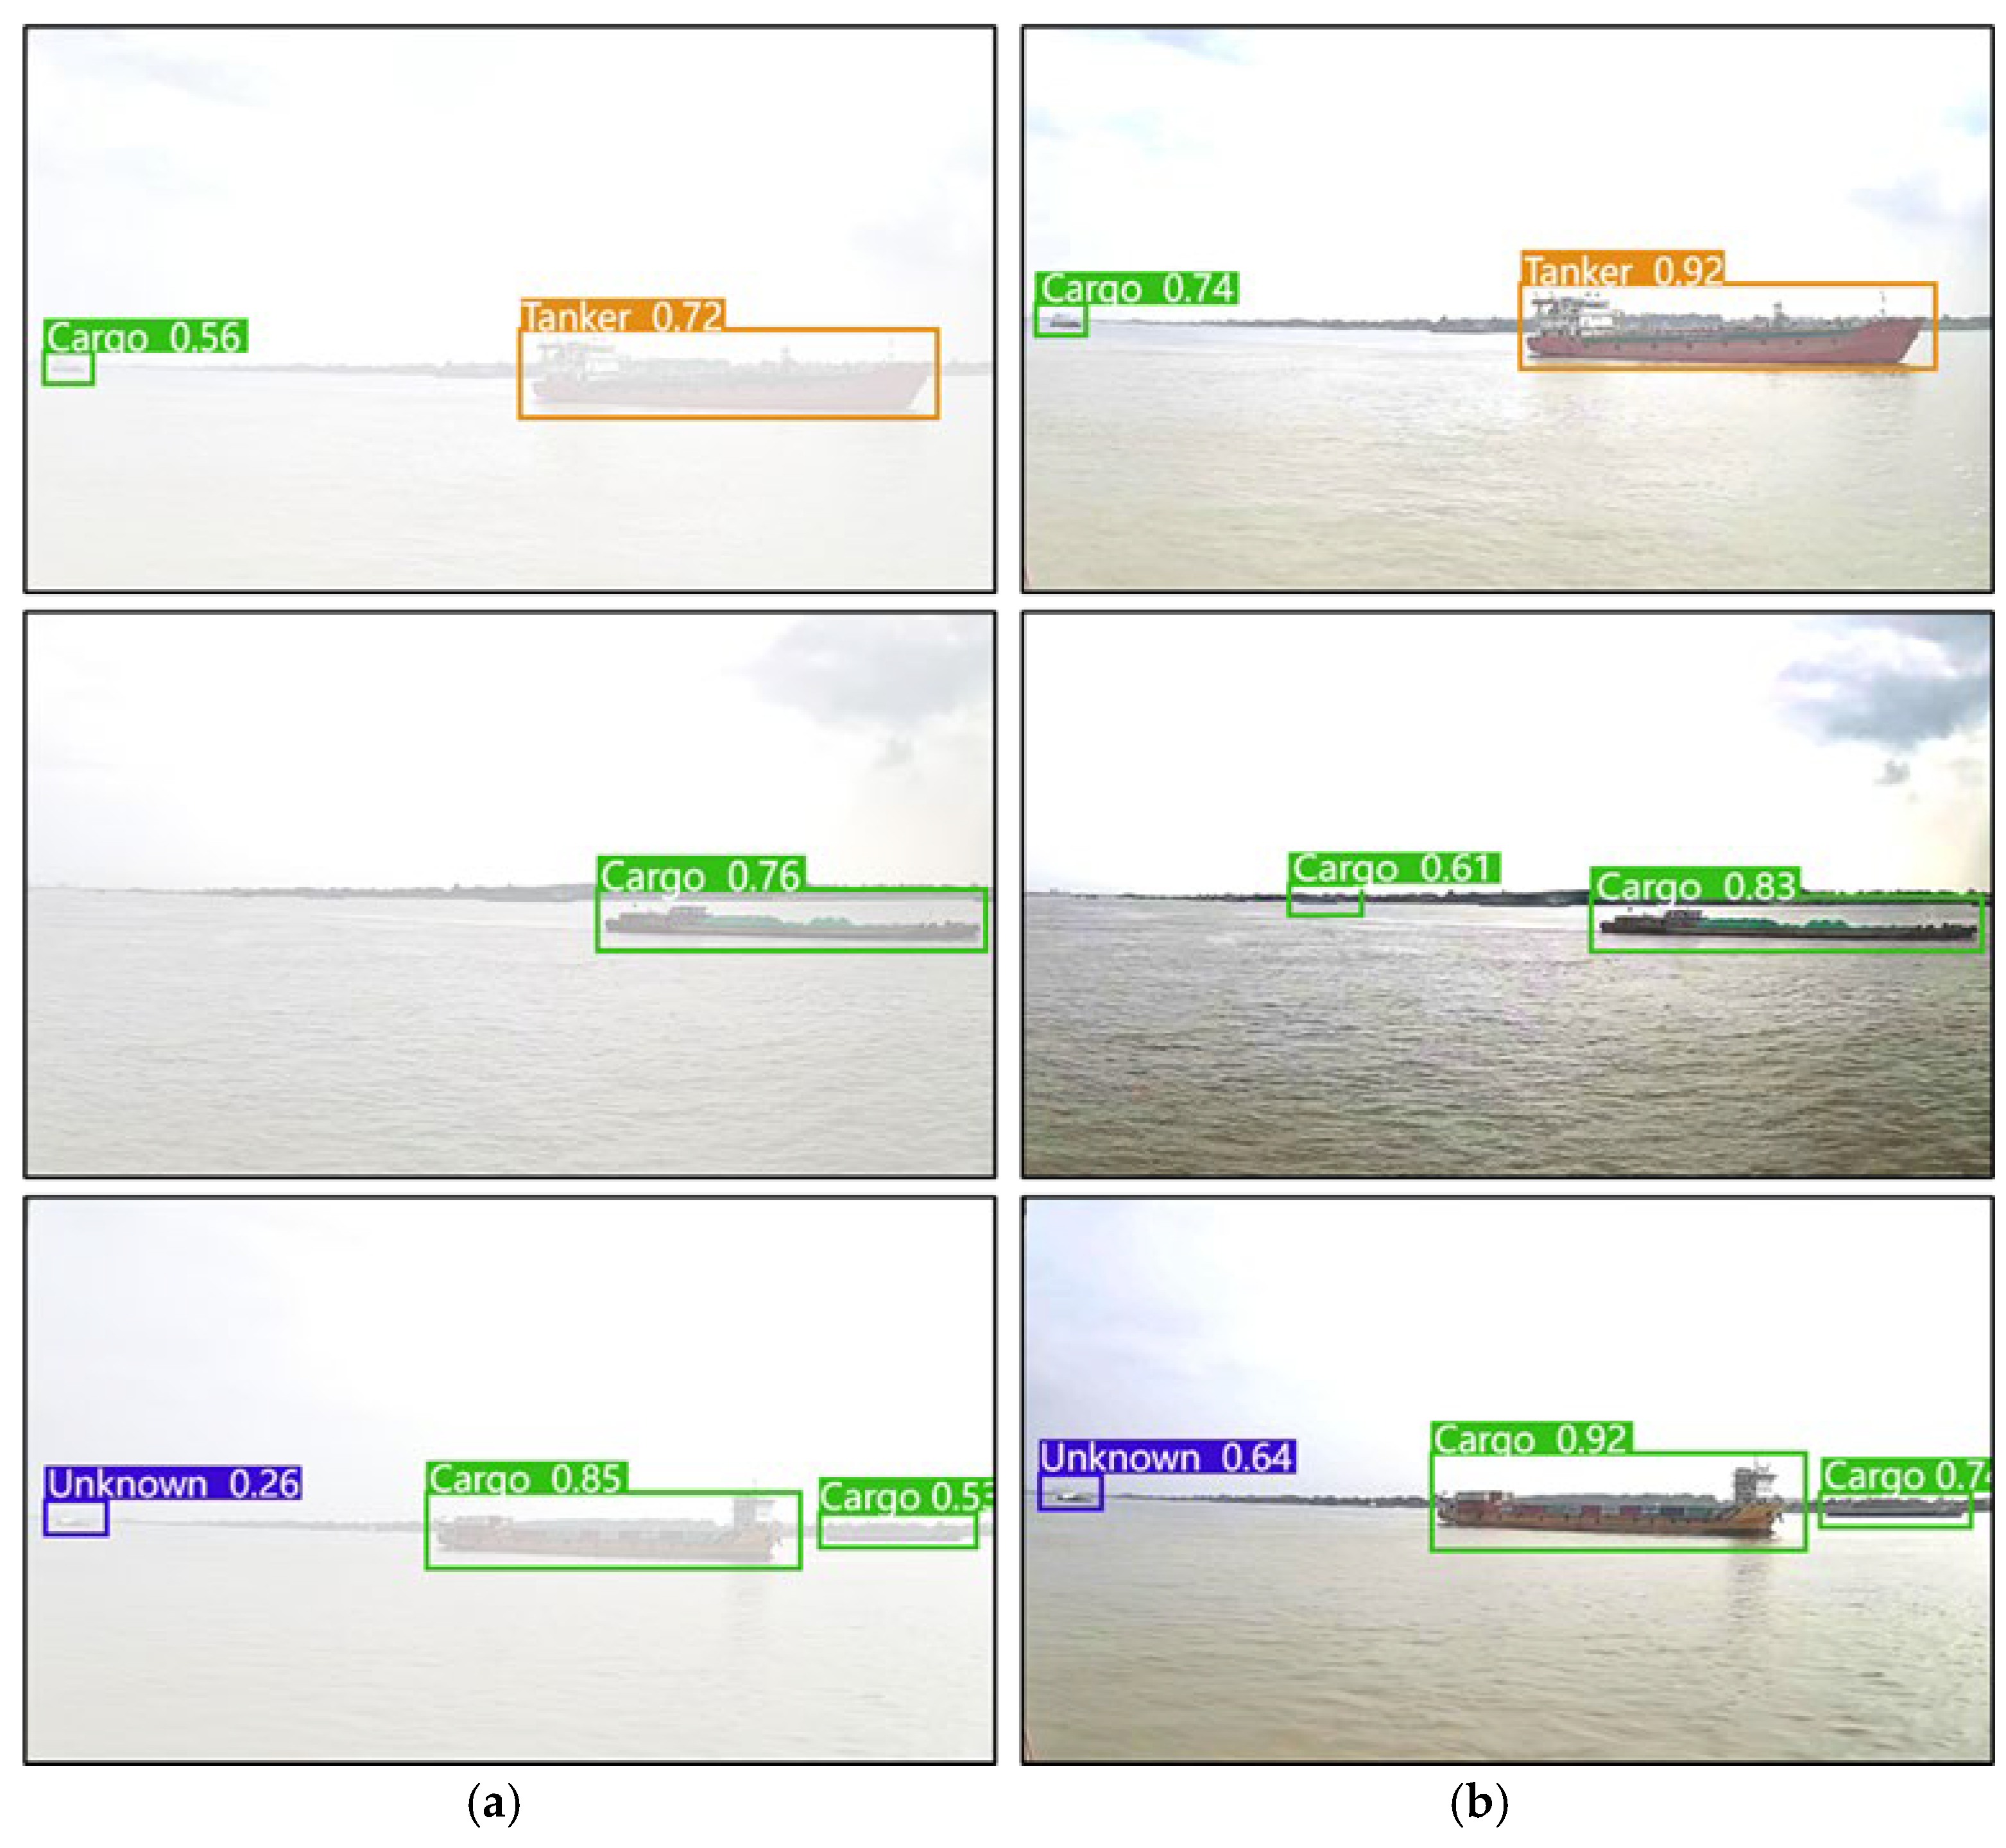
Table 3. The experimental results demonstrate that the enhancements made to the one-stage object detection algorithm significantly improved the model’s performance. Following the introduction of the SPD-Conv module, the model’s performance for small object detection was notably enhanced, achieving a mAP@0.5 of 0.956 for small objects in the Unknown category. The addition of the Detect_SE module further optimized feature extraction, resulting in a slight increase in the model’s mAP@0.5 to 0.976, with improvements across all detection categories. The incorporation of the Focal-EIoU loss function effectively boosted the model’s detection capabilities for overlapping targets, particularly increasing the detection accuracy for the Unknown category from 0.949 to 0.963, while the overall mAP@0.5 rose to 0.978. Additionally, after integrating the RReLU activation function, the model achieved its optimal performance, with the mAP@0.5 increasing to 0.981 and detection accuracies for the Cargo, Tanker, and Unknown categories reaching 0.991, 0.988, and 0.963, respectively. In conclusion, the proposed improvements significantly enhanced the detection performance for low-resolution small objects and overlapping targets in complex environments. The synergy between the modules resulted in exceptional detection performance, particularly for the Unknown category, which typically features smaller targets.
To further validate the superiority of the proposed algorithm, a comparative experiment was conducted between this algorithm and several mainstream object detection algorithms, including Faster R-CNN, SSD, YOLOv8, and YOLOv11, using the Wuhu waterway dataset under identical experimental parameters. The results are presented in
Table 4:
The experimental structure comparison is shown in
Figure 6. Based on the analysis of the comparative experimental results, the proposed method demonstrates exceptional performance across three key metrics: precision, recall, and mAP@0.5. Compared to other mainstream object detection algorithms, such as Faster R-CNN, SSD, YOLOv8, and YOLOv11, the proposed method achieved a precision of 0.971, significantly surpassing Faster R-CNN’s 0.872 and YOLOv8’s 0.952 and indicating our method’s superior ability to reduce false positives. In terms of recall, the proposed method also exhibits strong performance, demonstrating excellent target detection coverage. Regarding the mAP@0.5 metric, the proposed method outperforms all other mainstream algorithms. These results clearly highlight the effectiveness of the optimization strategy in the proposed object detection method, particularly in complex scenarios, where it achieves higher detection accuracy and robustness. This, in turn, provides more reliable technical support for inland waterway traffic situation awareness. Additionally, the
Table 5 presents the MOCA, IDP, IDR, and IDF
1 results for various object detection algorithms across five video segments.
Compared to other object detection algorithms, the proposed improved algorithm significantly reduces missed and false detections in complex scenarios, resulting in more stable vessel detection performance in crowded and challenging environments.
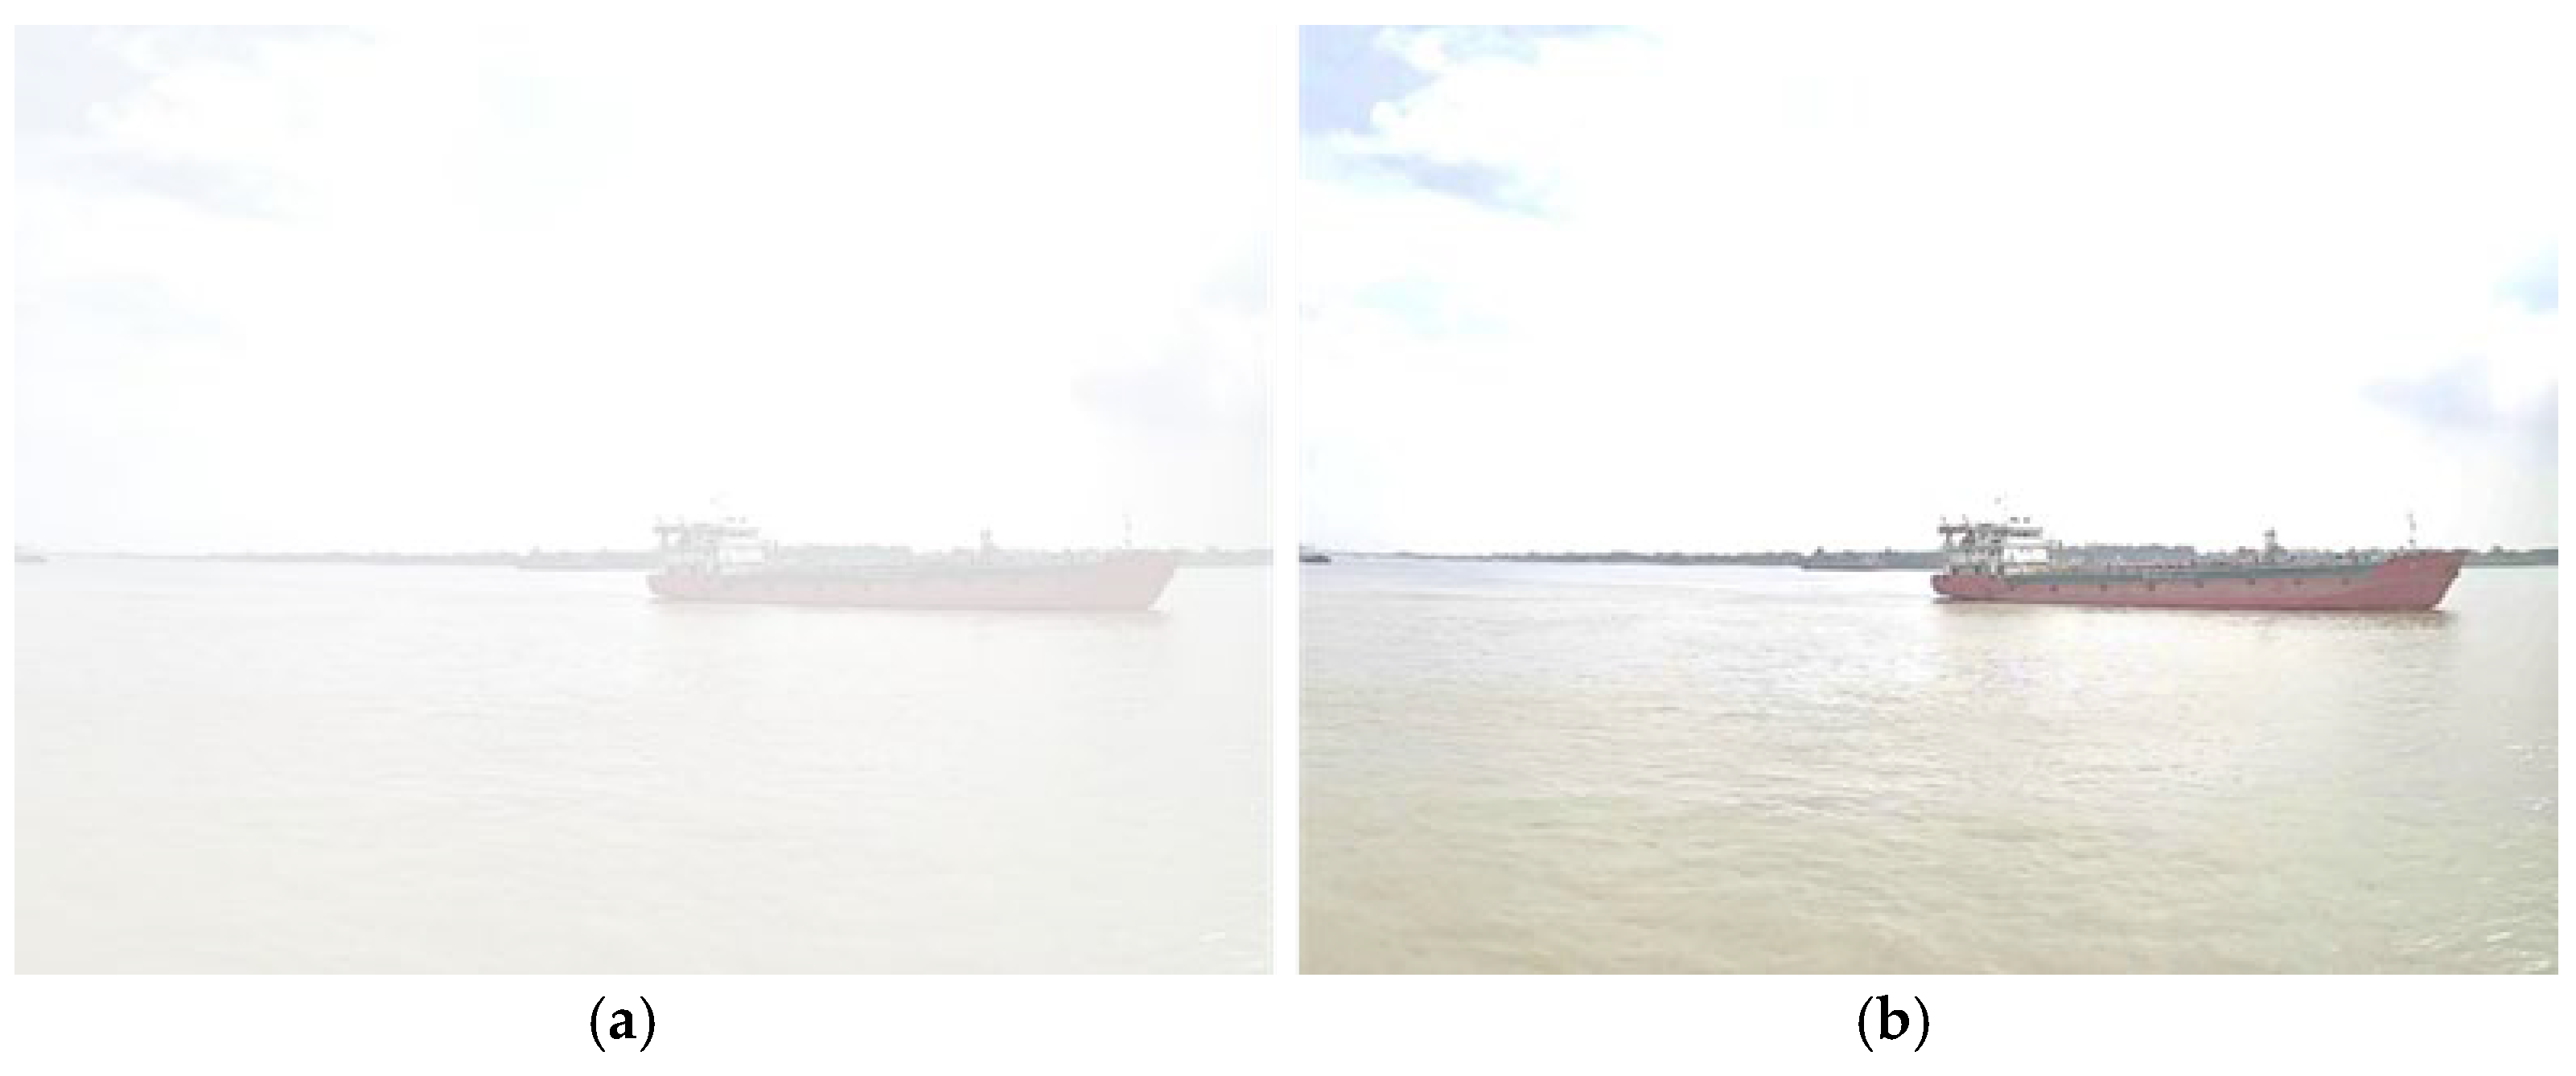
To demonstrate that our system can maintain good detection performance even under adverse weather conditions, we selected images from foggy and nighttime channel environments for ship target detection. The comparison of the processed images is shown in
Figure 7 and
Figure 8:
Figure 9 compares the performance of object detection in images before and after processing using our improved single-stage object detection algorithm:
Figure 10 shows the comparison results, after the vessel images in adverse conditions were processed, the contrast between the vessels and the background was significantly improved. This enhancement strengthens the relevant feature information, highlighting the key characteristics of the vessel targets. As a result, the accuracy of vessel recognition is greatly improved, laying a solid foundation for the subsequent feature extraction of maritime targets and enhancing vessel identification performance in challenging environments.
In this section, we conducted vessel data fusion experiments. First, due to the latency inherent to AIS, there is a certain level of error when matching AIS data with video in real time. To minimize this error, we employed trajectory prediction to synchronize the AIS data with the video data. The results are presented in
Figure 11.
During the data fusion stage, we first divide the camera’s field of view into six smaller regions. Based on this division, we also partition the video pixel matrix into six corresponding regions. The specific region division results are presented in
Figure 12.
After the region division, we determine the region set where the vessel is located based on its polar coordinates within the camera’s view and perform matching in the pixel coordinate system. When multiple vessels are present in a region set, as shown in
Figure 13, and three vessels are located within one region, we rank their features in ascending order of angular differences from the camera’s baseline angle,
. Specifically, the vessels are ranked as
, and matching is performed in the pixel coordinate system. The matching results are further verified by the distance to the camera.
The selected video data include multiple detected vessels and ships detected at long distances, representing a complex inland waterway environment. The fusion results are shown in
Figure 14 below:
The
Table 6 below presents various fusion evaluation metrics. The results demonstrate that the proposed method achieves stable fusion performance, with fusion accuracy ranging from 84.29% to 94.32%. It also performs well in the IDP, IDR, and IDF
1 metrics. These findings highlight that considering the trajectory displacement direction of both AIS and video-detected vessels significantly improves fusion performance. Additionally, our target matching method further enhances fusion effectiveness.
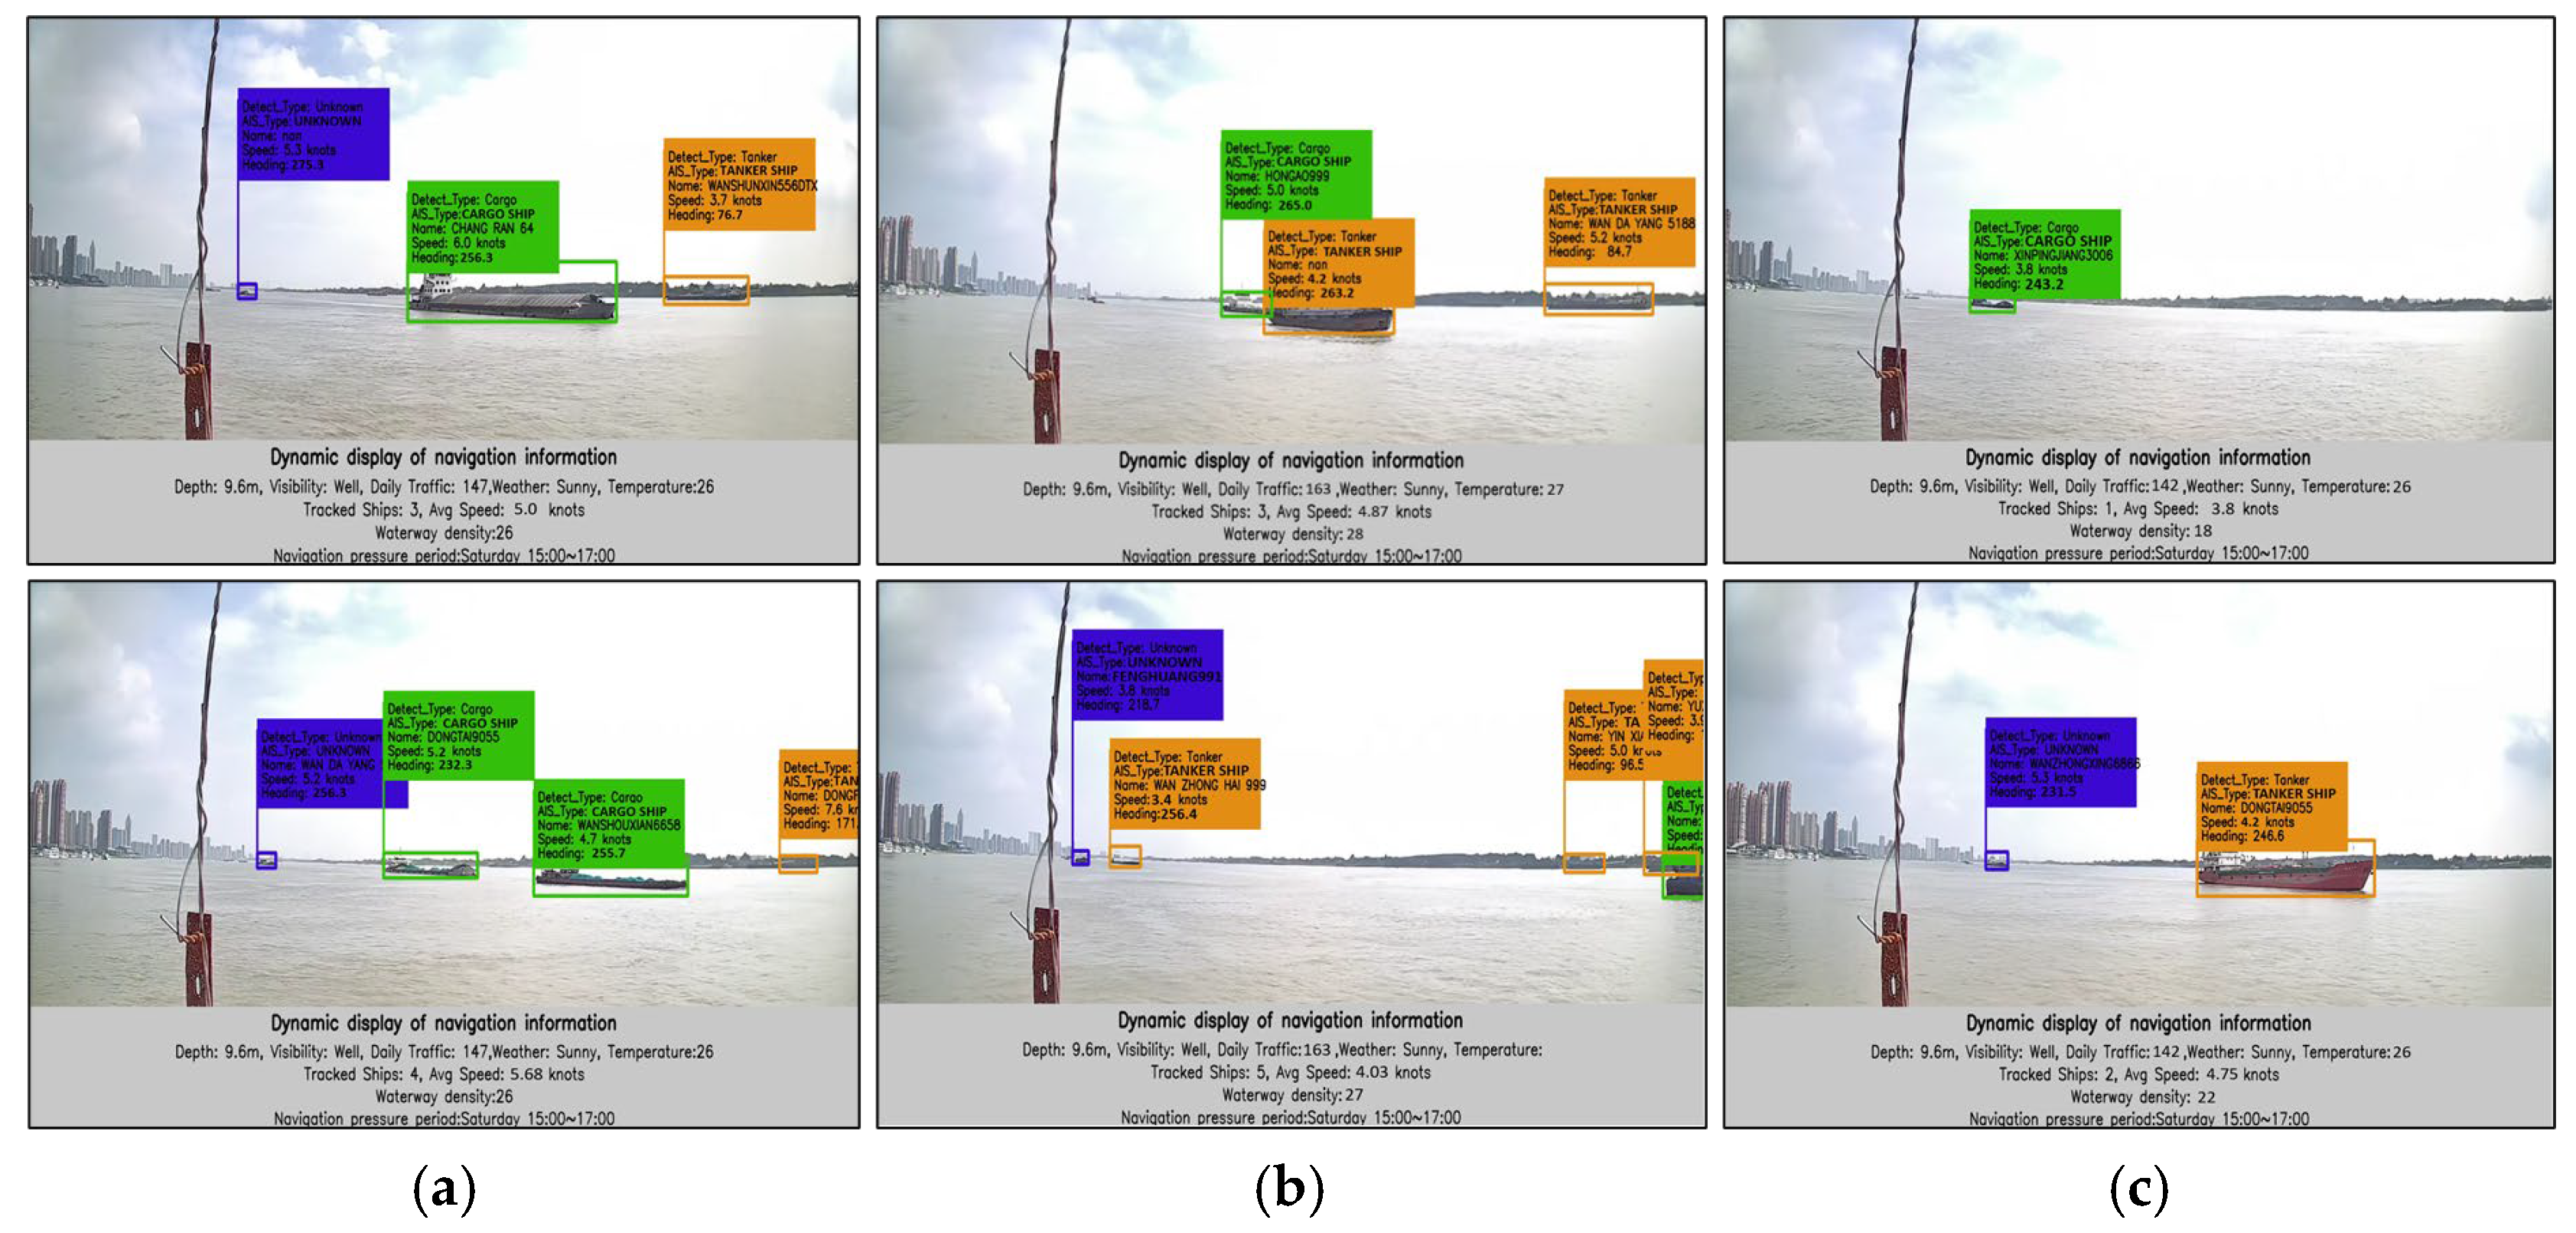
This section aims to enhance waterway traffic awareness for vessels through the design of an augmented reality (AR) framework for waterway traffic situation awareness.
Figure 15 presents a subset of results over three consecutive days. The framework enables the intuitive retrieval of AIS information for vessels detected in the video, including the vessel type, name, speed, and heading, allowing for a direct comparison between recognized vessel types and AIS data to verify the effectiveness of the augmented reality framework. Additionally, to offer a more intuitive understanding of waterway perception information, we integrated a dynamic navigation information display module. This module provides the number of vessels tracked in the current frame, their average speed, and facilitates better assessment of the current traffic conditions. It also includes a vessel flow counting function, calculating the number of vessels passing through the waterway in the past hour as part of a vessel density statistics module to capture traffic flow information. Furthermore, we predict the next period of navigation pressure based on historical periodic variations in waterway vessel traffic, helping relevant authorities prepare in advance and provide navigation services to vessels.
6. Discussion
6.1. Challenges in Multi-Source Data Fusion
This paper addresses various technical challenges in vessel detection, tracking, and multi-source data fusion within inland waterway navigation, proposing a deep learning-based method for waterway traffic situation awareness. To overcome issues such as difficulty in detecting small targets, severe occlusion, and AIS data latency in inland waterway environments, the paper enhances a one-stage object detection algorithm. The SPD-Conv module is employed to improve the detection of small target details, the squeeze excitation module is introduced to optimize feature extraction, and the Focal-EIoU loss function is adopted to enhance the algorithm’s adaptability in detecting overlapping targets and handling complex scenes. Additionally, based on vessel trajectory tracking algorithms, the paper combines appearance and motion features to address the continuity problem of target trajectories under occlusion. In terms of multi-source data fusion, the paper proposes a matching method that combines trajectory prediction and region set partitioning to address the temporal and spatial differences between AIS data and video data, achieving accurate fusion of video-detected vessels with AIS vessels in both time and space. These improvements significantly enhance detection accuracy, tracking stability, and data fusion effectiveness in complex inland waterway environments.
Compared to existing inland waterway services, this paper achieves a more comprehensive improvement in waterway traffic situation awareness. Traditional waterway service systems are typically based on a single data source (such as AIS or video data), which presents significant shortcomings in terms of real-time performance, accuracy, and environmental adaptability. This paper combines AIS data with video detection data to overcome the limitations of a single data source in target identification and dynamic information acquisition, significantly enhancing data fusion capabilities in complex environments. Compared to AIS-based data analysis alone, this paper can more accurately restore the vessel’s trajectory information and perceive its visual appearance; compared to video-based monitoring methods alone, this paper utilizes AIS data to improve the stability of target identity confirmation and trajectory tracking. Meanwhile, the application of the intelligent beacon system enhances data real-time performance and further improves the intelligence level of the system.
The primary contribution of this paper is the development of a refined inland waterway traffic situation awareness system. This system is based on an augmented reality (AR) framework that integrates multi-source data fusion with real-time information visualization, enabling a comprehensive representation of dynamic traffic conditions in inland waterways. The proposed framework dynamically displays key parameters such as vessel type, heading, speed, and traffic flow while providing real-time vessel density statistics and traffic flow predictions. These capabilities assist shipping managers in effectively monitoring waterway traffic conditions and formulating optimized navigation strategies. By deeply integrating multi-source data and combining visual detection with dynamic behavior prediction, the proposed approach enhances situational awareness and overcomes the limitations of traditional waterway service systems, which rely on single data sources and static perception. Furthermore, while the proposed method is specifically designed for the Yangtze River, it is theoretically adaptable to other waterway environments. In more complex maritime settings, it can be flexibly tailored to different operational needs, offering essential technical support for the advancement of efficient and intelligent inland waterway traffic management.
6.2. Future Work
This paper has achieved significant results in the field of inland waterway traffic situation awareness, but there is still room for further improvement.
Although the multi-source data fusion method employed in this study significantly enhances perception capabilities in a waterway, the limited data coverage restricts the system’s performance in varying traffic densities and waterway environments. Future work will incorporate a broader range of data sources, enabling the system to maintain robust fusion performance across different types of waterways and environmental conditions. Additionally, the inclusion of diverse data sources will mitigate the over-reliance on the quality and accuracy of a single data source.
To address the issue of target detection in cases of complete occlusion, future research could explore the deployment of distributed sensor networks, utilizing sensor data from multiple perspectives for cross-validation and supplementation. This approach would compensate for the limitations of single-perspective detection and further enhance the detection capability in scenarios of full occlusion.
Despite the strong performance and promising application prospects of the proposed intelligent beacon system, several challenges remain in real-world environments. Firstly, the initial deployment cost of the system is high, particularly when integrating various sensors, image processing units, and high-performance computing platforms. The substantial initial cost and complexity associated with building and maintaining the infrastructure may hinder widespread adoption, especially in underdeveloped regions. Furthermore, as the number of sensors, cameras, and other devices in the system increases, the volume of data also rises sharply. In high-density traffic environments or complex waterway conditions, the system’s processing capacity and storage may struggle to respond to the data flow quickly, potentially leading to overload or delays that affect the system’s real-time monitoring and accuracy.
Future ship–shore coordination will rely on large model technologies to create a highly intelligent navigation service and traffic management network. By deploying large-scale systems on navigational aids such as beacons, real-time vessel navigation data can be processed, and by analyzing the surrounding environment, navigation recommendations and hazard warnings can be generated. Meanwhile, the shore-based traffic management system can obtain real-time information from beacons, dynamically adjust the waterway traffic flow, and optimize vessel scheduling. This intelligent collaborative model will closely integrate vessels with shore management systems, enhancing navigation safety, optimizing shipping efficiency, and driving the digital transformation of waterway management while providing more accurate, flexible, and secure support for future smart shipping.
7. Conclusions
This paper proposes a waterway traffic situation awareness method based on heterogeneous data fusion, addressing the current insufficiency of inland waterway traffic information services and ship navigation safety issues. Firstly, to solve the problem of detecting small target ships, we improved the one-stage object detection algorithm by introducing the SPD-Conv module to enhance the feature learning capability for low-resolution small targets. Additionally, the Detect_SE module was introduced to optimize the feature extraction and channel feature integration capability. Furthermore, the Focal-EIoU loss function was adopted to improve detection accuracy in complex environments with overlapping targets. The experimental results show that our method achieves a mAP@0.5 of 98.1%, significantly outperforming traditional algorithms, and demonstrates good robustness in complex backgrounds and low-resolution scenarios. Our method also improves ship detection identity consistency performance, with the multi-object consistent accuracy (MOCA) reaching 92.61% in test video data, an improvement of 2.21% compared to existing algorithms. Additionally, in scenarios with target overlap and occlusion, the IDF1 score reaches 92.05%, effectively reducing target loss and mismatching issues. To address the temporal and spatial differences between AIS data and video data, we propose a matching method combining trajectory prediction and region set partitioning, which accurately aligns ship pixel coordinates with the geographic locations of AIS data. By employing trajectory prediction, we achieved time synchronization between AIS data and video detection data. The region partition matching significantly improved the accuracy and consistency of multi-source data fusion. The experimental results demonstrate that the fusion accuracy of our method can achieve an average of 94.32% across different test scenarios.
By combining dynamically updated waterway status data from the intelligent navigation marker system with augmented reality technology, the real-time visualization of waterway traffic has been achieved. This visualization includes key information such as vessel type, speed, heading, and traffic flow, enhancing the ability of managers to perceive a waterway situation and improving decision-making efficiency. The innovative application of multi-source data fusion within the intelligent navigation marker system provides accurate local traffic perception data for waterway managers, thereby enhancing service quality for inland waterway vessels. Additionally, it establishes a foundation for future innovations in ship-to-shore interaction models within the context of inland smart shipping.


