Article

Data-Driven Machine-Learning-Based Seismic Response Prediction and Damage Classification for an Unreinforced Masonry Building

by
Nagavinothini Ravichandran
1,*,
Butsawan Bidorn
1,2,*,
Oya Mercan
3 and
Balamurugan Paneerselvam
1
1
Center of Excellence in Interdisciplinary Research for Sustainable Development, Faculty of Engineering, Chulalongkorn University, Bangkok 10330, Thailand
2
Department of Water Resources Engineering, Chulalongkorn University, Bangkok 10330, Thailand
3
Department of Civil Engineering, University of Toronto, Toronto, ON M5S 1A4, Canada
*
Authors to whom correspondence should be addressed.
Appl. Sci. 2025, 15(4), 1686; https://doi.org/10.3390/app15041686
Submission received: 14 January 2025 / Revised: 29 January 2025 / Accepted: 4 February 2025 / Published: 7 February 2025
(This article belongs to the Special Issue Structural Seismic Design and Evaluation)

Abstract

:
Unreinforced masonry buildings are highly vulnerable to earthquake damage due to their limited ability to withstand lateral loads, compared to other structures. Therefore, a detailed assessment of the seismic response and resultant damage associated with such buildings becomes necessary. The present study employs machine learning models to effectively predict the seismic response and classify the damage level for a benchmark unreinforced masonry building. In this regard, eight regression-based models, namely, Linear Regression (LR), Stepwise Linear Regression (SLR), Ridge Regression (RR), Support Vector Machine (SVM), Gaussian Process Regression (GPR), Decision Tree (DT), Random Forest (RF), and Neural Networks (NN), were used to predict the building’s responses. Additionally, eight classification-based models, namely, Naïve Bayes (NB), Discriminant Analysis (DA), K-Nearest Neighbours (KNN), Adaptive Boosting (AB), DT, RF, SVM, and NN, were explored for the purpose of categorizing the damage states of the building. The material properties of the masonry and the earthquake intensity were considered as the input parameters. The results from the regression models indicate that the GPR model efficiently predicts the seismic response with larger coefficients of determination and smaller root mean square error values than other models. Among the classification-based models, the RF, AB, and NN models effectively classify the damage states with accuracy levels of 92.9%, 91.1%, and 92.6%, respectively. In conclusion, the overall performance of the non-parametric models, such as GPR, NN, and RF, was found to be better than that of the parametric models.

1. Introduction

Unreinforced masonry (URM) buildings constitute a significant portion of residential and heritage structures worldwide. Notably, such buildings represent a considerable number of the occupied buildings in developing nations such as India, Nepal, Pakistan, and Thailand [1,2]. These structures undergo extensive damage or complete collapse during seismic events due to their poor lateral load-bearing capacity. Hence, seismic response prediction and damage classification in URM buildings is critical due to the existence of non-engineered URM buildings in several earthquake-prone regions of the world [3]. Furthermore, modern computational methods involving machine learning algorithms will suitably aid in the effective seismic risk assessment of URM buildings.
The investigation of the seismic response of URM buildings holds significant importance for enhancing the structural safety of the buildings. It is also essential to formulate effective strategies to safeguard these vulnerable structures during seismic events. Modern computational tools, specifically machine learning algorithms, present a promising alternative to time-consuming numerical and analytical simulations, addressing the critical need for seismic risk assessment in URM buildings more effectively. The significance of the research lies in its innovative approach to the identification of damage in URM buildings, paving the way for the development of machine learning models for seismic damage assessment in such structures.
The application of machine learning in structural engineering has increased considerably in recent years. Machine learning (ML) algorithms utilize statistics to make inferences from the data to train developed models by using past experiences and behaviour patterns [4]. Hence, developing the data usually presented as predictors and response variables is crucial for implementing ML models for a particular application [5]. A comprehensive dataset will enable the ML algorithms to predict or to classify possible future samples. Since the numerical and analytical simulations of complex structural systems are time-consuming, ML could be a suitable alternative for various applications in structural engineering and earthquake engineering [6,7].
Several studies have been conducted on the structural response prediction and damage classification associated with a wide range of structures, using ML-based models [8,9,10,11,12]. Various ML models were developed to assess the seismic response, failure mode classification, and strength estimation of reinforced concrete structures at the structural element and building levels (including the reinforced concrete shear walls, frames with infills, and beam–column joints) [9,10,11,12]. In addition, ML applications in the optimization and fragility analysis of masonry-infilled reinforced concrete and steel moment frames have also been reported recently [13,14,15]. Studies also reported the application of ML algorithms in post-earthquake structural safety assessment, risk assessment, and fatigue analysis [16,17,18]. The literature clearly indicates the effectiveness of the machine learning approach in its application to complex structural-engineering problems.
In the case of masonry structures, recent notable research on damage assessment using ML approaches can be found in the literature. Chomacki et al. [19] implemented ML algorithms to assess the damage intensity of existing masonry buildings subjected to the adverse impacts of the industrial environment of mines, and better performance was obtained from the Bayesian belief network. Loverdos and Sarhosis [20] utilized deep learning networks to improve crack detection in masonry walls and automation in brick segmentation, and the results indicated a better outcome from the ML models, compared to the typical image-processing techniques. Mishra et al. [21] analyzed the applicability of three ML algorithms for predicting the compressive strength of masonry constructions, establishing a database using 44 masonry specimens. The results revealed that the ML models can successfully predict the compressive strength of historical constructions.
Regarding the damage assessment of masonry, Rezaie et al. [22] implemented simple ML algorithms for the damage assessment of rubble stone masonry piers and reported the better performance of the K-Nearest Neighbour model. Siam et al. [23] developed an ML-based framework for the performance prediction and damage classification of structural components. They demonstrated the use of the developed framework to classify the reinforced masonry shear walls and to evaluate several key parameters that affect the ultimate drift of walls. Recently, Loverdos and Sarhosis [24] developed a workflow for crack detection in masonry structures and developed a geometric digital twin of the masonry structures using ML. Harichian et al. [25] utilized four machine learning techniques to develop fragility curves that assessed the probability of collapse associated with masonry walls in Malawi. They reported that the Random Forest (RF) technique exhibited efficient performance, with appropriate levels of accuracy. Zain et al. [26] conducted a seismic vulnerability assessment of school buildings in high-intensity seismic zones, employing machine learning methodologies including RF, NN, XGBoost, and the Extremely Randomized Tree Regressor (ERTR). This investigation, which focused on reinforced concrete (RC) and URM school buildings, demonstrated the superior performance of the RF and XGBoost algorithms. Additionally, Coskun and Aldemir [27] devised a straightforward visual screening method aimed at predicting damage to masonry structures using various machine learning algorithms, including Logistic Regression, DT, RF, KNN, SVM, and an Ensemble Learning Method (ELM).
Many existing studies have focused on damage assessment through crack detection and capacity estimation in masonry walls rather than entire buildings [28,29]. Further, studies focusing on seismic response prediction in masonry buildings were found to be scarce in the literature, and the existing studies never attempted the application of a wide range of ML algorithms. More specifically, a study involving both ML-based seismic response and damage prediction for a non-engineered URM building has not been attempted so far. This can be attributed to the need for experimental results and time-consuming numerical analysis procedures required to develop the database. Also, shaking-table tests involving real-scale prototype buildings, particularly URM buildings, would demand large facilities, making the experimental data not readily available for different masonry structures. Hence, the research gap pertains to the ML-based seismic response prediction associated with non-engineered URM buildings and the need for a comprehensive database in order to develop ML models for complete seismic risk assessments of URM buildings.
In this context, the present paper aims to examine the effectiveness of various ML techniques used to predict the seismic response and to classify the damage state of a non-engineered URM building, based on the methodology shown in Figure 1. A finite-element (FE) model of a benchmark building based on the nonlinear layered shell elements approach was used to carry out a nonlinear time history analysis in SAP2000 v.22. With the FE model, a database of 1080 numerical results of the analysis of the benchmark URM building was developed, for which the damage levels were identified using the definitions from the literature. The material properties of the URM building and the intensity of ground motion were used as the input variables. ML models for regression and classification were then implemented to identify the structural response and damage state of the URM building. The performance assessments of the prediction and classification models were then presented using standard performance metrics. Finally, an analysis of the relative importance of the predictor variables was also presented. The results indicated the effectiveness of the ML models in predicting the seismic response and classifying the damage state of URM buildings. The findings from the study also demonstrated the capability of ML models for future relevant studies in the field of structural engineering.
The novelty of the present study lies in creating a comprehensive database and implementing various ML models to analyse the seismic response of URM buildings for the first time. The database developed specifically for this study focuses on the seismic analyses of entire buildings, as opposed to individual masonry structural components, an approach which has not, to this point, been documented in the existing literature. Further, a complete investigation of the performance of ML models in the seismic response prediction and damage state classification of URM buildings is still being explored. All of these features represent the main highlights of the present study, which is focused mainly on developing a wide range of ML models for the seismic damage assessment of URM buildings.
The paper is organized as follows: Section 2 describes the methodology of the study. The development of the database through the selection of building archetype, followed by FE modelling, is discussed in Section 3. Then, the optimized parameters of the ML algorithms used for regression and classification are detailed in Section 4. Finally, Section 5 presents the results of the developed ML framework and the evaluation of the performance of the various algorithms in predicting the structural response and identifying the damage level associated with the URM building.

2. Methodology of the Study

The study aims to identify a suitable predictive model which could be used to assess the seismic response of the URM building archetype, representing non-engineered masonry buildings generally, followed by the identification of building damage using ML techniques. First, regression-based ML techniques were used to develop demand models incorporating the input variables (ground-motion intensity measure and material properties) and an output variable (seismic response of the building). The maximum inter-story drift ratio (IDR), which is the ratio of the relative displacement (measured at the roof of the building) to the height of the building, was utilized as the building response. Next, the classification-based ML techniques were explored to classify the masonry building damage, using the material properties, ground-motion intensity, and seismic response as input parameters. The study involved three major steps: (i) database creation, (ii) data partition and pre-processing, and (iii) model training and performance evaluation.

2.1. Database Creation

To create the database, a benchmark URM building was selected; this was followed by the development of a numeric model of the building using a simplified finite-element modelling approach, using layered shell elements to model the masonry. This methodology was chosen to minimize the computational time required for database development. Compared to other detailed finite-element modelling techniques that employ solid elements, this shell-based three-dimensional modelling approach demonstrates enhanced computational efficiency while maintaining an acceptable level of accuracy. Then, the material properties of unreinforced brick masonry reported in the literature were collected. To consider the uncertainties associated with material properties, ‘N’ random samples were assembled using the Latin Hypercube Sampling (LHS) technique. This methodology was employed to minimize the number of simulations, while encompassing a broader spectrum of material properties. The random samples were created by partitioning each material property into an equal number of sub-intervals according to their probability distribution and selecting a sample from each interval. To incorporate the uncertainties associated with seismic events, ‘N’ compatible ground-motion records were identified and randomly paired with the material property samples.
For every random sample, static push-over analyses were carried out to record the lateral load-carrying capacity of the URM building. Incremental dynamic analyses were then carried out to identify the seismic response of the URM building for every input sample. The maximum IDR values were then identified through numerical analyses. Finally, the database for the regression-based ML models was developed, with the predictor variables being material properties and ground-motion intensity and the response variable being IDR. The definitions of damage levels associated with URM buildings, obtained from the literature, were then used to classify the building damage based on the values obtained for the engineering demand parameter (IDR). Using the damage class identification, the database for the classification-based ML models was developed with the predictor variables (material properties, ground-motion intensity, and IDR) and categorical response variables (damage states).

2.2. Data Partition and Pre-Processing

The data partition is necessary to avoid overfitting the model, a situation in which the model performs well with the training data but may not be accurate with the new data. Hence, the data were divided among a training set (70%) and a test set (30%) to check the performance of the ML models. In data pre-processing, the data were transformed and scaled to improve the performance of the ML models. The data transformation can be performed based on the identified distribution of the input features, and it can be implemented to improve the model performance. Furthermore, feature scaling helps to avoid the dominance of high-range features over lower-range features. Particularly, feature scaling will improve classification techniques which are based on the similarities and distances between data, such as K-Nearest Neighbours, Support Vector Machine, and Neural Networks [6].

2.3. Model Training and Performance Evaluation

In the model training stage, the ML models were trained with the database by tuning the model parameters to minimize the specific cost function. Regression-based models such as LR, SLR, RR, DT, RF, SVM, GPR, and NN were implemented to identify the seismic response of the URM building. The performance of the models was evaluated through the coefficient of determination ( R 2 ) and root mean square error (RMSE), and an optimum demand model was identified. Classification-based ML models such as NB, DA, KNN, DR, RF, AB, SVM, and NN were trained to classify the building damage states. The performance of the classification models was evaluated through metrics such as accuracy, precision, recall, and F1 score, along with the confusion matrix.

3. Database Development

A well-developed database is mandatory for the successful development of prediction and classification models. The selected building archetype, the uncertainty modelling considering the random material properties and ground-motion records, the numerical modelling of the URM building, and the nonlinear dynamic analyses carried out to procure data are explained in this section.

3.1. Finite-Element Modelling of the Benchmark URM Building

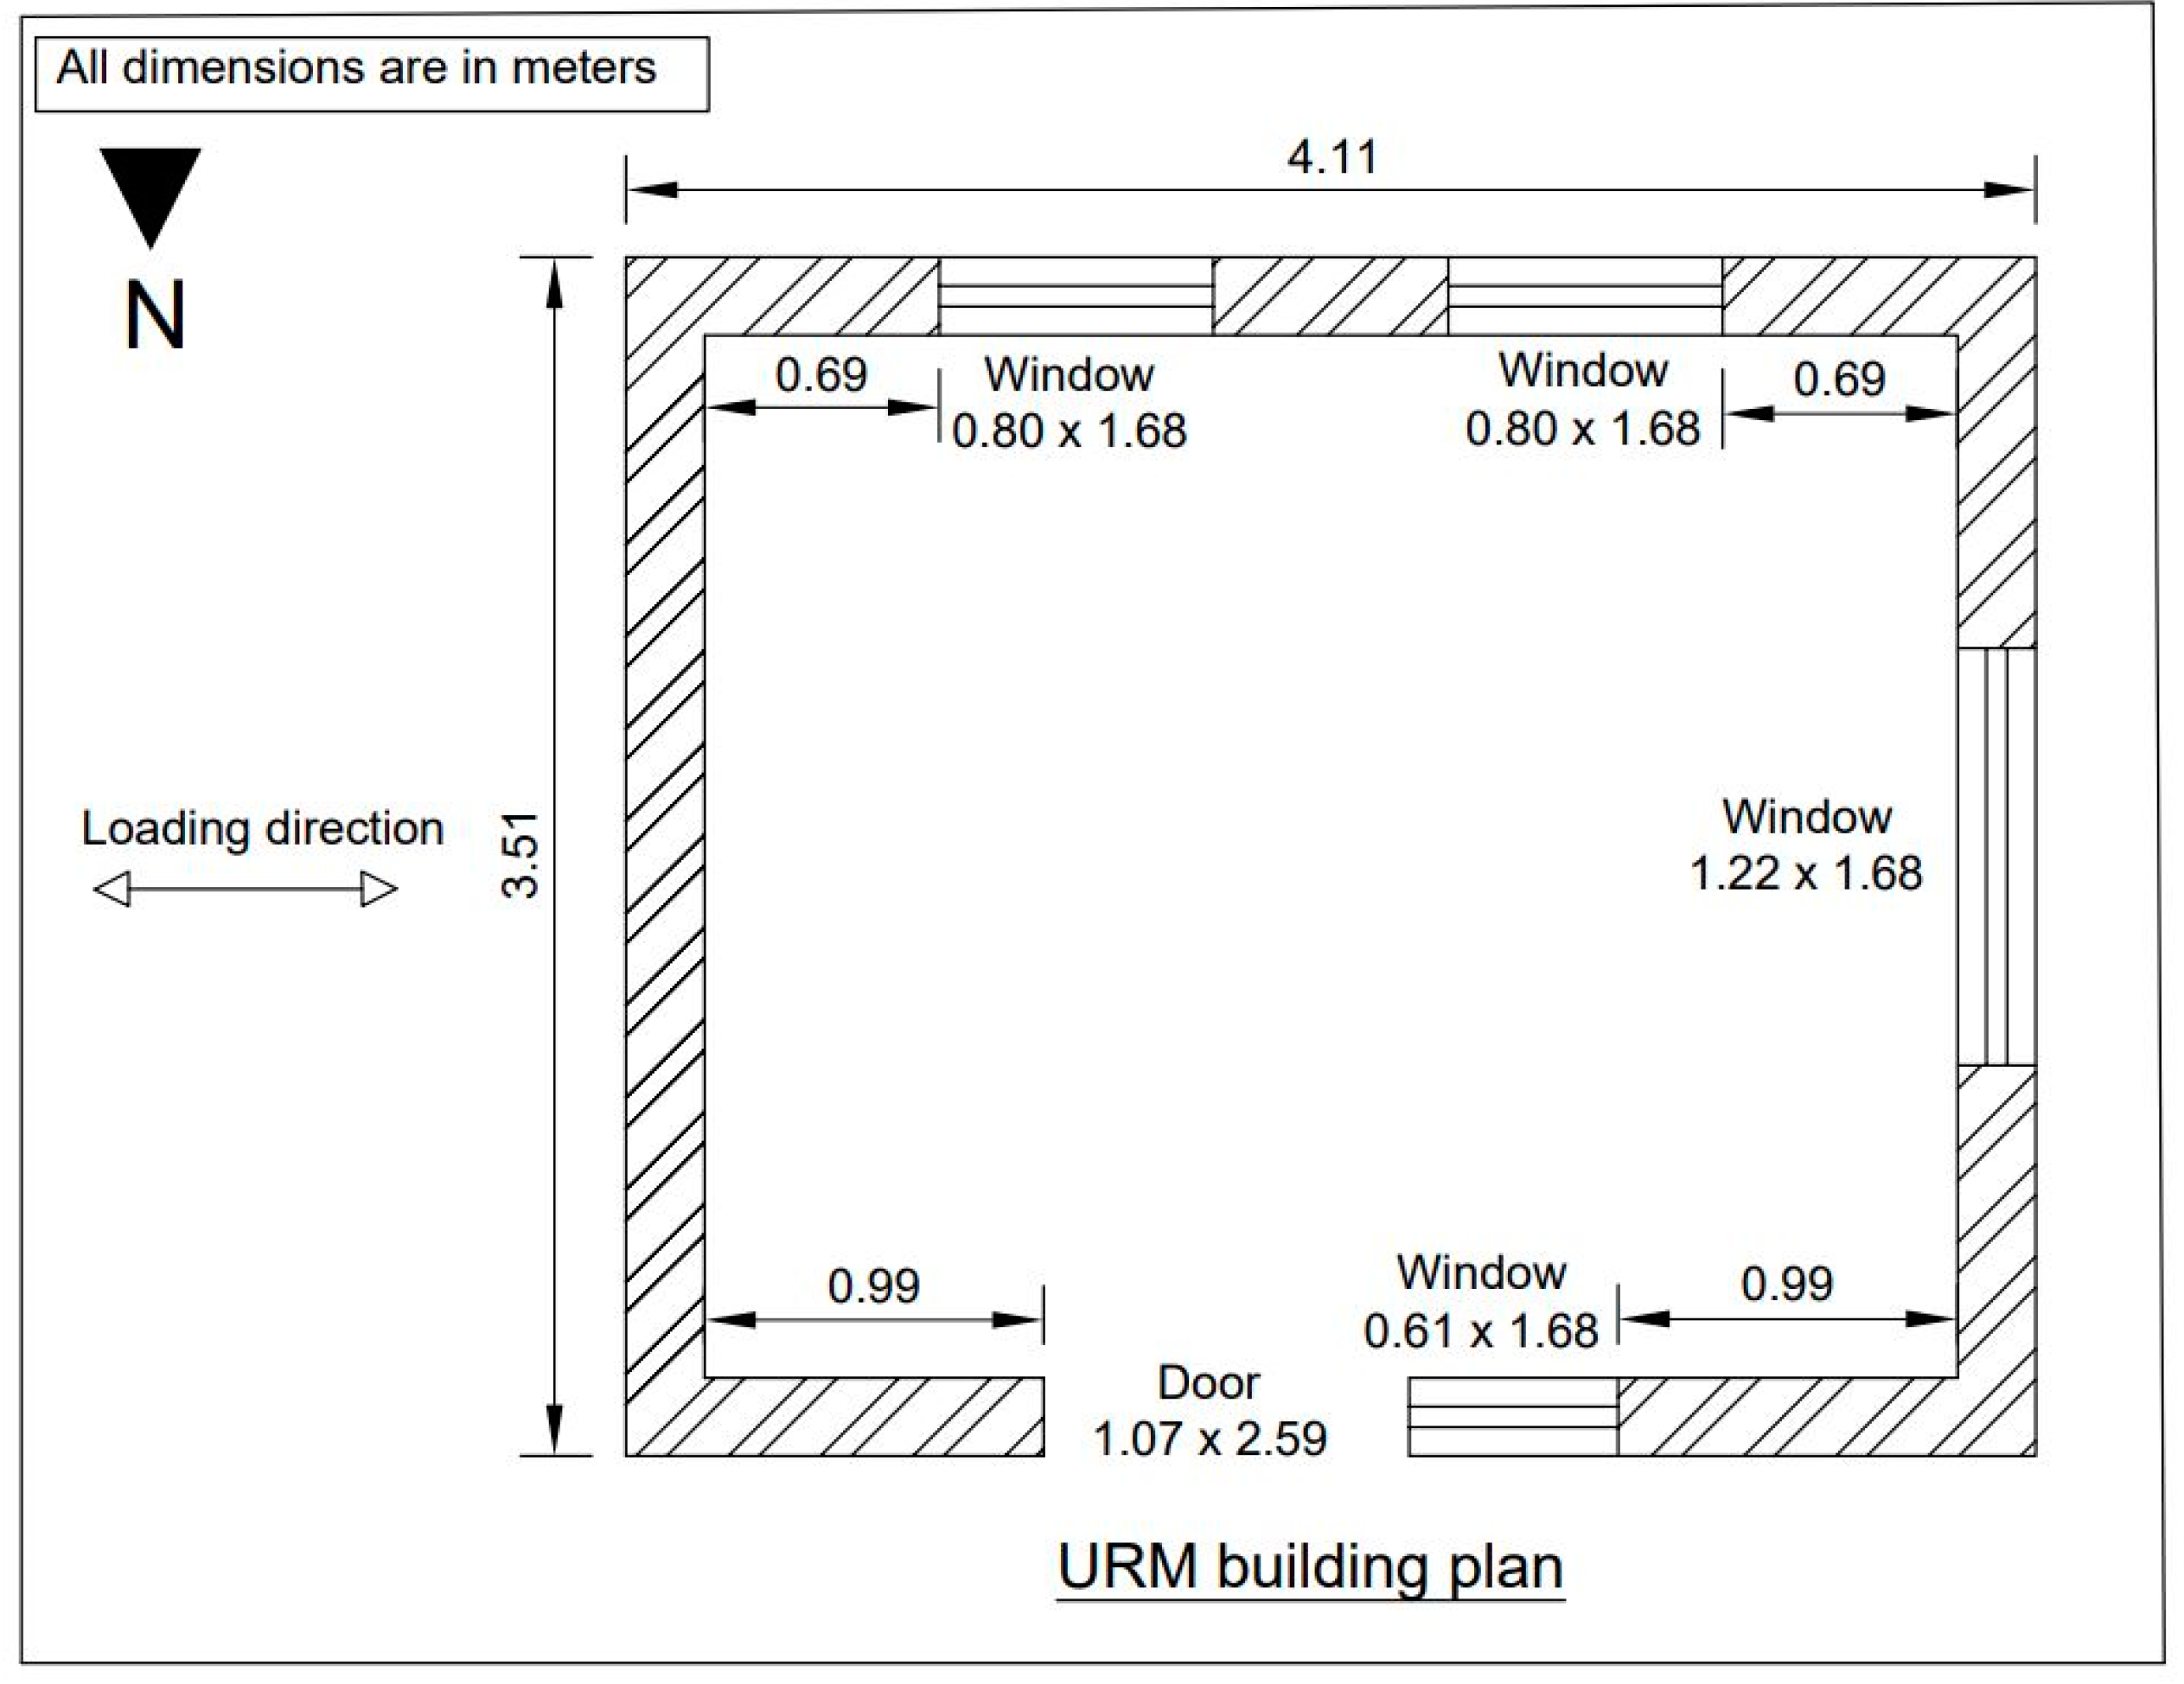
3.1.1. Benchmark Building

Numerous URM buildings exist in various regions worldwide, encompassing residential dwellings, government facilities, educational institutions, and historic monumental structures. These structures, situated in seismically active areas, were built using traditional methodologies devoid of engineering oversight. Additionally, the literature indicates that many older URM buildings remain inhabited, owing to their cultural significance and traditional ties [3]. Notably, contemporary URM constructions built in the last decade often showcase the fusion of masonry walls and reinforced concrete slabs, as depicted in Figure 2.
A single-storey, single-bay masonry building was considered the benchmark building archetype for database development [30]. This box-type URM building geometry is commonly found in the rural areas of several countries worldwide. The plan and elevation of the benchmark URM building are shown in Figure 3. This particular building is considered the benchmark for the present study due to the availability of experimental and numerical investigations in the literature [30,31]. The plan area of the building is 14.42 m2 with 0.23 m thick walls, and 0.15 m thick reinforced concrete lintel beams and roof slab. The building has a 0.914 m height parapet wall, and a 0.25 m thick sand layer was placed on the roof slab. The building is made up of brick units with cement mortar. The wall density values of the building along the X and Y directions are 13.1% and 9.7%, respectively. The walls were assumed to be sufficiently anchored to the diaphragm.

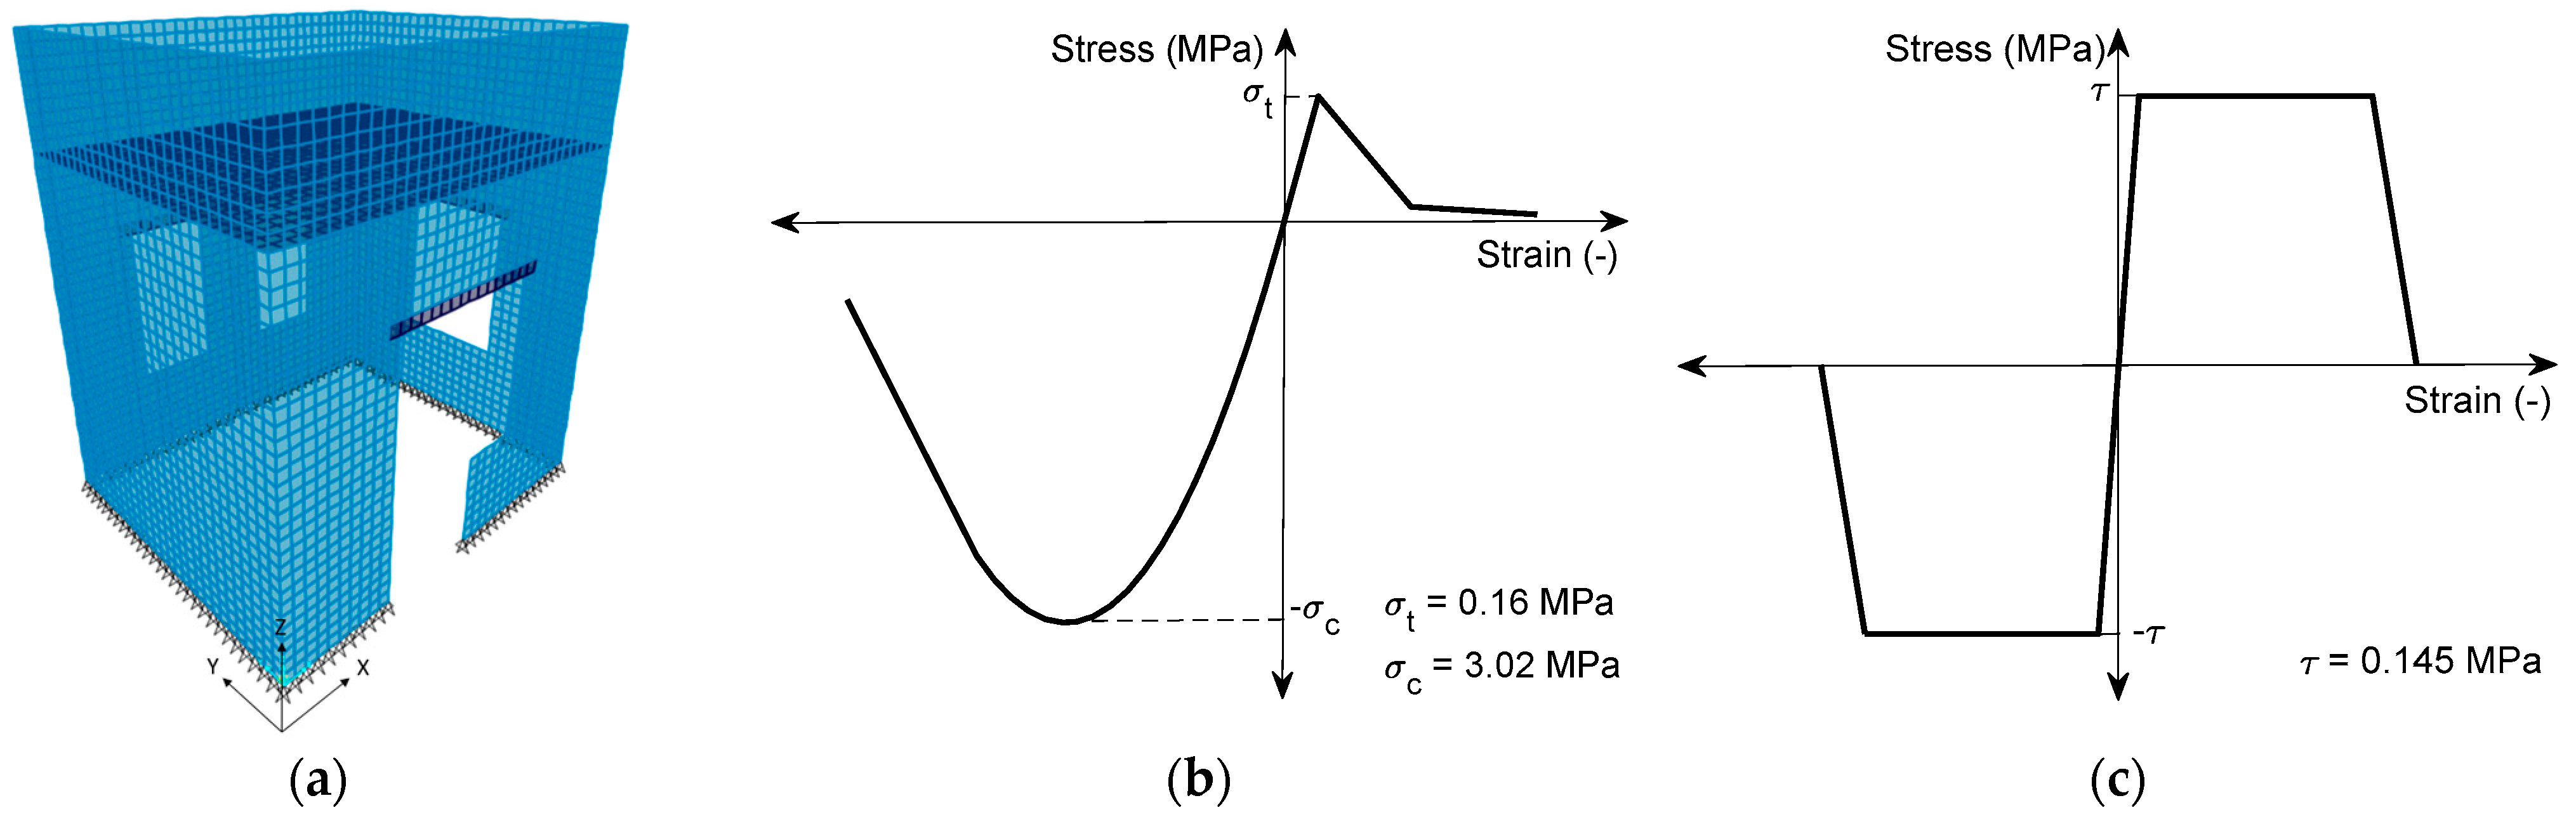
3.1.2. Development of the Simplified Numerical Model

A simplified 3D model of the benchmark URM building developed in SAP2000 v.22 with nonlinear layered shell elements was used in the present study to obtain the seismic response of the building. This is a macro-modelling technique, in which the masonry is modelled as a homogeneous material with equivalent mechanical properties. This technique is suitable for studying the overall behaviour of the masonry with reduced computational time. In this layered-element approach, various layers in the thickness direction with different associated constitutive laws can be used [32].
In the present study, masonry was considered as a nonlinear isotropic material and the material angle in each layer was taken as zero. The orthotropic behaviour of the masonry was not considered due to the lack of availability of experimental data for suitable calibration of the required parameters. Two stress–strain curves, corresponding to normal stress (compression and tension) and shear stress, were used in the model to represent the nonlinear behaviour of the masonry, using two layers of quadrilateral shell elements in the model [33]. The bottom nodes of the URM building were constrained in all three degrees of freedom. The RC lintels and roof were modelled using linear elastic elements, and the total weight of the 0.25 m thick sand layer was applied on the roof of the building as distributed mass. A rigid diaphragm constraint was applied at the roof level to constrain the nodes. The optimal mesh size (equal to 0.114 m) for the model was identified through detailed sensitivity analysis, for which 5184 shell elements were ultimately used. The FE model of the URM building is shown in Figure 4a. Readers can refer to [2,31,34] for additional insights as to the advantages and reproducibility of this simplified numerical model.
The basic motivation behind the use of this simplified numerical modelling approach is to reduce the computational time. Since a considerable amount of data is required to develop ML models, this numerical model can aid in the procurement of data satisfactorily. Further, the application of this simplified numerical modelling approach for the seismic response and fragility analyses of base-isolated URM buildings in the Himalayan regions highlights the suitability of the model for the real-world applications [2,33]. Additionally, it is also important to note that experimental data on non-engineered masonry buildings are scarce in the literature, and insufficient for the development of ML models. Hence, this attempt by the authors to develop the seismic damage prediction models along with data development is unique.
In this simplified modelling approach, the model parameters were defined through the direct implementation of stress–strain points. Hence, existing models in the literature were used to develop the stress–strain curves, using the available masonry strength parameters from the experiments. The constitutive models used in the study are shown in Figure 4b,c, with the material properties obtained from Shahzada et al. [30]. The analytical model developed by Kaushik et al. [35] was used to define the uniaxial compressive behaviour of the masonry. The uniaxial tensile behaviour of the masonry was defined by the relationship proposed by Akhaveissy and Milani [36]. The trilinear stress–strain curve was used to reduce the convergence issues that arise during the early stages of the analysis. The FE model was calibrated through a series of push-over analyses by applying incremental horizontal displacement at the control node in the roof level of the building. According to the experimental study, the masonry building reached its peak lateral resistance of 99.5 kN at a lateral displacement equal to 7.89 mm (corresponding to an inter-storey drift of 0.23%). The maximum load-carrying capacity of the URM building model developed in SAP2000 was 98.7 kN at 6.9 mm lateral displacement, which differs from the experimental value by less than 1%.

3.1.3. Model Validation

Modal analysis and nonlinear time history analysis were performed to validate the developed simplified FE model. The comparisons of the fundamental frequencies of the first three vibration modes of the simplified model with the detailed 3D model in the literature is listed in Table 1. The directions obtained for the first three modes were along the X direction, along the Y direction, and in the XY plane (Torsion); these were found to be similar to the results reported in the literature.
In addition, the developed model was subjected to the Bhuj earthquake record (with moment magnitude = 7.9). The maximum inter-storey drift of the URM building obtained from the simplified model was 0.0135% at 47.2 s, whereas the IDR from the detailed ANSYS model reported in the literature was 0.017 [31]. The results indicated the effectiveness of the developed numerical model with reduced computational time, an approach which is suitable for the development of the data required for training ML models.

3.2. Ground-Motion Selection

Ground-motion records tend to produce higher uncertainty than the levels associated with capacity and numerical modelling in seismic response analysis. Hence, the uncertainties associated with the seismic demand must be considered by accounting for various ground-motion records to represent the exact seismicity of the considered region [34]. Therefore, ground-motion records associated with previous earthquakes in various parts of the world (Armenia, Chile, Costa Rica, India, Iran, Mexico, Nepal, Peru, and Turkey) were collected, and 54 records were used for the nonlinear response analysis. The ground-motion time histories of the earthquake records were obtained from the Strong Motion Virtual Data Centre, developed at the University of California, Santa Barbara [37]. The variations associated with the moment magnitude and epicentral distance in the selected records are shown in Figure 5. The moment magnitude of the ground-motion records varies from 5.2 to 7.9. The epicentral distance varies from 2.2 to 250 km, considering both near- and far-field earthquakes. This indicates the consideration of a wide range of earthquakes of varying intensity and frequency intervals. Further, the site soil condition of the selected ground-motion records varies from soft soil to rock. The analysis was carried out by scaling the Peak Ground Acceleration (PGA) of the ground-motion records from 0.01 g to 2.0 g at an increment of 0.01 g.

3.3. Material Properties
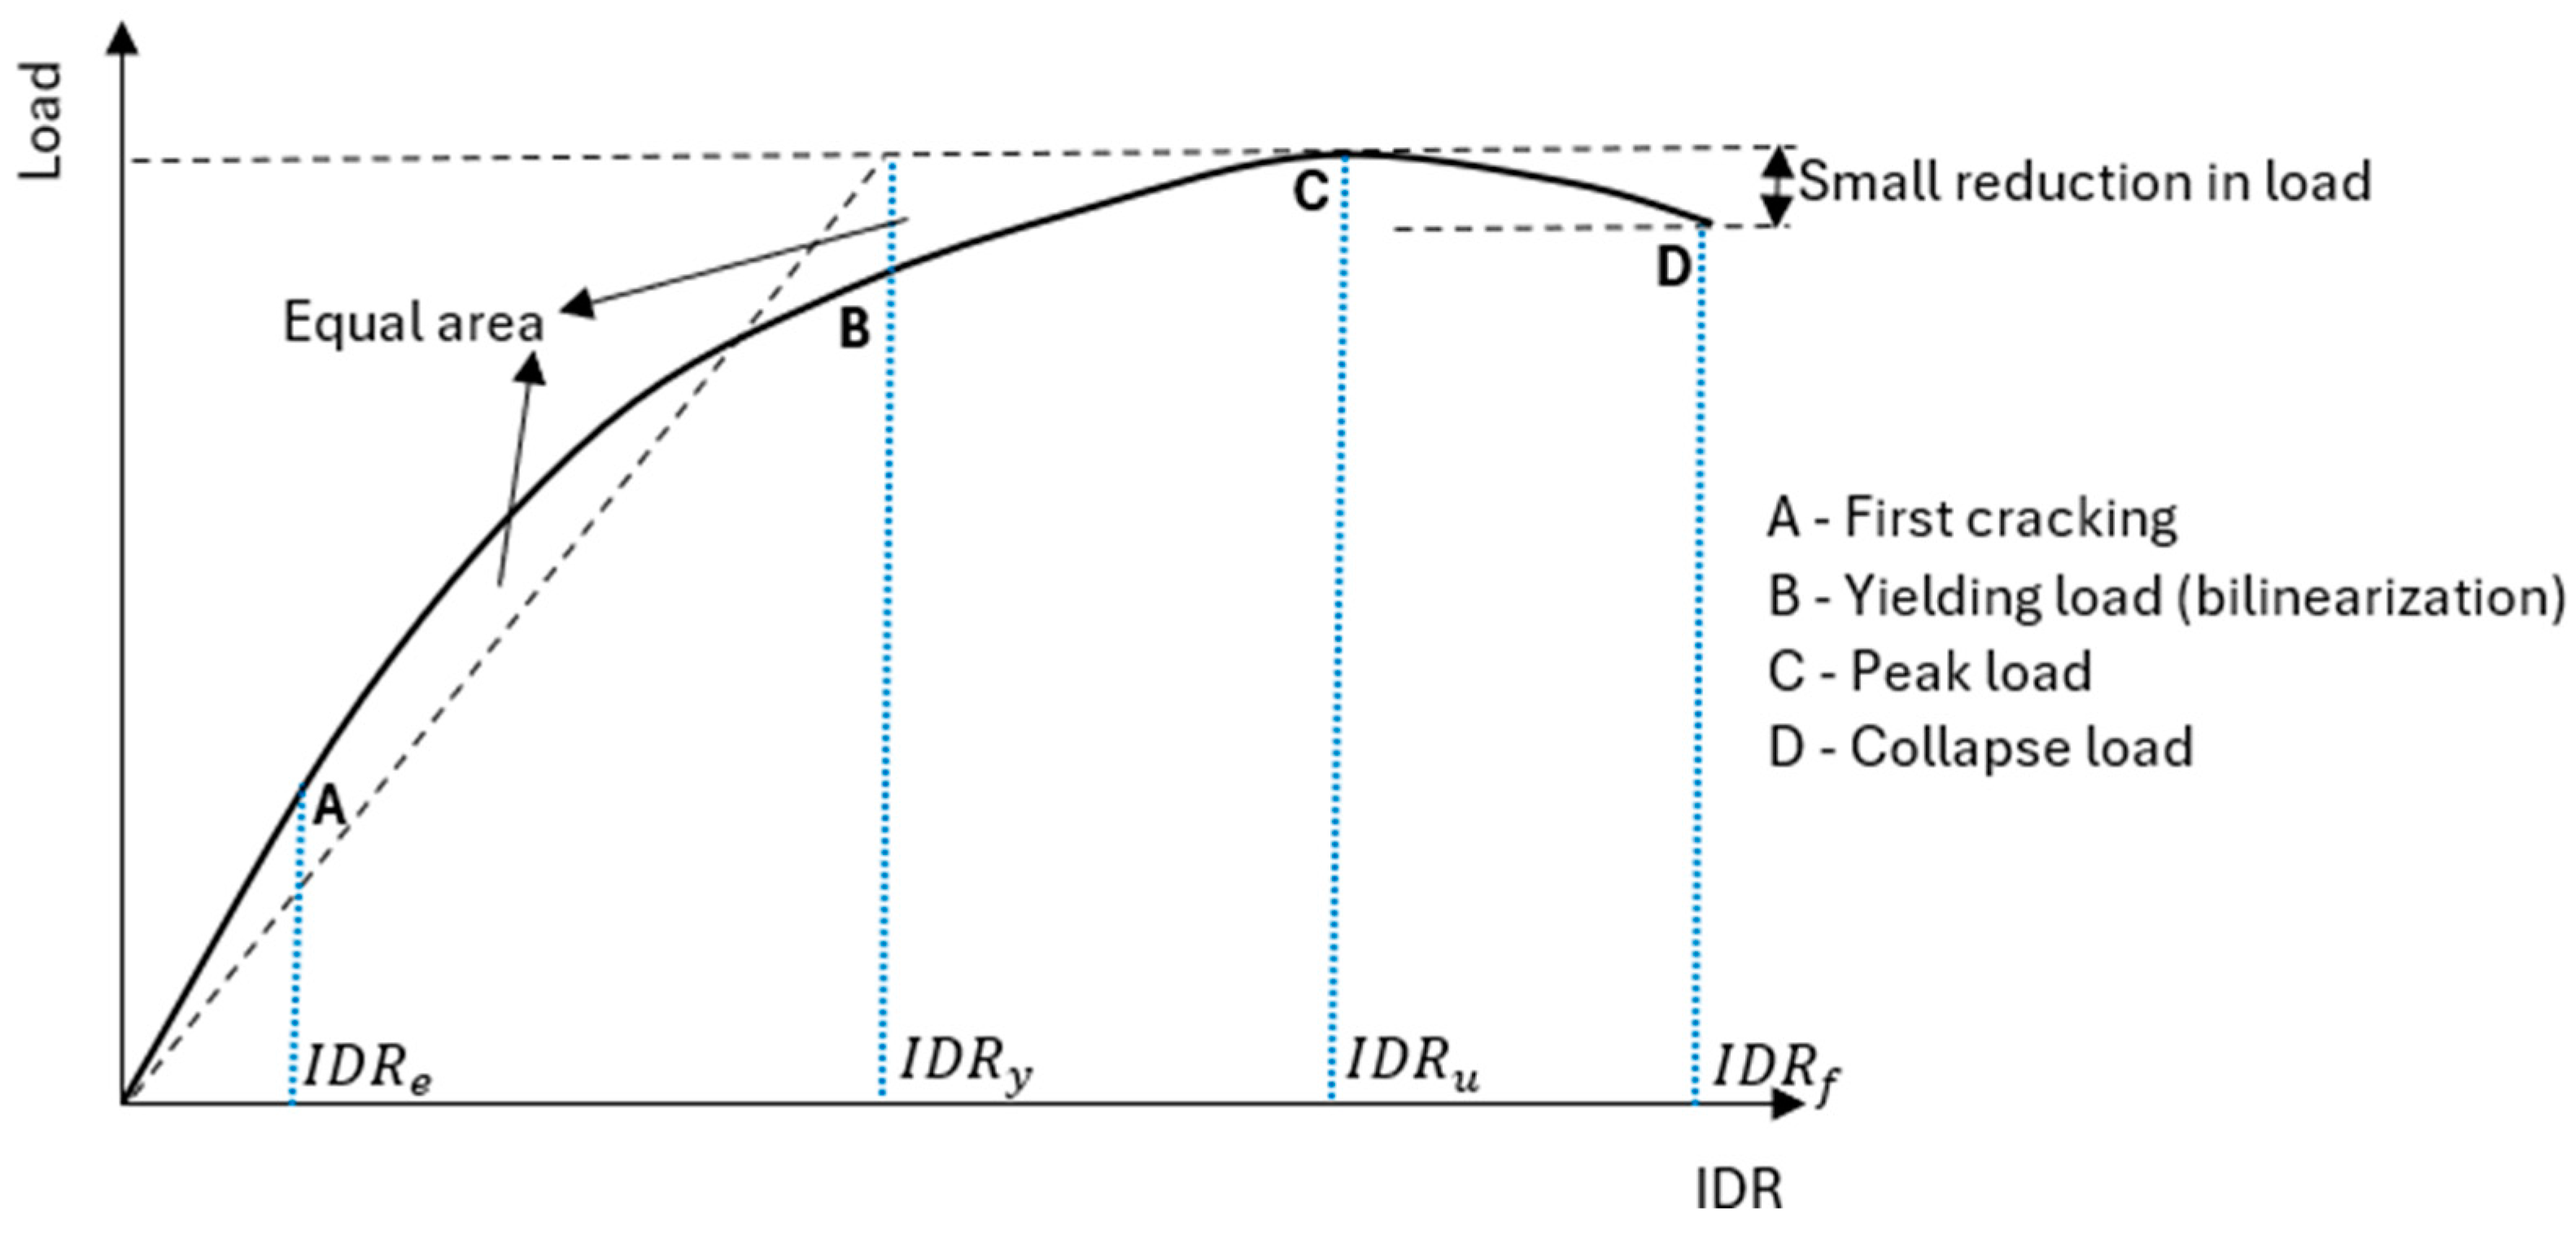
Using locally available materials and construction methods for URM buildings increases the uncertainty associated with the material properties of masonry. Hence, the material properties of URM buildings in different countries were collected and used for the probabilistic modelling. Masonry elastic modulus (E), density ( ρ ), compressive strength ( σ c ), tensile strength ( σ t ), and shear strength ( τ ) were identified as the major material properties that are sources of uncertainty in the seismic capacity of URM buildings. The statistical distributions (mean and coefficient of variation (CoV)) of the material properties were calculated based on the properties of URM buildings reported in India, Nepal, Pakistan, and Iran, and assuming a lognormal random distribution [38,39,40,41,42,43,44,45,46]. The values are listed in Table 2. The consideration of uncertainties associated with the masonry material properties indicates the consideration of a building class rather than a single building. Based on the statistical distributions, 54 sets of masonry material properties were generated to carry out the seismic analysis, and the ranges of the selected properties are also listed in Table 2.

3.4. Damage States

One of the critical components in the risk assessment of buildings is the classification of building damage levels, which is helpful in the probabilistic estimation of seismic losses. The damage levels in the URM building were defined in accordance with the definitions established by Park et al. [44], utilizing the identification of IDR threshold values on the push-over curves, as depicted in Figure 6.
Four distinct damage levels were taken into consideration based on the push-over curves: (i) slight damage—DS1, (ii) moderate damage—DS2, (iii) heavy damage—DS3, and (iv) complete damage—DS4. DS1 was defined using IDRe, corresponding to the initiation of nonlinear behaviour, indicating the onset of macroscopic cracking and nonlinear behaviour of the structure. DS2 corresponds to the yielding resisting force obtained through equal area bilinearization, and was defined by IDRy. DS3 and DS4 correspond to the extensive and complete damage states, the IDR values for which were defined by the peak load (IDRu) and the collapse load (IDRf). The modelling approach considered in the study is not capable of reproducing the exact post-peak softening behaviour of the masonry. Hence, an IDR value corresponding to a 10% reduction in the peak load is considered to be DS4, beyond which the structure is considered inoperable. It is also important to note that the inability of the model to predict the softening behaviour does not limit the aim of the present study, in that the damage classification was conducted based on different levels of damage rather than with the intention of definitively categorizing the structure as safe or unsafe for occupancy.

3.5. Numerical Analyses of Probabilistic Models

The Latin Hypercube Sampling technique was used to combine the uncertainties associated with the material properties and ground-motion records in the analysis [47]. Based on this approach, 54 sets of randomly generated material properties were combined with the ground-motion records, resulting in 54 sets of analysis conditions. In this way, the uncertainties of the masonry material properties associated with the URM building class and the ground-motion record uncertainties were considered together in the seismic demand prediction.
Push-over analyses for the 54 probabilistic modelling cases were carried out by applying horizontal displacement at the control node in the roof level of the URM building, which ensures the global response of the building, ignoring the local failures. Based on the push-over analysis results, the maximum IDR values corresponding to different damage states associated with the 54 sets of material properties were identified.
Each probabilistic model generated by randomly sampling material properties was then paired with the selected ground-motion records. Incremental dynamic analyses for the sets were then carried out by scaling the PGA of the ground-motion records from 0.01 g to 2.0 g, with an increment of 0.01 g, which accounts for 20 analysis cases for each material properties set. The nonlinear dynamic analysis of the URM building was carried out with a time step of 0.01 s for all of the cases. A proportional Rayleigh damping ratio of 4% was set for the first two vibration modes to avoid convergence issues, based on reports in the literature [48]. Finally, 1080 (54 sets of material properties ×20 sets of PGAs of ground-motion records) nonlinear time history analyses were carried out to identify the response of the URM building.

3.6. Database Development and Processing

The response-prediction analyses utilized seven input variables, comprising the five randomly generated material properties (outlined in Table 2), the shear modulus of the masonry, and the intensity of the ground-motion record. The shear modulus for every analysis set was calculated from the corresponding values for Young’s modulus and Poisson’s ratio (equal to 0.25) [31]. The range of shear modulus values used in the analysis was {248, 1193} MPa. The output variable was the maximum IDR of the URM building. Consequently, a database matrix of size 1080 × 7 was employed in the development of the response-prediction models. The general predictive equation for the structural response prediction is as follows:
Y M I D R = f X 1 , X 2 , X 3 , X 4 , X 5 , X 6 , X 7
where Y M I D R is the structural response, which is the maximum IDR. The predictor variables include the modelling and ground-motion-related uncertainties: X 1 is the mass density of masonry in kg/m3, X 2 is the compressive strength of masonry in MPa, X 3 is the tensile strength of masonry in MPa, X 4 is the shear strength of masonry in MPa, X 5 is the Young’s modulus of the masonry in MPa, X 6 is the shear modulus of masonry in MPa, and X 7 is the intensity measure from the earthquake records. PGA, one of the most commonly used Intensity Measures (IMs) in seismic demand analysis, was used as the IM. The effects of other IMs were not considered in the present study.
In the context of collapse status identification, the maximum IDR of the models was also incorporated as an input variable, resulting in eight input variables. The output variable for the classification models is the damage state (DS1 to DS4). A database matrix with a size of 1080 x 8 was used in developing the classification-based ML models. The general form of the classification models is as follows:
Y D a m a g e = f X 1 , X 2 , X 3 , X 4 , X 5 , X 6 , X 7 , X 8
where Y D a m a g e is the damage states DS1 through DS4, the X 1 through X 7 variables are the same as those used in the prediction models, and X 8 is the IDR of the URM building.
In the next step, the original data were pre-processed to improve the performance of the machine learning models. The input variables X 1 through X 7 are transformed into logarithmic scale before fitting the models in order to reduce the nonlinearity in the models. The data obtained from the nonlinear dynamic analysis of the URM building archetype were then divided into training and test sets. The training set, which accounted for 70% of the data (756 data points), was used to train both the regression-based and classification-based prediction models. The remaining 30% of the data (324 data points) was used to test the developed models, which helped to determine their performance on unknown data.
The correlations between the input variables were not considered in the study. The distribution of the damage states in the developed database is shown in Figure 7. Considering the scaling of the ground-motion records to 2.0 g and the comparatively lower load-carrying capacity of the URM building, 55% of the data falls under the collapse damage state (DS4).

4. Development of Machine Learning Models

The objective of this data-driven analysis is to explore the applicability of the various ML algorithms for the identification of the structural response and subsequent classification of the damage states. The regression and classification of damage states of URM buildings using ML algorithms are highly advantageous in identifying the underlying relationships between the input (structural parameters, material properties, and exciting force) and output variables (structural response and damage level) with minimal engineering judgement. These approaches are computationally efficient and are highly effective in identifying the hidden patterns in the structural response. Further, the models can be easily updated with additional data from experimental and numerical investigations.
The maximum IDR was considered the continuous quantitative output variable in the regression-based models. On the other hand, the categorical output considered in the classification-based approaches was the damage state, which was classified based on the structural response of the URM building to the earthquake’s excitation. Further, both parametric and non-parametric approaches were used in the study, in both prediction and classification, to encompass a wider range of ML algorithms. In each model, the model parameters were optimized by reducing the five-fold cross-validation loss. The models were programmed and developed using MATLAB R2024b.
Linear models such as LR, SLR, and RR were initially employed in prediction modelling due to their straightforward implementation and interpretative capabilities. To address the challenges associated with overfitting in linear models, techniques such as cross-validation and regularization were implemented. Following the development of linear models, various non-linear models were explored to capture the complex relationships between predictor and response variables in seismic response prediction. Notably, DT, RF, and SVM were utilized for prediction and classification tasks, owing to their robustness against outliers and their flexibility in accommodating diverse data types. Additionally, the NN model was incorporated into the prediction and classification processes due to its adaptability and learning capabilities.
As for the classification-based models, NB, DA, and AB were examined for their ease of implementation and interpretability, and may prove beneficial in future applications related to damage classification in URM buildings. The KNN model was selected to classify damage states due to its efficacy with small datasets and its straightforward application, which could be helpful for the present study. Moreover, the literature also suggests that the aforementioned models demonstrate superior performance across various structural-engineering applications [6,9,10,11]. The model development and parameter selection for every ML model considered in the present study are discussed in this section.

4.1. Regression-Based Machine Learning Techniques

Linear Regression, Stepwise Linear Regression, Ridge Regression, Support Vector Machine, Gaussian Process Regression, Decision Tree, Random Forest, and Neural Networks were used to construct a structural response prediction model.

4.1.1. Linear Regression (LR)

The LR technique identifies the linear relationship between the predictor and response variables. The present study used a quadratic model containing linear and squared terms for each predictor and products of pairs of distinct predictors. Maximum Likelihood estimation was used to formulate the robust model equations. It was solved using Iteratively Reweighted Least Squares (IRTS) to improve the fit by minimizing the effect of outliers by including weight as an additional scale factor.

4.1.2. Stepwise Linear Regression (SLR)

In this method, a linear model is developed by adding and removing predictors from the constant model based on a specific criterion [47]. In the present study, the p-value for an F-test for the change in the sum of squared error that results from removing or adding the term was used as the criterion. Further, a quadratic model was used for the predictors to improve the model performance.

4.1.3. Ridge Regression (RR)

This model develops the linear relationship by shrinking the regression coefficients by imposing a penalty based on the size of this value. Thus, the input parameters with less influence on the output variable will be removed [49]. The coefficients in Ridge Regression were chosen by minimizing the mean squared error, which is the difference between the observed and predicted values. The penalty term, composed of fit coefficients and a tuning parameter λ, was calculated using the L2 norm.

4.1.4. Decision Tree (DT)

The LR, SLR, and RR models fit the data by developing a linear relationship, but the relationship between the predictor and response variables might be nonlinear. In such cases, non-parametric approaches, such as Decision Tree and Random Forest, can be used to develop the nonlinear relationship. These models can provide more accurate predictions but are challenging to interpret. In the DT model, a tree-like structure is formed by splitting the regression region into a hierarchy of simple decisions involving one or several input features until a stopping criterion is met. The root node, or the first decision node, is the best predictor [50,51]. The best split is identified through the minimization of impurity or node error. In the present study, 563 splits were used to identify the response variable.

4.1.5. Random Forest (RF)

RF is an ensemble-based model which consists of several trees constructed from a bootstrap sample of the training data [52]. The RF model includes a layer of randomness to improve the bagging. For each spit, only a randomly drawn subset of input features is used, to avoid overfitting by reducing the correlation between the trees. As a result, the Random Forest model usually outperforms other simple ML algorithms. In the present study, the bootstrap method was used, along with 64 learning cycles. To attain better accuracy, the learning rate for shrinkage was assigned a value of 0.3, with a minimum number of leaf node observations of 3.

4.1.6. Support Vector Machine (SVM)

This model, established as a binary classifier, uses an optimal hyperplane to separate the data points by maximizing the margin [53,54,55]. The nonlinear boundary between the data points was identified through the nonlinear transformation of the features to a higher dimensional space using a kernel function. In the present study, a Gaussian kernel function was used for both regression and classification. Further, the model parameters were optimized through the minimization of the five-fold cross-validation loss.

4.1.7. Gaussian Process Regression (GPR)

GPR is a nonparametric kernel-based probabilistic model [56]. The model explains the response by introducing latent variables from the Gaussian process (GP) and explicit basis function h , projecting the inputs into a p-dimensional feature space. In the present study, the rational quadratic kernel function was used, along with the optimized hyperparameters, by minimizing the five-fold cross-validation loss. In the optimized model, the constant basis function and initial value σ of 0.234 for the noise standard deviation were used.

4.1.8. Neural Networks (NN)

The NN approach is modelled based on the human brain; the responses are identified through the nonlinear functional relationships associated with the input features [57]. The architecture of a neural network consists of input, hidden, and output layers, comprising neurons or nodes. The neurons combine the inputs from the input data with suitable weights, assigned based on the importance of the input. The present study used a sigmoid activation function with three fully connected layers to train the model with the standardized data.

4.2. Classification-Based Machine Learning Techniques

Naïve Bayes, Discriminant Analysis, K-Nearest Neighbours, Adaptive Boosting, Decision Tree, Random Forest, Support Vector Machine, and Neural Networks algorithms were used for developing the classification model to identify the damage state associated with the URM building subjected to the earthquake.

4.2.1. Naïve Bayes (NB)

NB is based on the Bayes theorem and assumes that the value of an attribute in a particular class is independent of the values of other attributes [58]. The method classifies the data according to the posterior probability of a sample belonging to each class. In the present study, a multiclass Naïve Bayes model was trained using a kernel smoothing density estimate and an optimized kernel smoothing window width.

4.2.2. Discriminant Analysis (DA)

DA is a classification method which assumes that the data generated by different classes are based on different multivariate Gaussian distributions [59]. The method creates distributions for each class based on the independent variables and calculates the probability of the dependent variable using Bayes’ theorem. For this study, linear Discriminant Analysis was used, which assumes that the predictors in each class have equal covariance and uses a linear decision surface.

4.2.3. K-Nearest Neighbours (KNN)

The KNN algorithm incorporates no assumption on the decision boundaries, and it works based on feature similarity [60]. This non-parametric ML algorithm classifies the sample based on the determination of the K most similar samples in the sample space. In the present study, optimized hyperparameters were used to train the model by five-fold cross-validation. The optimized model, with k = 12, an Euclidean distance metric and squared inverse distance weighting function, was used to classify the labels [61].

4.2.4. Adaptive Boosting (AB)

AB implements a simple decision tree as a weak base model and ultimately obtains a stronger model through an adaptive reweighted training of the data at each iteration [62]. This iterative algorithm begins with the uniform weights and updates the error value and weights at every iteration step.
The DT, RF, SVM, and NN classification methods follow the same methodologies explained in the previous section to classify the data. In the case of the DT model, 268 splits with the deviance-based split criterion were used to train the model. Standardized predictor variables were used with a polynomial kernel function to train the SVM model. Finally, a single-layered network with a t a n h activation function was used in neural network mode.

4.3. Performance Evaluation Metrics

The values associated with coefficient of determination ( R 2 ), adjusted R 2 , and Root Mean Square error (RMSE) are used for evaluating the performance of the prediction models. Smaller values for the errors and higher values of R 2 indicate the better performance of the models.
In case of classification models, the performance of the models was evaluated using accuracy, precision, recall, and F1 score. These metrics were defined based on the confusion charts, which display the actual damage states and the predicted damage states by the classification models. The diagonal elements of the matrix represent cases accurately classified by the algorithms, while the off-diagonal elements indicate misclassified cases. Additionally, the confusion chart includes row-normalized and column-normalized values, which provides the percentage of accurately classified samples relative to the total number of samples.
Accuracy is defined as the percentage of correctly predicted damage states relative to the total number of damage states or samples analysed. Precision is measured as the ratio of true positives to the total number of positives, either true or false; this value is represented by column-normalized values. This metric reflects the ability of the model to classify damage states while minimizing false positives accurately. Recall, indicated by row-normalized values, is the ratio of correctly classified data to the total number of actual cases. Recall is crucial in seismic damage classification, as it ensures the correct identification of severely damaged structures, a situation in which misclassification may lead to significant consequences. Higher values of accuracy, precision, and recall indicate superior performance of the machine learning algorithm.
In order to fully examine the effectiveness of the classification model, both recall and precision should be assessed. However, tuning the model to increase recall may result in a decrease in precision, and vice versa. As a trade-off, the F1-score is commonly used to examine the accuracy of the model. The F1-score is the weighted harmonic mean of the precision and recall, and it is given by the following:
F 1 = 2 P r e c i s i o n     R e c a l l P r e c i s i o n + R e c a l l

5. Results and Discussion

5.1. Building Response Prediction Models

The ML algorithms described in the previous section were used to predict the seismic response (IDR) of the URM building, and their performance was assessed through the metrics developed based on the training set and the test set. The values of R 2 , adjusted R 2 , and RMSE associated with the prediction models are listed in Table 3. The following inferences can be drawn from the results of the prediction models:
  • After examining several models, the RF, GPR, and NN models demonstrated effective performance in predicting the IDR of the URM building. This is evidenced by their higher R 2 values and the lower RMSE values associated with the training data, the least being the RMSE of the RF model. However, the GPR model exhibits comparatively lower RMSE relative to the test data. The RF model showed a lower R 2 value for the test set compared to the training set (3.6% reduction), indicating poor performance or high variance relative to the new dataset. On the other hand, the GPR model performed better in both the training and test sets (less than 0.2% variation), which is again evident from the RMSE values associated with the training and test sets of the model. This highlights the efficiency of GPR model in capturing the complex relationships in data.
  • The performance levels of the DT and SVM were found to be effective while examining the R 2 and RMSE values of the training set. However, the results obtained from the test set of DT and SVM models showed a slightly poor performance, with comparatively smaller R 2 values of 0.923 and 0.958, and larger RMSE values of 0.476 and 0.327, respectively, compared to other non-parametric models (RF, GPR, and NN). This indicates the overfitting of the DT model and the instability of the model relative to changes in the data.
  • The LR, SLR, and RR models are ineffective in accurately predicting structural response due to the nonlinearity in the relationship between the predictor and response variables. The findings also indicate a tendency for these linear models to overfit the data. The relatively poor performance of the linear models in comparison to their nonlinear counterparts may also be a result of their sensitivity to outliers in the seismic response data, despite the implementation of cross-validation and regularization techniques during the model development phase.
  • Even though the variation in the R 2 value of the parametric models (LR, SLR, and RR) exhibits a variation from the best performing GPR model by 10% to 17%, a notable variation in the RMSE of the training set (55% to 65%) can be observed. This fact was also established by comparing the actual and predicted response (in natural logarithmic scale) of the test set obtained through various ML algorithms, as illustrated in Figure 8. It is also clear that non-parametric models, particularly the GPR model, show a much better fit. With its high RMSE values (0.70), and the least fit in the regression graph, the RR exhibits comparatively poor performance among the parametric models.
  • The variations of the R 2 and RMSE values associated with the prediction models are illustrated in Figure 9. The R 2 values of the training and test sets for all the non-parametric models (DT, RF, SVM, GPR, and NN) ranged between 0.9 and 1.0, indicating the best performance, as compared to parametric models (LR, SLR, and RR). Furthermore, the RMSE values for SVM, GPR, and NN were all below 0.4, demonstrating their better performance.
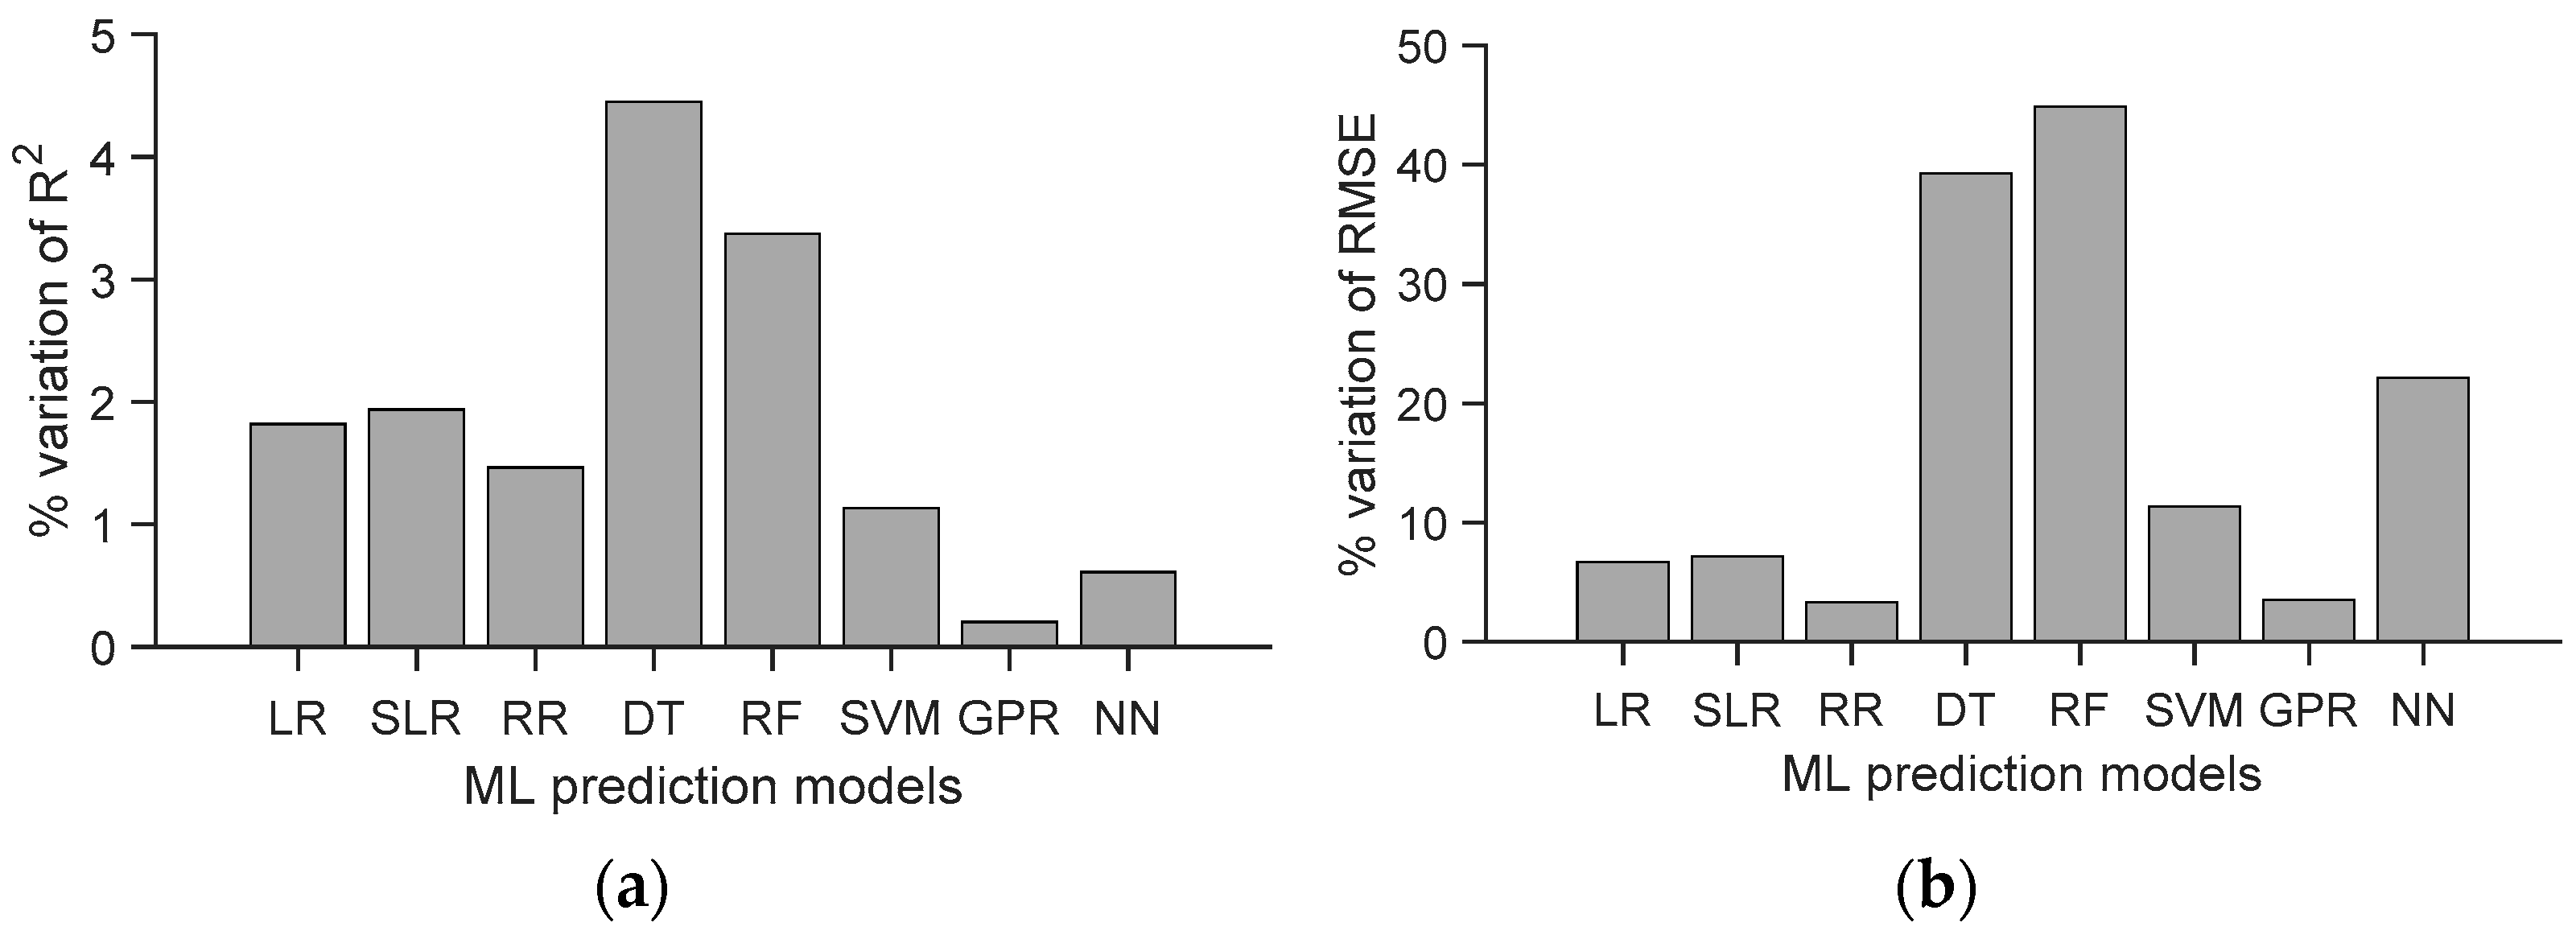
  • Furthermore, the percentage variation in the R 2 and RMSE values of the training and test sets of the ML models were calculated, and the results are compared in Figure 10. The lowest percentage variations for both the R 2 and RMSE values were found in the GPR model, which again substantiates the effective performance of the model in predicting the response. Based on these results, the performance of SVM model was found to be relatively better than the DT, RF and NN models. Even though the percentage variations associated with the results of the parametric models (LR, SLR, and RR) were comparatively lower than those of the non-parametric models, the values were quantitatively higher than those of the values reported by non-parametric models.
  • The performance of the ML models can be influenced by the underlying database, which in turn is impacted by factors such as building type, input variables, dataset size, and output variables in structural-engineering applications. The existing literature contains consistent findings which demonstrate that non-parametric regression models outperform parametric regression models. Specifically, RF, SVM, and DT have demonstrated superior performance in accurately estimating the structural responses of steel moment-resisting frame buildings [6].

5.2. Damage Levels Classification Models

After training the classification models, their performance was evaluated using standard metrics to measure their effectiveness on the test dataset. These metrics include accuracy, precision, recall, and F1 score, as defined based on the confusion charts shown in Figure 11. The diagonal cells, highlighted in various shades of blue, represent the correct predictions for different damage states. In contrast, the off-diagonal cells, highlighted in orange, indicate incorrect predictions. The recall and precision values for each damage state are presented in the final column and row of the chart, respectively, and are marked in grey.
It is also important to note that in the seismic assessment of URM buildings, recall values are crucial, as they show the number of samples classified as having reduced damage. This aspect is essential, as misclassifying a sample with Damage State 4 (DS4) as either Damage State 3 (DS3) or Damage State 2 (DS2) may erroneously categorize a severely damaged building as one with moderate or heavy damage. Such misclassification during post-earthquake evaluations could result in a heavily damaged structure being ascribed a lower damage rating, thus posing a significant risk to repair personnel and occupants following an earthquake. The accuracy, training error, and misclassification rates associated with the test sets and the F1-scores of the classification models are listed in Table 4.
The following inferences were drawn from the results of the trained classification models:
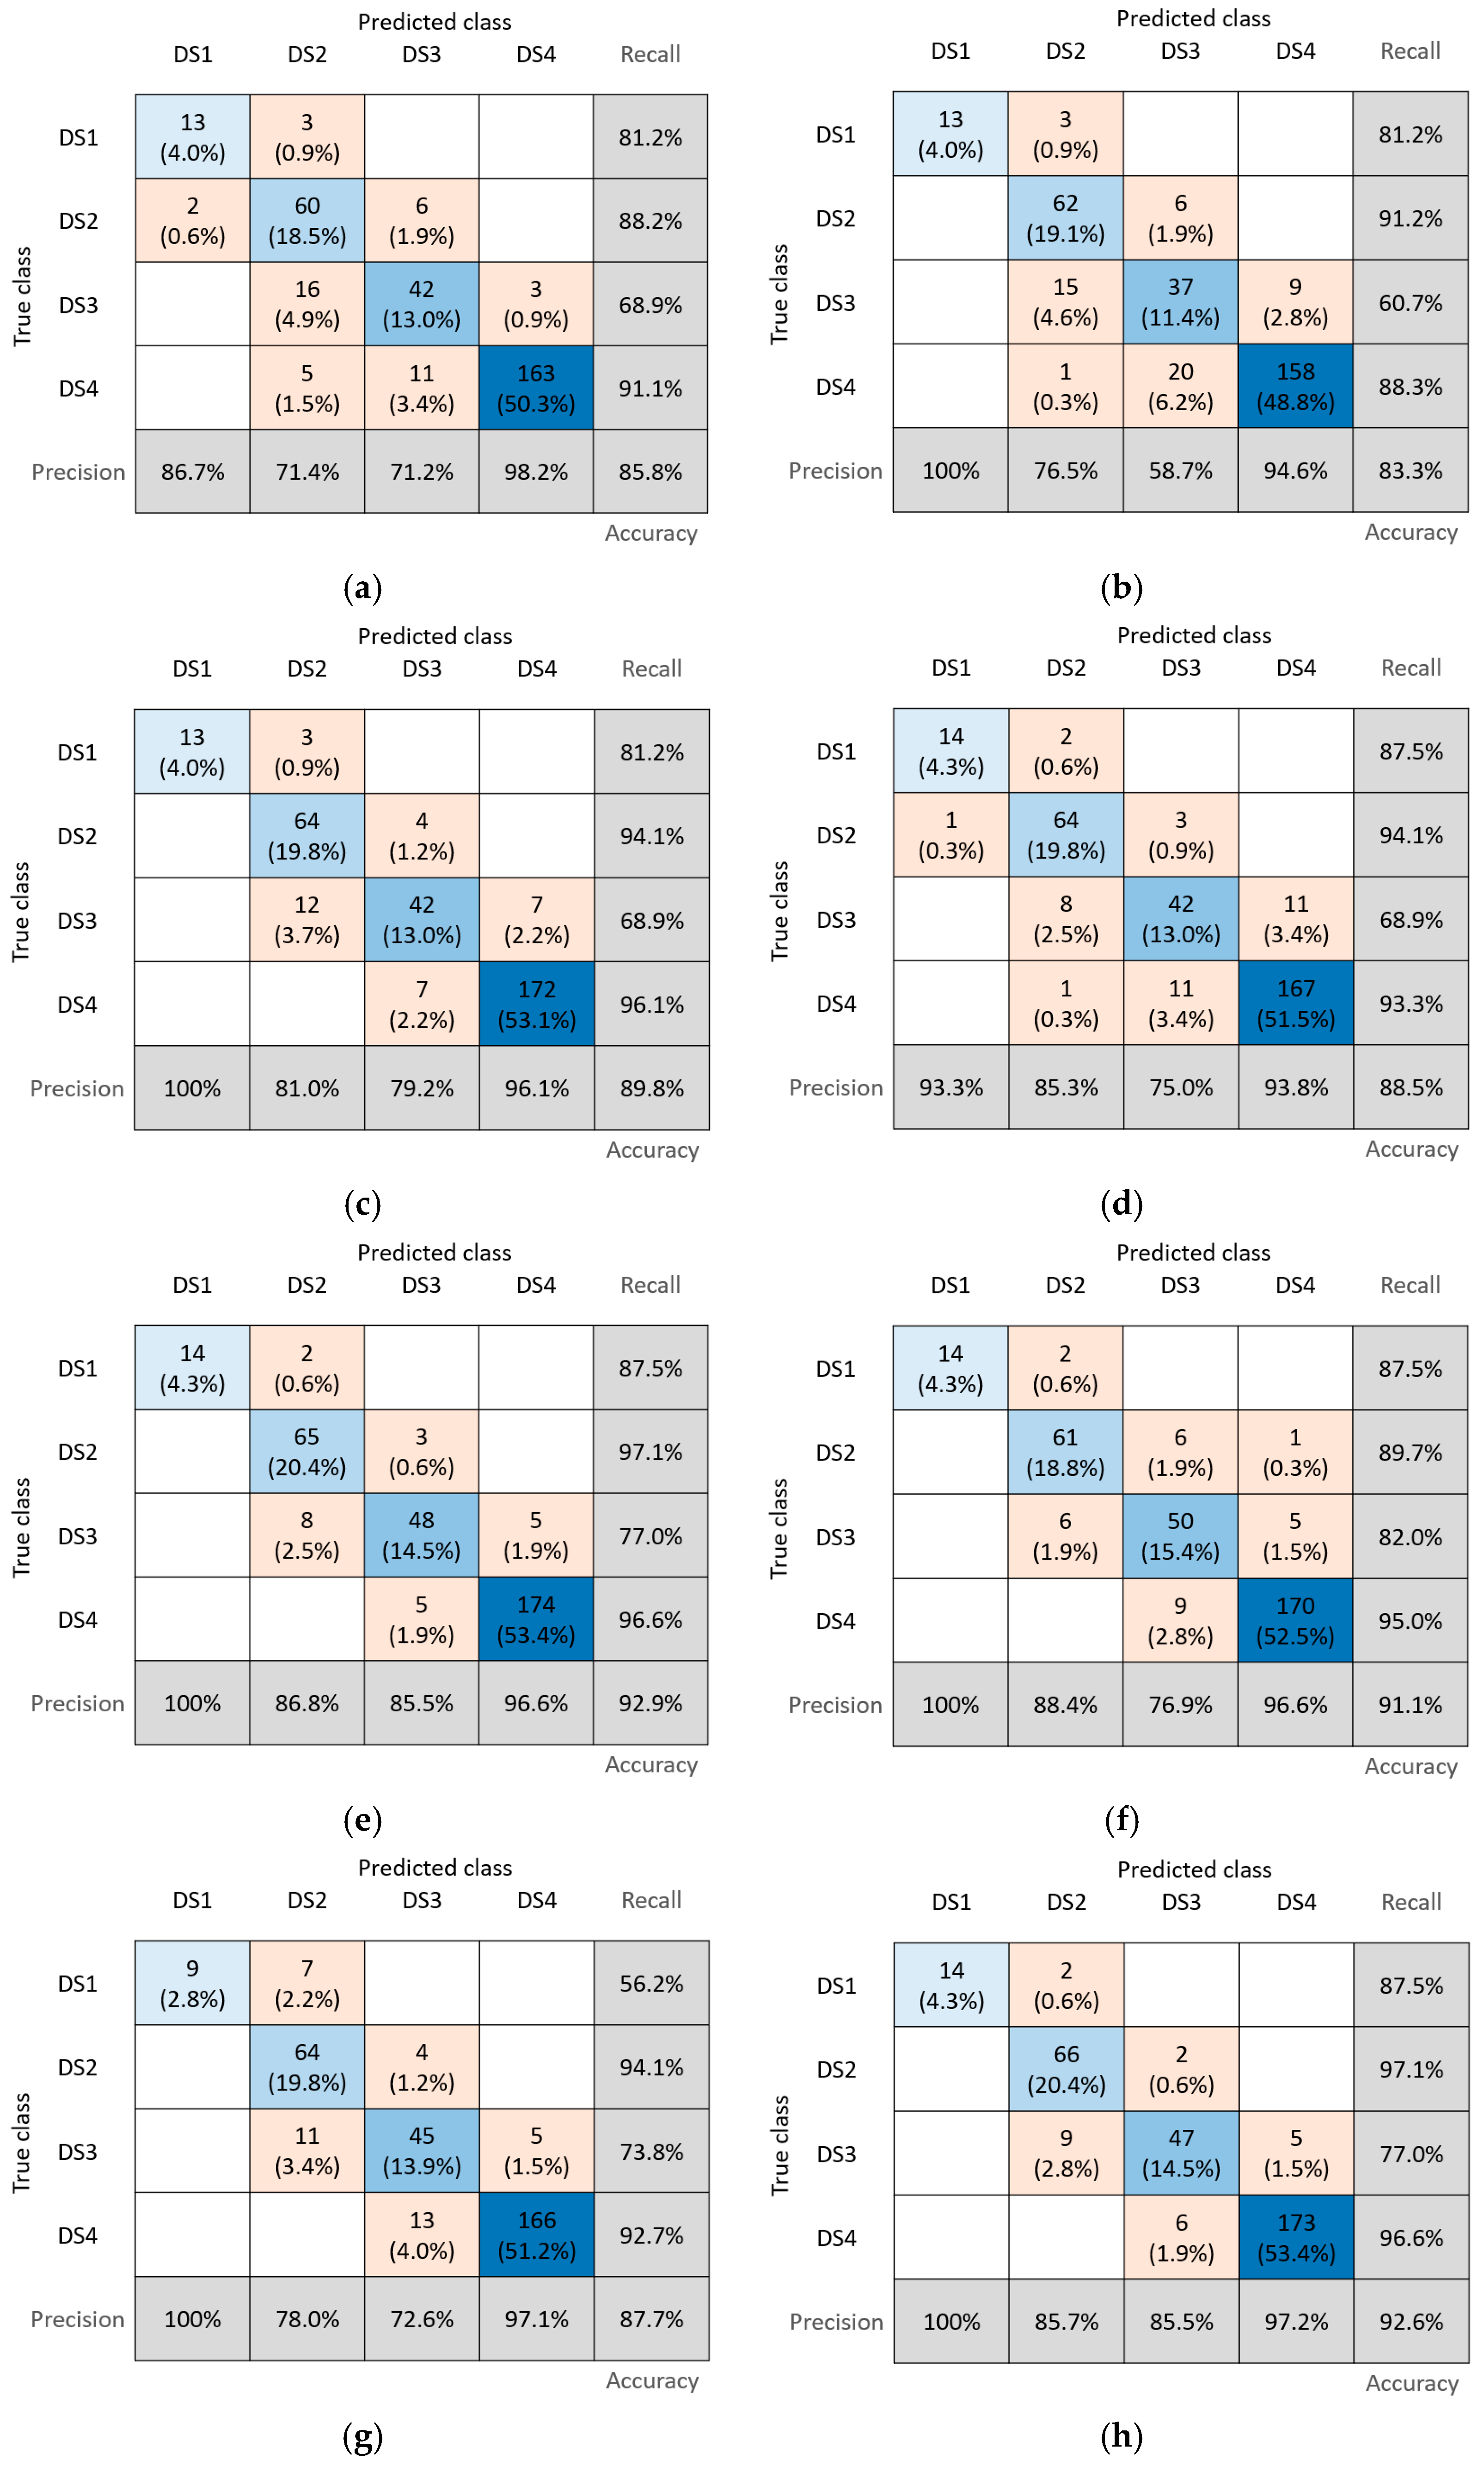
  • The results show that the RF model had the highest accuracy rate, at 92.9%, followed by the NN and AB models. The good performance of the tree-based models suggests that there are non-linear decision boundaries between the failure modes. The results clearly indicate that the non-parametric tree-based models performed better overall than did parametric non-tree-based models like NB.
  • Identifying damage state DS4, which indicates the collapse of the URM building, is critical. The RF model had a precision and recall rate of 96.6% in identifying DS4 in the test set. Similarly, the NN model showed a high recall rate for DS4 and slightly higher precision than the RF model.
  • Compared to other ML models, the RF model had a higher F1 score for all damage states, followed by the NN and AB models. These models also had lower misclassification rates. The F1 score of the DA model for all damage states was comparatively lower than other models, indicating poor performance in classifying the damage states. The AB model had 1.8% lower accuracy and 1.6% lower DS4 recall than the RF model. Based on the results, it can be clearly seen the bagging-based RF model outperforms gradient-based methods like AB in terms of accuracy.
  • Despite having a lower training error, the SVM model was outperformed by the neural network model in terms of accuracy, precision, and recall on the test set. Additionally, the KNN model with zero training error had lower accuracy than the tree-based models. This highlights the importance of splitting the data into training and test sets to evaluate model performance accurately.
  • In Figure 12, the accuracy, F1 score, precision, and recall of the classification models are compared. It is evident that the RF, SVM, and NN models demonstrate higher accuracy levels, ranging from 90% to 100%. Additionally, the F1 score values for these models exceed 75.0% across all damage states. While accurate classification of DS3 and DS4 is crucial, models exhibiting superior performance in classifying all damage states will significantly aid in the post-earthquake risk assessment of URM buildings. Notably, the precision values of the NB, DA, KNN, DT, and SVM models fall below 70% for damage states DS1 and DS3, indicating their poor performance. Furthermore, the recall values also reflect the inferior performance of NB and DA models, with recall values below 70% for the damage state DS3.
  • The results clearly demonstrate the superior performance of RF, AB, and NN models in categorizing the damage states of the URM building. Comparable findings validating the efficacy of these classification models can be found in the existing literature. For instance, the AB model achieved over 80% accuracy in classifying failure modes of reinforced concrete frames with infills [9]. Furthermore, the RF and AB models utilized for the collapse status classification of RC frame buildings exhibited enhanced performance [10]. Similarly, the RF model employed for identifying the flexure–shear failure mode of concrete shear walls attained the highest accuracy, with 70% recall and 84% precision [11].
Based on the higher values for accuracy and recall, the RF model can be seen as suitable for identifying the damage states in the URM building. In order to identify the importance of the input parameters that affect the performance of the RF model, the relative importance of the predictor variables was evaluated, and this is shown in Figure 13. The importance of the predictors was assessed by permuting out-of-bag observations across the trees. In this study, out-of-bag predictor importance values were initially computed through permutation, reflecting the impact of predictor variables on output estimation. The relative importance of each variable was then determined by dividing its importance value by the sum of the importance values for all predictor variables. The results indicated that the IDR is the most important predictor, with a relative-importance value of 26.84%, followed by PGA (16.81%) and shear strength of masonry (11.5%). The relative-importance values for the masonry material properties range from 7.14% to 11.5%.

6. Conclusions

URM buildings are a valuable part of cultural heritage and residential architecture worldwide, despite their limited ability to bear lateral loads. Further, these buildings are prevalent in regions highly prone to earthquakes. This study examines the effectiveness of various ML algorithms in identifying the seismic response and damage classification of a benchmark URM building. A comprehensive database was established by performing numerical analysis on a benchmark URM building, due to the absence of experimental data in the literature suitable for training ML models. This study presents a novel application of a diverse range of ML algorithms for the classification of seismic damage, which may improve the seismic risk assessment of non-engineered, unreinforced masonry buildings.
Eight ML algorithms were used to predict the seismic response of the URM building. The results showed that the GPR model exhibited better performance, with smaller R 2 values and larger RMSE values in both training and test sets. Additionally, the comparison of the actual and predicted responses from the GPR model showed better fit than other regression models. The percentage variation in the R 2 and RMSE values of the training and test sets (0.20% and 3.50%, respectively) for the GPR model were also found to be smaller than those of the other prediction models. The lowest RMSE value of the training set was found to be associated with the RF model, but the RMSE value of the test set was higher (44.88% higher), indicating the overfitting of the model. Hence, the results indicated that the overall performance of the non-parametric models such as GPR, RF, and NN was better than that of the linear models, indicating the nonlinear relationship between the predictor and response variables.
In the case of damage classification, eight ML algorithms were explored to identify the suitability of the models for the classification of the damage in a URM building. The results showed that the RF model had a higher accuracy rate, at around 92.90%, and a misclassification rate of 0.07. The precision and recall values associated with DS4 in the RF model were found to be equal to 96.6%, which indicates the accurate classification of completely damaged building cases, which is crucial in the seismic damage assessment of buildings. Followed by the RF model, the performance of the NN and AB models was found to be comparatively better than that of the other classification models used in the study. Additionally, the F1 score of these models was also higher, suggesting that the models performed better in distinguishing different damage states accurately. Finally, the relative-importance assessment of the input parameters in RF model showed that the IDR value was the most important predictor, with a relative importance of about 26.84%, followed by PGA (16.81%) and shear strength of masonry (11.5%).
The results of the study highlight the effectiveness of various ML models in the prediction of seismic response and classifying damage in URM buildings. The ML models, in conjunction with the optimized parameters outlined in the study, can be effectively employed to address similar challenges related to the prediction of seismic response in URM buildings worldwide. Moreover, these results will significantly influence the post-earthquake assessment of URM buildings and aid researchers in designing their experimental and numerical studies on URM buildings.
The important limitation in this demonstrated application of ML models for the damage prediction of a URM building is the requirement of the use of similar features for the input and output variables. Furthermore, accurate prediction of response and damage classification necessitate the use of precise values for masonry material properties and detailed descriptions of damage states. Therefore, ensuring the reliability of the material properties is essential for the appropriate utilization of these developed models in seismic damage assessment. It is essential to recognize that the present study primarily focuses on demonstrating the effectiveness of ML models in classifying the damage states of URM buildings, without considering various failure modes and the reasons for failure.
Future research efforts should aim to develop a comprehensive database that encompasses URM buildings with diverse floor plans and increased numbers of stories, thus encompassing a wider range of buildings globally. Additionally, there is also a need for the development of ML-based damage pattern prediction and fragility assessment for URM buildings. This expansion of scope will contribute to a more comprehensive understanding of URM building behaviour under seismic events.

Author Contributions

Conceptualization, N.R.; methodology, N.R.; software, N.R.; validation, N.R., O.M. and B.P.; formal analysis, N.R.; investigation, N.R. and B.P.; resources, N.R. and B.B.; data curation, N.R.; writing—original draft preparation, N.R. and B.P.; writing—review and editing, O.M. and B.B.; visualization, N.R. and B.P.; supervision, B.B. and O.M.; project administration, N.R. and B.B.; funding acquisition, B.B. All authors have read and agreed to the published version of the manuscript.

Funding

This research is supported by Ratchadapisek Somphot Fund for Postdoctoral Fellowship, Chulalongkorn University.

Institutional Review Board Statement

Not applicable.

Informed Consent Statement

Not applicable.

Data Availability Statement

The raw data supporting the conclusions of this article will be made available by the authors on request.

Conflicts of Interest

The authors declare no conflicts of interest.

Abbreviations

The following abbreviations are used in this manuscript:
ABAdaptive Boosting
CoVCoefficient of Variation
DADiscriminant Analysis
DSDamage State
DTDecision Tree
ELMEnsemble Learning Method
ERTRExtremely Randomized Tree Regressor
FEFinite Element
GDIGini’s Diversity Index
GPRGaussian Process Regression
IDRInter-story drift ratio
IMIntensity Measure
IRTSIteratively Reweighted Least Squares
KNNK-Nearest Neighbors
LHSLatin Hypercube Sampling
LRLinear Regression
MLMachine Learning
NBNaïve Bayes
NNNeural Networks
PGAPeak Ground Acceleration
RCReinforced Concrete
RFRandom Forest
RMSERoot Mean Square Error
RRRidge Regression
SLRStepwise Linear Regression
SVMSupport Vector Machine
URMUnreinforced Masonry

References

  1. Arya, A.S.; Boen, T.; Ishiyama, Y. Guidelines for Earthquake Resistant Non-Engineered Construction; UNESCO: Paris, France, 2014. [Google Scholar]
  2. Ravichandran, N.; Losanno, D.; Parisi, F. Low-cost base isolation systems for unreinforced masonry buildings in developing countries. In Proceedings of the 8th International Conference on Computational Methods in Structural Dynamics and Earthquake Engineering Methods in Structural Dynamics and Earthquake Engineering, Eccomas Proceedia, Athens, Greece, 28–30 June 2021. [Google Scholar]
  3. Choudhury, T.; Milani, G.; Kaushik, H.B. Comprehensive numerical approaches for the design and safety assessment of masonry buildings retrofitted with steel bands in developing countries: The case of India. Constr. Build. Mater. 2015, 85, 227–246. [Google Scholar] [CrossRef]
  4. Michalski, R.S.; Carbonell, J.G.; Mitchell, T.M. Machine Learning an Artificial Intelligence Approach; Springer: Berlin/Heidelberg, Germany; New York, NY, USA; Tokyo, Japan, 1984. [Google Scholar]
  5. Sun, H.; Burton, H.V.; Huang, H. Machine learning applications for building structural design and performance assessment: State-of-the-art review. J. Build. Eng. 2021, 33, 101816. [Google Scholar] [CrossRef]
  6. Kiani, J.; Camp, C.; Pezeshk, S. On the application of machine learning techniques to derive seismic fragility curves. Comput. Struct. 2019, 218, 108–122. [Google Scholar] [CrossRef]
  7. Thai, H.T. Machine learning for structural engineering: A state-of-the-art review. Structures 2022, 38, 448–491. [Google Scholar] [CrossRef]
  8. Wang, X.; Mazumder, R.K.; Salarieh, B.; Salman, A.M.; Shafieezadeh, A.; Li, Y. Machine learning for risk and resilience assessment in structural engineering: Progress and future trends. J. Struct. Eng. 2022, 148, 03122003. [Google Scholar] [CrossRef]
  9. Huang, H.; Burton, H.V. Classification of in-plane failure modes for reinforced concrete frames with infills using machine learning. J. Build. Eng. 2019, 25, 100767. [Google Scholar] [CrossRef]
  10. Hwang, S.H.; Mangalathu, S.; Shin, J.; Jeon, J.S. Machine learning-based approaches for seismic demand and collapse of ductile reinforced concrete building frames. J. Build. Eng. 2021, 34, 101905. [Google Scholar] [CrossRef]
  11. Mangalathu, S.; Jang, H.; Hwang, S.H.; Jeon, J.S. Data-driven machine-learning-based seismic failure mode identification of reinforced concrete shear walls. Eng. Struct. 2020, 208, 110331. [Google Scholar] [CrossRef]
  12. Mangalathu, S.; Jeon, J.S. Classification of failure mode and prediction of shear strength for reinforced concrete beam-column joints using machine learning techniques. Eng. Struct. 2018, 160, 85–94. [Google Scholar] [CrossRef]
  13. Charalampakis, A.E.; Tsiatas, G.C.; Kotsiantis, S.B. Machine learning and nonlinear models for the estimation of fundamental period of vibration of masonry infilled RC frame structures. Eng. Struct. 2020, 216, 110765. [Google Scholar] [CrossRef]
  14. Latif, I.; Banerjee, A.; Surana, M. Explainable machine learning aided optimization of masonry infilled reinforced concrete frames. Structures 2022, 44, 1751–1766. [Google Scholar] [CrossRef]
  15. Wu, J.R.; Di Sarno, L. A machine-learning method for deriving state-dependent fragility curves of existing steel moment frames with masonry infills. Eng. Struct. 2023, 276, 115345. [Google Scholar] [CrossRef]
  16. Mojaddadi, H.; Pradhan, B.; Nampak, H.; Ahmad, N.; Ghazali, A.H.B. Ensemble machine-learning-based geospatial approach for flood risk assessment using multi-sensor remote-sensing data and GIS. Geomat. Nat. Hazards Risk 2017, 8, 1080–1102. [Google Scholar] [CrossRef]
  17. Zhang, Y.; Burton, H.V.; Sun, H.; Shokrabadi, M. A machine learning framework for assessing post-earthquake structural safety. Struct. Saf. 2018, 72, 1–16. [Google Scholar] [CrossRef]
  18. Zhu, J.; Zhang, W. Probabilistic fatigue damage assessment of coastal slender bridges under coupled dynamic loads. Eng. Struct. 2018, 166, 274–285. [Google Scholar] [CrossRef]
  19. Chomacki, L.; Rusek, J.; Słowi, L. Machine Learning Methods in Damage Prediction of Masonry Development Exposed to the Industrial Environment of Mines. Energies 2022, 15, 3958. [Google Scholar] [CrossRef]
  20. Loverdos, D.; Sarhosis, V. Automatic image-based brick segmentation and crack detection of masonry walls using machine learning. Autom. Constr. 2022, 140, 104389. [Google Scholar] [CrossRef]
  21. Mishra, M.; Bhatia, A.S.; Maity, D. Predicting the compressive strength of unreinforced brick masonry using machine learning techniques validated on a case study of a museum through nondestructive testing. J. Civ. Struct. Health Monit. 2020, 10, 389–403. [Google Scholar] [CrossRef]
  22. Rezaie, A.; Godio, M.; Achanta, R.; Beyer, K. Machine-learning for damage assessment of rubble stone masonry piers based on crack patterns. Autom. Constr. 2022, 140, 104313. [Google Scholar] [CrossRef]
  23. Siam, A.; Ezzeldin, M.; El-Dakhakhni, W. Machine learning algorithms for structural performance classifications and predictions: Application to reinforced masonry shear walls. Structures 2019, 22, 252–265. [Google Scholar] [CrossRef]
  24. Loverdos, D.; Sarhosis, V. Geometrical digital twins of masonry structures for documentation and structural assessment using machine learning. Eng. Struct. 2023, 275, 115256. [Google Scholar] [CrossRef]
  25. Harirchian, E.; Hosseini, S.E.A.; Novelli, V.; Lahmer, T.; Rasulzade, S. Utilizing advanced machine learning approaches to assess the seismic fragility of non-engineered masonry structures. Results Eng. 2024, 21, 101750. [Google Scholar] [CrossRef]
  26. Zain, M.; Dackermann, U.; Prasittisopin, L. Machine learning (ML) algorithms for seismic vulnerability assessment of school buildings in high-intensity seismic zones. Structures 2024, 70, 107639. [Google Scholar] [CrossRef]
  27. Coskun, O.; Aldemir, A. Machine learning network suitable for accurate rapid seismic risk estimation of masonry building stocks. Nat. Hazards 2023, 115, 261–287. [Google Scholar] [CrossRef]
  28. Li, H.; Li, J.; Farhangi, V. Determination of piers shear capacity using numerical analysis and machine learning for generalization to masonry large scale walls. Structures 2023, 49, 443–466. [Google Scholar] [CrossRef]
  29. Valero, E.; Forster, A.; Bosché, F.; Hyslop, E.; Wilson, L.; Turmel, A. Automated defect detection and classification in ashlar masonry walls using machine learning. Autom. Constr. 2019, 106, 102846. [Google Scholar] [CrossRef]
  30. Shahzada, K.; Khan, A.N.; Elnashai, A.S.; Ashraf, M.; Javed, M.; Naseer, A.; Alam, B. Experimental seismic performance evaluation of unreinforced brick masonry buildings. Earthq. Spectra 2012, 28, 1269–1290. [Google Scholar] [CrossRef]
  31. Ravichandran, N.; Losanno, D.; Parisi, F. Comparative assessment of finite element macro-modelling approaches for seismic analysis of non-engineered masonry constructions. Bull. Earthq. Eng. 2021, 19, 5565–5607. [Google Scholar] [CrossRef]
  32. CSI. Analysis Reference Manual; Computers and Structures Inc.: Berkeley, CA, USA, 2014. [Google Scholar]
  33. Thuyet, V.N.; Deb, S.K.; Dutta, A. Mitigation of seismic vulnerability of prototype low-rise masonry building using U-FREIs. J. Perform. Constr. Facil. 2018, 32, 04017136. [Google Scholar] [CrossRef]
  34. Losanno, D.; Ravichandran, N.; Parisi, F. Seismic fragility of base-isolated single-storey unreinforced masonry buildings equipped with classical and recycled rubber bearings in Himalayan regions. J. Build. Eng. 2022, 45, 103648. [Google Scholar] [CrossRef]
  35. Kaushik, H.B.; Rai, D.C.; Jain, S.K. Uniaxial compressive stress–strain model for clay brick masonry. Curr. Sci. 2017, 92, 497–501. [Google Scholar]
  36. Akhaveissy, A.H.; Milani, G. Pushover analysis of large scale unreinforced masonry structures by means of a fully 2D non-linear model. Constr. Build. Mater. 2013, 41, 276–295. [Google Scholar] [CrossRef]
  37. CESMD. Center for Engineering Strong Motion Data, Strong Motion Virtual Data Center. Available online: www.strongmotioncenter.org (accessed on 10 October 2023).
  38. Su, L.; Li, X.L.; Jiang, Y.P. Comparison of methodologies for seismic fragility analysis of unreinforced masonry buildings considering epistemic uncertainty. Eng. Struct. 2020, 205, 110059. [Google Scholar] [CrossRef]
  39. Bakhshi, A.; Karimi, K. Performance evaluation of masonry buildings using a probabilistic approach. Sci. Iran. 2008, 15, 295–307. [Google Scholar]
  40. Choudhury, T.; Milani, G.; Kaushik, H.B. Experimental and numerical analyses of unreinforced masonry wall components and building. Constr. Build. Mater. 2020, 257, 119599. [Google Scholar] [CrossRef]
  41. Giordano, N.; De Luca, F.; Sextos, A. Analytical fragility curves for masonry school building portfolios in Nepal. Bull. Earthq. Eng. 2021, 19, 1121–1150. [Google Scholar] [CrossRef]
  42. Habieb, A.B.; Milani, G.; Tavio, T. Two-step advanced numerical approach for the design of low-cost unbonded fiber reinforced elastomeric seismic isolation systems in new masonry buildings. Eng. Fail. Anal. 2018, 90, 380–396. [Google Scholar] [CrossRef]
  43. Kadam, S.B.; Singh, Y.; Bing, L. Seismic fragility reduction of an unreinforced masonry school building through retrofit using ferrocement overlay. Earthq. Eng. Eng. Vib. 2020, 19, 397–412. [Google Scholar] [CrossRef]
  44. Park, J.; Towashiraporn, P.; Craig, J.I.; Goodno, B.J. Seismic fragility analysis of low-rise unreinforced masonry structures. Eng. Struct. 2009, 31, 125–137. [Google Scholar] [CrossRef]
  45. Sarkar, A.; Halder, L.; Sharma, R.P. Seismic damage evaluation of unreinforced masonry buildings in high seismic zone using the nonlinear static method. Adv. Struct. Eng. Dynam 2015, 2, 1039–1053. [Google Scholar]
  46. Cross, T.; De Luca, F.; De Risi, R.; Camata, G.; Petracca, M. Micro-modelling of stone masonry template buildings as a strategy for seismic risk assessment in developing countries. Eng. Struct. 2023, 274, 114910. [Google Scholar] [CrossRef]
  47. Castaldo, P.; Palazzo, B.; Della Vecchia, P. Seismic reliability of base-isolated structures with friction pendulum bearings. Eng. Struct. 2015, 95, 80–93. [Google Scholar] [CrossRef]
  48. Betti, M.; Galano, L.; Vignoli, A. Time-history seismic analysis of masonry buildings: A comparison between two non-linear modelling approaches. Buildings 2015, 5, 597–621. [Google Scholar] [CrossRef]
  49. Friedman, J.; Hastie, T.; Tibshirani, R. The Elements of Statistical Learning; Springer Series in Statistics; Springer: Berlin/Heidelberg, Germany, 2001. [Google Scholar]
  50. Leo, B.; Jerome, F.; Charles, J.S.; Olshen, R.A. Classification and Regression Trees, 1st ed.; Taylor & Francis: New York, NY, USA; Routledge: Oxfordshire, UK, 2017. [Google Scholar]
  51. Quinlan, J.R. Induction of decision trees. Mach. Learn. 1986, 1, 81–106. [Google Scholar] [CrossRef]
  52. Ho, T.K. The random subspace method for constructing decision forests. IEEE Trans. Pattern Anal. Mach. Intell. 1998, 20, 832–844. [Google Scholar]
  53. Bishop, C.M.; Nasrabadi, N.M. Pattern Recognition and Machine Learning; Springer: New York, NY, USA, 2006. [Google Scholar]
  54. Cristianini, N.; Shawe-Taylor, J. An Introduction to Support Vector Machines and Other Kernel-Based Learning Methods; Cambridge University Press: Cambridge, UK, 2000. [Google Scholar]
  55. Cortes, C.; Vapnik, V. Support-vector networks. Mach. Learn. 1995, 20, 273–297. [Google Scholar] [CrossRef]
  56. Rasmussen, C.E.; Williams, C.K. Gaussian Processes for Machine Learning; MIT Press: Cambridge, UK, 2006. [Google Scholar]
  57. Haykin, S. Neural Networks—A Comprehensive Foundation, 2nd ed.; Pearson Prentice Hall: Noida, India, 2004. [Google Scholar]
  58. Friedman, N.; Geiger, D.; Goldszmidt, M. Bayesian network classifiers. Mach. Learn. 1997, 29, 131–163. [Google Scholar] [CrossRef]
  59. Lachenbruch, P.A.; Goldstein, M. Discriminant analysis. Biometrics 1979, 35, 69–85. [Google Scholar] [CrossRef]
  60. Cover, T.; Hart, P. Nearest neighbor pattern classification. IEEE Trans. Inf. Theory 1967, 13, 21–27. [Google Scholar] [CrossRef]
  61. Hu, L.Y.; Huang, M.W.; Ke, S.W.; Tsai, C.F. The distance function effect on k-nearest neighbor classification for medical datasets. SpringerPlus 2016, 5, 1304. [Google Scholar] [CrossRef]
  62. Hastie, T.; Rosset, S.; Zhu, J.; Zou, H. Multi-class adaboost. Stat. Interface 2009, 2, 349–360. [Google Scholar] [CrossRef]
Figure 1. Methodology of the study.
Applsci 15 01686 g001
Figure 2. Typical URM building with reinforced concrete slab in India.
Applsci 15 01686 g002
Figure 3. Plan of the benchmark URM building [30,31].
Applsci 15 01686 g003
Figure 4. (a) FE model of the benchmark URM building; (b) normal stress–strain curve; and (c) shear stress–strain curve.
Applsci 15 01686 g004
Figure 5. Variation of PGA for the selected ground-motion records with (a) moment magnitude; and (b) epicentral distance.
Applsci 15 01686 g005
Figure 6. Limit-states definition of the URM building.
Applsci 15 01686 g006
Figure 7. Distribution of the damage states in the developed database.
Applsci 15 01686 g007
Figure 8. Actual response and predicted response by the regression models: (a) LR, (b) SLR, (c) RR, (d) DT, (e) RF, (f) SVM, (g) GPR, and (h) NN.
Applsci 15 01686 g008
Figure 9. Comparison of results of training and test sets of regression models: (a) R 2 values and (b) RMSE values.
Applsci 15 01686 g009
Figure 10. Percentage variations for the (a) R 2 and (b) RMSE values of the training and test sets of the regression models.
Applsci 15 01686 g010
Figure 11. Confusion matrices for the classification models in terms of damage state identification: (a) NB, (b) DA, (c) KNN, (d) DT, (e) RF, (f) AB, (g) SVM, and (h) NN.
Applsci 15 01686 g011
Figure 12. Comparison of results of the classification models: (a) accuracy, (b) F1 score, (c) precision, and (d) recall.
Applsci 15 01686 g012
Figure 13. Relative importance of input parameters affecting the Random Forest classification model.
Applsci 15 01686 g013
Table 1. Comparisons of the fundamental frequencies of the URM building.
ModeFrequency (Hz)
Detailed 3D Solid Element Model [31]Layered Shell Element Model [Present Study]
18.608.61
29.439.68
314.0415.04
Table 2. Masonry: material properties [38,39,40,41,42,43,44,45,46].
Material PropertiesMeanCoVRange
Mass density (kg/m3)17780.07[1272, 2013]
Compressive strength (MPa)4.790.39[1.11, 8.67]
Tensile strength (MPa)0.250.61[0.03, 0.43]
Shear strength (MPa)0.200.58[0.02, 0.63]
Young’s modulus (MPa)16690.62[620, 2982]
Table 3. Performance of the prediction models.
ModelTrainingTest
R 2 Adjusted   R 2 RMSE R 2 Adjusted   R 2 RMSE
Linear Regression (LR)0.8780.8770.5560.8620.8580.596
Stepwise Linear Regression (SLR)0.8770.8760.5580.8600.8570.601
Ridge Regression (RR)0.8060.8040.7000.8180.8140.677
Decision Tree (DT)0.9660.9660.2890.9230.9210.476
Random Forest (RF)0.9780.9780.2260.9450.9430.410
Support Vector Machine (SVM)0.9690.9680.2810.9580.9570.317
Gaussian Process Regression (GPR)0.9760.9760.2480.9740.9730.257
Neural Networks (NN)0.9780.9770.2390.9720.9720.307
Table 4. Performance of classification models in identifying the damage state of a URM building.
ModelAccuracy (%)Misclassification RateTraining ErrorF1 Score
DS1DS2DS3DS4
NB85.80.14200.109883.8678.9270.0394.52
DA83.30.16670.103289.6283.2159.6891.34
KNN89.80.1019089.6287.0673.6996.10
DT88.50.11420.050390.3189.4871.8293.55
RF92.90.0710093.3391.6681.0396.60
AB91.10.08950.001393.3389.0579.3795.79
SVM87.70.12350.002671.9685.3073.2094.85
NN92.60.07410.132393.3391.0481.0396.90
Disclaimer/Publisher’s Note: The statements, opinions and data contained in all publications are solely those of the individual author(s) and contributor(s) and not of MDPI and/or the editor(s). MDPI and/or the editor(s) disclaim responsibility for any injury to people or property resulting from any ideas, methods, instructions or products referred to in the content.

