Article

Experiment and Analytical Model for Pore Structure of Early-Age Composite Cement Pastes by LF-NMR

1
College of Civil and Transportation Engineering, Hohai University, Nanjing 210098, China
2
China Railway Shanghai Design Institute Group Corporation Limited, Shanghai 200000, China
*
Author to whom correspondence should be addressed.
Appl. Sci. 2025, 15(3), 1650; https://doi.org/10.3390/app15031650
Submission received: 3 January 2025 / Revised: 22 January 2025 / Accepted: 24 January 2025 / Published: 6 February 2025
(This article belongs to the Special Issue Sustainable Asphalt Pavement Technologies)

Abstract

:
This study investigated mineral admixtures that are often utilized as replacements for cement in high-performance concrete with a view to enhancing their durability and workability. The properties of concrete are closely related to the structure of its pores. This research employed low-field nuclear magnetic resonance technology to explore the influence of water-to-cement ratio, curing time, and mineral admixture content on the pore structure of early-age cement pastes. The findings indicated that the pore size distribution curves of all composite cement pastes display a distinct bimodal nature. The size of gel pores increases with a higher water-to-cement ratio, but decreases as the curing period extends. Fly ash, slag, and silica fume improve the pore structure at 14 days, 7 days, and 3 days, respectively. The addition of admixtures has little effect on the most probable pore diameter, but raises the proportion of gel pores with increasing content. In order to better fit the experimental data, a bimodal model integrating Shimomura and Maekawa’s model with the Weibull distribution function was introduced to describe the pore structure of cement pastes with or without fly ash, slag, and silica fume.

1. Introduction

Concrete is a material that plays a fundamental role in engineering projects due to its versatility, durability, and cost-effectiveness. However, cracks often develop at early ages [1], which can significantly compromise the safety and durability of concrete structures [2]. Fly ash, slag, and silica fume are industrial by-products that can negatively impact the environment and human health when directly disposed of in landfills or oceans [3,4,5]. However, these materials are also widely considered volcanic ash additives, which can improve their workability, mechanical properties, and resistance to volume deformation when added to concrete [6]. Moreover, the replacement of cement with these pozzolanic materials can save energy and reduce emissions [7]. The characteristics of concrete blended with fly ash, slag, and silica fume have been studied widely [8,9].
Current research on concrete incorporating supplementary cementitious materials such as fly ash, slag, and silica fume primarily focuses on their macroscopic properties, including permeability, shrinkage, strength, and durability [10,11,12]. However, pore structure is a critical characteristic of cement-based materials (CBMs), as it directly influences macroscopic properties and plays a key role in the crack resistance and long-term durability of concrete [13] Moreover, mineral admixtures like fly ash, slag, and silica fume significantly impact the pore structure [14,15,16]. In the case of fly ash, its reaction reduces the pore size in concrete, resulting in a denser pore structure. Prinya et al. [17] demonstrated that the fineness of fly ash has a substantial effect on the pore structure of blended cement paste, and the uniform distribution of its particles can further optimize pore size and distribution. With latent hydraulicity, slag forms a group of cement with better reactivity and performance combined with Portland cement. Many studies focusing on the properties of slag-blended cement have been carried out. Zhou [18] found that slag accelerated the hydration of cement and refined the pore structure of cement pastes. Song et al. [19] studied the shrinkage of cement pastes blended with slag. The results showed that the replacement of slag can effectively restrain the shrinkage of cement pastes. Silica fume has been found to reduce the pore size of cement pastes due to its extremely fine particles and high activity. Yajuun et al. [20] examined the effect of silica fume on the microstructure of cement pastes and found that its addition resulted in a finer pore structure compared to ordinary Portland cement (OPC) paste. In spite of extensive research on pore structures of composite cement pastes, a proper model to evaluate the effect of mineral addition on pore structure have not been established.
As for the technology of microstructure measurement, there are many methods to characterize pore structures, such as mercury intrusion porosimetry (MIP), BET, and scanning electron microscopy (SEM). MIP is the most widely adopted method for research on pore structure. However, MIP has limitations. Firstly, it measures the largest entrance to a pore rather than the actual internal size, and secondly, it cannot be used to analyze closed pores, as mercury cannot enter these pores. Nitrogen adsorption and BET analysis are also widely used for testing microporous materials [21,22]. However, there are arguments about the application of nitrogen adsorption in studying the surface area of cement paste [23]. The controversy surrounding nitrogen includes the “bottleneck” theory that nitrogen molecules would be excluded from pores with small openings due to their being larger than water particles [24]. The pre-drying of specimens would cause damage to pores. SEM is extremely useful in examining the microstructure of mortars and concretes [25]. It can directly capture images of pores for analysis. However, this method analyses information on 2D cross sections and may have a one-sided expression on pore structure. Moreover, SEM is unable to recognize gel pores due to the limitations of microscope magnification. NMR reflects the characteristics of pore structure by testing hydrogen protons’ relaxation time of water in pores [26,27,28]. Compared to the methods mentioned above, nuclear magnetic resonance has the advantages of being non-invasive and non-destructive, since NMR methods do not require drying of the paste, which would destroy the C-S-H gel structure, and can observe the gel pores. As a new method for investigating the pore structure of cementitious materials, NMR has been widely adopted. Halperin et al. [29,30] applied progressive drying to determine the surface relaxation rate and tested the pore structure of cementitious materials by NMR. Their comprehensive descriptions of the pore distribution are instructive. Zhao [31] investigated the pore structure of cement pastes with high-volume fly ash and highlighted that nuclear magnetic resonance (NMR) technology has distinct advantages over mercury intrusion porosimetry (MIP) in analyzing capillary and gel pores. In particular, NMR exhibits significantly higher sensitivity than MIP when examining fine pores and gel pores. Pamela et al. [32] studied the effect of the drying method on water content and pore size of cementitious materials by NMR, and compared this with the results by MIP and N2 gas adsorption measurements. The results showed that water content decreased significantly as the pore size distribution varied. NMR was able to reveal the weak change in pore size distribution, while MIP and N2 gas adsorption failed.
In this study, low-field nuclear magnetic resonance (LF-NMR) technology was used to investigate the effects of water-to-cement ratio, curing time, and mineral admixture content (such as fly ash, slag, and silica fume) on the pore structure of early-age cement pastes. To more accurately fit the experimental data, an improved bimodal model was introduced, combining the Shimomura and Maekawa models with the Weibull distribution function. This model provides a better description of the influence of various admixtures on the pore structure of cement pastes. Using this model, the evolution of the pore structure of cement pastes, both with and without the incorporation of mineral admixtures like fly ash, slag, and silica fume, was analyzed.

2. Experimental Materials and Methodology

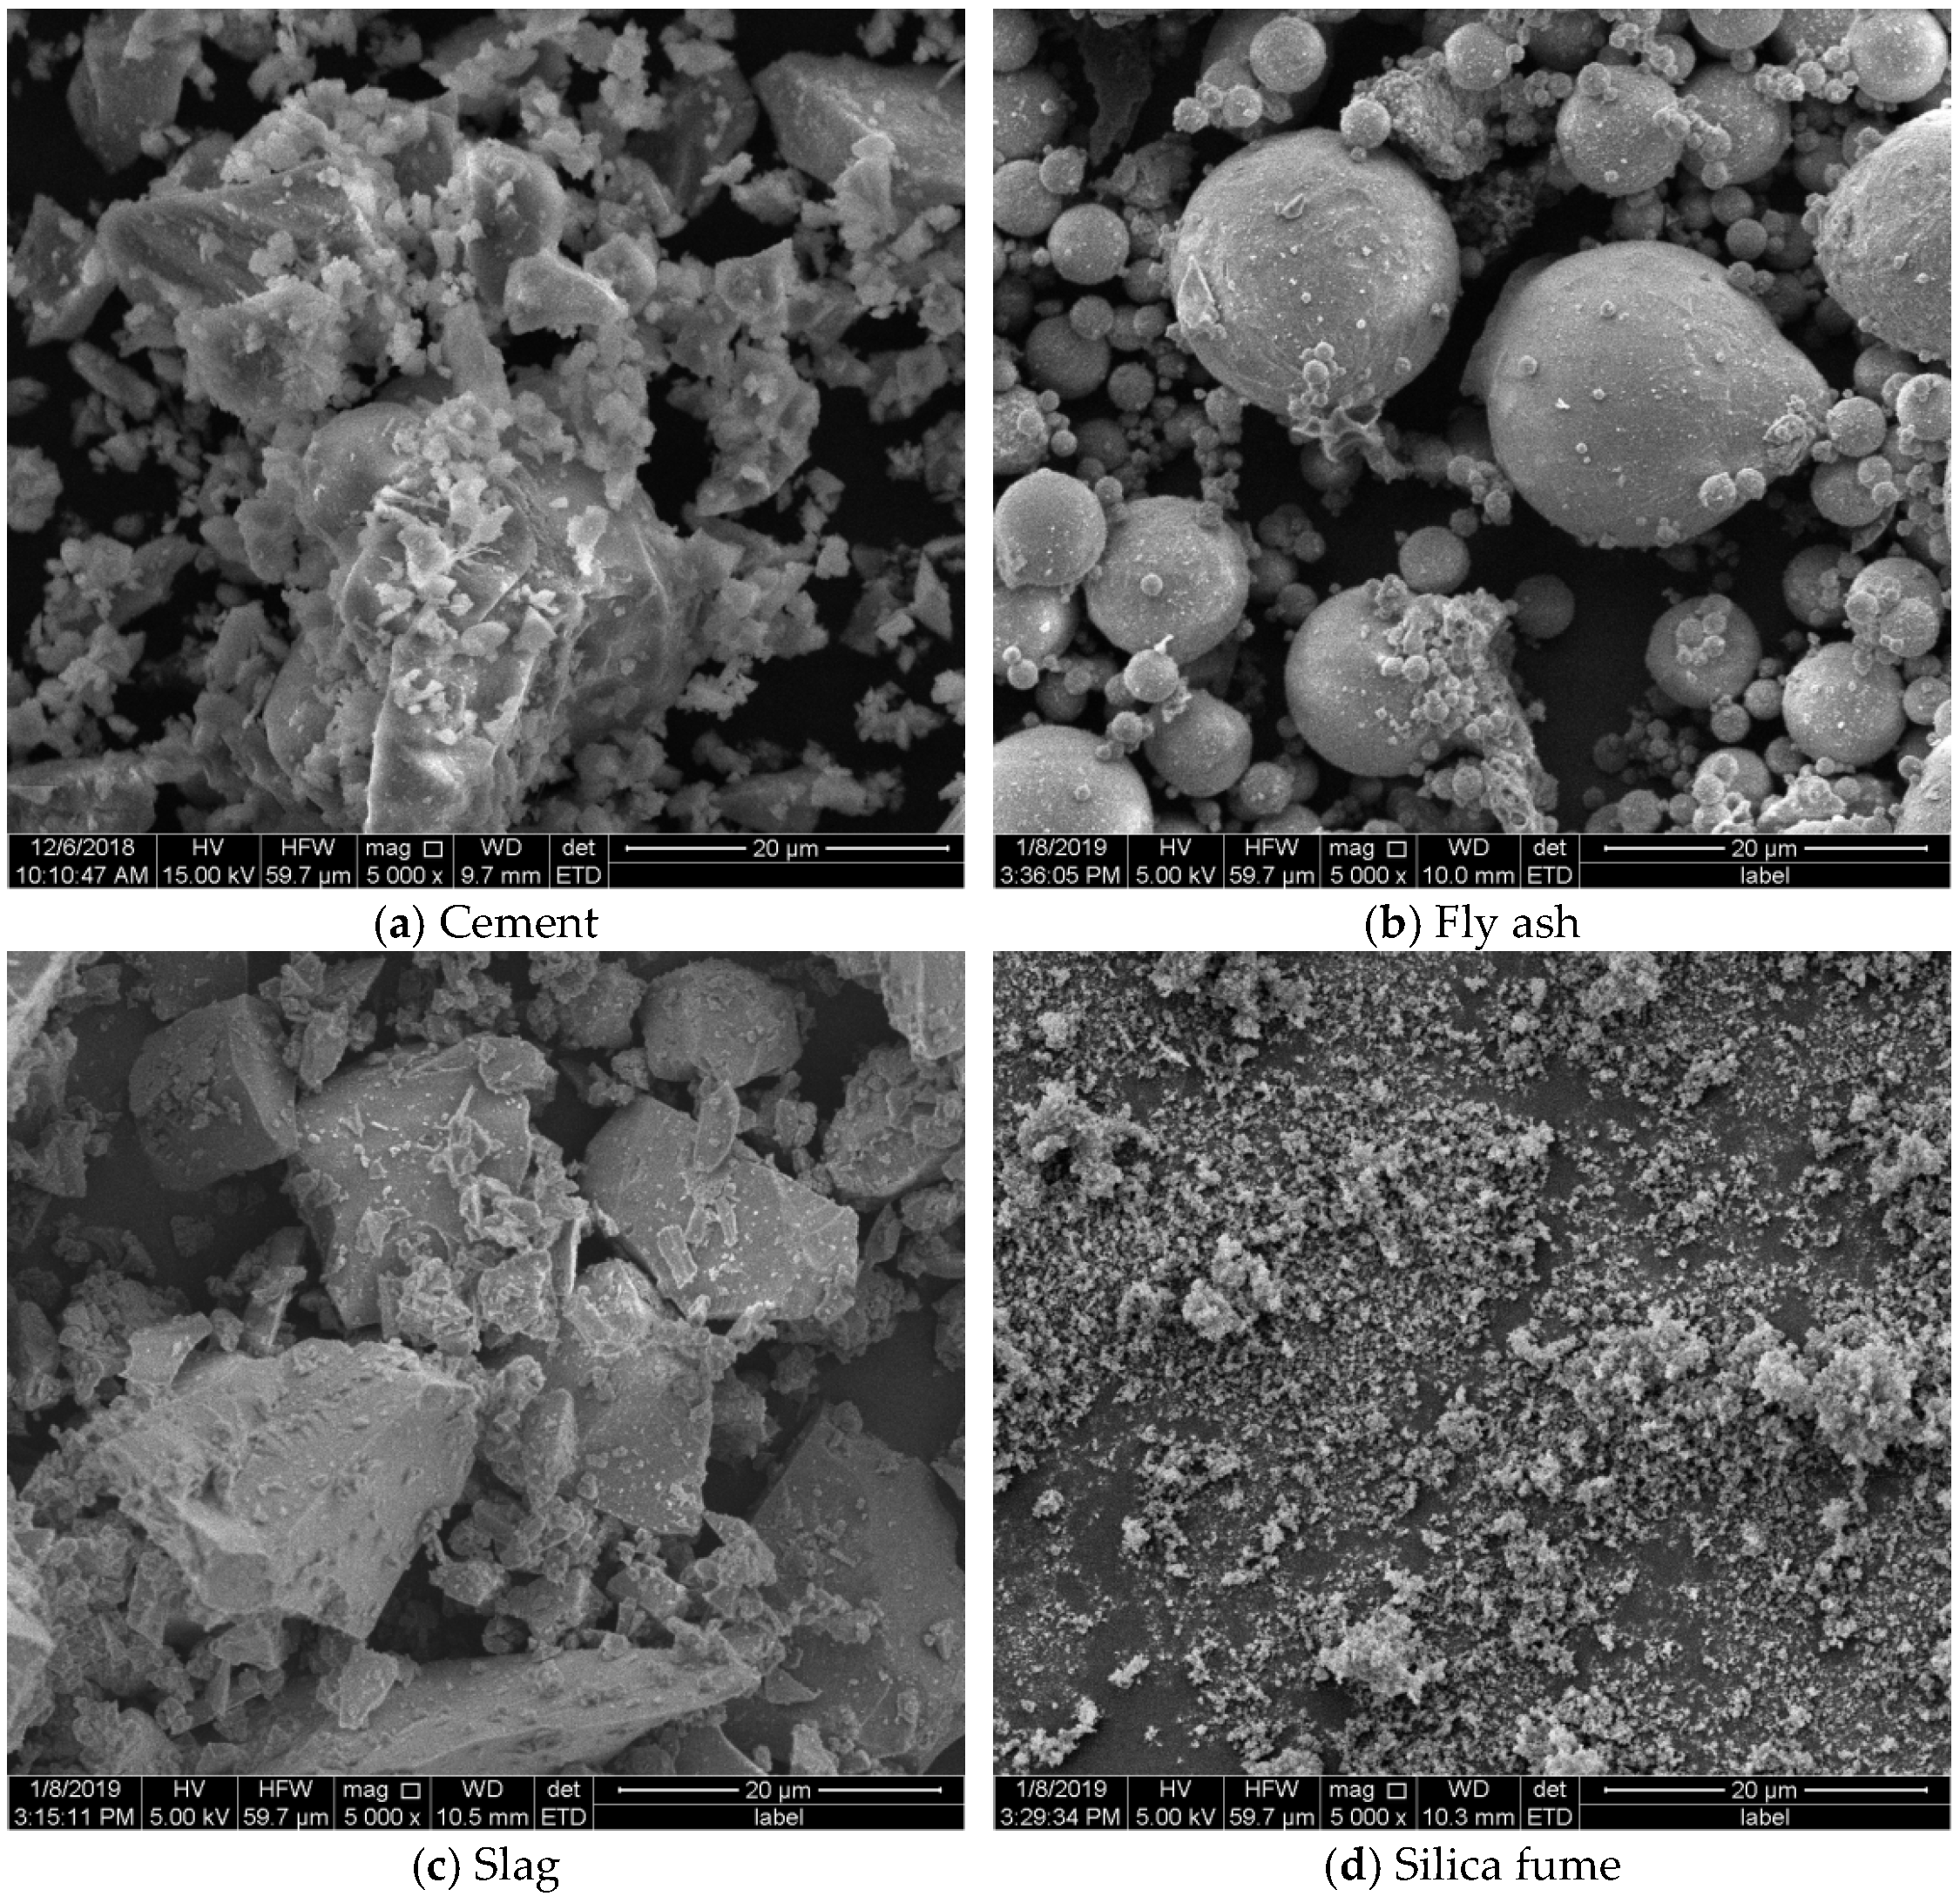
2.1. Experimental Materials

PII 52.5 Anhui Wuhu Conch-brand Portland cement was used. The specific surface area of the cement was determined by the gas adsorption method to be 373 m2/kg, with a density of 3180 kg/m3. Additionally, fly ash, silica fume, and slag were incorporated as supplementary cementitious materials, with densities of 2160 kg/m3, 2200 kg/m3, and 3056 kg/m3, respectively. The chemical compositions of the cement and the materials containing cement are summarized in Table 1, highlighting their key chemical characteristics and their potential influence on the performance of cement-based materials. To further characterize the particle properties of these materials, Figure 1 presents scanning electron microscope (SEM) images showing the particle morphology of cement, fly ash, slag, and silica fume. These images clearly illustrate the shape and surface characteristics of the different materials.
In this study, in order to study the influence of different water-to-cement (w/c) ratios on the pore size distribution (PSD) curve and the most probable pore diameter of cement slurry, the w/c ratios of the neat cement pastes were set to 0.3, 0.35, and 0.4, while the water-to-binder (w/b) ratio for the composite cement pastes was uniformly set to 0.4. The fly ash content was 15% and 30%. The slag content was 15% and 30%, and the silica fume content was 5% and 10%. Table 2 presents the mixture proportions of both neat and composite cement pastes. In this table, WC represents the neat cement pastes, while FA, SL, and SI represent the composite cement pastes blended with fly ash, slag, and silica fume, respectively. For example, WC30 refers to a paste with a w/c ratio of 0.3, while FA15 refers to a composite paste with a w/b ratio of 0.4 and 15% fly ash content.
The specific steps of this experiment were as follows. The required amounts of cement, water, and additives were accurately measured. After the cement and additives were thoroughly mixed in the planetary mixer, water was gradually added to the cementitious materials in the mixer. Subsequently, the mixture was stirred at a speed of 140 revolutions per minute (rpm) for 1 min to ensure uniform mixing of the materials. Then, the mixing procedure was paused for 30 s to scrape the adhered paste on the sidewall of the mixing container. The paste was cast into a 2 cm × 2 cm square mold after another mixing at 285 rpm for 2.5 min. The specimens were sealed for 24 h at room temperature (approximately 20 °C) before being molded. After being molded, the specimens were sealed for instant curing. Subsequently, the specimens were cured under standard conditions for the prescribed durations of 3, 7, 14, and 28 days.

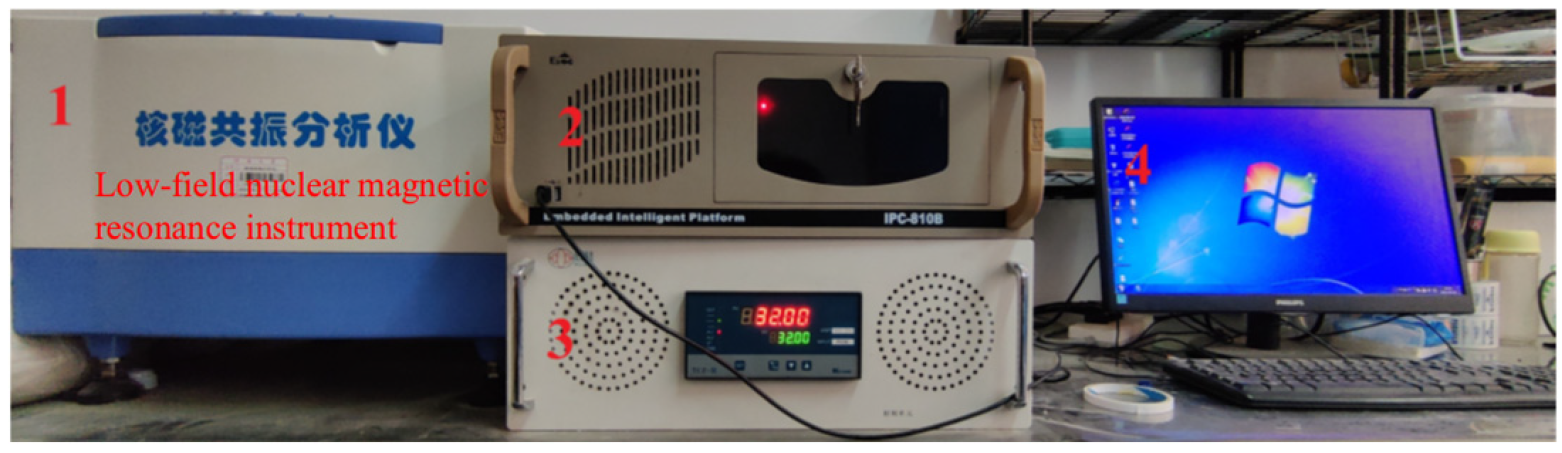
2.2. Experiment Method

In this experiment, the PQ001 LF-NMR spectrometer in Figure 2, manufactured by Niumag Corporation (Suzhou, China), was utilized. The equipment consists of a control unit, a magnet unit, an industrial control computer integrated with a spectrometer system, and a temperature control unit. Specimens were inserted into cylindrical glass tubes measuring 27 mm in diameter and 200 mm in length for LF-NMR analysis.
After powering on, the free induction decay (FID) sequence was first used to calibrate the standard oil sample, obtaining the frequency offset (O1) of the radio-frequency signal and the 90° pulse width (P1). Subsequently, the transverse relaxation time (T2) of the samples was measured using the LF-NMR spectrometer. Before testing, the parameters of the FID and Carr–Purcell–Meiboom–Gill (CPMG) sequences were configured, as detailed in Table 3.
Studies by Zhao et al. [31] and She et al. [33] indicated that the pore diameter of cement pastes can be determined using the LF-NMR transverse relaxation time T2, as represented by the following equation:
d = C T 2
where d represents the pore diameter, nm; T2 denotes the transverse relaxation time of the water molecules at the pore surface, ms, and C is the conversion factor—48 nm/ms.

3. Results and Discussion

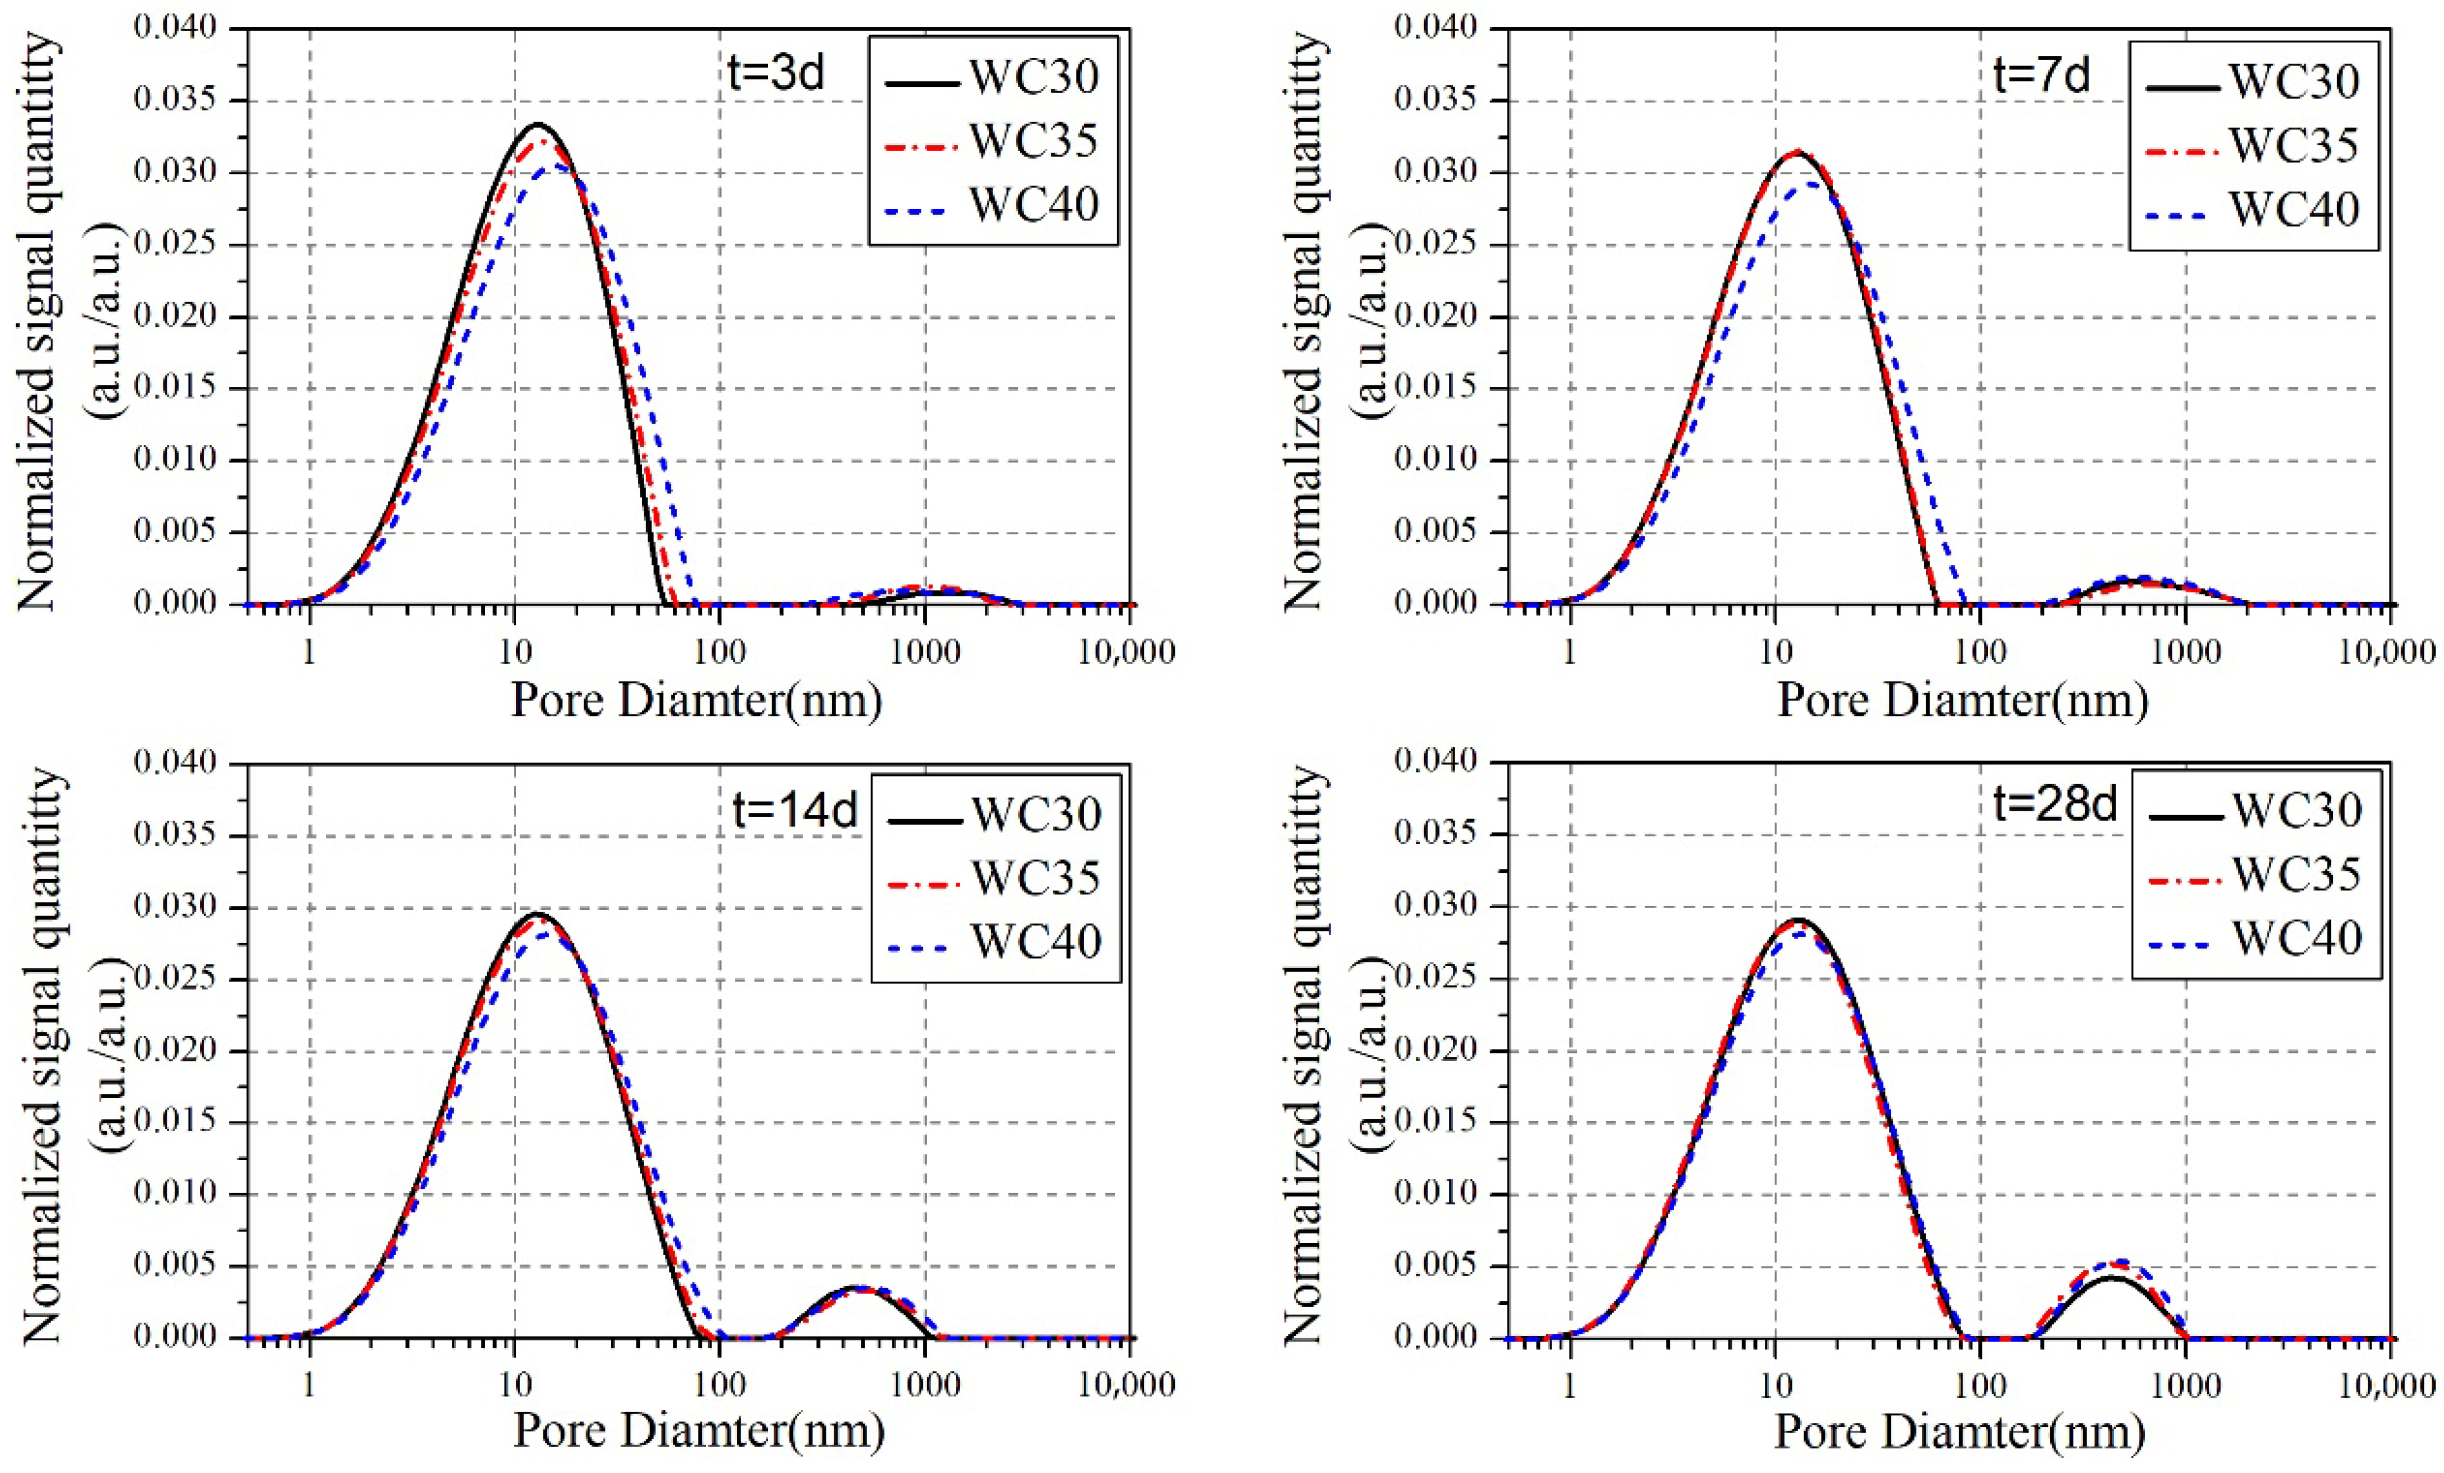
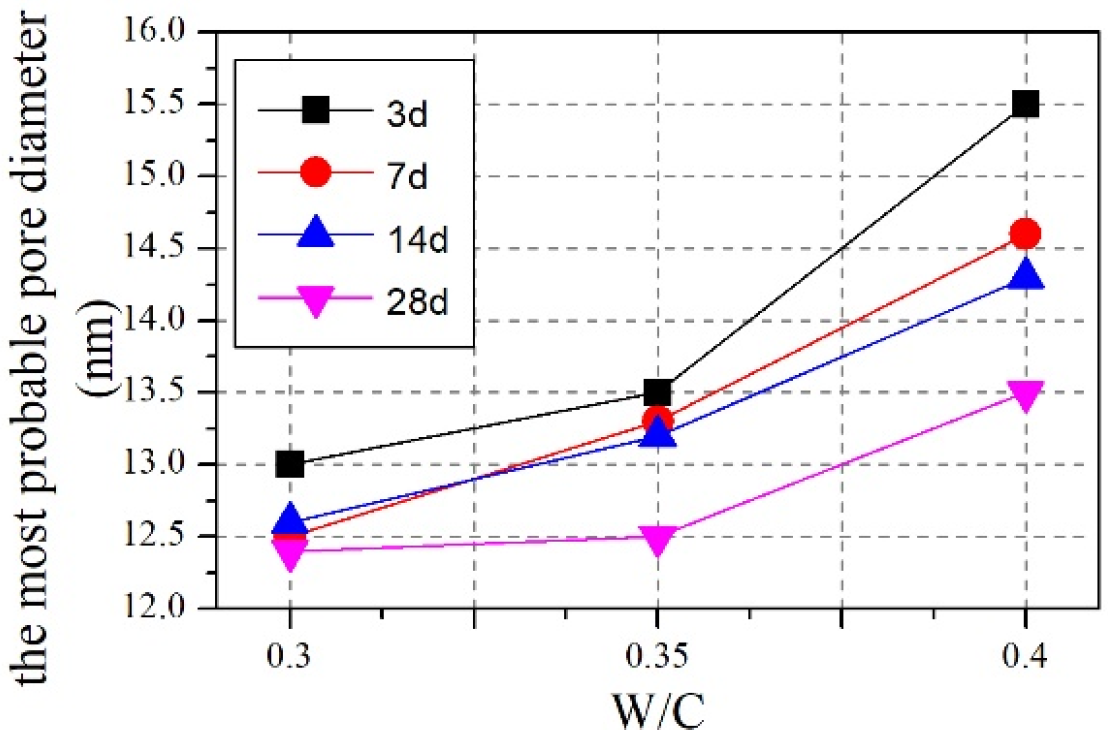
3.1. Pore Characteristics of Neat Cement Pastes

Figure 3 illustrates the pore size distribution (PSD) of neat cement pastes with varying w/c ratios cured under standard conditions for 3, 7, 14, and 28 days. The PSD curves of WC30, WC35, and WC40 contain two peaks, and the height and area of the left peaks are bigger than the ones of the right peak. According to the research of Jehng et al. [30], the larger peak indicates the gel pores, whereas the smaller peak signifies the capillary pores. As w/c increases, the curves of the PSD shift to the right, and the area of the gel pore decreases. This is because larger w/c causes larger water content and much less cementitious materials in unit volume, leading to the generation of sparse structure and larger pores. Moreover, the changes in gel pores are more significant at 3 and 7 days than those of 14 and 28 days.
Figure 4 illustrates the most probable pore diameter (MPPD, corresponding to the left peak) under different w/c ratios. The MPPD grows as the w/c ratio rises. Furthermore, higher w/c ratios result in more pronounced changes in the MPPD. For example, in the case of WC30, the MPPD decreases by 0.8 nm from 3 to 28 days, while for WC35 and WC40, the reductions are 1.0 nm and 2.0 nm, respectively. A higher w/c ratio may lead to a coarser pore size distribution in the paste, reflected in more significant changes in pore diameter trends. This trend highlights that controlling the w/c ratio is not only crucial for optimizing the early-stage performance of cement-based materials but also plays a vital role in enhancing their long-term durability and density.
Figure 5 illustrates the variation in the MPPD over time. As shown in the figure, the MPPD increases with a higher w/c ratio at the same age. However, as the curing age progresses, the MPPD generally decreases for all neat cement paste samples. This change is primarily attributed to the ongoing hydration reaction, which generates more hydration products and results in a denser pore structure. Moreover, the difference in the MPPD between samples with different w/c ratios gradually diminishes as the curing age increases. For example, at 3 days and 28 days, the difference in the MPPD between WC40 and WC30 is 2.5 nm and 1.1 nm, respectively. Additionally, the rate of decrease in pore diameter varies significantly between different w/c ratios. The decrease rate of WC40 from 3 days to 28 days is 0.08 nm/day, whereas the decrease rate of WC35 and WC30 are 0.04 nm/day and 0.02 nm/day, respectively.

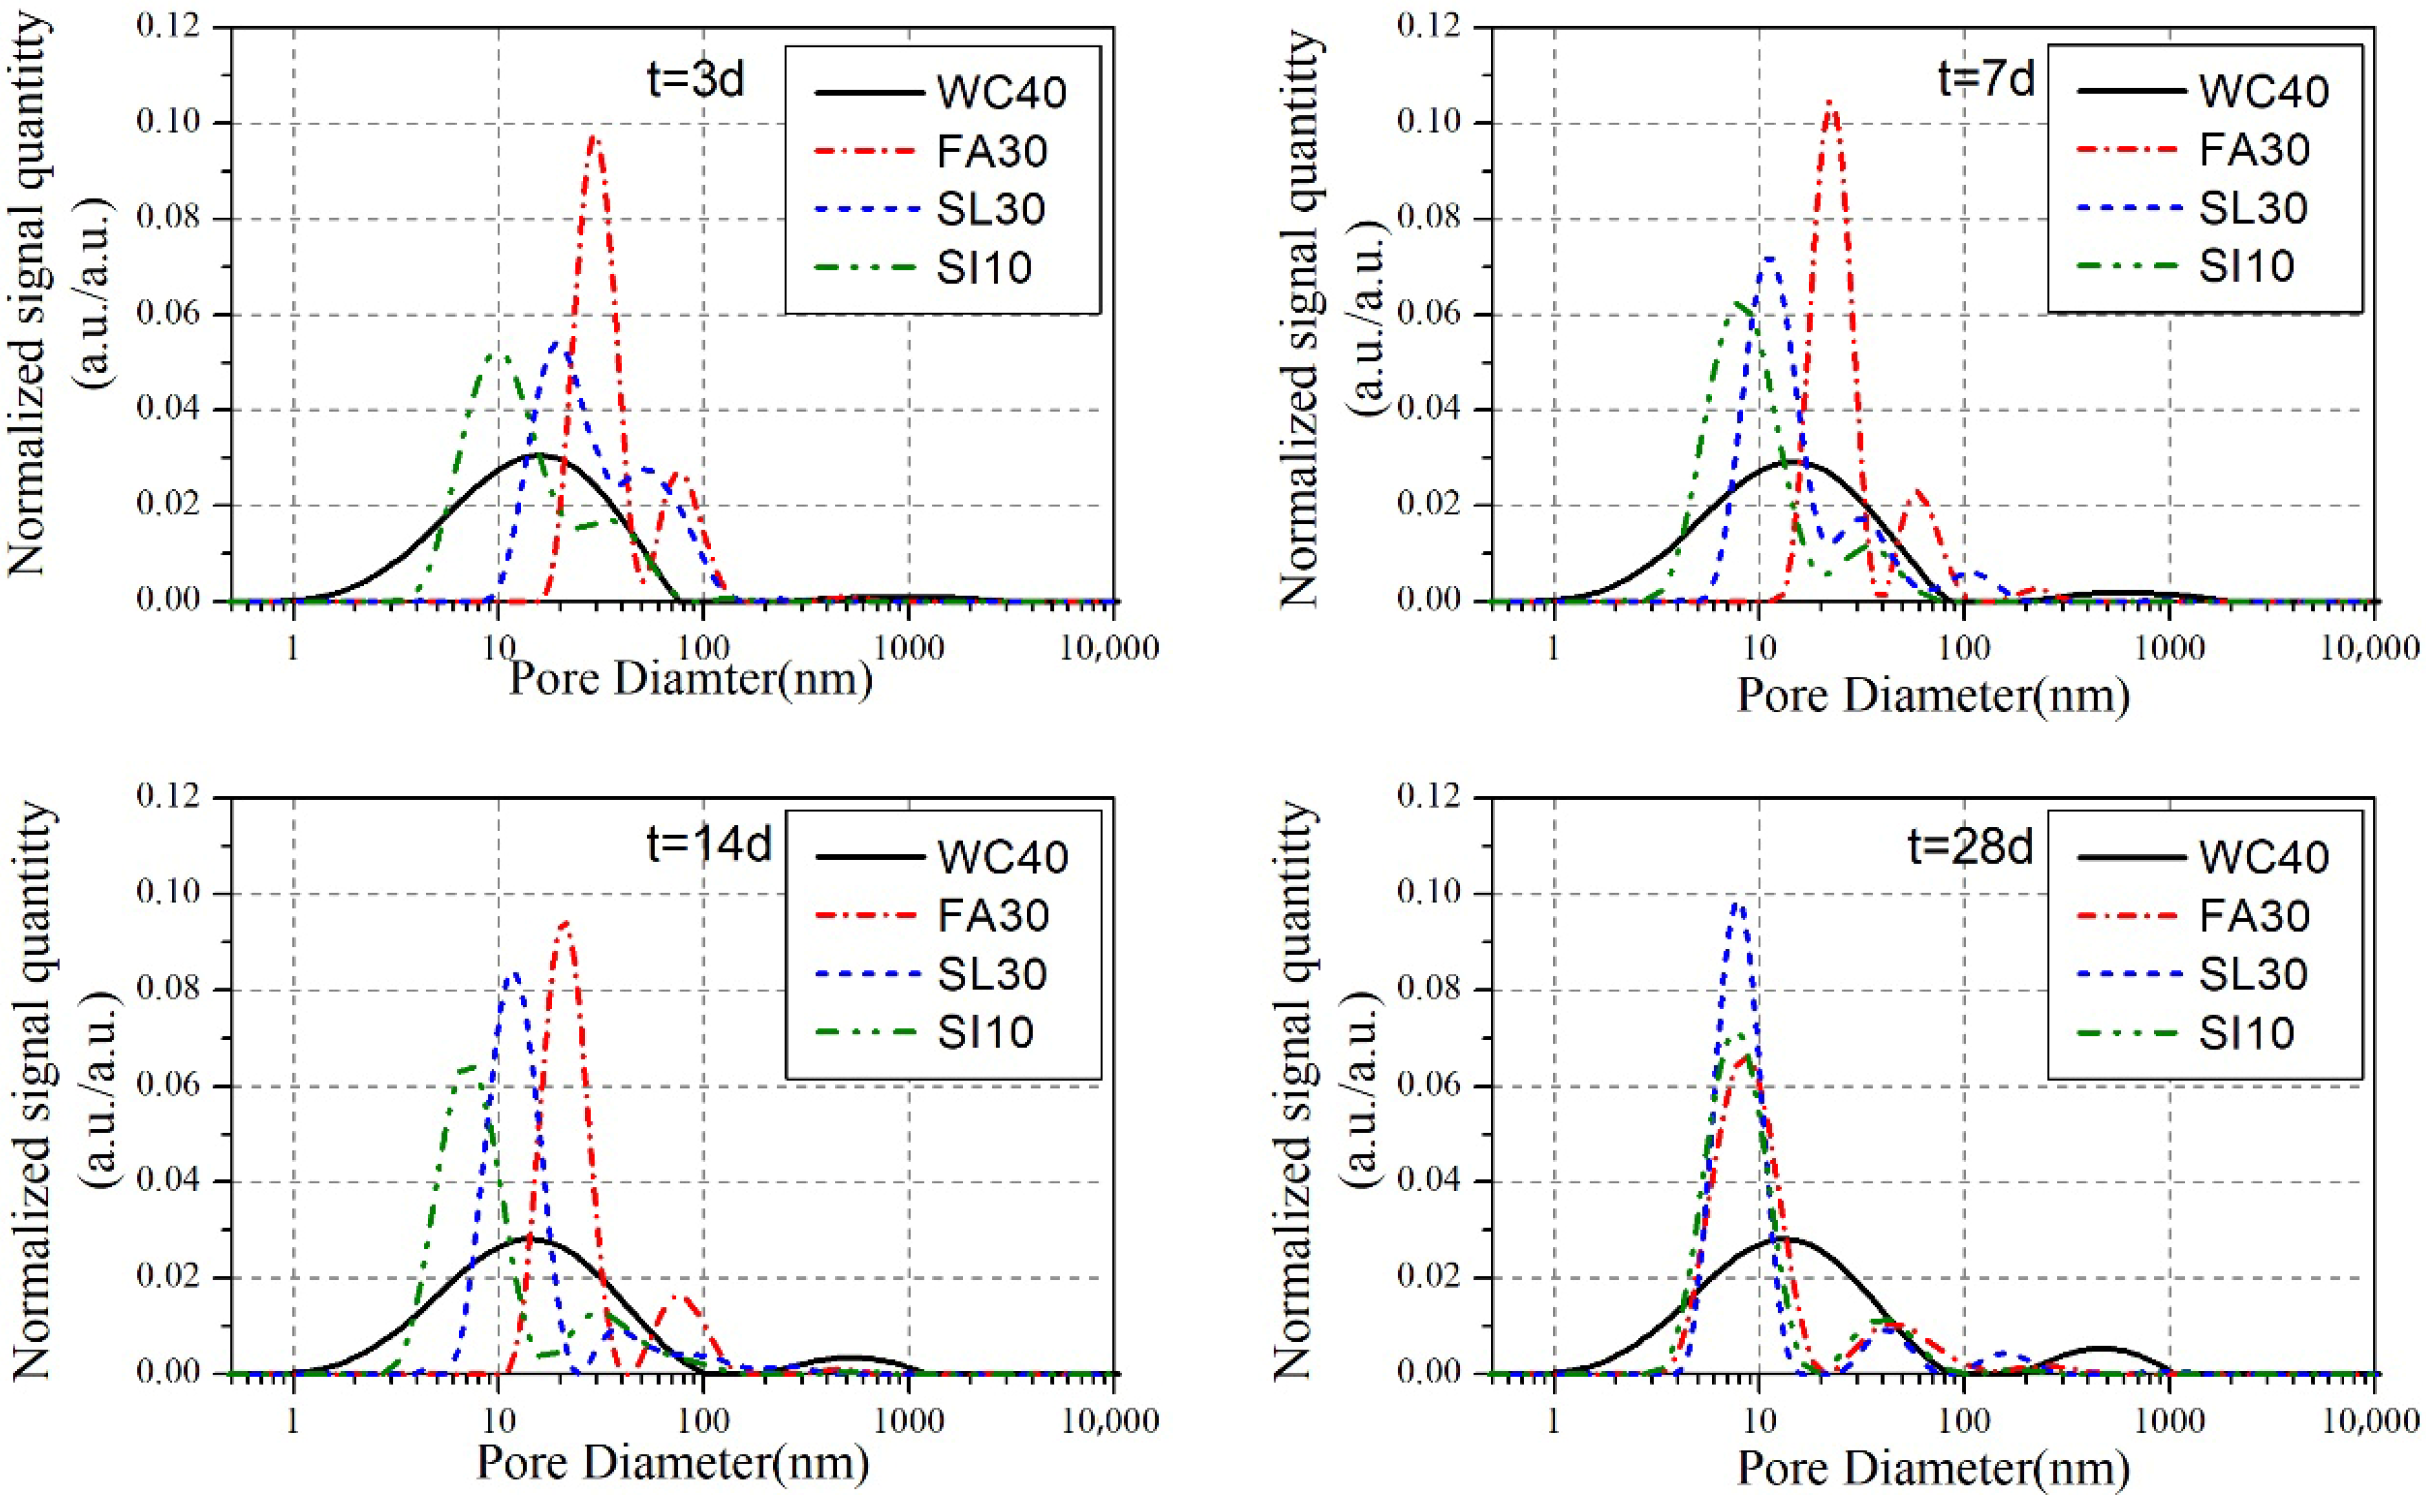
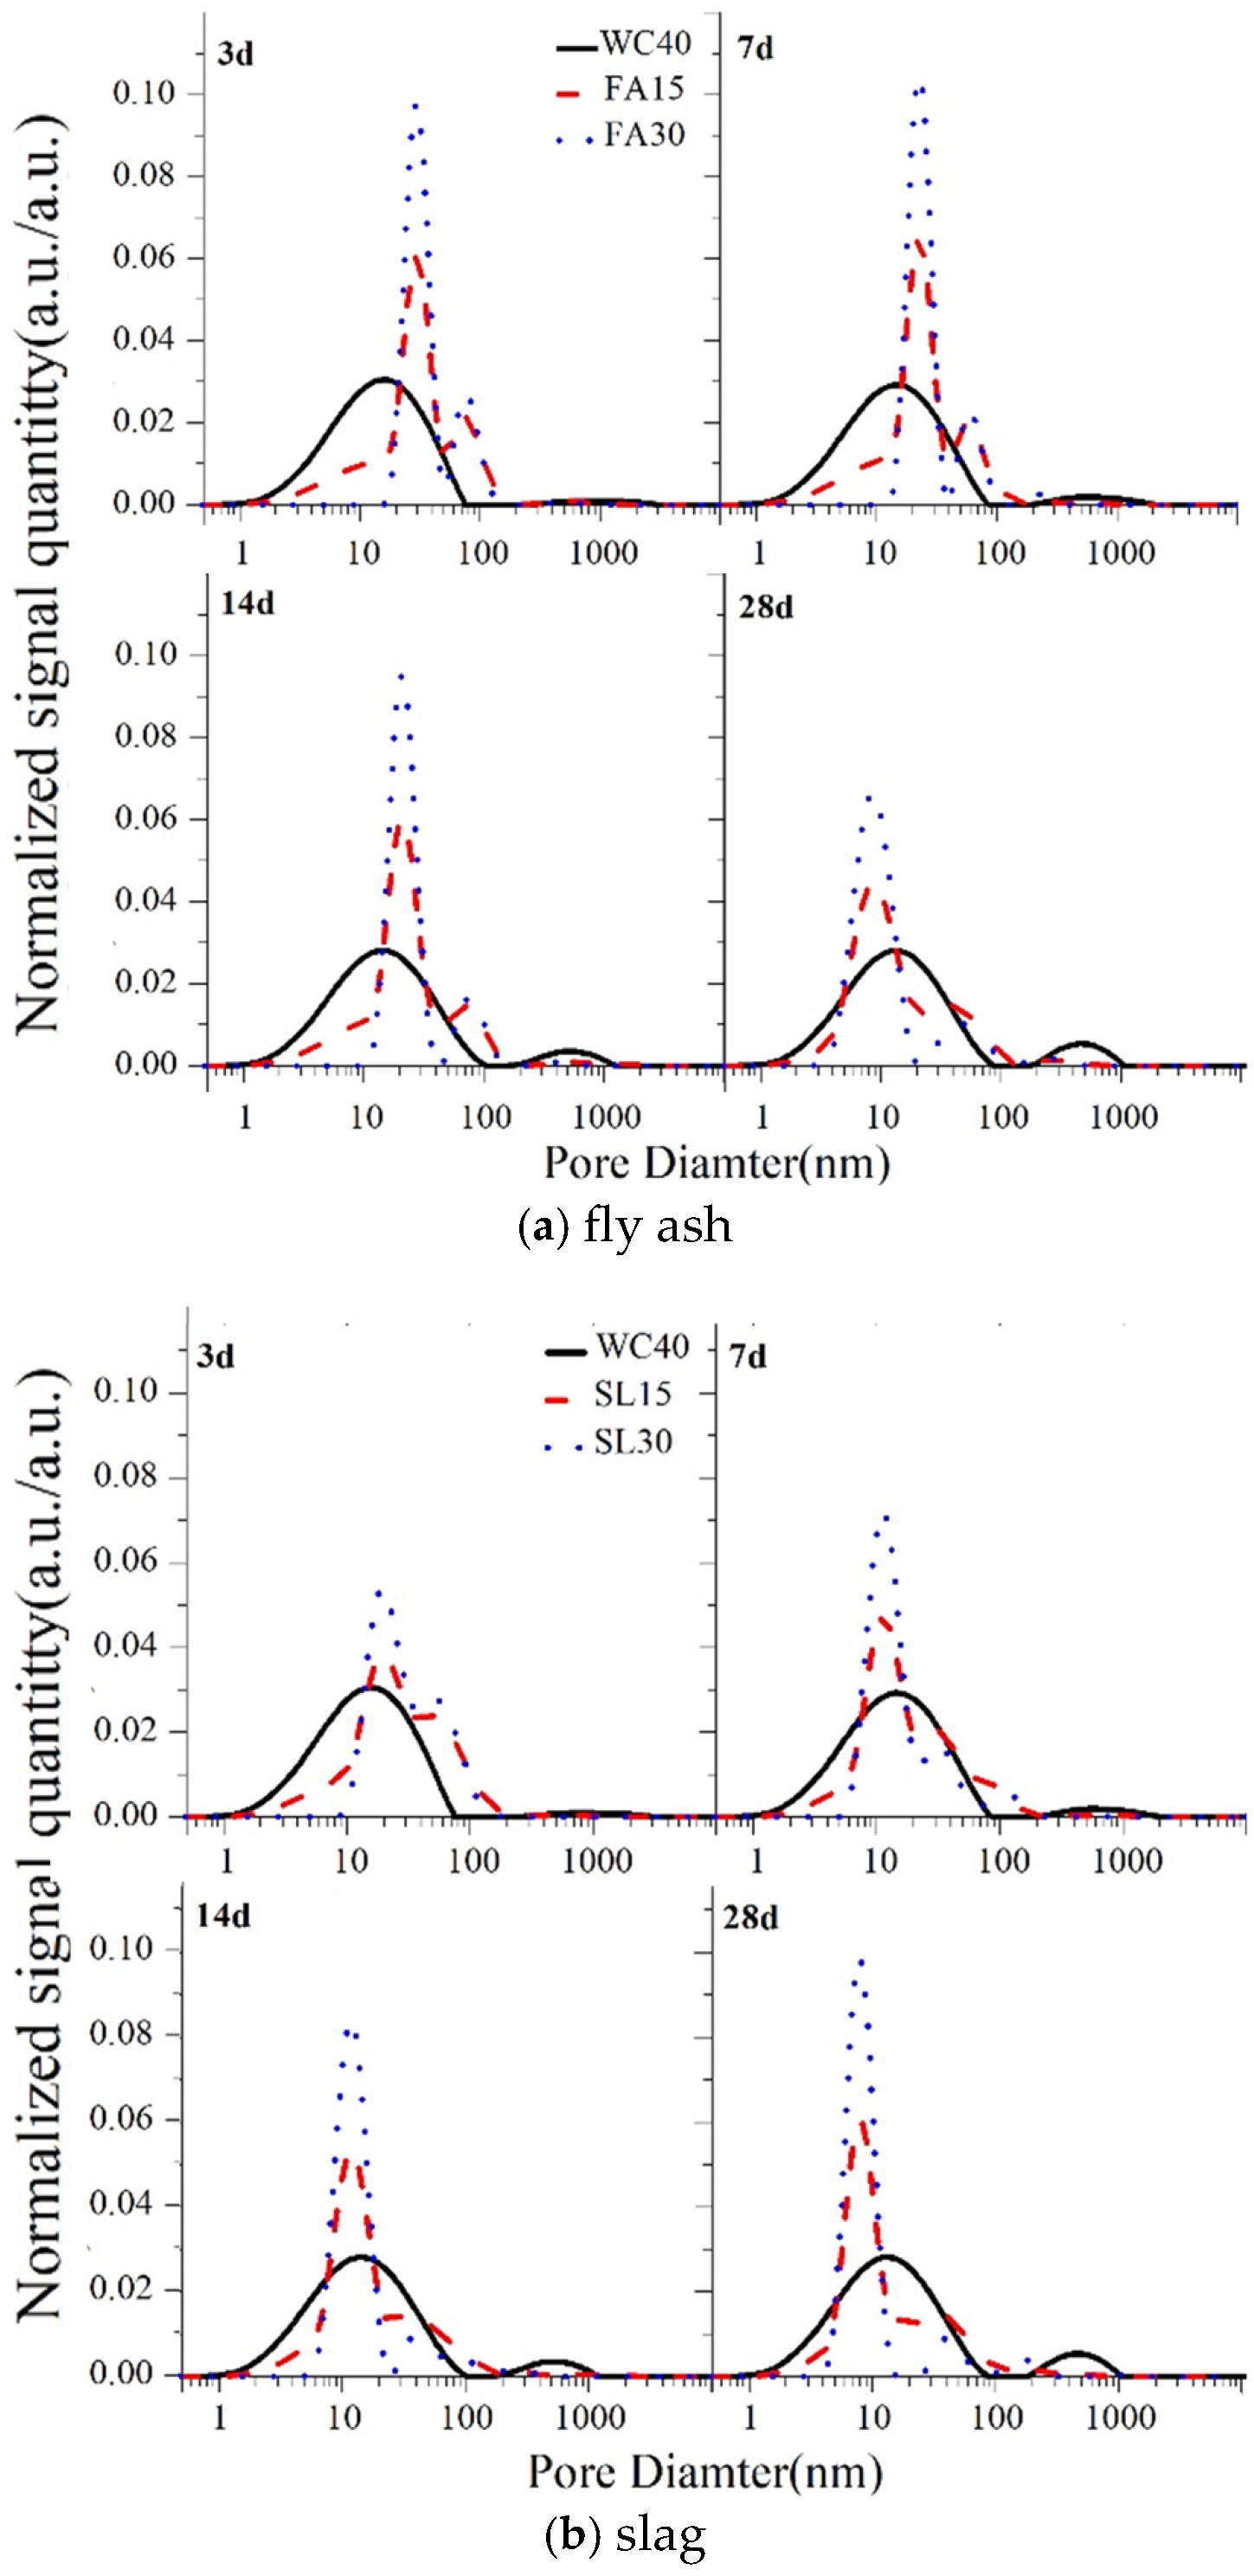
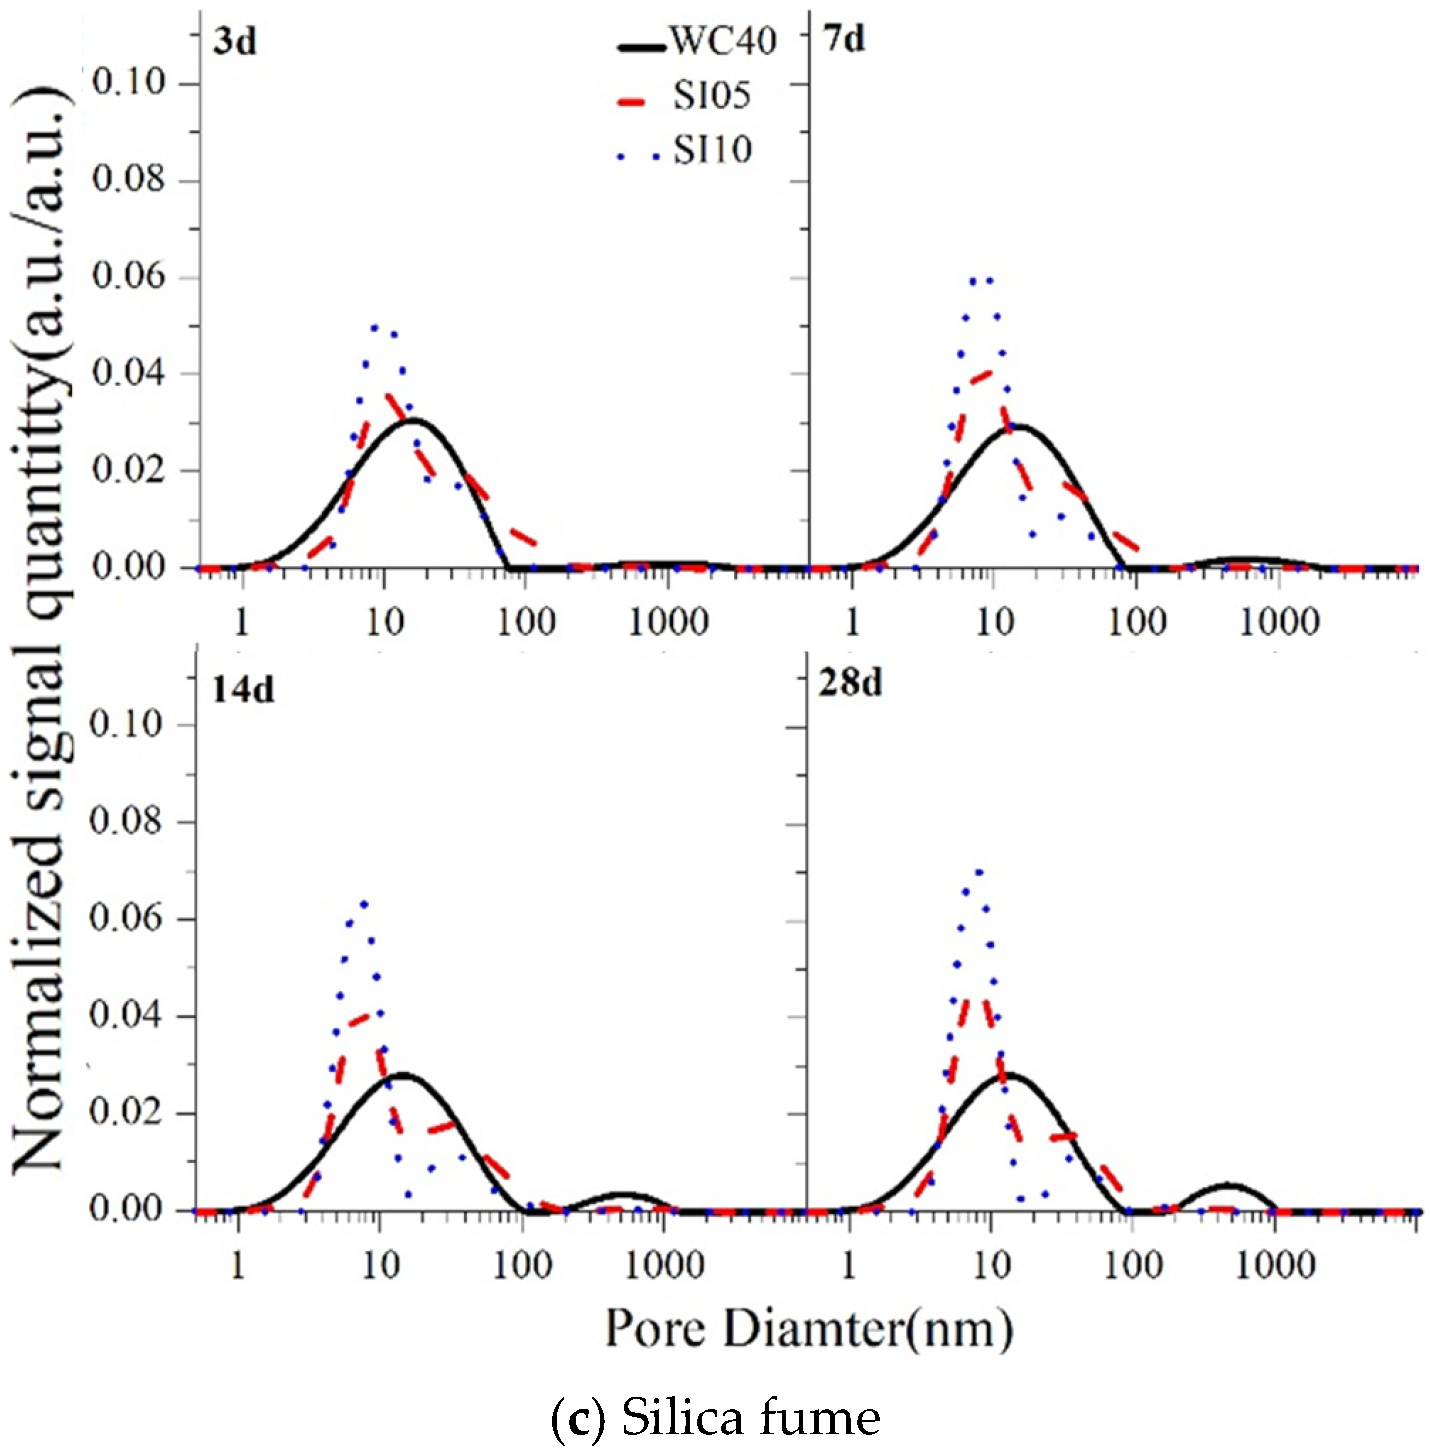
3.2. Pores of Composite Cement Pastes

The PSD curves of composite cement pastes are shown in Figure 6. The PSD curves of all the composite cement pastes contain two peaks. Compared to the PSD peaks of neat cement paste, the ones of composite cement pastes are much higher and thinner. In addition, the left peak and right peak of all the composite cement paste PSDs are right next to each other, while the ones of neat cement paste are separated. At the same time, the effect of admixture is significant. The PSDs of each composite cement are markedly different before 14 days, however, the PSDs of the composite cement tend to be similar at 28 days. Compared with the peak of neat cement paste, the addition of fly ash shifts the peaks to the right before 14 days, but shifts the peaks to the left at 28 days. Furthermore, the effect of slag shifts the peaks to the right at 3 days and then shifts the peaks to the left. However, the peaks of paste blended with silica fume are on the left of those of the neat cement paste from the beginning.
The relationship between the MPPD and age is plotted in Figure 7. The MPPD of cement paste blended with fly ash is larger before the age of 14 days and smaller at 28 days than that of neat cement paste. Due to the inert nature of fly ash, composite cement pastes produce fewer and more widely spaced hydration products compared to neat paste, which results in an increase in the gel pore size at the early stages. Thereafter, the hydration products of secondary hydration caused by the pozzolanic reaction of fly ash gradually fill the interspace at the later stage and refine the pore structure. The experimental results are consistent with the results of Pandey et al. [34] and Zhao [31]. The MPPD of cement paste blended with slag is bigger at 3 days and then smaller than those of neat cement paste. The functions of slag blended in cement are similar to those of fly ash, though the refinement of slag occurs earlier than that of fly ash. This may be due to the higher activities of slag than that of fly ash. These test results are in agreement with the work of Serge Ouellet [35]. On the contrary, the pore diameter of silica fume paste is smaller than that of neat paste cement from 3 to 28 days. This may be because of the high activity and microaggregate filling effect of silica fume, as reported in the literature [36,37].
The decrease rate of the MPPD of pastes blended with fly ash or slag is rapid before 7 days and after 14 days, and the rate is slow between 7 days to 14 days in Figure 6. In contrast, the decrease rate of the MPPD of neat paste and silica fume paste is gentle over the whole time. Finally, the four curves of cement paste with admixtures almost intersect at a point with an approximate pore size of 8 nm at 28 days.
Figure 8 presents the pore size distribution (PSD) curves for composite cement pastes with varying admixture contents. As seen from the figure, for cement pastes containing 15% and 30% fly ash, the MPPDs exceed those of neat cement paste before 28 days, but fall below them at 28 days. With an increase in the fly ash content, the proportion of gel pores rises, yet the MPPD shows little change. This finding contrasts with the results of Zhao et al. [31], who observed that MPPD grew progressively as fly ash content increased, indicating a direct correlation between the proportion of fly ash and the development of the MPPD. It is worth noting that in Zhao et al.’s study, the fly ash proportions differed slightly from those in this study, being 30%, 50%, and 70%, respectively.
For cement pastes blended with 15% and 30% slag, the pore structure improves before 7 days. Although the MPPD does not change significantly, the proportion of gel pores gradually increases as the slag content rises, which aligns with the conclusions of Young et al. [38]. A similar pattern was observed for the impact of silica fume content. However, the addition of silica fume begins to refine the pore structure after 3 days. The impact of silica fume on the proportion of small pores is consistent with the conclusions of Mehta et al. [39].

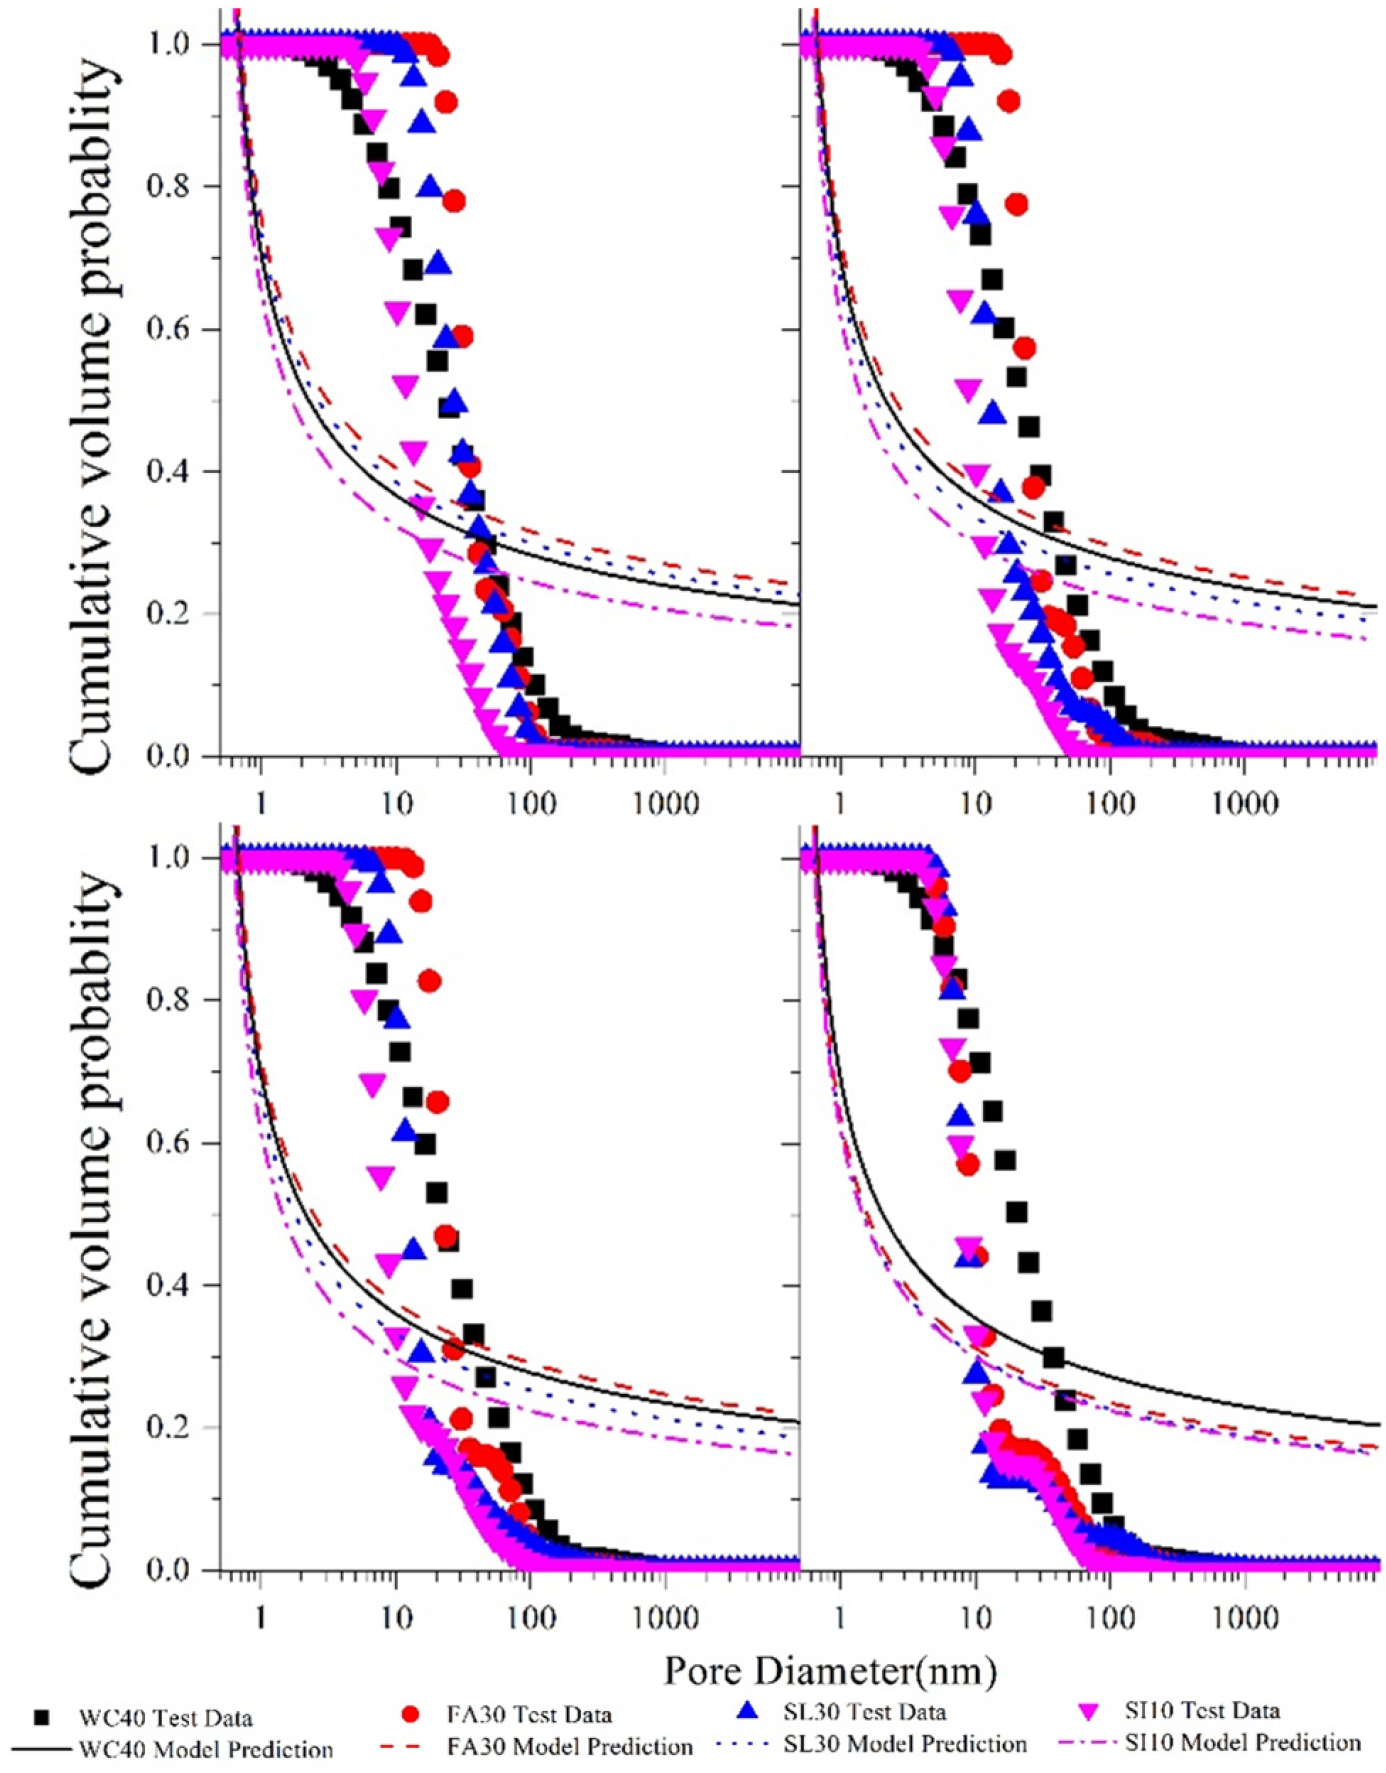
3.3. Analytical Pore Structure Model

There have been several models built for simulating the pore structure of cement paste [40,41,42]. Three classical models of pore structure are employed to simulate the test results, and an optimized pore structure model for composite cement paste is proposed in this section.

3.3.1. Van Breugel (V.B.) Pore Structure Model

The cumulative pore volume probability proposed by Breugel [40] is as follows:
V ( d ) = a ln d d 0 n
where V(d) is the pore volume of which the size is larger than d, m3/m3; d is the pore diameter, nm; d0 is the minimum-value pore depending on the measurement precision, nm; a and n are the parameters related to cement, w/c and curing age.
The experimental data for WC40, FA30, SL30, and SI10 were compared with the predicted results, as seen in Figure 9. Moreover, the parameters, correlation coefficients, and standard deviations of the fitting results are provided in Table 4. The cumulative volume probability of both prediction and measurement decreases with the increase in pore size. However, a clear discrepancy exists between the experimental data and the predictions from the V.B. model. The simulated curves differ significantly from the experimental ones, with the V.B. model yielding a single inverse function curve, while the experimental data show an inverse sigmoid curve. The fitting results reveal that when the pore diameter is 1.1 nm or smaller, the cumulative volume probability exceeds 1.0. Compared to the experimental data, the V.B. model underpredicts the values for smaller pores, but overpredicts them for larger pores.
As shown in Table 4, the parameters of Equation (6) vary with w/c and curing age: a increases gradually and n decreases with age. Furthermore, a decreases and n increases with w/c increasing. The correlations of the V.B. model are only about 70%, which shows non-ideal fitting results. The standard errors are high at around 0.3. Therefore, the predictions made by the V.B. model do not agree with the experimental data.

3.3.2. Shi and Brown (S. and B.) Pore Structure Model

The pore size distribution according to S. and B.’s [41] lognormal mixture model is expressed as follows:
P ( d ) = f i p ( d , μ i , σ i ) , f i = 1 .
where fi is the weight coefficient of the ith logarithmic normal distribution function; μ i and σ i are the location parameter and shape parameter of the logarithmic normal distribution function, respectively; and p ( d , μ i , σ i ) is expressed as Equation (4):
p ( d , μ i , σ i ) = 1 2 π σ i 2 x exp 1 2 log ( d ) μ i 2 2
As shown in Figure 10, a comparison is made between the experimental data of WC40, FA30, SL30, and SI10 and the corresponding predicted results, with the model performance metrics listed in Table 5. From the figure, the predictions from the S. and B. model align closely with the experimental results, outperforming the V.B. model. Both the predicted and experimental cumulative volume probabilities decrease as the pore size increases, showing a consistent trend. Additionally, the gap between the S. and B. model’s predictions and the experimental values is relatively small. The curves of both the simulated values and the experimental data display an inverse sigmoid pattern. It should be noted that the S. and B. model slightly underestimates the experimental data for pore diameters smaller than 1 nm and those between 10 nm and 30 nm. Conversely, for pore diameters ranging from 1 nm to 10 nm, as well as those exceeding 30 nm, the model tends to overestimate the experimental values. However, the differences between the predicted values and experimental results are minimal. According to Table 5, the correlation coefficients of the model are above 0.96, and the standard error is low, around 0.10. Nevertheless, the S. and B. model is more complex and involves numerous parameters.

3.3.3. Shimomura and Maekawa (S. and M.)’s Pore Structure Model

S. &M. expressed the cumulative volume of the pore as follows [42]:
V ( d ) = V 0 1 exp B d C
where V(d) is the cumulative volume of pores larger than d; V0 is the total pore volume of per unit volume specimens, m3/m3; B and C are model parameters.
The comparison of the model-predicted results with the test data of WC40, FA30, SL30, and SI10 are presented in Figure 11. And the model performance metrics for different w/c ratios and ages are presented in Table 6. Both the observed data and the predicted curves follow an inverse sigmoid pattern, where the cumulative volume probability progressively declines as the pore size enlarges. The simulation results from the S. and M. model demonstrate the best performance, with a much higher agreement between the predicted curves and the experimental data compared to the V.B. model and the S. and B. model, providing more accurate predictions. However, the model underestimates the test data for composite cement pastes at pore diameters larger than 10 nm for 7, 14, and 28 days. Additionally, the model overestimates the test data for neat cement paste at pore diameters larger than 100 nm.
As Table 6 shows, the correlations of the model value with the test data are high at around 0.999. Also, the standard errors are quite small at about 0.02. Moreover, the parameters of this model are simple.

3.3.4. Optimized Pore Structure Model

Building upon the S. and M. model, the Weibull distribution, and the bimodal characteristic of the PSD of cement pastes, a bimodal model is proposed as follows:
p ( d ) = A ( 1 exp ( B d C ) ) + exp ( E ( d G ) F )
where p(d) is the cumulative of pore volumes with diameters greater than d; and A, B, C, D, E, F, and G are parameters affected by w/c, the dosage of fly ash, slag, and silica fume.
The comparisons between the experimental data and the predicted results of the optimized model are presented in Figure 12, Figure 13, Figure 14 and Figure 15. The model performance metrics are provided in Table 7. Both the predicted values and the experimental data exhibit an inverse sigmoid shape, with the cumulative volume probability decreasing as the pore size increases. The experimental data and predicted results of the optimized model are generally in agreement, with only minor discrepancies. It is observed that as the w/c ratio increases, the fitting curve shifts to the right, indicating that the proportion of larger pores rises with an increasing w/c ratio. Additionally, as the age of the samples progresses, the gap between the predicted results and the experimental data gradually narrows. For small pores, the cumulative volume probability increases with higher contents of fly ash, slag, and silica fume, while for larger pores, the total volume probability decreases with an increase in fly ash and slag content. This suggests that as the content of these admixtures increases, the proportion of smaller pores also increases. Furthermore, as the age increases, the impact of the admixtures becomes more pronounced.
As indicated in Table 7, the revised model demonstrates a strong correlation of around 0.99, with a standard error below 0.01. Furthermore, the revised model has a relatively small number of parameters. Consequently, the optimized model provides a dependable and efficient prediction of the pore structure for all cement pastes.
In comparison with the S. and B. model and the S. and M. model, the V.B. model is the most straightforward, with the fewest parameters. However, its predicted results show poor correlation with the experimental data, larger standard errors, and noticeable discrepancies. Although the S. and B. model demonstrates a higher correlation and smaller standard error, it is more complicated and includes a greater number of parameters. Meanwhile, the S. and M. models provide the best fit among the models, showing high correlation and low standard error. However, these models fail to account for the right peak in the pore distribution. Therefore, the proposed optimized model, which takes the bimodal pore structure into consideration, presents a more appropriate solution.

4. Conclusions

Based on the cement materials, supplementary cementitious materials, and measurement techniques studied in this paper, the main conclusions are as follows.
(1)
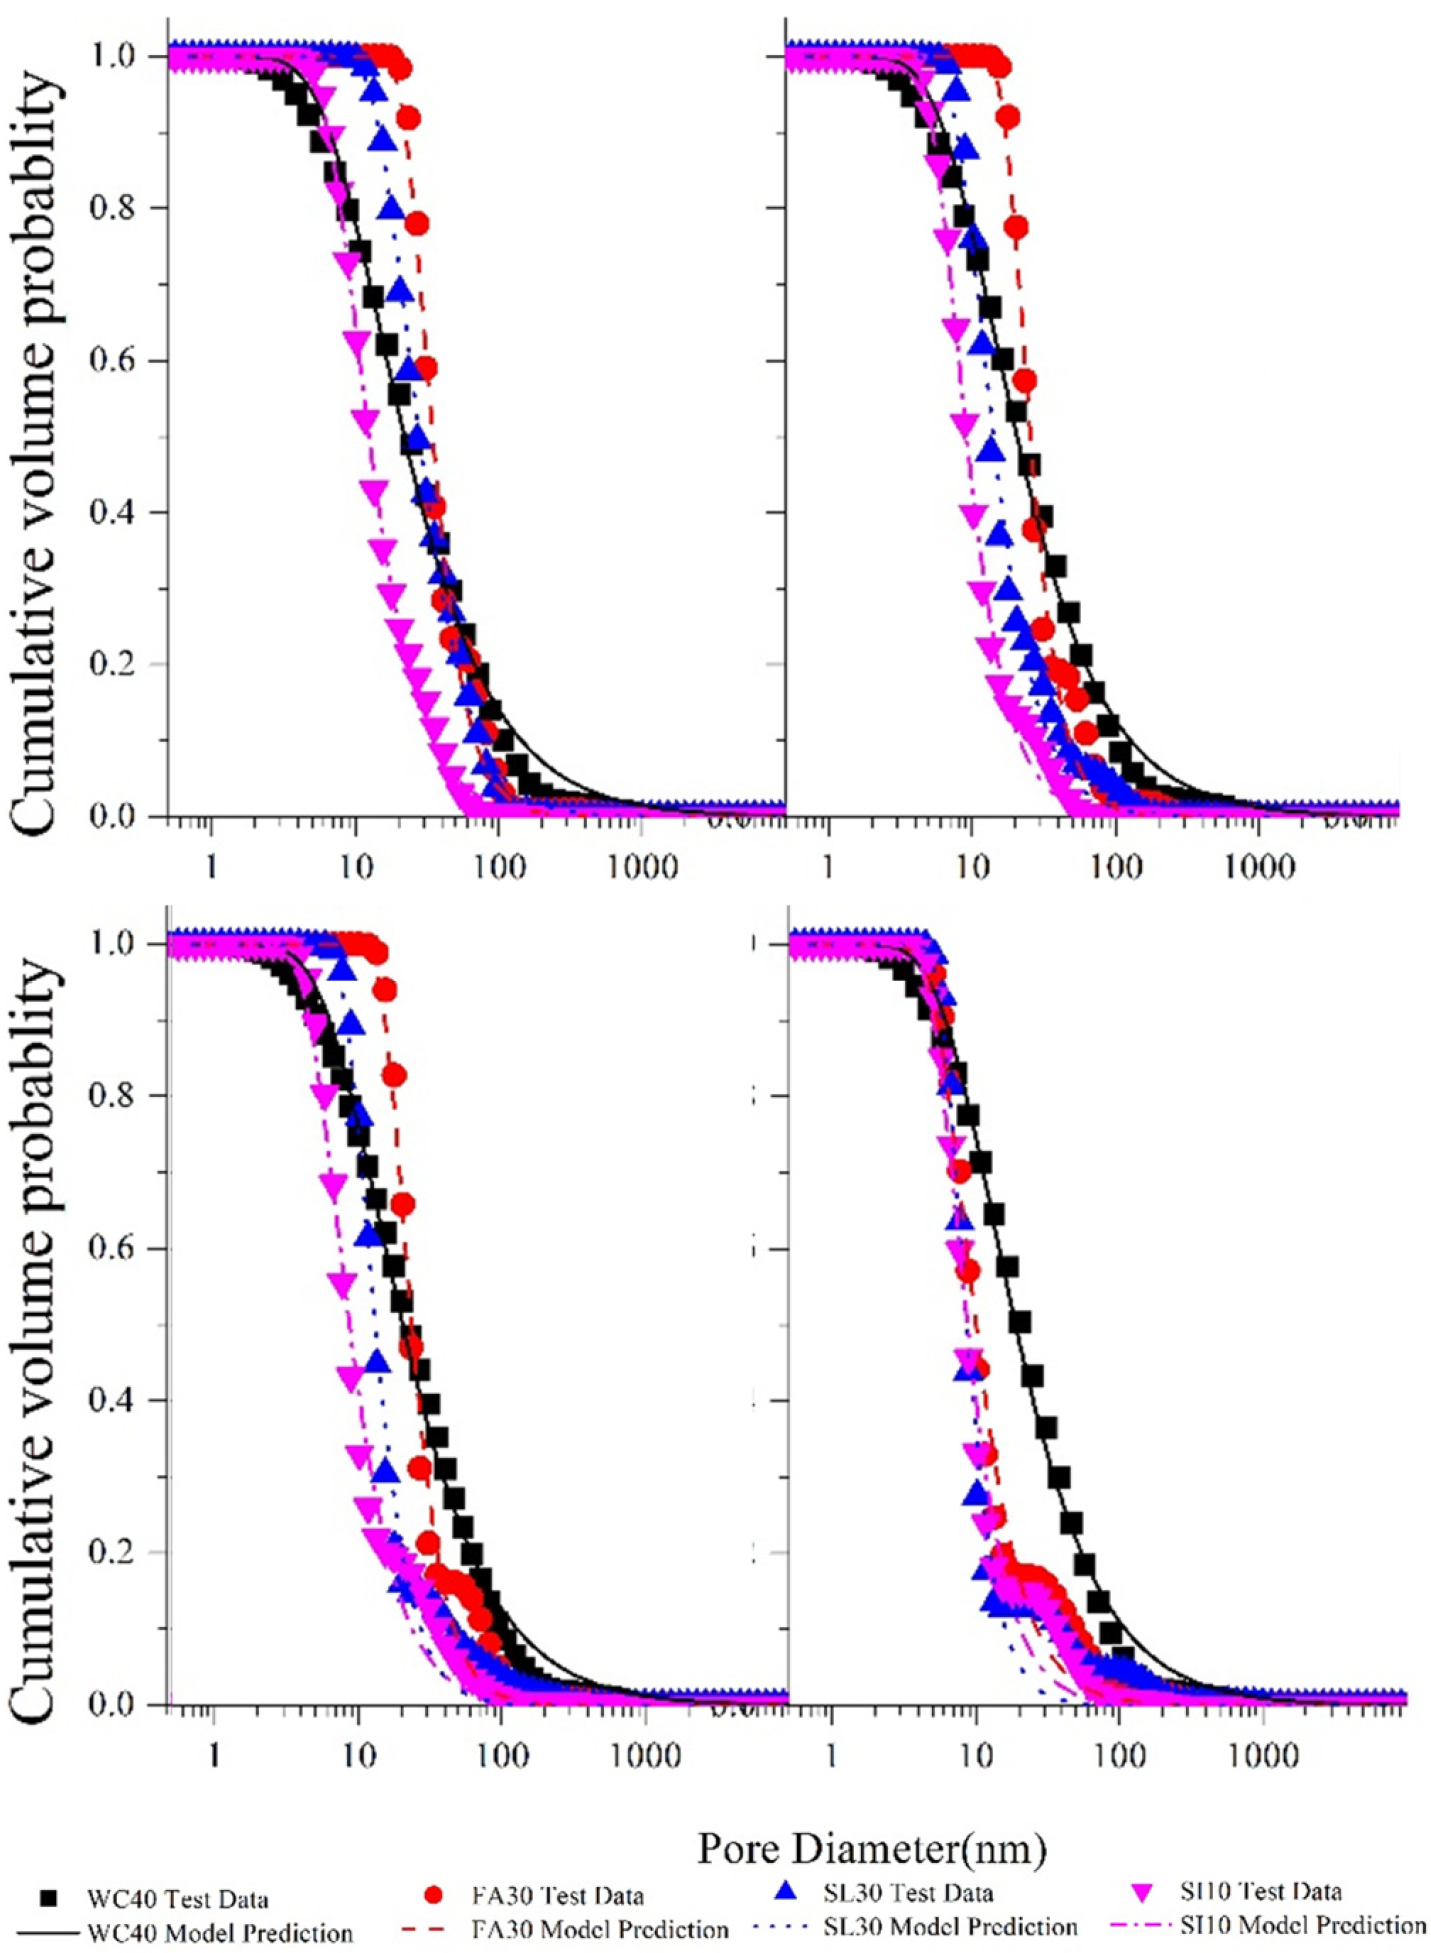
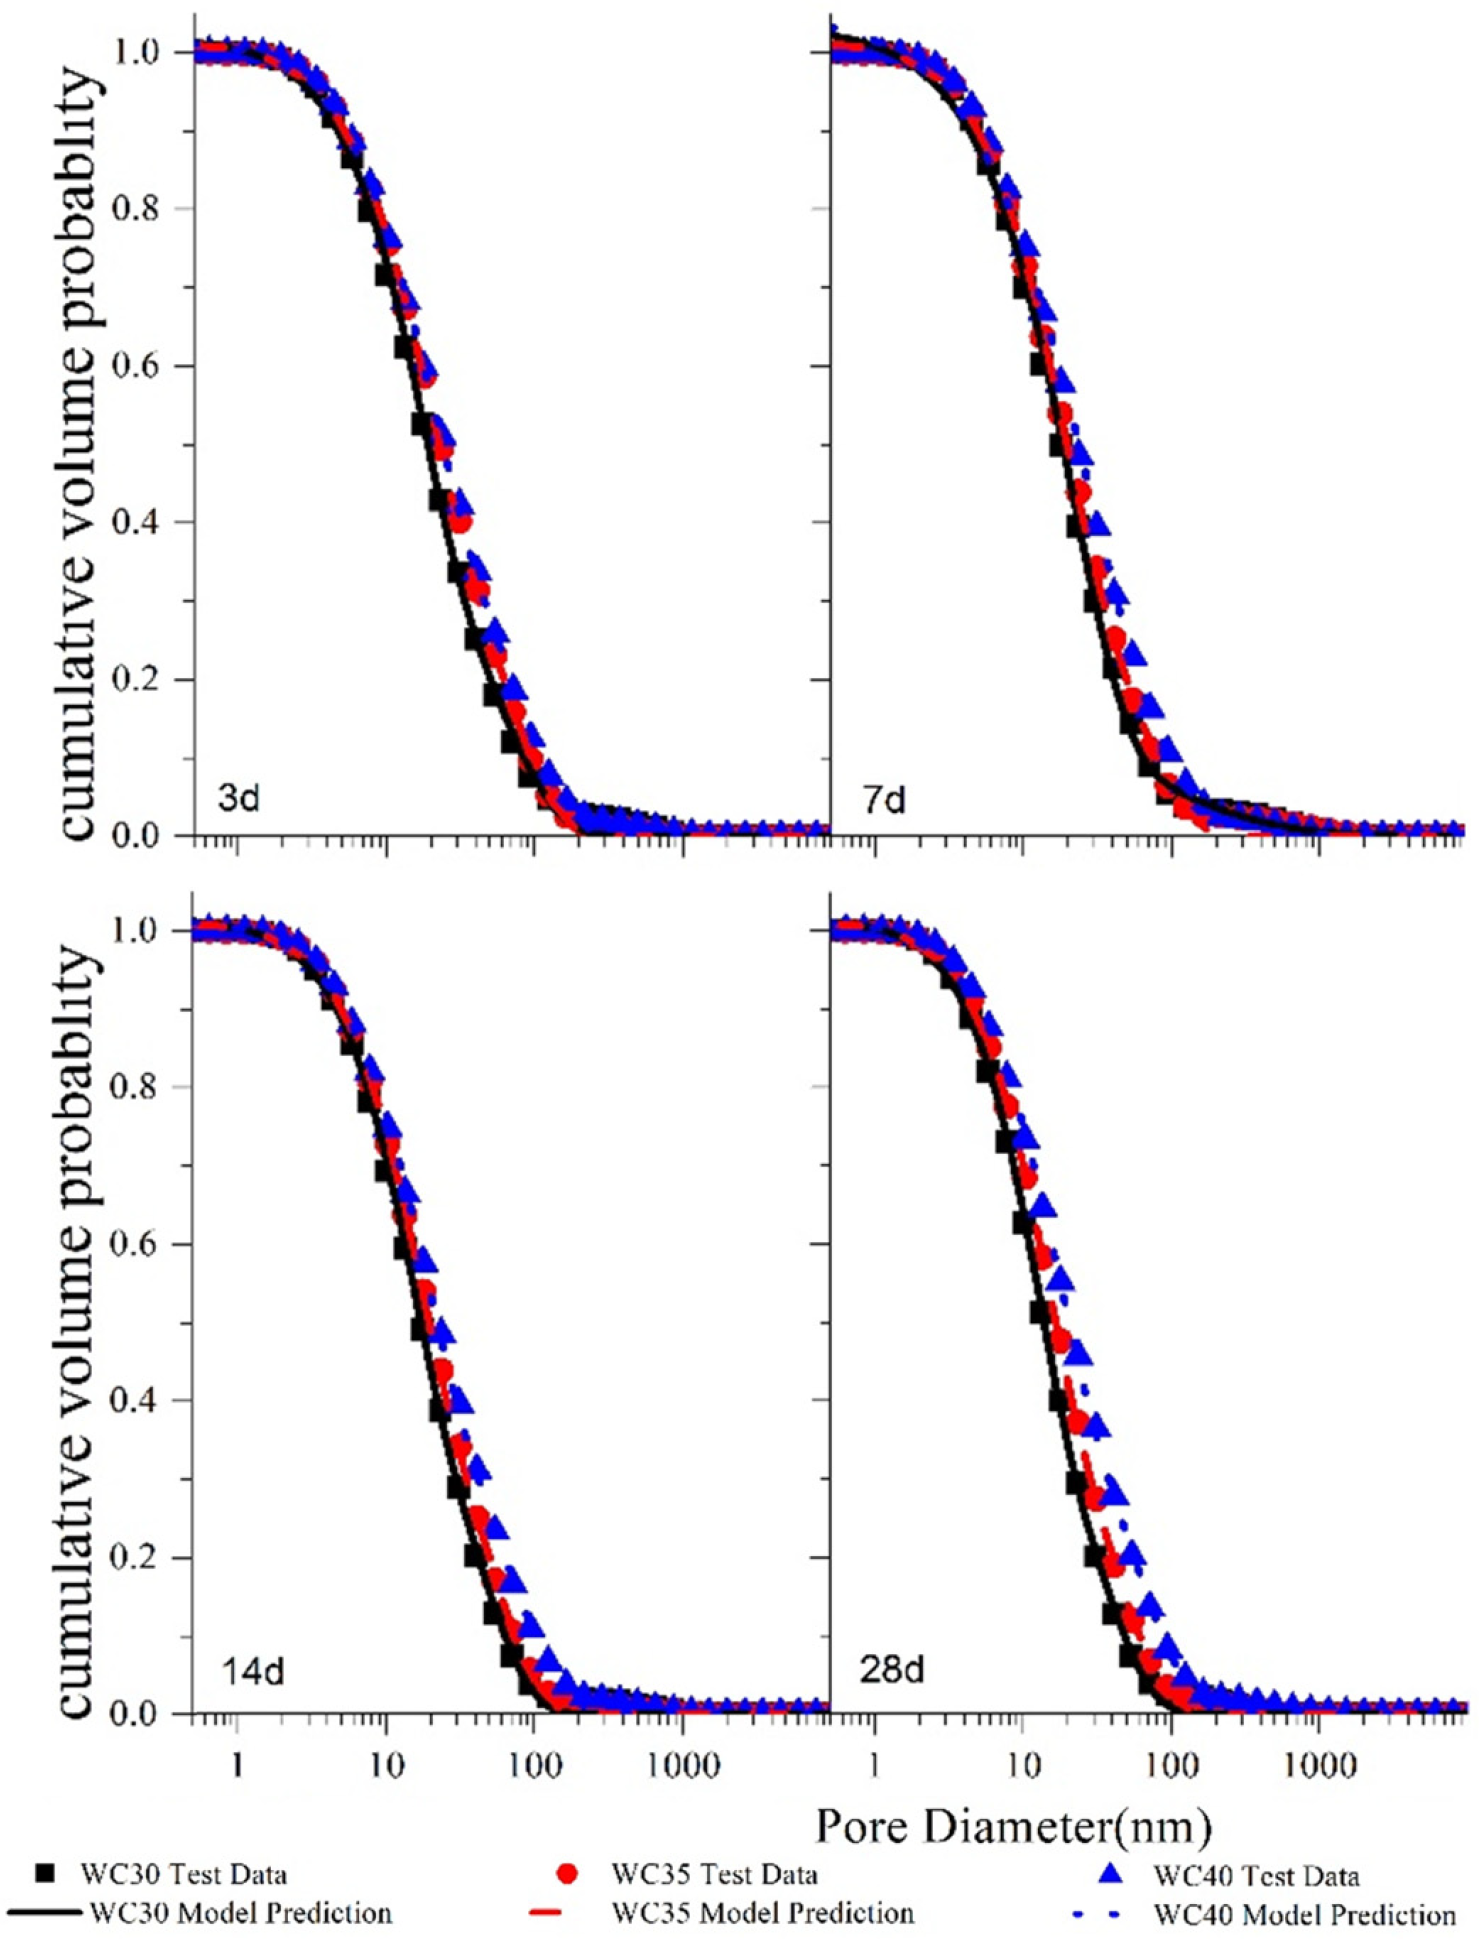
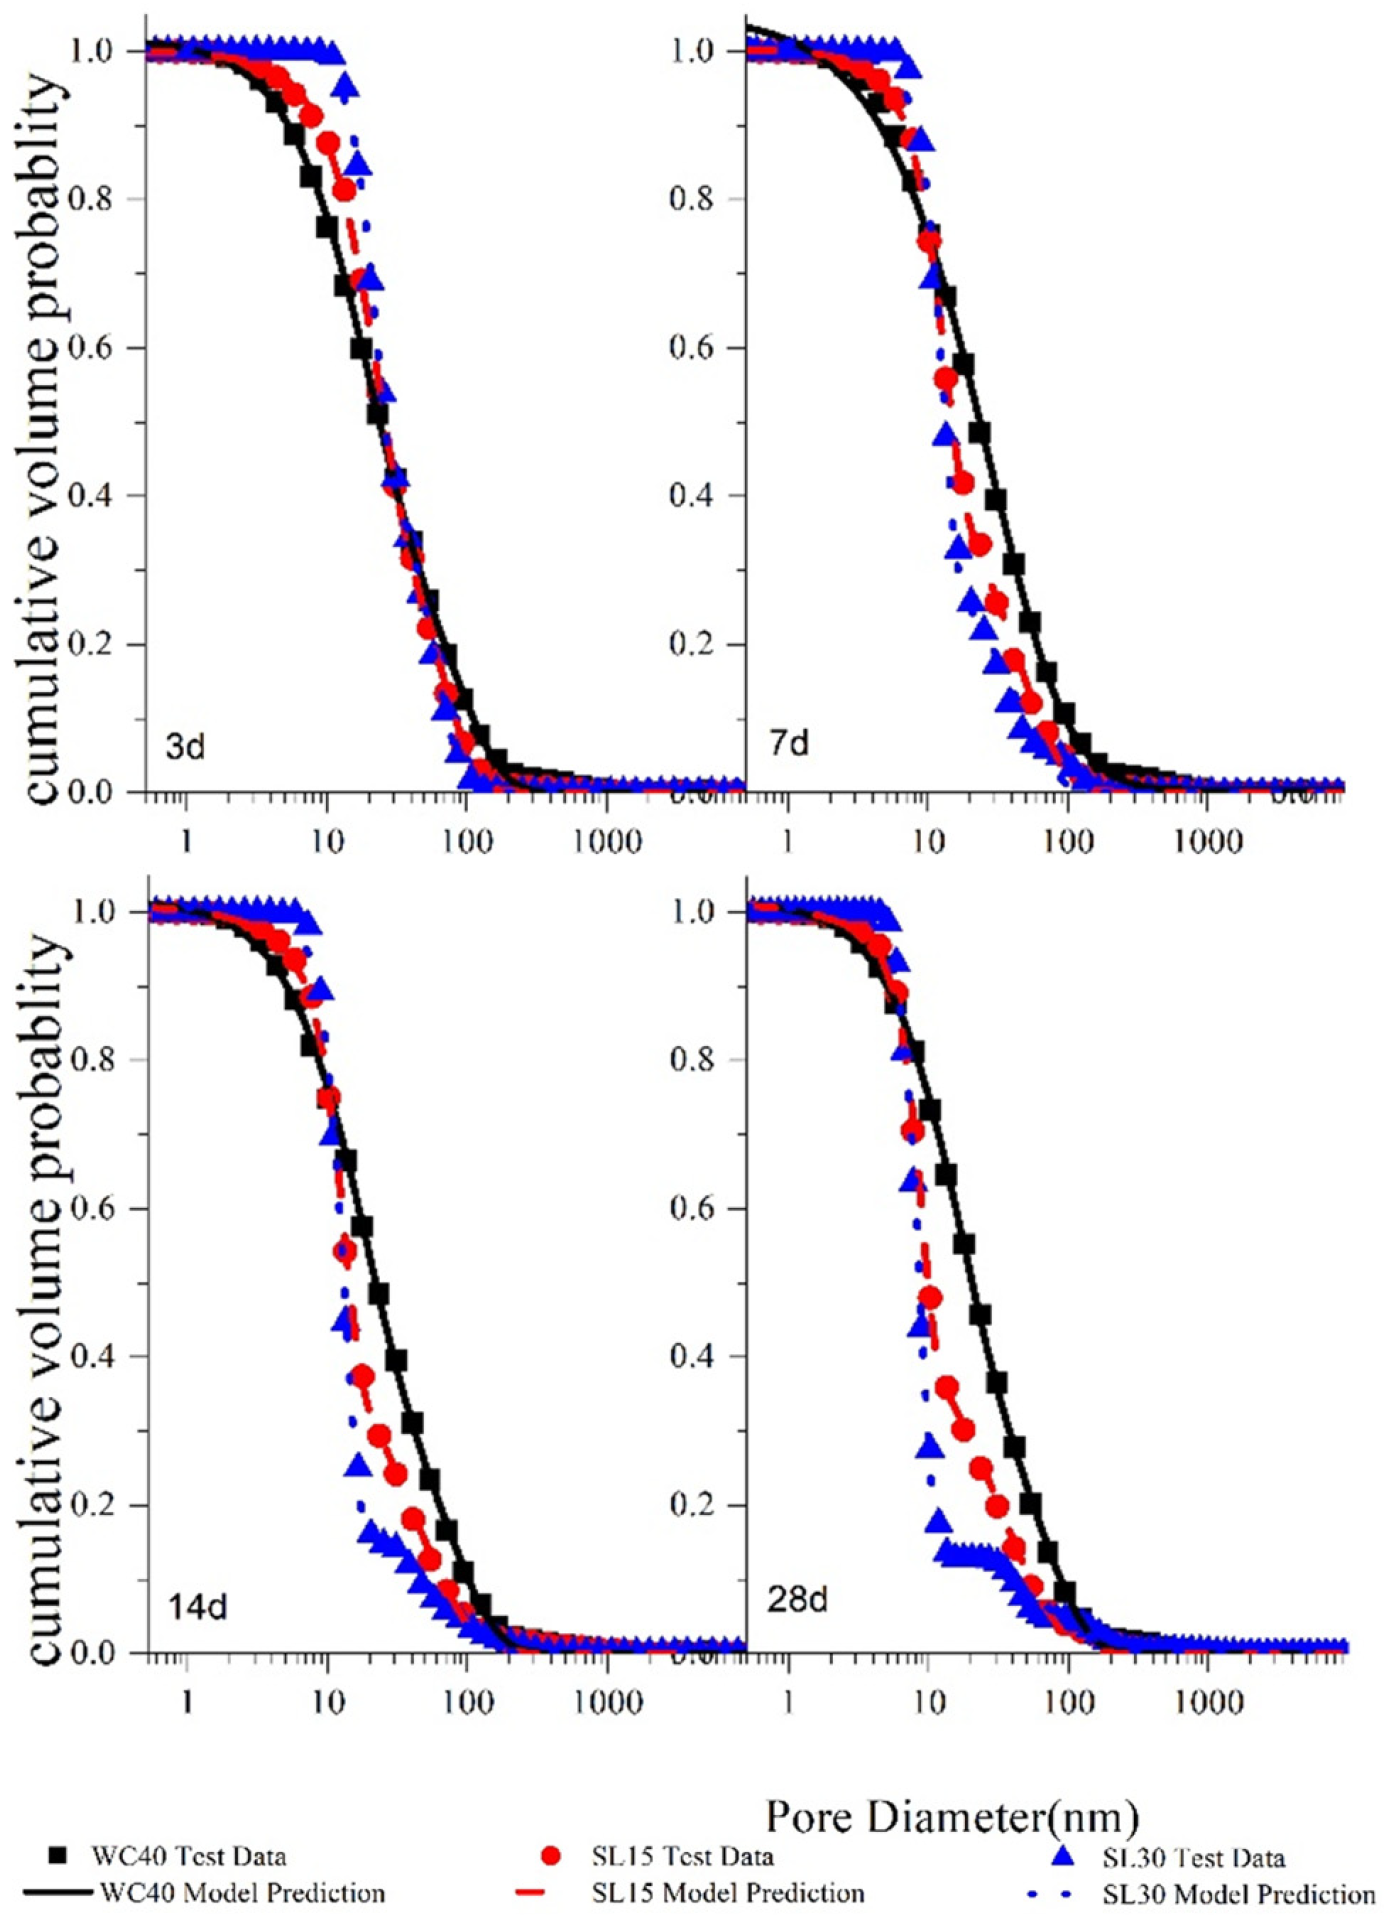
For all the cement pastes examined in the study, the most likely pore diameter reduces progressively with increasing curing age. Fly ash-blended cement pastes show a larger likely pore diameter than neat pastes up to 14 days, but it becomes smaller by 28 days. The pore size of slag-blended pastes increases initially and then decreases at 3 days. Moreover, the pore diameter of silica fume paste remains consistently smaller than that of neat paste from 3 to 28 days.
(2)
The test results indicate that when the contents of fly ash, slag, and silica fume are below 30%, 30%, and 10%, respectively, the mineral admixture content has minimal impact on the most probable pore diameter. But as the admixture content increases, the proportion of gel pores increases.
(3)
A bimodal model, which combines the Shimomura and Maekawa model with the Weibull distribution function, was developed to account for the PSD of both the left and right peaks in cement paste with and without the addition of fly ash, slag, and silica fume. The outcomes of this model align well with the experimental data.

Author Contributions

Conceptualization, J.W., G.Y., B.H. and X.L.; methodology, J.W., G.Y. and B.H.; validation, J.W. and B.H.; formal analysis, B.H. and X.L.; investigation, J.W.; resources, B.H.; data curation, X.L.; writing—original draft preparation, J.W.; writing—review and editing, G.Y. and B.H.; supervision, G.Y.; project administration, G.Y. and B.H.; funding acquisition, G.Y. and X.L. All authors have read and agreed to the published version of the manuscript.

Funding

This research was funded by the Research on Key Technologies for Improving the Quality and Safety Assurance of the Huai River to Sea Waterway Phase II Project (RHSD2/FW-2024-03), Guangxi Science and Technology Program (grant Guike AA23062034), China Postdoctoral Science Foundation (2024M750729), Fundamental Research Funds for the Central Universities (B240201179), Natural Science Foundation of Jiangsu Province (BK20241532), and Technology Project of State Grid Jiangsu Electric Power Co., Ltd. (J2023094).

Data Availability Statement

The original contributions presented in this study are included in the article. Further inquiries can be directed to the corresponding author.

Conflicts of Interest

Author Bin Hong was employed by the company China Railway Shanghai Design Institute Group Corporation Limited. The remaining authors declare that the research was conducted in the absence of any commercial or financial relationships that could be construed as a potential conflict of interest.

References

  1. Dao, V.T.N.; Morris, P.H.; Dux, P.F. Crack propagation in concrete at very early ages. Mag. Concr. Res. 2014, 66, 643–651. [Google Scholar] [CrossRef]
  2. Douglas Hooton, R. Future directions for design, specification, testing, and construction of durable concrete structures. Cem. Concr. Res. 2019, 124, 105827. [Google Scholar] [CrossRef]
  3. Orozco, C.; Babel, S.; Tangtermsirikul, S.; Sugiyama, T. Comparison of environmental impacts of fly ash and slag as cement replacement materials for mass concrete and the impact of transportation. Sustain. Mater. Technol. 2024, 39, e00796. [Google Scholar] [CrossRef]
  4. Meyer, C. The greening of the concrete industry. Cem. Concr. Compos. 2009, 31, 601–605. [Google Scholar] [CrossRef]
  5. Li, M.; Han, Z.; Cheng, H.; Yang, R.; Yuan, J.; Jin, T. Low-temperature performance improvement strategies for high RAP content recycled asphalt mixtures: Focus on RAP gradation variability and mixing process. Fuel 2025, 387, 134362. [Google Scholar] [CrossRef]
  6. Tayeh, B.A.; Hamada, H.M.; Almeshal, I.; Bakar, B.H.A. Durability and mechanical properties of cement concrete comprising pozzolanic materials with alkali-activated binder: A comprehensive review. Case Stud. Constr. Mater. 2022, 17, e01429. [Google Scholar] [CrossRef]
  7. Altwair, N.M.; Kabir, S. Green concrete structures by replacing cement with pozzolanic materials to reduce greenhouse gas emissions for sustainable environment. In Proceedings of the 6th International Engineering and Construction Conference, Cairo, Egypt, 28–30 June 2010; pp. 1126–1130. [Google Scholar]
  8. Nochaiya, T.; Wongkeo, W.; Chaipanich, A.J.F. Utilization of fly ash with silica fume and properties of Portland cement–fly ash–silica fume concrete. Fuel 2010, 89, 768–774. [Google Scholar] [CrossRef]
  9. Guo, Z.; Jiang, T.; Zhang, J.; Kong, X.; Chen, C.; Lehman, D.E. Mechanical and durability properties of sustainable self-compacting concrete with recycled concrete aggregate and fly ash, slag and silica fume. Constr. Build. Mater. 2020, 231, 117115. [Google Scholar] [CrossRef]
  10. Nazeer, M.; Kapoor, K.; Singh, S. Strength, durability and microstructural investigations on pervious concrete made with fly ash and silica fume as supplementary cementitious materials. J. Build. Eng. 2023, 69, 106275. [Google Scholar] [CrossRef]
  11. Ramzi, S.; Hajiloo, H. The effects of supplementary cementitious materials (SCMs) on the residual mechanical properties of concrete after exposure to high temperatures. Buildings 2023, 13, 103. [Google Scholar] [CrossRef]
  12. Mark, O.; Ede, A.; Olofinnade, O.; Bamigboye, G.; Okeke, C.; Oyebisi, S.; Arum, C. Influence of some selected supplementary cementitious materials on workability and compressive strength of concrete—A review. IOP Conf. Ser. Mater. Sci. Eng. 2019, 640, 012071. [Google Scholar] [CrossRef]
  13. Makul, N. Modern sustainable cement and concrete composites: Review of current status, challenges and guidelines. Sustain. Mater. Technol. 2020, 25, e00155. [Google Scholar] [CrossRef]
  14. Duan, P.; Shui, Z.; Chen, W.; Shen, C. Effects of metakaolin, silica fume and slag on pore structure, interfacial transition zone and compressive strength of concrete. Constr. Build. Mater. 2013, 44, 1–6. [Google Scholar] [CrossRef]
  15. Hooton, R.D. Permeability and pore structure of cement pastes containing fly ash, slag, and silica fume. In Blended Cements; ASTM International: West Conshohocken, PA, USA, 1986. [Google Scholar]
  16. Li, Y.; Bao, J.; Guo, Y. The relationship between autogenous shrinkage and pore structure of cement paste with mineral admixtures. Constr. Build. Mater. 2010, 24, 1855–1860. [Google Scholar] [CrossRef]
  17. Chindaprasirt, P.; Jaturapitakkul, C.; Sinsiri, T. Effect of fly ash fineness on microstructure of blended cement paste. Constr. Build. Mater. 2007, 21, 1534–1541. [Google Scholar] [CrossRef]
  18. Zhou, J.; Ye, G.; Van Breugel, K. Hydration process and pore structure of Portland cement paste blended with blast furnace slag. In Proceedings of the 6th International Symposium on Cement & Concrete, Canmet, Xi’an, China, 19–22 September 2006; pp. 1–7. [Google Scholar]
  19. Song, W.; Zhu, Z.; Peng, Y.; Wan, Y.; Xu, X.; Pu, S.; Song, S.; Wei, Y. Effect of steel slag on fresh, hardened and microstructural properties of high-calcium fly ash based geopolymers at standard curing condition. Constr. Build. Mater. 2019, 229, 116933. [Google Scholar] [CrossRef]
  20. Yajuun, J.; Cahyadi, J. Investigation on microstructure of silica fume cement pastes. WIT Trans. Built Environ. 2002, 59, 9. [Google Scholar]
  21. Thommes, M.; Cychosz, K.A. Physical adsorption characterization of nanoporous materials: Progress and challenges. Adsorption 2014, 20, 233–250. [Google Scholar] [CrossRef]
  22. Bae, Y.-S.; Yazaydın, A.O.; Snurr, R.Q. Evaluation of the BET method for determining surface areas of MOFs and zeolites that contain ultra-micropores. Langmuir 2010, 26, 5475–5483. [Google Scholar] [CrossRef] [PubMed]
  23. De Belie, N.; Kratky, J.; Van Vlierberghe, S. Influence of pozzolans and slag on the microstructure of partially carbonated cement paste by means of water vapour and nitrogen sorption experiments and BET calculations. Cem. Concr. Res. 2010, 40, 1723–1733. [Google Scholar] [CrossRef]
  24. Juenger, M.C.G.; Jennings, H.M. The use of nitrogen adsorption to assess the microstructure of cement paste. Cem. Concr. Res. 2001, 31, 883–892. [Google Scholar] [CrossRef]
  25. Ng, C.; Alengaram, U.J.; Wong, L.S.; Mo, K.H.; Jumaat, M.Z.; Ramesh, S. A review on microstructural study and compressive strength of geopolymer mortar, paste and concrete. Constr. Build. Mater. 2018, 186, 550–576. [Google Scholar] [CrossRef]
  26. Fleury, M.; Gimmi, T.; Mazurek, M. Porewater content, pore structure and water mobility in clays and shales from NMR methods. Clays Clay Miner. 2022, 70, 417–437. [Google Scholar] [CrossRef]
  27. Watson, A.T.; Chang, C.P. Characterizing porous media with NMR methods. Prog. Nucl. Magn. Reson. Spectrosc. 1997, 31, 343–386. [Google Scholar] [CrossRef]
  28. Nagel, S.M.; Strangfeld, C.; Kruschwitz, S. Application of 1H proton NMR relaxometry to building materials—A review. J. Magn. Reson. Open 2021, 6, 100012. [Google Scholar] [CrossRef]
  29. Halperin, W.P.; Jehng, J.-Y.; Song, Y.-Q. Application of spin-spin relaxation to measurement of surface area and pore size distributions in a hydrating cement paste. Magn. Reson. Imaging 1994, 12, 169–173. [Google Scholar] [CrossRef]
  30. Jehng, J.-Y.; Sprague, D.; Halperin, W. Pore structure of hydrating cement paste by magnetic resonance relaxation analysis and freezing. Magn. Reson. Imaging 1996, 14, 785–791. [Google Scholar] [CrossRef] [PubMed]
  31. Zhao, H.; Qin, X.; Liu, J.; Zhou, L.; Tian, Q.; Wang, P. Pore structure characterization of early-age cement pastes blended with high-volume fly ash. Constr. Build. Mater. 2018, 189, 934–946. [Google Scholar] [CrossRef]
  32. Faure, P.F.; Caré, S.; Magat, J.; Chaussadent, T. Drying effect on cement paste porosity at early age observed by NMR methods. Constr. Build. Mater. 2012, 29, 496–503. [Google Scholar] [CrossRef]
  33. She, A.-m.; Yao, W.; Yuan, W.-c. Evolution of distribution and content of water in cement paste by low field nuclear magnetic resonance. J. Cent. South Univ. 2013, 20, 1109–1114. [Google Scholar] [CrossRef]
  34. Pandey, S.; Sharma, R. The influence of mineral additives on the strength and porosity of OPC mortar. Cem. Concr. Res. 2000, 30, 19–23. [Google Scholar] [CrossRef]
  35. Ouellet, S.; Bussière, B.; Aubertin, M.; Benzaazoua, M. Microstructural evolution of cemented paste backfill: Mercury intrusion porosimetry test results. Cem. Concr. Res. 2007, 37, 1654–1665. [Google Scholar] [CrossRef]
  36. Wan, Z.; He, T.; Chang, N.; Yang, R.; Qiu, H. Effect of silica fume on shrinkage of cement-based materials mixed with alkali accelerator and alkali-free accelerator. J. Mater. Res. Technol. 2023, 22, 825–837. [Google Scholar] [CrossRef]
  37. Dai, J.; Wang, Q.; Xie, C.; Xie, Z.; Tian, X.; Lou, X.; Guo, H. Effect of Curing Temperature on Activity Index of Silica Fume. IOP Conf. Ser. Mater. Sci. Eng. 2018, 381, 012096. [Google Scholar] [CrossRef]
  38. Choi, Y.C.; Kim, J.; Choi, S. Mercury intrusion porosimetry characterization of micropore structures of high-strength cement pastes incorporating high volume ground granulated blast-furnace slag. Constr. Build. Mater. 2017, 137, 96–103. [Google Scholar] [CrossRef]
  39. Mehta, P.K. Pozzolanic and cementitious byproducts as mineral admixtures for concrete-a critical review. Spec. Publ. 1983, 79, 1–46. [Google Scholar]
  40. Van Breugel, K. Numerical simulation of hydration and microstructural development in hardening cement-based materials (I) theory. Cem. Concr. Res. 1995, 25, 319–331. [Google Scholar] [CrossRef]
  41. Shi, D.; Brown, P.W.; Ma, W. Lognormal simulation of pore size distributions in cementitious materials. J. Am. Ceram. Soc. 1991, 74, 1861–1867. [Google Scholar] [CrossRef]
  42. Shimomura, T.; Maekawa, K. Analysis of the drying shrinkage behaviour of concrete using a micromechanical model based on the micropore structure of concrete. Mag. Concr. Res. 1997, 49, 303–322. [Google Scholar] [CrossRef]
Figure 1. Raw materials.
Applsci 15 01650 g001
Figure 2. Low-field nuclear magnetic resonance instrument. (1 magnetic box; 2 spectrum system and controlling machine; 3 console unit; 4 displayer).
Applsci 15 01650 g002
Figure 3. Distribution of porosity in cement slurries with different w/c ratios.
Applsci 15 01650 g003
Figure 4. W/c ratio effect on the most probable pore size.
Applsci 15 01650 g004
Figure 5. Aging effect on the most probable pore size.
Applsci 15 01650 g005
Figure 6. The pore size distributions of composite cement paste.
Applsci 15 01650 g006
Figure 7. The most probable pore diameter of composite cement paste.
Applsci 15 01650 g007
Figure 8. The pore size distributions of composite cement paste with different content.
Applsci 15 01650 g008aApplsci 15 01650 g008b
Figure 9. Comparison of the measured data with the forecast results of the V.B. model.
Applsci 15 01650 g009
Figure 10. Comparison of the experimental data with the predictions from the S. and B. model.
Applsci 15 01650 g010
Figure 11. Comparison of experimental data and predicted results of S. &M. model.
Applsci 15 01650 g011
Figure 12. Comparison between the test results and predictions from the optimized model.
Applsci 15 01650 g012
Figure 13. Comparison between the test results and predictions from the optimized model.
Applsci 15 01650 g013
Figure 14. Comparison between the test results and predictions from the optimized model.
Applsci 15 01650 g014
Figure 15. Comparison between the test results and predictions from the optimized model.
Applsci 15 01650 g015
Table 1. The chemical makeup of the cement and binder materials (%).
SampleCaOSiO2Al2O3Fe2O3MgOK2ONa2OTiO2SO3
Cement64.719.64.53.10.80.60.07
Fly ash2.1354.035.13.900.5121.260.471.290.45
Slag39.930.814.60.618.650.5760.401.222.19
Silica fume1.4091.40.610.882.371.680.430.48
Table 2. Blend ratios of cement slurries.
SampleMixture ParametersQuantity of Experimental Substances (kg/m3)
w/bSlag Content %Fly Ash Content %Silica Fume Content %CementSlagFly AshSilica FumeWater
WC300.300001628000488
WC350.350001505000527
WC400.400001399000560
FA150.400150115402040543
FA300.40030092203950527
SL150.401500118720900558
SL300.40300097441700557
SI50.4000513160069554
SI100.400010123600137549
Table 3. Configuration of low-field nuclear magnetic resonance parameters.
SequenceTDSWRFDRG1DRG1PRGTWNSNECHTEDL1
FID10242000.005203220004
CPMGAUTO333.330.0051032200440000.36500
Table 4. Parameters of the V.B. model of neat cement pastes.
SampleAge (Day)anCorrelationStandard Error
WC4030.610−0.4570.70110.2896
70.604−0.4600.70220.2884
140.603−0.4610.70250.2880
280.596−0.4650.70290.2873
FA3030.657−0.4370.64740.3458
70.630−0.4510.65560.3362
140.625−0.4540.66010.3315
280.543−0.4970.69970.2844
SL3030.635−0.4480.66300.3299
70.574−0.4810.68400.3039
140.570−0.4830.68180.3046
280.530−0.5040.69500.2860
SI1030.558−0.4890.69060.2958
70.526−0.5080.69600.2857
140.526−0.5070.70450.2780
280.526−0.5070.69930.2824
Table 5. Parameters of the S. and B. model for plain cement pastes.
SampleAge (Day)f1/f2/f3μ1/μ2/μ3σ1/σ2/σ3CorrelationStandard Error
WC403−0.55432.63700.00310.99110.0380
−0.57121.7574−0.0036
0.64762.1643−0.0064
713.05552.19970.05990.99060.0388
−0.02812.58040.0002
0.25071.40480.2099
1410.0689−0.52630.03490.99120.0550
−2.7385−0.6080−30.2094
0.3575−0.5845−0.0220
280.0034−1359.40001033.95800.99040.0569
1.0084−0.17660.0668
0.3245−1.4005−0.0008
FA3030.00001.16600.00000.96880.1109
−0.00713.66740.0001
0.99872.9082−0.0111
729.0848−2.37600.04580.97350.1033
0.0000−6.25380.0000
−28.0848−2.64750.0356
14−0.00051.52390.00000.97210.1019
−1.98322.69030.0123
2.14460.0117
28−0.08512.0938−0.00680.98380.0697
−19,535.3000−0.7879−476.5680
−0.0020−407.2220
SL3030.1671−0.18790.23650.97020.1078
0.84920.34820.0667
−1.2336−0.0013
7−0.00310.76450.00000.98160.0781
16.10961.35500.0304
1.5903−0.0387
14198.92631.0956−0.36760.97700.0871
−0.00971.44980.0000
0.7179−0.7680
28−3.4846−0.33280.01570.97570.0848
4.63190.07980.0121
0.5546−0.0009
SI103−1.15531.36880.00440.98540.0684
−35.88820.62040.1371
0.98760.0734
78339.11300.000037.00110.98320.0712
0.00001.05480.0000
−8338.1130−0.346446.1337
14−43.95950.62570.25300.98630.0632
−3.5670−0.20940.0137
0.14890.1135
28−0.02220.8798−0.00030.98270.0716
−13.9269−0.55350.1810
0.24630.0997
Table 6. The model performance metrics of the S. and M. model.
SampleAge (Days)BCCorrelationStandard Error
WC40315.1829−1.00000.99910.0183
715.5102−1.0.2880.99920.0164
1415.1023−1.02190.99920.0174
2815.9384−1.06710.99920.0170
FA30312,072.4900−2.75570.99920.0176
711,392.3500−2.99820.99910.0192
144480.3220−2.77420.99870.0224
2858.7800−1.92920.99790.0258
SL303360.1463−1.88190.99970.0111
7157.6100−2.05450.99920.0170
14554.1292−2.59400.99860.0228
28465.3938−3.02010.99720.0312
SI10375.5010−1.84450.99980.0078
793.0119−2.21560.99960.0104
1439.0152−1.86440.99840.0219
2882.8129−2.20820.99840.0227
Table 7. Parameters of the optimized model of cement pastes.
SampleAge (Days)ABCEFGCorrelationStandard Error
WC3030.500011.5818−1.00380.02231.11130.48000.99990.0037
70.500010.6257−0.97930.01831.23540.48000.99990.0044
140.500012.2808−1.10870.01461.25920.48001.00000.0028
280.500012.6788−1.18340.01901.29970.48001.00000.0024
WC3530.500012.6478−1.06610.01131.17500.48001.00000.0021
70.500011.5941−1.01390.01531.20780.48000.99990.0034
140.500013.3211−1.12510.01151.24670.48001.00000.0024
280.500013.7422−1.17380.01561.24340.48001.00000.0021
WC4030.500012.7710−1.03420.01611.06280.48001.00000.0021
70.500013.1063−1.03330.01941.06040.48001.00000.0028
140.500013.4378−1.07080.01821.05600.48001.00000.0023
280.500013.8415−1.10480.01721.10750.48001.00000.0023
FA1530.500023,166.8753−3.03420.03040.92280.48000.99940.0105
70.500095,288.6855−3.79470.03000.96230.48000.99950.0096
140.500095,381.8748−3.91670.03180.92690.48000.99950.0101
280.500074.1283−1.45140.00192.96280.48000.99980.0051
FA3030.50002970.1461−2.16060.00006.99150.48000.99960.0090
70.5000700.3776−1.97190.00007.65520.48000.99960.0085
140.5000226.7626−1.68240.00007.13360.48000.99940.0109
280.500016.2297−1.16780.00004.78580.48000.99920.0110
SL1530.5000183.7057−1.75660.01761.08540.48000.99980.0053
70.5000215.7488−1.67270.00092.95260.48000.99990.0042
140.500073.8583−1.39510.00082.93760.48000.99980.0055
280.500042.9995−1.32740.00043.77930.48000.99980.0051
SL3030.500091,027.6255−3.92210.00041.96040.48001.00000.0029
70.500092.0333−1.58720.00004.97190.48000.99990.0050
140.500044.0380−1.45540.00006.29690.48000.99930.0106
280.500018.9131−1.36150.00008.08670.48000.99780.0187
SI0530.5000308.0020−1.73860.00212.68540.48001.00000.0025
70.5000320.3482−2.86820.01931.12430.48000.99990.0047
140.5000115.0704−1.53520.00183.17080.48000.99980.0048
280.5000792.4858−3.41120.02171.11000.48000.99980.0055
SI1030.5000385.7514−2.08120.00023.80290.48000.99980.0062
70.500051.4245−1.70540.00053.60950.48000.99970.0064
140.500020.2913−1.29520.00024.37300.48000.99950.0088
280.500019.9810−1.35010.00004.96280.48000.99920.0112
Disclaimer/Publisher’s Note: The statements, opinions and data contained in all publications are solely those of the individual author(s) and contributor(s) and not of MDPI and/or the editor(s). MDPI and/or the editor(s) disclaim responsibility for any injury to people or property resulting from any ideas, methods, instructions or products referred to in the content.

