
A Deep Reinforcement Learning-Based Speed Optimization System to Reduce Fuel Consumption and Emissions for Smart Cities

Abstract
1. Introduction
- How can DRL algorithms, particularly the DQN-based model, be applied to optimize fuel consumption, reduce emissions and improve driving comfort and safety across various traffic scenarios?
- To what extent can the proposed DQN-based model produce effective results using existing traffic data and how adaptable is it to different traffic conditions, in terms of both environmental impact and user experience?
- How does the performance of the DQN-based model compare to other methods in the existing literature in terms of fuel consumption, emissions, driving comfort and safety?
- Can the proposed method be applied to vehicles driven by human drivers and what is its potential to improve traffic flow, reduce fuel consumption, enhance driving comfort and increase safety in real-world traffic conditions?
- Hypothesis 1: The DQN-based model can effectively optimize fuel consumption, reduce CO2 emissions and improve driving comfort and safety by learning optimal driving policies in various traffic scenarios.
- Hypothesis 2: The DQN-based model, when trained with existing traffic data, can produce reliable results in optimizing fuel consumption, reducing emissions and improving driving comfort and safety, and it can be generalized to various urban traffic conditions.
- Hypothesis 3: The DQN-based model will outperform other DRL methods or traditional traffic optimization techniques in terms of fuel consumption reduction, environmental impact and enhancements in driving comfort and safety.
- Hypothesis 4: The proposed DQN-based method can be applied to vehicles with human drivers, improving traffic flow, reducing congestion, decreasing fuel consumption and enhancing driving comfort and safety in real-world driving situations.
- Using different scenarios, the proposed method’s performance in reducing fuel consumption, emission release and environmental pollution was demonstrated.
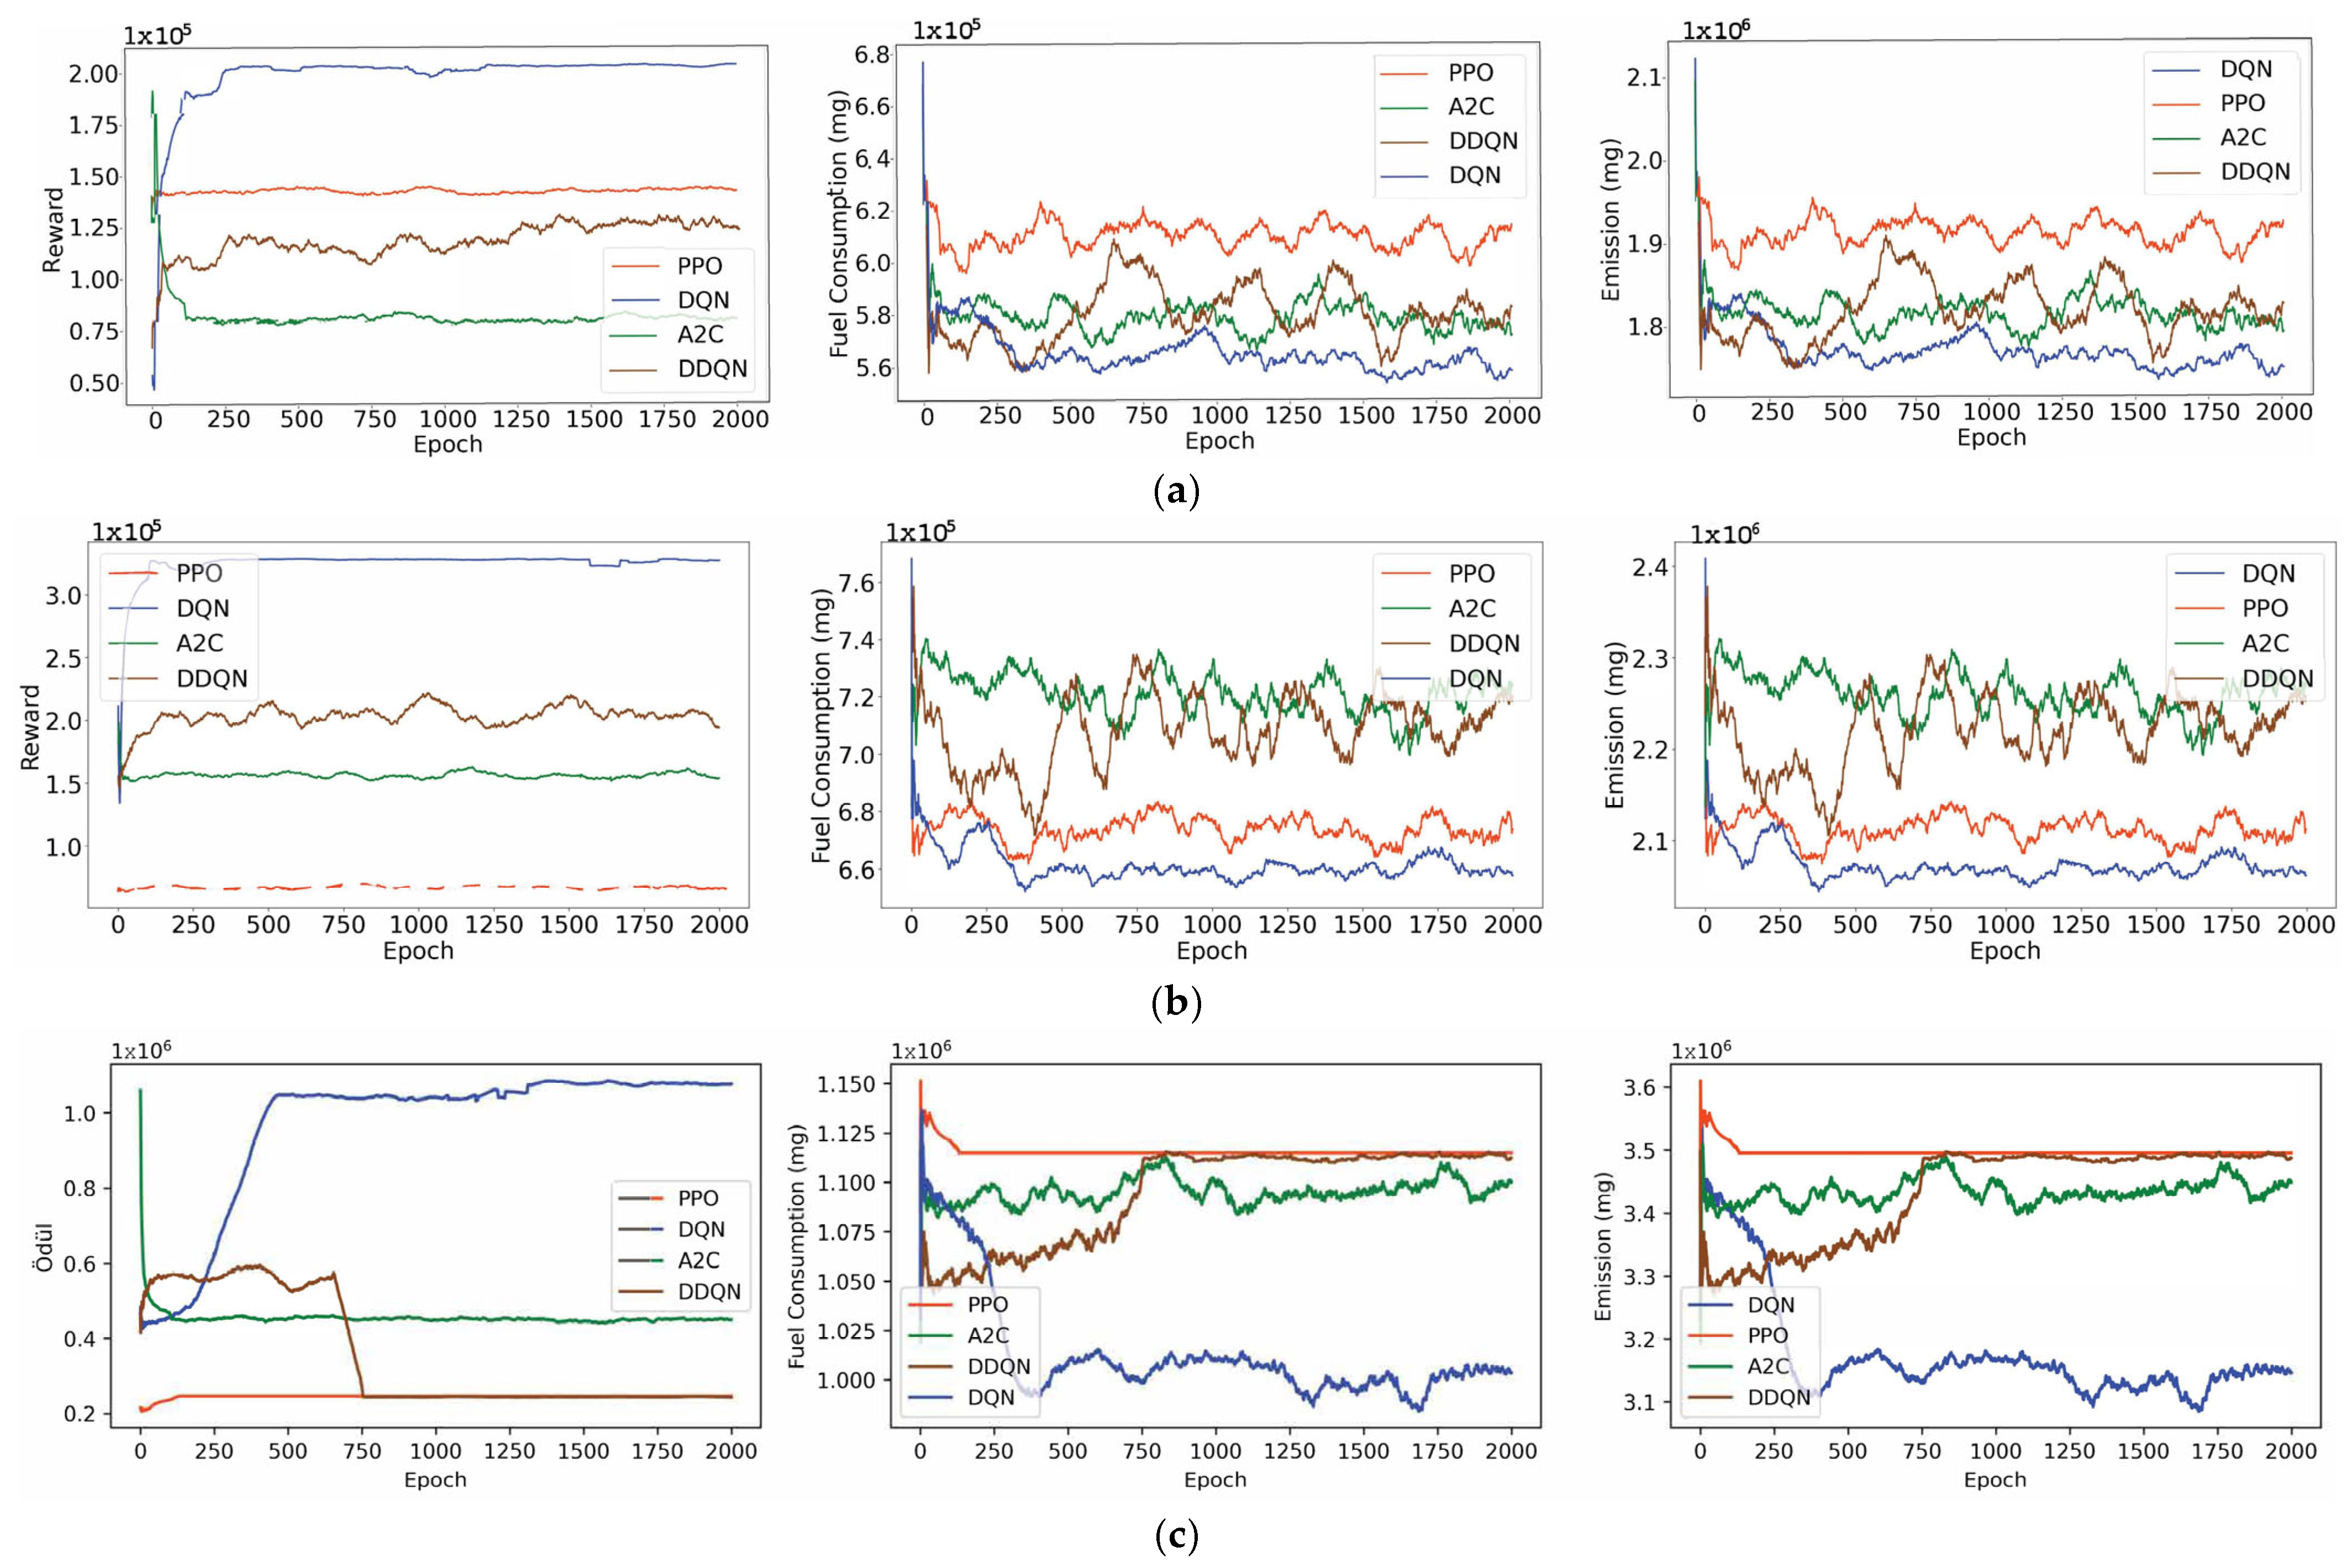
- Recently popular DRL algorithms such as DQN, Double Deep Q-Network (DDQN), Proximal Policy Optimization (PPO) and Advantage Actor-Critic (A2C) were trained on the same scenarios, and their results were compared in terms of reducing fuel consumption, environmental pollution and emission release; it is thought that the proposed method is more successful and will contribute to this area.
- A method that can be applied not only to autonomous vehicles but also to existing vehicles is proposed.
2. Materials and Methods
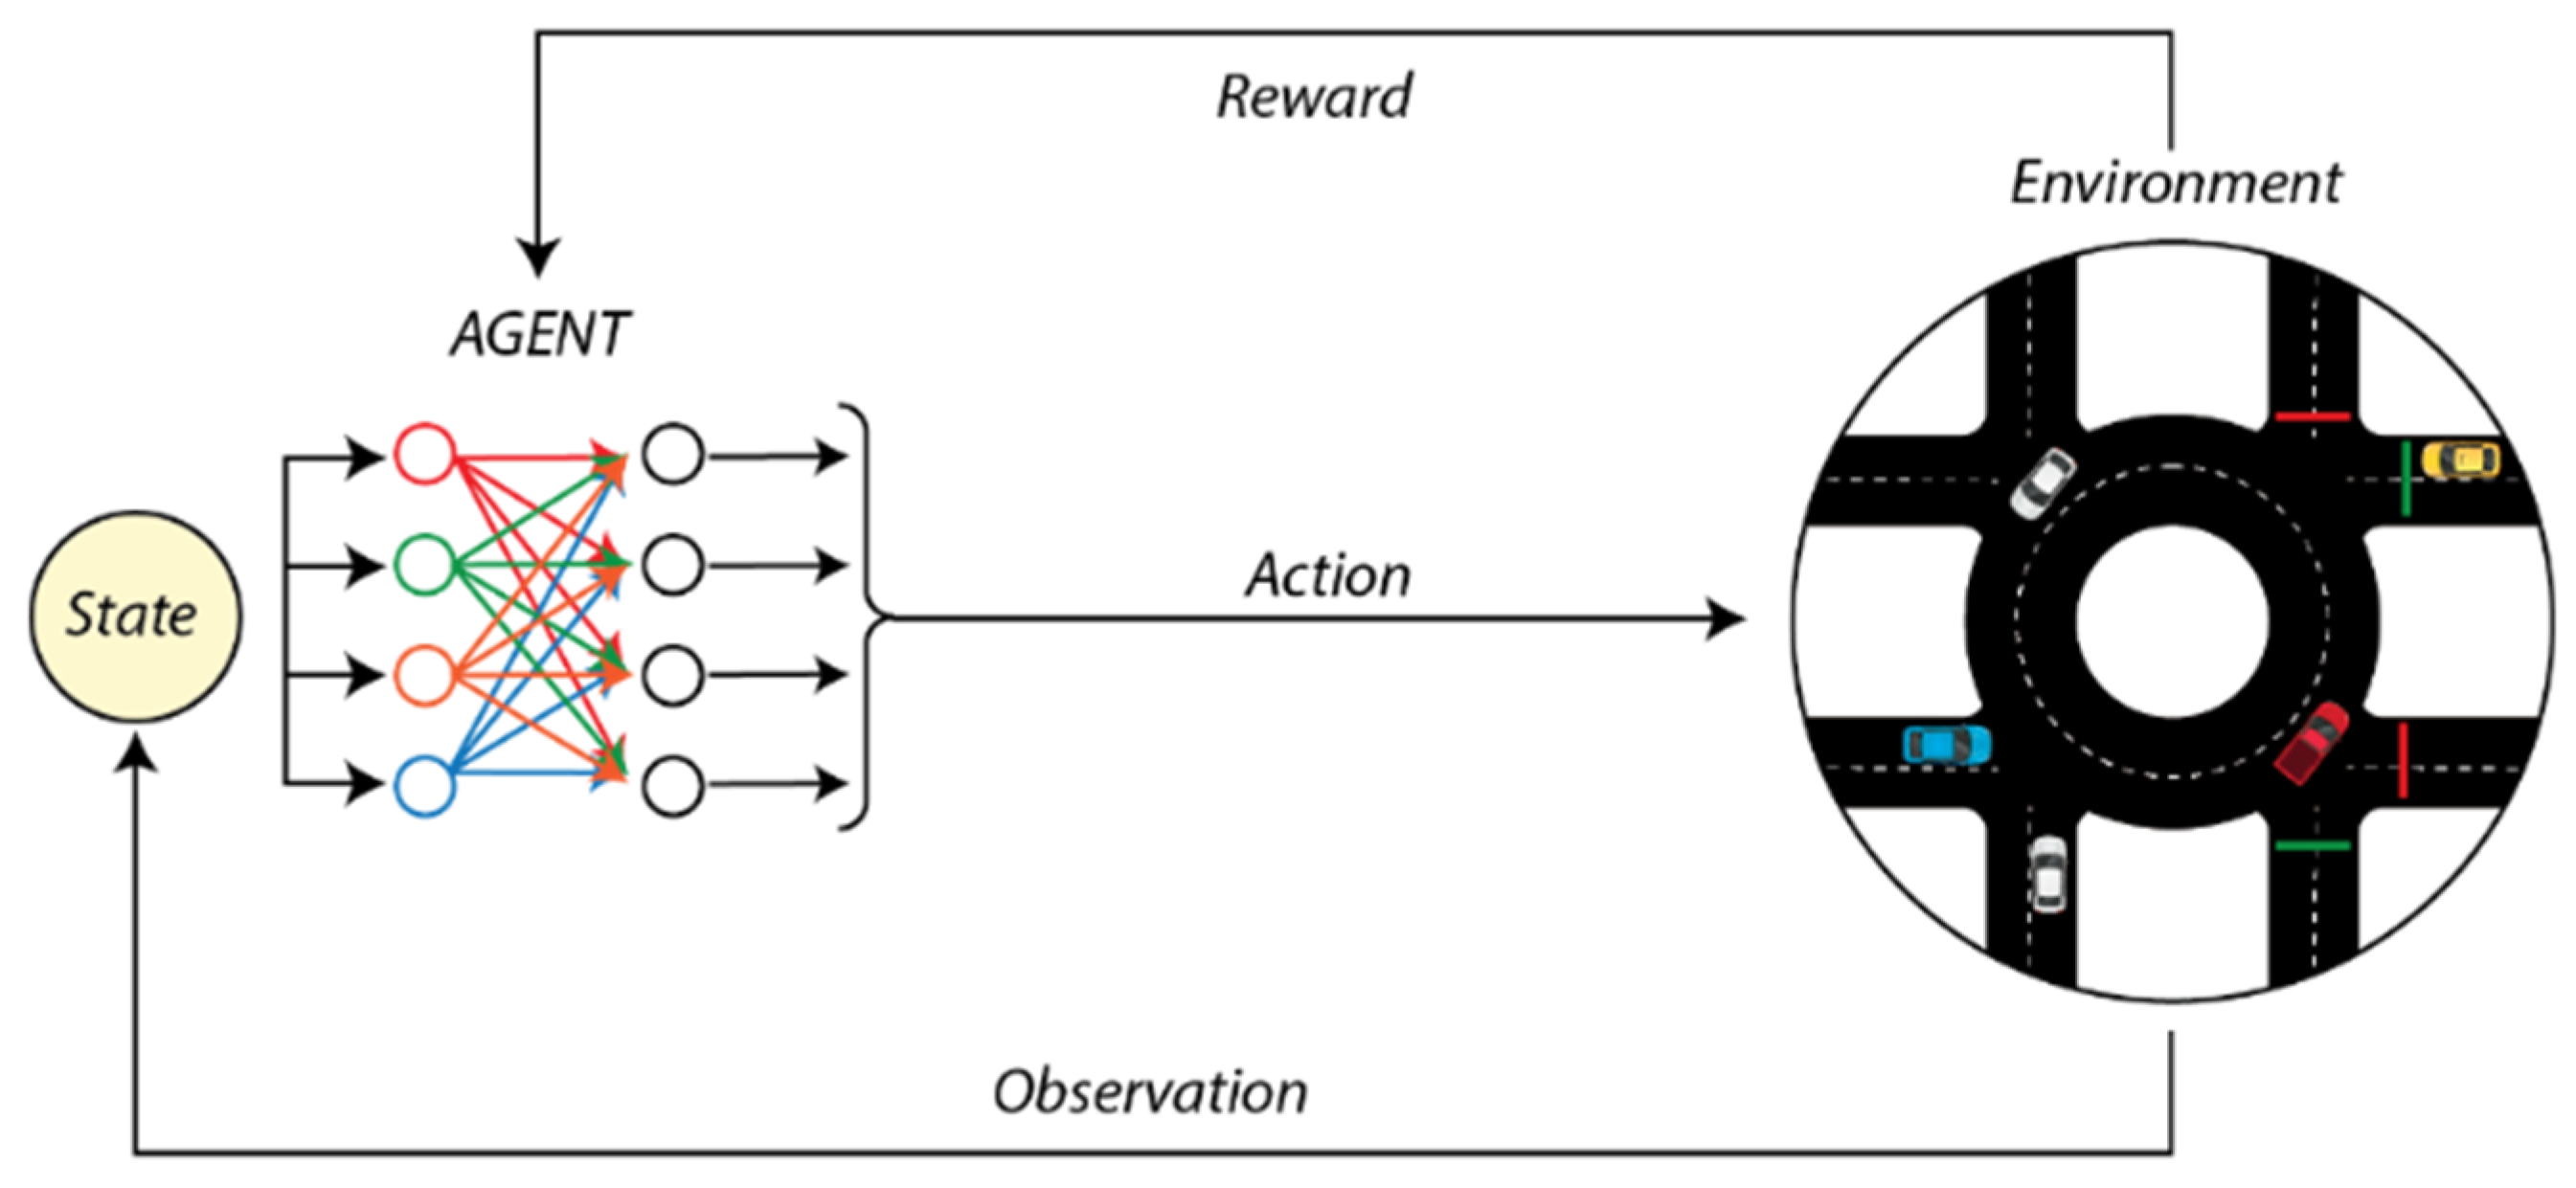
2.1. Deep Reinforcement Learning
2.1.1. Reward Function Design
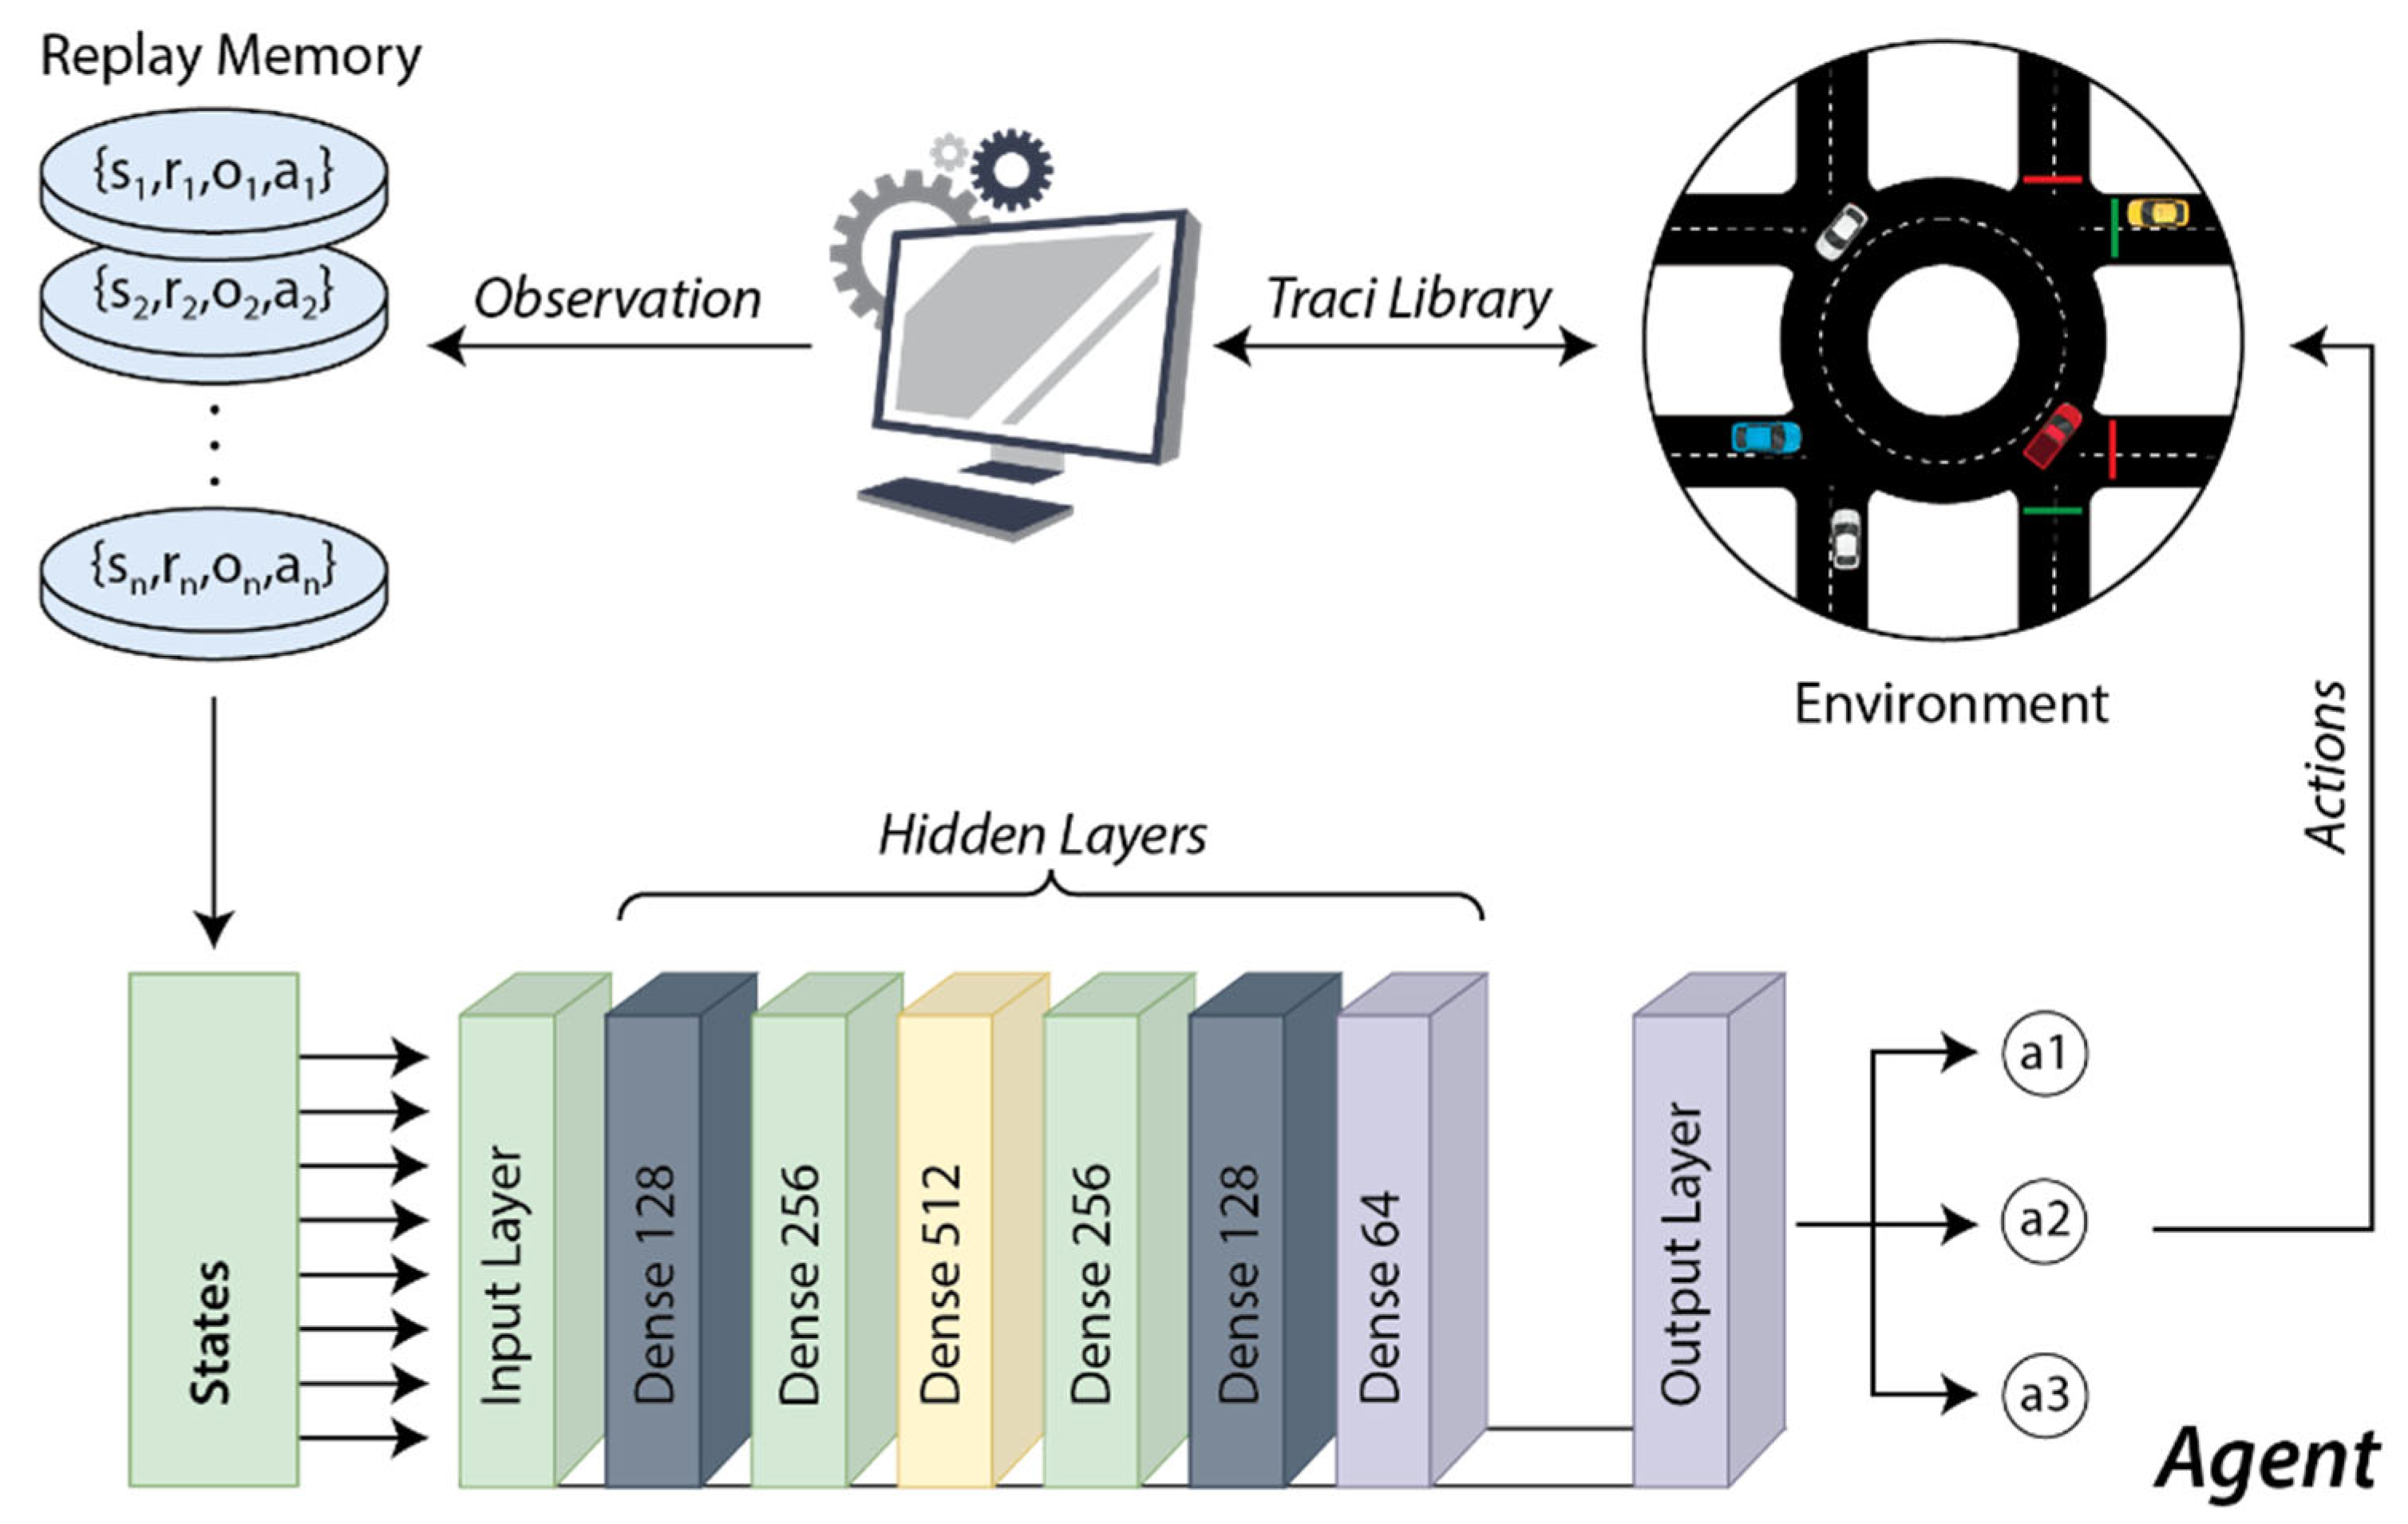
2.1.2. Neural Network Development
3. Experimental Results
3.1. Experimental Setups
3.1.1. Development of the Reward Function in the Study
3.1.2. Development of the Neural Network in the Study
3.2. Results
4. Discussion
5. Conclusions
- Fuel Consumption Reduction: In the most complex traffic conditions of Scenario 3, the DQN algorithm was found to consume up to 15% less fuel than other DRL methods.
- Emission Reduction: In all the scenarios, the DQN method was found to reduce the CO2 emissions by an average of 13% compared to the baseline methods.
- Improved Traffic Flow: The proposed method minimized stop-and-go movements and also optimized vehicle acceleration leading to a 22% decrease in the average time spent at traffic lights.
Author Contributions
Funding
Institutional Review Board Statement
Informed Consent Statement
Data Availability Statement
Conflicts of Interest
References
- Castillo, O.; Álvarez, R.; Domingo, R. Opportunities and Barriers of Hydrogen–Electric Hybrid Powertrain Vans: A Systematic Literature Review. Processes 2020, 8, 1261. [Google Scholar] [CrossRef]
- Rawat, A.; Garg, C.P.; Sinha, P. Analysis of the key hydrogen fuel vehicles adoption barriers to reduce carbon emissions under net zero target in emerging market. Energy Policy 2024, 184, 113847. [Google Scholar] [CrossRef]
- Yiğit, Y.; Karabatak, M. Akıllı Şehirler ve Trafik Güvenliği için Sürüş Kontrolü Uygulaması. Fırat Üniversitesi Mühendislik Bilim. Derg. 2023, 35, 761–770. [Google Scholar] [CrossRef]
- Li, J.; Wu, X.; Fan, J.; Liu, Y.; Xu, M. Overcoming driving challenges in complex urban traffic: A multi-objective eco-driving strategy via safety model based reinforcement learning. Energy 2023, 284, 128517. [Google Scholar] [CrossRef]
- Çeltek, S.A. Şehir Içi Trafik Sinyal Ağinin Takviyeli Öğrenme Algoritmalari Ve Nesnelerin Interneti Tabanli Kontrolü; Konya Teknik Üniversitesi: Konya, Türkiye, 2021. [Google Scholar]
- Liu, Z.; Hu, J.; Song, T.; Huang, Z. A Methodology Based on Deep Reinforcement Learning to Autonomous Driving with Double Q-Learning. In Proceedings of the 2021 the 7th International Conference on Computer and Communications, Chengdu, China, 10–13 December 2021; pp. 1266–1271. [Google Scholar]
- Liu, B.; Sun, C.; Wang, B.; Sun, F. Adaptive Speed Planning of Connected and Automated Vehicles Using Multi-Light Trained Deep Reinforcement Learning. IEEE Trans. Veh. Technol. 2022, 71, 3533–3546. [Google Scholar] [CrossRef]
- Cabannes, T.; Li, J.; Wu, F.; Dong, H.; Bayen, A.M. Learning Optimal Traffic Routıng Behaviors Using Markovian Framework in Microscopıc Simulatıon. In Proceedings of the Transportation Review Board Annual Meeting, Wahington, DC, USA, 12–16 January 2020. [Google Scholar]
- Bhuiyan, M.; Kabir, M.A. Vehicle Speed Prediction based on Road Status using Machine Learning. Adv. Res. Energy Eng. 2020, 2, 1–9. [Google Scholar]
- Mnih, V.; Kavukcuoglu, K.; Silver, D.; Rusu, A.A.; Veness, J.; Bellemare, M.G.; Graves, A.; Riedmiller, M.; Fidjeland, A.K.; Ostrovski, G.; et al. Human-level control through deep reinforcement learning. Nature 2015, 518, 529–533. [Google Scholar] [CrossRef]
- Mnih, V. Playing atari with deep reinforcement learning. arXiv 2013, arXiv:1312.5602. [Google Scholar]
- Zhou, S.; Chen, X.; Li, C.; Chang, W.; Wei, F.; Yang, L. Intelligent Road Network Management Supported by 6G and Deep Reinforcement Learning. IEEE Trans. Intell. Transp. Syst. 2024, PP, 1–9. [Google Scholar] [CrossRef]
- Zhang, Z.; Fei, Y.; Fu, D. A Deep Reinforcement Learning Traffic Control Model for Pedestrian and Vehicle Evacuation in the Parking Lot. Physica A Stat. Mech. Appl. 2024, 646, 129876. [Google Scholar] [CrossRef]
- Wang, T.; Qu, D.; Wang, K.; Dai, S. Deep Reinforcement Learning Car-Following Control Based on Multivehicle Motion Prediction. Electronics 2024, 13, 1133. [Google Scholar] [CrossRef]
- Hua, C.; Fan, W. Safety-oriented dynamic speed harmonization of mixed traffic flow in nonrecurrent congestion. Physica A Stat. Mech. Appl. 2024, 634, 129439. [Google Scholar] [CrossRef]
- Gao, C.; Wang, Z.; Wang, S.; Li, Y. Mitigating oscillations of mixed traffic flows at a signalized intersection: A multiagent trajectory optimization approach based on oscillation prediction. Physica A Stat. Mech. Appl. 2024, 635, 129538. [Google Scholar] [CrossRef]
- Makantasis, K.; Kontorinaki, M.; Nikolos, I. A Deep Reinforcement Learning Driving Policy for Autonomous Road Vehicles. arXiv 2019, arXiv:1907.05246. [Google Scholar] [CrossRef]
- Li, J.; Fotouhi, A.; Pan, W.; Liu, Y.; Zhang, Y.; Chen, Z. Deep reinforcement learning-based eco-driving control for connected electric vehicles at signalized intersections considering traffic uncertainties. Energy 2023, 279, 128139. [Google Scholar] [CrossRef]
- Pérez-Gil, Ó.; Barea, R.; López-Guillén, E.; Bergasa, L.M.; Gómez-Huélamo, C.; Gutiérrez, R.; Díaz-Díaz, A. Deep reinforcement learning based control for Autonomous Vehicles in CARLA. Multimed. Tools Appl. 2022, 81, 3553–3576. [Google Scholar] [CrossRef]
- EL Sallab, A.; Abdou, M.; Perot, E.; Yogamani, S. Deep Reinforcement Learning framework for Autonomous Driving. Electron. Imaging 2017, 29, 70–76. [Google Scholar] [CrossRef]
- Zhang, Z. Autonomous Car Driving Based on Deep Reinforcement Learning. In Proceedings of the 2022 International Conference on Economics, Smart Finance and Contemporary Trade (ESFCT 2022), Xi’an, China, 22–24 July 2022; Atlantis Press: Amsterdam, The Netherlands, 2022; pp. 835–842. [Google Scholar]
- Ke, P.; Yanxin, Z.; Chenkun, Y. A Decision-making Method for Self-driving Based on Deep Reinforcement Learning. AIACT 2020 IOP Publ. J. Phys. Conf. Ser. 2020, 1576, 012025. [Google Scholar] [CrossRef]
- Zhao, J.; Qu, T.; Xu, F. A Deep Reinforcement Learning Approach for Autonomous Highway Driving. IFAC-PapersOnLine 2020, 53, 542–546. [Google Scholar] [CrossRef]
- Zou, Y.; Ding, L.; Zhang, H.; Zhu, T.; Wu, L. Vehicle Acceleration Prediction Based on Machine Learning Models and Driving Behavior Analysis. Appl. Sci. 2022, 12, 5259. [Google Scholar] [CrossRef]
- Haklay, M.; Weber, P. OpenStreetMap: User-Generated Street Maps. IEEE Pervasive Comput. 2008, 7, 12–18. [Google Scholar] [CrossRef]
- Codeca, L.; Cahill, V. Using Deep Reinforcement Learning to Coordinate Multi-Modal Journey Planning with Limited Transportation Capacity. Sumo Conf. Proc. 2022, 2, 13–32. [Google Scholar] [CrossRef]
- Reichsöllner, E.; Freymann, A.; Sonntag, M.; Trautwein, I. SUMO4AV: An Environment to Simulate Scenarios for Shared Autonomous Vehicle Fleets with SUMO Based on OpenStreetMap Data. Sumo Conf. Proc. 2022, 3, 83–94. [Google Scholar] [CrossRef]
- Boz, C.; Gülgen, F. Sumo Trafik Simülasyonu Kullanılarak Trafik Düzenlemelerinin Etkilerinin Gözlenmesi. In Proceedings of the VII. Uzaktan Algılama-CBS Sempozyumu (UZAL-CBS 2018), Eskişehir, Turkiye, 18–21 September 2018; Volume 1, pp. 467–471. [Google Scholar]
- Wegener, A.; Piórkowski, M.; Raya, M.; Hellbrück, H.; Fischer, S.; Hubaux, J.P. TraCI: An Interface for Coupling Road Traffic and Network Simulators. In Proceedings of the 11th Communications and Networking Simulation Symposium, Ottawa Canada, 14–17 April 2008; Association for Computing Machinery: New York, NY, USA, 2008. [Google Scholar]
- Hua, C.; Fan, W. Dynamic speed harmonization for mixed traffic flow on the freeway using deep reinforcement learning. IET Intell. Transp. Syst. 2023, 17, 2519–2530. [Google Scholar] [CrossRef]
- Schulman, J.; Wolski, F.; Dhariwal, P.; Radford, A.; Klimov, O. Proximal policy optimization algorithms. arXiv 2017, arXiv:1707.06347. [Google Scholar]
- Anwar, M.; Wang, C.; De Nijs, F.; Wang, H. Proximal Policy Optimization Based Reinforcement Learning for Joint Bidding in Energy and Frequency Regulation Markets. In Proceedings of the 2022 IEEE Power & Energy Society General Meeting (PESGM), Denver, CO, USA, 17–21 July 2022; IEEE. [Google Scholar]


| Article | Used Methods | Purpose of the Article |
|---|---|---|
| Mosabbir Bhuiyan and others [9] | Linear Regression | Speed recommendations for vehicles |
| Konstantinos Makantasis and others [17] | DDQN | Autonomous Driving Policy on the highway |
| Jie Li and others [18] | DQN | Creating a driving policy by adding multiple traffic light information for connected vehicles |
| Óscar Pérez and others [19] | DQN + deterministic policy gradient | Autonomous Driving Policy |
| Bo Liu and others [7] | DQN + deterministic policy gradient | Creating a driving policy by adding multiple traffic light information for connected vehicles |
| Ahmad El Sallab and others [20] | DQN + CNN | Autonomous Driving Policy |
| Zelin Zhang [21] | MTD3_ improved version of TD3 | Autonomous Driving Policy |
| Pang Ke and others [22] | New Soft Actor-Critic (SAC) | Autonomous Driving Policy |
| Junwu Zhao and others [23] | DDQN | Autonomous Driving Policy on the highway |
| Yajie Zou and others [24] | Long Short-Term Memory (LSTM) and Gated Recurrent Unit (GRU) | A vehicle acceleration prediction model behavior analysis based on machine learning methods and driving is proposed. |
| Group Name | Traffic Light Id | Red (s) | Yellow (s) | Green (s) |
|---|---|---|---|---|
| Scenario 1 | TLS1 | 65 | 2 | 30 |
| TLS2 | 35 | 2 | 40 | |
| TLS3 | 40 | 2 | 50 | |
| TLS4 | 50 | 2 | 40 | |
| Scenario 2 | TLS5 | 35 | 2 | 25 |
| TLS6 | 45 | 2 | 30 | |
| TLS7 | 20 | 2 | 30 | |
| TLS8 | 40 | 2 | 20 | |
| TLS9 | 35 | 2 | 30 | |
| TLS10 | 65 | 2 | 35 | |
| TLS11 | 55 | 2 | 30 | |
| TLS12 | 39 | 6 | 39 | |
| TLS13 | 25 | 2 | 45 | |
| TLS14 | 30 | 2 | 25 | |
| Scenario 3 | TLS15 | 35 | 2 | 25 |
| TLS16 | 45 | 2 | 30 | |
| TLS17 | 20 | 2 | 30 | |
| TLS18 | 40 | 2 | 20 | |
| TLS19 | 35 | 2 | 30 | |
| TLS20 | 65 | 2 | 35 | |
| TLS21 | 55 | 2 | 30 | |
| TLS22 | 39 | 6 | 39 | |
| TLS23 | 45 | 2 | 25 | |
| TLS24 | 65 | 2 | 35 | |
| TLS25 | 30 | 2 | 25 |
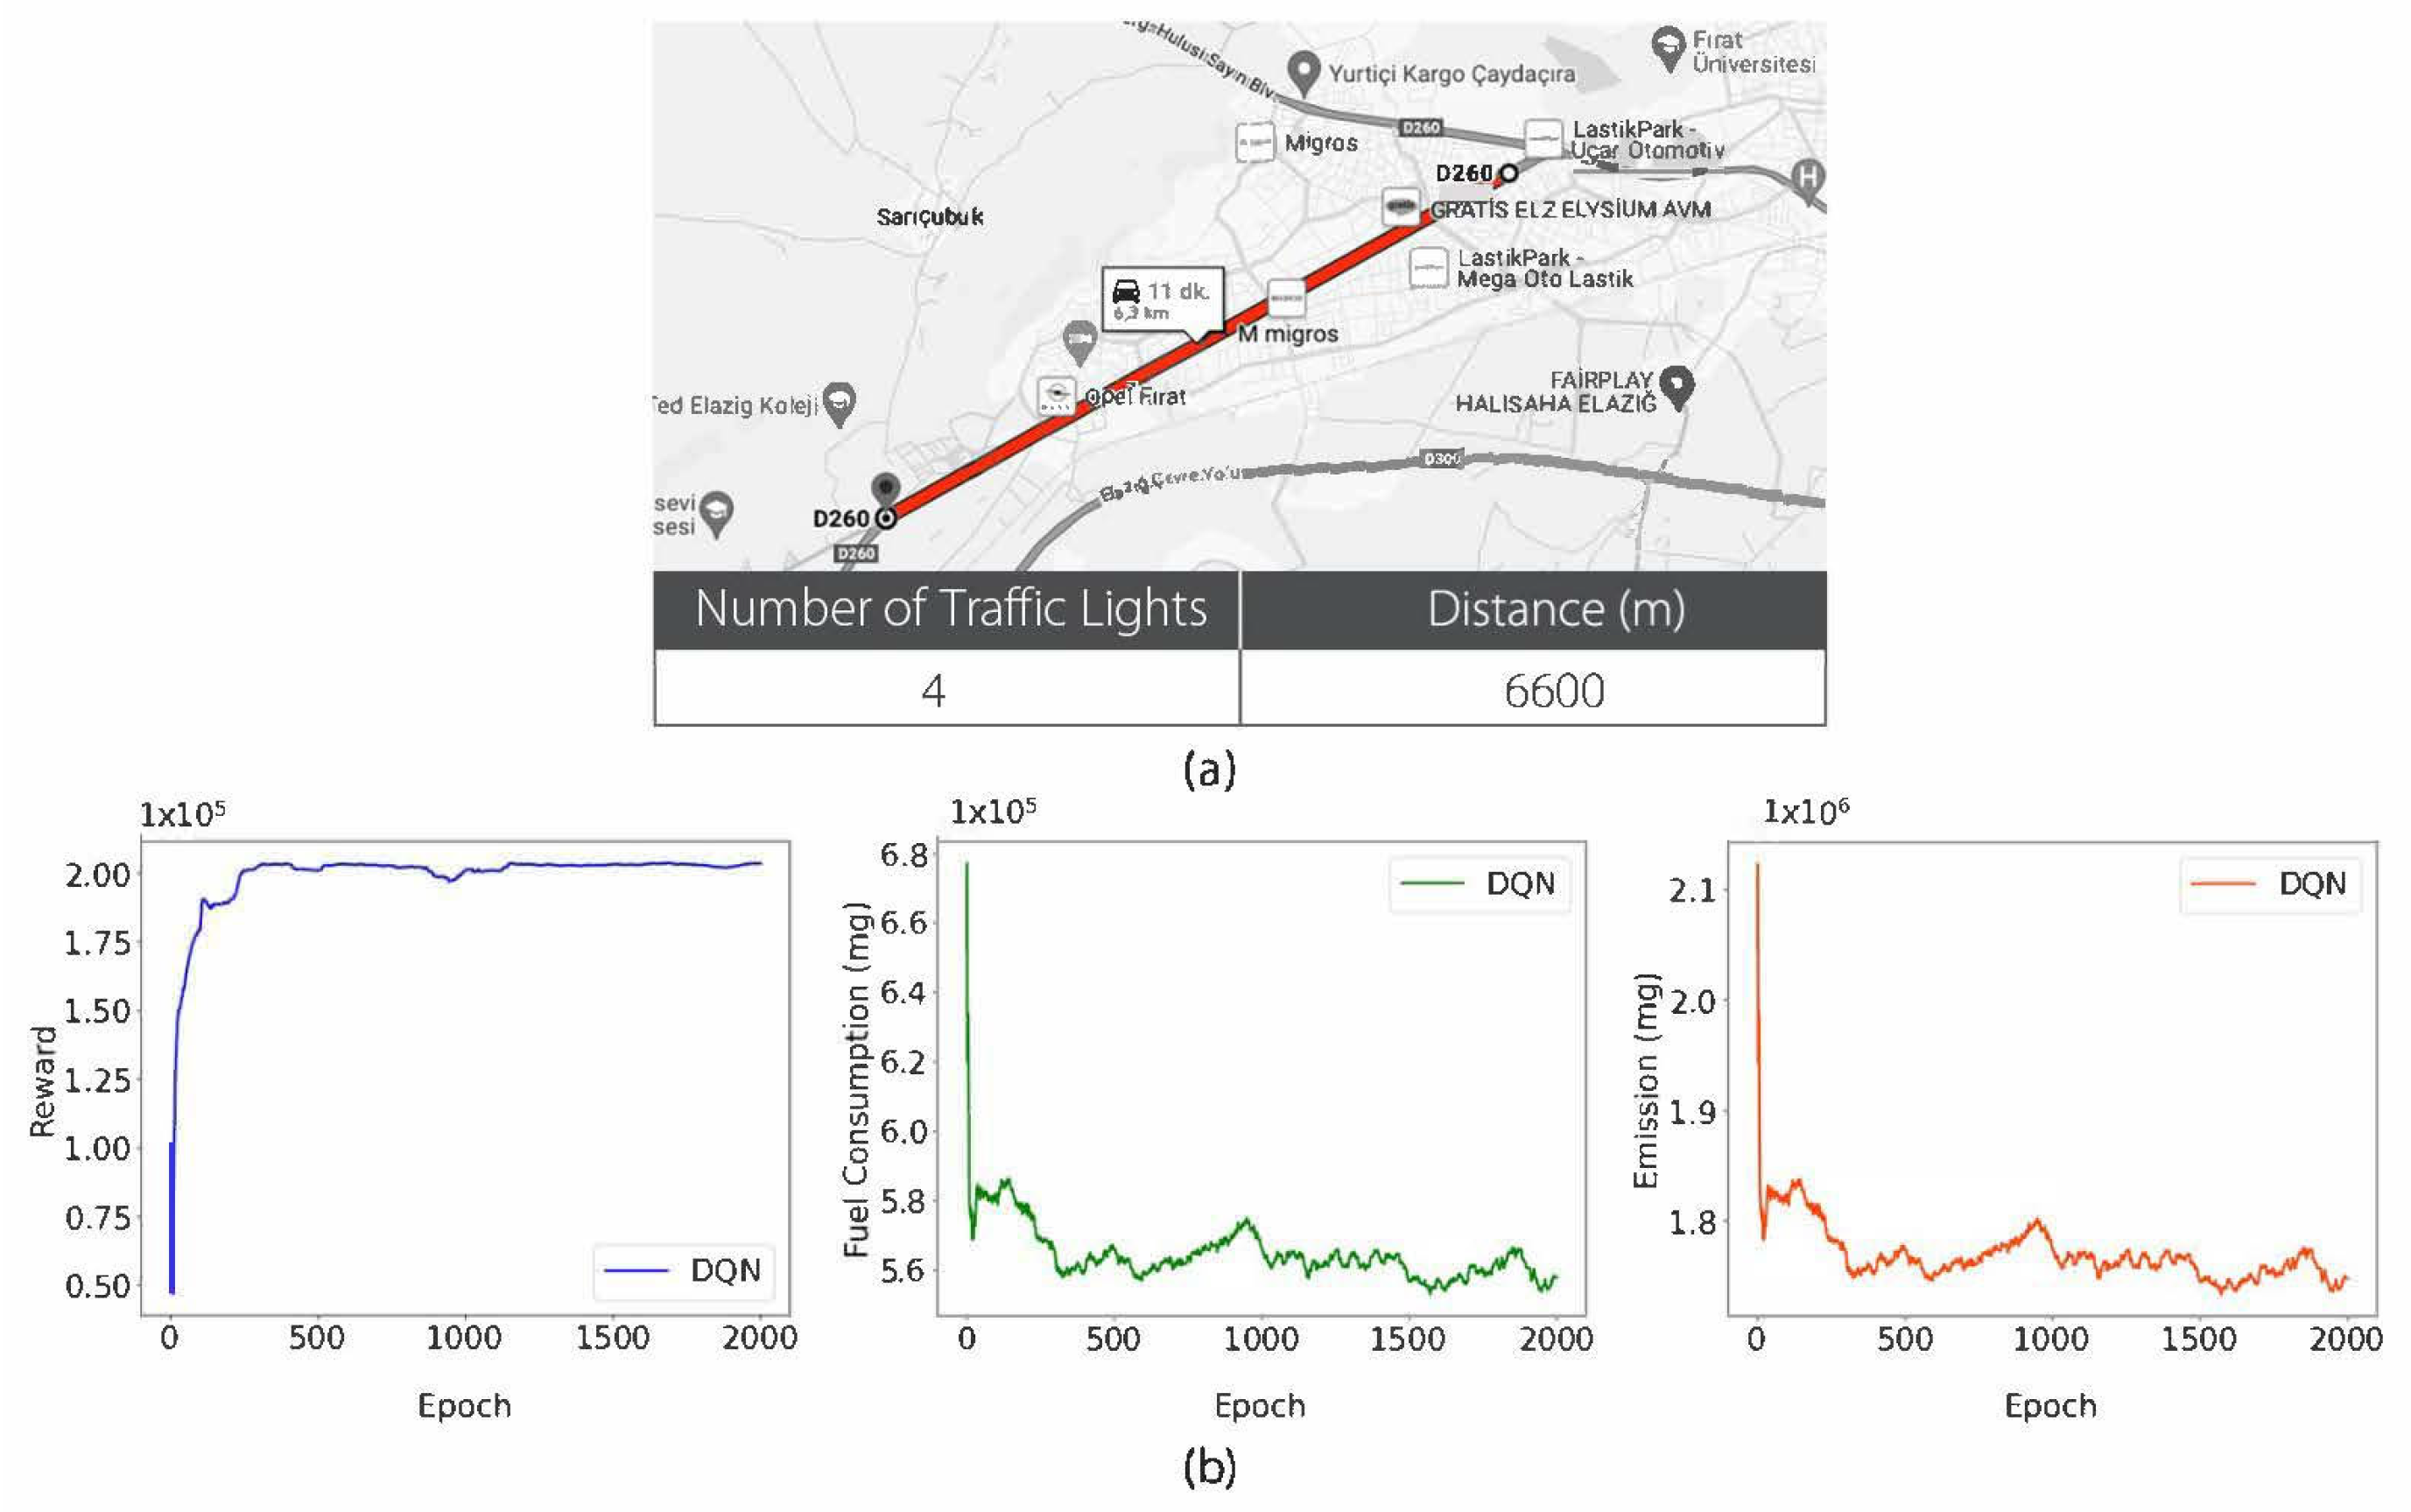
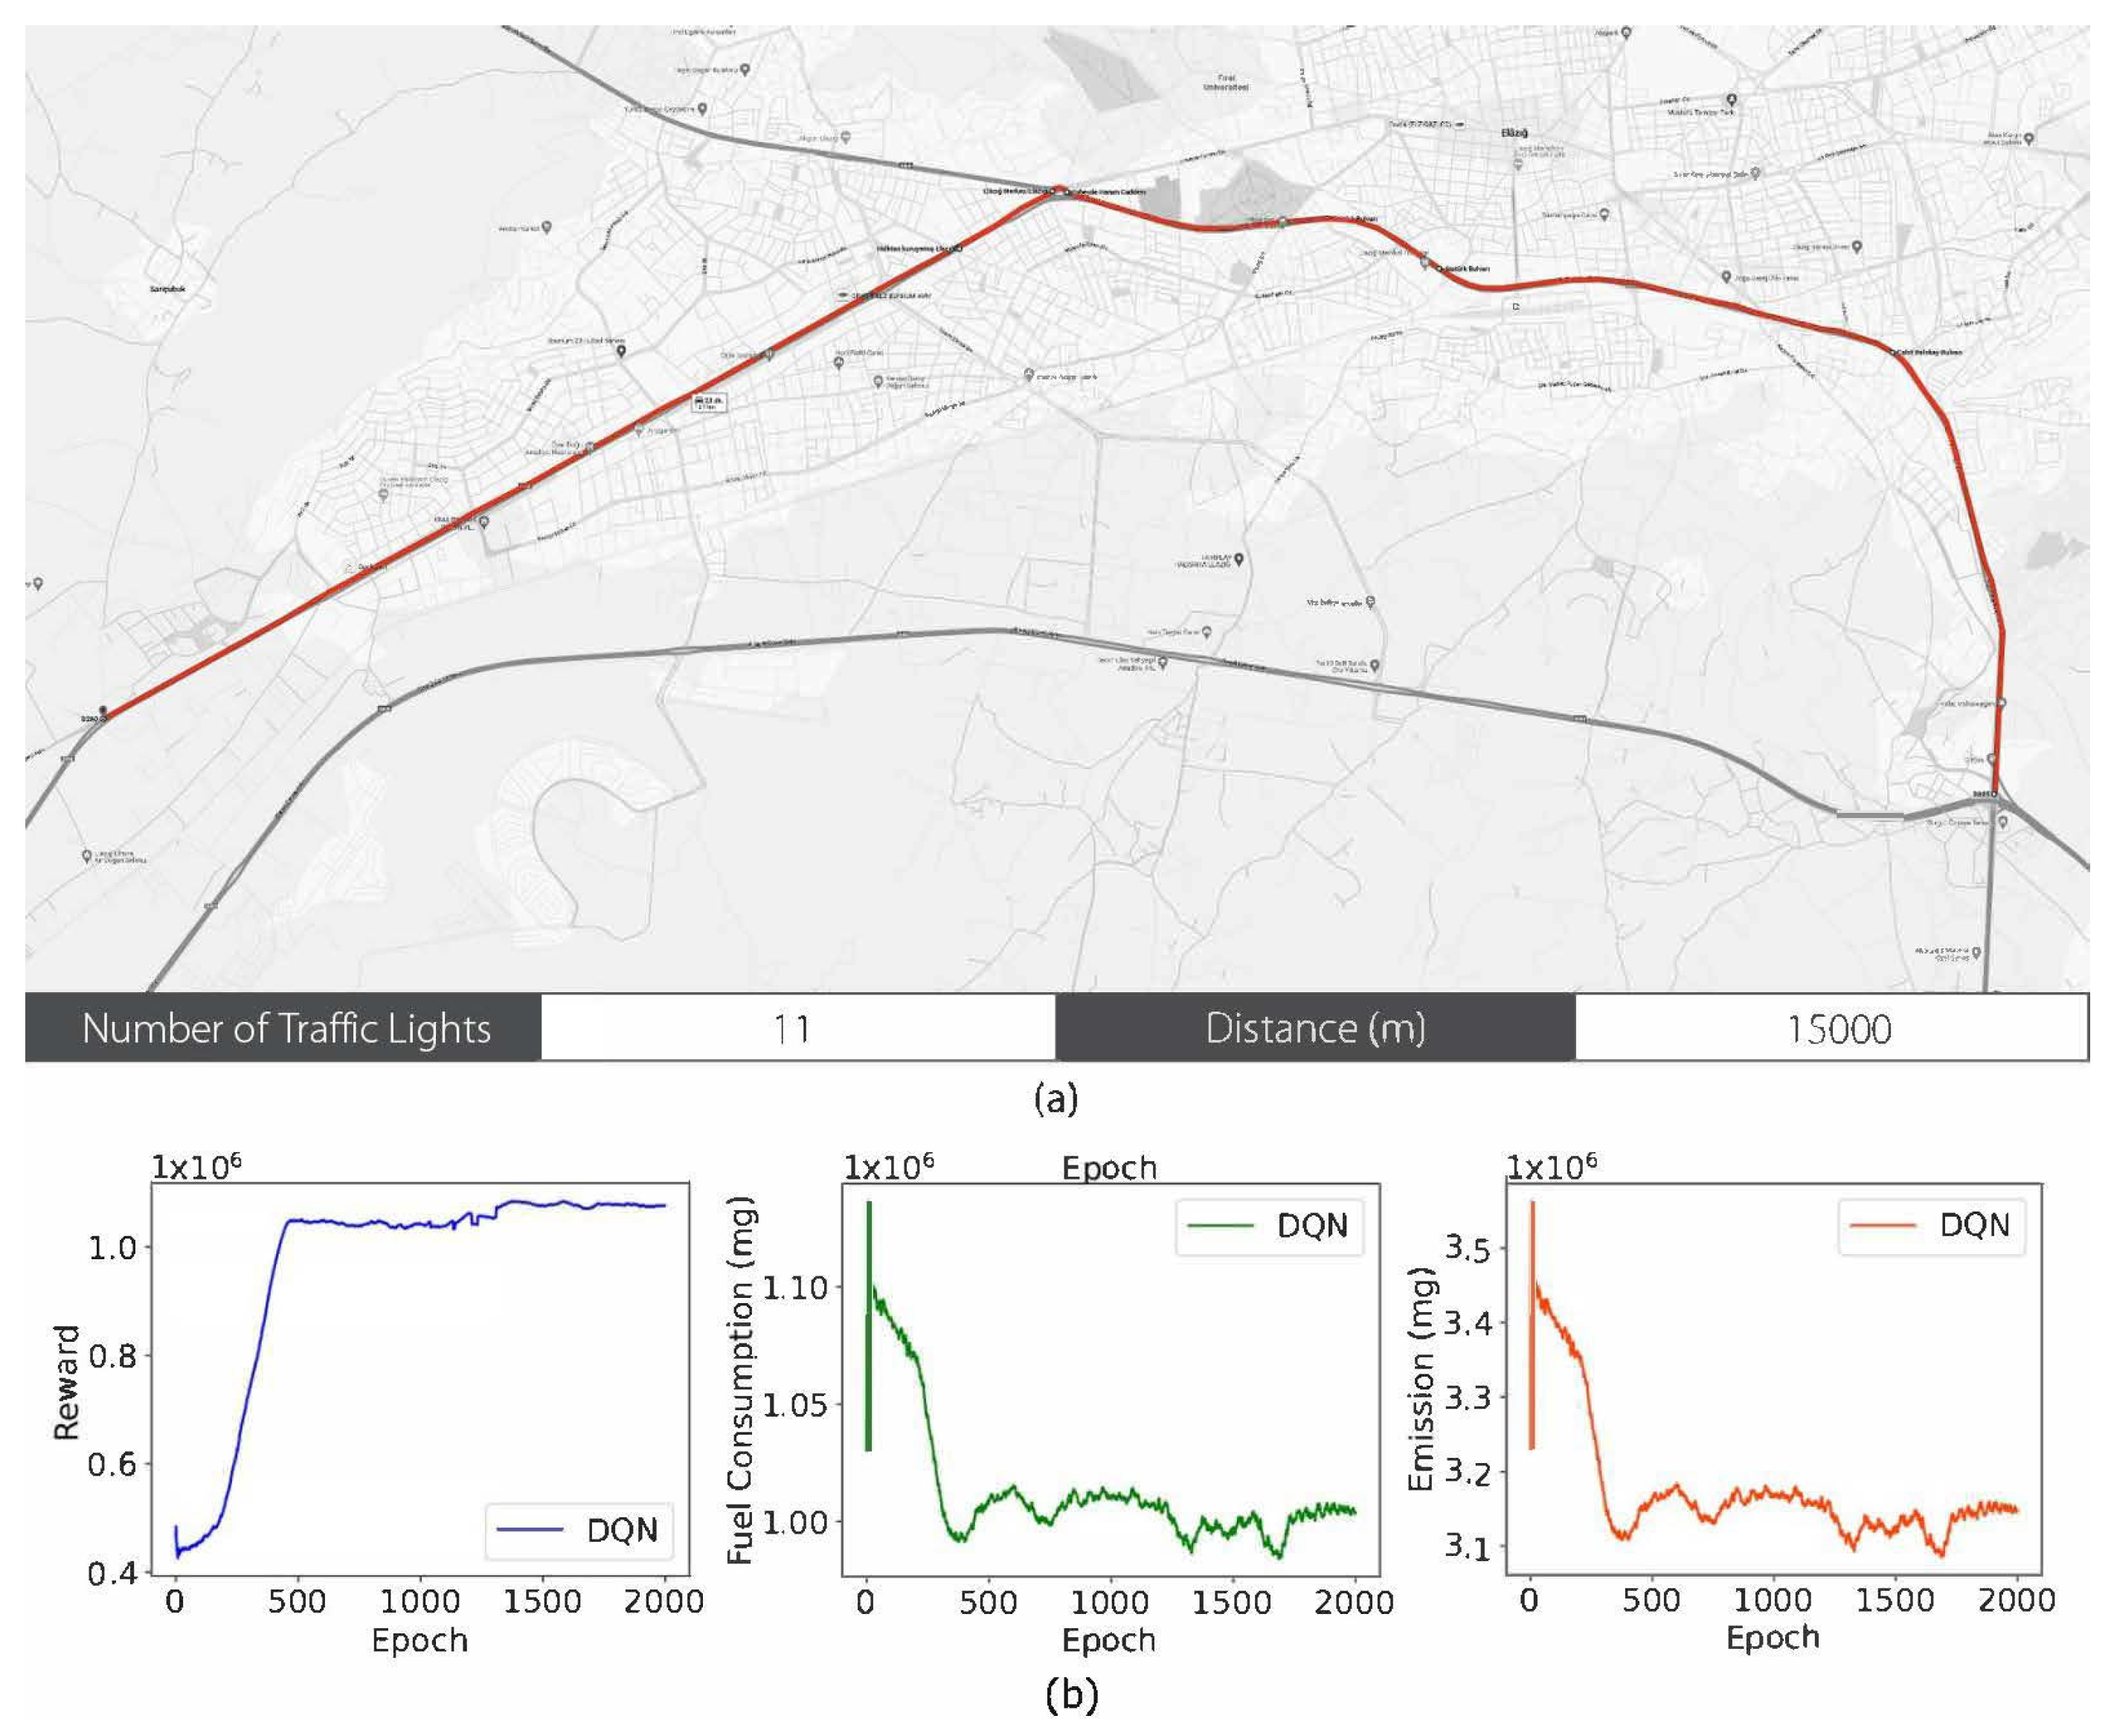
| Parameters | Scenario 1 | Scenario 2 | Scenario 3 |
|---|---|---|---|
| Distance (m) | 6600 | 8700 | 15,000 |
| Number of Traffic Lights | 4 | 11 | 10 |
| Traffic light group name | Scenario 1 | Scenario 2 | Scenario 3 |
| Car | 53% | 53% | 53% |
| Truck | 14% | 14% | 14% |
| Bus | 33% | 33% | 33% |
| Total number of Steps | 4500 | 4500 | 4500 |
| Number of states | 14 | 14 | 14 |
| Layer Name | Number of Units | Activation Function |
|---|---|---|
| Inputs | 14 | Relu |
| Dense | 128 | Relu |
| Dense | 256 | Relu |
| Dense | 512 | Relu |
| Dense | 256 | Relu |
| Dense | 128 | Relu |
| Dense | 64 | Relu |
| Outputs | Action Space | None |
| Optimizer | - | Adam |
| Parameter Name | Value |
| Epsilon | 1.0 |
| Min_epsilon | 0.01 |
| Lr (Learning rate) | 0.005 |
| Batch size | 64 |
| Gamma | 0.99 |
| Policy clip | 0.2 |
| Gae lamda | 0.95 |
| Epsilon_dec | 0.0001 |
| Loss | Mse |
Disclaimer/Publisher’s Note: The statements, opinions and data contained in all publications are solely those of the individual author(s) and contributor(s) and not of MDPI and/or the editor(s). MDPI and/or the editor(s) disclaim responsibility for any injury to people or property resulting from any ideas, methods, instructions or products referred to in the content. |
© 2025 by the authors. Licensee MDPI, Basel, Switzerland. This article is an open access article distributed under the terms and conditions of the Creative Commons Attribution (CC BY) license (https://creativecommons.org/licenses/by/4.0/).
Share and Cite
Yiğit, Y.; Karabatak, M. A Deep Reinforcement Learning-Based Speed Optimization System to Reduce Fuel Consumption and Emissions for Smart Cities. Appl. Sci. 2025, 15, 1545. https://doi.org/10.3390/app15031545
Yiğit Y, Karabatak M. A Deep Reinforcement Learning-Based Speed Optimization System to Reduce Fuel Consumption and Emissions for Smart Cities. Applied Sciences. 2025; 15(3):1545. https://doi.org/10.3390/app15031545
Chicago/Turabian StyleYiğit, Yıldıray, and Murat Karabatak. 2025. "A Deep Reinforcement Learning-Based Speed Optimization System to Reduce Fuel Consumption and Emissions for Smart Cities" Applied Sciences 15, no. 3: 1545. https://doi.org/10.3390/app15031545
APA StyleYiğit, Y., & Karabatak, M. (2025). A Deep Reinforcement Learning-Based Speed Optimization System to Reduce Fuel Consumption and Emissions for Smart Cities. Applied Sciences, 15(3), 1545. https://doi.org/10.3390/app15031545