An Advanced Model for Greenhouse Gas Emission Reduction in the Agricultural Sector to Achieve Sustainability for Thailand’s Future
Abstract
1. Introduction
2. Literature Reviews
- The economic sector has a positively correlated influence on changes in the social sector.
- The economic sector has a negatively correlated influence on changes in the environmental sector.
- The social sector has a negatively correlated influence on changes in the environmental sector.
3. Material and Methods
3.1. Structural Equation Modeling Framework
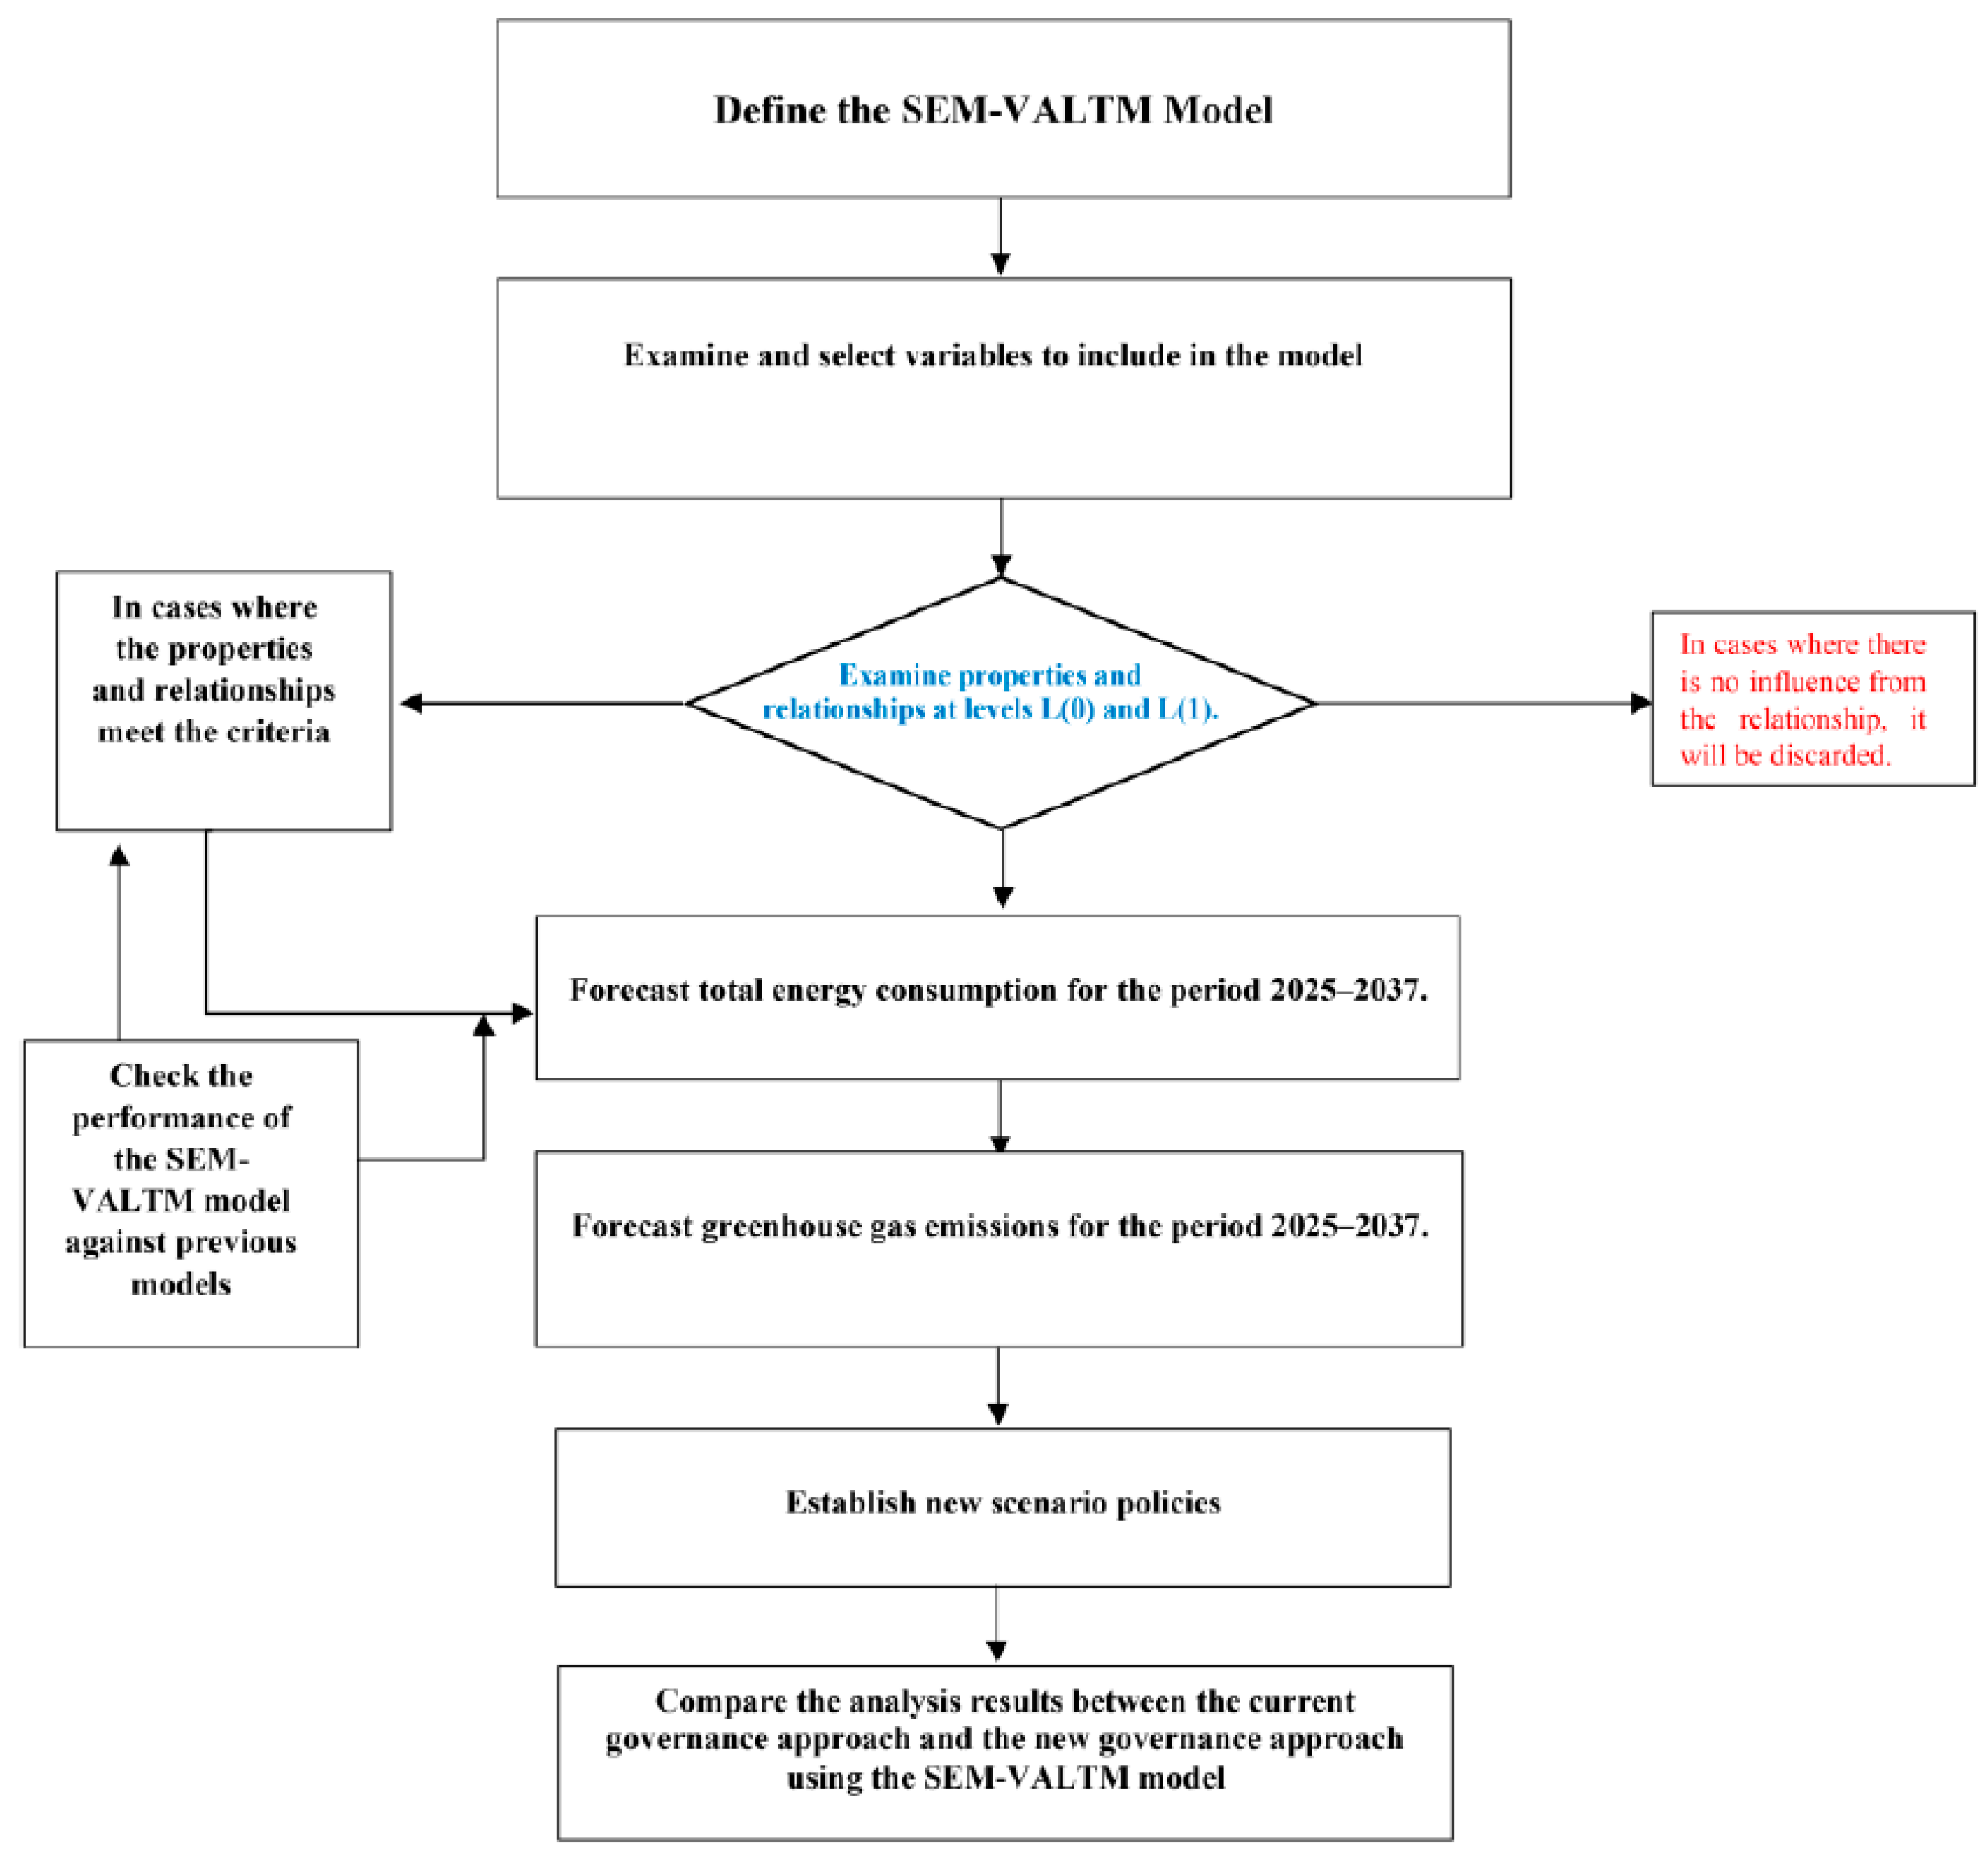
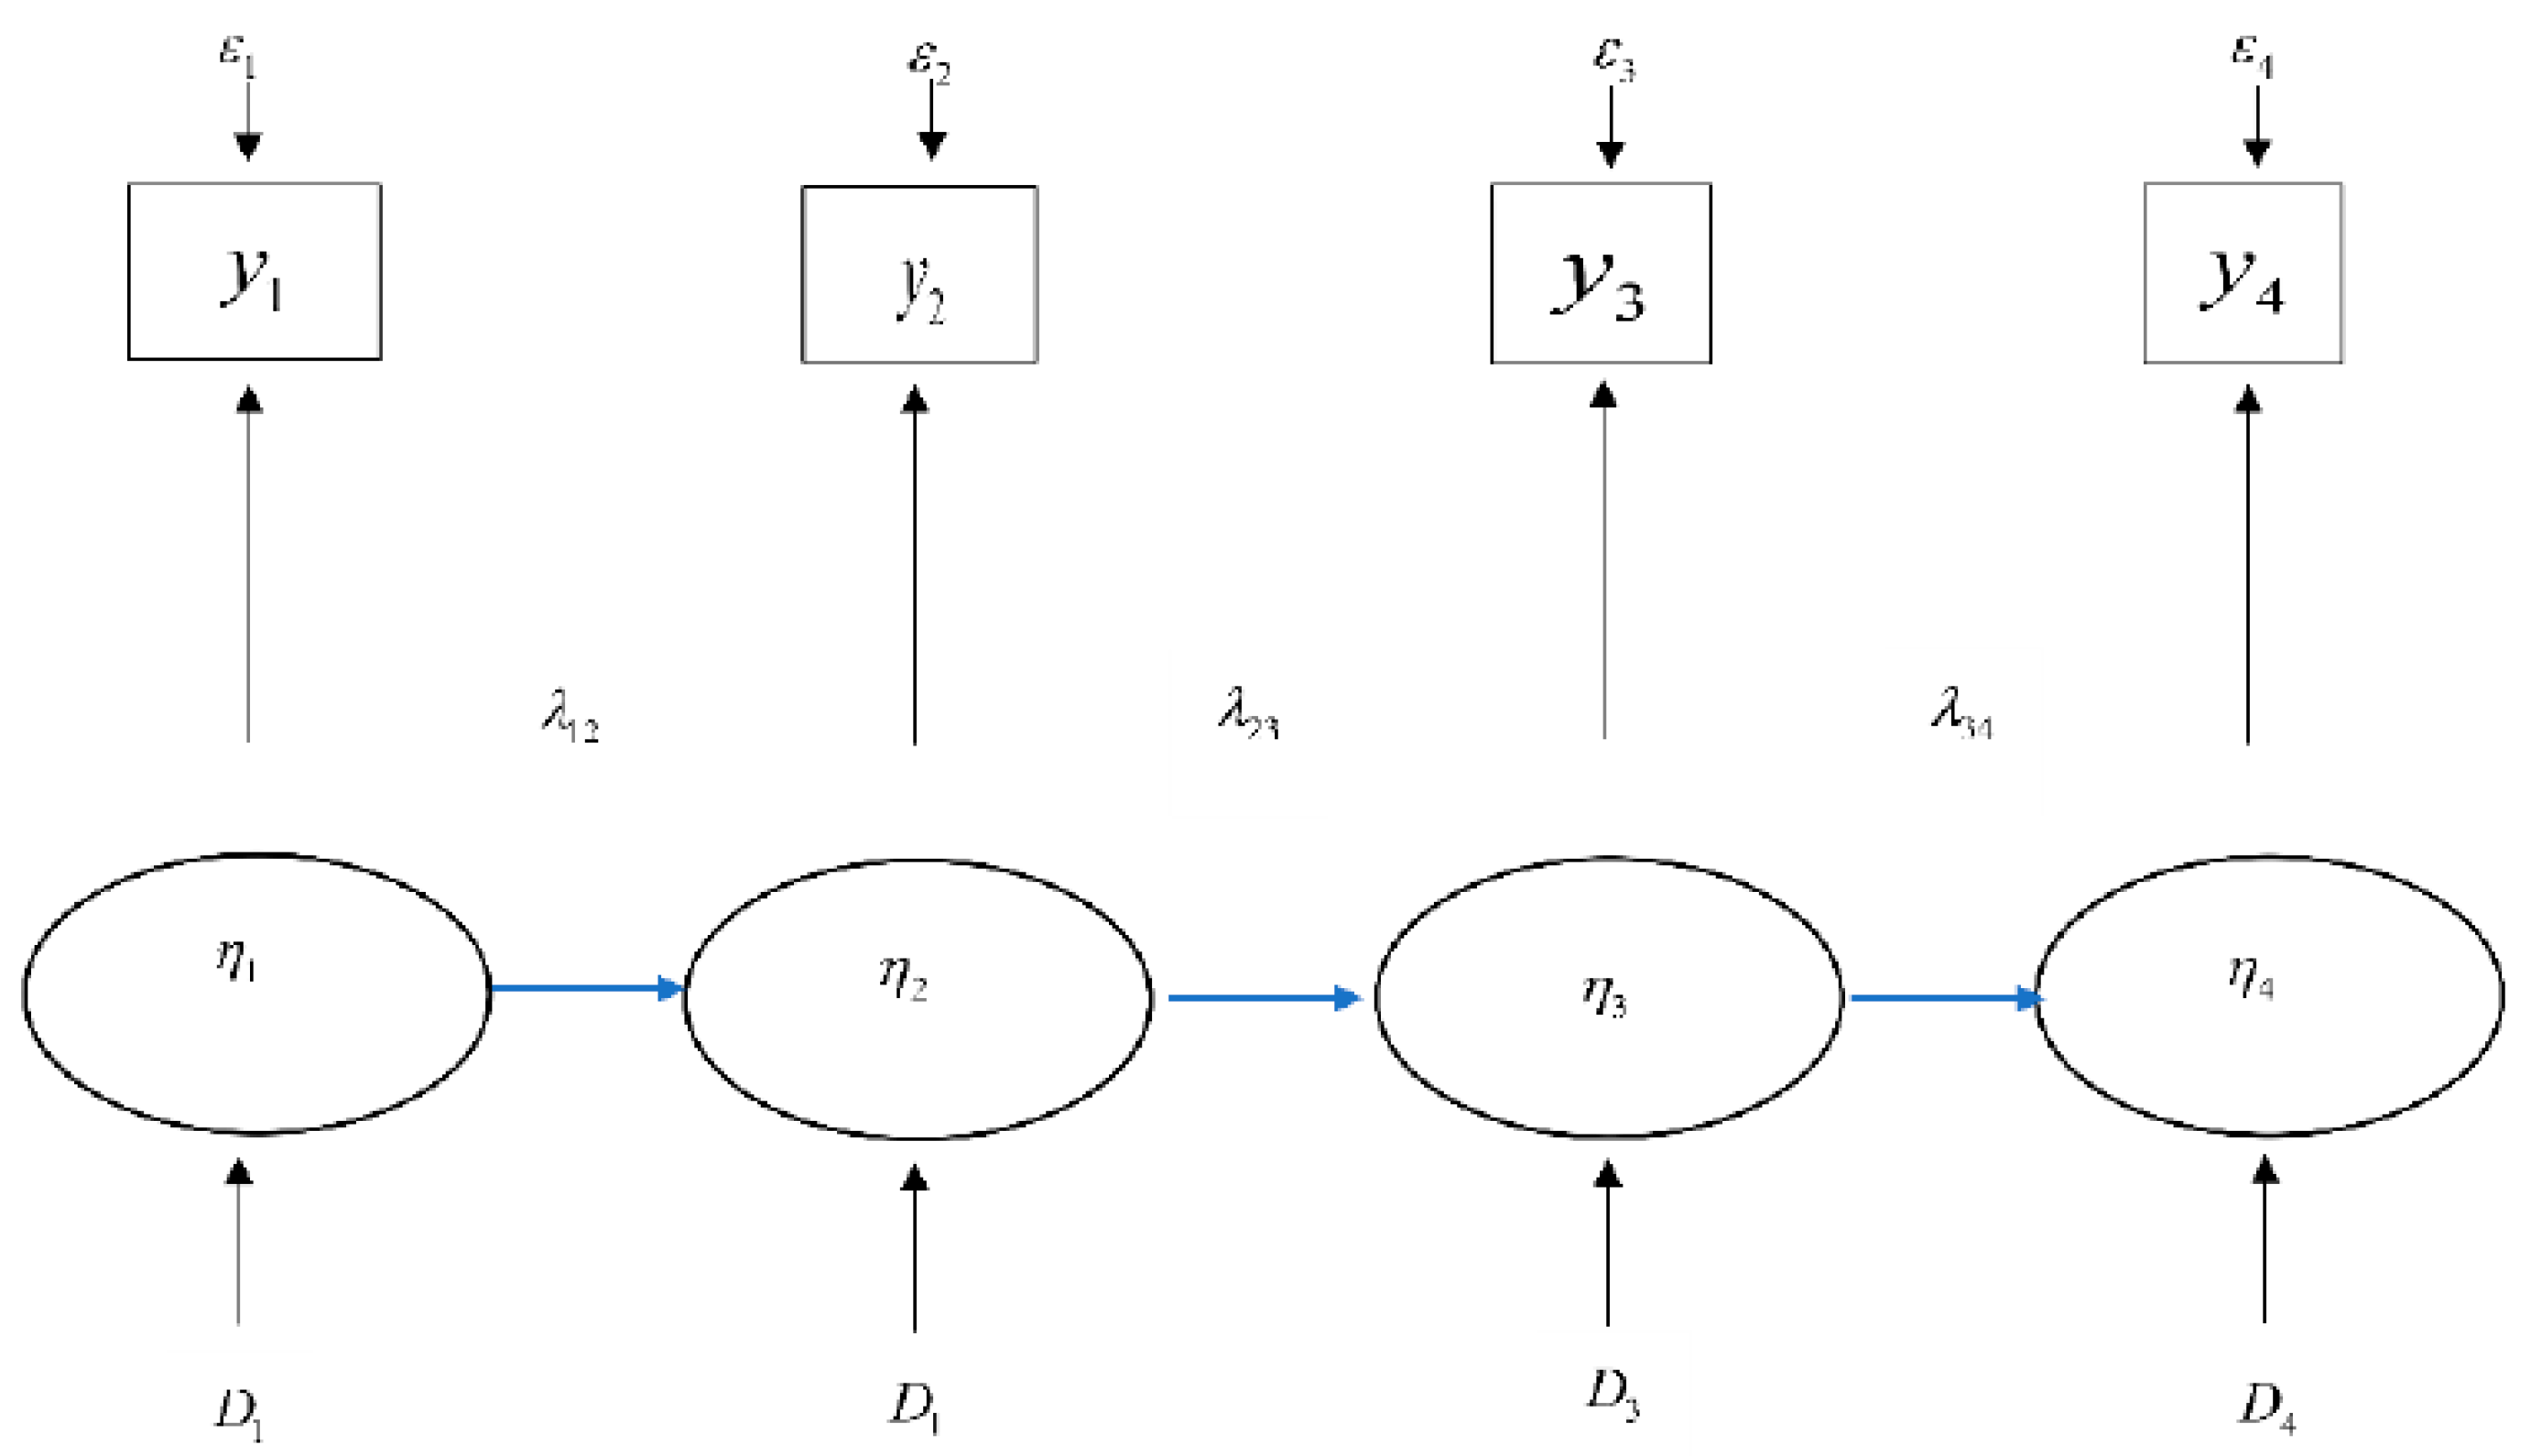
- Model Specification: Define the model by specifying that the measurement score values must not have discrepancies. The parameter for the influence of true scores in the first measurement affects the true scores in subsequent measurements [49].
- Identification of the Model: For any structural equation model, when analyzing to estimate parameters, the model must be identified to ensure that it is identifiable. A model is properly identified if the number of parameters to be estimated is fewer than the number of observed variable variance–covariance matrix members [15].
- Parameter Estimation: Once identifiability is confirmed and the model is over-identified, the program estimates all model parameters. These parameters are then used to compute the variance–covariance values of the observed variables in the model.
- Model Fit Assessment: Check if the hypothetical model aligns with the empirical data. In this research, the model fit indices considered include a non-significant chi-square statistic, the chi-square/degrees of freedom ratio should be less than 2, or less than 5 for more complex models; the Comparative Fit Index (CFI) and Tucker–Lewis Index (TLI) should be 0.90 or higher, preferably 0.95 or higher; the Standardized Root Mean Square Residual (SRMR) should be less than 0.05 for good fit and 0.05 to 0.79 for acceptable fit; and the Root Mean Square Error of Approximation (RMSEA) should be less than 0.05 for excellent fit, 0.05 to 0.07 for good fit, and 0.08 to 0.09 for acceptable fit [46,47].
- Model Modification: Based on the analysis results, consider modifying the model by adding or removing influence paths that significantly reduce the chi-square value, enhancing the model’s fit with empirical data.
- Parameter Estimation in the SEM-VALTM model with Latent Growth Variables—estimate parameters including factor loadings, means and standard deviations, and correlation coefficients [50].
3.2. Spuriousness in the Analysis Results
3.2.1. Heteroskedasticity
Impacts of Heteroskedasticity
- -
- Lacks the property of efficiency, even though it possesses the properties of unbiasedness and consistency.
- -
- Hypothesis testing results are more likely to produce non-significance than normal.
- -
- Forecasted values exhibit higher-than-normal errors.
Detecting Heteroskedasticity
Methods for Resolving Heteroscedasticity
3.2.2. Autocorrelation
Effects of Autocorrelation
- -
- The variance is not minimized, preventing the achievement of the efficiency property.
- -
- The model lacks consistency due to bias still present in the model.
- -
- Forecast values will exhibit higher-than-normal error rates.
Detecting Autocorrelation
Methods for Resolving Autocorrelation
3.2.3. Multicollinearity
Impact of Multicollinearity
- -
- The correlation, , will be high, which affects the analysis of the relationships.
- -
- Higher estimated values of lead to reduced t-tests, resulting in the potential rejection of . If this happens, those variables should be removed.
- -
- The analysis cannot properly evaluate the model’s convergence toward equilibrium due to the high sensitivity of the variables.
Detecting Multicollinearity
Methods for Resolving Multicollinearity
4. Empirical Analysis
4.1. Screening of Influencing Factors for Model Input
- Economic Sector: The organization responsible for preparing and collecting the data is the Office of the National Economic and Social Development Council (NESDC). In this research, the following indicators have been utilized: the industrial structure rate ; per capita GDP rate ; qual foreign tourist rate ; urbanization rate ; indirect foreign investment rate ; total exports rate ; and government expenditure rate .
- Social Sector: The organizations responsible for preparing and collecting the data are the National Statistical Office and the Ministry of Information and Communication Technology. In this research, the following indicators have been utilized: the consumer protection rate ; social security rate ; employment rate ; and health and illness rate .
- Environmental Sector: The organization responsible for preparing and collecting the data is the Department of Alternative Energy Development and Efficiency. In this research, the following indicators have been utilized: the consumption rate ; green technology rate ; renewable energy rate ; and carbon dioxide emissions .
4.2. Analysis of Co-Integration
4.3. Formation of Analysis Modeling with the SEM-VALTM Model
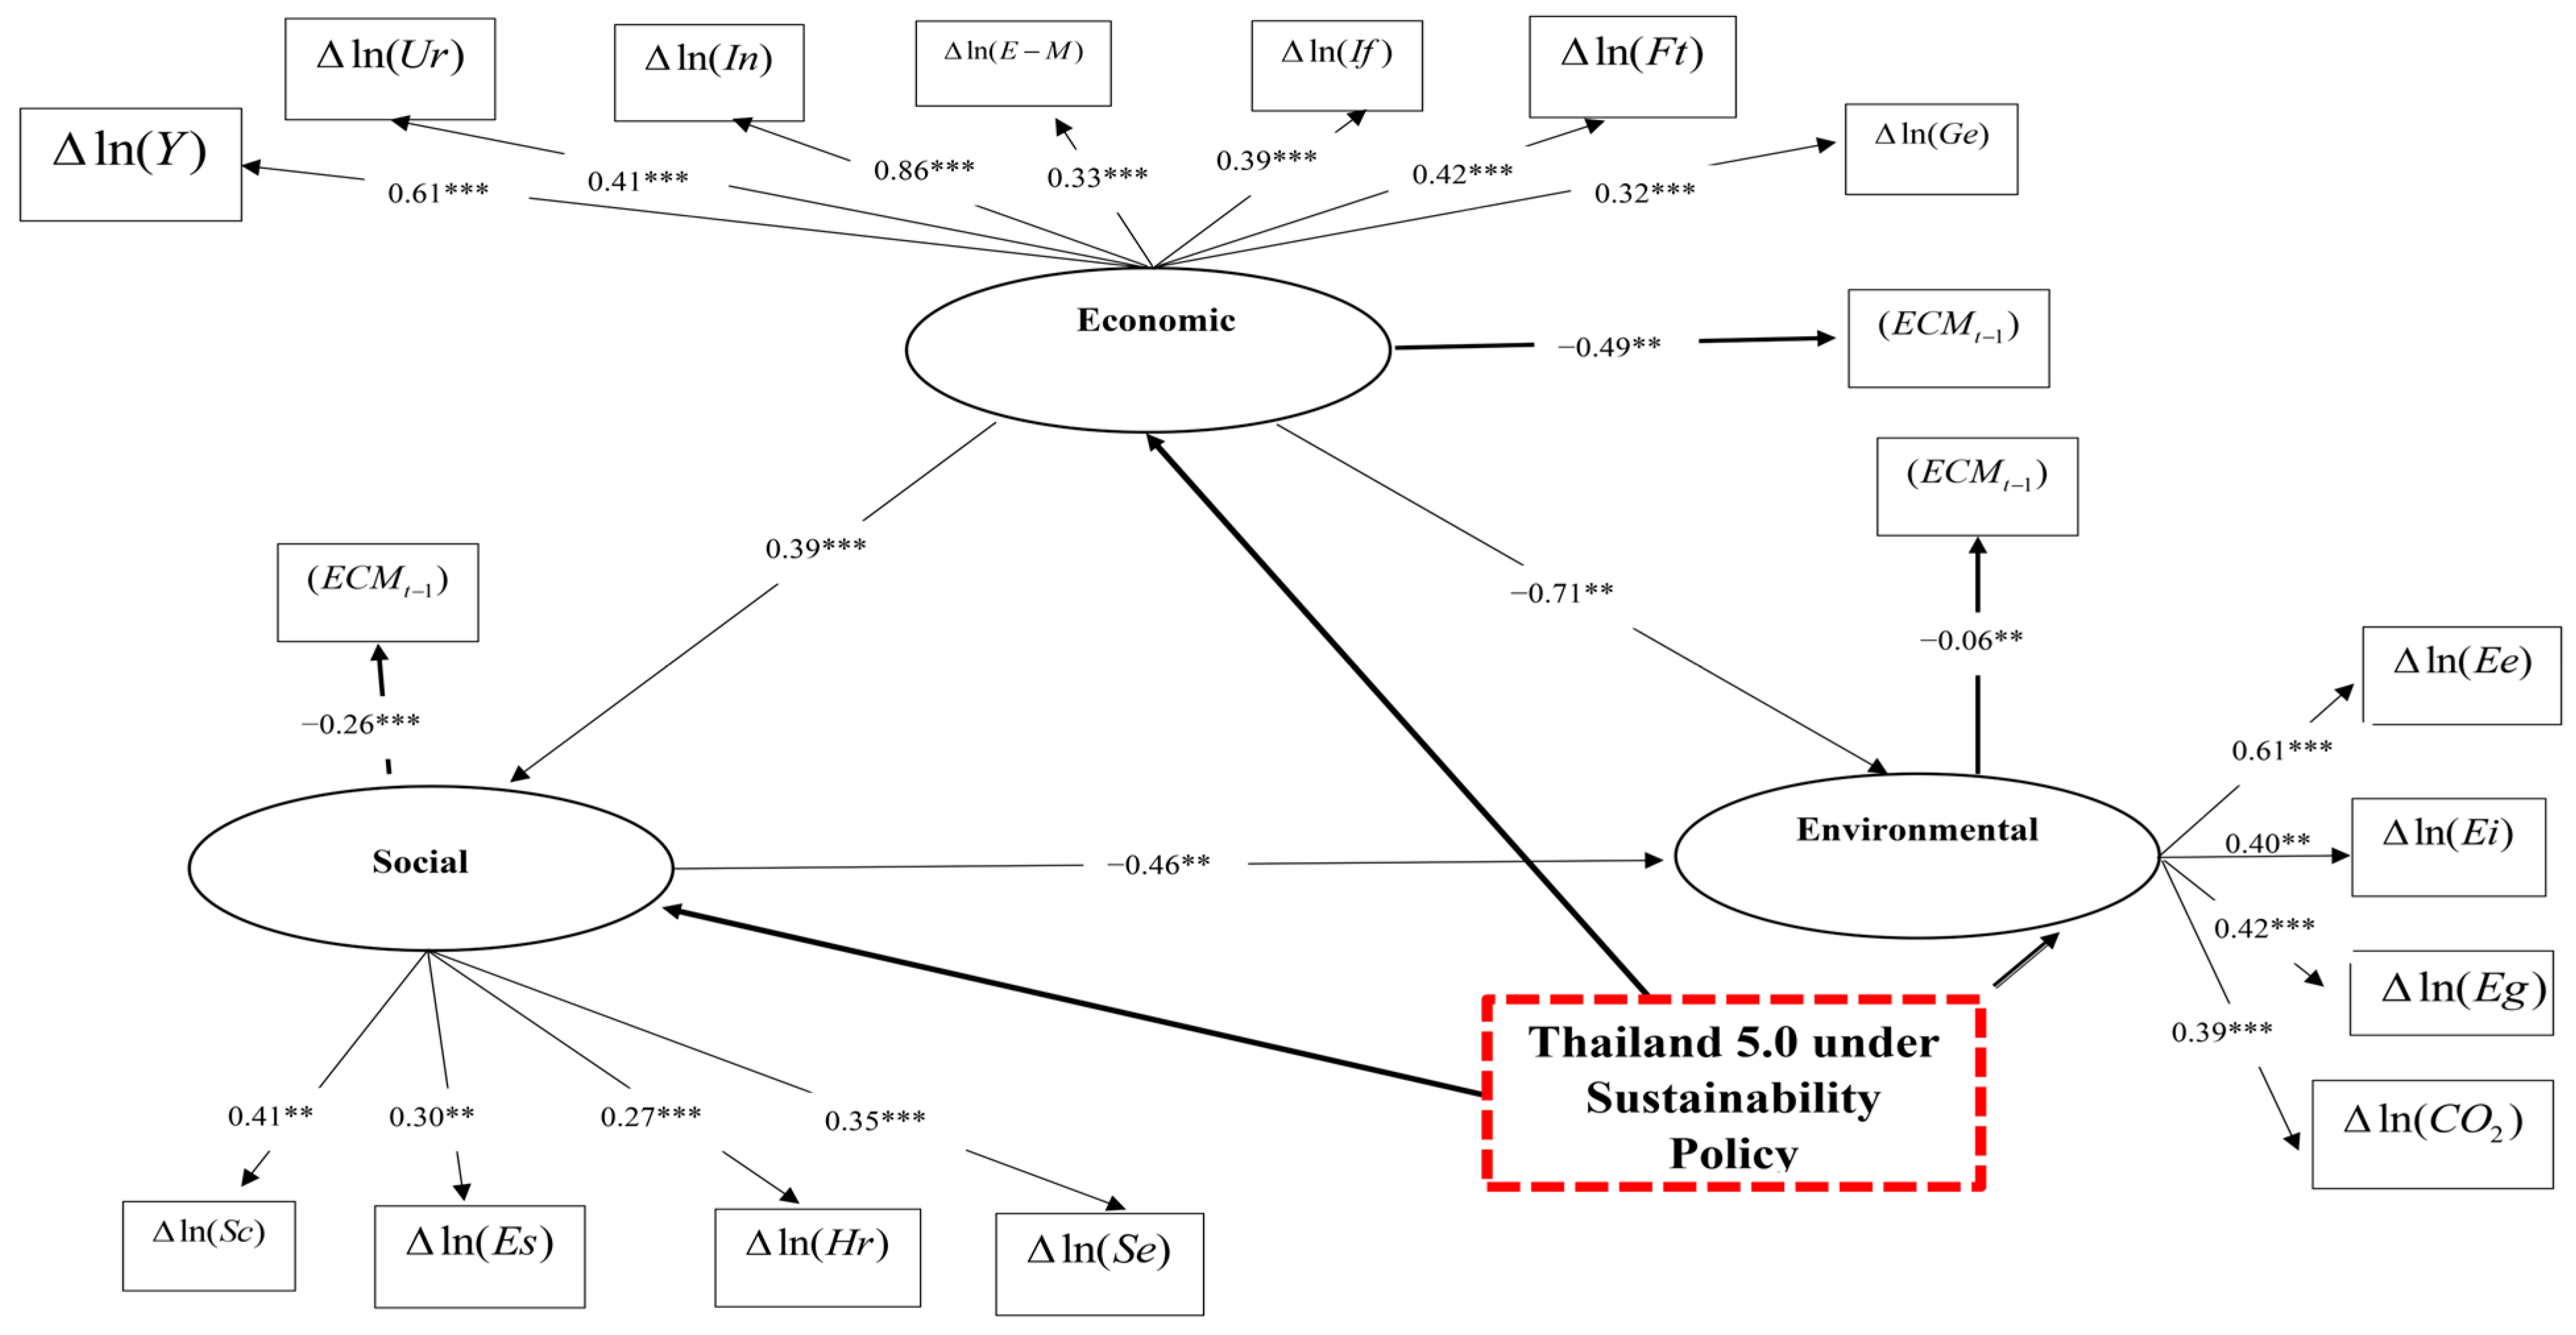
- Economic Sector: At a statistical significance level of α = 0.01, the observed variable with the highest influence is the industrial structure rate , followed by the per capita GDP rate , the foreign tourist rate , the urbanization rate , the indirect foreign investment rate , the total exports rate , and the government expenditure rate , respectively.
- Social Sector: At a statistical significance level of α = 0.01, the observed variable with the highest influence is the consumer protection rate , followed by the social security rate , the employment rate , and the health and illness rate , respectively.
- Environmental Sector: At a statistical significance level of α = 0.01, the observed variable with the highest influence is the total energy consumption rate , followed by the green technology rate , the renewable energy rate , and carbon dioxide emissions , respectively.
4.4. Forecasting the Results of Total Energy Consumption and Greenhouse Gas Emissions Using the SEM-VALTM Model
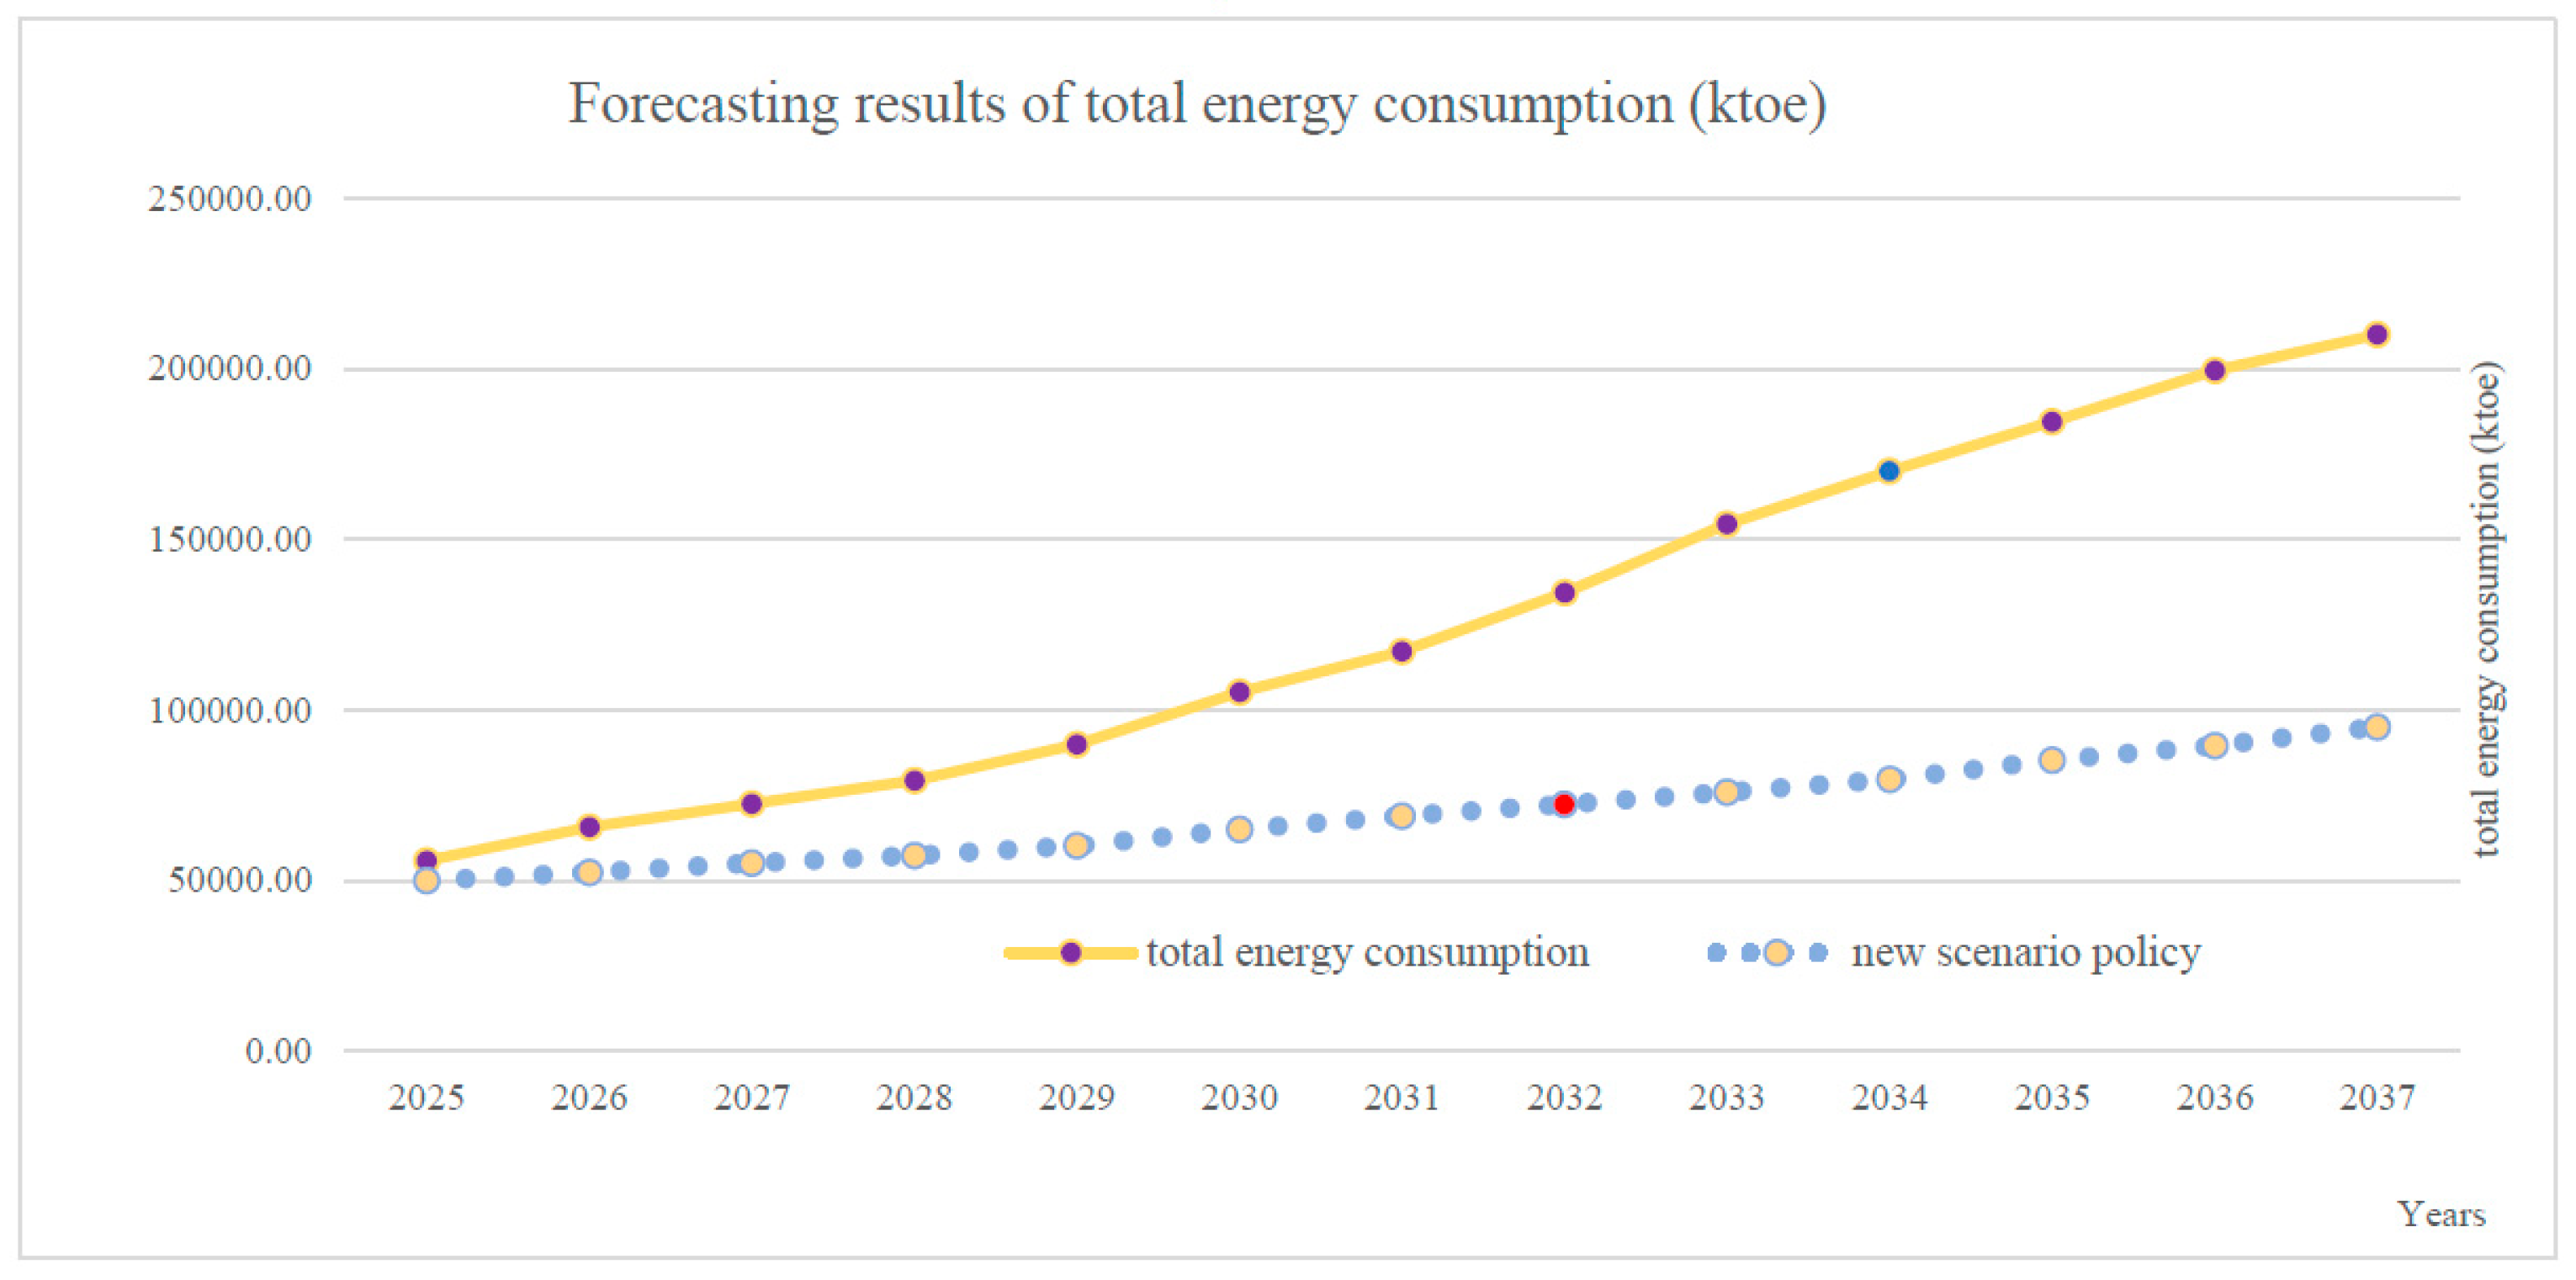
- The total energy consumption forecast using the SEM-VALTM model for the period 2025 to 2037 is shown in Figure 4.
- 2.
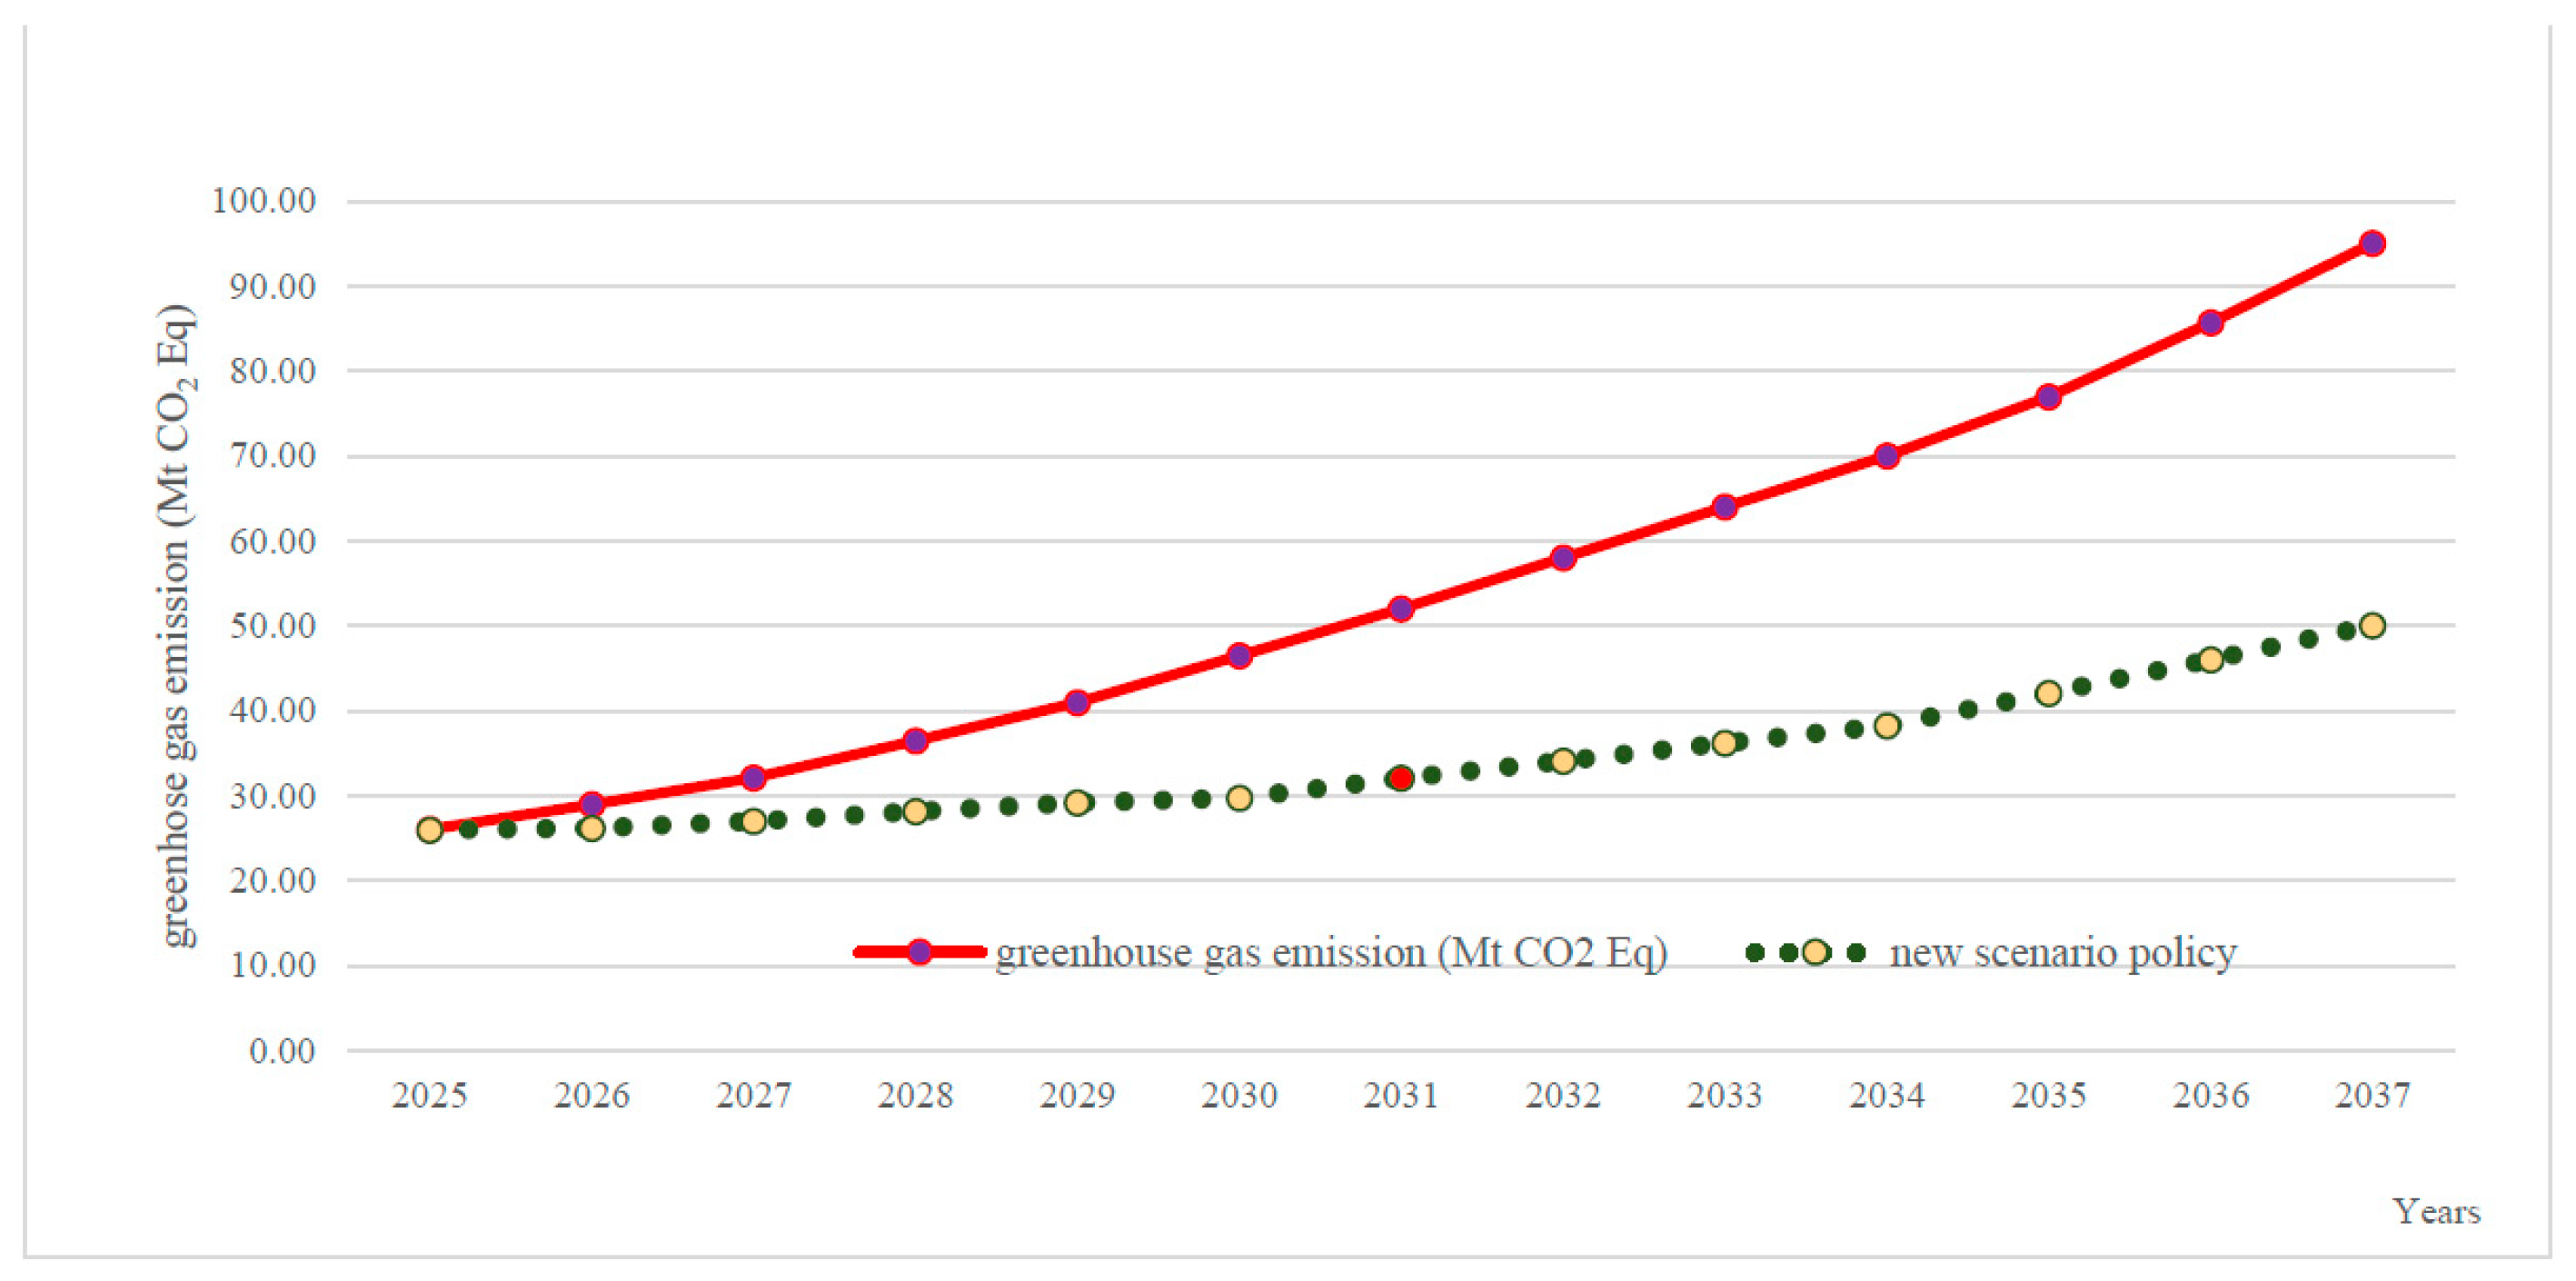
- Forecasting Results of Greenhouse Gas Emissions Using the SEM-VALTM Model (2025–2037)
5. Discussion
- The environmental sector has the slowest adjustment capacity to equilibrium. With its current adjustment speed, it could take thousands of years for the ecosystem to return to its natural state, or it may never recover. Therefore, any shock to the system would severely harm the ecosystem, with cascading negative effects across all sectors.
- Given that the industrial rate has the most significant negative impact on the environmental sector, strategies for a new scenario policy in the agricultural sector must focus on promoting renewable energy and clean technologies. These strategies should be prioritized by the government as the first step in long-term national policy formulation.
- Comprehensive reforms of Thailand’s environmental protection laws are essential, as the current legal framework is insufficient for addressing contemporary challenges. Accelerating these reforms would improve enforcement and mitigate environmental degradation. Presently, enforcement measures lack adequacy and fail to comprehensively address criminal, civil, and administrative laws.
- Establishing clear standards for carrying capacities to manage greenhouse gas emissions across all sectors is a critical requirement for Thailand. Continuous monitoring is necessary, as current assessments of carrying capacity only address short-, medium-, and long-term intervals. This approach risks failing to account for true changes or shocks in emission levels.
- Urgent governmental action is required to allocate appropriate and modern technology to reduce greenhouse gas emissions effectively. Additionally, policy shifts are needed to hold environmental offenders accountable, transforming victims into proactive defenders of environmental rights to reduce communal environmental harm.
- While the polluter pays principle is theoretically applied in Thailand, its implementation lacks concrete measures, and proving violations remains challenging. Furthermore, Thailand does not have a dedicated environmental court, relying instead on administrative courts, which reduces the efficiency of legal proceedings. Expediting the establishment of such mechanisms is urgently necessary.
6. Conclusions
Author Contributions
Funding
Institutional Review Board Statement
Informed Consent Statement
Data Availability Statement
Acknowledgments
Conflicts of Interest
References
- Office of the National Economic and Social Development Council (NESDC). Available online: http://www.nesdc.go.th/nesdb_en/more_news.php?cid=154&filename=index (accessed on 20 December 2024).
- Thailand Greenhouse Gas Management Organization (Public Organization). Available online: https://www.tgo.or.th/2023/index.php/th/ (accessed on 20 December 2024).
- The World Bank: Energy Use (Kg of Oil Equivalent Per Capita) Home Page. Available online: https://data.worldbank.org/indicator/EG.USE.PCAP.KG.OE (accessed on 20 December 2024).
- Department of Alternative Energy Development and Efficiency. Available online: https://www.dede.go.th/ (accessed on 21 December 2024).
- National Statistic Office Ministry of Information and Communication Technology. Available online: https://www.nso.go.th/nsoweb/index?set_lang=en (accessed on 20 December 2024).
- Sutthichaimethee, P.; Kubaha, K. The Efficiency of Long-Term Forecasting Model on Final Energy Consumption in Thailand’s Petroleum Industries Sector: Enriching the LT-ARIMAXS Model under a Sustainability Policy. Energies 2018, 11, 2063. [Google Scholar] [CrossRef]
- Sutthichaimethee, P.; Chatchorfa, A.; Suyaprom, S. A Forecasting Model for Economic Growth and CO2 Emission Based on Industry 4.0 Political Policy under the Government Power: Adapting a Second-Order Autoregressive-SEM. J. Open Innov. Technol. Mark. Complex 2019, 5, 69. [Google Scholar] [CrossRef]
- Sutthichaimethee, P. A Framework on Setting Strategies for Enhancing the Efficiency of State Power use in Thailand’s Pursuit of a Green Economy. Int. J. Energy Econ. Policy 2024, 14, 108–120. [Google Scholar] [CrossRef]
- United Nations Framework Convention on Climate Change, UNFCCC, Bonn, Germany. The Paris Agreement: An Early Assessment. Environ. Policy Law 2014, 44, 485–488. [Google Scholar]
- United Nations Framework Convention on Climate Change, UNFCCC, Bonn, Germany. Global Progress in Environmental Law. Environ. Policy Law 2016, 46, 23–27. [Google Scholar]
- Sutthichaimethee, P. Forecasting Economic, Social and Environmental Growth in the Sanitary and Service Sector Based on Thailand’s Sustainable Development Policy. J. Ecol. Eng. 2018, 19, 205–210. [Google Scholar] [CrossRef]
- Thailand Development Research Institute (TDRI), Making Exports for a Low-Carbon Era. Available online: https://thaicarbonlabel.tgo.or.th/tools/files.php?mod=YjNKbllXNXBlbUYwYVc5dVgyUnZkMjVzYjJGaw&type=WDBaSlRFVlQ&files=TkRrPQ (accessed on 20 December 2024).
- Pollution Control Department Ministry of Natural Resources and Environment. Navigation of Thai Waterways Act, B.E. 2546. Available online: https://www.pcd.go.th/publication/3559/ (accessed on 20 December 2024).
- Pollution Control Department Ministry of Natural Resources and Environment. Principle 4: In Order to Achieve Sustainable Development, Environmental Protection Shall Constitute an Integral Part of the Development Process and Cannot Be Considered in Isolation from It. Available online: https://www.epd.gov.hk/epd/misc/corp-env/epd-eng/annex1.htm (accessed on 20 December 2024).
- Sutthichaimethee, P.; Ariyasajjakorn, D. Forecasting Model of GHG Emission in Manufacturing Sectors of Thailand. J. Ecol. Eng. 2017, 18, 18–24. [Google Scholar] [CrossRef][Green Version]
- Sutthichaimethee, P.; Ariyasajjakorn, D. Forecast of Carbon Dioxide Emissions from Energy Consumption in Industry Sectors in Thailand. Environ. Clim. Technol. 2018, 22, 107–117. [Google Scholar] [CrossRef]
- Sutthichaimethee, P.; Ariyasajjakorn, D. Forecasting Model on Carrying Capacity for Government’s Controlling Measure under Environmental Law in Thailand: Adapting Non-recursive Autoregression Based on the Var-X Model. Int. J. Energy Econ. Policy 2020, 10, 645–655. [Google Scholar] [CrossRef]
- Sutthichaimethee, P.; Kubaha, K. A Relational Analysis Model of the Causal Factors Influencing CO2 in Thailand’s Industrial Sector under a Sustainability Policy Adapting the VARIMAX-ECM Model. Energies 2018, 11, 1704. [Google Scholar] [CrossRef]
- Wang, J.; Jiang, C.; Li, M.; Zhang, S.; Zhang, X. Renewable energy, agriculture, and carbon dioxide emissions nexus: Implications for sustainable development in sub-Saharan African countries. Sustain. Environ. Res. 2023, 33, 31. [Google Scholar] [CrossRef]
- Kuldasheva, Z.; Salahodjaev, R. Renewable Energy and CO2 Emissions: Evidence from Rapidly Urbanizing Countries. J. Knowl. Econ. 2022, 14, 1077–1090. [Google Scholar] [CrossRef]
- Ike, G.N.; Usman, O.; Alola, A.A.; Sarkodie, S.A. Environmental quality effects of income, energy prices and trade: The role of renewable energy consumption in G-7 countries. Sci. Total Environ. 2020, 721, 137813. [Google Scholar] [CrossRef] [PubMed]
- Şanlı, D.; Muratoğlu, Y.; Songur, M.; Uğurlu, E. The asymmetric effect of renewable and non-renewable energy on carbon emissions in OECD: New evidence from non-linear panel ARDL model. Front. Environ. Sci. 2023, 11, 1228296. [Google Scholar] [CrossRef]
- Riti, J.S.; Song, D.; Shu, Y.; Kamah, M.; Adi Atabani, A. Does renewable energy ensure environmental quality in favour of economic growth? Empirical evidence from China’s renewable development. Qual. Quant. 2018, 52, 2007–2030. [Google Scholar] [CrossRef]
- Iqbal, S.; Wang, Y.; Ahmed Shaikh, P.; Maqbool, A.; Hayat, K. Exploring the asymmetric effects of renewable energy production, natural resources, and economic progress on CO2 emissions: Fresh evidence from Pakistan. Environ. Sci. Pollut. Res. 2022, 29, 7067–7078. [Google Scholar] [CrossRef]
- Naz, S.; Sultan, R.; Zaman, K.; Mohammed Aldakhil, A.; Nassani, A.A.; Qazi Abro, M.M. Moderating and mediating role of renewable energy consumption, FDI inflows, and economic growth on carbon dioxide emissions: Evidence from robust least square estimator. Environ. Sci. Pollut. Res. 2019, 26, 2806–2819. [Google Scholar] [CrossRef]
- Alola, A.A.; Joshua, U. Carbon emission effect of energy transition and globalization: Inference from the low-, lower middle-, upper middle-, and high-income economies. Environ. Sci. Pollut. Res. 2020, 27, 38276–38286. [Google Scholar] [CrossRef]
- Shaari, M.S.; Abidin, N.Z.; Abdul Karim, Z. The Impact of Renewable Energy Consumption and Economic Growth on CO2 Emissions: New Evidence using Panel ARDL Study of Selected Countries. Int. J. Energy Econ. Policy 2020, 10, 617–623. [Google Scholar] [CrossRef]
- Arshad, A.; Jadoon, A.K.; Sarwar, A.; Javaid, M.F. Towards Asian Countries Sustainable Development: The Nexus between Information and Communication Technology, Energy Consumption and Carbon Dioxide Emission. Bull. Bus. Econ. 2024, 13, 1–8. [Google Scholar] [CrossRef]
- Raihan, A.; Tuspekova, A. Toward a sustainable environment: Nexus between economic growth, renewable energy use, forested area, and carbon emissions in Malaysia. Resour. Conserv. Recycl. Adv. 2022, 15, 200096. [Google Scholar] [CrossRef]
- Ansah, S.; Xungang, Z.; Wiafe, E.A.; Ntim-Amo, G. Sustainable Economic Development Routes in Sub-Sahara Africa: A Dynamic Long-Run Relationship Analysis Of Fiscal Policy, Energy Consumption And Carbon Dioxide Emissions. J. Adv. Res. Econ. Adm. Sci. 2022, 32, 64–94. [Google Scholar] [CrossRef]
- Abdi, A.H. Toward a sustainable development in sub-Saharan Africa: Do economic complexity and renewable energy improve environmental quality? Environ. Sci. Pollut. Res. 2023, 30, 55782–55798. [Google Scholar] [CrossRef] [PubMed]
- Pindiriri, C.; Chidoko, C. The Impact Assessment of Sustainable Development Assistance on Carbon Dioxide Emissions: The Sub-Saharan Africa Experience. J. Sustain. Dev. Afr. 2012, 14, 182–198. [Google Scholar]
- Adendorff, C.M.; Keown, H.; Amansure, R. The development of a socio-economic model to promote women’s empowerment initiatives in the renewable energy sector of South Africa. J. Energy South. Afr. 2020, 31, 34–47. [Google Scholar] [CrossRef]
- You, C.; Khattak, S.I.; Ahmad, M. Do international collaborations in environmental-related technology development in the U.S. pay of in combating carbon dioxide emissions? Role of domestic environmental innovation, renewable energy consumption, and trade openness. Environ. Sci. Pollut. Res. 2022, 29, 19693–19713. [Google Scholar] [CrossRef]
- Yu, S.; Chang, C.T.; Ma, C.M. Simulation and measurement of air quality in the traffic congestion area. Sustain. Environ. Res. 2021, 31, 26. [Google Scholar] [CrossRef]
- Sooktawee, S.; Kanchanasuta, S.; Bunplod, N. Assessment of 24-h moving average PM2.5 concentrations in Bangkok, Thailand against WHO guidelines. Sustain. Environ. Res. 2023, 33, 3. [Google Scholar] [CrossRef]
- Cai, K.; Zhang, X.; Zhang, M.; Ge, Q.; Li, S.; Qiao, B.; Liu, Y. Improving air pollutant prediction in Henan Province, China, by enhancing the concentration prediction accuracy using autocorrelation errors and an Informer deep learning model. Sustain. Environ. Res. 2023, 33, 13. [Google Scholar] [CrossRef]
- Rehman, A.; Deyuan, Z. Pakistan’s energy scenario: A forecast of commercial energy consumption and supply from different sources through 2030. Energy Sustain. Soc. 2018, 8, 26. [Google Scholar] [CrossRef]
- Almuhtady, A.; Alshwawra, A.; Alfaouri, M.; Al-Kouz, W.; Al-Hinti, I. Investigation of the trends of electricity demands in Jordan and its susceptibility to the ambient air temperature towards sustainable electricity generation. Energy Sustain. Soc. 2019, 9, 39. [Google Scholar] [CrossRef]
- Schrammel, J.; Diamond, L.M.; Fröhlich, P.; Mor, G.; Cipriano, J. Influencing residential electricity consumption with tailored messages: Long-term usage patterns and effects on user experience. Energy Sustain. Soc. 2023, 13, 15. [Google Scholar] [CrossRef]
- Allen, P.; Hammond, G.P. Bioenergy utilization for a low carbon future in the UK: The evaluation of some alternative scenarios and projections. BMC Energy 2019, 1, 3. [Google Scholar] [CrossRef]
- Tilahun, F.B.; Bhandari, R.; Mamo, M. Supply optimization based on society’s cost of electricity and a calibrated demand model for future renewable energy transition in Niger. Energy Sustain. Soc. 2019, 9, 31. [Google Scholar] [CrossRef]
- Awafo, E.A.; Akolgo, G.A.; Awaafo, A. Assessment of agricultural residue potential for electrifcation of of-grid communities in the Sawla-Tuna-Kalba District of Ghana. Energy Sustain. Soc. 2024, 14, 50. [Google Scholar] [CrossRef]
- Momodu, A.S.; Addo, A.; Kayode Akinbami, J.F.; Mulugetta, Y. Low-carbon development strategy for the West African electricity system: Preliminary assessment using System dynamics approach. Energy Sustain. Soc. 2017, 7, 11. [Google Scholar] [CrossRef]
- Zhu, X.; Zhu, J.; Wu, B.; Liu, M.; Wang, G.; Zhu, Z.; Gan, Z.; Zhang, J.; Meng, C. Energy planning for an eco-city based on a distributed energy network. Energ. Sustain. Soc. 2021, 11, 8. [Google Scholar] [CrossRef]
- Zhou, C.; Chen, X. Forecasting China’s energy consumption and carbon emission based on multiple decomposition strategy. Energy Strategy Rev. 2023, 49, 101160. [Google Scholar] [CrossRef]
- Sahin, U.; Chen, Y. Assessing the current and future effects of Covid-19 on energy related-CO2 emissions in the United States using seasonal fractional grey model. Energy Strategy Rev. 2023, 50, 101234. [Google Scholar] [CrossRef]
- Enders, W. Applied Econometrics Time Series; Wiley Series in Probability and Statistics; University of Alabama: Tuscaloosa, AL, USA, 2010. [Google Scholar]
- Harvey, A.C. Forecasting, Structural Time Series Models and the Kalman Filter; Cambridge University Press: Cambridge, UK, 1980. [Google Scholar]
- Velos, S.P.; Go, M.B.; Bate, G.P.; Joyohoy, E.B. A Seasonal Autoregressive Integrated Moving Average (SARIMA) Model to Forecasting Tourist Arrival in the Philippines: A Case Study in Moalboal, Cebu (Philippines). Recoletos Multidiscip. Res. J. 2020, 8, 67–78. [Google Scholar] [CrossRef]
- Dickey, D.A.; Fuller, W.A. Likelihood ratio statistics for autoregressive time series with a unit root. Econometrica 1981, 49, 1057–1072. [Google Scholar] [CrossRef]
- MacKinnon, J. Critical Values for Cointegration Test in Long-Run Economic Relationships; Engle, R., Granger, C., Eds.; Oxford University Press: Oxford, UK, 1991. [Google Scholar]
- Johansen, S. Likelihood-Based Inference in Cointegrated Vector Autoregressive Models; Oxford University Press: New York, NY, USA, 1995. [Google Scholar]
- Johansen, S.; Juselius, K. Maximum likelihood estimation and inference on cointegration with applications to the demand for money. Oxf. Bull. Econ. Stat. 1990, 52, 169–210. [Google Scholar] [CrossRef]
| Tau Test | MacKinnon Critical Value | |||||
|---|---|---|---|---|---|---|
| Variables | Level I(0) Value | Variables | First Difference I(1) Value | 1% | 5% | 10% |
| −3.01 | −4.73 *** | −3.85 | −3.15 | −2.70 | ||
| −3.11 | −5.01 *** | −3.85 | −3.15 | −2.70 | ||
| −3.55 | −6.40 *** | −3.85 | −3.15 | −2.70 | ||
| −3.00 | −4.55 *** | −3.85 | −3.15 | −2.70 | ||
| −2.75 | −4.59 *** | −3.85 | −3.15 | −2.70 | ||
| −2.39 | −4.60 *** | −3.85 | −3.15 | −2.70 | ||
| −2.55 | −4.35 *** | −3.85 | −3.15 | −2.70 | ||
| −3.05 | −4.77 *** | −3.85 | −3.15 | −2.70 | ||
| −3.77 | −4.79 *** | −3.85 | −3.15 | −2.70 | ||
| −3.01 | −4.66 *** | −3.85 | −3.15 | −2.70 | ||
| −2.50 | −4.79 *** | −3.85 | −3.15 | −2.70 | ||
| −3.15 | −5.05 *** | −3.85 | −3.15 | −2.70 | ||
| −3.05 | −5.11 *** | −3.85 | −3.15 | −2.70 | ||
| −3.79 | −5.73 *** | −3.85 | −3.15 | −2.70 | ||
| −3.55 | −5.09 *** | −3.85 | −3.15 | −2.70 | ||
| Variables | Hypothesized No of CE(S) | Trace Statistic Test | Max-Eigen Statistic Test | MacKinnon Critical Value | |
|---|---|---|---|---|---|
| 1% | 5% | ||||
| , , , , , , , , , , , , , , | None *** | 255.01 *** | 201.05 *** | 15.05 | 10.25 |
| At Most 1 *** | 85.00 *** | 81.01 *** | 11.25 | 7.45 | |
| Dependent Variables | Type of Effect | Independent Variables | |||
|---|---|---|---|---|---|
| Economic | Social | Environmental | Error Correction Mechanism () | ||
| Economic | DE | - | - | - | −0.49 *** |
| IE | - | - | - | - | |
| Social | DE | 0.39 *** | - | - | −0.26 *** |
| IE | - | - | - | - | |
| Environmental | DE | 0.71 *** | 0.46 *** | - | −0.06 *** |
| IE | 0.10 *** | - | - | - | |
| Forecasting Model | MAPE (%) | RMSE (%) |
|---|---|---|
| ANN model | 15.55 | 17.50 |
| MARP model | 12.25 | 15.05 |
| GB model | 9.05 | 10.15 |
| Gray model | 6.05 | 8.95 |
| ARIMAX model | 6.01 | 8.25 |
| SEM-VALTM model | 1.09 | 1.71 |
Disclaimer/Publisher’s Note: The statements, opinions and data contained in all publications are solely those of the individual author(s) and contributor(s) and not of MDPI and/or the editor(s). MDPI and/or the editor(s) disclaim responsibility for any injury to people or property resulting from any ideas, methods, instructions or products referred to in the content. |
© 2025 by the authors. Licensee MDPI, Basel, Switzerland. This article is an open access article distributed under the terms and conditions of the Creative Commons Attribution (CC BY) license (https://creativecommons.org/licenses/by/4.0/).
Share and Cite
Sutthichaimethee, P.; Saraphirom, P.; Junsiri, C. An Advanced Model for Greenhouse Gas Emission Reduction in the Agricultural Sector to Achieve Sustainability for Thailand’s Future. Appl. Sci. 2025, 15, 1485. https://doi.org/10.3390/app15031485
Sutthichaimethee P, Saraphirom P, Junsiri C. An Advanced Model for Greenhouse Gas Emission Reduction in the Agricultural Sector to Achieve Sustainability for Thailand’s Future. Applied Sciences. 2025; 15(3):1485. https://doi.org/10.3390/app15031485
Chicago/Turabian StyleSutthichaimethee, Pruethsan, Phayom Saraphirom, and Chaiyan Junsiri. 2025. "An Advanced Model for Greenhouse Gas Emission Reduction in the Agricultural Sector to Achieve Sustainability for Thailand’s Future" Applied Sciences 15, no. 3: 1485. https://doi.org/10.3390/app15031485
APA StyleSutthichaimethee, P., Saraphirom, P., & Junsiri, C. (2025). An Advanced Model for Greenhouse Gas Emission Reduction in the Agricultural Sector to Achieve Sustainability for Thailand’s Future. Applied Sciences, 15(3), 1485. https://doi.org/10.3390/app15031485


