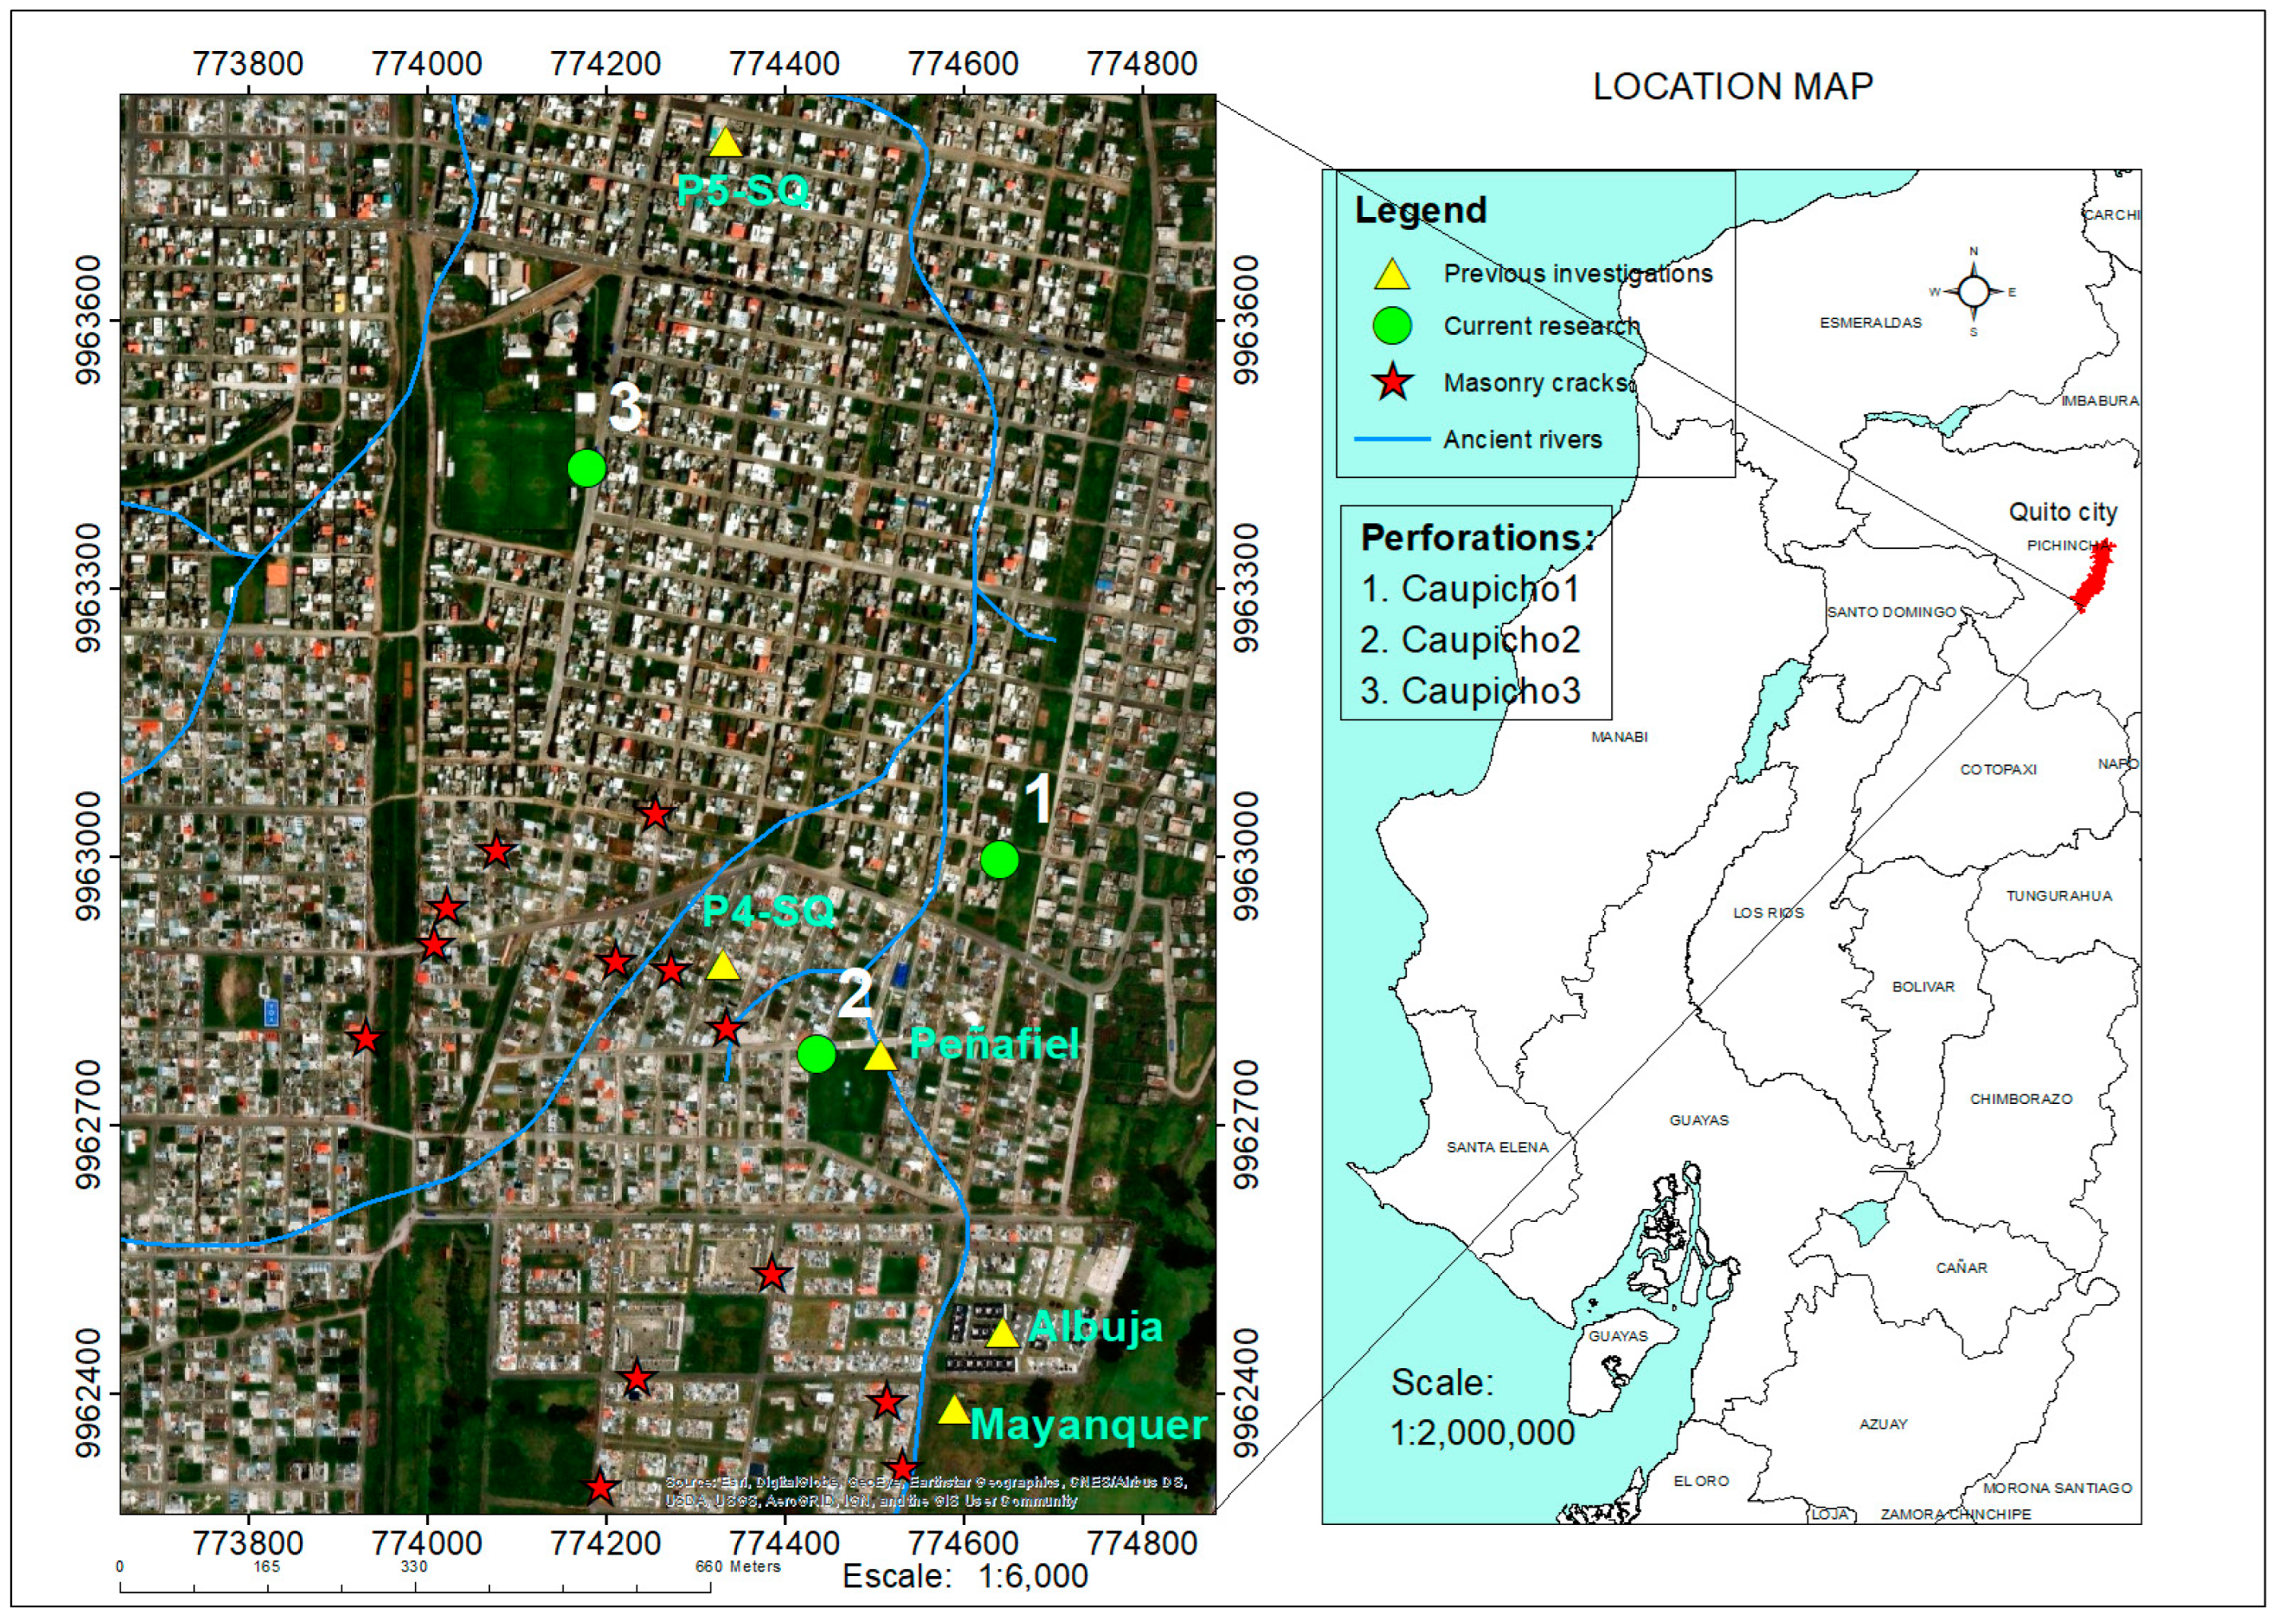
Figure 1.
Caupicho study area (coordinate system: Datum WGS 84—Projection UTM Zone 17 S) [
16].
Figure 1.
Caupicho study area (coordinate system: Datum WGS 84—Projection UTM Zone 17 S) [
16].
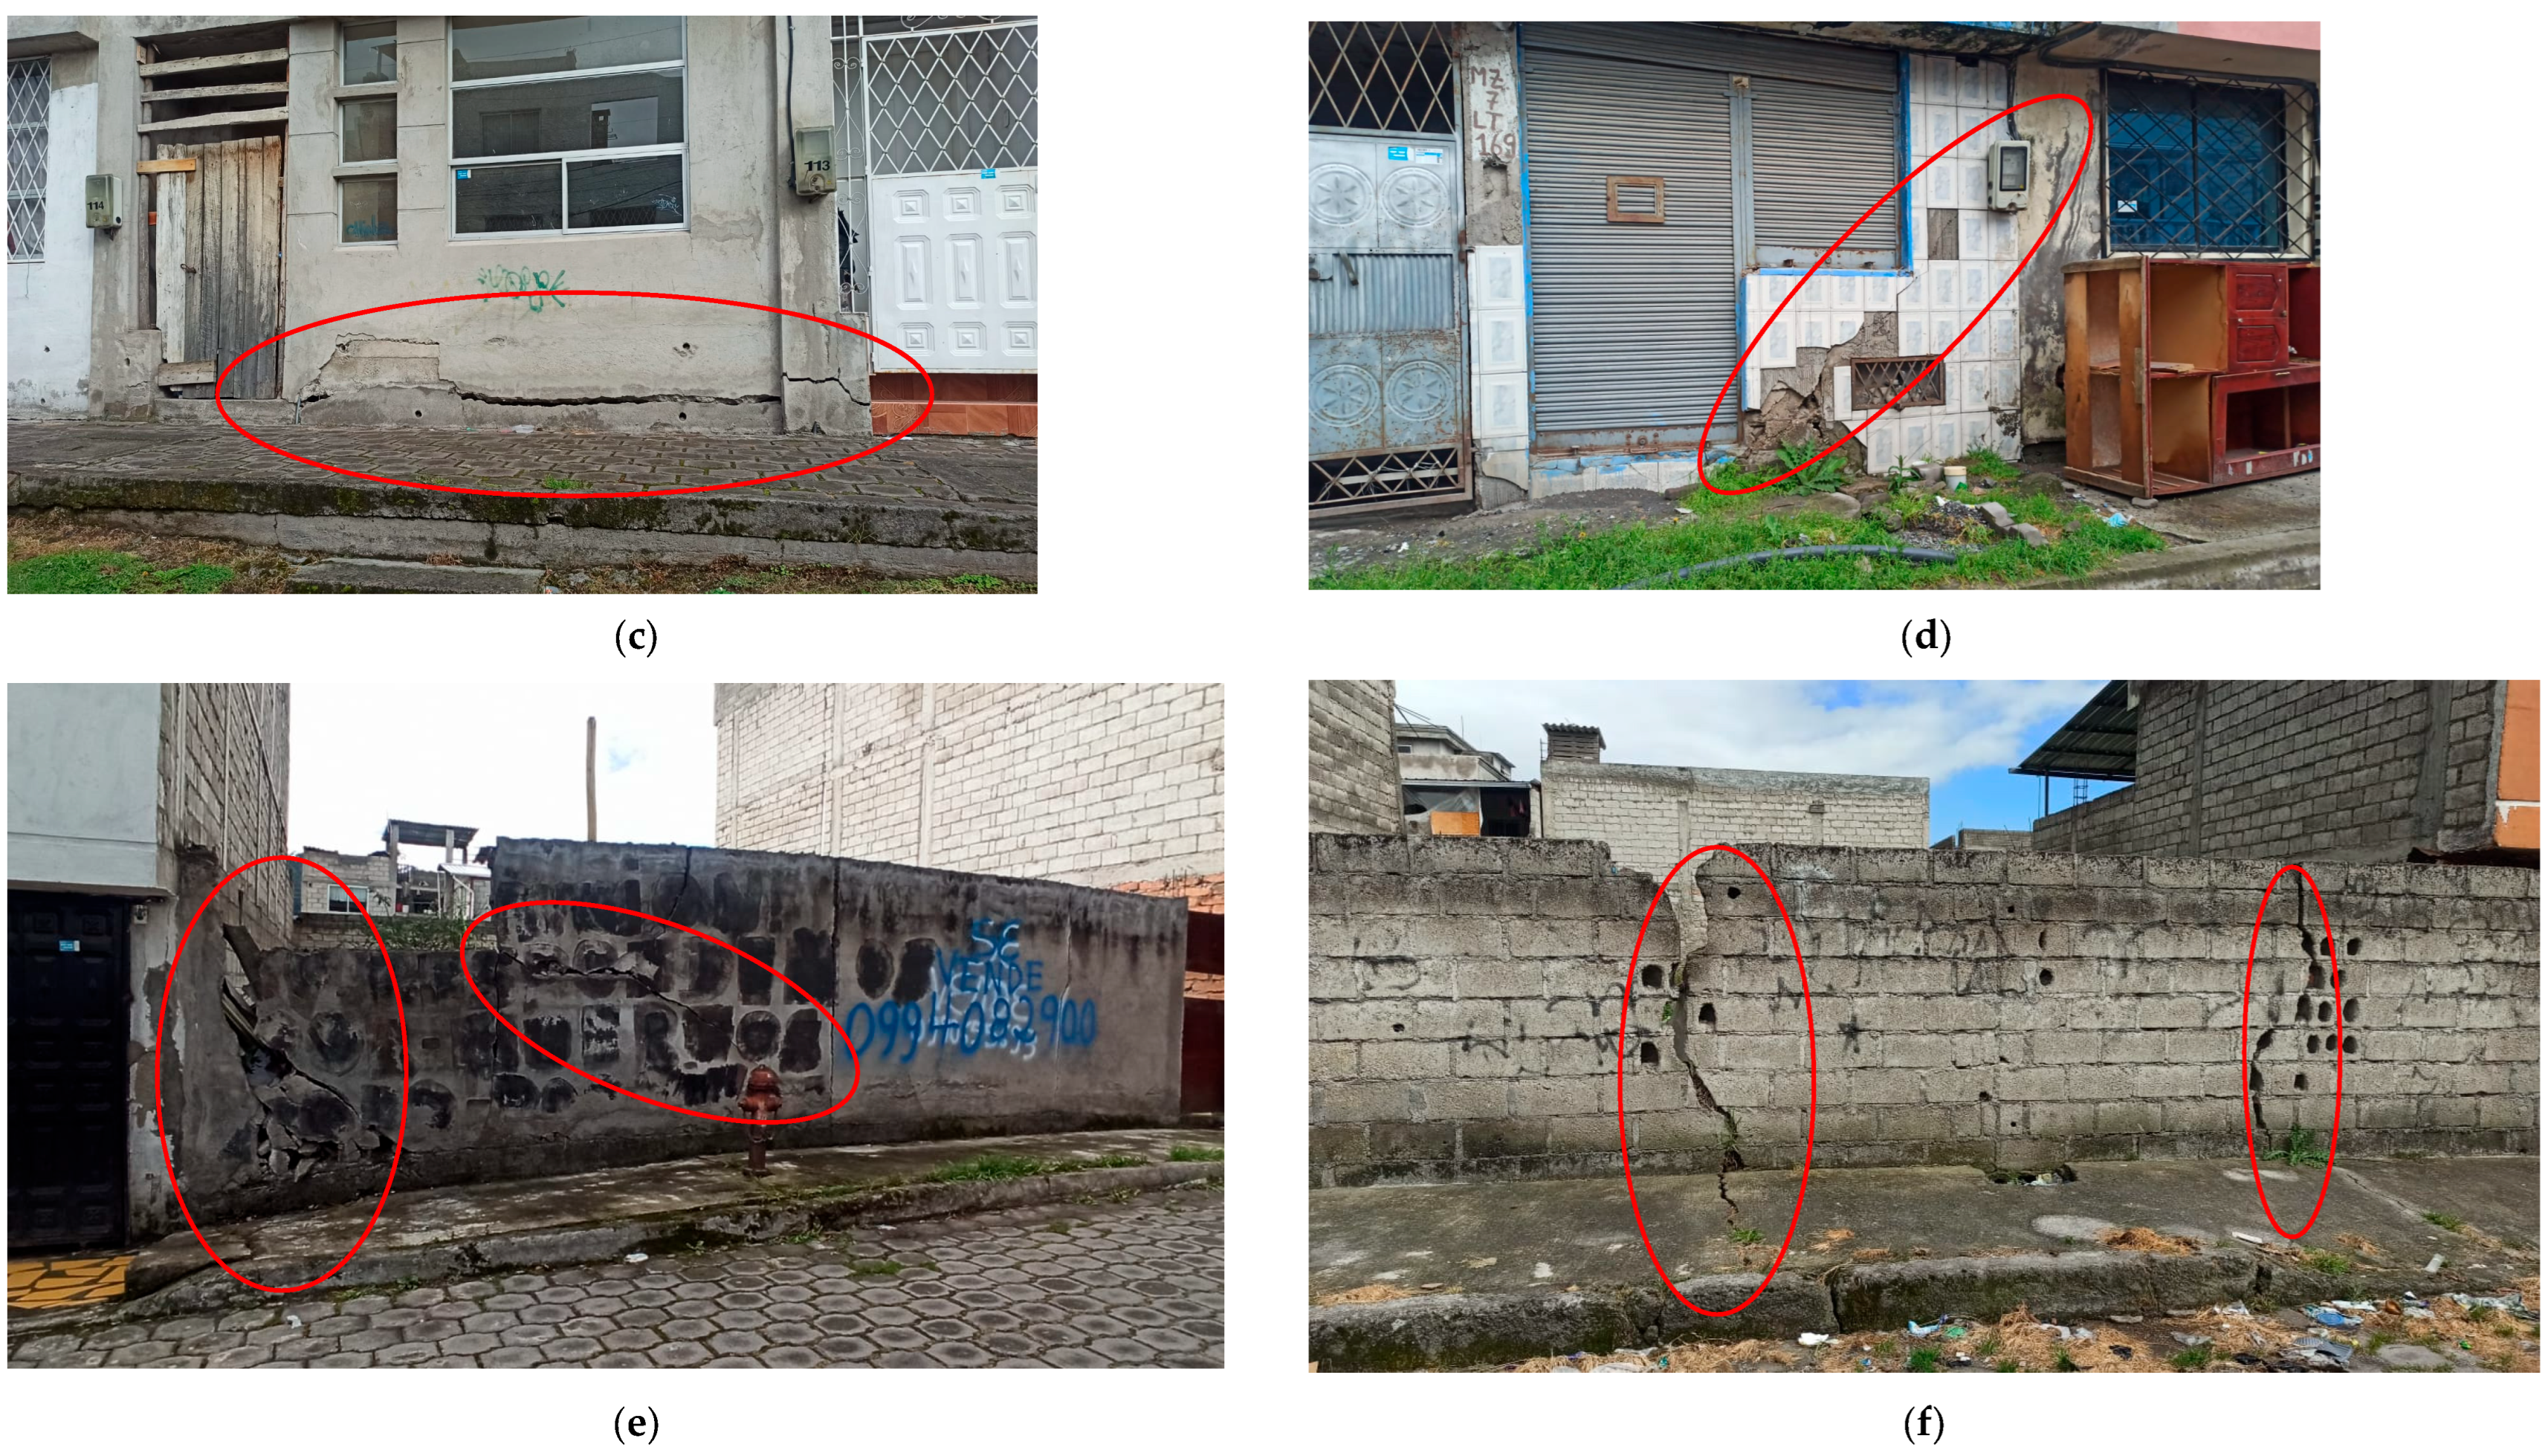
Figure 2.
(a) Repaired cracks in masonry; (b) unrepaired masonry cracks; (c) cracks between masonry and floor beam; (d) cracks in masonry and dampness in walls owing to capillarity; (e) crack in enclosure attached to a three-story house and capillary dampness; (f) crack in the enclosure and sidewalk.
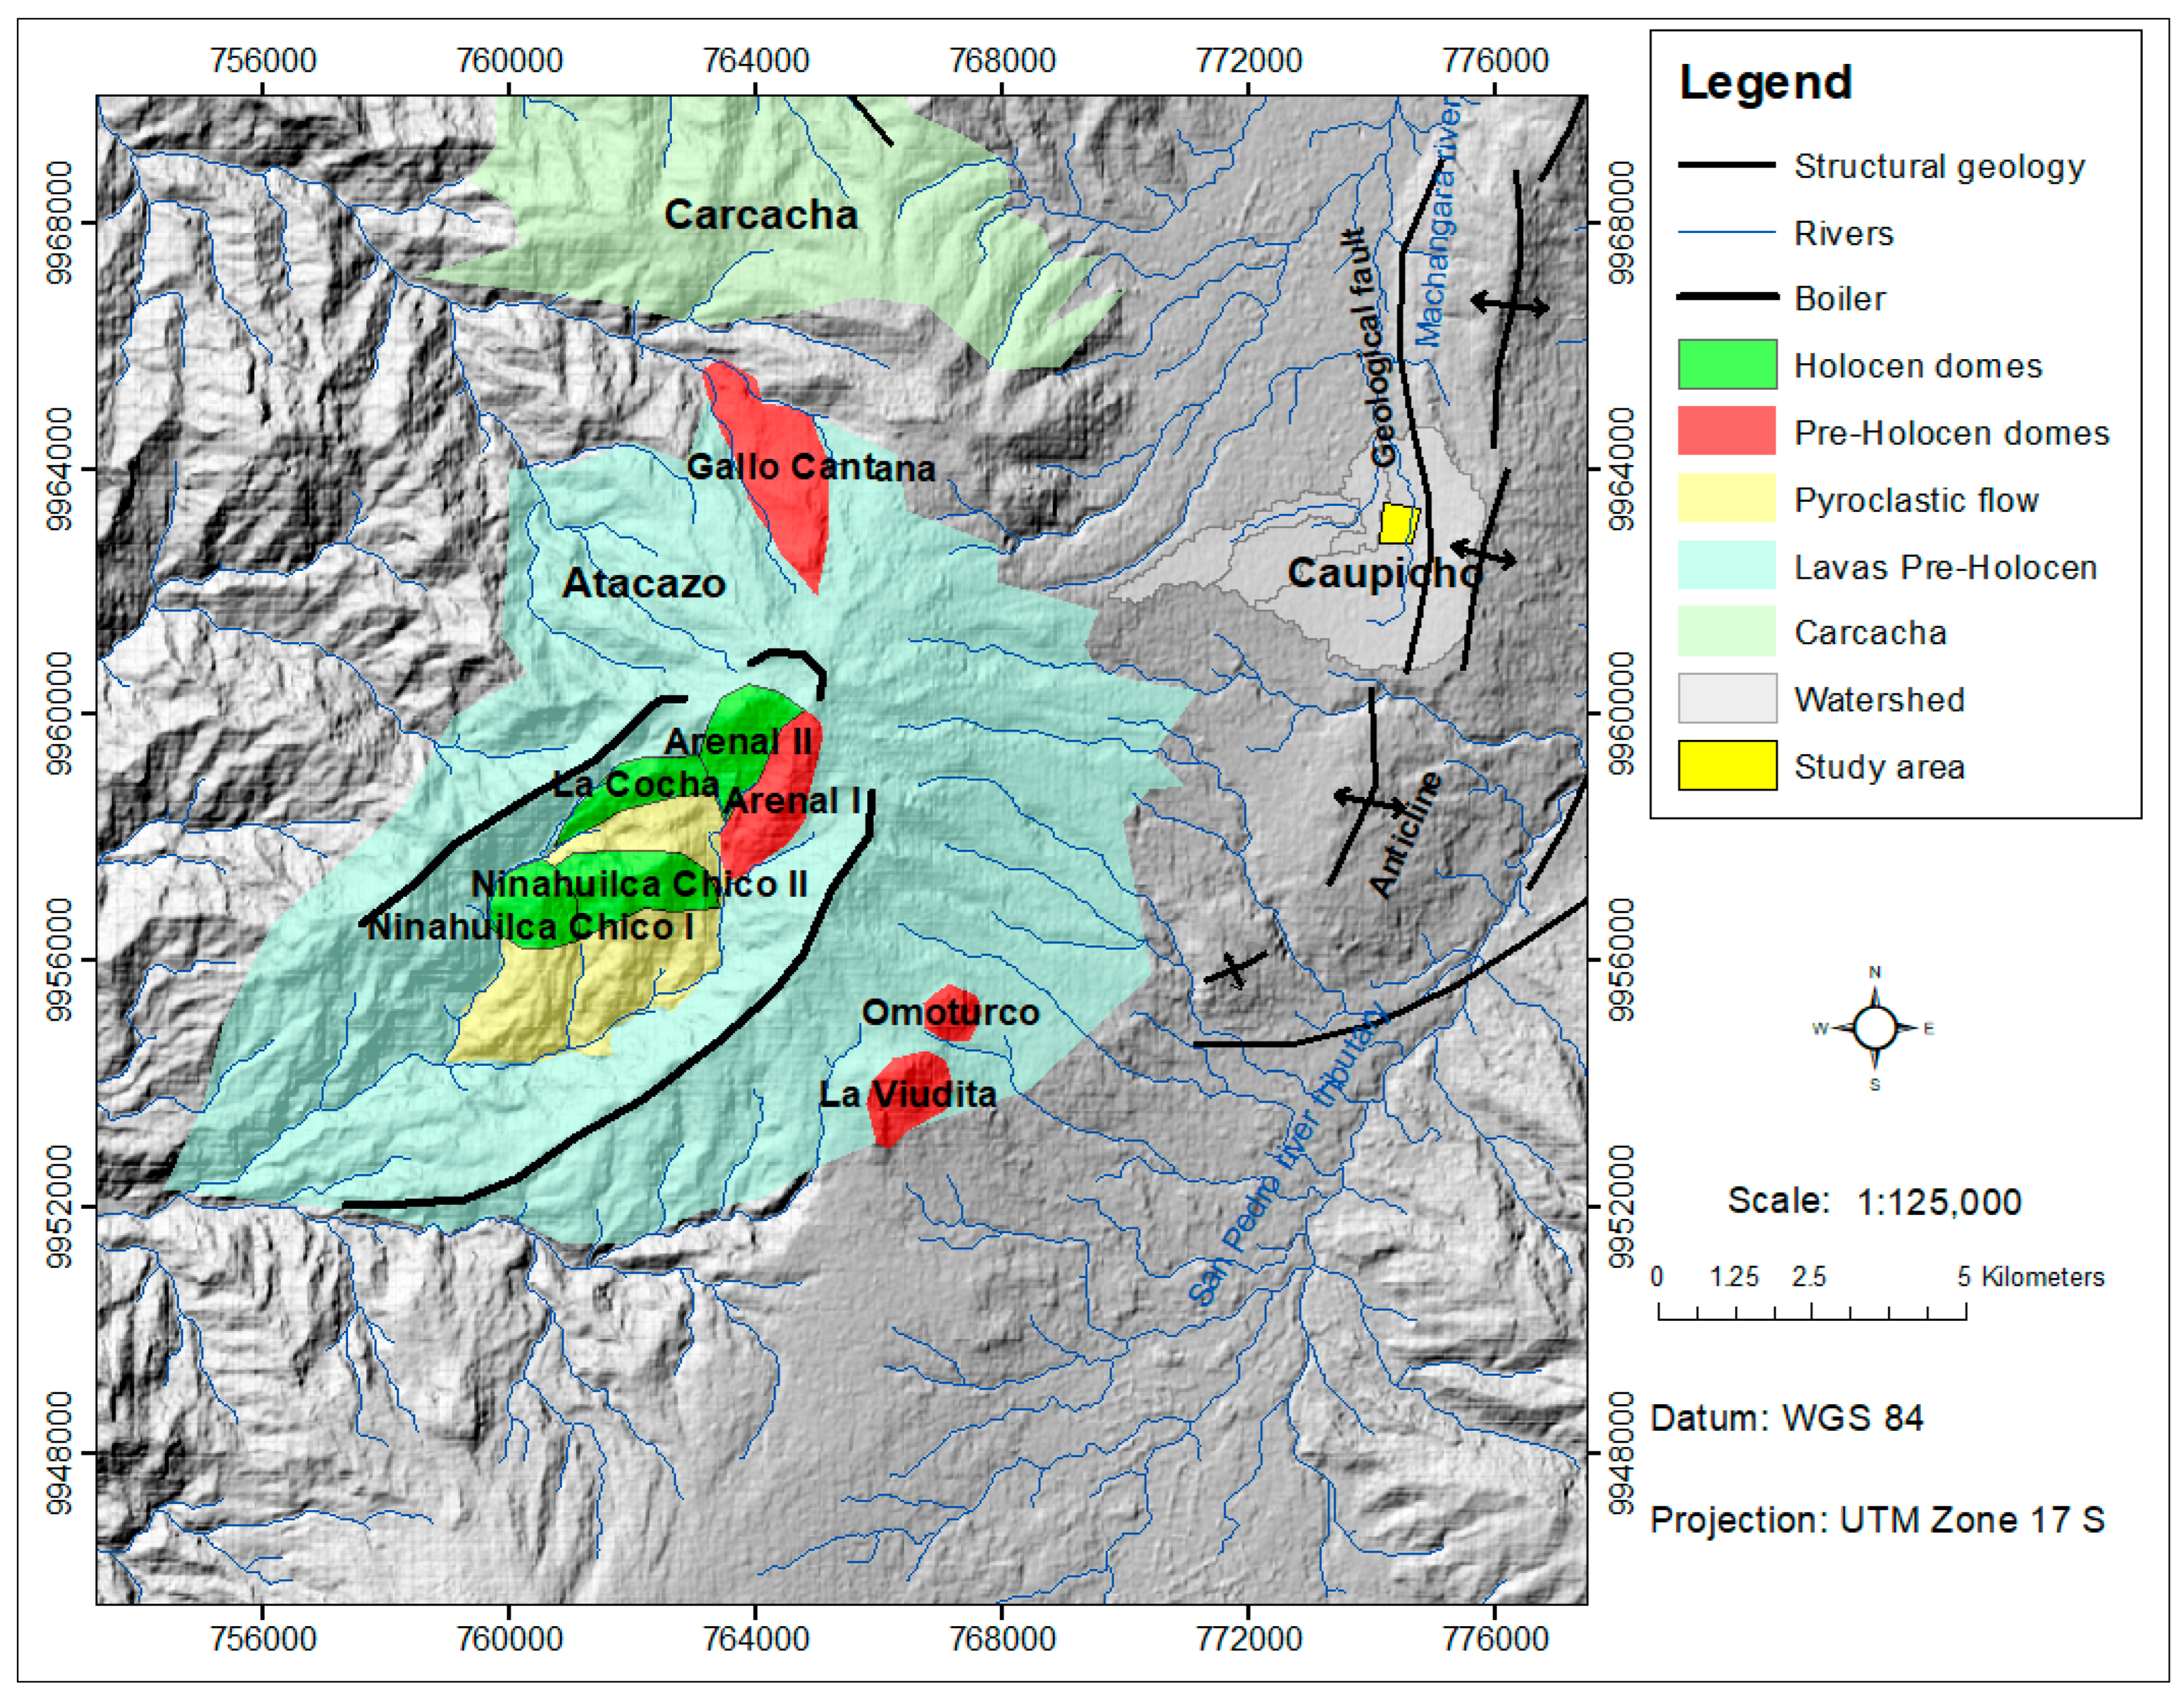
Figure 3.
Atacazo–Ninahuilca geological map (coordinate system: Datum WGS 84–Projection UTM Zone 17 S) [
7,
8,
9].
Figure 3.
Atacazo–Ninahuilca geological map (coordinate system: Datum WGS 84–Projection UTM Zone 17 S) [
7,
8,
9].
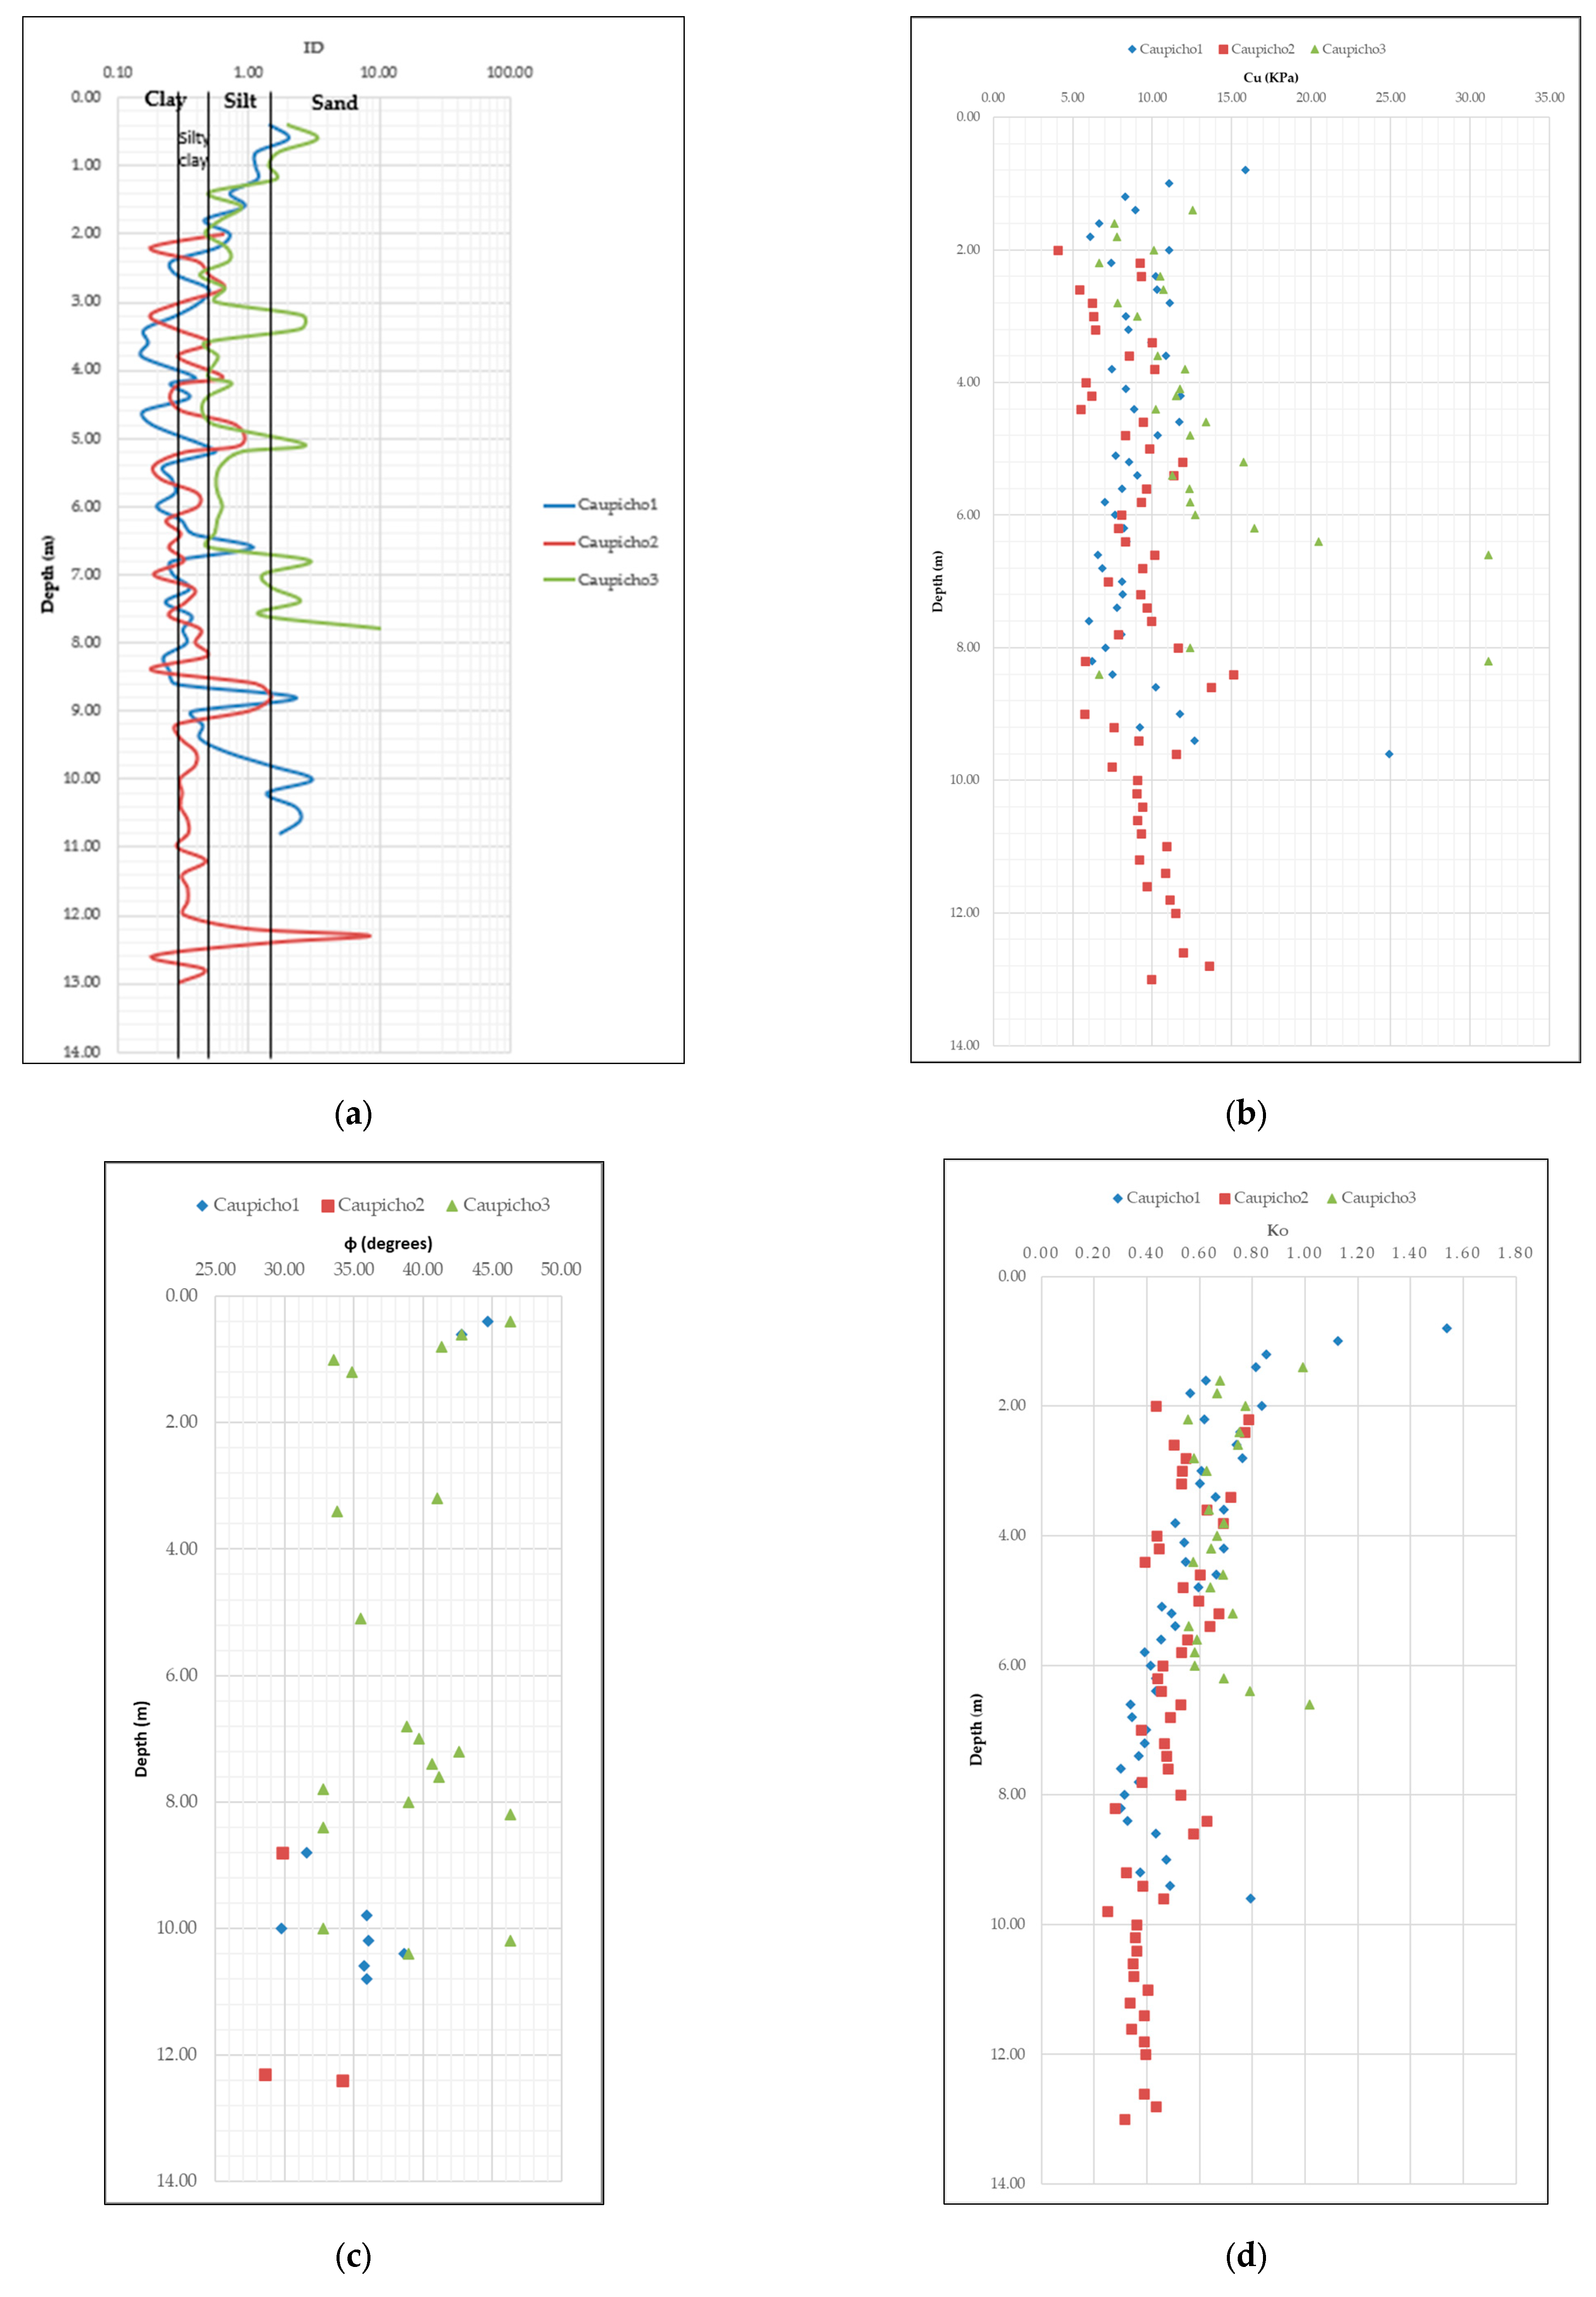
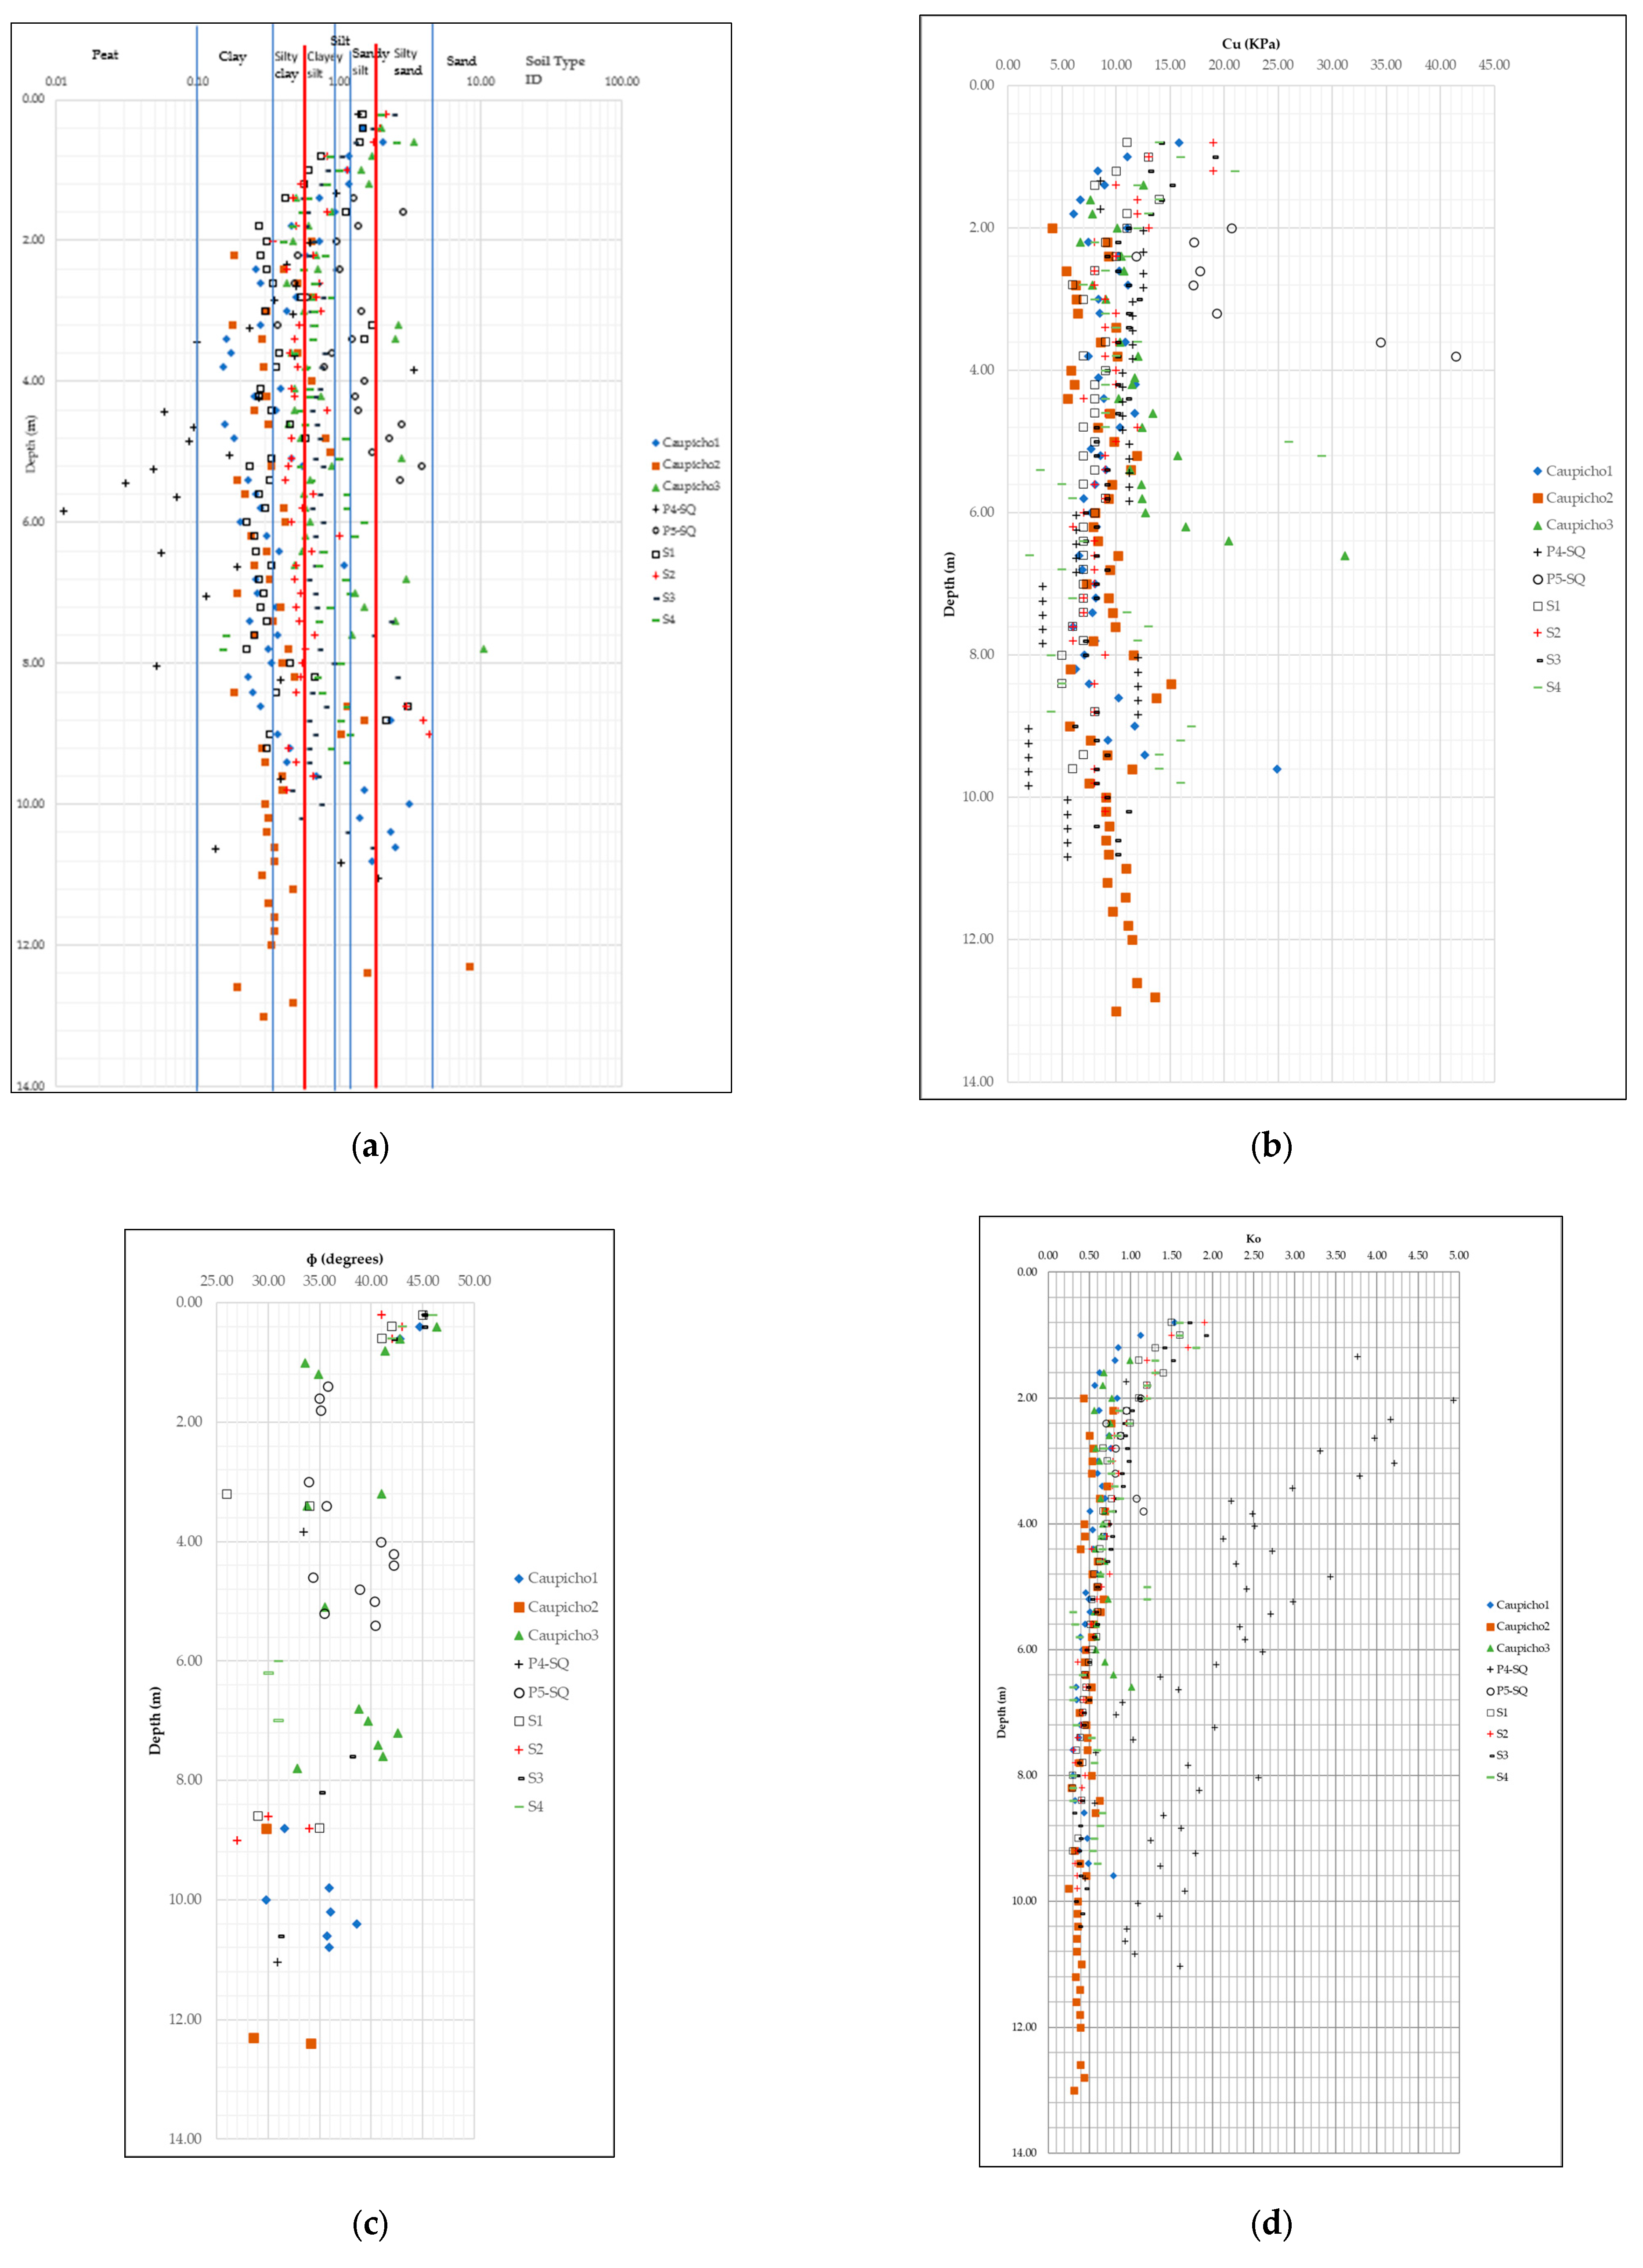
Figure 4.
Geotechnical parameters of Caupicho in relation to depth, using the Marchetti dilatometer, listed as: (a) material index (ID); (b) cohesion of unconsolidated undrained soil (Cu); (c) angle of internal friction (ɸ); (d) coefficient of lateral soil pressure (Ko); (e) relationship between preconsolidation pressure σc and the effective vertical pressure present σ’o (OCR); and (f) specific weight of soil (Ƴ).
Figure 5.
DMT results plotted on Marchetti’s nomogram [
36].
Figure 5.
DMT results plotted on Marchetti’s nomogram [
36].
Figure 6.
Materials and methods—seismic dilatometer: (
a) DMT blade and seismic module; (
b) schematic layout of the seismic dilatometer test; and (
c) seismic dilatometer equipment [
38].
Figure 6.
Materials and methods—seismic dilatometer: (
a) DMT blade and seismic module; (
b) schematic layout of the seismic dilatometer test; and (
c) seismic dilatometer equipment [
38].
Figure 7.
Results of three seismic wave velocity (Vs) tests for Caupicho1 [
36].
Figure 7.
Results of three seismic wave velocity (Vs) tests for Caupicho1 [
36].
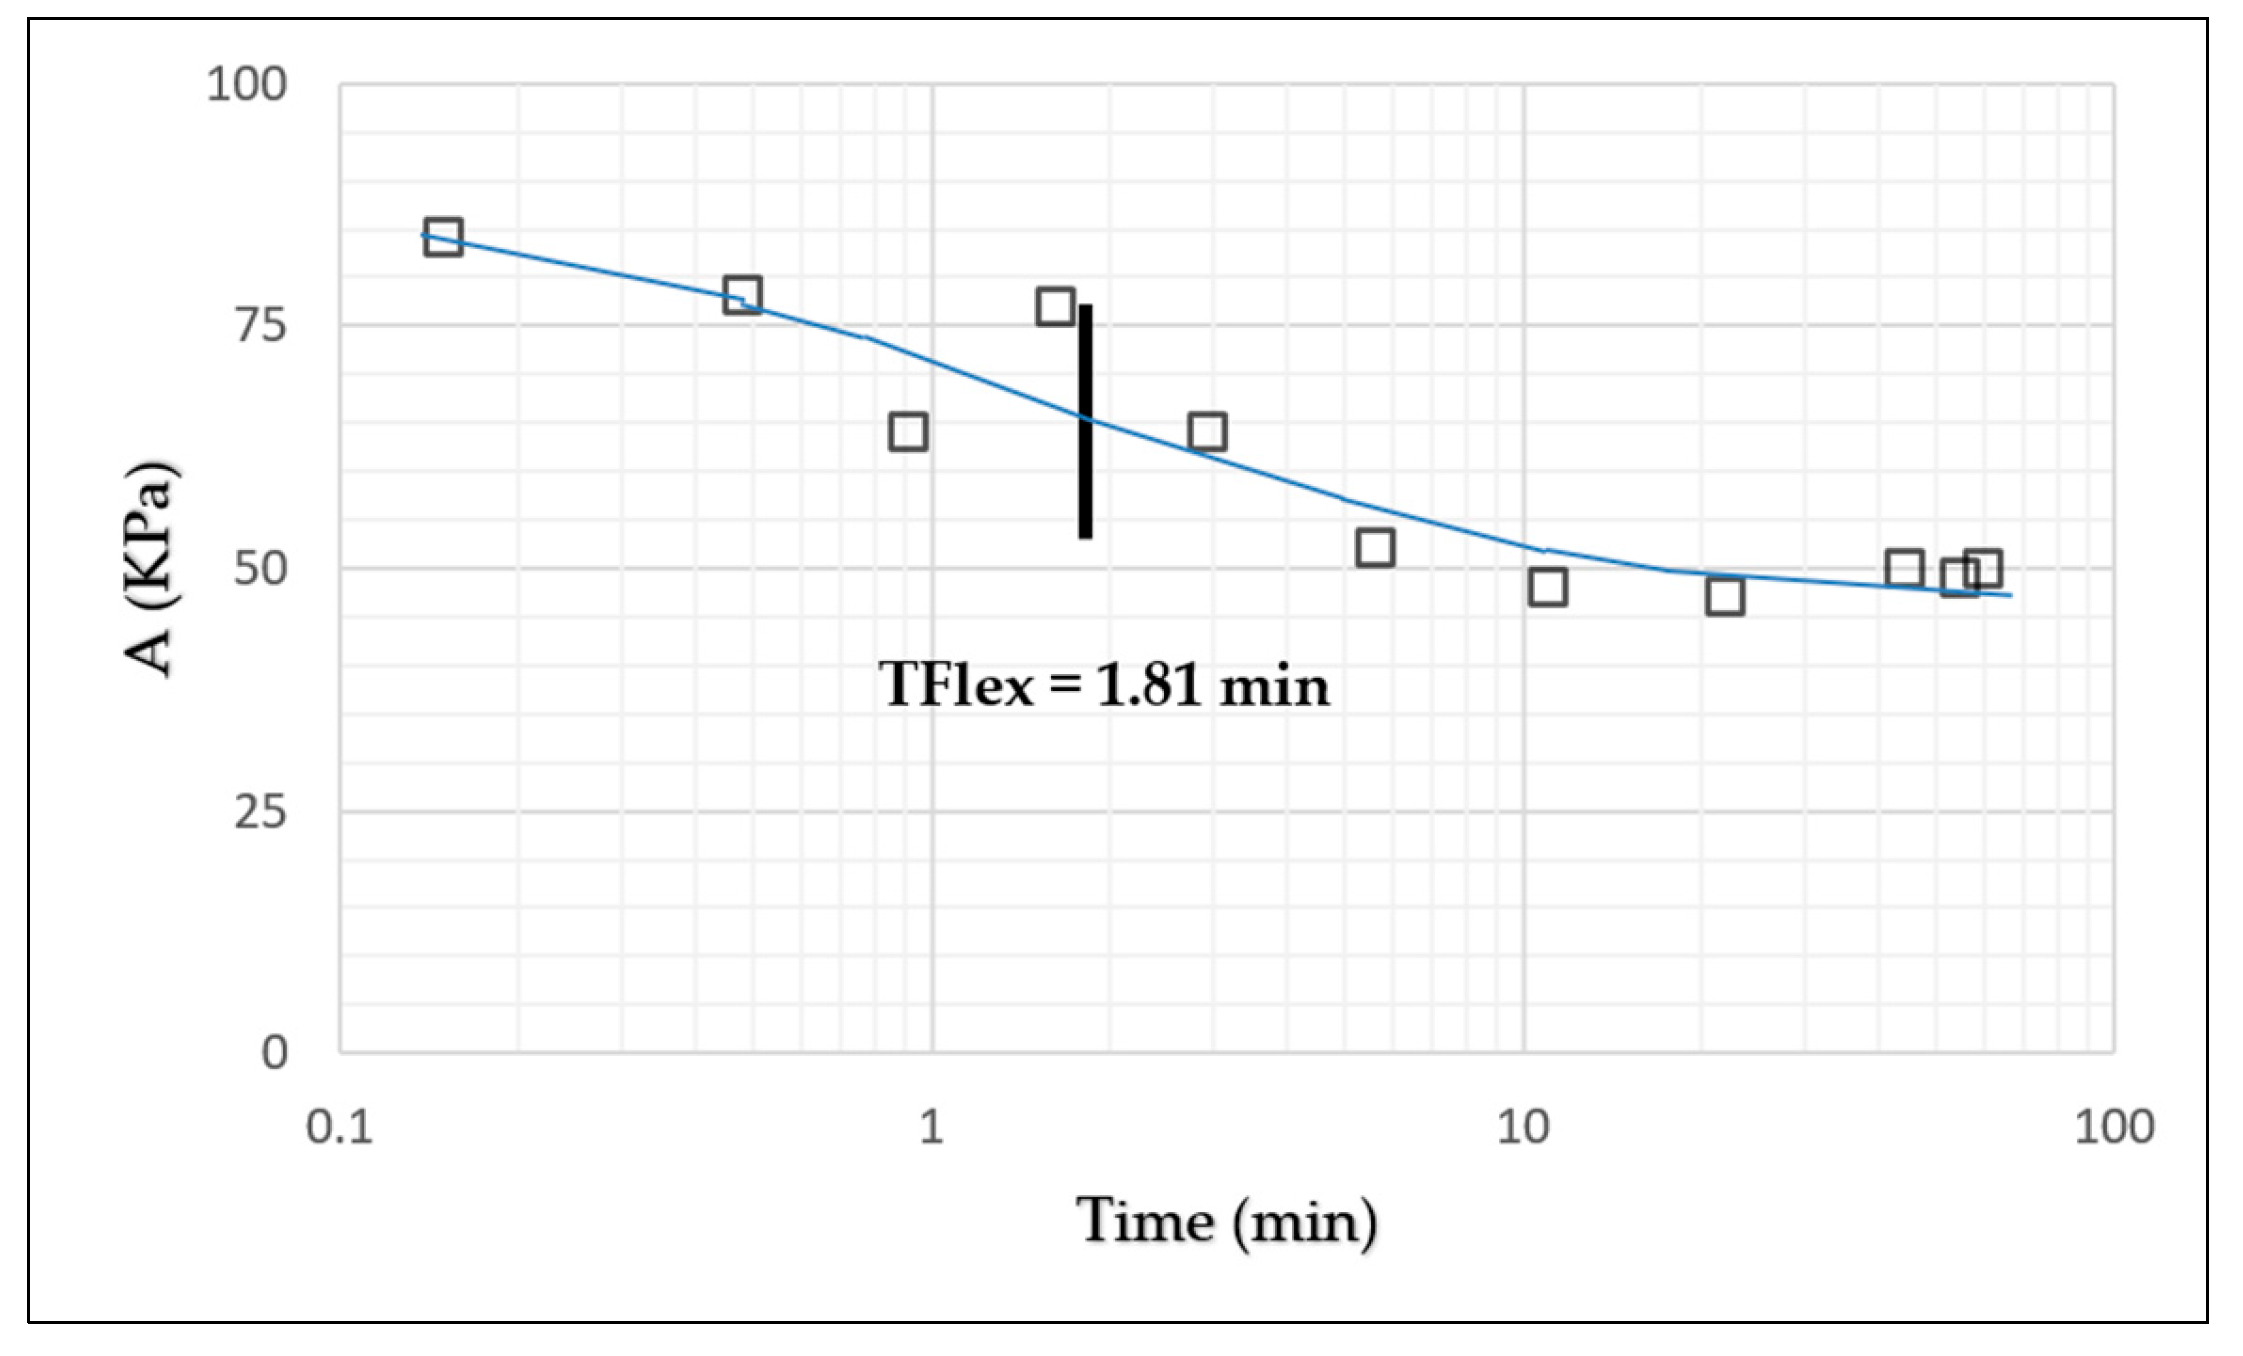
Figure 8.
DMT-A dissipation test as a function of time.
Figure 8.
DMT-A dissipation test as a function of time.
Figure 9.
Microphotography of Caupicho soil. Department of Geology, Faculty of Geology and Petroleum, National Polytechnic School—Quito [
24].
Figure 9.
Microphotography of Caupicho soil. Department of Geology, Faculty of Geology and Petroleum, National Polytechnic School—Quito [
24].
Figure 10.
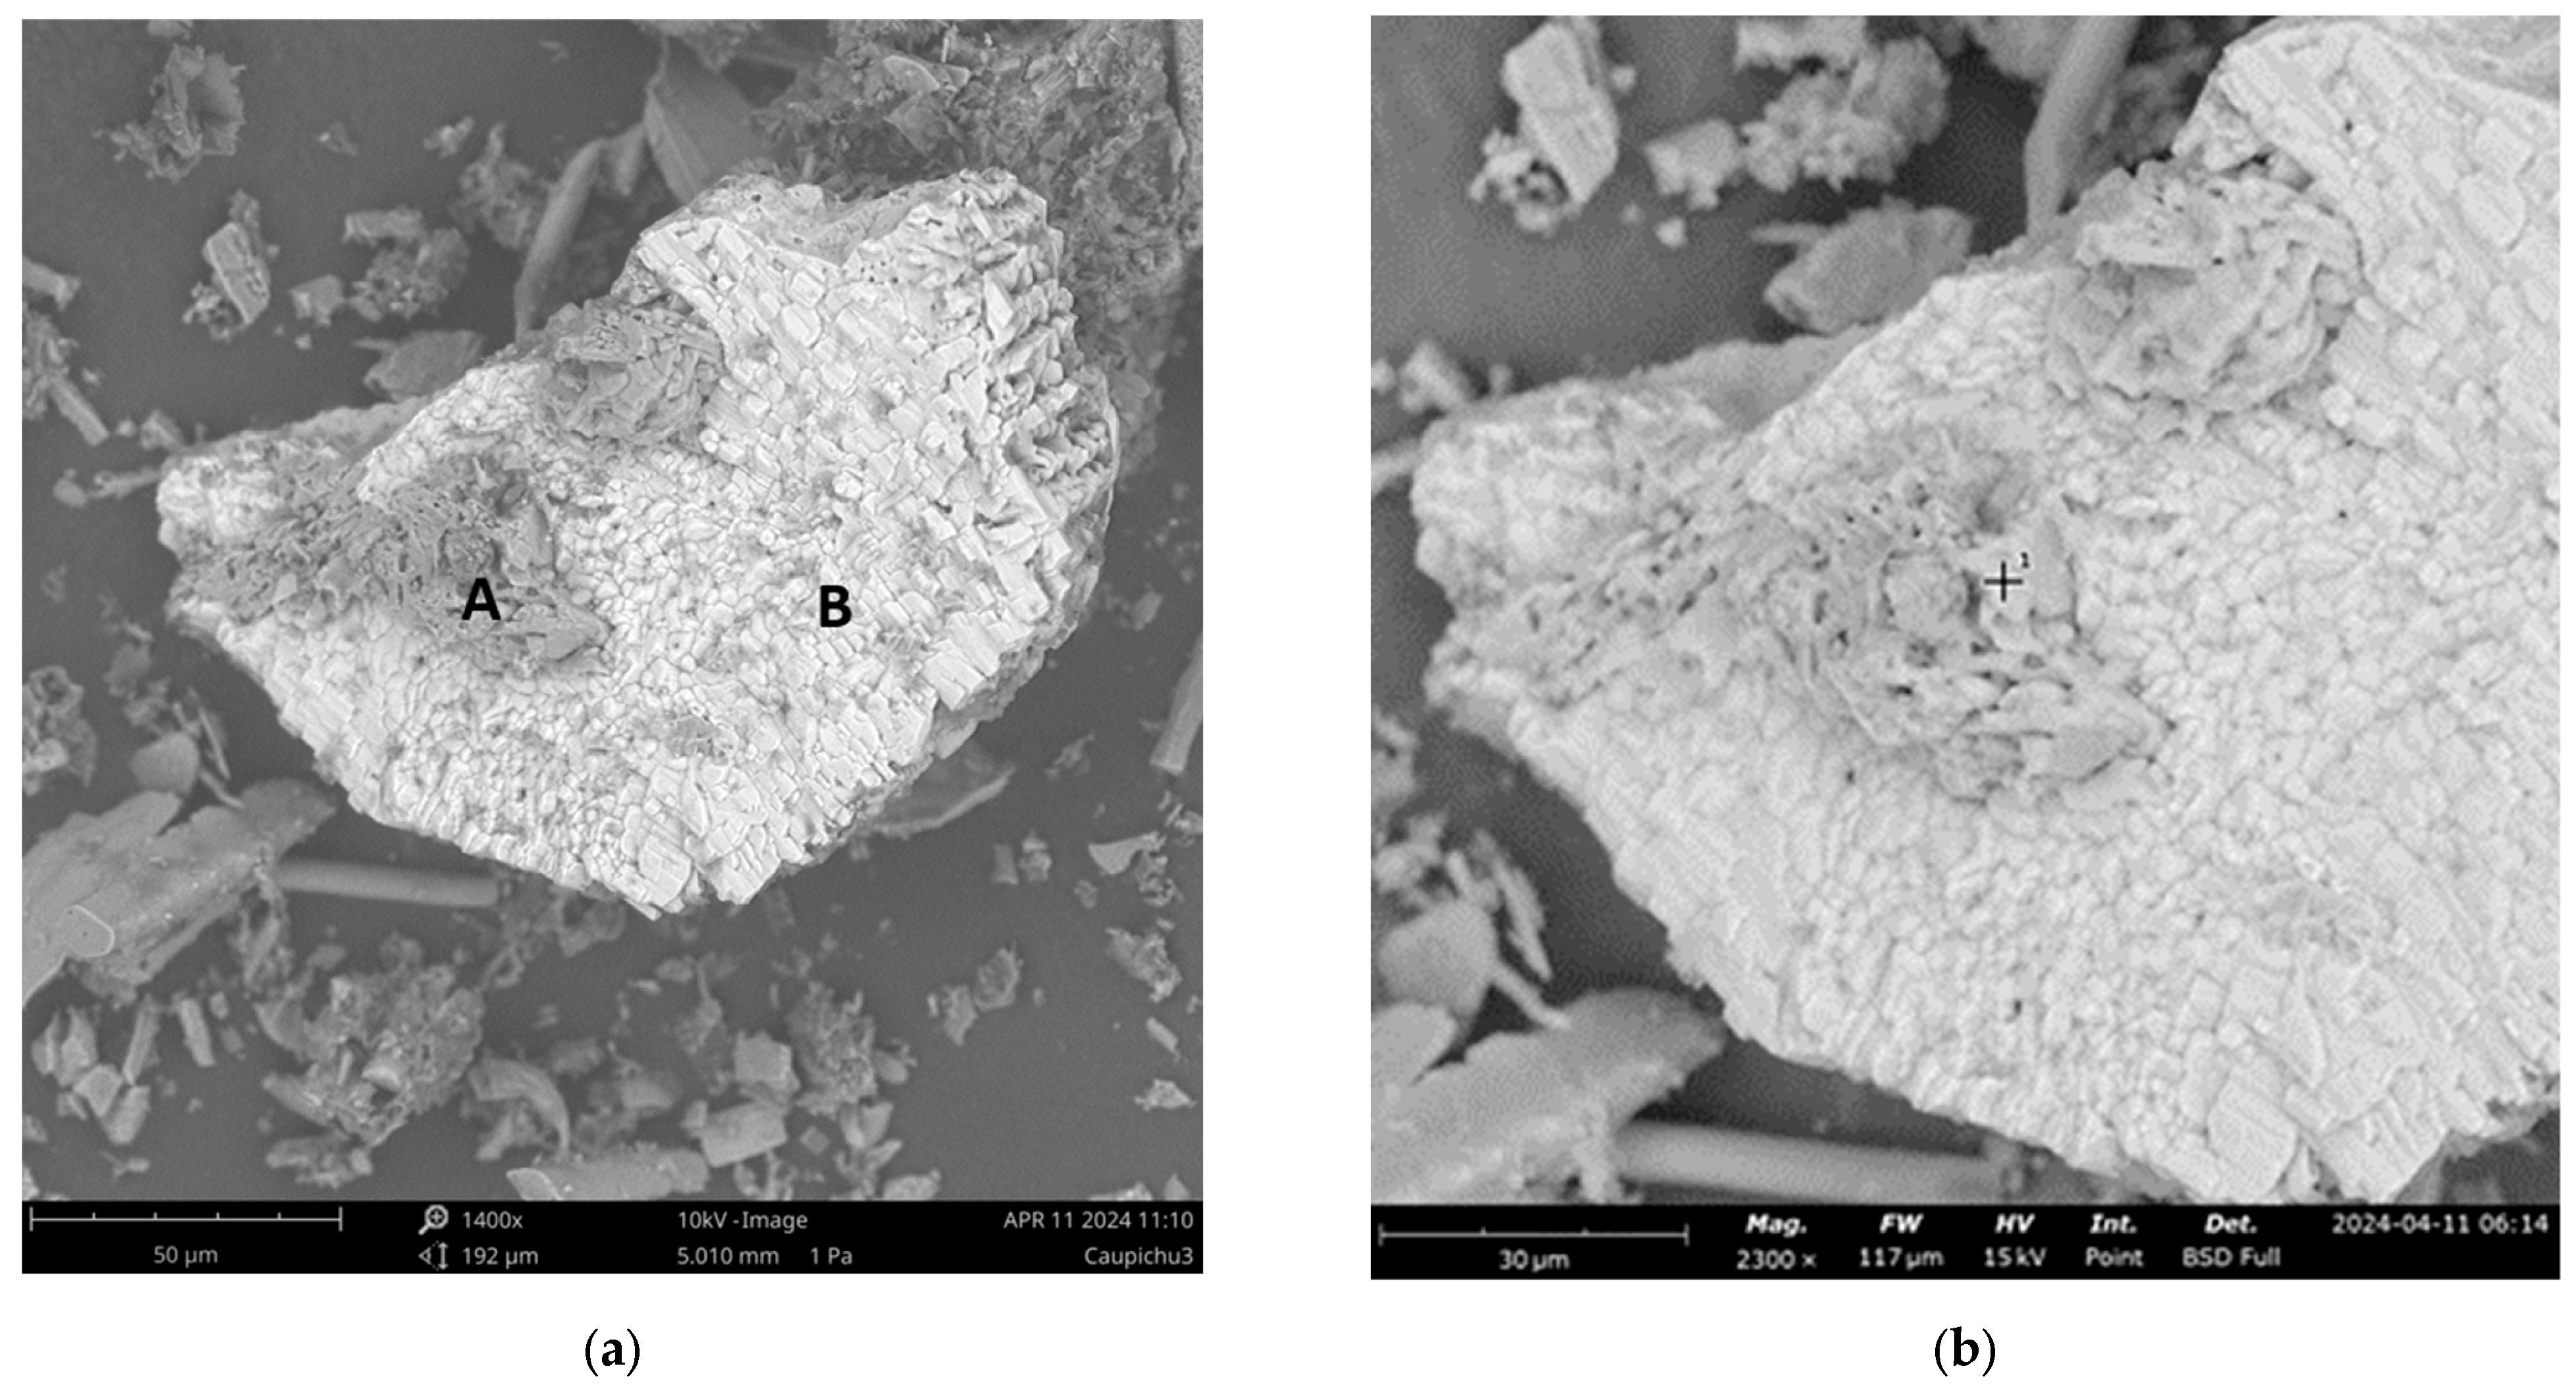
Morphology image Caupicho 4.50–5.00 m, listed as; (a) twinned mineral crystal; (b) point 1: evaluation of chemical elements in mineral A; (c) point 1: evaluation of chemical elements in mineral B. Morphology image Caupicho 9.50–10.00 m: listed as: (d) point 1: evaluation in soil particle.
Figure 10.
Morphology image Caupicho 4.50–5.00 m, listed as; (a) twinned mineral crystal; (b) point 1: evaluation of chemical elements in mineral A; (c) point 1: evaluation of chemical elements in mineral B. Morphology image Caupicho 9.50–10.00 m: listed as: (d) point 1: evaluation in soil particle.
Figure 11.
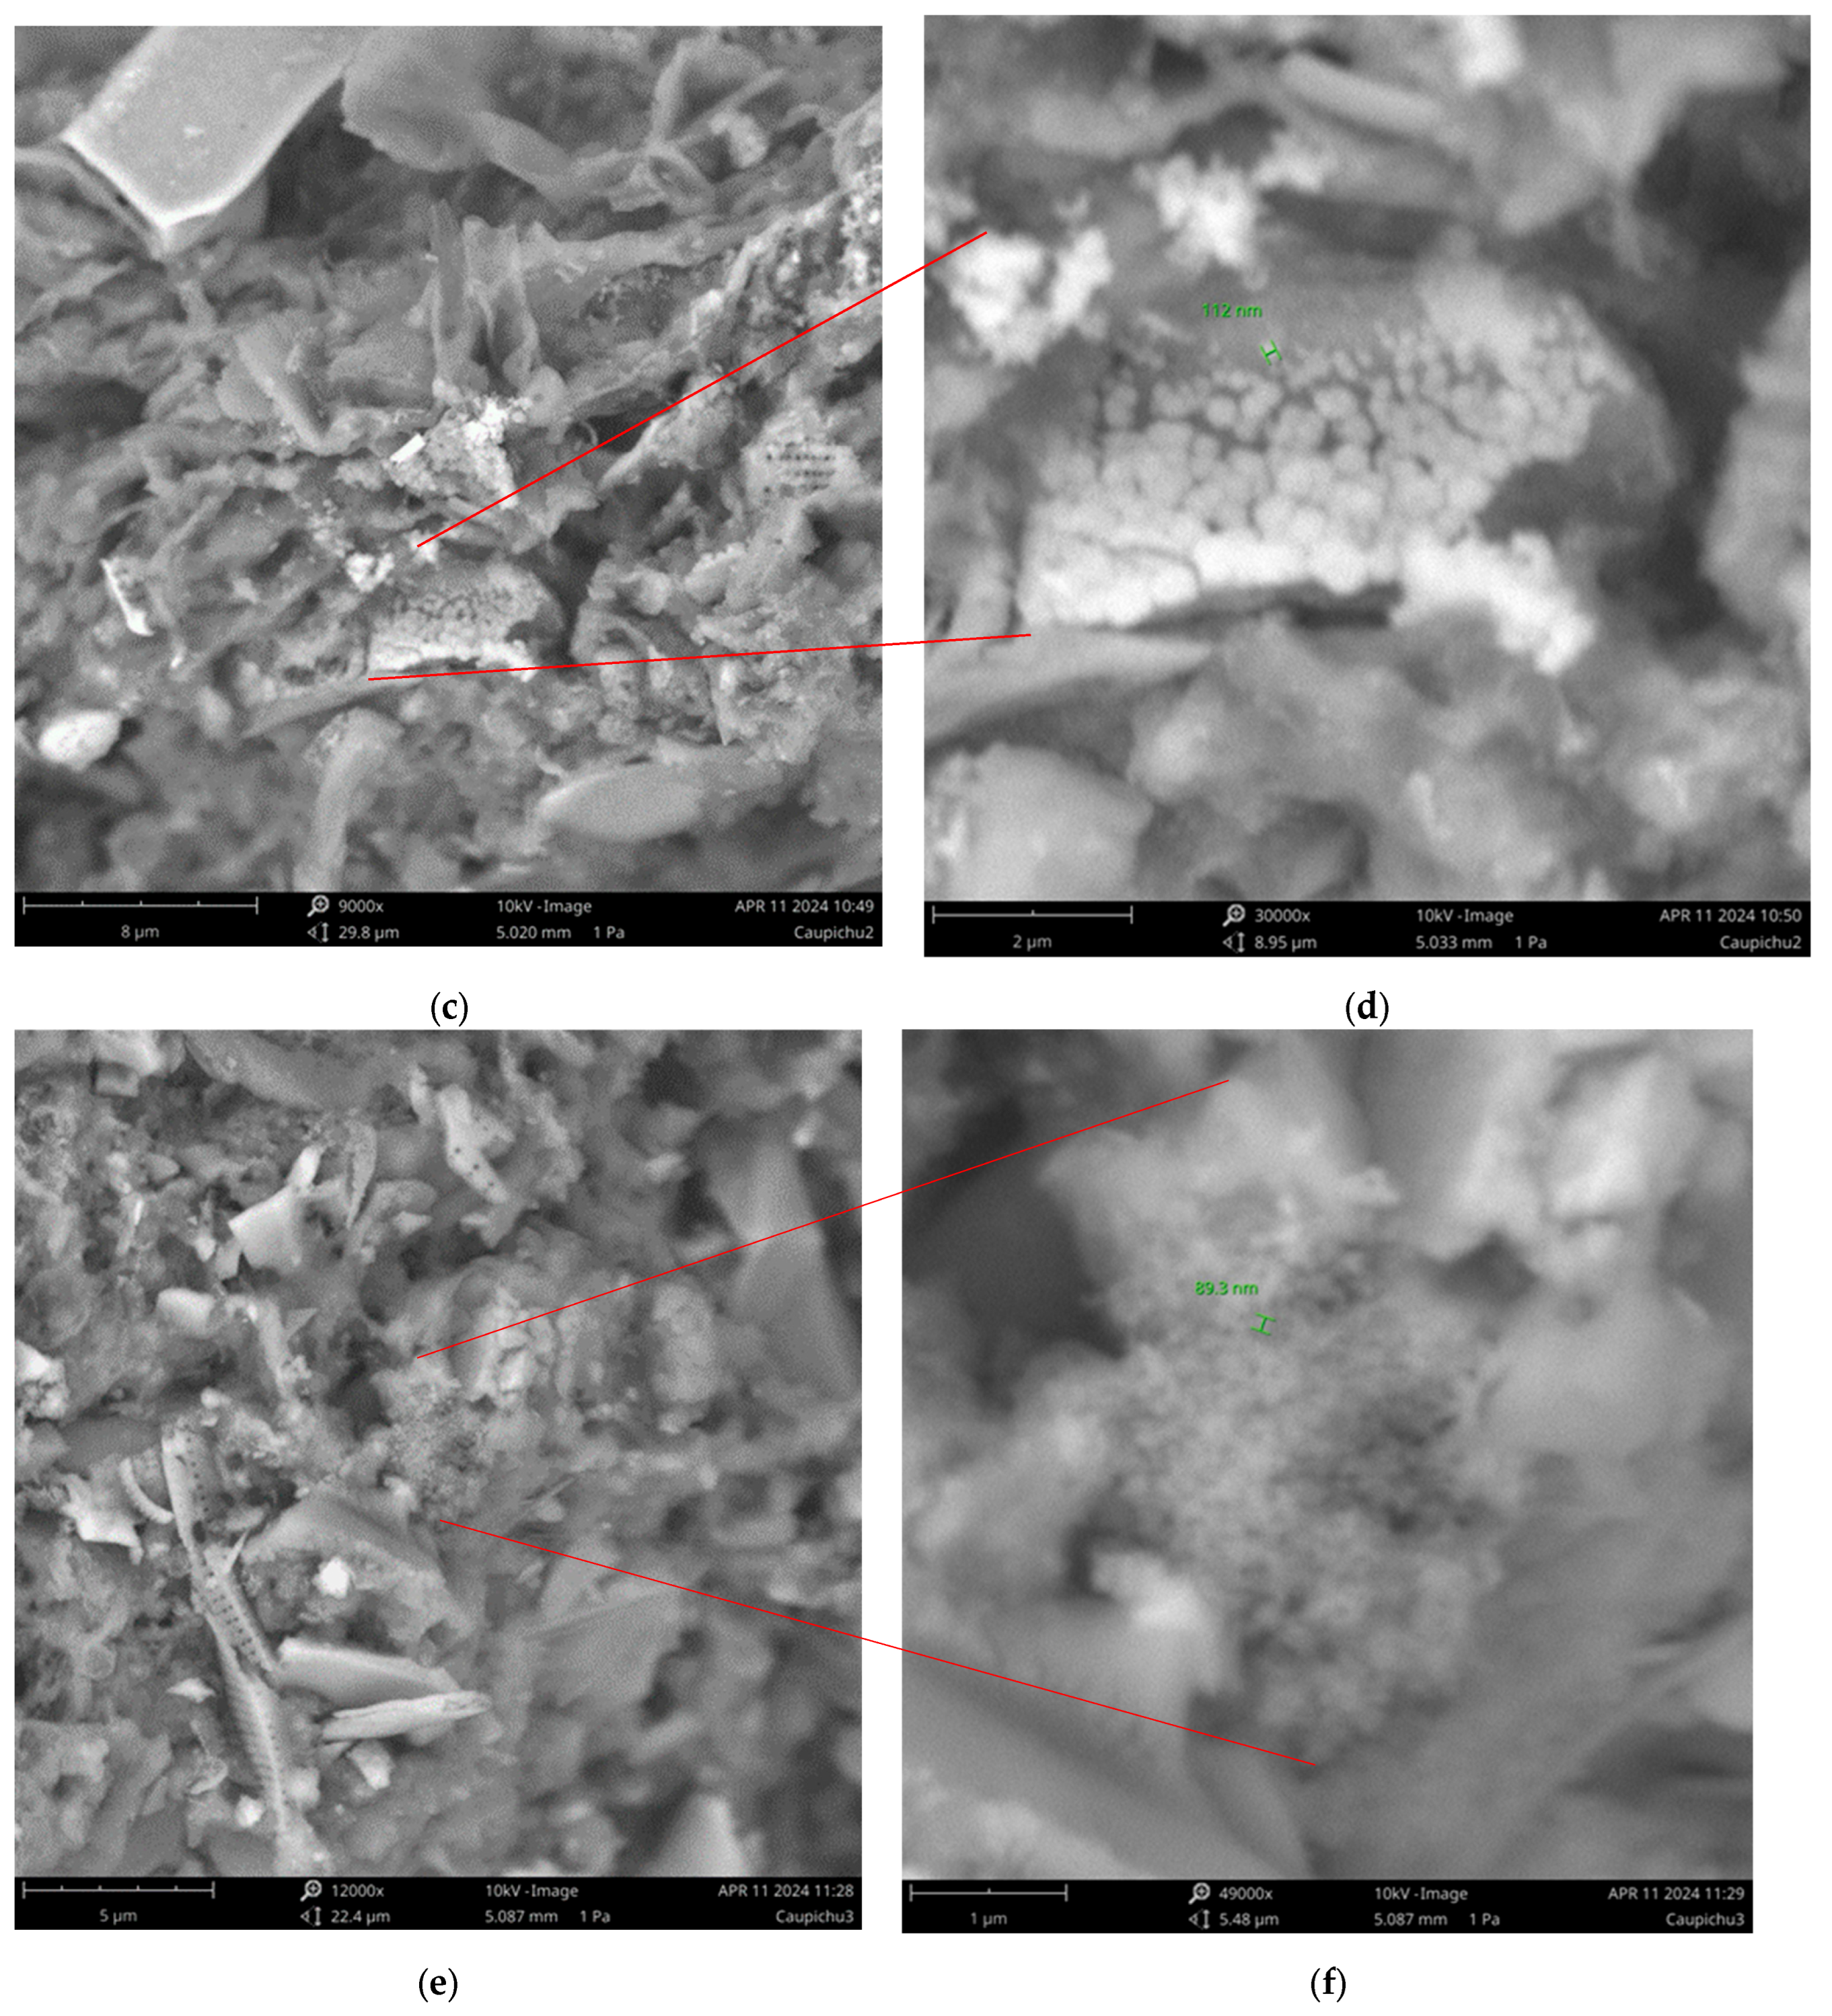
Morphology image Caupicho 4.50–5.00: (a) soil with diatoms; (b) set of diatoms with lengths of 5 to 10 μm; (c) soil, mineralization, and diatoms; (d) mineralization of approximate diameter 112 nm; (e) soil, allophane, and diatoms; and (f) allophane clusters < 89.3 nm.
Figure 11.
Morphology image Caupicho 4.50–5.00: (a) soil with diatoms; (b) set of diatoms with lengths of 5 to 10 μm; (c) soil, mineralization, and diatoms; (d) mineralization of approximate diameter 112 nm; (e) soil, allophane, and diatoms; and (f) allophane clusters < 89.3 nm.
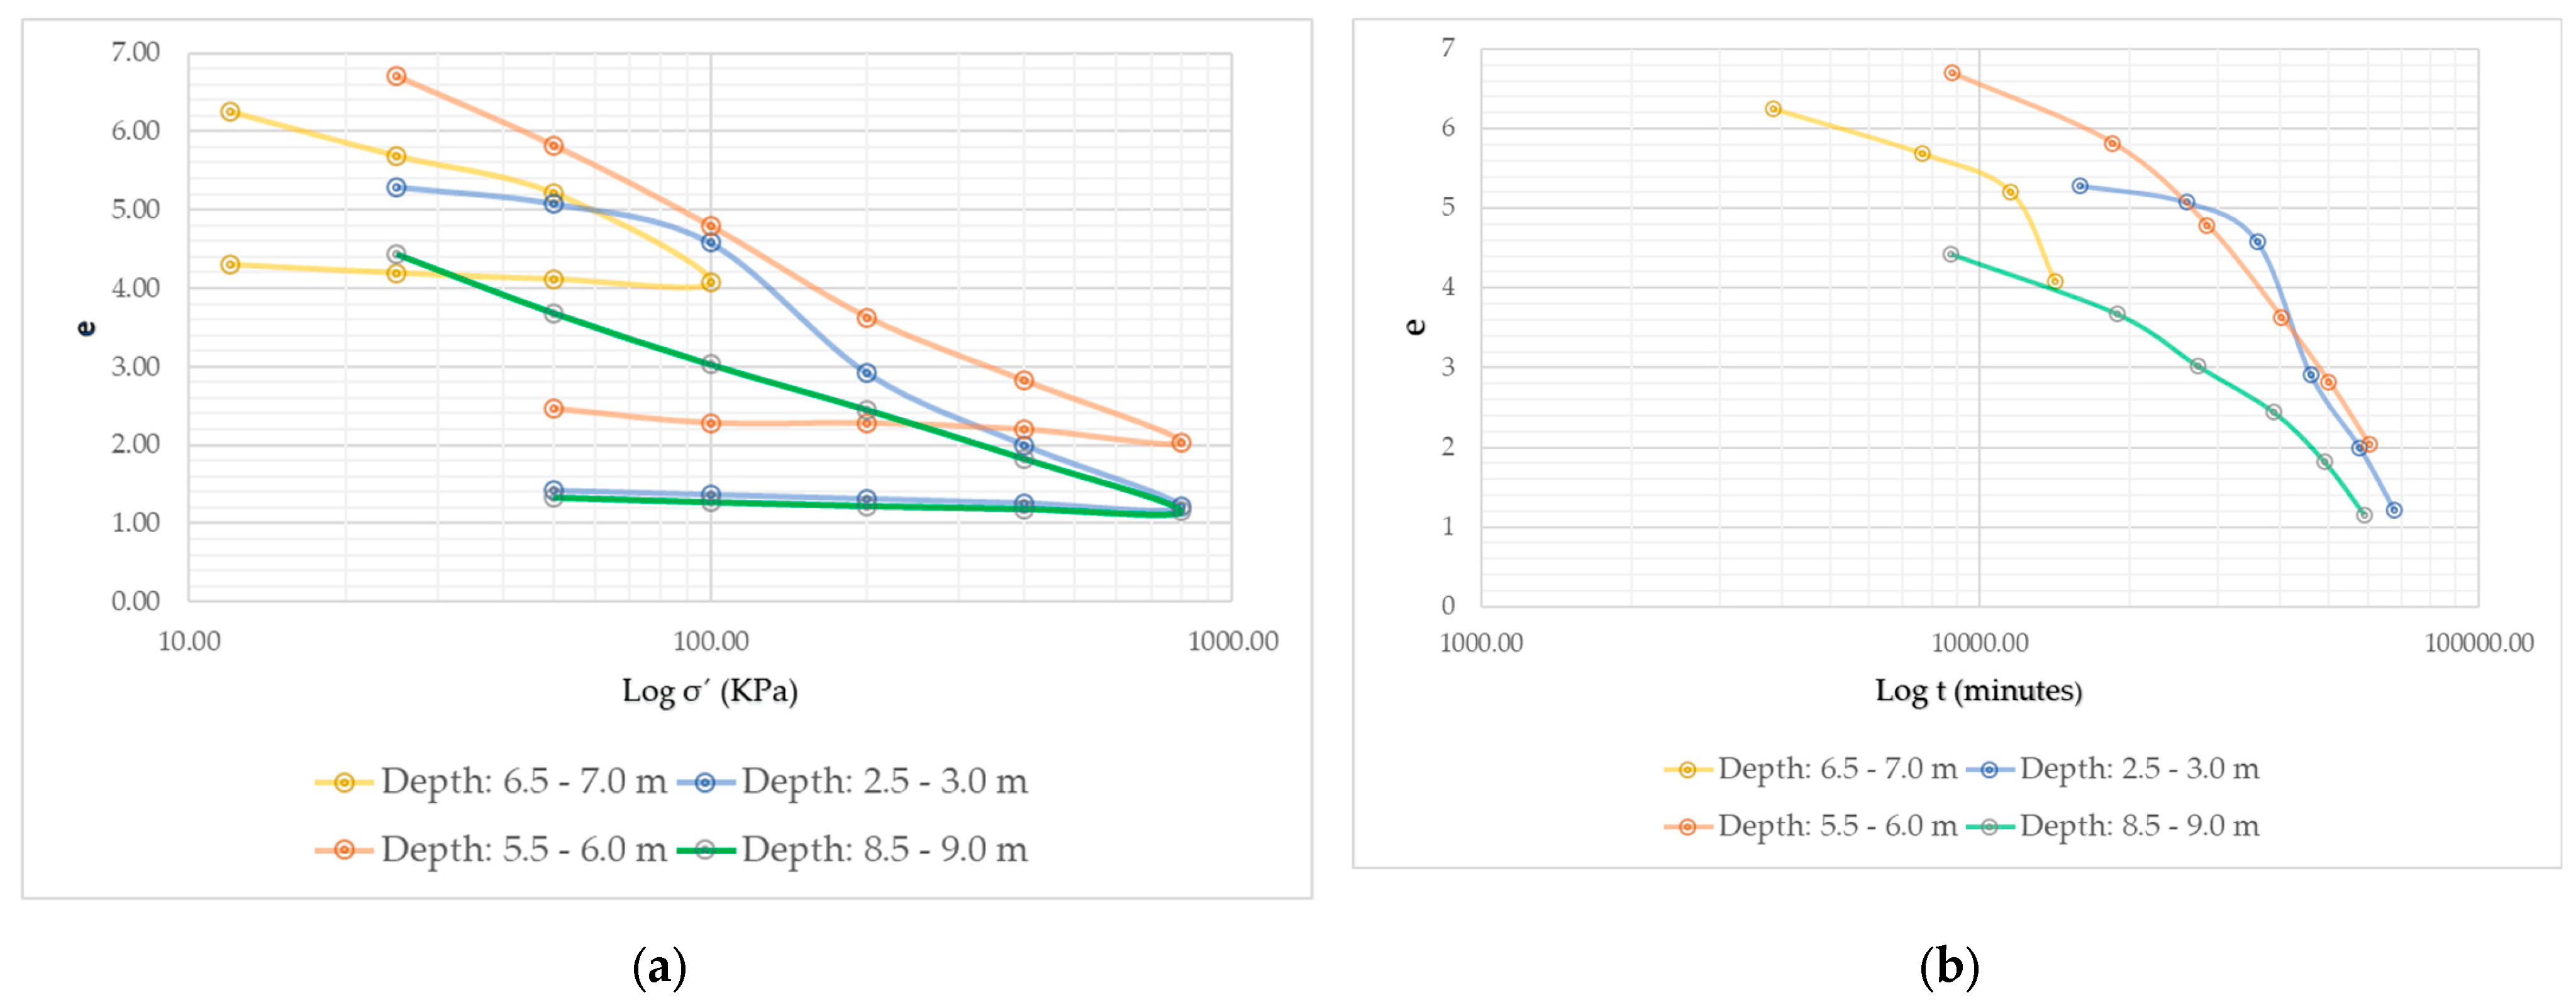
Figure 13.
(a) Void index (e) as a function of the logarithm of the effective pressure (log σ’), showing loading and unloading; (b) void index (e) as a function of the logarithm of time (log t) in minutes.
Figure 13.
(a) Void index (e) as a function of the logarithm of the effective pressure (log σ’), showing loading and unloading; (b) void index (e) as a function of the logarithm of time (log t) in minutes.
Figure 14.
(a) Strain (mm) vs. root time (min) at different loads of 12.5, 25, 50, and 100 KPa for sample 1; (b) strain (mm) vs. root time (min) at different loads of 25, 50, 100, 200, 400, and 500 KPa for sample 2; (c) strain (mm) vs. root time (min) at different loads of 25, 50, 100, 200, 400, and 500 KPa for sample 3; (d) strain (mm) vs. root time (min) at different loads of 25, 50, 100, 200, 400, and 500 KPa for sample 4.
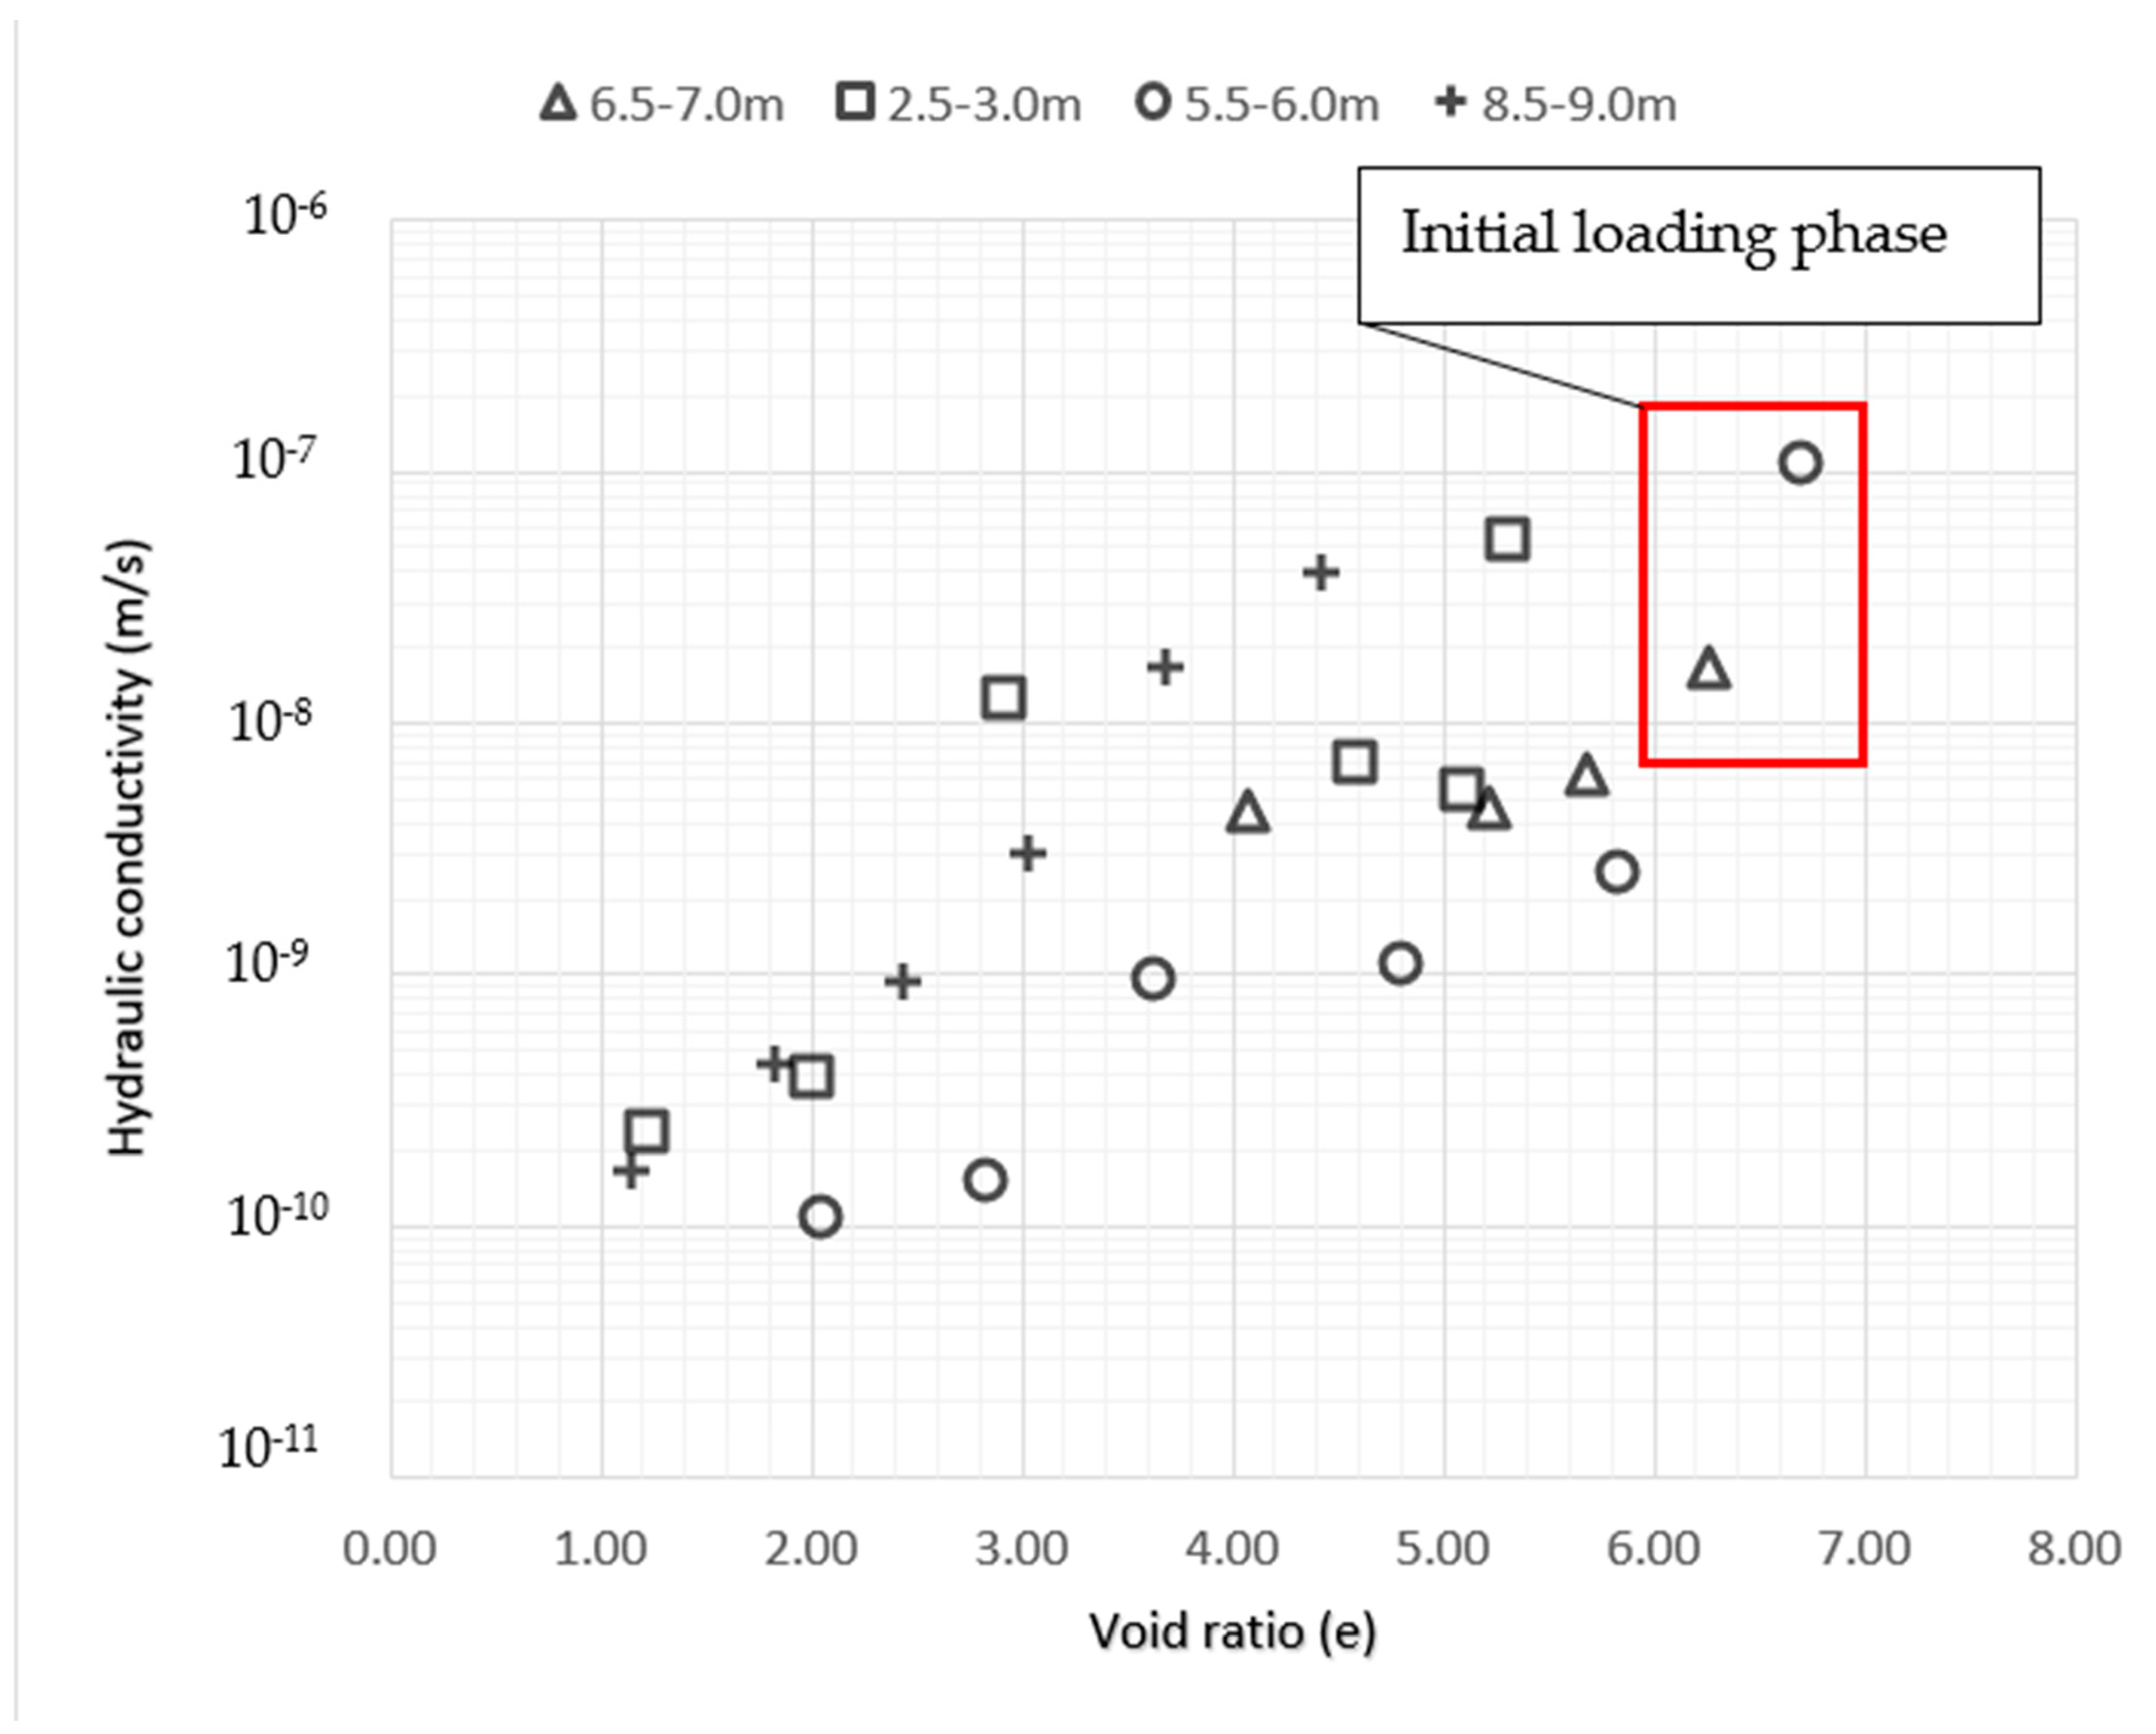
Figure 15.
Hydraulic conductivity (Kv) as a function of void index at different depths in Caupicho1.
Figure 15.
Hydraulic conductivity (Kv) as a function of void index at different depths in Caupicho1.
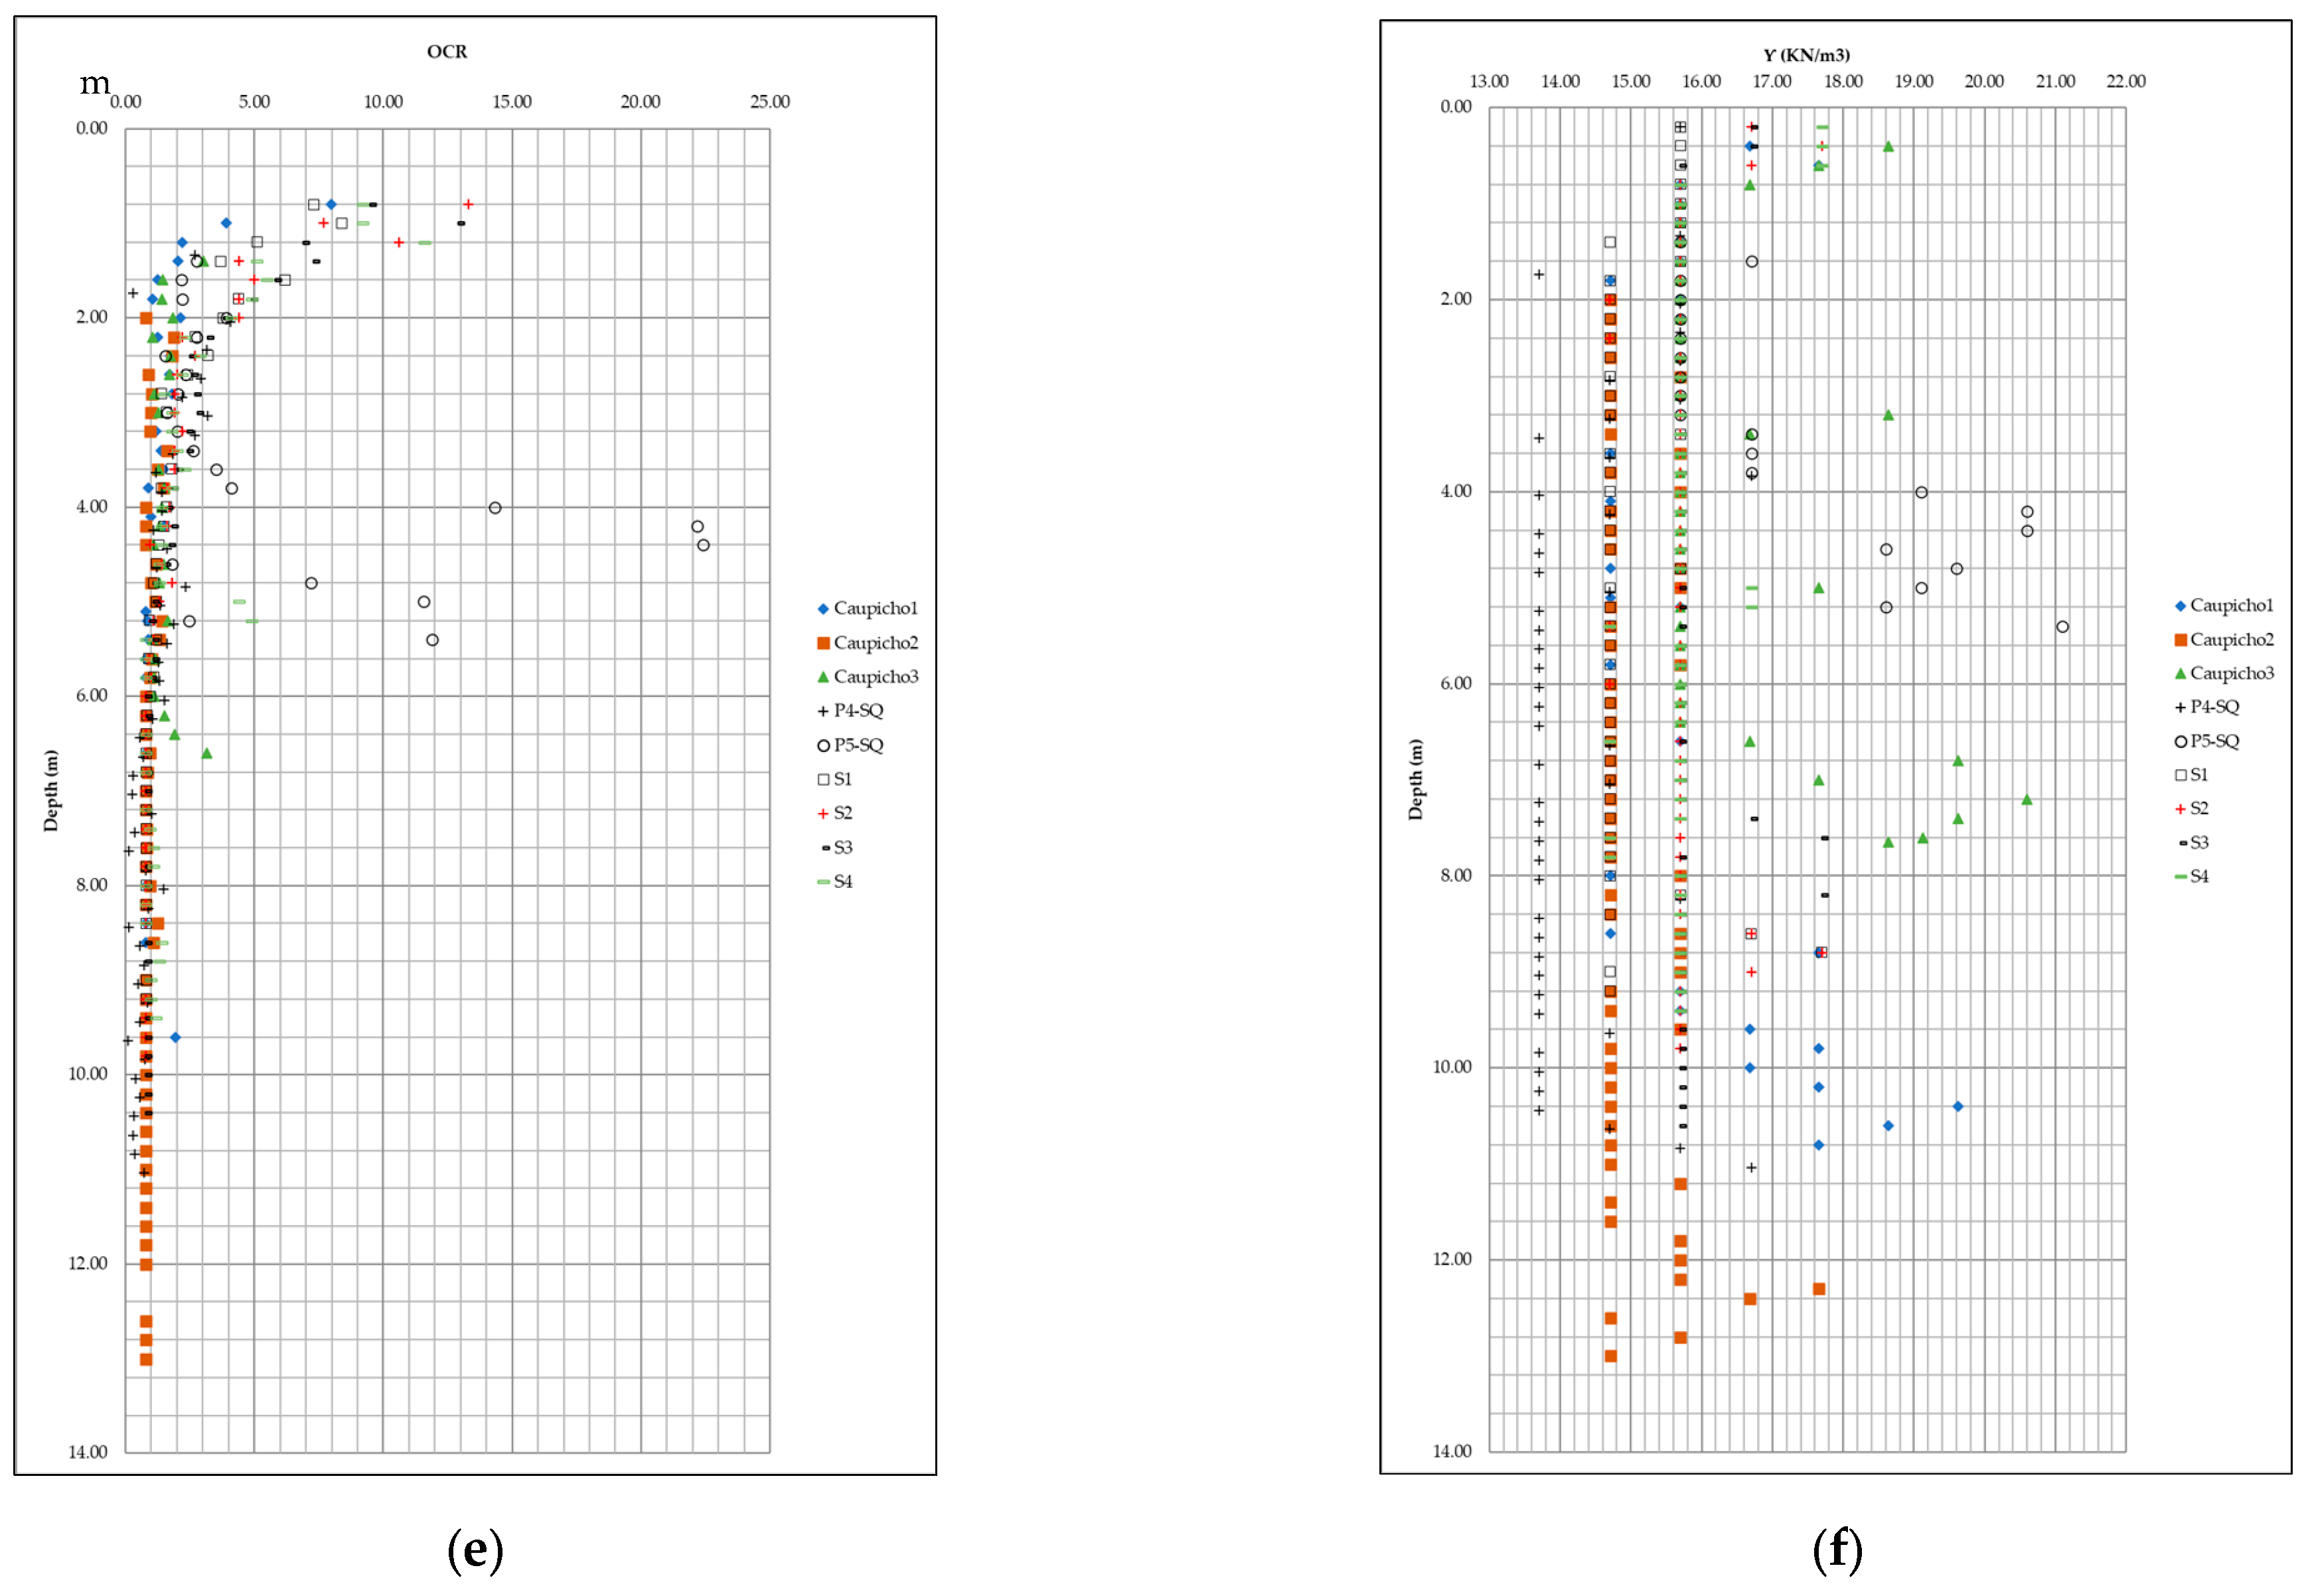
Figure 16.
Relation of Caupicho geotechnical parameters using the Marchetti dilatometer vs. Quito seismic zoning project (P4-SQ, P5-SQ) and Mayanquer (S1, S2, S3, S4), listed as: (a) material index (ID)–depth; (b) cohesion of unconsolidated undrained soil (Cu)–depth; (c) angle of internal friction (ɸ) in degrees–depth; (d) coefficient of lateral soil pressure (Ko)–depth; (e) relationship between preconsolidation pressure σc and the present effective vertical pressure σ’o (OCR)–depth; and (f) specific weight of soil (Ƴ)–depth.
Figure 17.
Geographical position of seismic traces: T42, T44, and T46.
Figure 17.
Geographical position of seismic traces: T42, T44, and T46.
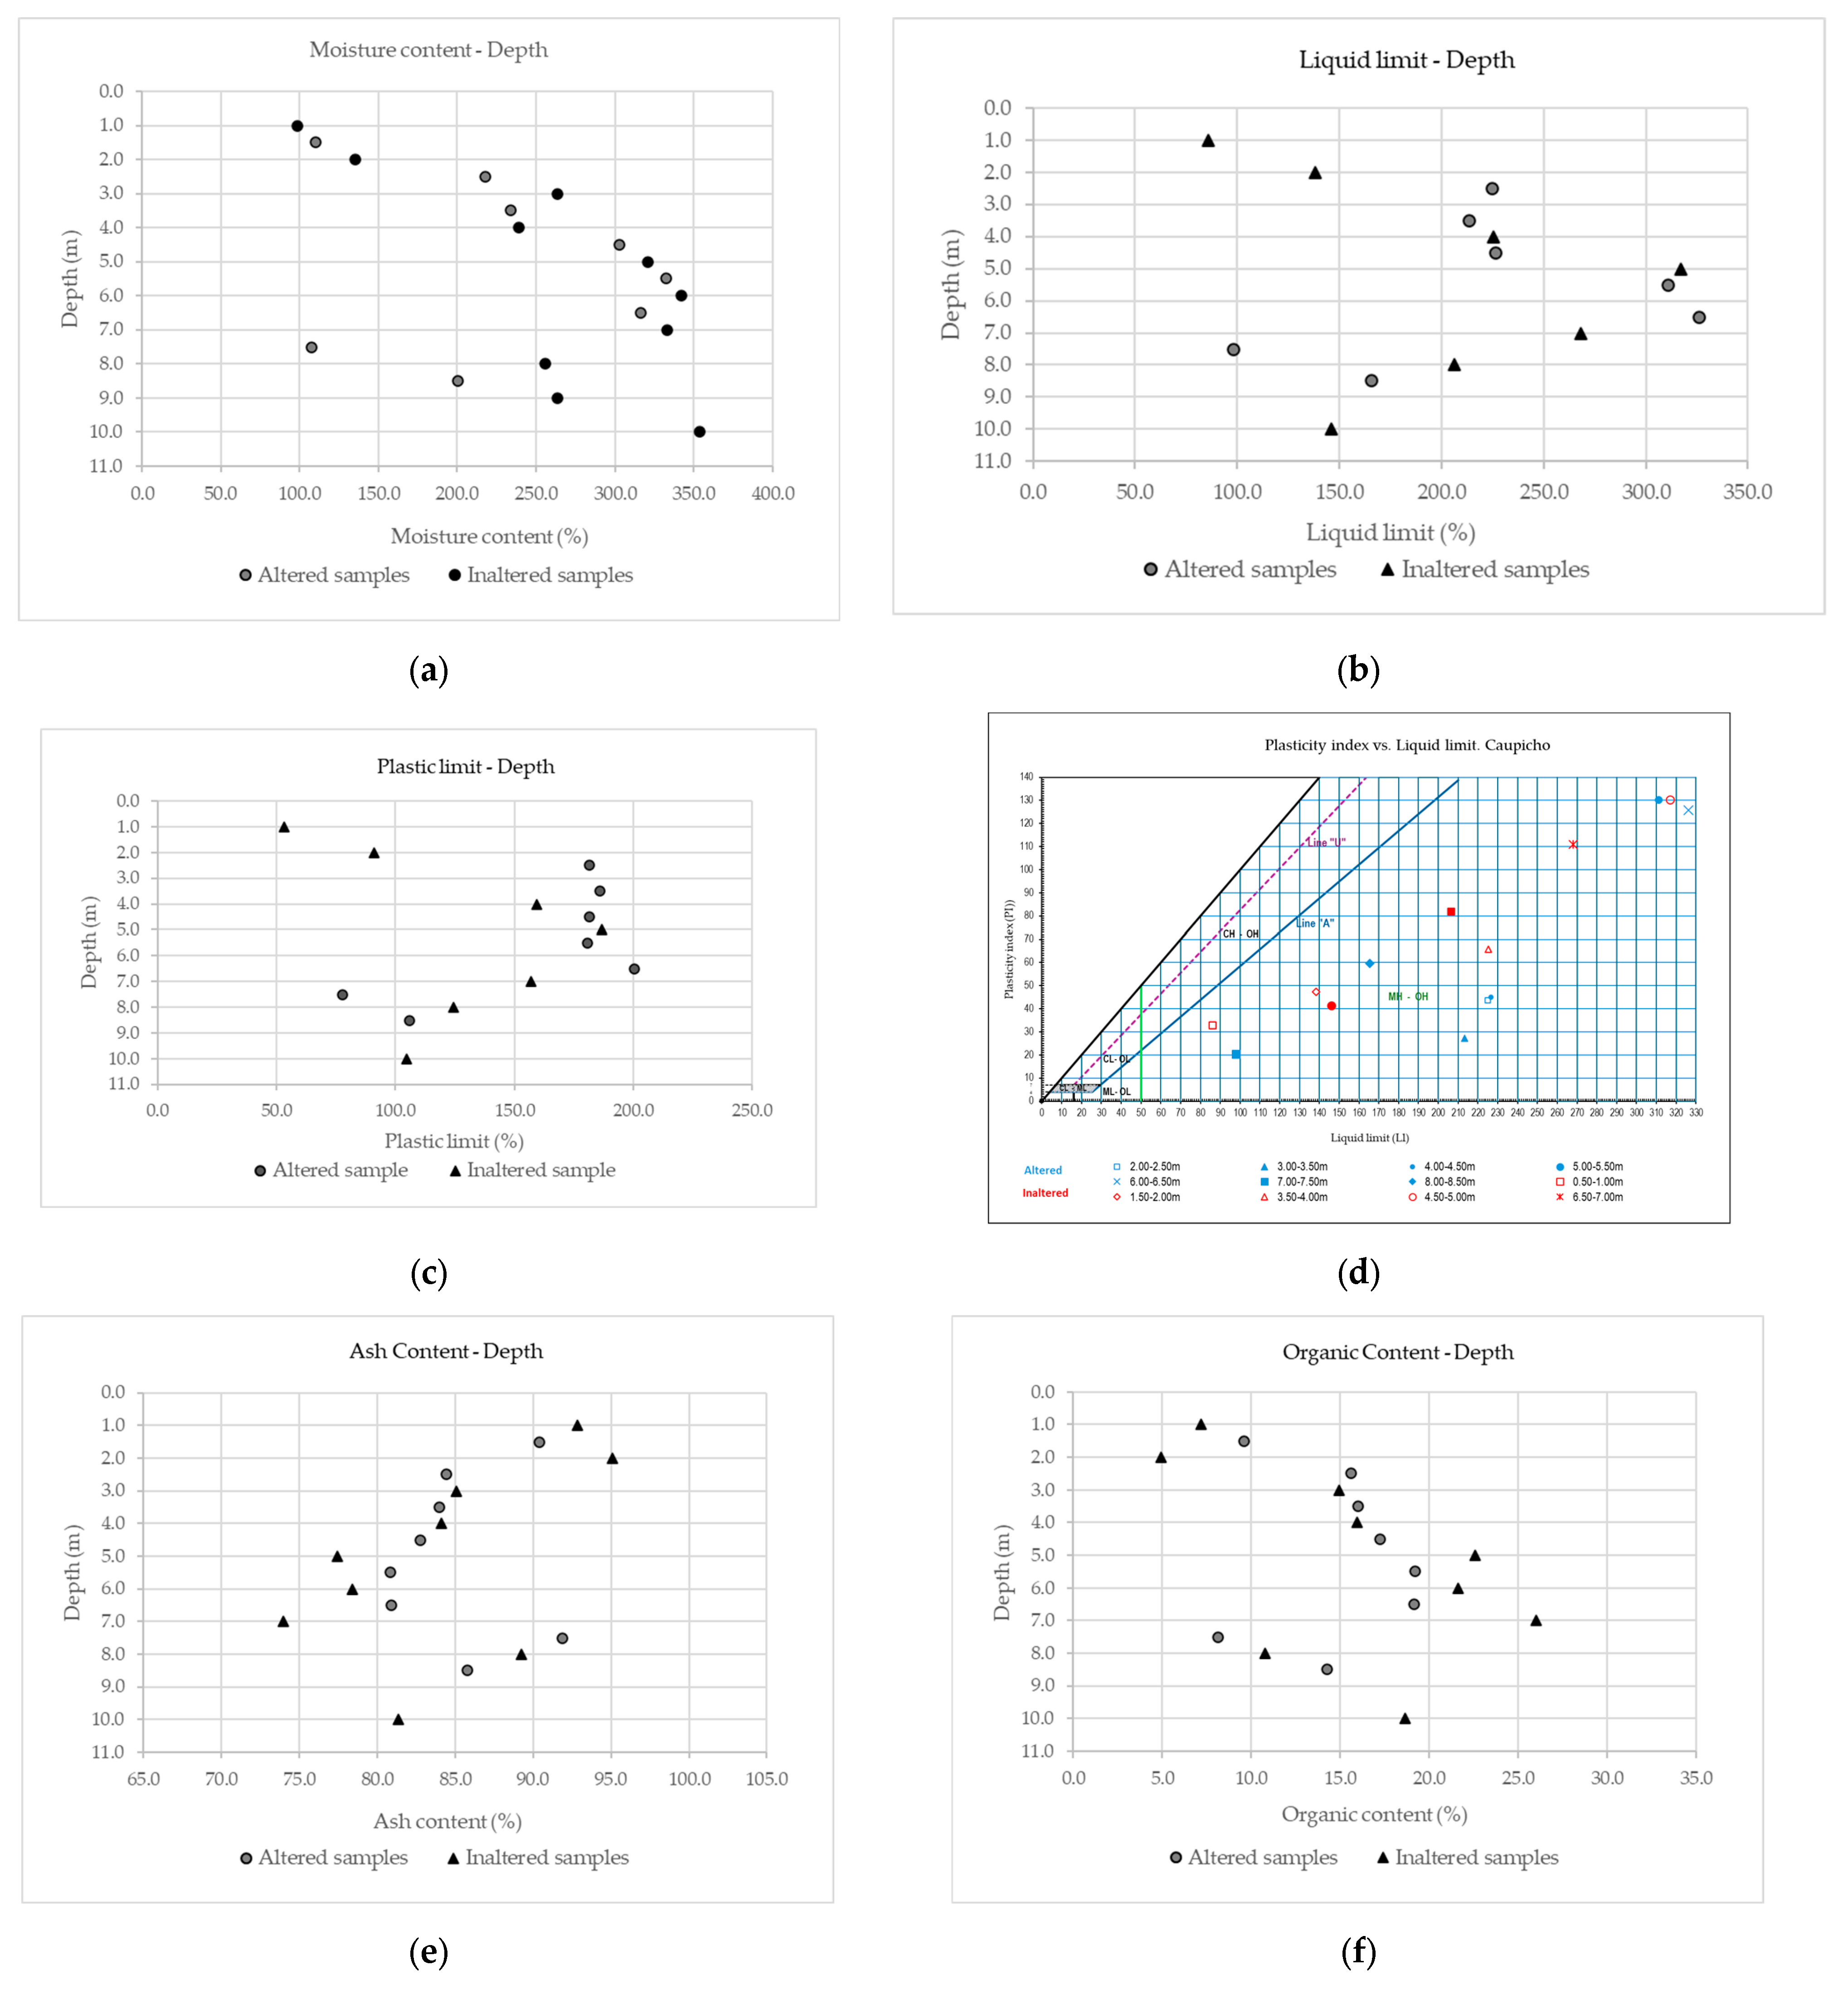
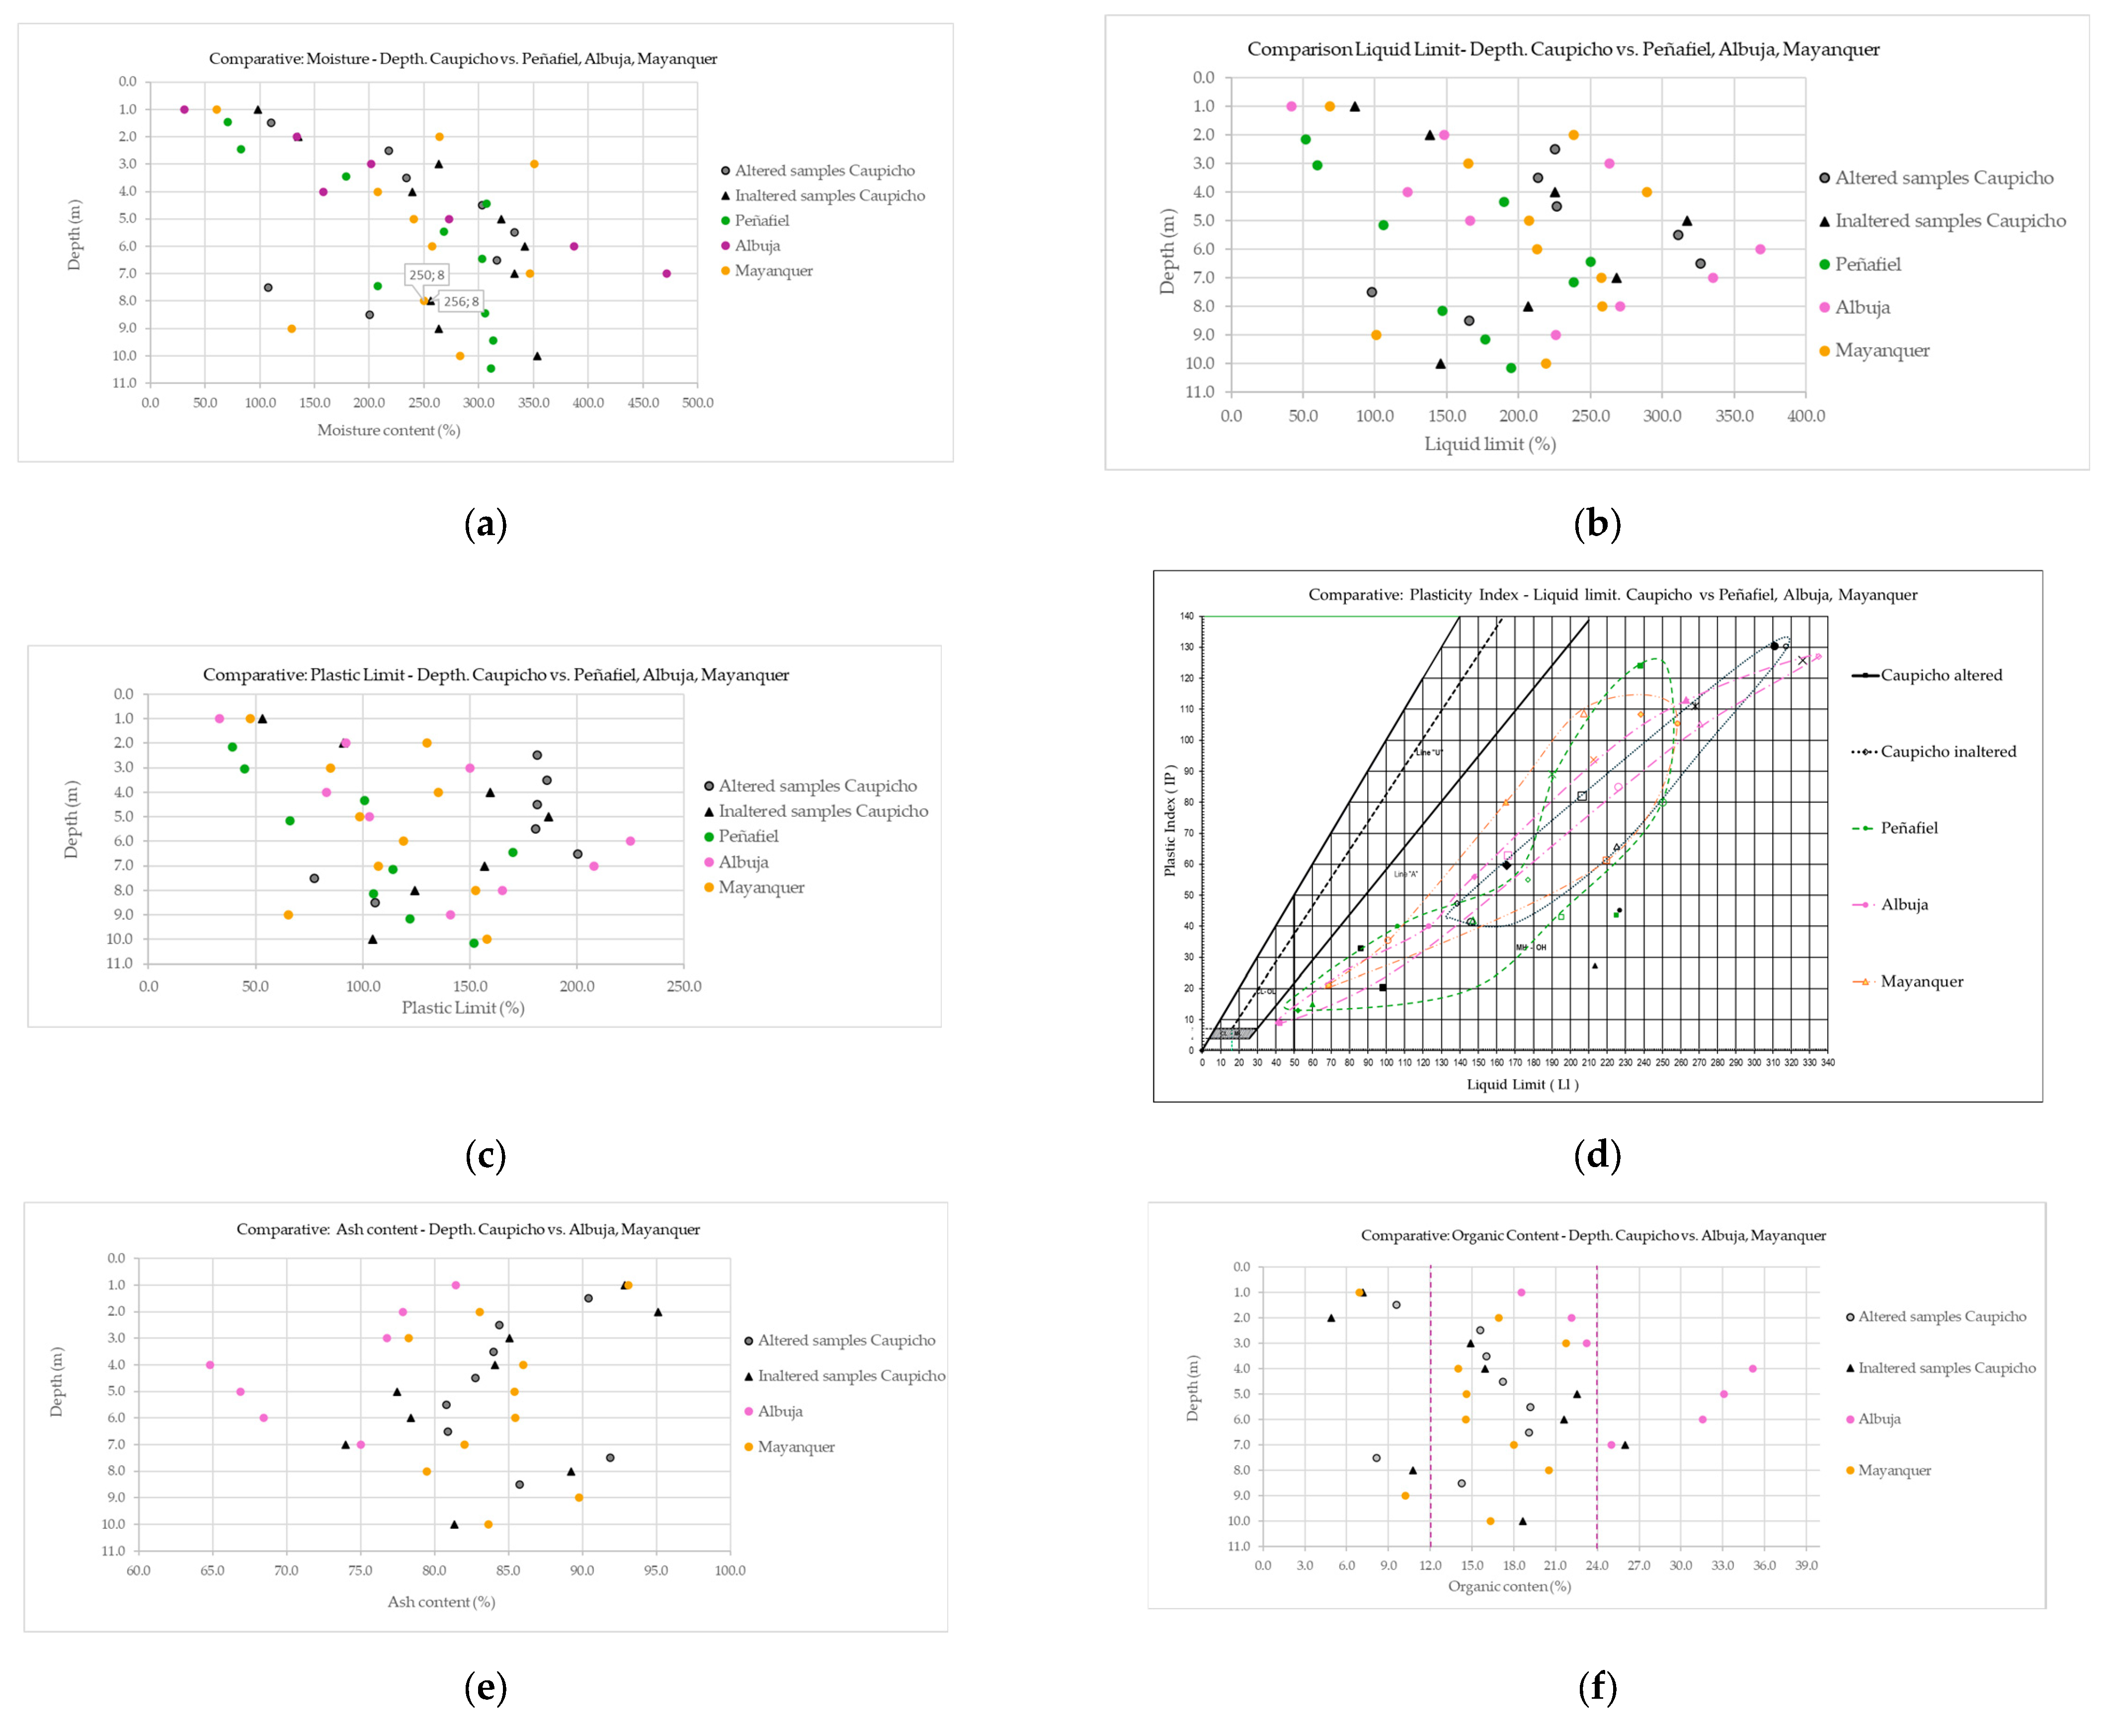
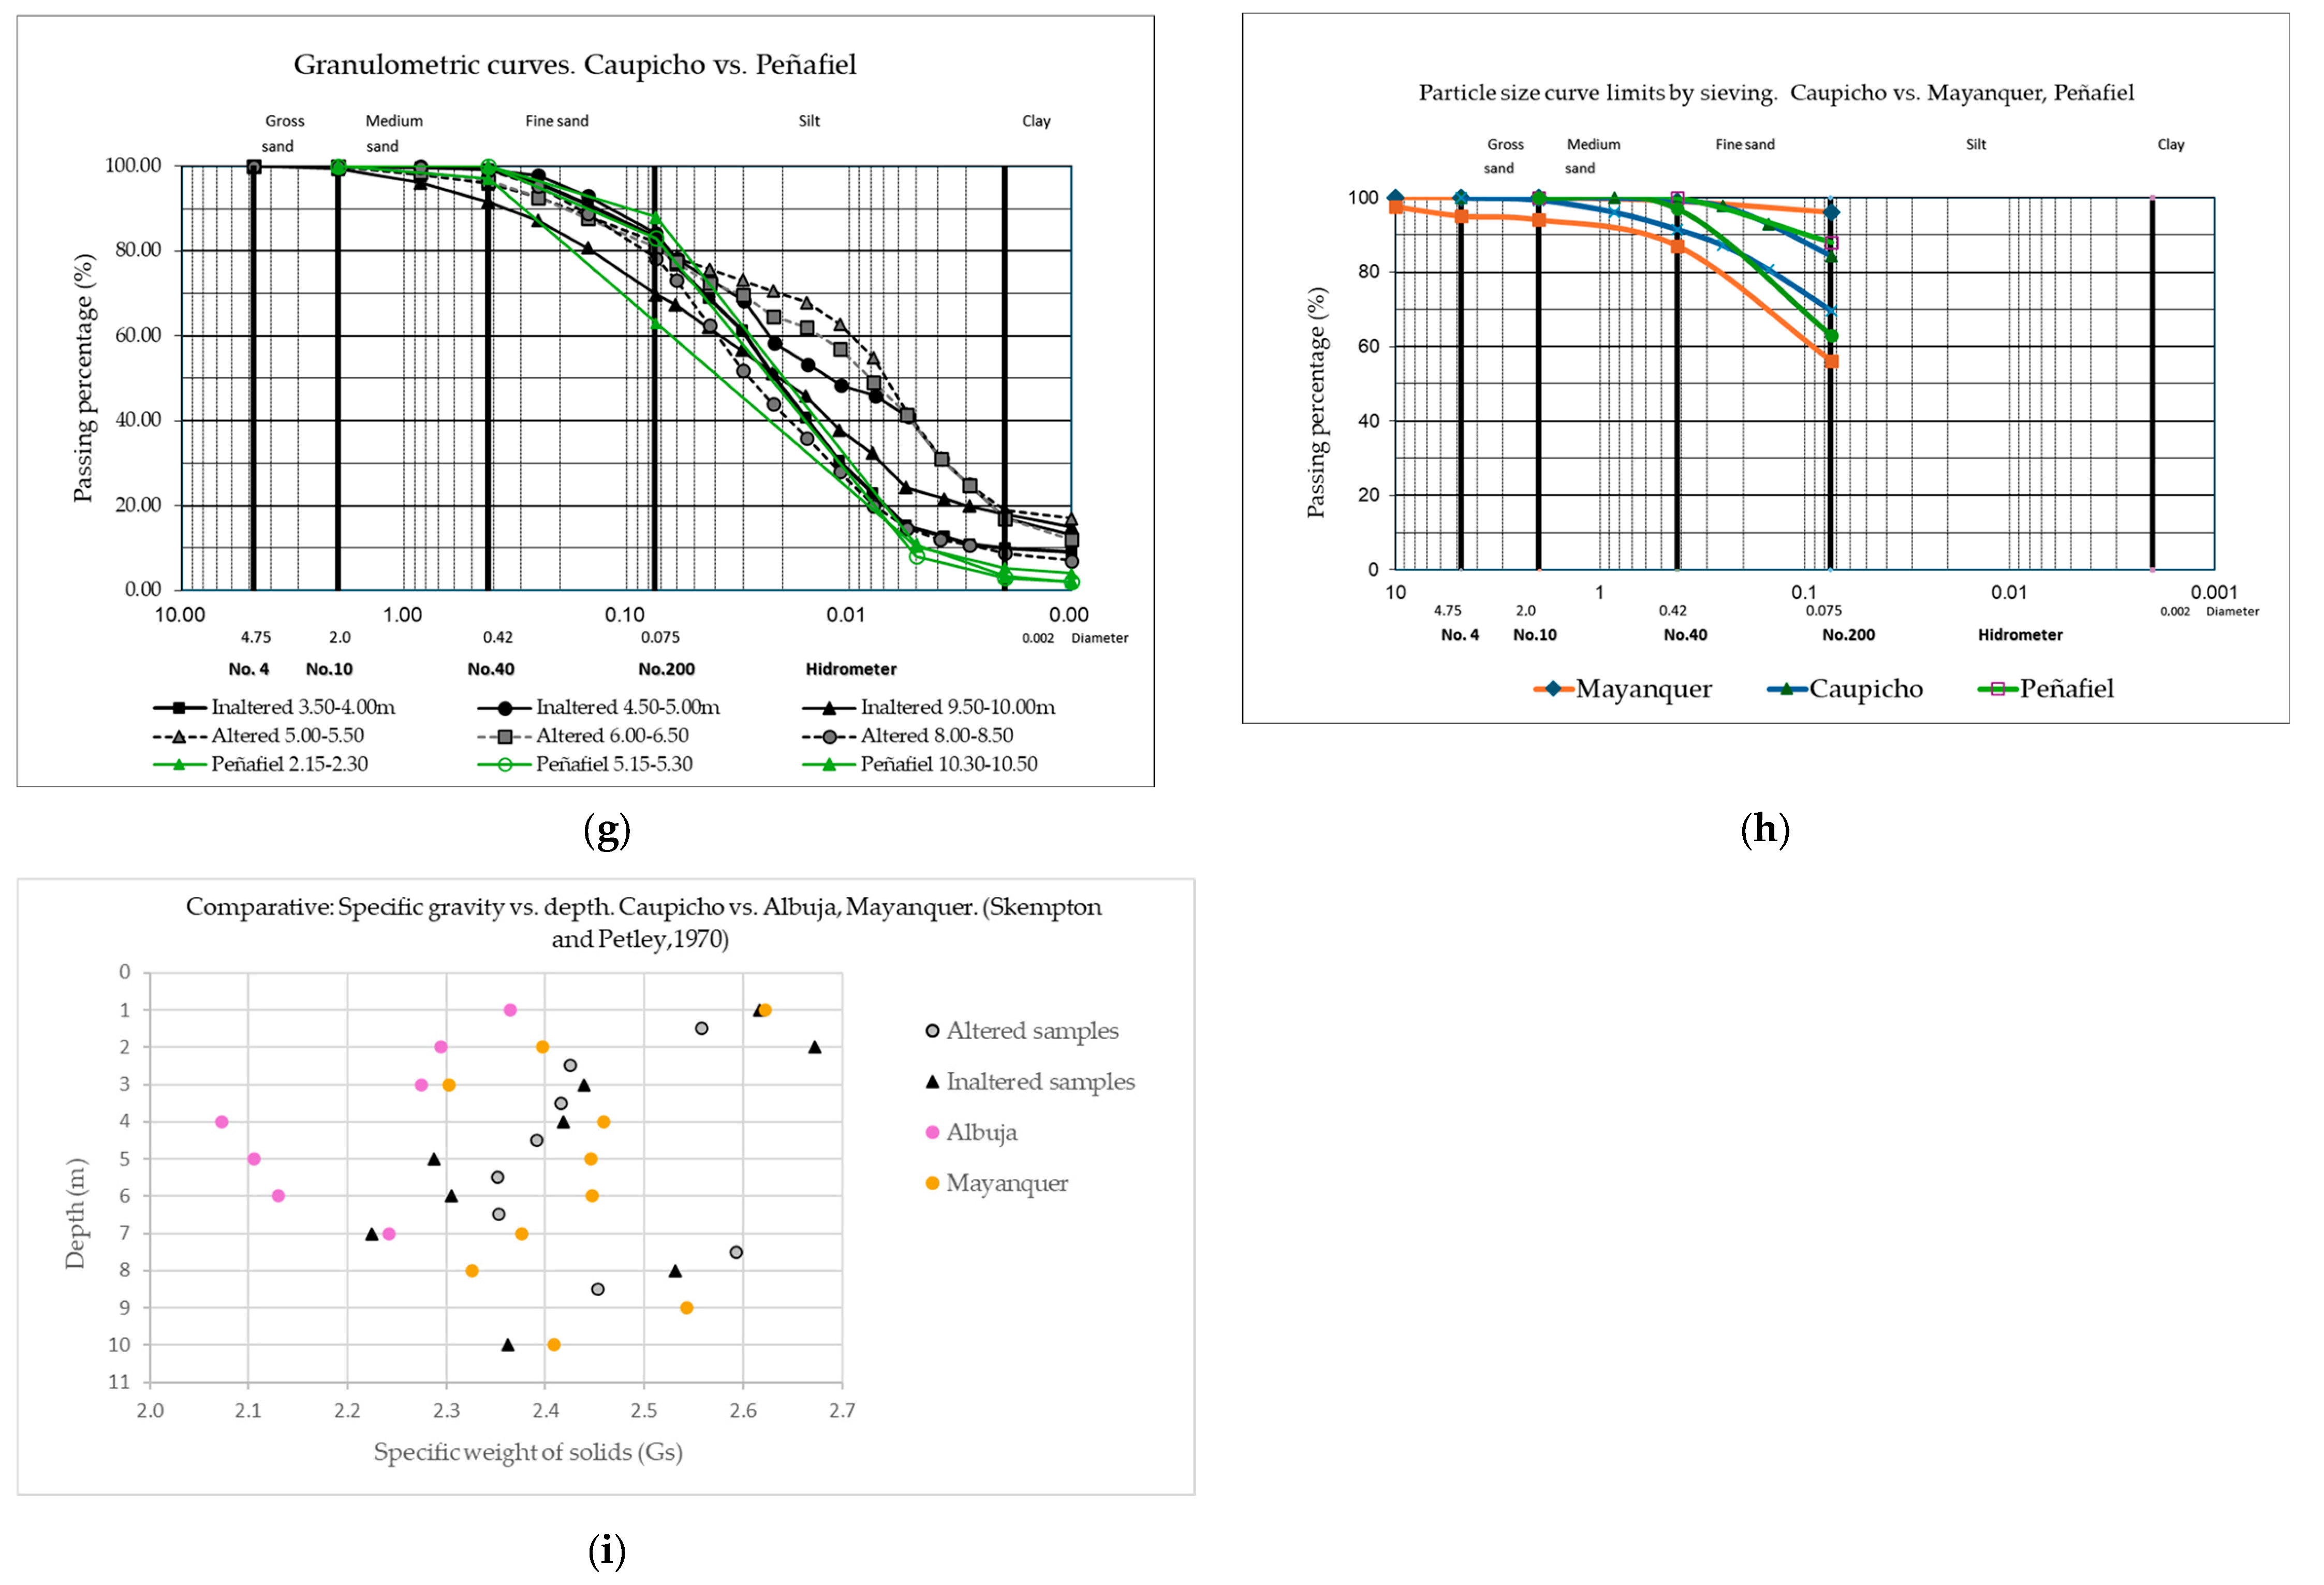
Figure 18.
Relations of Caupicho with other geotechnical studies carried out previously in Peñafiel, Albuja, and Mayanquer [
2,
3,
4,
5] (See
Figure 1), listed as: (
a) humidity–depth; (
b) liquid limit–depth; (
c) plastic limit–depth; (
d) comparative data set of liquid limit and plastic index; (
e) ash content–depth; (
f) organic content–depth; (
g) granulometry curve limits by sieve and hydrometer; (
h) granulometric curve limits by sieving; and (
i) specific weight of solids (Gs)–depth [
42].
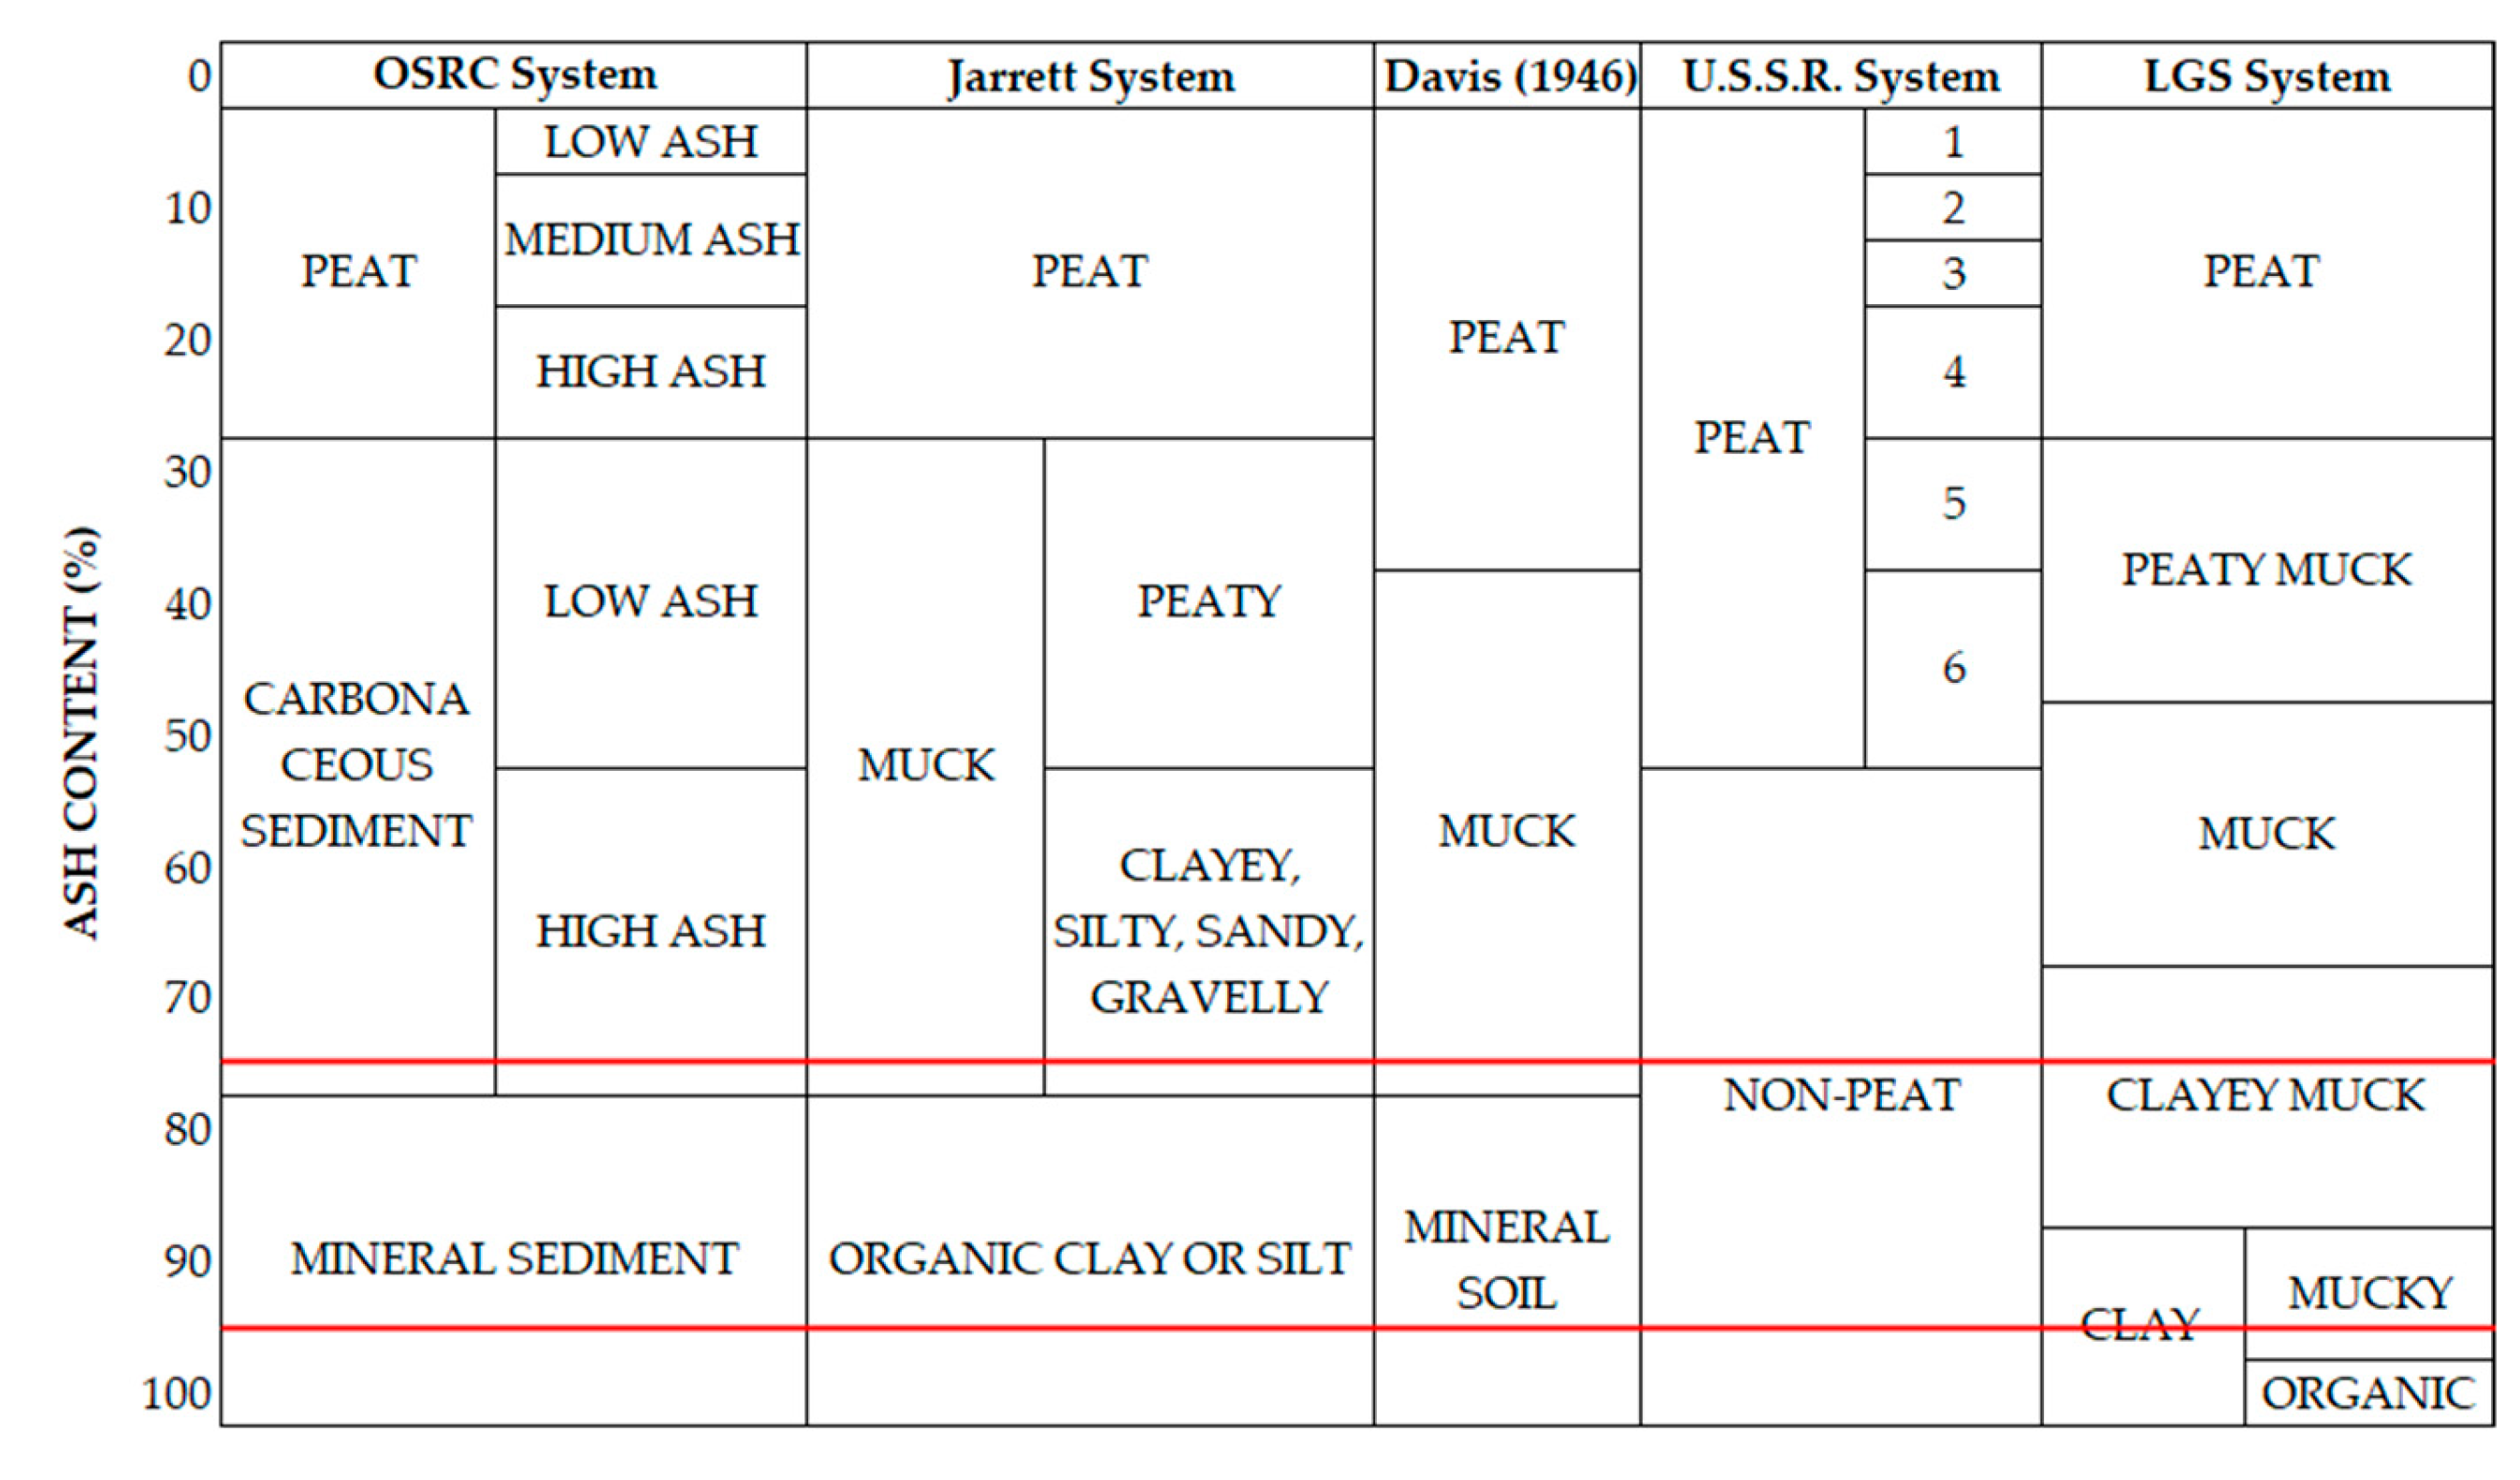
Figure 19.
Comparison of soil classifications from different sources based on ash content [
13,
14].
Figure 19.
Comparison of soil classifications from different sources based on ash content [
13,
14].
Figure 20.
Relation of Caupicho with Fiavé peat, oedometric test [
47].
Figure 20.
Relation of Caupicho with Fiavé peat, oedometric test [
47].
Table 1.
Climate variables. Santa Catalina Weather Station. Latitude: 0.36 S, longitude: 78.55 W, height: 3058 m [
17,
18].
Table 1.
Climate variables. Santa Catalina Weather Station. Latitude: 0.36 S, longitude: 78.55 W, height: 3058 m [
17,
18].
| Month | Min Temp | Max Temp | Humidity | Wind | Insolation | Rad | ETo |
|---|
| | °C | °C | % | km/day | hours | MJ/m2/day | mm/day |
|---|
| January | 5.90 | 18.10 | 79 | 181 | 4.00 | 15.20 | 2.84 |
| February | 6.20 | 17.60 | 79 | 190 | 3.50 | 14.80 | 2.78 |
| March | 6.40 | 17.60 | 80 | 181 | 3.30 | 14.60 | 2.74 |
| April | 6.40 | 17.60 | 81 | 181 | 2.80 | 13.50 | 2.56 |
| May | 6.30 | 17.90 | 87 | 181 | 4.20 | 14.80 | 2.55 |
| June | 5.30 | 17.70 | 81 | 216 | 4.50 | 14.50 | 2.64 |
| July | 4.90 | 18.20 | 70 | 268 | 4.70 | 15.10 | 3.09 |
| August | 4.60 | 18.60 | 69 | 259 | 4.80 | 16.00 | 3.30 |
| September | 4.80 | 18.60 | 72 | 242 | 4.40 | 16.10 | 3.22 |
| October | 5.30 | 18.20 | 78 | 181 | 3.60 | 14.90 | 2.86 |
| November | 5.60 | 18.00 | 79 | 173 | 3.90 | 14.90 | 2.79 |
| December | 5.80 | 18.10 | 78 | 181 | 4.10 | 15.10 | 2.83 |
| Average | 5.60 | 18.00 | 78 | 203 | 4.00 | 15.00 | 2.85 |
Table 2.
Monthly precipitation. Santa Catalina Weather Station. Latitude: 0.36 S, longitude: 78.55 W, height: 3058 m [
17,
18].
Table 2.
Monthly precipitation. Santa Catalina Weather Station. Latitude: 0.36 S, longitude: 78.55 W, height: 3058 m [
17,
18].
| Month | January | February | March | April | May | June | July | August | September | October | November | December | Total |
|---|
| Precipitation (mm) | 132 | 157 | 173 | 192 | 140 | 68 | 31 | 40 | 86 | 141 | 142 | 121 | 1423 |
Table 3.
Calculation of the surface runoff coefficient for Caupicho.
Table 3.
Calculation of the surface runoff coefficient for Caupicho.
| Soil Texture | Area (Ha) | % | Runoff Coefficient (Ce) | %/100 × Ce |
|---|
| | | | Minimum | Maximum | | |
|---|
| Urban areas | 4.98 | 1.00 | 0.30 | 0.50 | 0.00 | 0.00 |
| Clayey | 51.96 | 7.00 | 0.18 | 0.22 | 0.01 | 0.01 |
| Sandy loam (fine to coarse) | 386.15 | 50.00 | 0.10 | 0.15 | 0.05 | 0.08 |
| Silt loam | 326.34 | 42.00 | 0.10 | 0.15 | 0.04 | 0.06 |
| Total | 769.42 | 100.00 | | | 0.11 | 0.16 |
Table 4.
Calculation of the maximum flow for a 100-year return period in Caupicho.
Table 4.
Calculation of the maximum flow for a 100-year return period in Caupicho.
| Basin Area | Channel
Length (L) | River Slope (S) | Return Time | Runoff
Coefficient (Ce) | Concentration Time (tc) | Daily
Intensity (Idtr) | Maximum
Intensity of Rain (Itr) | Maximum Flow |
|---|
| Km2 | m | m/m | years | | min | mm/h | mm/h | cms |
|---|
| 5.13 | 4281.00 | 0.03 | 100.00 | 0.16 | 47.06 | 3.30 | 62.35 | 14.22 |
Table 5.
Calculation of maximum flow for different return periods.
Table 5.
Calculation of maximum flow for different return periods.
| Return Period | Daily Intensity (Idtr) | Maximum Intensity of Rain (Itr) | Maximum Flow |
|---|
| Year | mm/h | mm/h | cm |
|---|
| 2 | 1.80 | 34.00 | 7.75 |
| 5 | 2.00 | 37.79 | 8.62 |
| 10 | 2.30 | 43.46 | 9.91 |
| 25 | 2.60 | 49.12 | 11.20 |
| 50 | 3.00 | 56.68 | 12.92 |
| 100 | 3.30 | 62.35 | 14.22 |
Table 6.
SDMT Parameters.
Table 6.
SDMT Parameters.
| In Situ Test | Parameters | Reference |
|---|
| SDMT | Ƴ, ID, Ko, OCR, ɸ, Cu, Kh, Vs | [22,23] |
Table 7.
Laboratory tests.
Table 7.
Laboratory tests.
| Laboratory Test | Parameters | Reference |
|---|
| Thin-section mineralogy | Mineral content | [24] |
| Rx diffraction | Mineral content | [25] |
| Scanning electron microscope (SEM) | Chemical form | [26] |
| Moisture content | w (%) | [27] |
| Atterberg limits | Ll, Lp, Ip (%) | [28] |
| Material finer than 75 μm | Fines (%) | [29] |
| USCS classification | Soil classification | [30] |
| Ash and organic content | Ash content, organic material | [31] |
| Unit weight | Ƴ | [32] |
| Triaxial CU | c’, ɸ’ | [33] |
| Oedometric consolidation | Cc, Cs, Cv, Kv | [34] |
Table 8.
Soil type and material index (ID) for cohesive and granular soils.
Table 8.
Soil type and material index (ID) for cohesive and granular soils.
| | Soil Type | Material Index (ID) |
|---|
| Organic soils and cohesive soils | Peat/Sensitive clays | <0.10 |
| Clay | 0.10 | 0.35 |
| Silty clay | 0.35 | 0.60 |
| Clayey silt | 0.60 | 0.90 |
| Silt | 0.90 | 1.20 |
| Sandy silt | 1.20 | 1.80 |
| Non-cohesive soils | Silty sand | 1.80 | 3.30 |
| Sand | >3.30 |
Table 9.
Soil type in percentages for Caupicho.
Table 9.
Soil type in percentages for Caupicho.
| Soil | Caupicho1 | Caupicho2 | Caupicho3 |
|---|
| | % | % | % |
|---|
| MUD * | 52.63 | 68.42 | 0.00 |
| Clay | 0.00 | 1.75 | 0.00 |
| Silty clay | 10.53 | 12.28 | 35.71 |
| Clayey silt | 5.26 | 3.51 | 16.67 |
| Silt | 8.77 | 7.02 | 4.76 |
| Sandy silt | 7.02 | 3.51 | 14.29 |
| Silty sand | 8.77 | 0.00 | 14.29 |
| Sandy silt | 7.02 | 3.51 | 14.29 |
| Total | 100.00 | 100.00 | 100.00 |
Table 10.
Marchetti’s nomogram analysis. Muck/peat determination.
Table 10.
Marchetti’s nomogram analysis. Muck/peat determination.
| Muck/Peat | Caupicho1 | Caupicho2 | Caupicho3 |
|---|
| % | % | % |
|---|
| Yes | 56.6 | 69.6 | 0.0 |
| No | 43.4 | 30.4 | 100.0 |
| Total | 100.0 | 100.0 | 100.0 |
Table 11.
Marchetti’s analysis. Calculation of horizontal permeability at depth Z.
Table 11.
Marchetti’s analysis. Calculation of horizontal permeability at depth Z.
| Z (m) | KD | Ko | MDMT | Ch (cm2/min) | Kh (m/seg) |
|---|
| 5.20 | 1.82 | 0.50 | 1.16 | 3.87 | 1.10 × 10⁻⁷ |
| 5.40 | 1.87 | 0.51 | 0.51 | 3.87 | 2.42 × 10⁻⁷ |
Table 12.
Petrographic mineralogical analysis of the Caupicho soil [
24].
Table 12.
Petrographic mineralogical analysis of the Caupicho soil [
24].
| Petrographic Analysis (2.5–3 m) | % |
|---|
| Coalescence of cavities with clay mixture (CC) | 2.00 |
| Soil matrix (Matriz) | 47.80 |
| Pyroxenes (Px) | 0.30 |
| Plagioclases (Pl) | 5.00 |
| Organic material (RO) | 23.40 |
| Porosity | 21.50 |
| | 100.00 |
Table 13.
Mineralogical analysis X-ray diffraction in Caupicho soil.
Table 13.
Mineralogical analysis X-ray diffraction in Caupicho soil.
| Mineral | Formula | Mineral Concentration (%) |
|---|
| Plagioclase | (Na,Ca) Al (Si,Al)Si2O8 | 78 |
| Muscovite | KAl2(AlSi3O10) (OH)2 | 17 |
| Quartz | SiO2 | 3 |
| Cordierite | Mg2Al4Si5O18 | 2 |
| | | 100 |
Table 14.
Analysis of chemical elements in Caupicho soil (2.50–10.00m) using SEM [
26].
Table 14.
Analysis of chemical elements in Caupicho soil (2.50–10.00m) using SEM [
26].
| Element | O | C | B | Si | N | Fe | Al | Na | Br | Ca | Ti | K | Mg | Total |
|---|
| Weight concentration (%) | 41.02 | 33.46 | 11.59 | 5.25 | 3.03 | 2.84 | 1.01 | 0.55 | 0.53 | 0.39 | 0.16 | 0.10 | 0.07 | 100.00 |
Table 15.
Analysis of the chemical elements in Caupicho at 4.50–5.00 m. Mineral A.
Table 15.
Analysis of the chemical elements in Caupicho at 4.50–5.00 m. Mineral A.
Element
Number | Element
Symbol | Element Name | Atomic
Concentration (%) | Weight
Concentration (%) |
|---|
| 8 | O | Oxygen | 67.26 | 58.15 |
| 14 | Si | Silicon | 13.64 | 20.7 |
| 7 | N | Nitrogen | 10.92 | 8.27 |
| 13 | Al | Aluminum | 4.74 | 6.9 |
| 19 | K | Potassium | 1.96 | 4.15 |
| 11 | Na | Sodium | 1.48 | 1.83 |
Table 16.
Analysis of chemical elements in Caupicho at 4.50–5.00 m. Mineral B.
Table 16.
Analysis of chemical elements in Caupicho at 4.50–5.00 m. Mineral B.
| Element Number | Element Symbol | Element Name | Atomic Concentration (%) | Weight Concentration (%) |
|---|
| 6 | C | Carbon | 41.1 | 19.02 |
| 8 | O | Oxygen | 26.15 | 16.12 |
| 26 | Fe | Iron | 19.57 | 42.1 |
| 22 | Ti | Titanium | 11.15 | 20.56 |
| 14 | Si | Silicon | 2.03 | 2.2 |
Table 17.
Analysis of chemical elements from Caupicho at 9.50–10.00 m.
Table 17.
Analysis of chemical elements from Caupicho at 9.50–10.00 m.
| Element Number | Element Symbol | Element Name | Atomic Concentration (%) | Weight Concentration (%) |
|---|
| 8 | O | Oxygen | 56.62 | 46.87 |
| 6 | C | Carbon | 23.59 | 14.66 |
| 14 | Si | Silicon | 12.45 | 18.1 |
| 35 | Br | Bromine | 3.16 | 13.07 |
| 11 | Na | Sodium | 1.79 | 2.13 |
| 26 | Fe | Iron | 0.86 | 2.47 |
| 20 | Ca | Calcium | 0.64 | 1.34 |
| 12 | Mg | Magnesium | 0.53 | 0.67 |
Table 19.
Initial data of the oedometric test for samples 1, 2, 3, and 4.
Table 19.
Initial data of the oedometric test for samples 1, 2, 3, and 4.
| Sample | Depth | Particle Specific Gravity | Initial Moisture Content | Initial Bulk Density | Initial Dry Density | Initial Void Index (eo) | Initial Degree of Saturation | Porosity (n) |
|---|
| | m | | % | Mg/m3 | Mg/m3 | | % | % |
|---|
| 1 | 6.5–7.0 | 2.24 | 288.46 | 1.07 | 0.28 | 6.92 | 90.85 | 87.50 |
| 2 | 2.5–3.0 | 2.27 | 257.16 | 1.14 | 0.32 | 6.14 | 95.14 | 85.90 |
| 3 | 5.5–6.0 | 2.18 | 366.79 | 1.04 | 0.22 | 8.79 | 91.01 | 89.91 |
| 4 | 8.5–9.0 | 2.24 | 256.54 | 1.15 | 0.32 | 5.93 | 96.86 | 85.71 |
Table 20.
Oedometric test calculations for samples 1, 2, 3 and 4.
Table 20.
Oedometric test calculations for samples 1, 2, 3 and 4.
| Sample | Depth | Final Void Ratio (ef) | Final Degree of Saturation | Preconsolidation Pressure (σ’c) | σ’o | OCR (σ’c/σ’o) | Bulging Index | Compression Index |
|---|
| | m | | % | Kpa | Kpa | | Cs | Cc |
|---|
| 1 | 6.5–7.0 | 4.32 | 99.75 | 25.00 | 19.09 | 1.31 | 0.23 | 3.71 |
| 2 | 2.5–3.0 | 1.44 | 99.72 | 20.00 | 18.84 | 1.06 | 0.18 | 2.65 |
| 3 | 5.5–6.0 | 2.42 | 99.10 | 22.40 | 20.84 | 1.07 | 0.35 | 2.57 |
| 4 | 8.5–9.0 | 1.31 | 99.77 | | 28.68 | | 0.15 | 2.21 |
Table 21.
Coefficient of consolidation Cv at depth of 6.5–7 m from the oedometric test.
Table 21.
Coefficient of consolidation Cv at depth of 6.5–7 m from the oedometric test.
| Pressure (Loading) | Coefficient of Consolidation (Cv) |
|---|
| Kpa | mm2/min |
|---|
| | Depth: 6.5–7.0 m |
| 12.50 | 13.59 |
| 25.00 | 6.12 |
| 50.00 | 9.43 |
| 100.00 | 6.79 |
Table 22.
Coefficient of consolidation Cv at different depths of the oedometric test.
Table 22.
Coefficient of consolidation Cv at different depths of the oedometric test.
| Pressure (Loading) | Coefficient of Consolidation (Cv) |
|---|
| Kpa | mm2/min |
|---|
| | Depth: 2.5–3.0 m | Depth: 5.5–6.0 m | Depth: 8.5–9.0 m |
| 25.00 | 69.18 | 65.90 | 23.69 |
| 50.00 | 24.37 | 3.16 | 16.80 |
| 100.00 | 24.65 | 1.99 | 5.90 |
| 200.00 | 21.97 | 2.59 | 3.63 |
| 400.00 | 1.84 | 0.95 | 2.70 |
| 800.00 | 1.88 | 1.11 | 1.47 |
Table 23.
Vertical oedometric permeability analysis.
Table 23.
Vertical oedometric permeability analysis.
| Sample | Depth | σ’ | Kv = Cv.Ƴw.mv | σ’ | Kv = Cv.Ƴw.mv | Kv Mean |
|---|
| | m | Kpa | m/s | Kpa | m/s | m/s |
|---|
| 1 | 6.5–7.0 | 0–12 | 1.68 × 10⁻⁸ | 12–25 | 6.36 × 10⁻⁹ | 1.16 × 10⁻⁸ |
| 2 | 2.5–3.0 | 0–25 | 5.53 × 10⁻⁸ | 25–50 | 5.54 × 10⁻⁹ | 3.04 × 10⁻⁸ |
| 3 | 5.5–6.0 | 0–25 | 1.10 × 10⁻⁷ | 25–50 | 2.55 × 10⁻⁹ | 5.64 × 10⁻⁸ |
| 4 | 8.5–9.0 | 0–25 | 3.98 × 10⁻⁸ | 25–50 | 1.67 × 10⁻⁸ | 2.82 × 10⁻⁸ |
| Kv average | | | 5.55 × 10⁻⁸ | | 7.78 × 10⁻⁹ | 3.16 × 10⁻⁸ |
Table 24.
CD Triaxial–Caupicho1.
Table 24.
CD Triaxial–Caupicho1.
| Depth (m) | Axial Strain (%) | ɸ’ (◦) | c’ (KPa) |
|---|
| 2.5–4.0 | 14.75 | 30.00 | 16.67 |
| 4.0–5.0 | 14.74 | 25.49 | 20.90 |
| 5.0–6.0 | 13.40 | 30.05 | 47.27 |
| 6.5–8.0 | 14.78 | 28.74 | 11.90 |
| Average | 14.42 | 28.57 | 24.19 |
Table 25.
Marchetti classification—type of soil per drilling: Caupicho, Mayanquer, Albuja, and Seismic Quito.
Table 25.
Marchetti classification—type of soil per drilling: Caupicho, Mayanquer, Albuja, and Seismic Quito.
| | Caupicho1 | Mayanquer | Albuja | Seismic Quito [6] |
|---|
| Soil | 1 | 2 | 3 | S1 | S2 | S3 | S4 | | P4-SQ | P5-SQ |
|---|
| Peat | 0.00 | 0.00 | 0.00 | 0.00 | 0.00 | 0.00 | 0.00 | 0.00 | 34.48 | 0.00 |
| Clay | 67.92 | 82.14 | 39.47 | 76.09 | 61.22 | 9.62 | 23.91 | 62.50 | 44.83 | 19.05 |
| Silt | 22.64 | 16.07 | 39.47 | 19.57 | 28.57 | 84.62 | 69.57 | 23.44 | 13.79 | 57.14 |
| Sand | 9.43 | 1.79 | 21.05 | 4.35 | 10.20 | 5.77 | 6.52 | 14.06 | 6.90 | 23.81 |
| Total (%) | 100.00 | 100.00 | 100.00 | 100.00 | 100.00 | 100.00 | 100.00 | 100.00 | 100.00 | 100.00 |
Table 26.
Marchetti classification—comparison of soil types between Caupicho and Mayanquer.
Table 26.
Marchetti classification—comparison of soil types between Caupicho and Mayanquer.
| Soil | Caupicho | Mayanquer |
|---|
| MUD | 40.35 | 21.08 |
| Clay | 20.09 | 22.17 |
| Silt | 23.60 | 45.59 |
| Sand | 15.96 | 11.15 |
| Total (%) | 100.00 | 100.00 |
Table 27.
Topographic difference per study in meters above sea level.
Table 27.
Topographic difference per study in meters above sea level.
| Topographic Heigh |
|---|
| Study | Height z (m) | ∆z |
|---|
| Mayanquer | 2994.46 | 22.92 |
| Albuja | 2993.73 | 22.19 |
| Caupicho1 | 2986.39 | 14.85 |
| Caupicho2 | 2976.18 | 4.64 |
| Caupicho3 | 2971.54 | 0.00 |
Table 28.
Seismic wave velocity profiles Vs and Vs30 for geophysical surveys T42T44–T46 [
44].
Table 28.
Seismic wave velocity profiles Vs and Vs30 for geophysical surveys T42T44–T46 [
44].
| Shots | Layers | Depth (m) | dᵢ (m) | Vs (m/s) | Vs30 (m/s) | Depth (m) | dᵢ (m) | Vs (m/s) | Vs30 (m/s) | Depth (m) | dᵢ (m) | Vs (m/s) | Vs30 (m/s) |
|---|
| Profile | 1 | 9.2 | 9.2 | 104.0 | 172.9 | 5.5 | 5.5 | 110.2 | 208.1 | 2.2 | 2.2 | 131.6 | 148.1 |
| 2 | 15.6 | 6.4 | 250.0 | 15.2 | 9.7 | 236.7 | 19.5 | 7.3 | 157.4 |
| 3 | 17.7 | 2.2 | 105.8 | 17.6 | 2.4 | 177.0 | 26.2 | 6.7 | 104.9 |
| 4 | 30.0 | 12.3 | 314.2 | 30.0 | 12.4 | 312.4 | 30.0 | 3.8 | 315.0 |
| 2-3 | 1 | 9.1 | 9.1 | 103.1 | 151.2 | 2.8 | 2.8 | 142.3 | 165.4 | 5.3 | 5.3 | 101.3 | 141.8 |
| 2 | 20.9 | 11.7 | 193.0 | 18.9 | 9.7 | 151.2 | 14.0 | 8.7 | 200.2 |
| 3 | 24.7 | 3.9 | 120.0 | 18.9 | 6.4 | 103.1 | 27.2 | 13.3 | 123.6 |
| 4 | 30.0 | 5.3 | 312.4 | 30.0 | 11.1 | 311.5 | 30.0 | 2.8 | 312.4 |
| 4-5 | 1 | 9.4 | 9.4 | 102.2 | 157.2 | 12.0 | 12.0 | 128.0 | 167.4 | 7.5 | 7.5 | 147.0 | 194.3 |
| 2 | 19.0 | 9.6 | 201.9 | 14.2 | 13.0 | 157.4 | 11.0 | 3.5 | 206.4 |
| 3 | 23.0 | 4.1 | 137.8 | 20.8 | 6.6 | 114.7 | 16.7 | 5.7 | 191.2 |
| 4 | 30.0 | 7.0 | 315.0 | 30.0 | 9.2 | 312.4 | 30.0 | 13.3 | 315.0 |
| 6-7 | 1 | 8.7 | 8.7 | 101.3 | 157.0 | 11.0 | 11.0 | 102.2 | 151.9 | 11.1 | 11.1 | 128.0 | 189.5 |
| 2 | 11.5 | 2.8 | 196.6 | 15.0 | 4.0 | 229.5 | 12.5 | 1.4 | 185.0 |
| 3 | 17.8 | 6.3 | 123.6 | 19.0 | 4.0 | 105.8 | 15.0 | 2.5 | 157.4 |
| 4 | 30.0 | 12.2 | 305.2 | 30.0 | 11.1 | 315.0 | 30.0 | 15.0 | 312.4 |
| Center | 1 | 11.6 | 11.6 | 104.9 | 146.6 | 7.1 | 7.1 | 101.3 | 176.9 | 5.0 | 5.0 | 118.2 | 149.0 |
| 2 | 16.0 | 4.4 | 226.0 | 14.4 | 7.3 | 222.4 | 13.3 | 8.3 | 166.3 |
| 3 | 20.9 | 4.9 | 108.6 | 18.7 | 3.4 | 127.2 | 21.5 | 3.1 | 128.0 |
| 4 | 30.0 | 9.2 | 315.0 | 30.0 | 12.2 | 313.3 | 30.0 | 8.5 | 305.2 |
| 10-11 | 1 | 4.6 | 4.6 | 105.8 | 190.0 | 9.7 | 9.7 | 101.3 | 171.3 | 3.7 | 3.7 | 109.3 | 148.5 |
| 2 | 7.2 | 2.6 | 202.8 | 14.6 | 4.9 | 193.3 | 14.0 | 3.7 | 130.3 |
| 3 | 17.7 | 10.6 | 168.1 | 18.0 | 3.4 | 152.3 | 21.2 | 8.8 | 103.1 |
| 4 | 30.0 | 12.3 | 315.0 | 30.0 | 11.1 | 312.4 | 30.0 | 8.2 | 312.4 |
| 12-13 | 1 | 6.8 | 6.8 | 103.1 | 193.1 | 4.6 | 4.6 | 108.4 | 180.6 | 3.7 | 3.7 | 103.1 | 150.6 |
| 2 | 14.3 | 7.5 | 249.1 | 6.9 | 2.5 | 209.1 | 12.7 | 8.1 | 163.6 |
| 3 | 16.4 | 2.1 | 130.7 | 12.5 | 5.9 | 103.1 | 21.5 | 8.8 | 136.6 |
| 4 | 30.0 | 13.6 | 314.2 | 30.0 | 11.1 | 312.4 | 30.0 | 8.6 | 308.8 |
| 14-15 | 1 | 9.0 | 9.0 | 102.2 | 175.3 | 1.1 | 1.1 | 108.4 | 178.9 | 8.4 | 8.4 | 144.9 | 176.0 |
| 2 | 15.0 | 6.0 | 246.5 | 11.3 | 9.2 | 103.1 | 12.7 | 10.4 | 192.1 |
| 3 | 17.6 | 2.6 | 104.9 | 14.3 | 5.1 | 180.7 | 21.4 | 8.7 | 157.4 |
| 4 | 30.0 | 13.0 | 314.2 | 30.0 | 18.7 | 315.0 | 30.0 | 2.4 | 115.5 |
| Back Profile | 1 | 10.8 | 10.8 | 102.2 | 166.4 | 9.1 | 9.1 | 100.4 | 162.4 | 2.4 | 2.4 | 115.5 | 182.7 |
| 2 | 12.1 | 1.3 | 155.6 | 15.8 | 6.6 | 250.0 | 6.3 | 5.9 | 157.4 |
| 3 | 15.3 | 3.3 | 182.2 | 19.0 | 3.3 | 101.3 | 16.9 | 6.6 | 136.0 |
| 4 | 30.0 | 14.7 | 301.7 | 30.0 | 11.0 | 314.2 | 30.0 | 13.1 | 306.1 |
| Average Vs30 (m/s) | | | 167.7 | | | | 173.7 | | | | 164.5 |
Table 29.
Comparison of Vs between Caupicho and T42–T44–T46.
Table 29.
Comparison of Vs between Caupicho and T42–T44–T46.
| | Caupicho1 | T42-T44-T46 |
|---|
| Depth Z (m) | Vs (m/s) |
|---|
| 1.50–6.50 | 74.30 | 107.00 (60%) 120.00 (40%) |
| 6.50–8.50 | 330.25 |
| 8.50–9.60 | 82.00 |
| 9.60–10.50 | 353.50 | 239.00 (max) |
Table 30.
Comparison of mineral characteristics of andesite and dacite with Caupicho.
Table 30.
Comparison of mineral characteristics of andesite and dacite with Caupicho.
| Characteristic Minerals | Degree of Weathering [45] | Minerals Found |
|---|
| | Andesite | Dacite | Petrographic Analysis | X-Ray Diffraction |
|---|
| | | | 2.5–3.0 m | 8.5–9.0 m |
|---|
| Quartz | X | X | 1 | | X |
| Muscovite | X | X | 2 | | X |
| Orthoclase | | X | 3 | | |
| Biotite | X | X | 4 | | |
| Plagioclase | X | X | 5 | X | X |
| Amphibole | X | X | 6 | | |
| Pyroxene | X | | 7 | X | |
Table 31.
Coefficient of consolidation as a function of pressure and depth.
Table 31.
Coefficient of consolidation as a function of pressure and depth.
| Depth | Pressure (Loading) | Coefficient of Consolidation (Cv) |
|---|
| m | KPa | mm2/min |
|---|
| 2.5–3.0 | 50–800 | 14.94 |
| 5.5–6.0 | 50–800 | 1.96 |
| 8.5–9.0 | 50–800 | 7.45 |
Table 32.
Comparison of three different peaty soils (undisturbed or remodeled) with Caupicho in a one-dimensional consolidation test [
47].
Table 32.
Comparison of three different peaty soils (undisturbed or remodeled) with Caupicho in a one-dimensional consolidation test [
47].
| Sample | Levitico Peat | Fiavé Peat | Egna Peat | Caupicho |
|---|
| Mean specific gravity, Gs | 2.3 | 1.8 | 1.6 | 2.2–2.3 |
| Organic Specific weight Gsm | 2.7 | 2.7 | 2.6 | |
| Inorganic specific weight Gso | 1.3 | 1.4 | 1.4 | |
| Organic matter: % | 19.9 | 49.3 | 71.0 | 5.0–26.0 |
| Liquid limit, Wl: % | 114.0 | 305.0 | 346.0 | 210.9 |
| Plastic limit, Wp: % | 76.0 | 183.0 | 226–272 | 142.1 |
| Plastic index, Ip: % | 38.0 | 126.0 | 121–74 | 68.8 |
| Natural water content, w: % | 150–180 | 209.0 | 280.0 | 245.9 |
| Compression index, Cc Rem. | 1.05–1.39 | 1.67 | | |
| Compression index, Cc Nat. | 0.82 | 1.72 | 1.87 | 2.21–3.71 |
| Swelling index, Cs Nat. | 0.11–0.13 | 0.21 | | 0.15–0.35 |
| Swelling index, Cs Rem. | 0.11 | 0.29 | 0.28 | |
Table 33.
Representative values for angle of internal friction ɸ’ vs. Caupicho.
Table 33.
Representative values for angle of internal friction ɸ’ vs. Caupicho.
| | Type of Test | |
|---|
| | Unconsolidated Undrained | Consolidated Undrained | Consolidated Drained | Reference |
|---|
| Soil | UU | CU | CD | |
|---|
| Silt or silty sand | | | |
| Loose | 20–22 | | 27–30 | [43] |
| Dense | 25–30 | | 30–35 | “ |
| Clay | 0° if saturated | 3–20° | 20–42 | “ |
| Silty clay | 17–22 | | | [44] |
| Muddy | 20.8 | | | “ |
| Peat | | | 27.8–31.7 * | [45] |
| Organic silt–Caupicho | | | 25.5–30 ** | Current research |


