

Towards Sustainable Magnetic Resonance Neuro Imaging: Pathways for Energy Optimization and Cost Reduction Strategies

 , , , ,
  and
and 
Abstract
:Featured Application
Abstract
1. Introduction
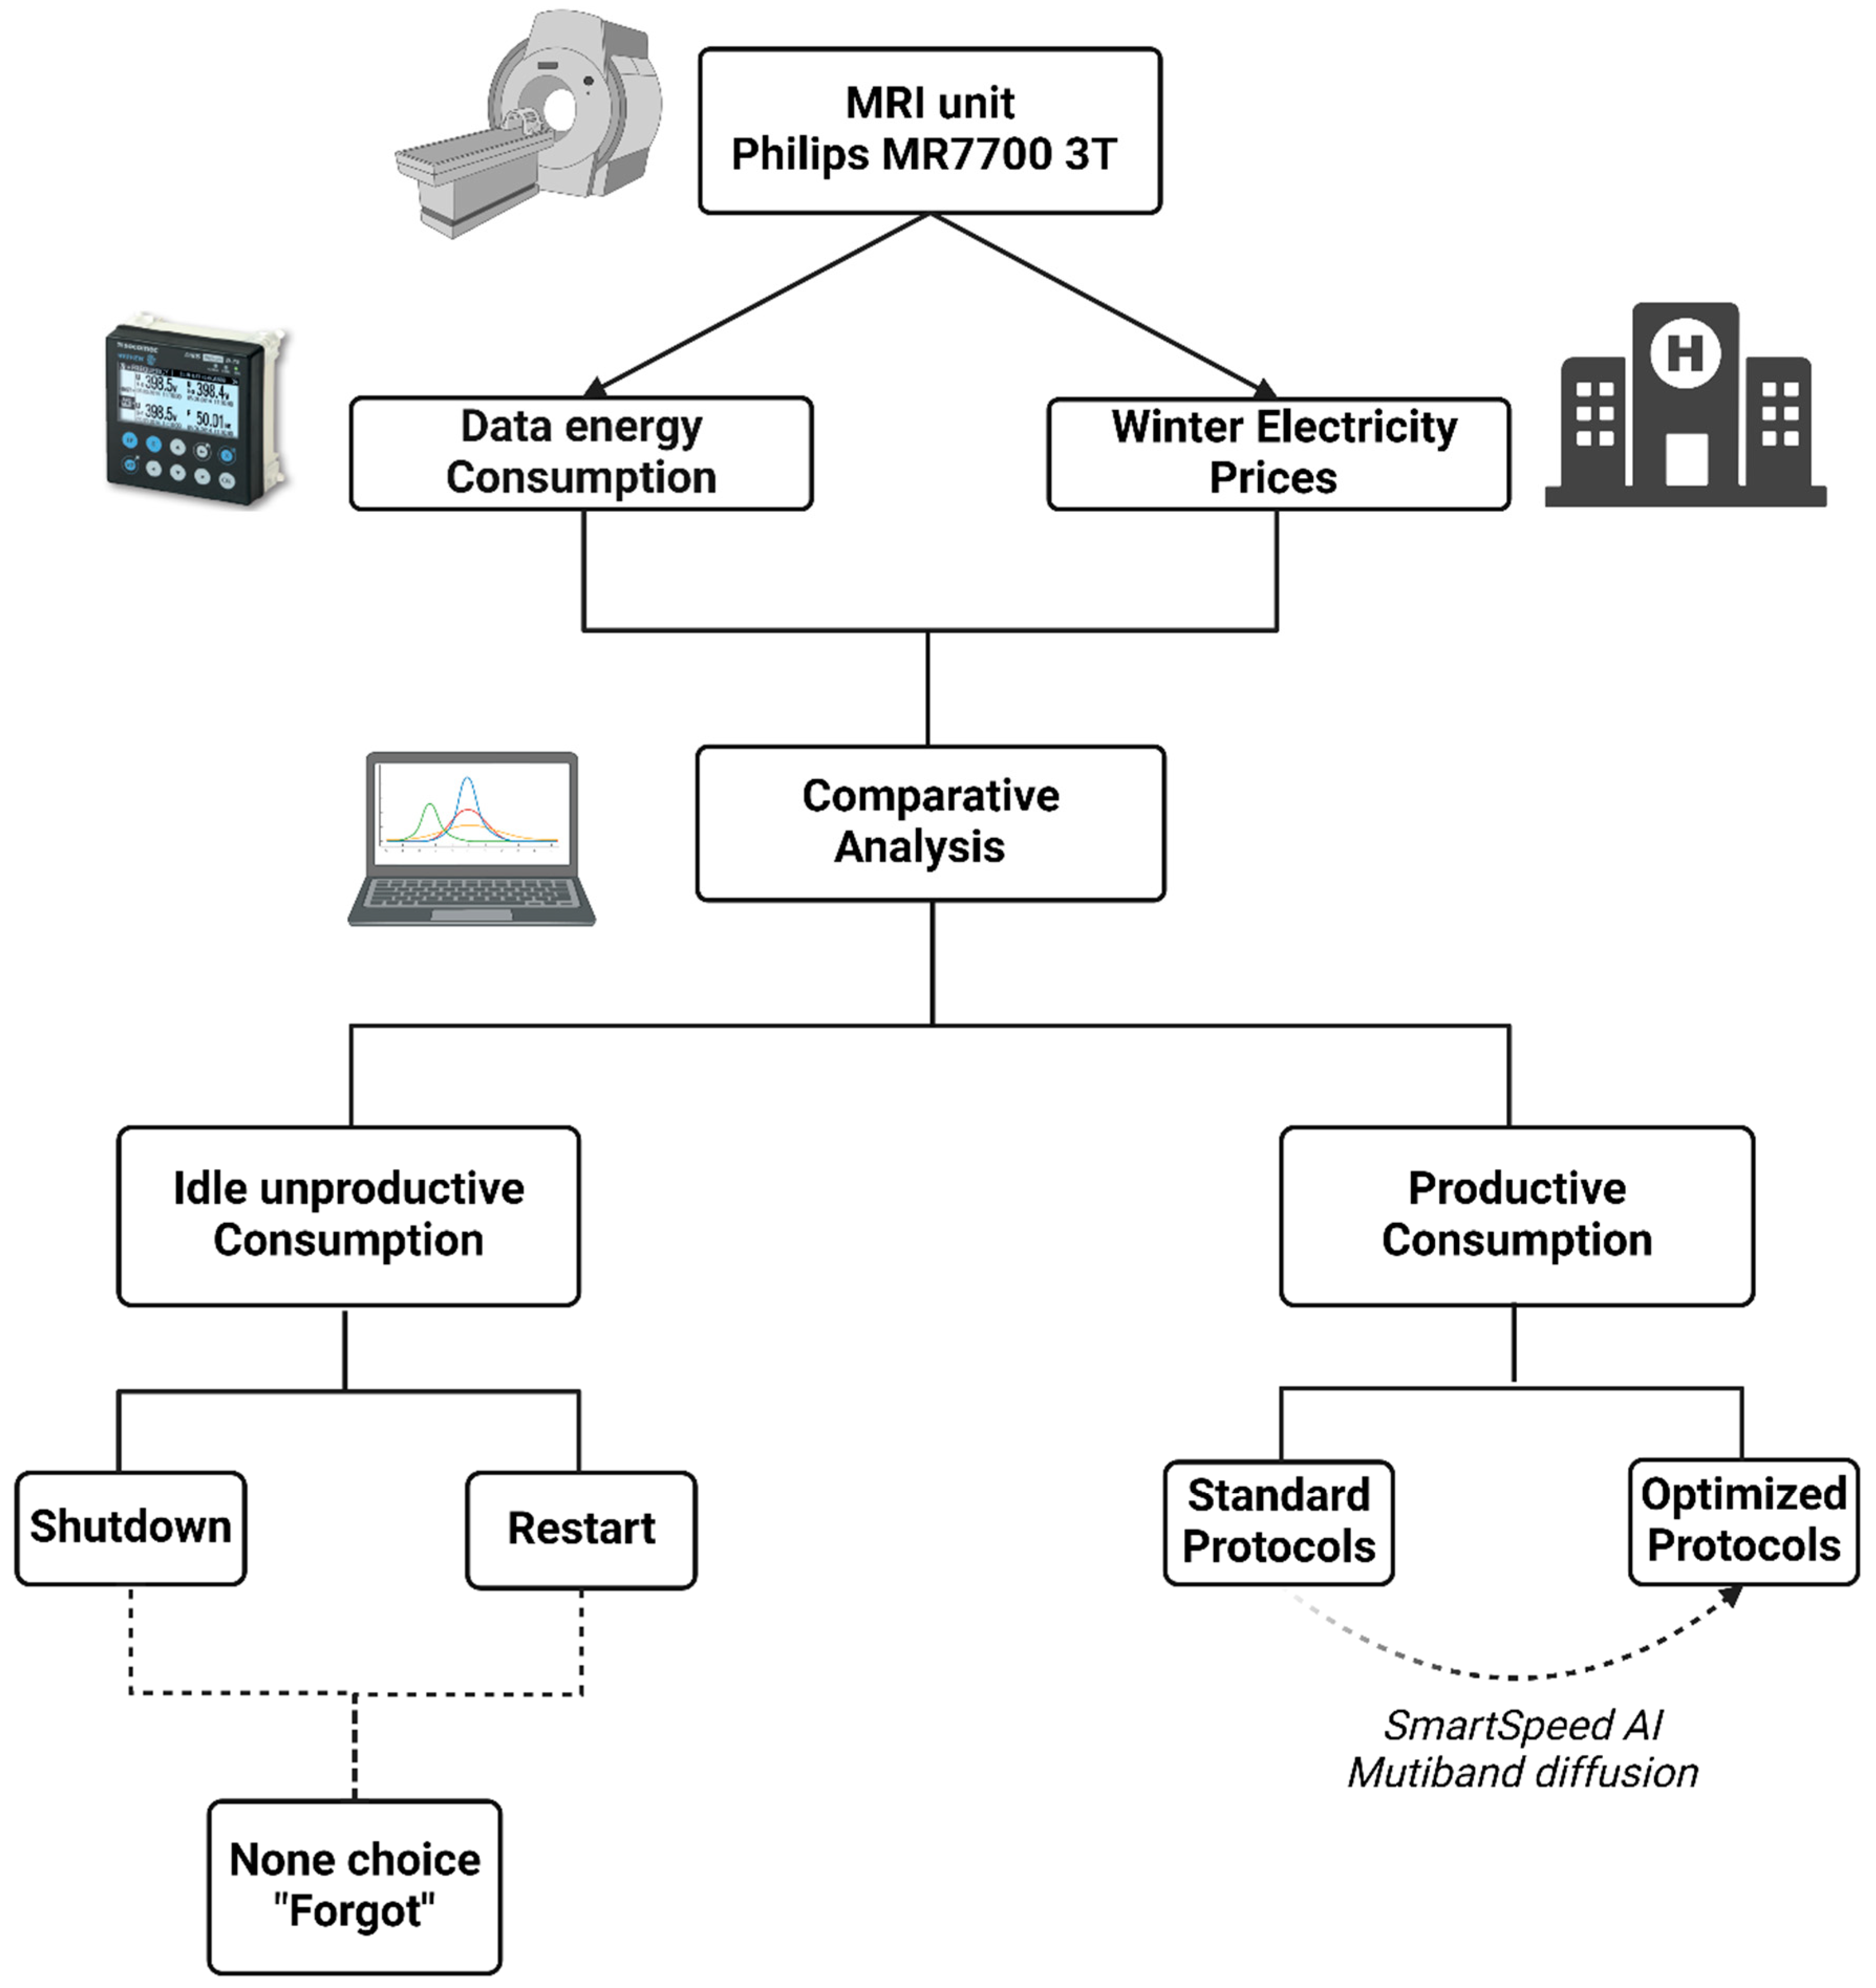
2. Materials and Methods
2.1. MRI Machine
2.2. Standard and Optimized Protocols
2.3. Phantoms
2.4. Power Measurements
2.5. Cost Data
2.6. Consumption Calculations and Statistical Analysis
3. Results
4. Discussion
5. Conclusions
Supplementary Materials
Author Contributions
Funding
Institutional Review Board Statement
Informed Consent Statement
Data Availability Statement
Acknowledgments
Conflicts of Interest
References
- HealthCare’s Climate Footprint Report. Health Care Without Harm Web Site. Available online: https://noharm-global.org/sites/default/files/documents-files/5961/HealthCaresClimateFootprint_092319.pdf (accessed on 3 June 2024).
- Roletto, A.; Zanardo, M.; Bonfitto, G.R.; Catania, D.; Sardanelli, F.; Zanoni, S. The environmental impact of energy consumption and carbon emissions in radiology departments: A systematic review. Eur. Radiol. Exp. 2024, 8, 35. [Google Scholar] [CrossRef]
- Woolen, S.A.; Becker, A.E.; Martin, A.J.; Knoerl, R.; Lam, V.; Folsom, J.; Eusemann, C.; Hess, C.P.; Deshpande, V. Ecodesign and Operational Strategies to Reduce the Carbon Footprint of MRI for Energy Cost Savings. Radiology 2023, 307, e230441. [Google Scholar] [CrossRef] [PubMed]
- Ognard, J.; Barrat, J.-A.; Cotton, F.; Mian, A.; Kremer, S.; Sitoh, Y.Y.; Verclytte, S.; Loffroy, R.; Tripier, R.; Alavi, Z.; et al. A roadmap towards pollution prevention and sustainable development of Gadolinium. J. Neuroradiol. 2021, 48, 409–411. [Google Scholar] [CrossRef]
- Rovira, À.; Ben Salem, D.; Geraldo, A.F.; Cappelle, S.; del Poggio, A.; Cocozza, S.; Saatci, I.; Zlatareva, D.; Lojo, S.; Quattrocchi, C.C.; et al. Go Green in Neuroradiology: Towards reducing the environmental impact of its practice. Neuroradiology 2024, 66, 463–476. [Google Scholar] [CrossRef] [PubMed]
- Hough, E.; Tanugi-Carresse, A.C. Supporting Decarbonization of Health Systems-A Review of International Policy and Practice on Health Care and Climate Change. Curr. Environ. Health Rep. 2024, 11, 266–278. [Google Scholar] [CrossRef]
- WHO Global Health Observatory Data Repository. World Health Organization Web Site. Available online: https://www.who.int/data/gho/data/indicators/indicator-details/GHO/total-density-per-million-population-magnetic-resonance-imaging (accessed on 1 June 2024).
- Chodorowski, M.; Ognard, J.; Rovira, À.; Gentric, J.-C.; Bourhis, D.; Ben Salem, D. Energy consumption in MRI: Determinants and management options. J. Neuroradiol. 2024, 51, 182–189. [Google Scholar] [CrossRef]
- Hainc, N.; Brantner, P.; Zaehringer, C.; Hohmann, J. “Green Fingerprint” Project: Evaluation of the Power Consumption of Reporting Stations in a Radiology Department. Acad. Radiol. 2020, 27, 1594–1600. [Google Scholar] [CrossRef] [PubMed]
- Prasanna, P.M.; Siegel, E.; Kunce, A. Greening radiology. J. Am. Coll. Radiol. 2011, 8, 780–784. [Google Scholar] [CrossRef]
- Brown, M.; Snelling, E.; De Alba, M.; Ebrahimi, G.; Forster, B.B. Quantitative Assessment of Computed Tomography Energy Use and Cost Savings Through Overnight and Weekend Power Down in a Radiology Department. Can. Assoc. Radiol. J. 2023, 74, 298–304. [Google Scholar] [CrossRef]
- Heye, T.; Knoerl, R.; Wehrle, T.; Mangold, D.; Cerminara, A.; Loser, M.; Plumeyer, M.; Degen, M.; Lüthy, R.; Brodbeck, D.; et al. The Energy Consumption of Radiology: Energy- and Cost-saving Opportunities for CT and MRI Operation. Radiology 2020, 295, 593–605. [Google Scholar] [CrossRef] [PubMed]
- Souter, N.E.; Bhagwat, N.; Racey, C.; Wilkinson, R.; Duncan, N.W.; Samuel, G.; Lannelongue, L.; Selvan, R.; Rae, C.L. Measuring and reducing the carbon footprint of fMRI preprocessing in fMRIPrep. Hum. Brain Mapp. 2024, 45, e70003. [Google Scholar] [CrossRef] [PubMed]
- Siemens Healthineers Magnetom World Whitepaper. Siemens Healthineers Web Site. Available online: https://marketing.webassets.siemenshealthineers.com/7b633cb0e5eb4aa8/0bc40743a3e9/magnetom-world_10079_MR_Deep_Resolve_Whitepaper.pdf (accessed on 3 June 2024).
- GE Healthcare AIR Recon DL Whitepaper. GE Healthcare Web Site. Available online: https://www.gehealthcare.com/-/jssmedia/gehc/us/files/products/molecular-resonance-imaging/air/mr_gbl_air-recon-dl_091720_jb00297xx.pdf?rev=-1 (accessed on 3 June 2024).
- Canon Medical Whitepaper. Canon Medical Web Site. Available online: https://canonmedical.widen.net/content/lqeukohvmi/original/637286648343997179LE.pdf?u=cglmil& (accessed on 3 June 2024).
- Philips SmartSpeed Whitepaper. Philips Web Site. Available online: https://images.philips.com/is/content/PhilipsConsumer/Campaigns/HC20140401_DG/Documents/HC05072022-white_paper_philips_smartspeed.pdf (accessed on 3 June 2024).
- Hallinan, J.T.P.D. Deep Learning for Spine MRI: Reducing Time Not Quality. Radiology 2023, 306, e222410. [Google Scholar] [CrossRef] [PubMed]
- Kim, E.; Cho, H.-H.; Cho, S.; Park, B.; Hong, J.; Shin, K.; Hwang, M.; You, S.; Lee, S. Accelerated Synthetic MRI with Deep Learning–Based Reconstruction for Pediatric Neuroimaging. Am. J. Neuroradiol. 2022, 43, 1653–1659. [Google Scholar] [CrossRef] [PubMed]
- Dossier de Presse: L’imagerie en France. SNITEM Web Site. Available online: https://www.snitem.fr/wp-content/uploads/2023/10/Dossier-de-presse-_Limagerie-en-France.pdf (accessed on 3 June 2024).
- Data Adapted from Ember, Energy Institute. Available online: https://ourworldindata.org/grapher/carbon-intensity-electricity (accessed on 27 May 2024).
- Ibrahim, F.; Cadour, F.; Campbell-Washburn, A.E.; Allen, B.D.; Vosshenrich, J.; Brown, M.J.; Thavendiranathan, P.; Hanneman, K.; Moy, L. Energy and Greenhouse Gas Emission Savings Associated with Implementation of an Abbreviated Cardiac MRI Protocol. Radiology 2024, 311, e240588. [Google Scholar] [CrossRef] [PubMed]
- Knott, J.J.; Varangu, L.; Waddington, K.; Easty, T. Medical Imaging Equipment Study: Assessing Opportunities to Reduce Energy Consumption in the Health Care Sector. A Report to Natural Resources Canada by the Canadian Coalition for Green Health Care in Association with Dr. Tony Easty. Available online: https://greenhealthcare.ca/wp-content/uploads/2016/11/Medical-Imaging-Equipment-Energy-Use-CCGHC-2017.pdf (accessed on 23 January 2025).
- Cauz, M.; Rossier, S.; Planair, S.A. Rapport Final Efficacite Energetique Des Equipements Medicaux–IRM, Scanners, Appareils de Radiographie. Available online: https://pubdb.bfe.admin.ch/fr/publication/download/10159 (accessed on 1 June 2024).
- Lazard’s LCOE + April 2023. Lazard Web Site. Available online: https://www.lazard.com/media/2ozoovyg/lazards-lcoeplus-april-2023.pdf (accessed on 4 June 2024).
- RTE, Futurs Énergétiques 2050. RTE Web Site. Available online: https://assets.rte-france.com/prod/2022-06/Futurs%20%C3%A9nerg%C3%A9tiques%202050%20_%20rapport%20complet.zip (accessed on 24 May 2024).
- Central Collection and Publication of Electricity Generation, Transportation and Consumption Data and Information for the Pan-European Market. ENTSOE Web Site. Available online: https://transparency.entsoe.eu/dashboard/show (accessed on 19 December 2024).
- U.S. Energy Information Administration (EIA). Electric Power Monthly; Table 5.3. Average Retail Price of Electricity to Ultimate Customers. Available online: https://www.eia.gov/electricity/monthly/ (accessed on 22 January 2025).
- Subtle Medical SubtleMR. Subtle Medical Web Site. Available online: https://subtlemedical.com/subtlemr/ (accessed on 3 June 2024).


| System State | Definition |
|---|---|
| Productive scan mode | The MRI unit is actively engaged in scanning, producing images during ongoing examinations |
| Unproductive mode | When not actively generating images, the MRI unit may be in ready-to-scan, update, or idle modes |
| Ready to scan | When not capturing data between sequences or patients, the system enables immediate scanning on demand |
| Update | Performing software or hardware updates on the system |
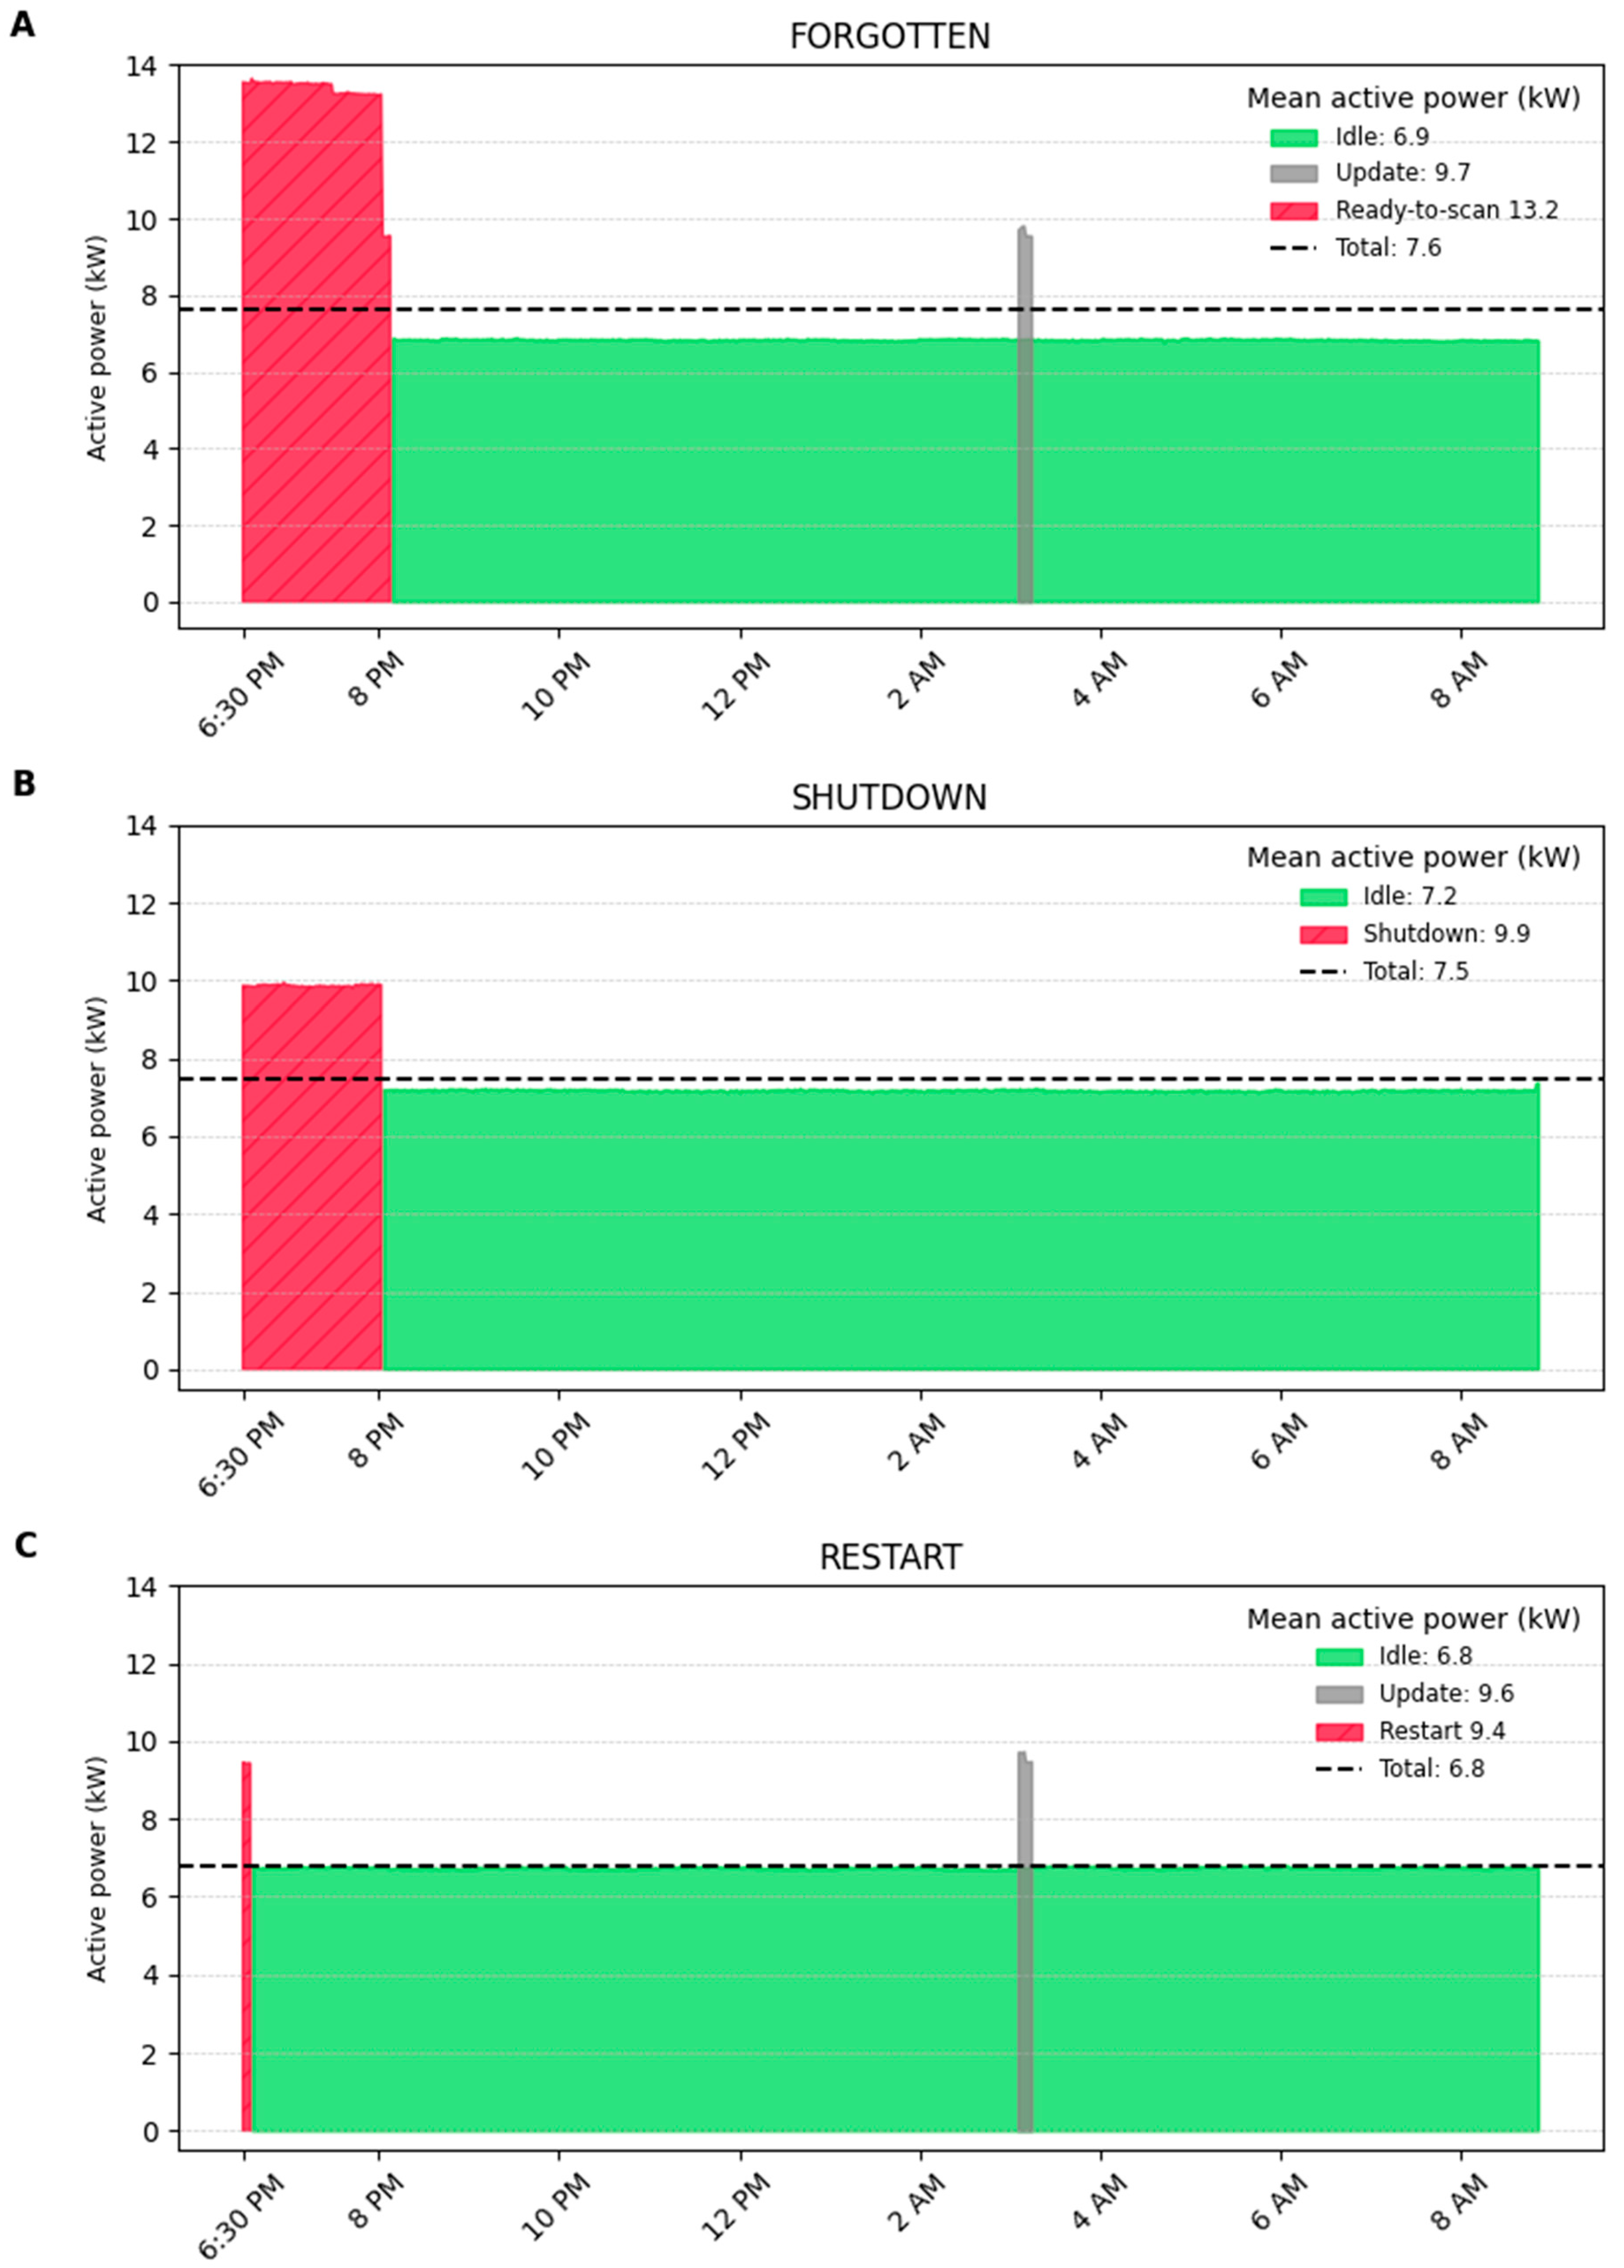
| Idle | Power save mode minimizes power consumption when in off or low-power states. Upon operator console logout, settings offer two options provided by the manufacturer:
|
| Forgotten | Shutdown | Restart | |
|---|---|---|---|
| Active power parameters (kW) | |||
| Minimum–maximum | [6.78–13.65] | [7.13–9.94] | [6.69–9.75] |
| Mean | 7.62 | 7.49 | 6.81 |
| Median | 6.87 | 7.21 | 6.76 |
| Standard deviation | 2.06 | 0.83 | 0.38 |
| Variance | 4.23 | 0.68 | 0.14 |
| Interquartile range | 0.03 | 0.03 | 0.04 |
| Mode | 6.87 | 7.20 | 6.78 |
| Sum | 109.50 | 107.64 | 97.83 |
| Total winter price (night standby) (EUR) | |||
| 2021 | 6.2 | 5.4 | 5.3 |
| 2022 | 22.4 | 18.1 | 14.1 |
| 2023 | 46.5 | 43.2 | 37.5 |
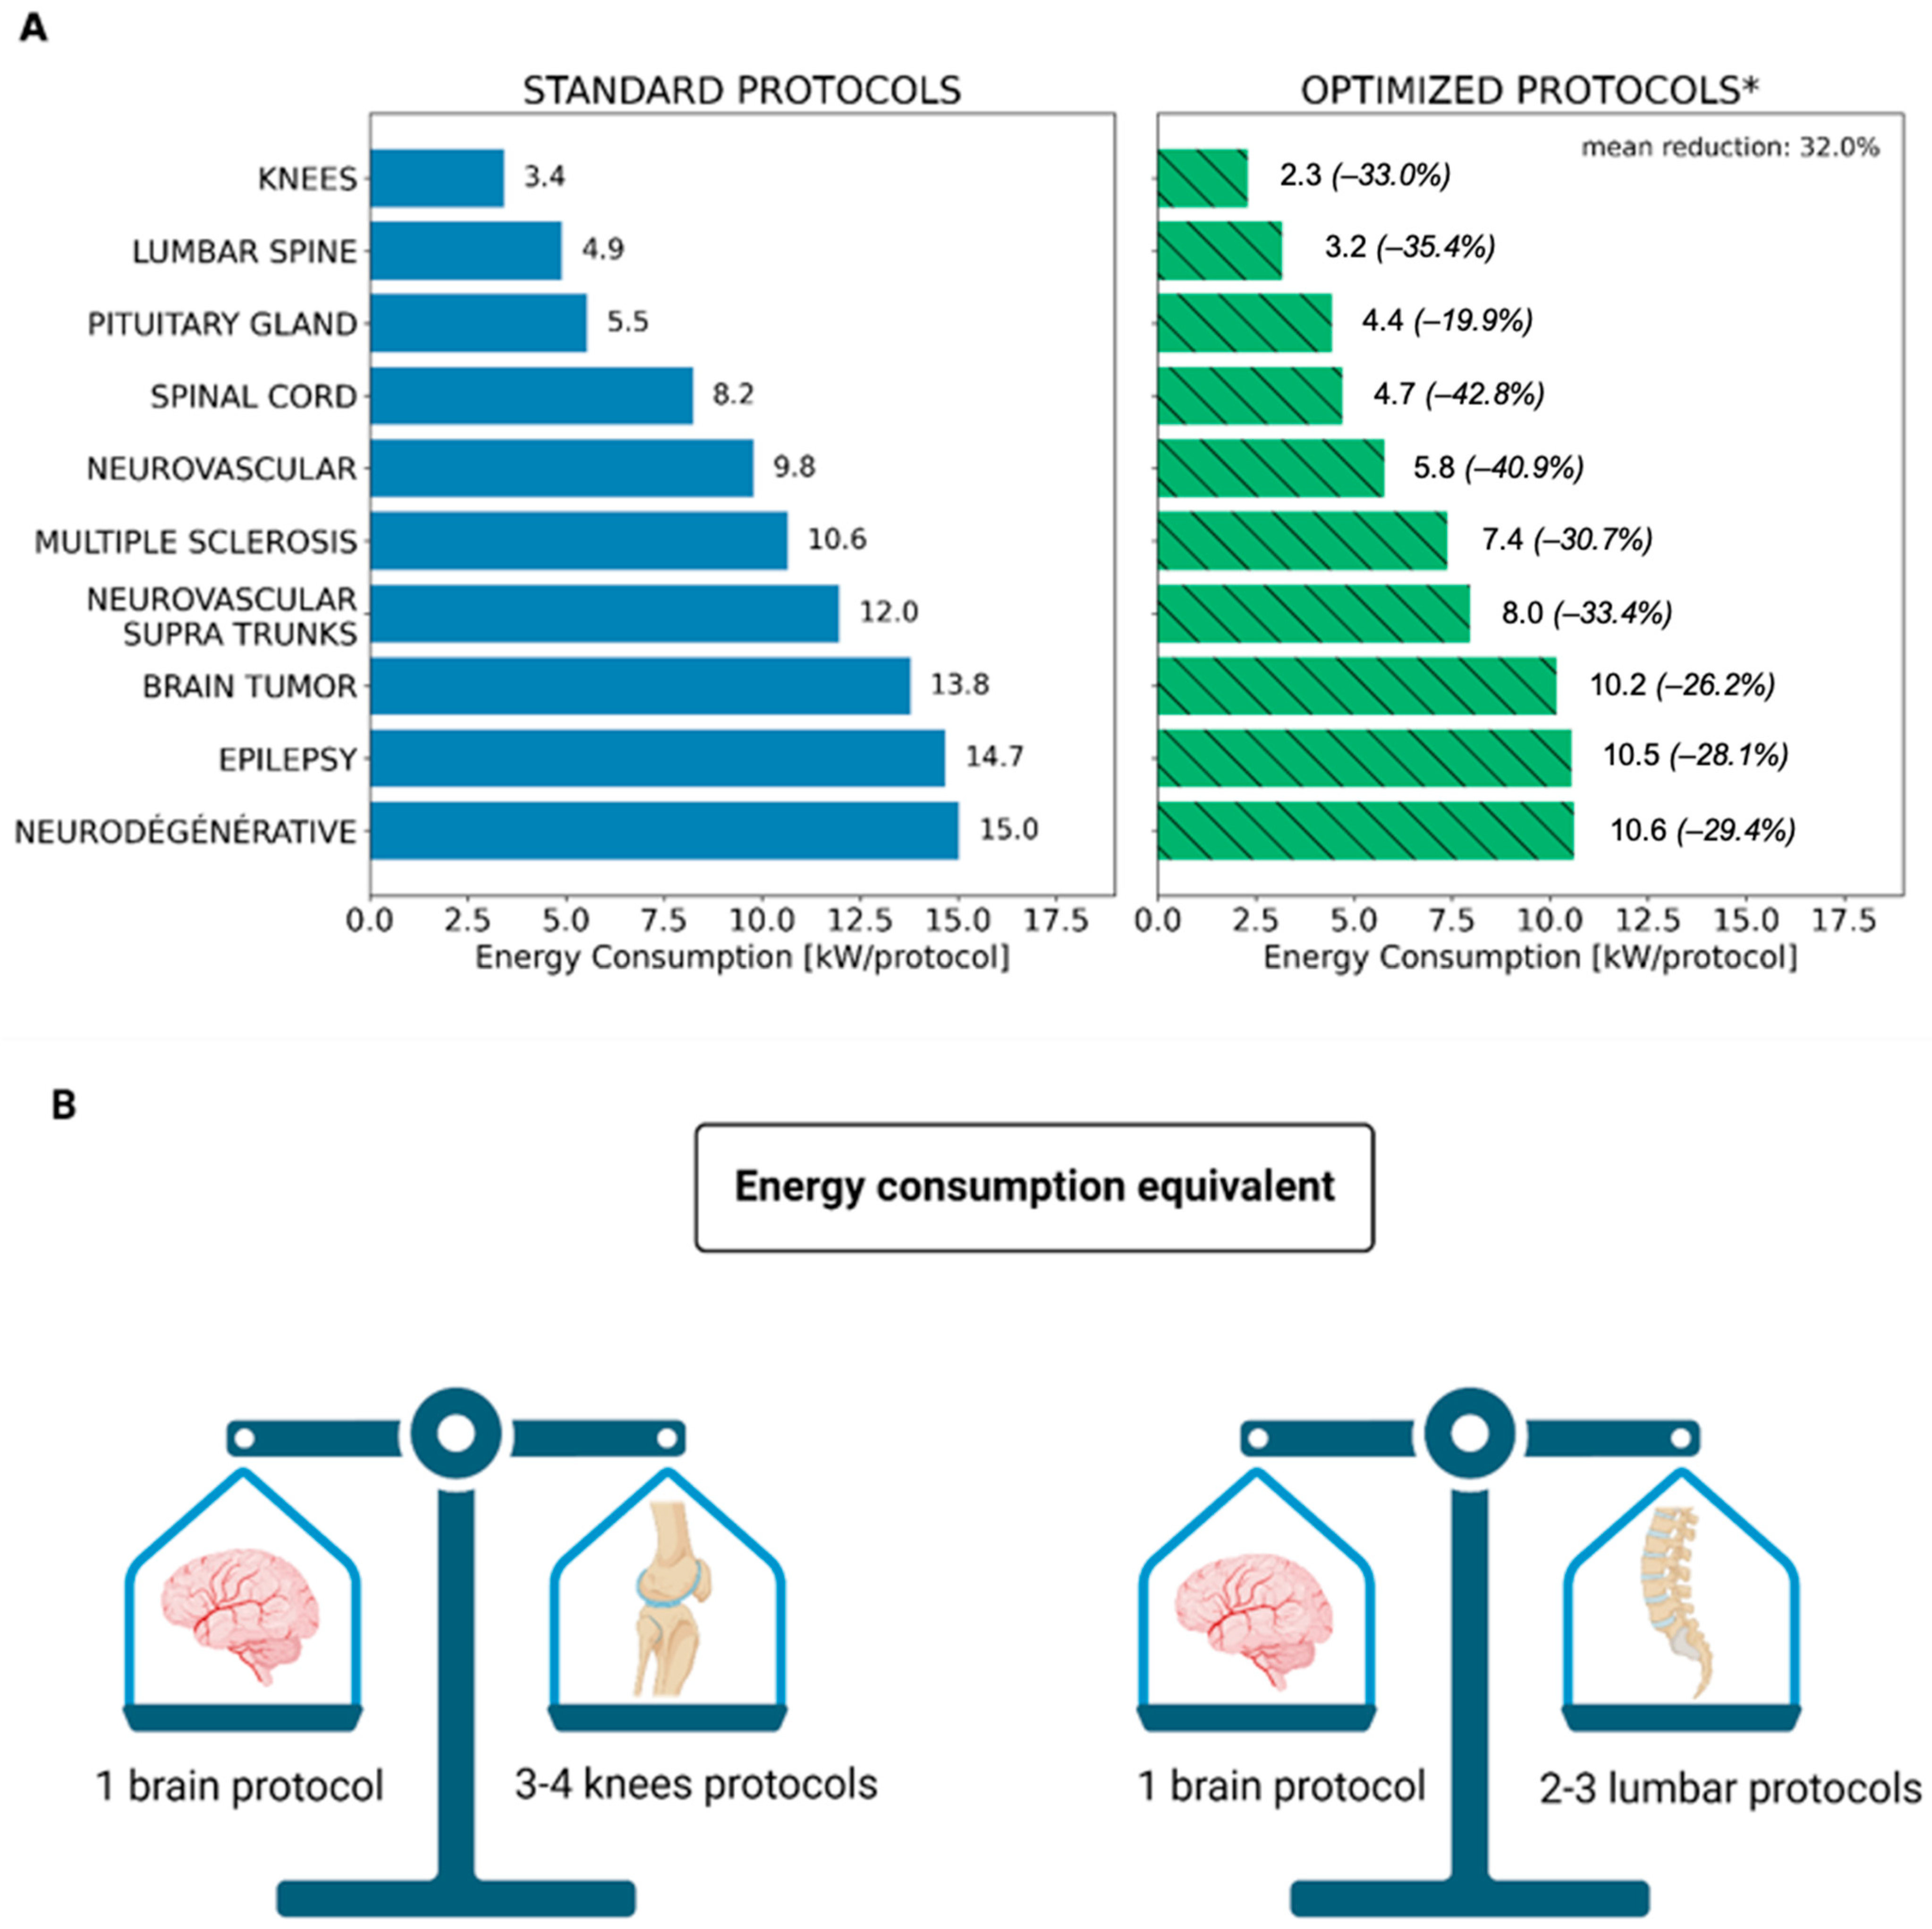
| Duration (s) | Consumption (kW/Protocol) | Off-Peak Hours Winter Price (EUR/Protocol) | Full Hours Winter Price (EUR/Protocol) | Peak Hours Winter Price (EUR/Protocol) | |||||||
|---|---|---|---|---|---|---|---|---|---|---|---|
| Years | 2021 | 2022 | 2023 | 2021 | 2022 | 2023 | 2021 | 2022 | 2023 | ||
| Standard protocols | |||||||||||
| Knees | 420 | 3.4 | 0.15 | 0.19 | 0.07 | 0.22 | 0.29 | 2.86 | 0.27 | 0.29 | 2.86 |
| Lumbar spine | 630 | 4.9 | 0.21 | 0.27 | 0.10 | 0.32 | 0.42 | 4.10 | 0.39 | 0.42 | 4.10 |
| Pituitary gland | 708 | 5.6 | 0.24 | 0.31 | 0.11 | 0.37 | 0.48 | 4.71 | 0.45 | 0.48 | 4.71 |
| Spinal cord | 1029 | 8.24 | 0.35 | 0.45 | 0.17 | 0.54 | 0.70 | 6.89 | 0.65 | 0.70 | 6.89 |
| Neurovascular | 956 | 9.8 | 0.42 | 0.53 | 0.20 | 0.64 | 0.83 | 8.18 | 0.77 | 0.83 | 8.18 |
| Multiple sclerosis | 1046 | 10.7 | 0.45 | 0.58 | 0.22 | 0.70 | 0.91 | 8.91 | 0.84 | 0.91 | 8.91 |
| Neurovascular and Supra trunks | 1298 | 11.98 | 0.51 | 0.65 | 0.24 | 0.79 | 1.02 | 10.01 | 0.95 | 1.02 | 10.01 |
| Brain tumor | 1300 | 13.92 | 0.59 | 0.75 | 0.28 | 0.92 | 1.19 | 11.63 | 1.10 | 1.19 | 11.63 |
| Epilepsy | 1596 | 14.68 | 0.62 | 0.79 | 0.30 | 0.97 | 1.25 | 12.27 | 1.16 | 1.25 | 12.27 |
| Neurodegenerative | 1567 | 15.04 | 0.64 | 0.81 | 0.31 | 0.99 | 1.28 | 12.57 | 1.19 | 1.28 | 12.57 |
| Optimized protocols | |||||||||||
| Knees | 304 | 2.29 | 0.10 | 0.12 | 0.05 | 0.15 | 0.20 | 1.91 | 0.18 | 0.20 | 1.91 |
| Lumbar spine | 436 | 3.17 | 0.13 | 0.17 | 0.06 | 0.21 | 0.27 | 2.65 | 0.25 | 0.27 | 2.65 |
| Pituitary gland | 518 | 4.25 | 0.18 | 0.23 | 0.09 | 0.28 | 0.36 | 3.55 | 0.34 | 0.36 | 3.55 |
| Spinal cord | 580 | 4.71 | 0.20 | 0.25 | 0.10 | 0.31 | 0.40 | 3.94 | 0.37 | 0.40 | 3.94 |
| Neurovascular | 621 | 5.77 | 0.25 | 0.31 | 0.12 | 0.38 | 0.49 | 4.82 | 0.46 | 0.49 | 4.82 |
| Multiple sclerosis | 769 | 7.38 | 0.31 | 0.40 | 0.15 | 0.49 | 0.63 | 6.17 | 0.58 | 0.63 | 6.17 |
| Neurovascular and supra trunks | 963 | 7.96 | 0.34 | 0.43 | 0.16 | 0.52 | 0.68 | 6.65 | 0.63 | 0.68 | 6.65 |
| Brain tumor | 1021 | 10.31 | 0.44 | 0.56 | 0.21 | 0.68 | 0.88 | 8.62 | 0.82 | 0.88 | 8.62 |
| Epilepsy | 1200 | 10.55 | 0.45 | 0.57 | 0.21 | 0.69 | 0.90 | 8.82 | 0.83 | 0.90 | 8.82 |
| Neurodegenerative | 1150 | 10.61 | 0.45 | 0.57 | 0.22 | 0.70 | 0.90 | 8.87 | 0.84 | 0.90 | 8.87 |
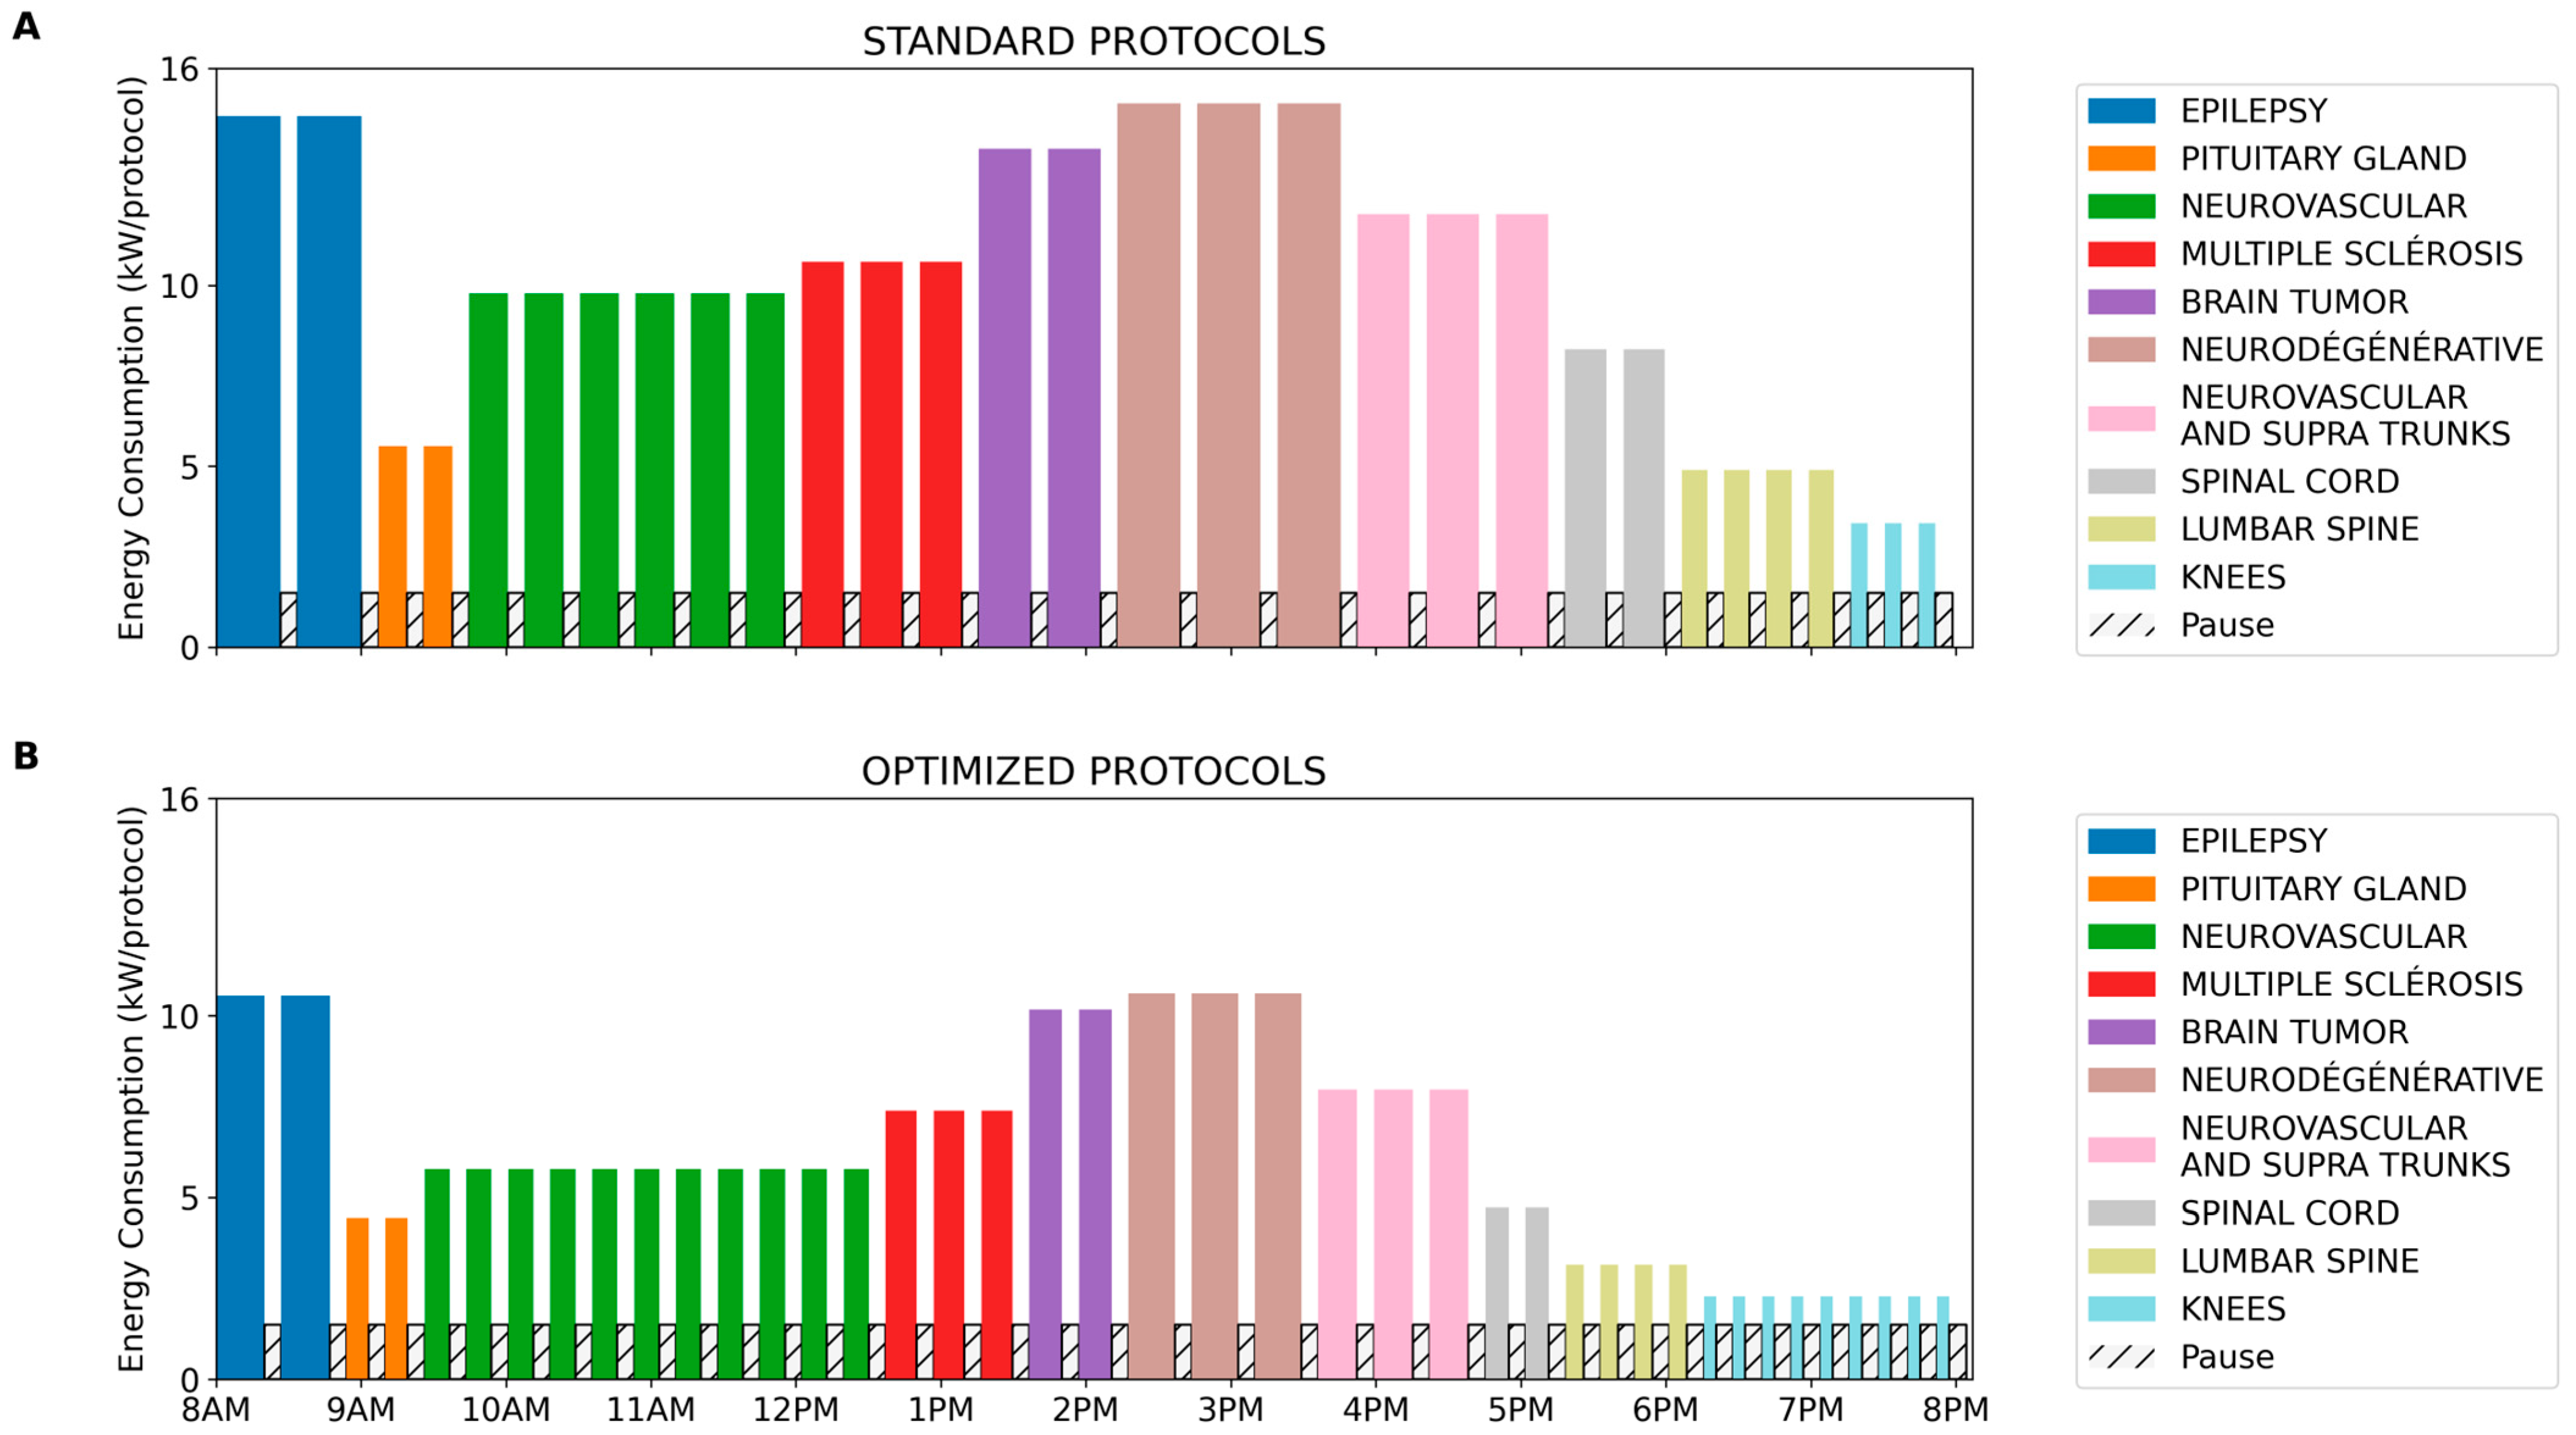
| Years | 2021 | 2022 | 2023 | |||
|---|---|---|---|---|---|---|
| Protocols | Standard | Optimized | Standard | Optimized | Standard | Optimized |
| Protocols count | 30 | 41 | 30 | 41 | 30 | 41 |
| Daily Consumption (kW) | ||||||
| Protocols | 285.95 | 234.53 | 285.95 | 234.53 | 285.95 | 234.53 |
| Break | 45.00 | 61.50 | 45.00 | 61.50 | 45.00 | 61.50 |
| Total | 330.95 | 296.03 | 330.95 | 296.03 | 330.95 | 296.03 |
| Daily cost (EUR) | ||||||
| Protocols | 19.46 | 15.96 | 22.00 | 18.05 | 238.98 | 196.01 |
| Break | 3.08 | 4.18 | 3.48 | 4.73 | 37.61 | 51.40 |
| Total | 22.53 | 20.15 | 25.48 | 22.78 | 276.59 | 247.41 |
Disclaimer/Publisher’s Note: The statements, opinions and data contained in all publications are solely those of the individual author(s) and contributor(s) and not of MDPI and/or the editor(s). MDPI and/or the editor(s) disclaim responsibility for any injury to people or property resulting from any ideas, methods, instructions or products referred to in the content. |
© 2025 by the authors. Licensee MDPI, Basel, Switzerland. This article is an open access article distributed under the terms and conditions of the Creative Commons Attribution (CC BY) license (https://creativecommons.org/licenses/by/4.0/).
Share and Cite
Alerte, Z.; Chodorowski, M.; Ammari, S.; Rovira, A.; Ognard, J.; Ben Salem, D. Towards Sustainable Magnetic Resonance Neuro Imaging: Pathways for Energy Optimization and Cost Reduction Strategies. Appl. Sci. 2025, 15, 1305. https://doi.org/10.3390/app15031305
Alerte Z, Chodorowski M, Ammari S, Rovira A, Ognard J, Ben Salem D. Towards Sustainable Magnetic Resonance Neuro Imaging: Pathways for Energy Optimization and Cost Reduction Strategies. Applied Sciences. 2025; 15(3):1305. https://doi.org/10.3390/app15031305
Chicago/Turabian StyleAlerte, Zélie, Mateusz Chodorowski, Samy Ammari, Alex Rovira, Julien Ognard, and Douraied Ben Salem. 2025. "Towards Sustainable Magnetic Resonance Neuro Imaging: Pathways for Energy Optimization and Cost Reduction Strategies" Applied Sciences 15, no. 3: 1305. https://doi.org/10.3390/app15031305
APA StyleAlerte, Z., Chodorowski, M., Ammari, S., Rovira, A., Ognard, J., & Ben Salem, D. (2025). Towards Sustainable Magnetic Resonance Neuro Imaging: Pathways for Energy Optimization and Cost Reduction Strategies. Applied Sciences, 15(3), 1305. https://doi.org/10.3390/app15031305