1. Introduction
An essential function of buildings is to provide comfortable indoor environments, which often entails high energy consumption. In particular, the interaction of occupants with building controls has been recognized as an important factor that influences commonly observed significant differences between actual and predicted energy consumption in buildings [
1]. As for the field study of thermal comfort, research has traditionally adopted two main approaches [
2]: the heat balance model [
3] and the adaptive model [
4,
5,
6]. In particular, with respect to the latter, the main international standards [
7] establish admissible indoor temperature thresholds in buildings without mechanical ventilation based on comfort studies and over the past ten years, numerous field studies have been conducted along these lines [
8,
9,
10]. Therefore, adaptive comfort has established itself as a major research field, defining standards that relate acceptable indoor temperatures to outdoor temperatures. These proposals reflect how climate influences our thermal preferences and how body regulation mechanisms drive thermoregulatory behaviors. As J.F. Nicol pointed out, it could be summarized in the adaptive principle: “
If a change occurs such as to produce discomfort, people react in ways which tend to restore their comfort” [
11]. J.F. Nicol also highlights that the adaptive approach “
to explain the range of temperatures people found comfortable in buildings with the variable indoor temperature’s characteristic of naturally ventilated buildings” offers a complementary solution to the challenge of heat balance.
Since then, this approach has gained recognition, consolidating into standards such as ANSI/ASHRAE 55:2023 [
2], the reference for thermal comfort in North America, and the European standard UNE-EN 16798-1:2020 [
4], which covers both thermal comfort and other indoor environmental parameters. These adaptive approaches are mainly applied to the assessment of the thermal environment in naturally ventilated (NV) buildings where, e.g., the occupants have access to operable windows and have some freedom to adapt the insulation of their clothing. Countries such as the Netherlands [
12] and Brazil [
13,
14] have also included adaptive models in their national regulations and standards.
Utilizing natural ventilation in buildings can lead to considerable electrical energy savings for cooling and fans [
15]. While adaptation is described as the gradual decrease in the reaction to environmental stimulation, and can be behavioral (such as clothing [
16], windows, fans), physiological (acclimatization), and psychological (expectation) [
17], in a practical setting, variations in the perception of the thermal environment were identified between occupants of naturally ventilated or free-running, fully air-conditioned and mixed-mode or hybrid buildings [
17].
Adaptive comfort approach have arisen as a sustainable and resilient solution that, according to Bienvenido-Huertas et al. [
18], could reduce the incidence of fuel poverty, in contrast to the static model that relies exclusively on active cooling. Harold Wilhite [
19] described fully conditioned buildings as “
Buildings as comfort capsules” where the heating, ventilating and air-conditioning (HVAC) system is seen as one of the tools contributing to the “homogenization of people”, resulting in “thermal monotony”, although early HVAC engineers strived to avoid creating monotonous thermal environments [
20]. The building sector is looking for sustainable building solutions, not only with passive heat dissipation capabilities [
21] or from an aerothermal point of view [
22], but also passive actions are expected to contribute to periods with natural ventilation, such as the adaptation of the clothing insulation level [
23].
The application of adaptive comfort control (ACC) as an alternative to fixed setpoint systems (or the paradigm of a single temperature setpoint in each climatic season) would be justified by Fountain et al. [
24] who explain that “
after repeated exposure to variation in environmental conditions,
a person’s expectations of those conditions may become more relaxed—even anticipatory of temporal changes” (p. 181). This idea provides insight into why adaptive comfort control is a valid alternative to fixed setpoint systems, as it suggests that people’s expectations of environmental conditions can be adjusted and become more flexible over time. This adaptive capacity comes from repeated exposure to such environmental variations, which fosters more flexible expectations and even positive anticipation of temporary changes in the environment. This reinforces the idea that an adaptive control system, by allowing controlled variations in indoor conditions rather than maintaining a fixed setpoint, can not only be more energy efficient, but also promote a natural thermal comfort experience aligned with human expectations. As highlighted in [
25] (p. 16), the application of adaptive comfort systems has been shown to improve energy savings, enhance resilience to climate change and increase thermal satisfaction and well-being.
The adaptive comfort control approach could be seen as a solution to the phenomenon described by De Dear [
26] in which occupants of buildings with traditional HVAC systems develop an expectation of thermal constancy due to the strict maintenance of fixed temperatures. This expectation, as the author points out, causes even small fluctuations in temperature to be perceived negatively, generating a hypersensitivity that leads to frequent complaints. Automated controls that adjust HVAC setpoints according to the outdoor climate and seasonal variations can be an effective solution. In fact, Deuble and De Dear [
27] suggest that increasing indoor climate variability is key to sustainable building design strategies.
In this context, it becomes relevant to analyze mixed mode (MM) buildings, which combine natural ventilation and HVAC systems. Although there is no consensus in the literature on control strategies for mixed mode buildings [
28], this study proposes the analysis of a real case of integration of the adaptive approach in the operation of HVAC systems to investigate the implementation of a real mixed mode situation. Given that an MM building does not have to operate as a fully conditioned building the whole time, and although some authors consider or analyze that they must operate in the HVAC mode above a certain temperature [
27], the reality is that an MM building can be a free-behaving building. The hypothesis analyzed in this study is that operating a significant percentage of the time in passive mode, with the HVAC system serving as a temporary backup adaptive measure, would be a feasible solution. This hypothesis is supported by recent findings [
29], although only 20% of case studies on adaptive setpoints in Building Automation Systems (BAS) have been implemented in real-world cases (in European countries, this accounts for 36% of the 20%), and despite the fact that the operational strategies in mixed mode buildings are suitable to such approaches (48% are categorized as changeover strategies). Therefore, the aim of this paper is to expand upon these studies, addressing the gap in literature by analyzing real-world feasibility. Moreover, in recent studies such as [
30], it has been shown that in situations when extreme outdoor temperatures entail the use of HVAC systems, adjusting adaptive setpoints can lead to a reduction of approximately 35% in cooling demand, thereby contributing to both energy savings and greater thermal comfort. The user might rely on this measure (HVAC usage) without being aware of the building’s setpoint (due to its adaptive nature), thus, expressing its need to improve the temperature on an ad hoc basis. Consequently, the setpoint, as it is adaptive, would follow the temperature proposed by the adaptive comfort algorithm, with the consequent energy savings that this would entail, compared to a continuous conditioning operation based on a fixed setpoint.
In relation to the number of field studies carried out in MM buildings, although a growing trend of research focused on this area can be detected in the literature, the number is lower than in naturally ventilated or fully conditioned buildings [
29]. In terms of climatology, building type and HVAC systems, a higher volume of work can be identified in MM buildings in oceanic and humid sub-tropical climates, commercial or business buildings and change-over and concurrent operations strategies, respectively.
There is also a wide variety of control algorithms developed for MM buildings. Although some studies propose rule-based control, considering variables such as outdoor temperature, indoor temperature, thermal comfort or adaptive behaviors, among others, other research focuses on complex computational controls based on fuzzy logic or machine learning algorithms, highlighting the diversity of approaches in this field.
Additionally, there is a need for this type of case study, since, as indicated by [
29], 80% of the case studies are based on simulations, which points to the need to analyze a larger number of real implementations.
This article is structured as follows:
Section 2 describes the material and methods, describing the case study as well as including previous knowledge, relevant background information and milestones that have enabled the development of the current study, as well as the general contextual conditions and climatology of the case study. This section also discusses the data collection process and the preliminary analyses conducted and presents the proposed methodology.
Section 3 shows the results obtained after one year of practical implementation of the integration of the adaptive algorithm into the control system and discusses the findings. Finally,
Section 4 presents the conclusions of the work.
2. Materials and Methods
2.1. Case Study
The study was carried out in a building located in Seville (37 °N, 5 °W), in the southern region of Spain. The climate is classified as Csa (hot summer Mediterranean climate) according to the Köppen–Geiger classification [
31], and as B4 according to the Spanish Building Technical Code [
32]. The main characteristics of the climate in Seville are hot and dry summers, and mild, humid and temporary rainy winters. It is also characterized by one of the highest average annual temperatures in Europe, frequently exceeding 40 °C. During the sample period, spanning from July 2023 to June 2024, these temperatures, as shown in (
Table 1), exceeded this threshold.
This field study was carried out in an office room of a tertiary, non-residential building. Following the proposal of Morgan and De Dear [
33], among the conditions for the adaptive approach,
“It is essential that building occupants are free to adapt themselves,
primarily through clothing adjustment,
to the variable indoor climate regime prevailing inside such buildings” (p. 267), so the present study allows users to make adaptive adjustments, although it focuses on the analysis of the inclusion of an adaptive algorithm into the building management system.
The adaptive comfort algorithm applied in this area of the building was presented by Barbadilla et al. [
34], in which a single adaptive model was proposed for both the NV and HVAC operation modes. The algorithm was based on an analysis of more than five thousand surveys, leading to the following equation (Equation (1)).
where T
c is the indoor comfort temperature and T
rm is the outdoor running mean temperature.
Figure 1 shows the adaptive range corresponding to the behavior of this algorithm over a full year.
Regarding
Figure 1, in [
34] a comparative analysis of the adaptive control algorithm considered for the development of the present case study was carried out with respect to other models, showing that the neutral temperatures obtained were lower than those proposed using the ASHRAE-55:2023 and UNE-EN 16798-1:2020 models for NV buildings. Moreover, according to [
9] (pp. 6–7), where a summary of different adaptive regression models and their coefficients was carried out, most of the linear adaptive linear regression models are within the limits recommended in ASHRAE 55.
As for the implementation of the adaptive control algorithm, in [
35] a methodology is presented for implementing an adaptive control algorithm in a Building Management System (BMS). In the present study, the BMS was adapted to allow users to switch between natural ventilation and heating, ventilation, and air conditioning modes. During the study period, users had the option of not using HVAC, with a key feature of this adaptation being that, in NV mode, occupants could freely open or close windows at their discretion.
This previous approach is based on the “change-over” mixed mode, commonly applied in office buildings, where natural ventilation and HVAC systems are used in the same space but at different moments [
10,
36]. In the present study, HVAC mode operation required all windows to remain closed, and windows could only be opened if the HVAC system had been turned off or inactive for at least 5 min [
37].
To make use of the HVAC system, a limited one-off measure in building retrofit, it was proposed to include a 2-h inactivity timer in the BMS; if no interaction occurred during this period, the system was automatically switched off. However, the system could be stopped at any time. This design not only improves energy use but also gives the user personal control over the climate control system. This perceived control has an important psychological effect, as it allows people to feel that they can directly influence their environment, thus, improving their comfort and satisfaction [
38]. The decision to allow the use of the HVAC system, with automatic shut-off functionality after 2 h of inactivity or when reaching the temperature of the adaptive comfort setpoint, aligns with the findings of [
38]. According to this study, the perceived ability of users to control their thermal environment improves their perception of thermal comfort due to the psychological influence of perceived control. Furthermore, when faced with extreme thermal conditions, occupants have a greater desire to adjust their environment, and this personal control is even more effective.
The system design not only provides perceived control that reduces thermal discomfort even with slight improvements in thermal conditions, but also ensures that the thermal demands of the occupants are adequately addressed. This can ultimately minimize complaints about the thermal environment, optimizing thermal comfort as well as energy efficiency.
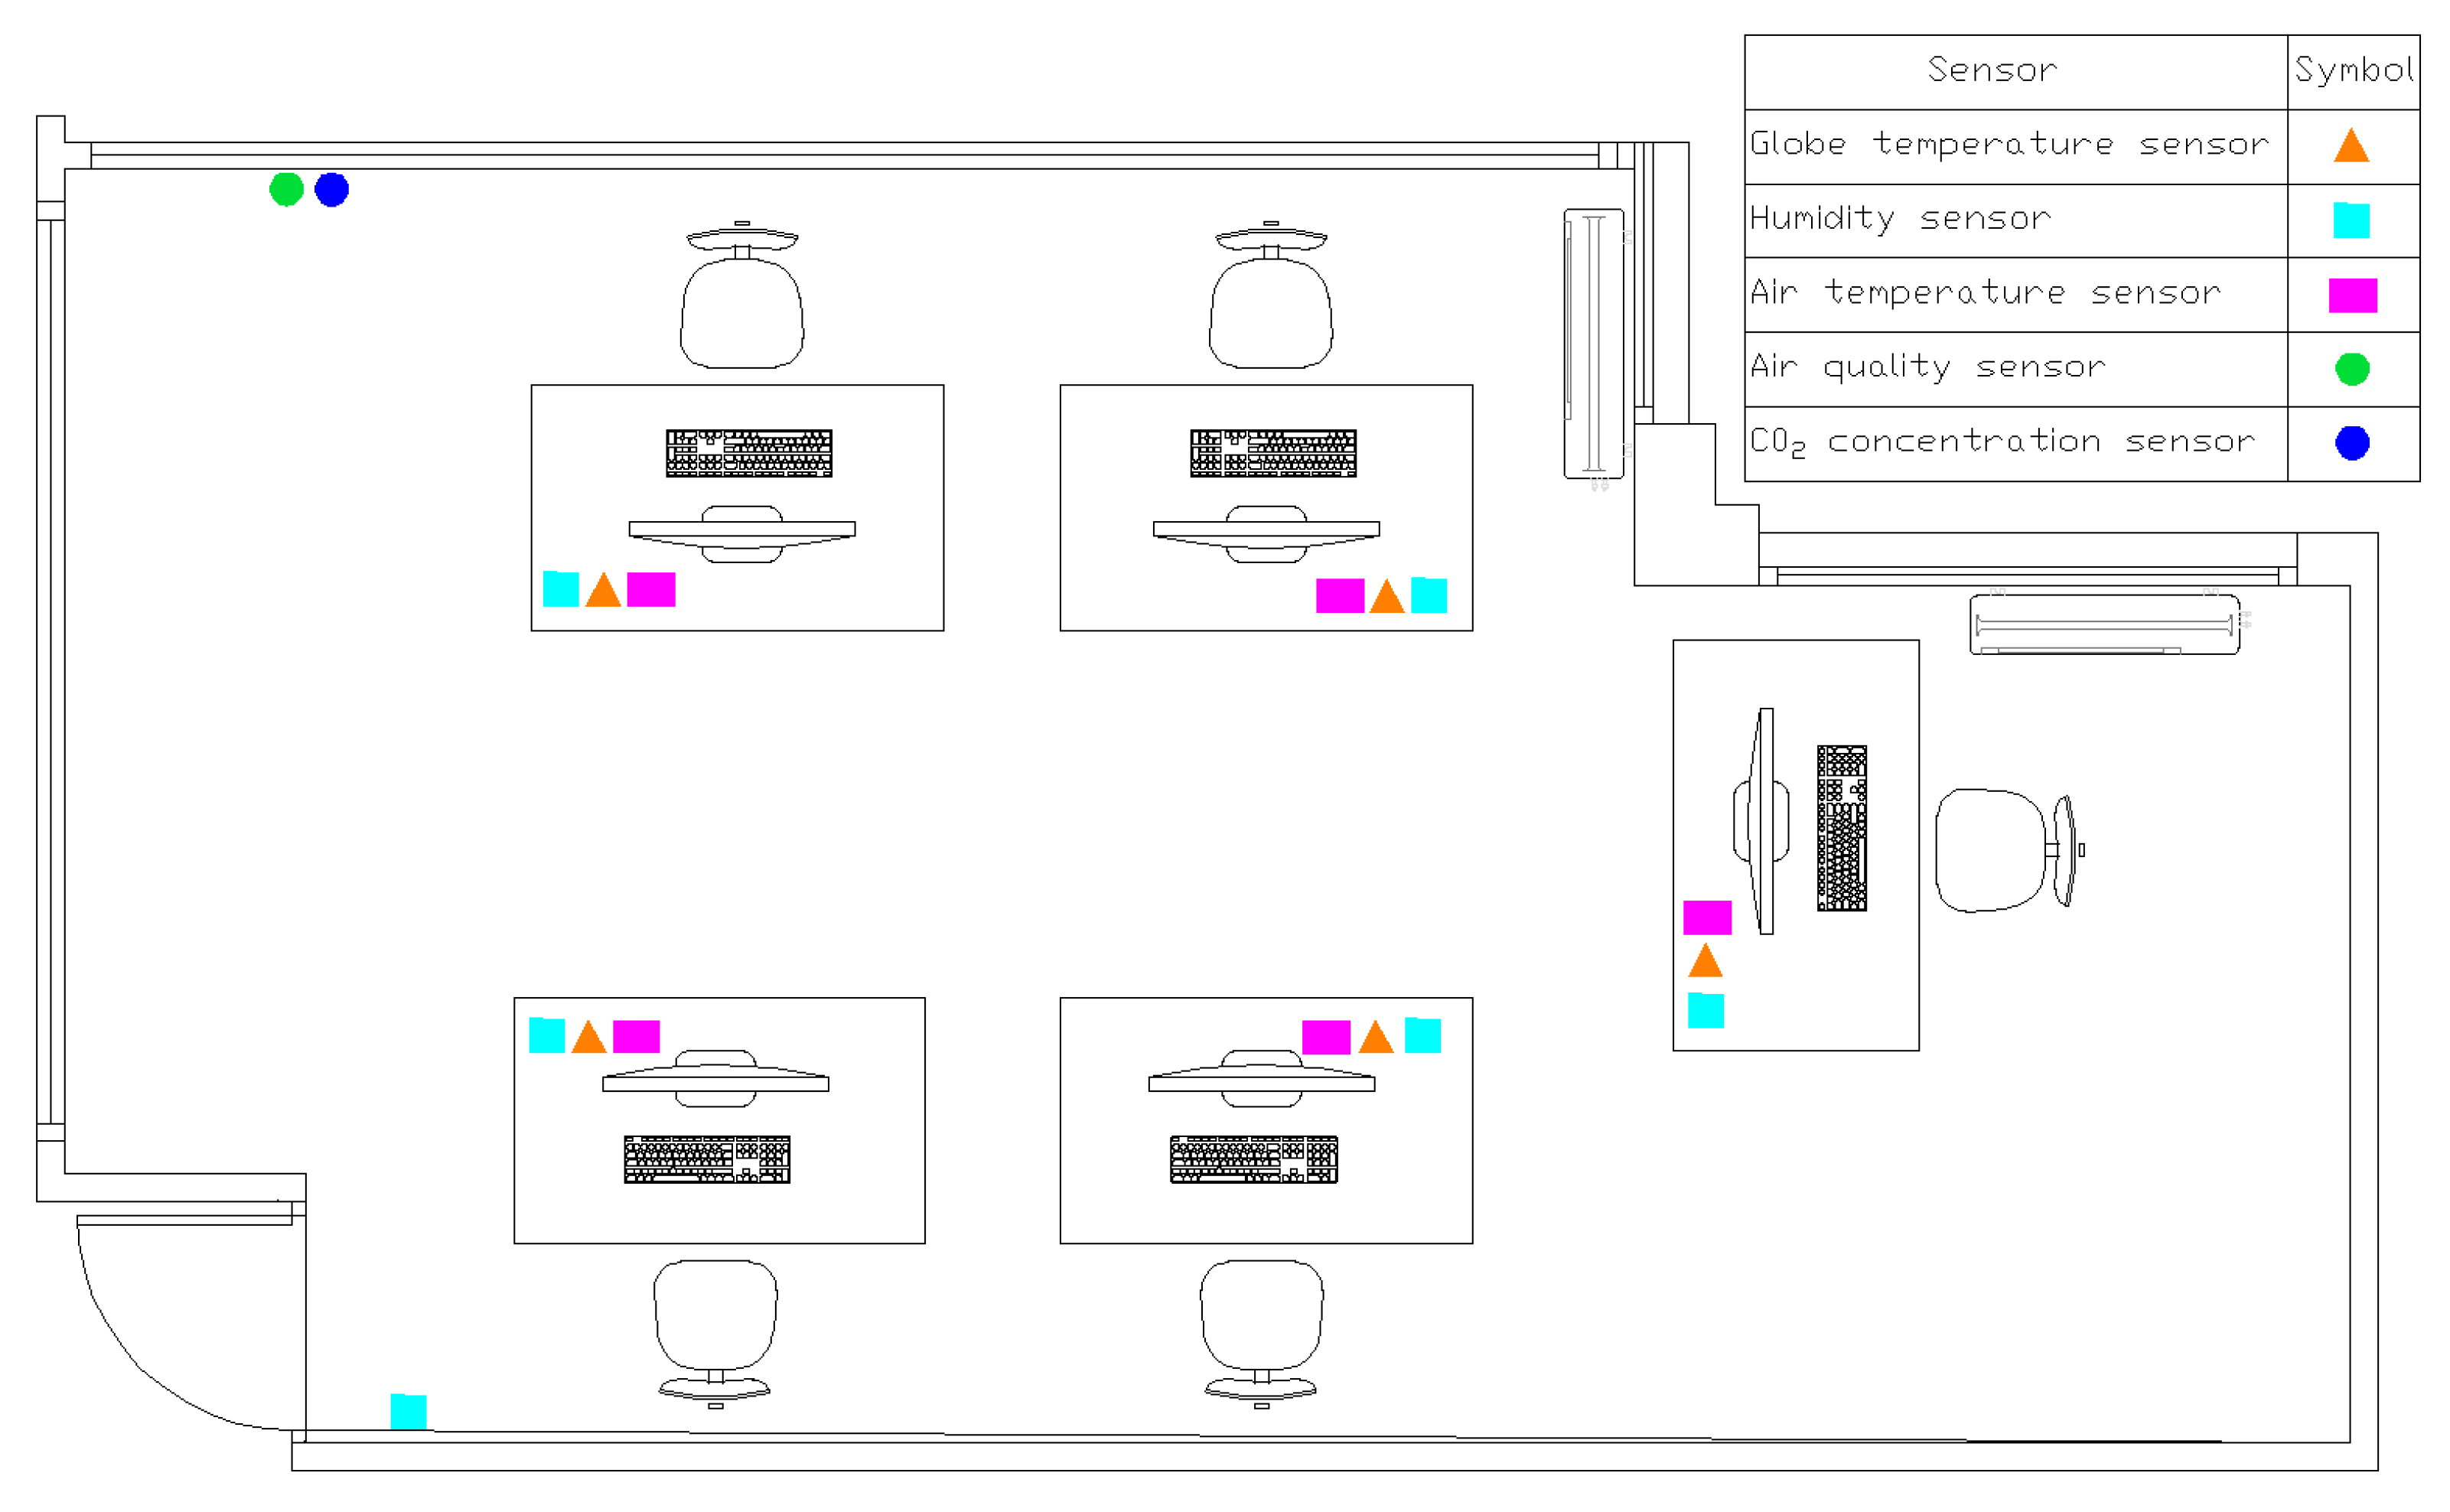
The study group consisted of 10 people aged 24 to 50 years, with 7 men and 3 women, in a room with 5 workstations (
Figure 2), where the desks allowed users to exchange throughout the work day (“hot desk”). The office hours considered were from 8:00 to 20:00 h, and the participation of the subjects was voluntary, as is the case in many thermal comfort field studies. The study area depicted in
Figure 2 shows a room with sensors and tables, with an area of 14 m
2 with windows with double glass and manual and indoor blinds.
2.2. Acquisition, Processing and Preliminary Analysis of Data
Throughout the study, objective measurements (indoor and outdoor climate) and subjective measurements (thermal preference) were collected simultaneously. The study was carried out over 12 months (July 2023 to June 2024) in order to characterize all the seasons. An array of wireless technology sensors recorded the behavior of the room. The newly acquired sensors were verified prior to the study. A total of 685,152 indoor environmental records (located in
Figure 2) and 35,136 outdoor records (
Table 2) were collected.
Measurements inside the room (temperature, humidity, etc.) were obtained at 10 min intervals. All sensors were new, calibrated, compared with similar sensors under the same conditions, and showed no significant differences in their measurements. Sensors were placed approximately 1 m from the occupants’ workstations in order to describe their immediate thermal environment under typical working conditions. Outdoor weather observations were collected from a weather station close to the building [
39] and located about 100 m from it, of which outdoor temperature was of the greatest interest.
The 2859 working hours during which the users were working in the office were selected, after eliminating weekends, holidays, and intensive working days in July (when the room was not used in the afternoon). A total of 1320 valid surveys were collected and were grouped according to the time of day, resulting in the evaluation of 483 declared thermal preferences.
At the end of the study, the BMS register was obtained with the HVAC system states. The base setpoint value of the HVAC system applied the adaptive comfort algorithm for the building, in which the running mean temperature was calculated with an alpha of 0.8. The range associated with the adaptive comfort law is represented in
Figure 1 by two green dashed lines, which indicate the total width of the comfort zone for the sample period. The same figure shows the behavior of the indoor and outdoor temperatures for the building, together with the comfort zone based on the implemented adaptive law. The range is indicated in its most restrictive form, with a scale of +2/−3 °C, building category I according to UNE-EN 16798-1 [
4]. This more restrictive range was adopted to prioritize perceived thermal comfort in this analysis, considering that even small variations can generate significant responses.
Although in the UNE-EN 16798-1 [
4] indoor comfort range for the design and evaluation of the energy performance of buildings would be +3/−4 °C, in Carlucci et al. [
40] a comparative analysis of different adaptive thermal comfort models can be found, in which the most restrictive acceptability percentage corresponds to 90%. These percentages are justified on the grounds that current models cannot accurately predict how an individual will feel on a specific day, so it is not reasonable to expect all users to experience thermal comfort in the same environment, even when it complies with current standards.
Based on the BMS register, the HVAC system was required as a punctual measure in 379 h (13.25% of the total active hours of office use). Of these, 206 h was sufficient to achieve thermal comfort within the planned operation time, while in 192 h, the planned operation time was insufficient, requiring an extension to maintain comfort. A total of 166 h of punctual activity occurred in summer, from June to September, and 113 h in winter, from December to March. In the study, the HVAC system remained off with passive adaptation measures for 2480 h (92.7% of the total hours of use).
2.3. Methodology
One of the main challenges of thermal comfort studies is to keep people motivated to participate over time. This is especially relevant in approaches that require active interaction over long periods of time.
The present proposal was, therefore, aimed at analyzing HVAC as an adaptive measure in MM and, given that the field study was carried out over one year, a central question on thermal preference was used: “
How would you prefer to be now?” [
41]. The scale issue about the thermal preference arose “
to overcome the ambiguity of thermal condition acceptability considering the 3-point McIntyre preference scale” [
42], but based on ISO 10551:2019 [
41], “
A 7-degree scale should be applied in the case of environments judged to be close to neutrality; a 9-degree scale should be applied in the case of environments judged to be more intense”, although studies can be found with an 11-point scale [
42]. In [
43] it is indicated that the scale for the thermal preference vote (TPV) represents how an occupant would prefer to adjust their thermal environment and it is, therefore, an accurate measure for defining an optimal indoor thermal environment. According to the authors, unlike other measures, TPV directly suggests a change in current conditions, making it an effective tool to improve the prediction of the HVAC system and optimize energy efficiency.
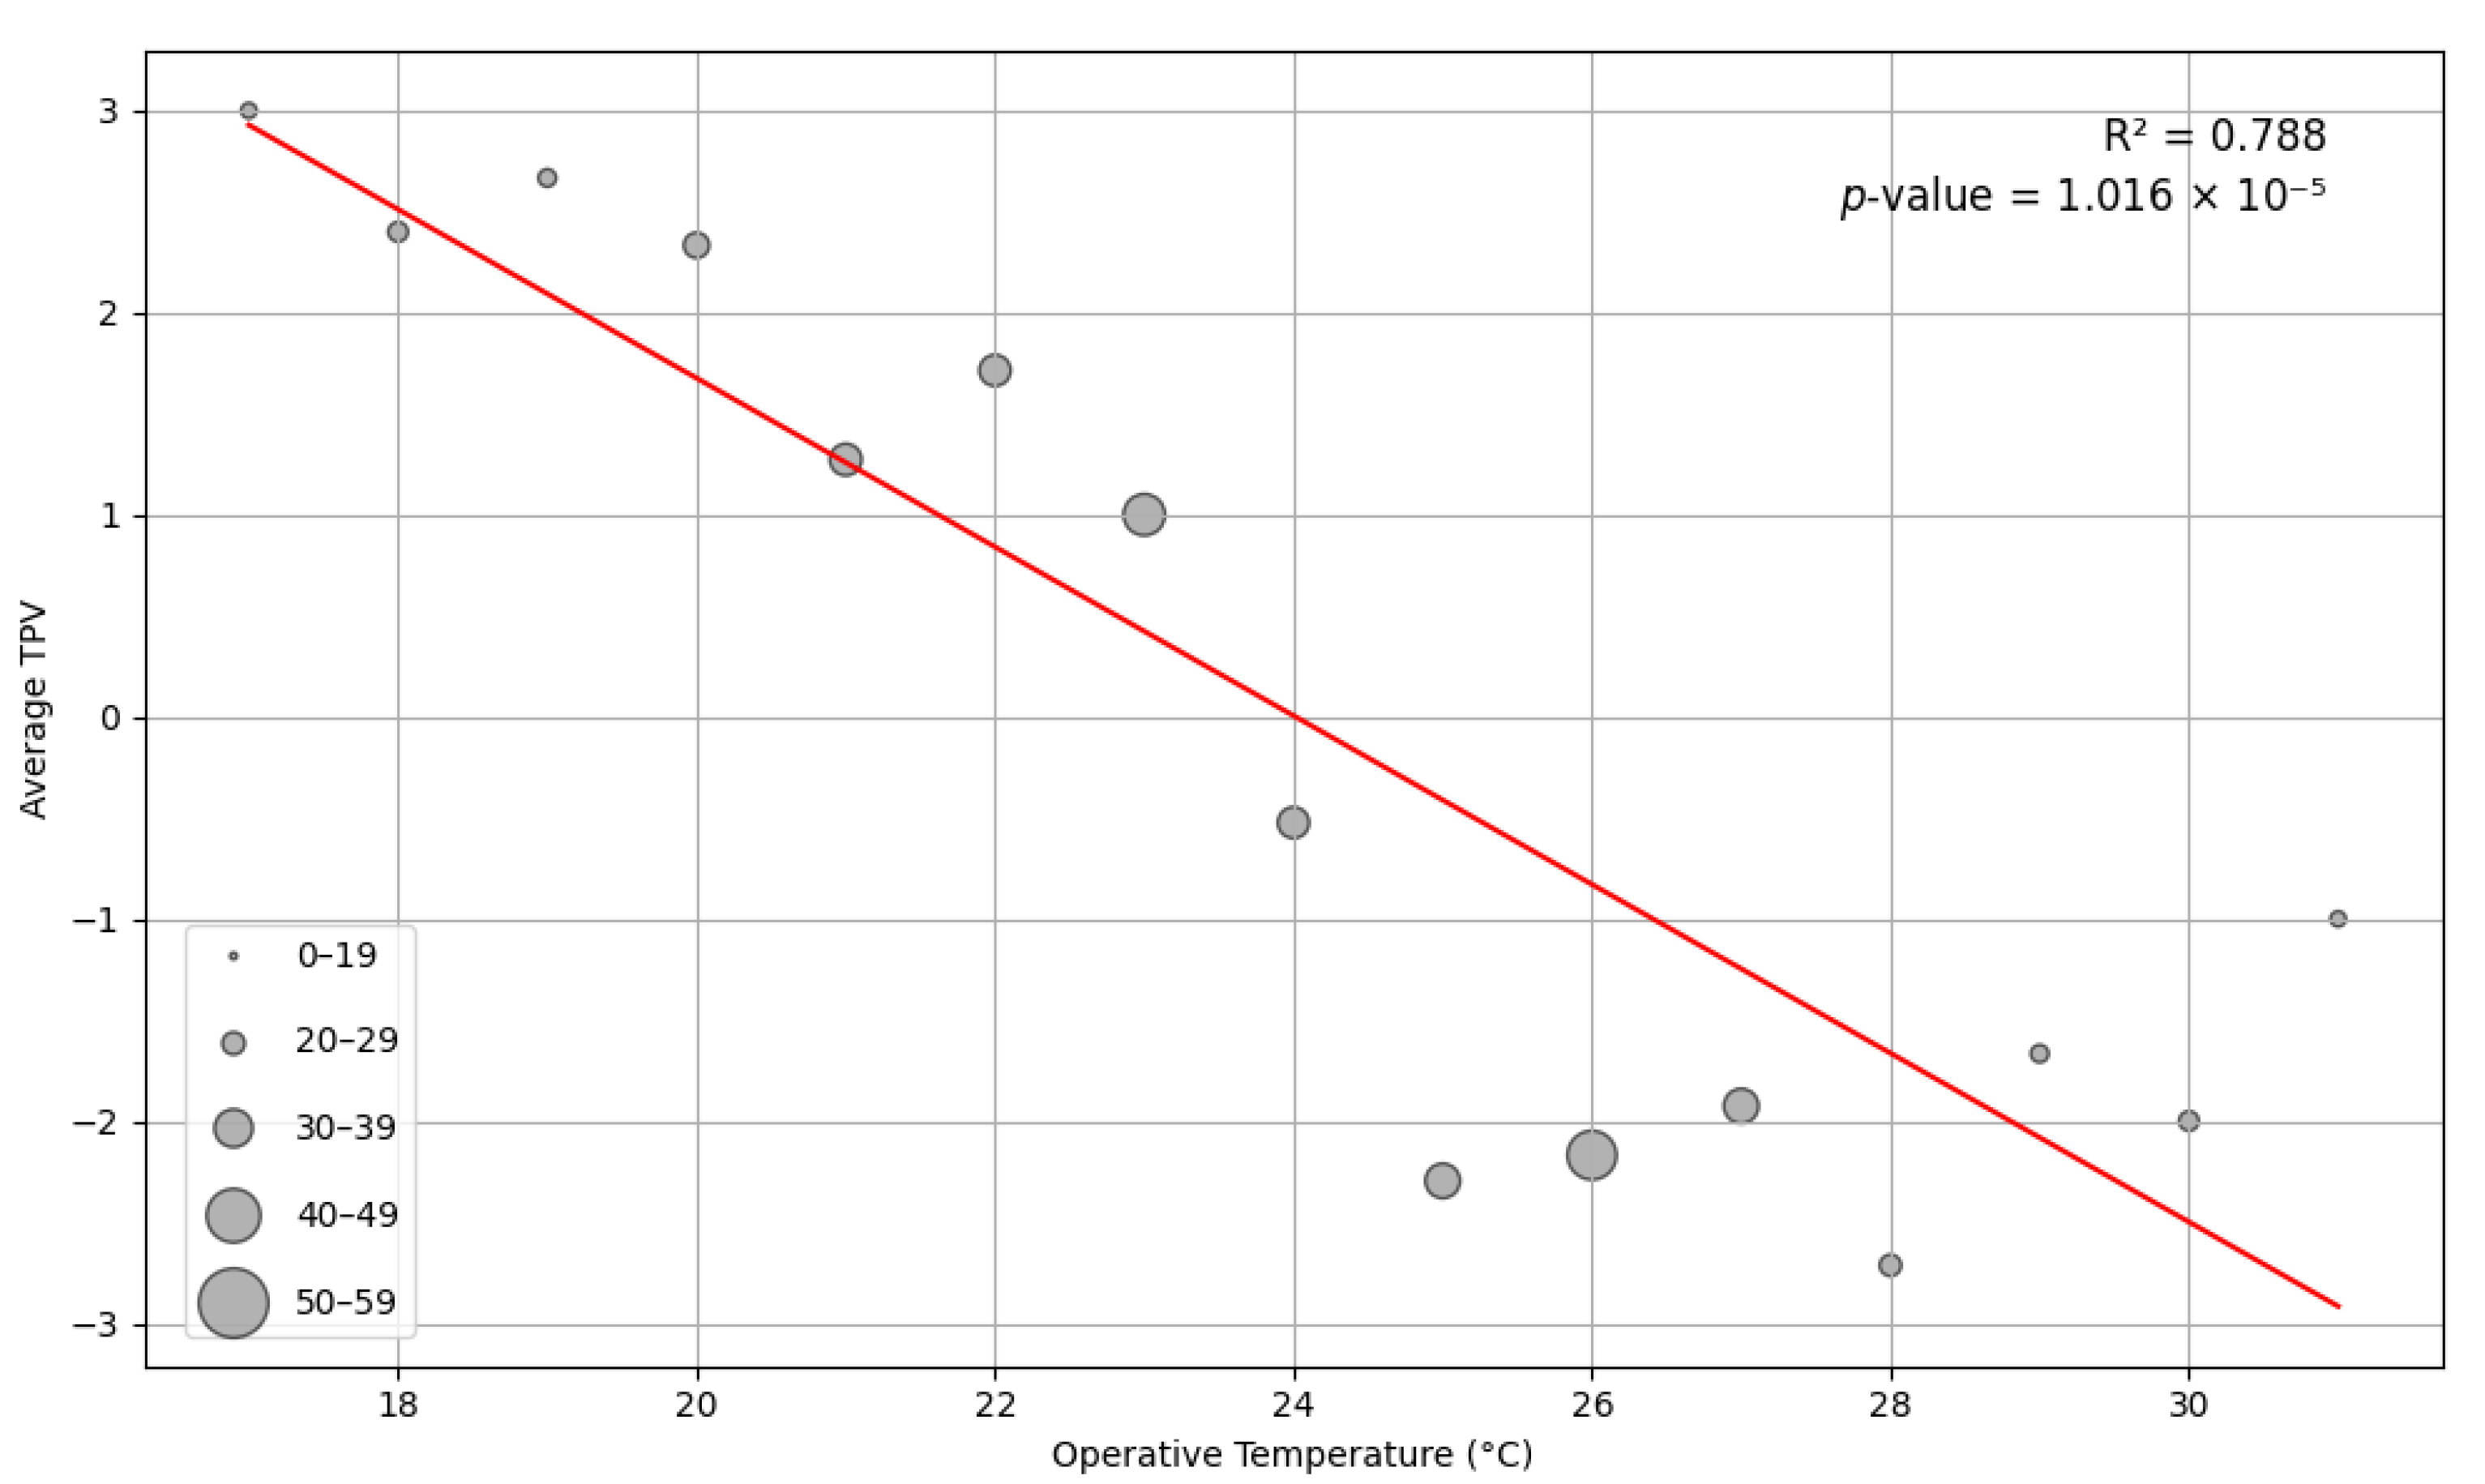
In order to conduct this analysis, it is necessary to have a meaningful data set.
Figure 3, relating to average TPV and operative temperature, depicts how the average thermal perception of participants varies with operational temperature. It shows that 78.8% of the variation in average TPV can be explained by operational temperature, so, given the statistical significance obtained, the study set can be analyzed.
After applying the adaptive comfort equation (Equation (1)) and the associated temperature ranges for the one-year period, the indoor thermal comfort is analyzed hour by hour (
Figure 4,
Figure 5 and
Figure 6), considering the thermal preference of the users. For this analysis, non-working hours, holidays and weekends are excluded. Subsequently, evaluation metrics are calculated to examine the accuracy of the system by defining the following indicators from [
42], but adapted to the case of the analysis with a comfort law applied and on the basis of users’ preferences:
True Comfort (TC): This value is identified when the comfort law applied correctly predicts thermal comfort, that is, when the thermal preference of the users is neutral, slightly cooler or slightly warmer (TPV ∈ [−1,1]). In other words, the system forecasts comfort and it corresponds to the occupant’s thermal sensation.
False Comfort (FC): This value is identified when the comfort law incorrectly predicts thermal comfort, that is, the thermal preference of users is significantly outside the comfort range (TPV ∉ [−1,1]). In this case, the system does not accurately reflect the occupant’s thermal experience.
True Discomfort (TD): This value is identified when discomfort is predicted and the thermal preference vote of the occupant is outside the comfort range (TPV ∉ [−1,1]). In this case, the system aligns with the thermal state experienced by the occupant.
False Discomfort (FD): This value is identified when discomfort is incorrectly predicted, since the occupant’s thermal preference is within the comfort range (TPV ∈ [−1,1]). This suggests that the occupant is experiencing comfort, while the system predicts otherwise. This information is useful for evaluating the possibility of expanding the comfort range for users.
These indicators (
Figure 4) allow the performance of the thermal comfort system or model to be assessed as a function of the occupant’s TPV. Furthermore, the distribution and frequency of these indicators are used to analyze the accuracy and reliability of the system, as well as to assess the validity of the defined comfort ranges.
Table 3 provides a detailed description of the evaluation metrics considered in this study, which are based on the set of indicators previously defined. The metrics selected in this study, such as the percentage of dissatisfaction (PD), precision, recall, accuracy, and F1-score, are typical metrics for evaluating the performance of machine learning algorithms. They were chosen because they allow the analysis of comfort ranges; for instance, in [
44], they were used to analyze users’ thermal sensations based on an adaptive law, and in [
45], they were employed to evaluate the effectiveness of machine learning algorithms for predicting occupants’ comfort experiences. In this study, they are adapted to the analysis of thermal preference in a real-life situation.
The percentage of dissatisfaction (PD) (Equation (2)) identifies the situations when the participants feel uncomfortable (TD and FC). Precision (Equation (3)) comprises predictions of comfort, with the thermal comfort vote of the participants being comfortable, among all the situations when comfort was predicted. That is, the percentage of comfort in the range that, according to the established study interval for the exposed category, should be around 90% of the time (the most restrictive situation, a category I building) and only considering in this study the active period of the building during working hours. Recall (Equation (4)) quantifies true positive indicators with respect to the number of positives. Therefore, it shows the occasions when comfort is predicted and participants feel thermal comfort, regarding all situations when occupants’ thermal sensation is comfortable. This said evaluation metric quantifies the rate of participants in their comfort zone during the sample period identified by the model, overlooking the existing discomfort. Furthermore, it represents the alignment of the considered temperature range (in this case, category I) with the true thermal preference of the participants, showing the possibility of energy saving for the model. Accuracy (Equation (5)) identifies the rate of cases when the considered comfort range and law are successful in their predictions, meaning all correct predictions relative to the total situations of the occupants. It quantifies the success rate of predictions of the adaptive model considered, but it is important to note that balanced results may be related to the representativeness of the metric. F1-score metric (Equation (6)) combines both precision and recall and it gives equal weight to them. Because of this, it is the most relevant metric for evaluating comfort and efficiency together, as it considers both aspects.
These metrics will be calculated and presented in the next section to analyze the evolution of the MM in a room with adaptive settings HVAC.
3. Results and Discussion
In this case study, the results of the evolution of a room in a building in terms of thermal comfort are shown, considering an approach that combines passive actions and an HVAC system with an adaptive law. It is based on the idea that it is feasible to maintain thermal comfort conditions for a significant percentage of the time using only passive actions, leading to the use of HVAC systems for specific moments by adopting the concept of mixed mode “change-over”.
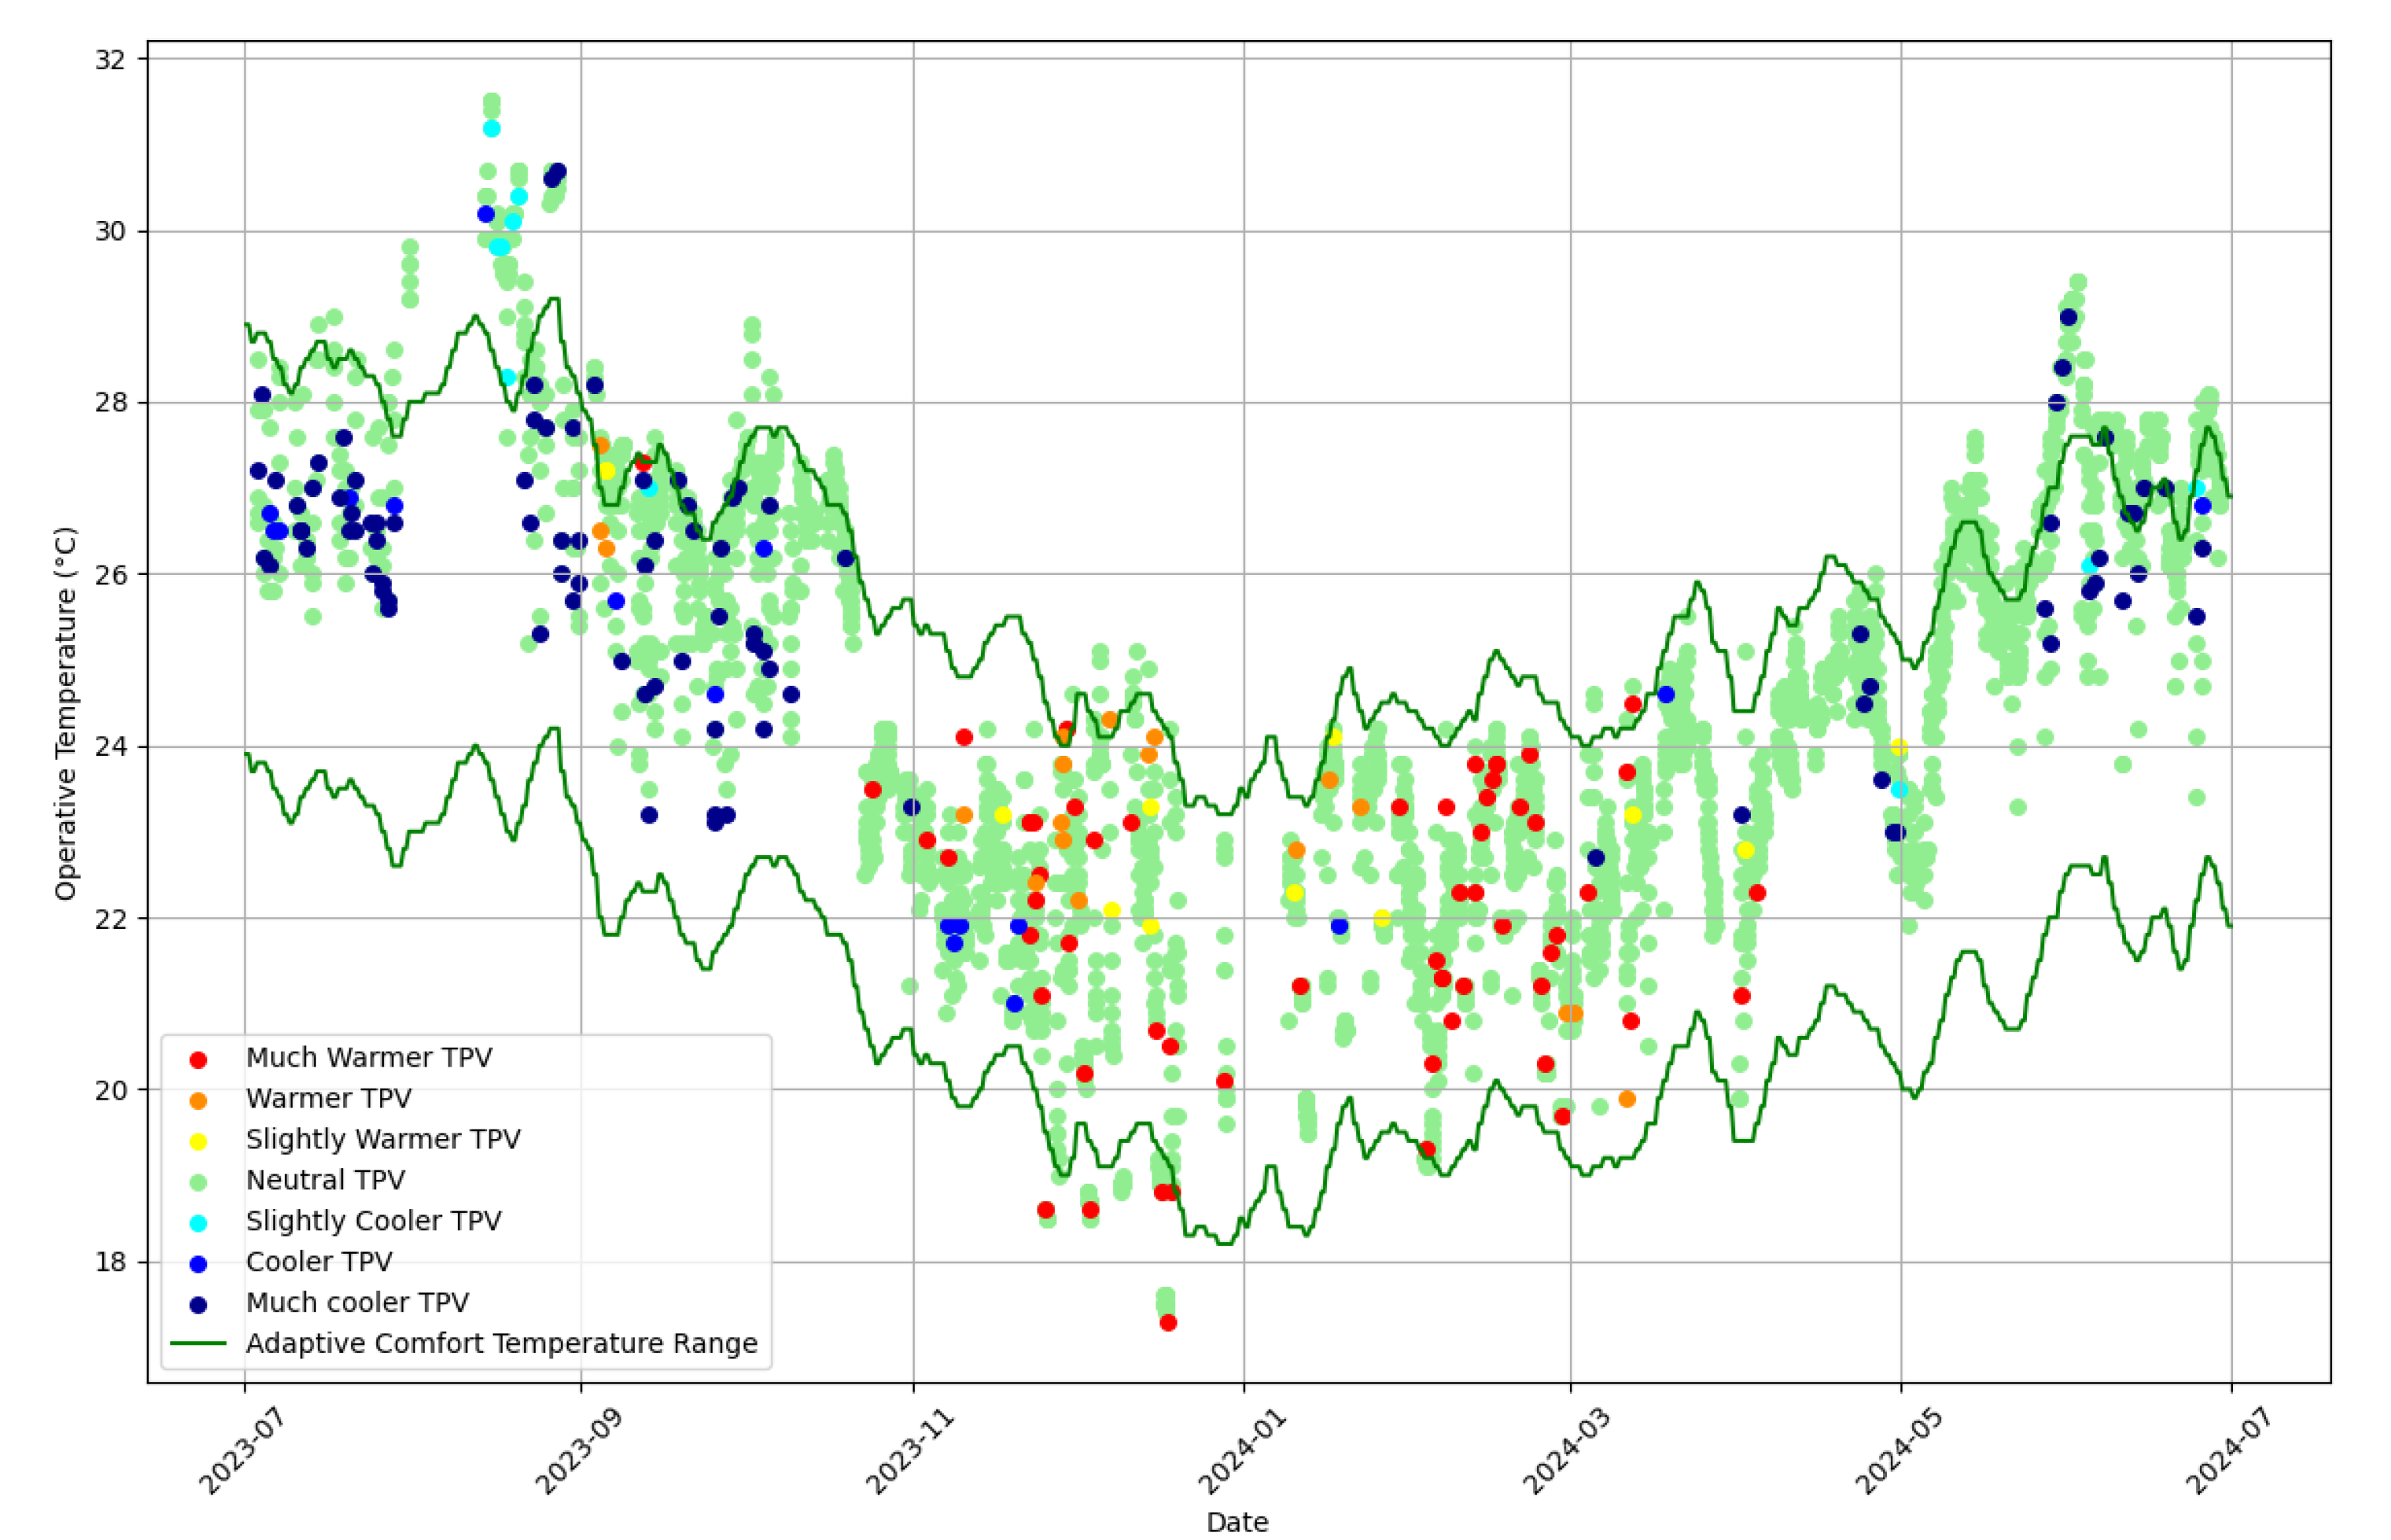
In this context, users play a key role, as they can express their thermal needs without necessarily knowing the building’s predefined setpoint temperatures. In
Figure 5, the adaptive model and the declared thermal preference are presented over the course of a year. Human preference and physical conditions determine thermal comfort and its variation over time, with the year being a relevant period of interest, as seasonal [
46] or climatic factors [
47] can influence preferences regarding cooling and heating.
It can be observed in
Figure 5 that during 93.49% of the hours, users find themselves in a neutral situation or with undeclared thermal acceptability, 86.43% of the assessments are situations of thermal acceptability without the need of the HVAC system (slightly cooler to slightly warmer), and 13.57% of the situations represent a significant thermal preference change that requires the use of the HVAC system as an adaptive measure.
This distribution suggests that during most of the working hours, users are in conditions of comfort or thermal acceptability without the need for adaptive measures. However, 10% of situations require actions to maintain thermal comfort, highlighting the importance of passive strategies or the optimization of HVAC systems during critical periods. Although, based on the adaptive law, the annual variation in the comfort range is observed, the study area during the summer or winter periods shows temperatures outside the range during the working period, due to the influence of the external climate to which the building adapts.
When analyzing the results in
Figure 6, where the terms TC, FC, TD and FD are associated with the metrics shown in Equations 2 to 6, it can be observed in
Table 4 that a PD of 6.5% during the work year and an accuracy of 92.96% have been obtained. This indicates that the model correctly identifies 92.96% of cases in which thermal comfort is predicted within the comfort range. This high value suggests that the proposed temperature range for thermal comfort is quite representative of the real conditions perceived as comfortable by the occupants.
It is important to note that the proportion of TC, FC, TD and FD varies throughout the year due to seasonal factors. In particular, from July to September, a higher level of thermal discomfort (TD and FD) is observed. This is mainly due to temperature characteristics during these months, which can exceed the limits of the proposed thermal comfort range.
The recall, 82.52%, shows that the model correctly identifies 82.52% of cases in which thermal comfort was actually experienced within the defined range. Although this value is lower than the accuracy, it remains high, indicating that the model identifies a significant proportion of real comfort cases, although it may miss some (false negatives). It is also important to note that although the recall value, 82.52%, could reflect a certain omission of comfort cases, such a result is directly related to the use of a more restrictive comfort range in this study, defined as +2/−3 °C. While the UNE-EN 16798-1 standard also considers a wider comfort range (+3/−4 °C), the narrower range was intentionally selected to evaluate the model under stricter conditions. This approach provides valuable insights into the trade-offs between adhering to high comfort standards and achieving energy efficiency.
The accuracy, which measures the overall percentage of correct predictions of all predictions made, is 77.81%. This result shows that the model performs acceptably in general when making predictions for all possible responses of the occupants.
Finally, the F1-Score, which balances precision and recall, is 87.43%. This value is relevant because it combines the model’s ability to correctly identify comfort cases (recall) and avoid incorrect predictions (precision). A high F1-Score suggests a good balance between these factors, ensuring the reliability of the model, both from the perspective of occupant thermal comfort and potential energy savings.
The adaptive model implemented and integrated into the BMS has proven to be effective when improving thermal comfort and presents considerable energy-saving potential. When analyzing the hours of HVAC system usage throughout the year (13.57% in global terms), it is observed that most thermal discomfort occurs during July and August, as shown in
Figure 7a, along with a significant increase in HVAC system usage, according to
Figure 7b.
It is important to note that the data is presented in percentage terms. During the month of July, university activity is mainly concentrated in the morning and it extends into the hottest hours of the day, when outdoor temperatures reach their maximum value, entailing an increase in HVAC system usage. In the case of August, although the building had very few days of occupancy due to the vacation period, HVAC system usage remains relevant to ensure thermal comfort on specific days of activity, where the HVAC system is employed as a complement to natural ventilation to maintain the thermal environment within acceptable limits.
The “change-over” mixed mode suggests that it is feasible to operate a significant percentage of the time using only passive ventilation, with conditioning systems serving as backup at certain moments. The presented metrics allow for an analysis of the actual behavior after applying the adaptive comfort law as a guideline and as an adaptive action, while the office space operates under free behavior, meaning the user has the freedom to take adaptive actions such as using the HVAC, opening windows, or changing clothes. The MM building functioned as a passive building, temporarily accepting temperatures between 18 and 30 degrees. In the case study, if users were uncomfortable, the system acted to improve user temperature within the adaptive comfort range for a maximum of 2 h, with the adaptive guideline as the objective. The results suggest that occupants tend to feel slightly better during an NV-AC mode change event, but do not require high use of the HVAC systems as a thermal solution. In this case study, a period of 10% of the year sufficed.
Figure 5 shows that it is possible to allow indoor temperatures to vary within acceptable limits based on adaptive comfort, being more energy efficient while still ensuring thermal comfort for the building’s users. In case comfort limits are exceeded, occupants tend to use the HVAC system, but it can be turned on intermittently to maintain temperatures within the standards of adaptive comfort. In some cases, users did not activate the system, but the width of the range and the comfort law appear to be a more appropriate alternative compared to the fixed setpoints of a controlled HVAC system.
The results obtained align with those stated by [
26,
48] who stated that “
Naturally ventilated buildings afford their occupants greater degrees of thermal control than air-conditioned buildings,
and that this sense of control leads to a relaxation of expectation and greater tolerance of temperature excursions” (p. 17). The same criteria are proposed in the present study by relaxing expectations to a setpoint based on adaptive law. The occupants in the case study, working in a mixed mode building, show more control regarding the indoor environment but to a setpoint limited to the adaptive law. However, options may be somewhat limited during severe climate conditions or significant variations in running mean temperature due to the delay in learning (depending on the alpha, α, selected for its calculation), which influences the indoor environment. These effects may be difficult to overcome through operable windows and passive solutions compared to active ones, since the delay in learning can affect system behavior. As Humphreys et al. [
49] pointed out, a sudden change in outdoor temperature entailed that it would take several days for the indoor temperature to adopt its new value. For example, for an α of 0.8, the indoor comfort temperature would reach half of its new value in more than three days and three-quarters of said value in one week. This highlights the relationship between the adaptive capacity of the system and the weight assigned to recent data in the calculation of the running mean temperature. The combination of adaptive approaches and automation in the regulation of indoor environments can significantly enhance performance, minimizing the impact of abrupt changes in outdoor conditions.
Finally, this case study aligns with the proposal of Kim and De Dear [
36] to analyze how occupants’ comfort perception is affected by the operational mode within an MM building. In this case, the MM building is analyzed with an HVAC system integrating a manually used adaptive setpoint. The present work provides an initial approach to the impact of the operational mode on comfort preference in buildings with adaptive HVAC systems. However, several limitations remain to be addressed and future directions could delve deeper into these aspects, as discussed in the following section.
4. Conclusions
The integration of adaptive algorithms based on thermal adaptive behavior is a feasible solution for buildings. Although further studies on thermal comfort and preference are necessary when these guidelines are applied within a building, this study highlights that the percentage of HVAC system usage is low due to a declared preference that differs from the natural behavior of the building or as a result of adjustments through other adaptive measures.
The present work carried out a field study in an office room for a year, collecting the operational mode of said room and carrying out a survey regarding the thermal preference of the users, although they were required to use the HVAC with a previously defined adaptive setpoint. As for the main conclusions of the work, they are exposed below.
The analysis of 2859 working hours and 1320 records of thermal preference showed statistically significant TPV responses, with a low percentage of discomfort situations in a Mediterranean climate. The hourly evolution of thermal preference during a working period over a year reveals that in 93.5% of the hours, users are in a neutral or unexpressed thermal acceptability situation. A rate of 86.7% of evaluations correspond to thermal acceptability situations without the need for using the HVAC system (slightly cooler or warmer conditions). Only 10% represent significant thermal preferences requiring the HVAC system as an adaptive measure where the integration of an adaptive law as a setpoint allows for proper building operation, aligning with supporting future proposals for the integration of adaptive setpoints in mixed-function buildings.
The results obtained reflect a model with a good balance between precision (92.96%) and F1-Score (87.43%), indicating the model’s ability to correctly identify thermal comfort in most cases while minimizing incorrect predictions. Although recall (82.52%) and accuracy (77.81%) are slightly lower, the model demonstrates an overall acceptable performance, suggesting that it is suitable for assessing and ensuring the perceived thermal comfort of occupants. These results highlight its potential to optimize both user experience and energy savings, ensuring an accurate representation of the thermal comfort range in real conditions. Additionally, it would be interesting to develop future individual or group learning proposals that could refine the results and further improve the model’s capacity to adapt to the specific needs of occupants and changing environmental conditions.
Limitations and Future Directions
Longitudinal studies over a year pose a challenge due to the time required for them, making it difficult to develop studies with such large samples as in point-in-time studies. Therefore, more studies are needed on the real applications of adaptive comfort algorithms in buildings with larger samples. The study of perceived control over environmental conditions should be further explored to examine whether it could significantly improve the thermal experience without the restrictions of two-hour interruptions considered in the present work or by reducing it. Furthermore, the behavior of users in an adaptive environment should be analyzed in relation to thermal monotony, as indicated by [
20]. Moreover, a more in-depth study regarding specific adaptive actions of the users would be worthy of investigation in future investigations.
Results could be optimized following the lines proposed in studies such as those of Zhao et al. [
50], which suggest a framework for personalized HVAC control. Said model integrates environmental and human data to address the diverse users’ thermal preferences. In this regard, it highlights the importance of considering both the mode and the optimal setpoint of a room, evaluating the human and environmental factors involved. Another line of analysis could focus on the examination of the semantic artifact hypothesis [
24], according to which people tend to prefer warmer temperatures in cold climates and cooler temperatures in warm climates. In the case of this study, summers are warm and winters are mild, with a significant tendency towards cooler temperatures in summer than warmer in winter. This approach has been explored in previous research and could provide a deeper understanding of thermal control strategies based on cultural and climatic factors.
In summary, incorporating these perspectives could significantly enrich HVAC control strategies, while contributing to more efficient and personalized systems capable of meeting the thermal needs and preferences of a diverse population.


