1. Introduction
Time series forecasting is a critical challenge with significant practical implications across various domains, such as economics, energy, weather, traffic monitoring, and healthcare [
1,
2,
3,
4]. The field of economics, in particular, has demonstrated a longstanding interest in accurately predicting economic time series data. Financial markets, which inherently generate data in time series form, have been extensively studied over the past decades. The primary goal of these studies has been to uncover deeper insights into market trends. As researchers gain a better understanding of market behaviors, they are increasingly able to develop more effective investment strategies, thereby enhancing financial decision-making processes. However, the efficient market hypothesis (EMH) [
5] posits that asset prices reflect all available information, theoretically rendering them unpredictable, as new data are instantly assimilated. Despite this, practical forecasting efforts continue to show that financial markets are indeed a combination of efficient and non-efficient markets, suggesting that they are, to some extent, predictable [
6,
7].
Time series forecasting primarily aims to project future values based on historical data, often exploiting repeating long-term or short-term patterns inherent in the data. Over the years, the field has explored various methodologies to capture these patterns, including linear and nonlinear time series models, and artificial intelligence techniques. However, in the economic field, the characteristics of data present unique challenges that complicate the application of these models. Firstly, financial data are highly volatile and can exhibit extreme value changes, which undermines the assumption of stable patterns over time [
8]. Secondly, compared to other types of time series, financial data typically exhibit more complex seasonality and more variable trends [
9]. This variability is often exacerbated by sudden and unpredictable events, adding a layer of complexity to the forecasting. These factors make economic forecasting particularly challenging.
Different approaches for economic time series forecasting have been explored, ranging from econometric theory and statistical methodologies to artificial intelligence models. Statistical methods, such as the autoregressive integrated moving average mbox(ARIMA) model [
10,
11] and the semi-functional partial linear model [
12], have also been employed in this field. These models benefit from a solid mathematical foundation and offer strong interpretability [
13], but their predictions are often imprecise due to the nonlinear and irregular nature of economic data.
In response to the complexity of economic time series, neural networks and support vector machines (SVM) have demonstrated considerable success in modeling non-linear relationships, offering robust alternatives to traditional linear models [
14]. Furthermore, recurrent neural networks (RNNs) and long short-term memory (LSTM) networks have become particularly prevalent due to their ability to effectively extract time dependencies from time series data, thanks to the memory features obtained from their feedback mbox mechanisms [
15,
16]. More recently, transformer-based models have emerged for this task, employing attention mechanisms capable of learning global context and long-term dependencies, thus enhancing the depth of time series analysis [
17,
18].
As deep learning expands its application in time series forecasting, the integration of natural language processing (NLP) techniques is increasingly transforming economic predictions. Textual data, available in real-world economic time series forecasting applications, often contain nuanced information that may surpass the insights provided by numerical financial series alone [
19]. Recent studies have begun using textual data in economic forecasting models to capture these additional insights. For instance, some models analyze large volumes of financial news to identify sentiments and factual information that may affect investor behavior and market trends [
20].
In financial market forecasting, Farimani et al. [
21] propose generating sentiment-based features over time and combining them with time series data to improve predictions. Similarly, Reis Filho et al. [
22] focus on agricultural commodity prices, using a low-dimensional representation of domain-specific text data enriched with selected keywords, which addresses issues of high dimensionality and data sparsity, improving forecast accuracy. Baranowski et al. [
23] take a different approach, developing a tone shock measure from European Central Bank communications to predict monetary policy decisions. In cryptocurrency forecasting, Erfanian et al. [
24] apply machine learning methods such as SVR, OLS, ensemble learning, and MLP to examine how macroeconomic, microeconomic, technical, and blockchain indicators relate to Bitcoin prices over short and long terms. These studies show how NLP can enhance time series forecasting by integrating textual data with traditional economic indicators.
These studies demonstrate the potential of natural language processing (NLP) to enhance time series forecasting by incorporating textual data alongside traditional economic indicators. However, most existing approaches simplify the complexity of textual data by focusing on specific aspects, such as sentiment polarity, tone, or keyword-based representations, neglecting the rich, nuanced information embedded in the full text. This narrow scope limits their ability to capture the non-linear and qualitative impacts of news and other unstructured data sources. Incorporating comprehensive news content into financial forecasting can enhance datasets by introducing additional contextual information, improving the adaptability and accuracy of predictive models. Such an approach allows models to better reflect real-world dynamics, capturing the multifaceted interactions that drive market behavior. Therefore, a more comprehensive framework is required to address these challenges, leveraging both unstructured textual data and structured time series to establish a robust and realistic forecasting methodology.
This paper introduces a novel approach to economic time series forecasting that integrates textual information directly into the predictive framework as an additional variable. Unlike sentiment-centric methods, this approach fully leverages the richness of textual data, such as economic news and reports, to extract predictive signals absent from numerical data alone. By treating textual data as an extension of time series variables, the proposed method provides a unified framework for modeling the interplay between textual and numerical inputs. The primary contributions of this study are as follows:
- (1)
Multimodal Attention-Based Integration: The proposed method employs an inverted attention mechanism to directly model interactions between textual data and multivariate time series. By treating text as an additional variable, the model captures intricate relationships between historical price movements and textual information, enabling more accurate and robust economic forecasts.
- (2)
Seamless Integration of Textual and Numerical Data: This study utilizes matched historical price and news datasets to construct multimodal datasets. By combining the contextual depth of textual data with the temporal patterns of price data, the proposed method enhances forecasting performance.
- (3)
Comprehensive Experimental Validation: Extensive experiments on economic datasets demonstrate the effectiveness of the proposed approach. Results highlight the model’s ability to outperform traditional forecasting techniques by leveraging both textual and numerical inputs, offering deeper insights into market dynamics.
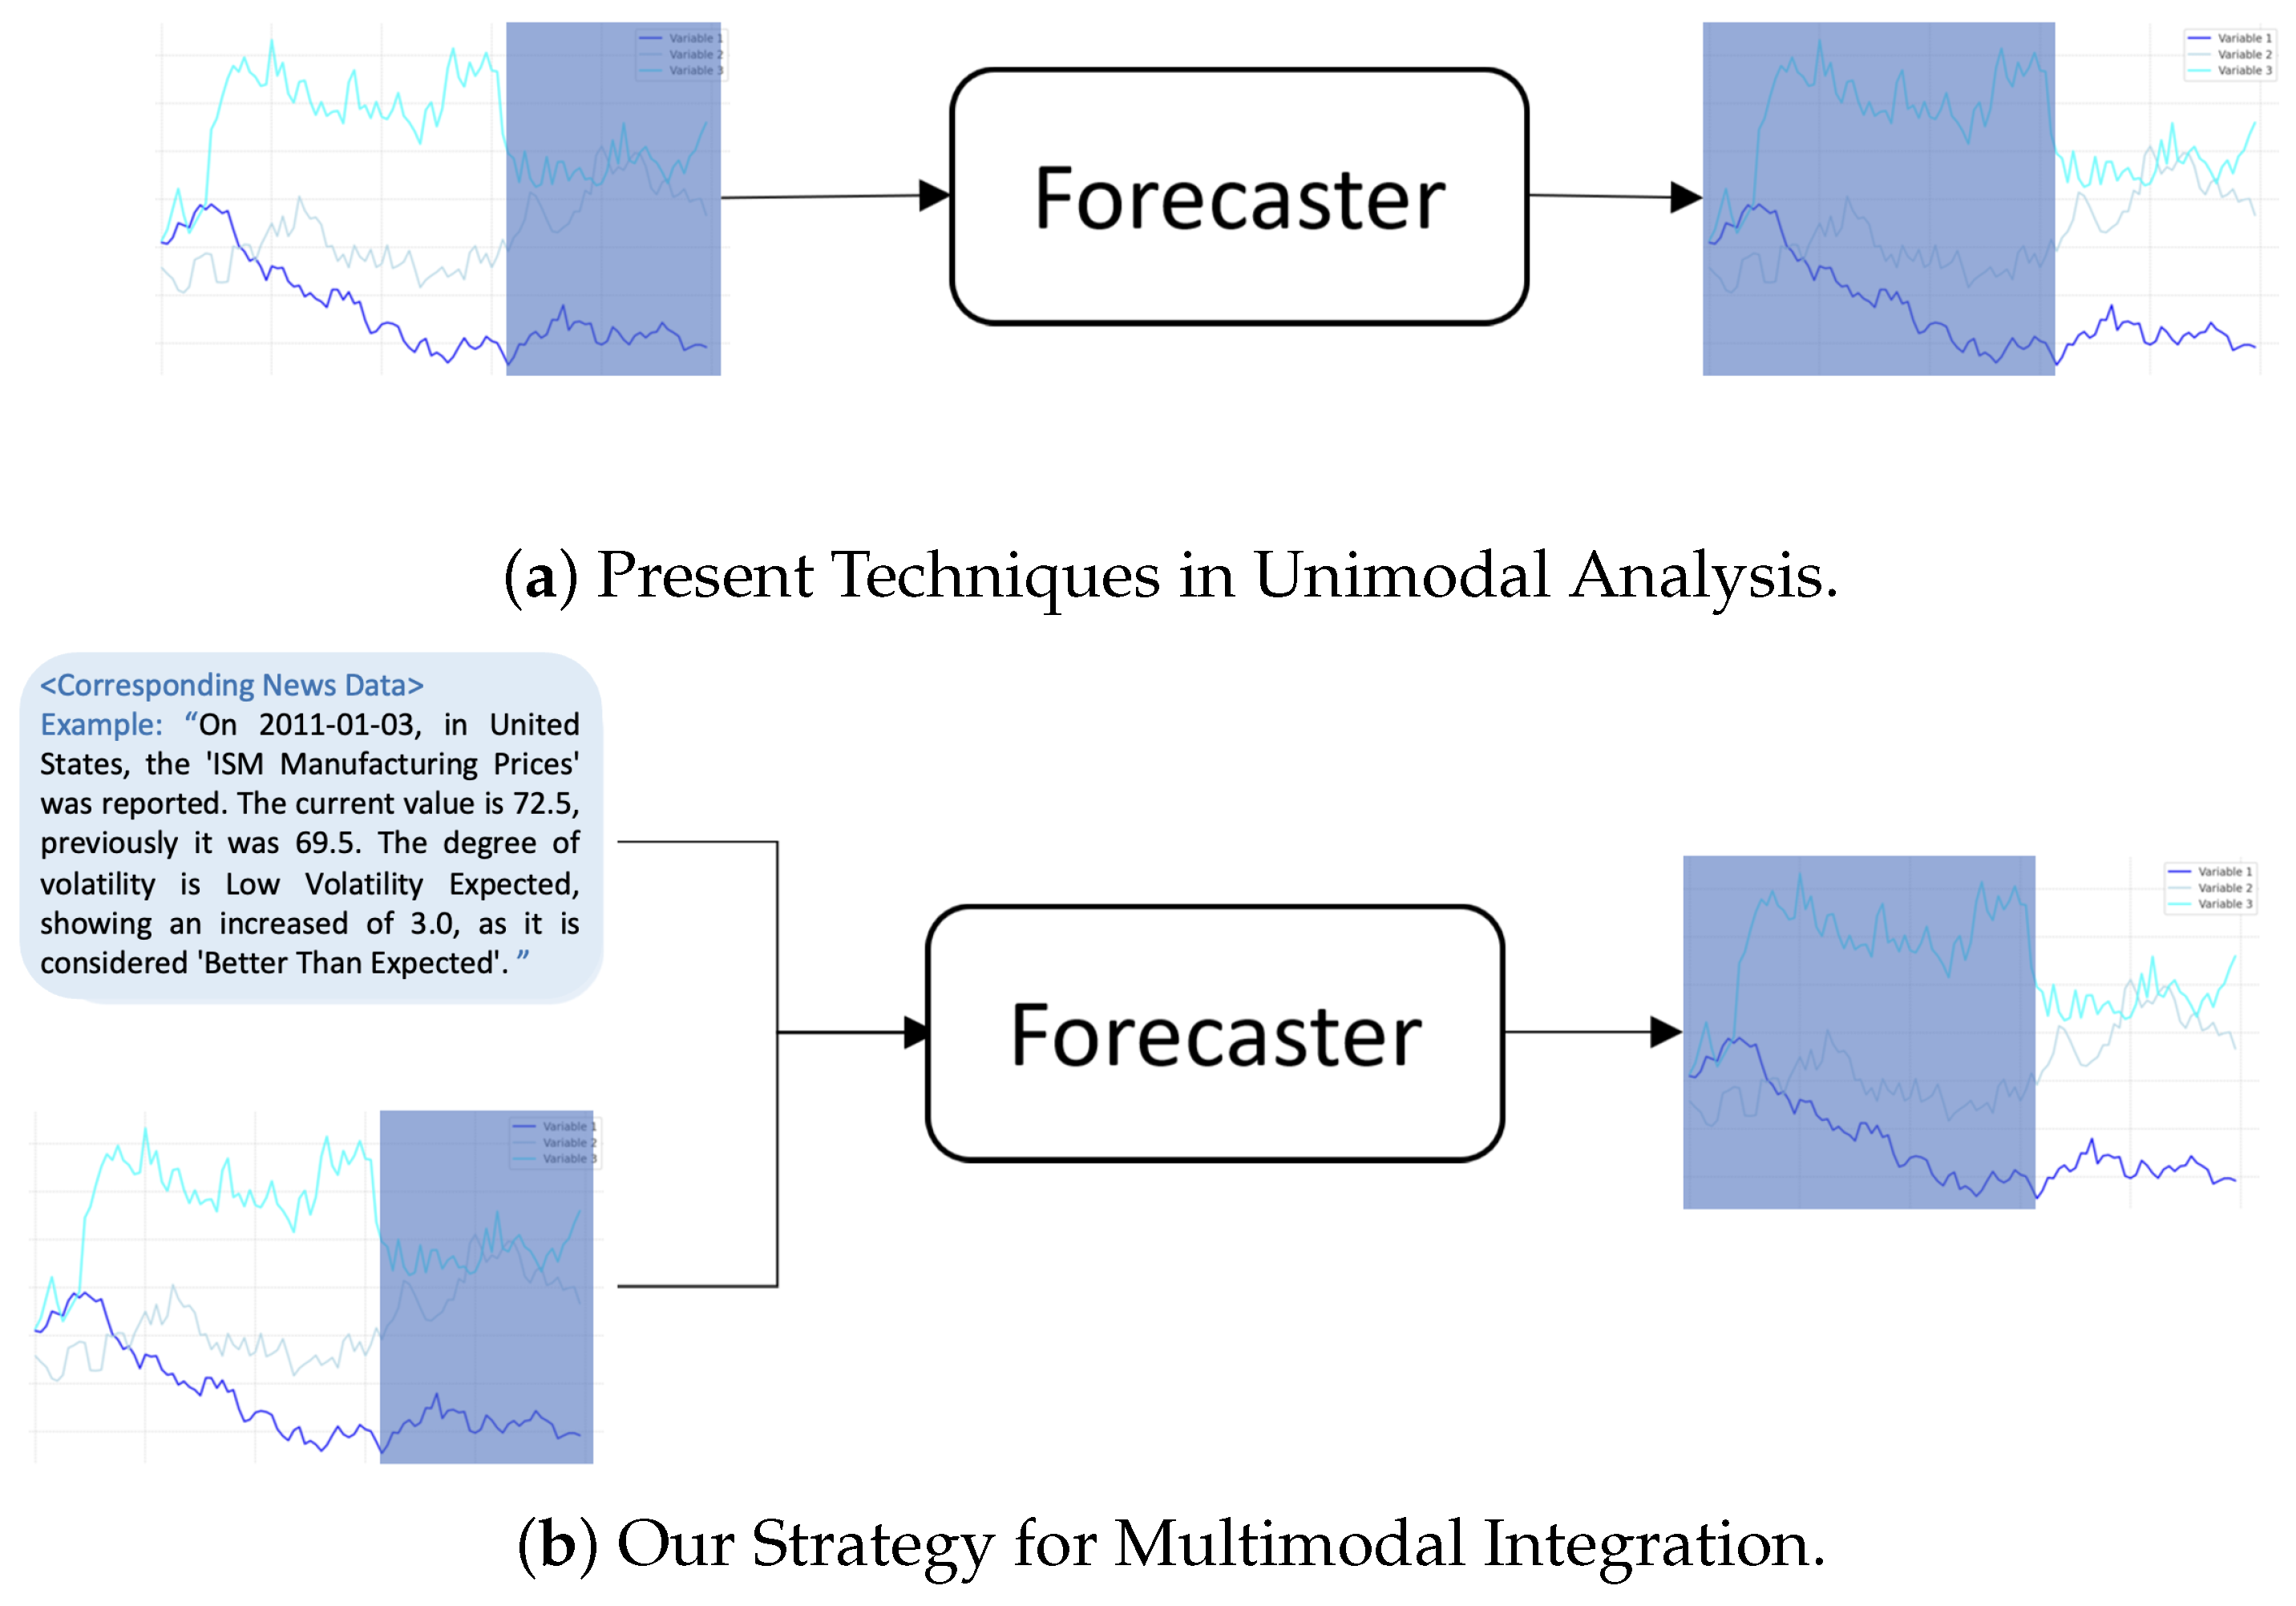
Figure 1 compares (b) our multimodal learning method with the existing (a) unimodal approach, demonstrating how this integration enhances the model’s ability to utilize diverse data sources and extract valuable insights, thereby improving the accuracy of time series forecasting.
The remainder of this paper is organized as follows:
Section 2 provides a detailed exploration of existing methods in time series forecasting.
Section 3 describes the proposed method and outlines the framework in detail.
Section 4 discusses the dataset, presents the experimental results, and explores some notable findings. Finally,
Section 5 concludes the paper.
3. Proposed Method
3.1. Problem Definition
The multivariate economic time series forecasting problem can be formulated as follows. Given historical time series data denoted as , where L is the fixed historical window, c is the number of variates, and denotes the value of the variate at time step. The forecasting task aiming to figure out the predicted series , where c denotes the number of variates, is the predicted result of the variate at the time step t, and H denotes the number of forecasting time steps. The ground truth for the time period from to is denoted as .
3.2. Proposed MM-iTransformer Framework
We propose MM-iTransformer, where MM stands for multimodal, to overcome the limitations of existing time series forecasting models. This framework integrates textual embeddings derived from financial news and numerical embeddings from historical prices, providing a robust cross-modal approach to enhance predictive performance in economic applications (see
Figure 3).
FinBERT for Textual Embeddings: To incorporate rich semantic information from financial news, we utilize FinBERT [
37], a language model fine-tuned specifically for financial text. Unlike traditional sentiment analysis approaches, FinBERT captures nuanced financial terminology and contextual insights from complete news articles.
Given a set of historical news articles
within a historical window of length
L, each article
, which is composed of a word sequence, is processed through FinBERT to obtain its contextualized embedding. Specifically, we extract the [CLS] token’s last hidden state from FinBERT’s output, resulting in a d-dimensional vector
that represents the overall context of the news at time
t. This process yields a sequence of textual embeddings, as defined in Equation (
1):
Each embedding encapsulates the semantic and contextual information of the corresponding news article, effectively capturing critical financial insights that may influence market movements.
Integration with Time Series Data: The core of MM-iTransformer lies in effectively integrating the textual embeddings
with the historical time series data. The historical price data
are embedded using Inverted Embed of iTransformer. Specifically, we describe these data as
, where c is the number of numerical variables (e.g., different financial indicators). Our goal is to learn a function F that maps these inputs to future forecasts as shown in Equation (
2):
Here, represents the predicted future values over a forecast horizon H. To integrate textual and numerical data, we treat the textual embeddings as additional variate tokens, similar to how variables are represented in the inverted perspective of the iTransformer framework. This alignment allows us to leverage the attention mechanism to model cross-modal relationships effectively.
Cross-Attention Mechanism: The combined input consists of both numerical and textual embeddings concatenated along the variate (feature) dimension:
In the cross-attention mechanism, we compute the query (
Q), key (
K), and value (
V) matrices using learned weight matrices as shown in Equations (
4), (
5), and (
6), respectively:
Here, and are learnable weight matrices for the queries, keys, and values, respectively. These matrices project the input features into appropriate representation spaces for attention computations. Note that and are distinct from the dimension d used for textual embeddings, as they specifically define the sizes of the query, key, and value projections within the attention mechanism:
: The total number of variates, where c represents the numerical variables, and 1 represents the additional textual variable.
: The dimensionality of the projected query, key, and value vectors within the attention head h. These dimensions control the representation capacity of the attention mechanism, influencing how relationships between input features (both textual and numerical) are modeled and how information is aggregated into output representations.
The attention scores are computed using the scaled dot-product attention mechanism proposed in [
38], which evaluates the relevance between queries and keys. This mechanism enables the model to weigh the importance of each feature (both textual and numerical) when making predictions, effectively capturing cross-modal interactions between financial news and historical price data.
Balanced Contribution of Modalities: To prevent richer textual embeddings from dominating the learning process and overshadowing numerical data, we implement a strategy to balance the contributions of both modalities.
Selective Incorporation of Textual Data: We include only the most recent news articles in the textual embeddings. Given that the latest news tends to have the most significant impact on future market movements, this approach reduces the noise of older articles and focuses the model on the most relevant information.
Dimension Alignment: A linear layer is applied to the textual embeddings, adjusting their feature dimension to align with that of the time series embeddings. This ensures that, although the number of variables may differ between modalities, they can be directly concatenated along the variate dimension without any dimensional mismatch.
The combined embeddings are then fed into the MM-iTransformer model, which processes them through multiple layers of attention and feed-forward networks to produce the final forecasts
. The details are outlined in Algorithm 1.
| Algorithm 1 Modalities fusion under the MM-iTransformer framework. |
Input: Time Series Data: ,
Output: Future Forecasting H steps:
1: Process Text Data:
2: FinBert.Embed().
3: Linear(d, L)(TextEmb)
4: Process Time Series Data:
5: for to C do
6: Inverted Embed()
7: end for
8: Combine Embeddings:
9: Concatenate()
along the variate dimension
10: Apply iTransformer Model:
11: Load iTransformer model with appropriate configurations
12: for to do
13: iTransformer.Projection(CombinedFeatures)
14:
15: end for
16:
17: return
|
4. Experiment
4.1. Datasets
In the economic domain, despite the abundance of news text and historical pricing data, there is a notable lack of publicly available datasets that directly correlate these two types of information, especially in analyzing the impact of textual news on economic indicators. To validate the ideas presented, we develop two specialized datasets: one focusing on Gold-price and the other on foreign exchange (Forex).
4.1.1. Gold Price Forecasting Dataset
For the first dataset, we utilize a publicly available Kaggle repository entitled “The Effect of Economic News on Gold Prices” (
https://www.kaggle.com/datasets/fekihmea/the-effect-of-economic-news-on-gold-prices/data (accessed on 23 January 2025)). This dataset comprises two primary components: (i) historical gold-price data spanning from January 2019 to December 2023, capturing daily market dynamics and highlighting the evolving trends that shape gold’s valuation; and (ii) an economic calendar detailing significant events over the same period from key global participants—including Canada, Japan, the United States, Russia, the European Union, and China. By integrating these two data streams, the dataset provides a comprehensive perspective on how economic news from these influential regions influences the highly volatile gold market.
Key Variables in the Dataset: The primary structure of the dataset utilized in this study is as follows:
Historical Gold Prices:
- –
Date: The specific date corresponding to the recorded gold price.
- –
Price: The daily closing price of gold.
Economic Calendar Data:
- –
Date: The exact date of the anticipated or actual economic event.
- –
Country: The country associated with the economic event.
- –
Event: A concise label for the specific economic indicator or event (e.g., inflation rate release and unemployment rate).
- –
Actual: The real reported value of the economic indicator for the current event.
- –
Prior: The most recently released value of the same economic indicator for comparison.
Textual Description Generation: The economic calendar data, illustrated in
Table 1, contain various events, numerical values, and dates. However, these raw data formats are not directly usable by language models, which are designed to process natural language text. To make these data compatible, we generate textual descriptions for each economic event using a standardized template. These descriptions include the event’s date, name, the reported value, and its deviation from prior or consensus values, enabling clearer interpretation by language models. For example, “On 01/01/19, the Caixin Manufacturing PMI for December was reported at 49.70, down from the previous value of 50.20, indicating a decrease of 0.50”. This approach transforms tabular numerical data into concise, natural-language summaries, enhancing the dataset’s utility for language-based analyses.
Data Alignment and “No News” Filling: To integrate textual descriptions with historical gold price data, we align each event-based description to the corresponding trading date in the price dataset. For dates without economic events, we fill the gap with the placeholder phrase “no news” to ensure temporal consistency. This approach guarantees that every date in the Gold-price dataset has a corresponding textual entry, maintaining completeness and coherence in the resulting data structure.
Resulting Samples: The integration of historical gold prices with textual economic event descriptions produces a dataset of 1352 samples. Each sample consists of the following:
Date: The trading day associated with the gold price and any economic news.
Gold Price: The recorded closing price of gold on the specified date.
Economic News Description: A one-sentence summary of the economic event(s) released that day, or the placeholder phrase “no news” for days without scheduled announcements.
This curated dataset encapsulates the intricate interplay between global economic events and gold price fluctuations, offering a granular perspective on market behavior. By synthesizing structured numerical data with natural language descriptions, the dataset provides an invaluable resource for examining temporal patterns, identifying key correlations, and understanding the role of economic news in shaping financial market dynamics.
4.1.2. Foreign Exchange Forecasting Dataset
For the second dataset, we consolidate data from two distinct Kaggle sources. The first, titled “Economic Calendar Invest Forex” (
https://www.kaggle.com/datasets/devorvant/economic-calendar (accessed on 23 January 2025)) serves as an extensive archive of significant economic events, news, and volatility assessments, focusing on the economies of developed nations, especially the United States, Britain, and Japan, due to their profound influence on global forex markets. This dataset includes critical economic indicators and historical data publications. The second source, “Foreign Exchange Rates 2000–2019”, (
https://www.kaggle.com/datasets/brunotly/foreign-exchange-rates-per-dollar-20002019 (accessed on 23 January 2025)) produced by the Federal Reserve’s Data Download Program, features a comprehensive time series of foreign exchange rates per dollar for multiple countries.
Key Variables in the Dataset: The primary structure of the dataset utilized in this study is as follows:
Foreign Exchange Data:
- –
Date: The specific date when the foreign exchange rate was recorded.
- –
Japan exchange: The exchange rate of the US dollar against the Japanese yen.
- –
Euro exchange: The exchange rate of the US dollar against the Euro.
- –
UK exchange: The exchange rate of the US dollar against the British pound.
Economic Calendar Data:
- –
Date: The exact date of the anticipated or actual economic event.
- –
Country: The country associated with the economic event.
- –
Volatility: The expected impact of the event on currency or indexes.
- –
Event: A concise summary of the economic event.
- –
Assessment: Evaluation of the event’s outcome compared to forecasts—better, worse, or as expected.
- –
Actual Data: The actual data reported for the event.
- –
Prior Data: Previous data related to the event, with notes on any interim changes.
Textual Description Generation: Similar to the Gold-price dataset, the economic calendar data for the Forex dataset are converted into natural language summaries to make them suitable for language models. For example, “On 2011-01-03, in United States, the ‘ISM Manufacturing Prices’ was reported. The current value is 72.5, previously it was 69.5. The degree of volatility is Low Volatility Expected, showing a increased of 3.0, as it is considered ‘Better Than Expected’”. This method transforms raw numerical data into concise, contextual summaries that enhance the dataset’s utility for language-based analyses.
Data Alignment and Focused Selection: To ensure consistency across datasets, the Forex data are aligned with the dates of economic events, using the same “no news” filling approach as in the Gold-price dataset to address dates without significant economic events. Given that the majority of economic events in the calendar dataset are pertinent to the United States, Britain, and Japan, our dataset exclusively incorporates exchange rate data for the euro, yen, and pound to enhance the dataset’s relevance and ensure a high correlation with the included economic events. This targeted selection strategy helps to maintain a focused and relevant dataset for analyzing forex fluctuations.
Resulting Samples: The combination of foreign exchange rates with textual descriptions of economic events resulted in a dataset of 2347 samples. Each sample contains the following:
Date: The trading day to which the forex rates and any economic news pertain.
Forex Rates: The recorded exchange rates for the day.
Economic News Description: A concise summary of the economic event(s) on that day, or the phrase “no news” for days without scheduled announcements.
This curated dataset facilitates an in-depth analysis of the relationship between major economic announcements and their impact on forex rates, offering insights into the dynamics of the foreign exchange market. By combining structured numerical data with descriptive text, the dataset supports a comprehensive approach to understanding the economic indicators that influence forex fluctuations, thereby enhancing our understanding of market behavior.
4.2. Evaluation Metrics
To assess the performance of the forecasting models, we adopt four evaluation metrics: Mean Squared Error (MSE), Root Mean Square Error (RMSE), Mean Absolute Error (MAE), and Mean Absolute Percentage Error (MAPE). MSE focuses on larger prediction errors, making it sensitive to outliers. RMSE provides an interpretable error magnitude by aligning the scale of errors with the original data. MAE offers a balanced view by equally weighting errors of different magnitudes, while MAPE expresses errors as a percentage of the actual values, indicating the average deviation in percentage terms. These metrics are defined as follows:
where
and
denote the actual and predicted values, respectively, and
n is the total number of samples.
4.3. Experimental Settings
The proposed framework is trained using the MSE loss function and optimized with ADAM [
39], initialized with a learning rate of
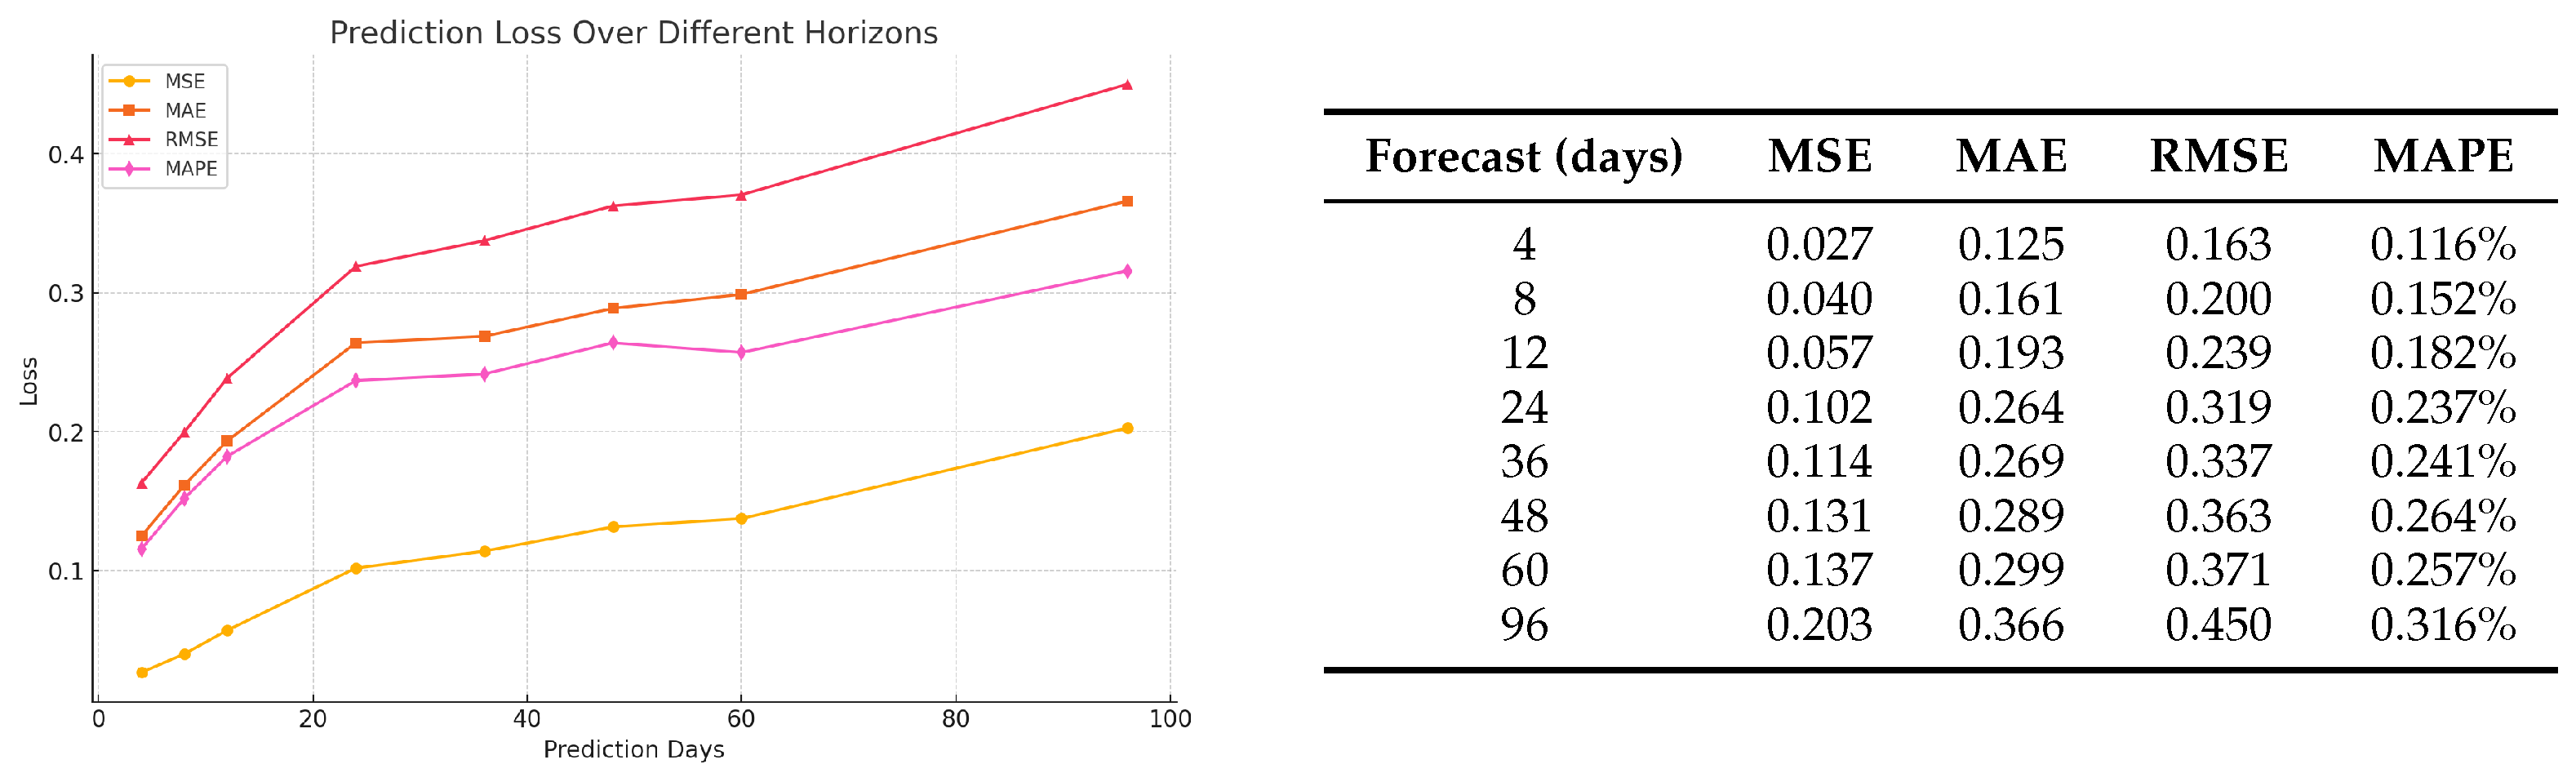
. Considering the relatively small size of our datasets, we evaluate various forecast horizons—
days—to identify the most practical forecast horizon for economic forecasting. As illustrated in
Figure 4, the 12-day forecast horizon is selected based on its balance between predictive accuracy and practical applicability. The time series historical window is set at 96 days, providing a comprehensive temporal context for generating accurate and actionable forecasts.
As described in
Section 3.2, we incorporate only the most recent day’s news as textual input. Aligning textual inputs with the full historical window would produce text embeddings with dimensions far exceeding those of the time series features, creating an imbalance between the two modalities and hindering effective fusion.
4.4. Baselines
To evaluate the effectiveness of the proposed MM-iTransformer, we compare its performance with the baseline iTransformer model. This analysis highlights the added value of incorporating textual information into economic forecasting through our multimodal approach.
In addition to the iTransformer and MM-iTransformer comparison, we employ several classical and baseline methods for further evaluation. First, we use the ARIMA model [
40], a well-established approach for time series forecasting, to assess the advantages of transformer-based architectures over traditional statistical models. Additionally, we include the Random Walk Model [
41], a widely used benchmark in financial forecasting, to establish a baseline and quantify the predictive improvements achieved by our proposed MM-iTransformer framework.
4.5. Experimental Results
This study compares the MM-iTransformer framework with the iTransformer, ARIMA, and the Random Walk Model using the Forex and Gold-price datasets. We primarily focus on the Mean Squared Error (MSE), as the models are trained using this metric. Additionally, we evaluate their predictive capabilities using Mean Absolute Error (MAE), Root Mean Squared Error (RMSE), and Mean Absolute Percentage Error (MAPE). The results, presented in
Table 2, show the following:
Comparison between MM-iTransformer and iTransformer: The MM-iTransformer integrates textual data with historical price data and demonstrates superior performance over the iTransformer. On the Forex dataset, it reduces the MSE from 0.022 to 0.019, showing a 13.64% reduction. For the Gold-price dataset, the MSE is reduced from 0.065 to 0.057, a reduction of 12.31%. These results highlight the significant benefits of incorporating textual data into forecasting models, enhancing the MM-iTransformer’s accuracy and robustness.
Single-variable and Multi-variable Prediction Performance: MM-iTransformer excels in both single-variable (Gold-price) and multi-variable (Forex) predictions, affirming its capability to utilize textual data effectively. This inclusion provides additional predictive signals, enabling the model to capture market dynamics more accurately than using historical price data alone.
Comparison with Classical Models: Compared to classical models, both the MM-iTransformer and iTransformer exhibit superior performance, with MM-iTransformer consistently achieving the lowest MSE across datasets. However, the iTransformer does not consistently outperform the Random Walk Model on the Forex dataset, possibly due to difficulties in adapting to abrupt market changes—a scenario where the Random Walk Model, which assumes price continuity, may have an advantage.
In summary, the MM-iTransformer framework marks a significant advancement in economic forecasting by leveraging multimodal data, particularly through the integration of textual information. This study confirms the potential of advanced deep learning techniques to revolutionize financial market predictions by incorporating diverse data types.
Ablation study: To assess the impact of temporally aligned news on prediction accuracy, we conduct an ablation study by randomizing the order of news texts within the time series window. This change disrupts the contextual relevance of the news data, simulating scenarios where the financial news is not aligned with historical market prices. By removing this alignment, we could isolate and examine the specific effect of the temporal relevance of textual inputs on forecasting performance.
As shown in
Table 3, using randomized news texts shows a clear decline in performance compared to temporally aligned news. In the Gold-price dataset, the MSE increases to 0.069, and for the Forex dataset, it increases to 0.021 when random news is used. This indicates that non-contextual, misaligned news does not contribute meaningfully to prediction accuracy and may even reduce it. The observed rise in error rates underscores the critical role of temporal alignment, affirming that relevant, timely news data significantly enhance forecasting accuracy.
Statistical Significance Analysis of Textual Data Integration: To rigorously ascertain the impact of integrating textual data into economic forecasting models, we utilize the Diebold–Mariano (DM) test to statistically evaluate the enhancements observed with the MM-iTransformer compared to the traditional iTransformer. The DM test results are summarized in
Table 4, where the DM statistics for both the Gold-price and Forex datasets are presented.
The DM test results show statistically significant improvements in forecasting accuracy when textual data are integrated. Specifically, the Gold-price dataset yields a DM statistic of 2.030 with a p-value of 0.043, and the Forex dataset exhibits a DM statistic of 3.010 with a p-value of 0.003. These results indicate that the improvements in predictive performance with the MM-iTransformer, which incorporates textual data, are statistically significant compared to the iTransformer, which relies solely on the historical price data.
These findings provide statistical evidence that supports the hypothesis that textual integration enhances the ability of forecasting models to capture complex market dynamics more effectively than models relying on time series data alone. This validation confirms the relevance and efficacy of incorporating textual data into economic forecasting models, reinforcing the value of multimodal approaches in enhancing prediction accuracy.
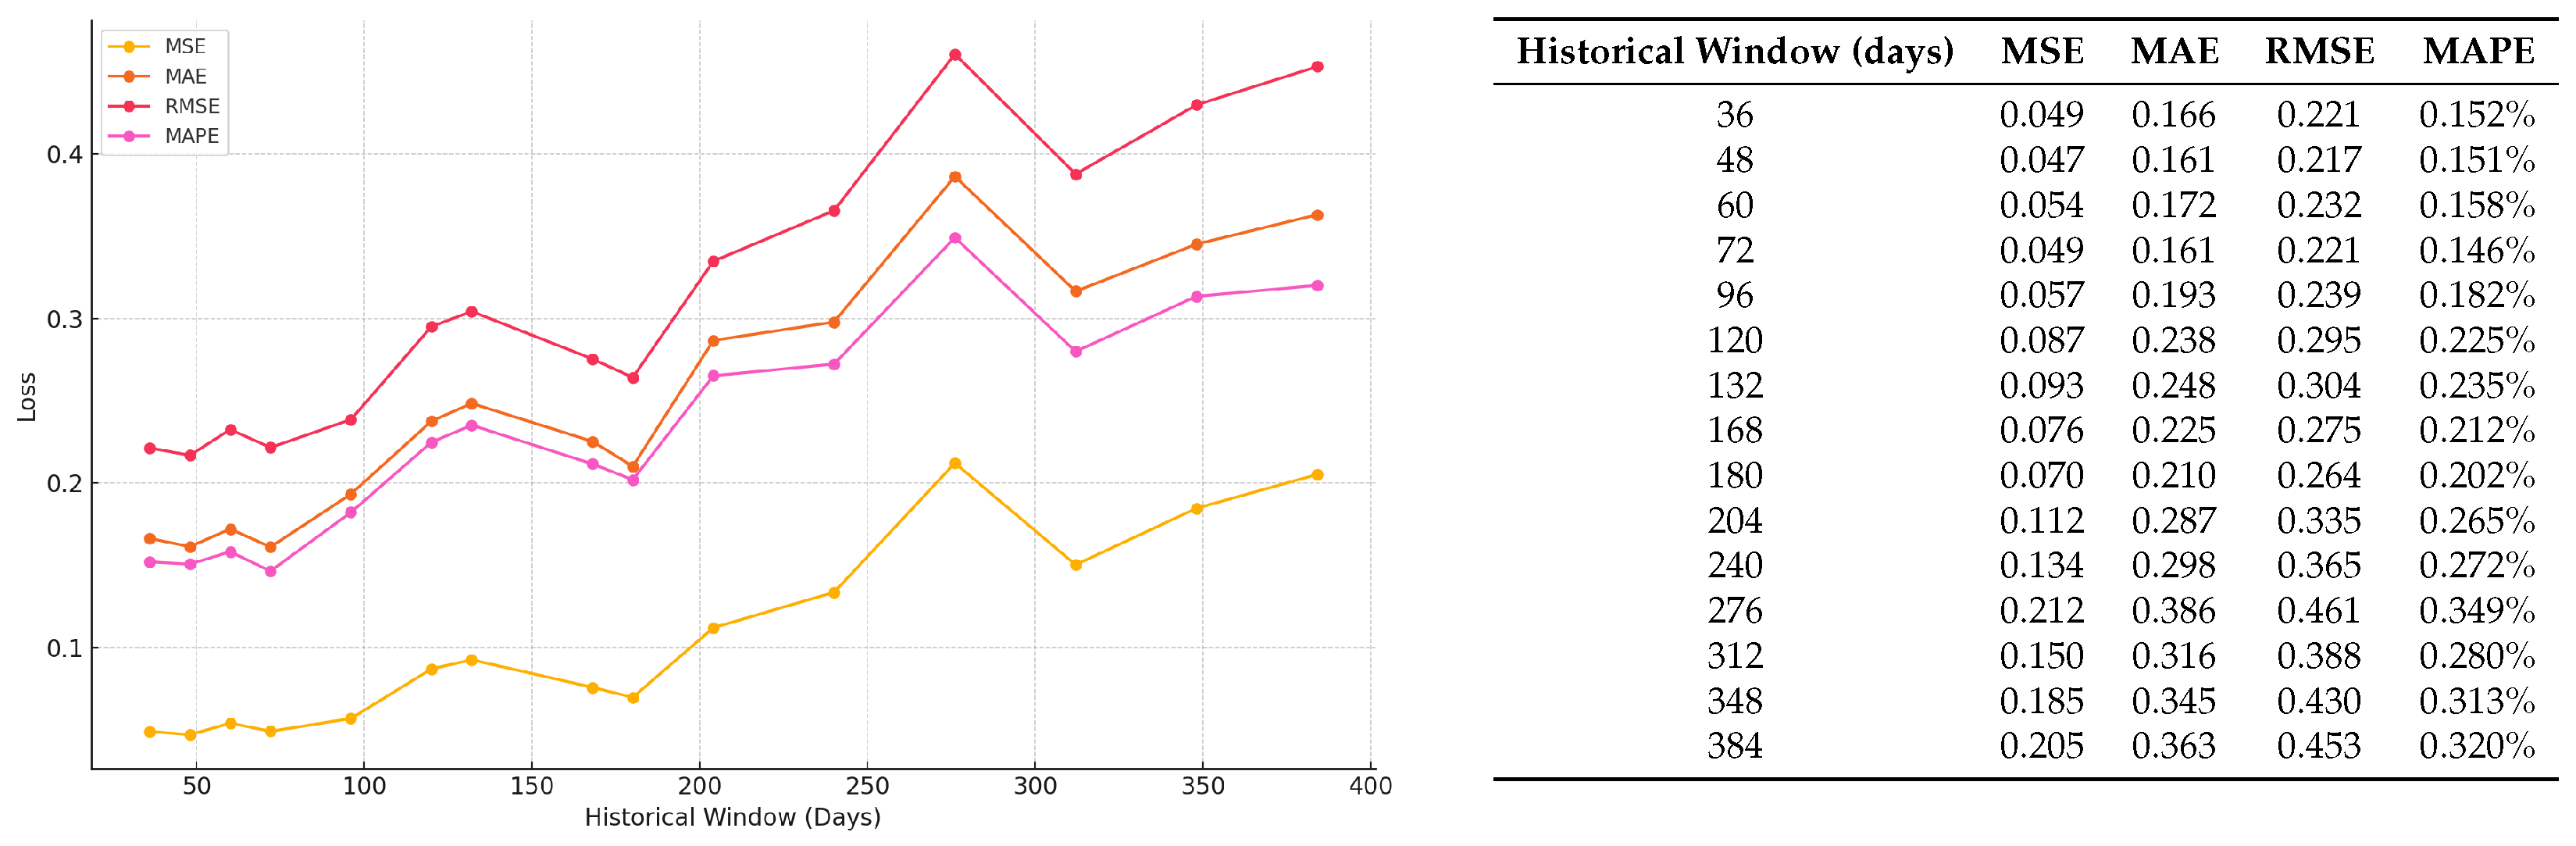
Analysis of Historical Window Lengths: To assess model performance stability, we experimented with various historical window lengths ranging from 36 to 384 days on the Gold-price and Forex datasets. The results indicate that shorter windows typically result in lower loss, with a 96-day window yielding optimal performance as shown in
Figure 5 and
Figure 6. Extending the window beyond 96 days led to increased errors from outdated and less relevant data, which is detrimental for short-term forecasting.
The sizes of our datasets—1352 samples for Gold-price and 2347 for Forex—also guided our choice of window length to avoid overfitting. Larger windows risk models memorizing specific data features instead of generalizing from underlying patterns, reducing their effectiveness on unseen data. Furthermore, we did not opt for smaller windows, as they could miss significant economic cycles and trends crucial for robust predictions. The chosen 96-day window provides a balanced approach, capturing essential market dynamics without the noise and overfitting associated with longer windows. This balance facilitates efficient learning and reliable forecasting, making it well suited for our dataset constraints.
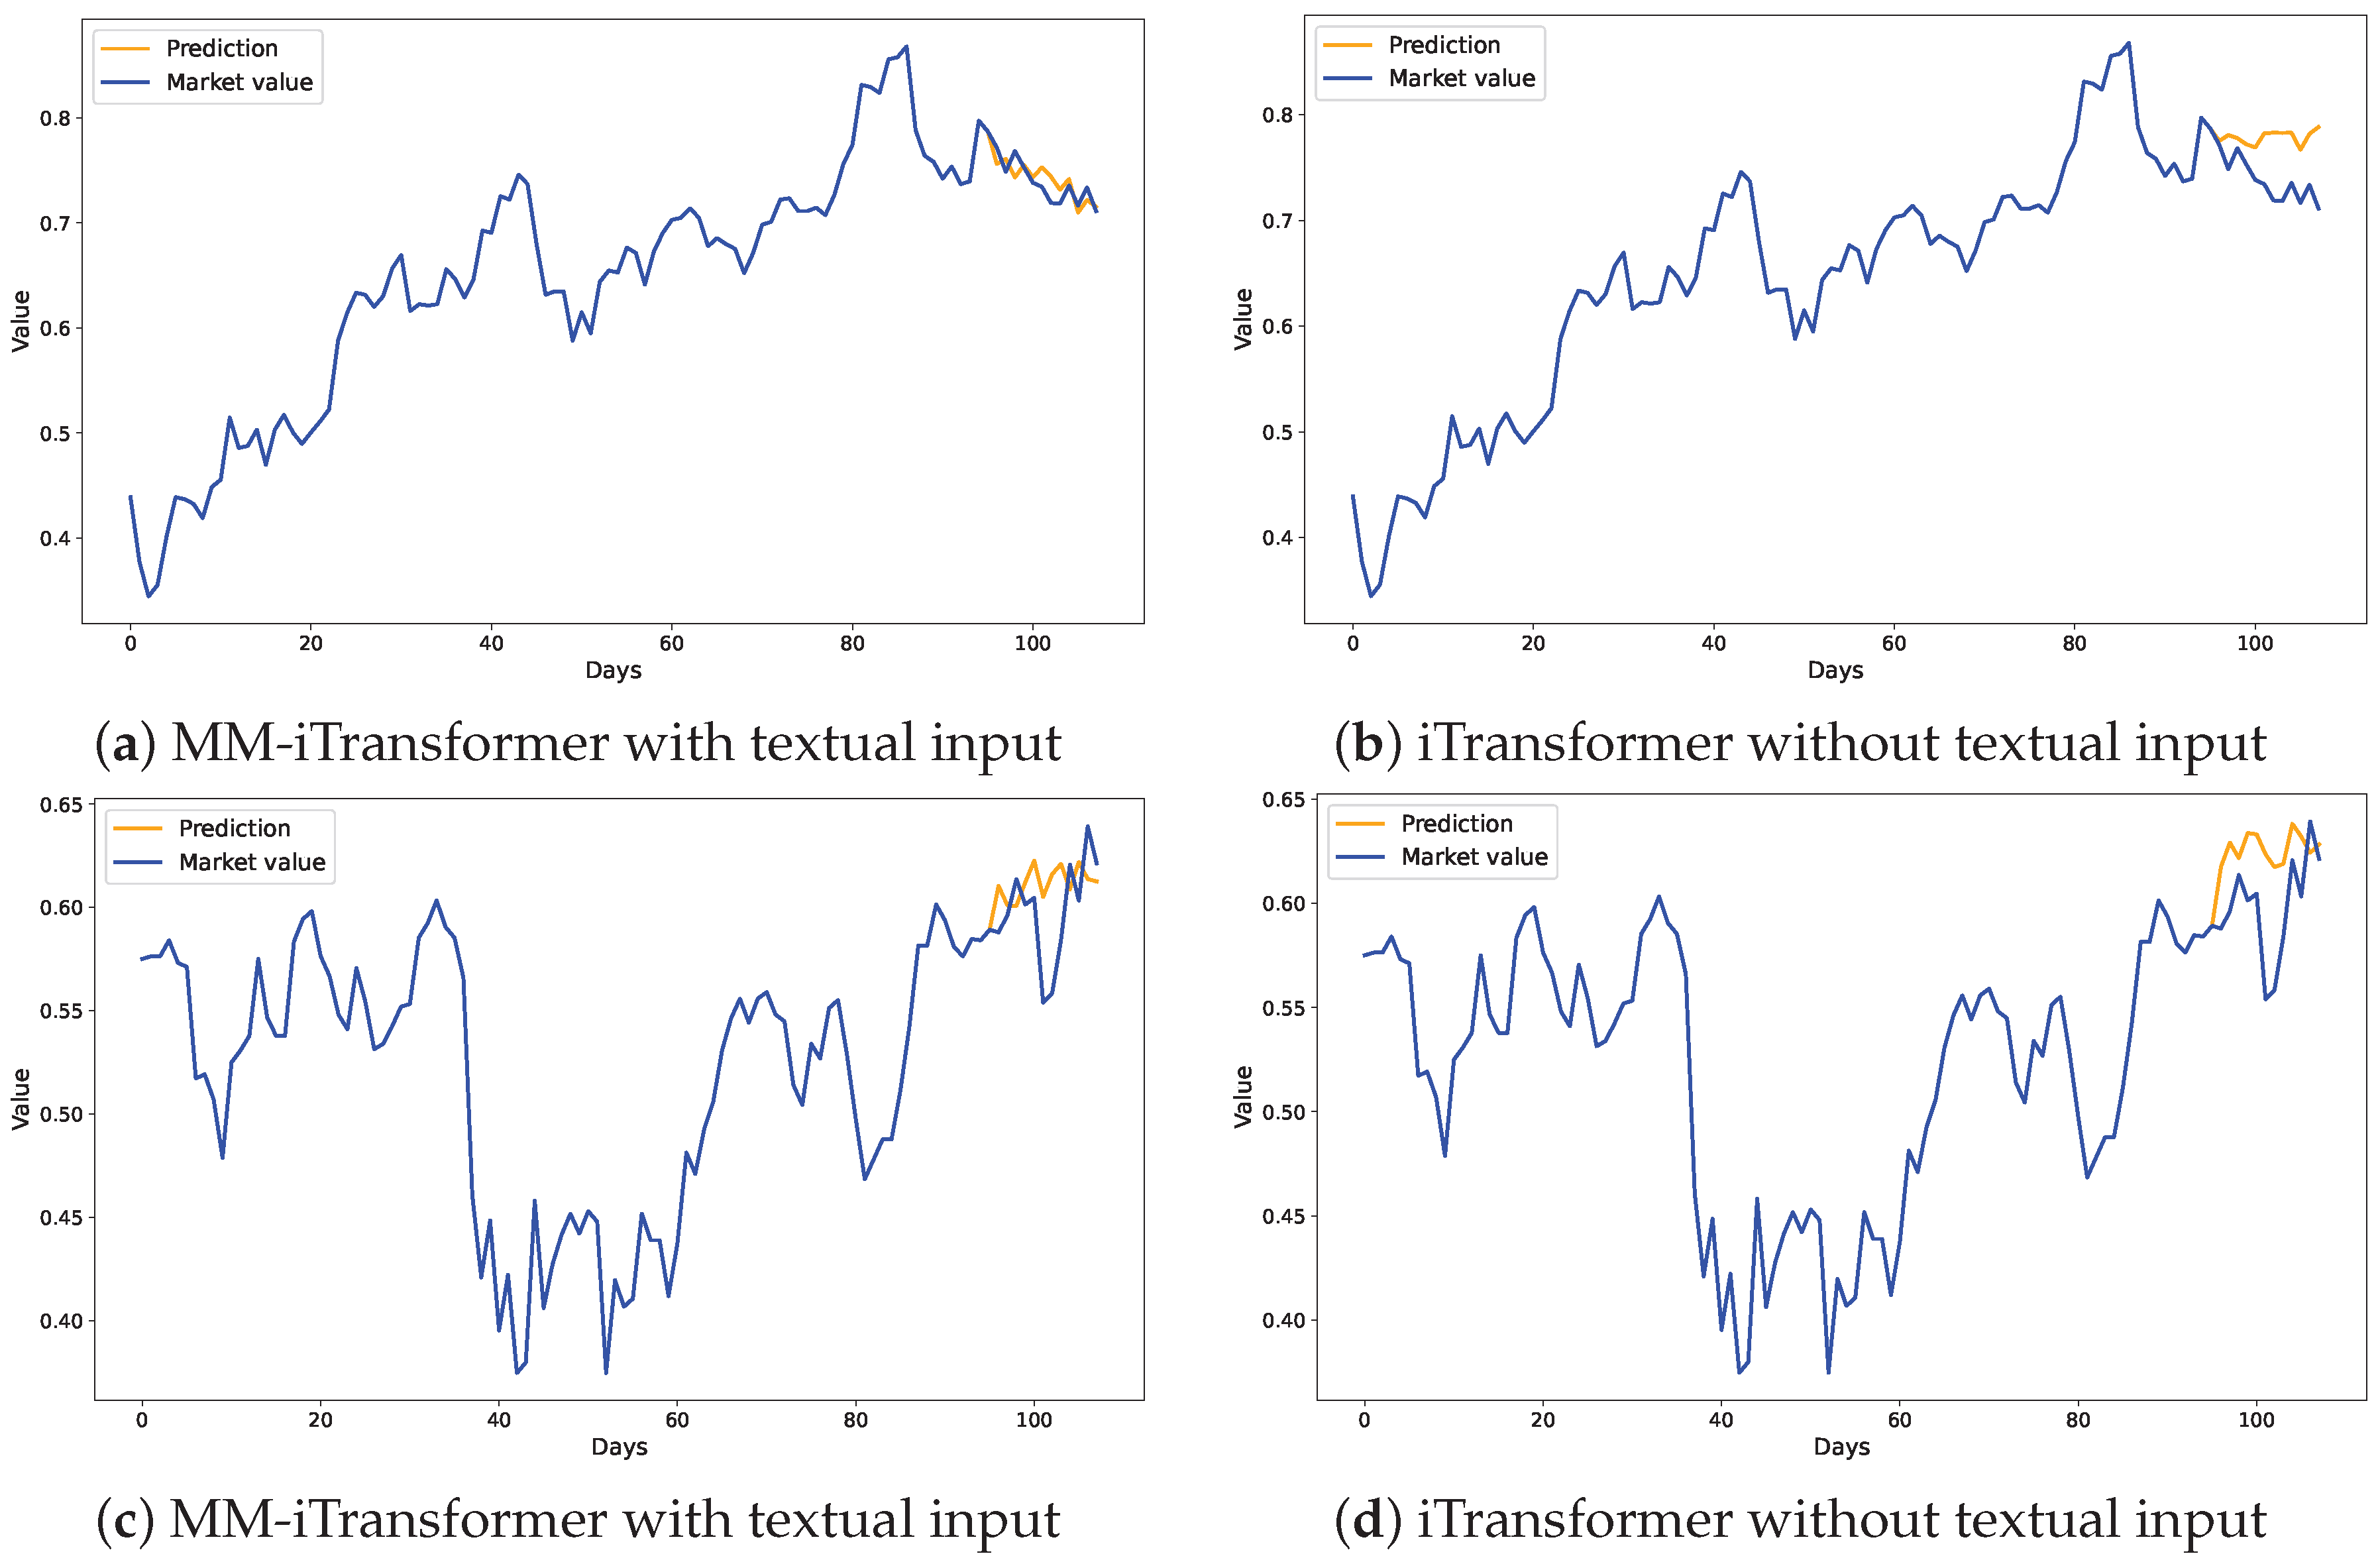
Example Forecasting Results:
Figure 7 presents a detailed comparison of forecasting outcomes from the MM-iTransformer and iTransformer models applied to Forex datasets. The graphs illustrate a marked improvement in prediction accuracy through the integration of textual data. Specifically, the MM-iTransformer, which incorporates textual inputs alongside historical price data, demonstrates superior alignment with actual market trends and captures future price movements with significantly higher precision compared to iTransformer, which relies solely on historical price data. This visual representation compellingly demonstrates how integrating relevant textual information can substantially enhance a model’s ability to comprehend and predict market dynamics, leading to more precise forecasts.
4.6. Computational Complexity Analysis
In our research, the MM-iTransformer model integrates textual data with historical price data to improve the accuracy of the economic time series forecast. This integration introduces additional computational complexity primarily due to the use of pre-trained neural networks to generate text embeddings. Given the minimal computational demands of traditional models like ARIMA and the Random Walk Model, which do not use deep learning frameworks, our analysis focuses exclusively on comparing the MM-iTransformer with the original iTransformer.
Table 5 illustrates that MM-iTransformer exhibits slower training speeds and higher memory requirements than iTransformer. Specifically, on the Forex dataset, the MM-iTransformer processes at 232.89 milliseconds per iteration compared to 49.91 milliseconds for the iTransformer. Furthermore, the memory usage for the MM-iTransformer is 1.02 GB versus 0.59 GB for the iTransformer.
These findings underscore the increased computational costs associated with the MM-iTransformer. However, the significant improvement in prediction accuracy by effectively leveraging multimodal data justifies these costs. This capability to utilize diverse data types is crucial for accurately capturing complex market dynamics. Future efforts will aim to optimize the model’s architecture to reduce computational demands without compromising performance. Enhancing the efficiency of the model will broaden its applicability, making it more suitable for real-time trading systems and large-scale financial applications.
4.7. Cross-Modality Correlation Interpretation
We conduct detailed case studies on both the Gold-price dataset and the Forex dataset. These studies illustrate how our model, through its attention mechanism, adeptly captures and quantifies the interdependencies between textual embeddings and time series data.
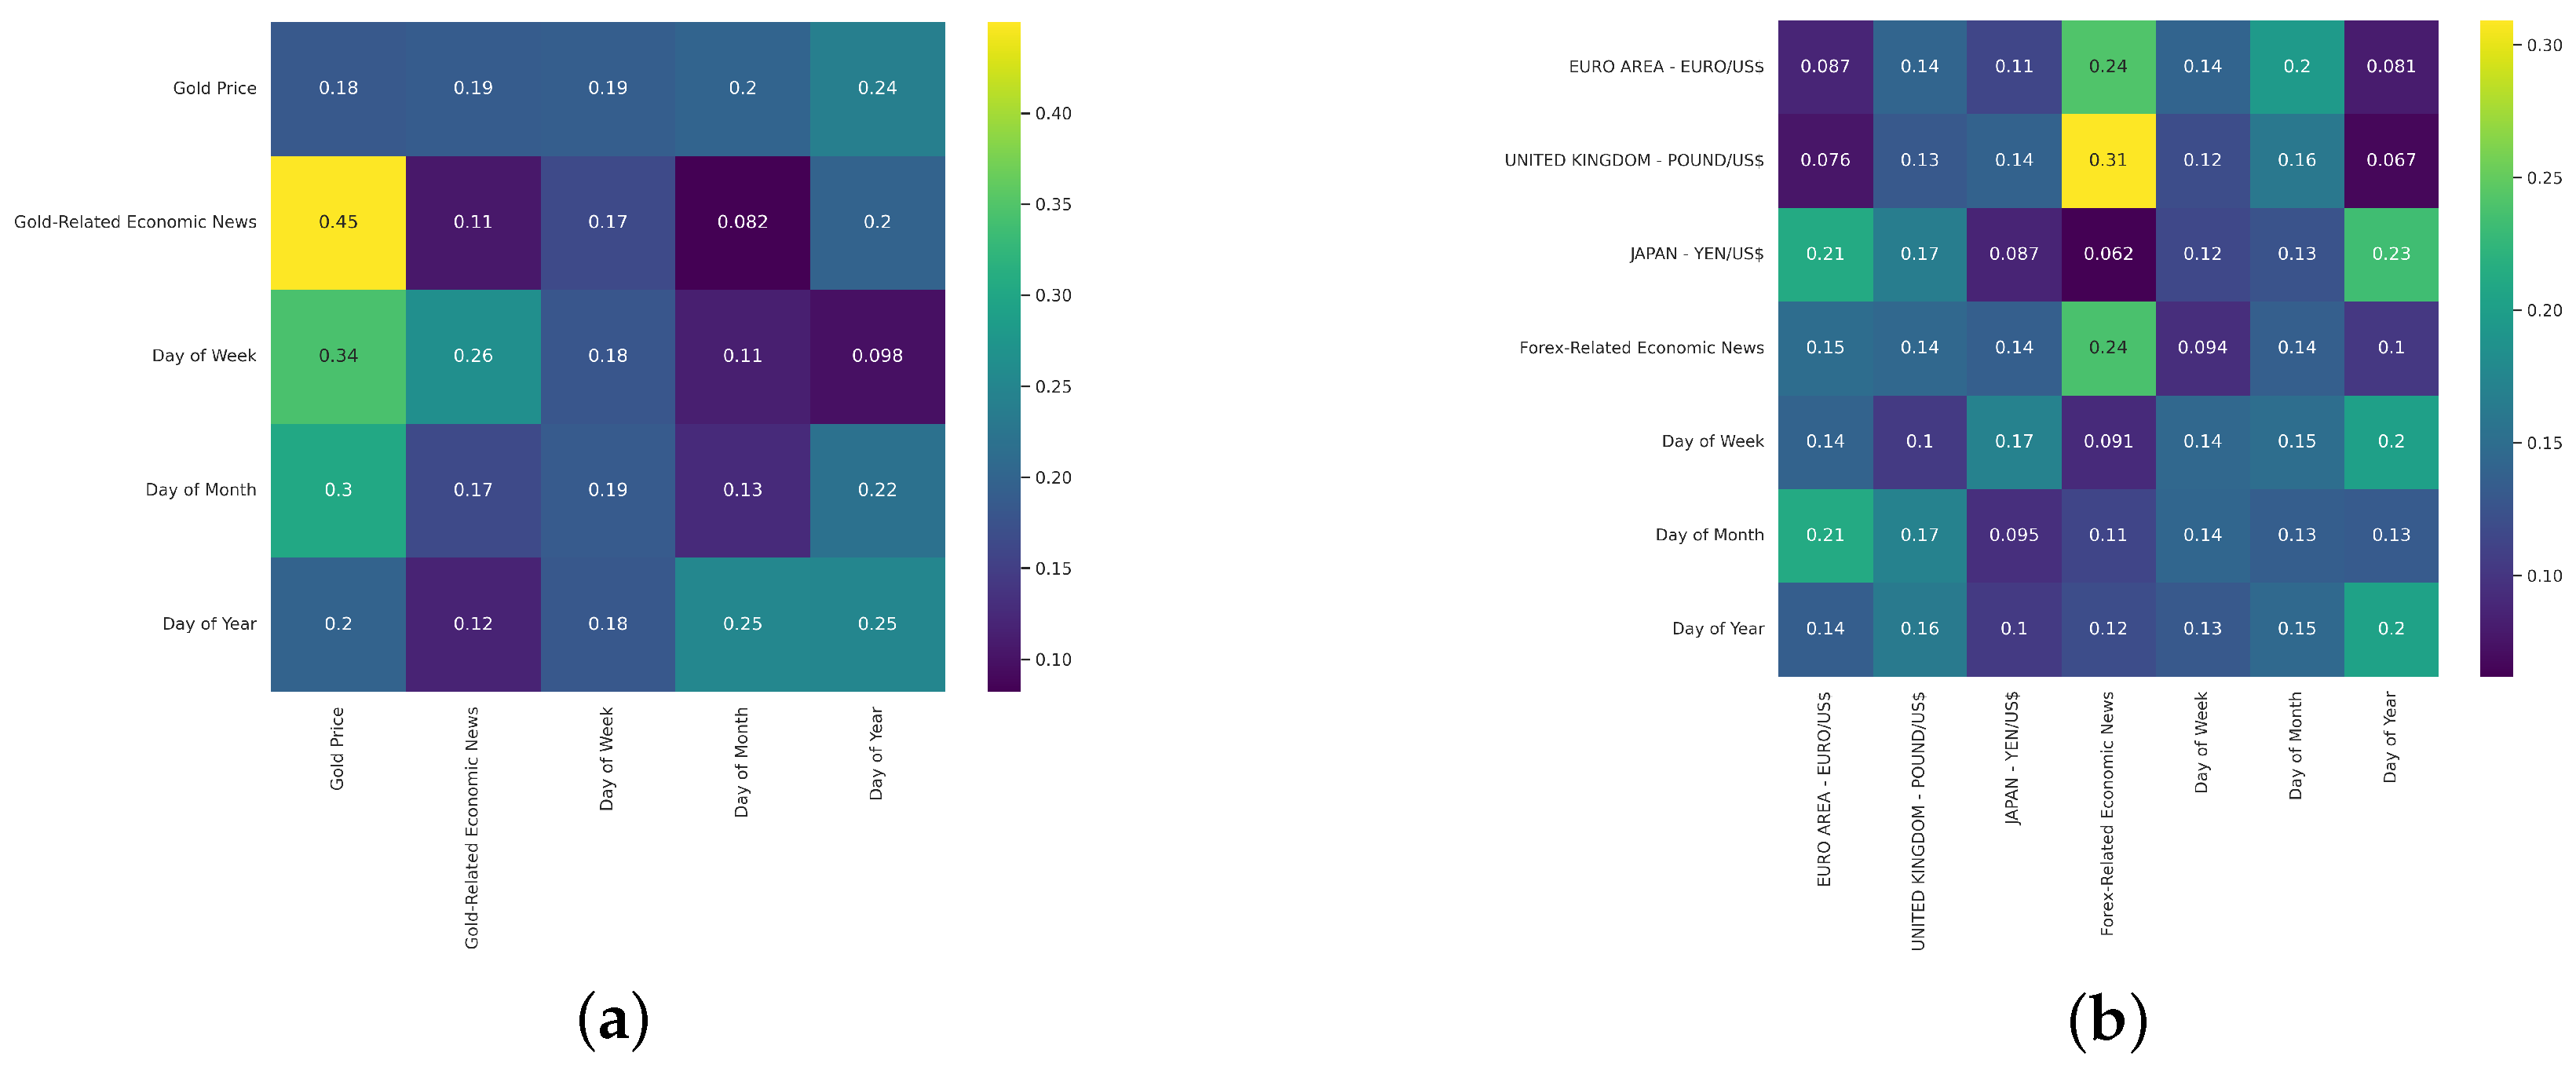
As visualized in the attention heatmaps (
Figure 8), the model utilizes the attention mechanism to pinpoint and quantify the interdependencies that exist between diverse data modalities. In the Gold-price dataset, the heat map reveals substantial attention weights on interactions between gold-related economic news and the price movements of gold itself. A notable correlation of 0.45 underscores the substantial influence of economic news on market prices as shown in
Figure 8a. This high correlation coefficient indicates that our model not only recognizes relevant economic news but also assesses its impact on market fluctuations significantly. Similarly, the heat map for the Forex dataset shows focused attention on economic narratives associated with specific currency pairs. For instance, the attention weight of 0.31 for the GBP/USD exchange rate highlights the significant impact of economic narratives on currency valuation, as demonstrated in
Figure 8b. This focused attention reflects the model’s ability to discern and emphasize the economic indicators that are the most predictive of currency movements.
These findings provide quantitative evidence of meaningful patterns and relationships in different types of data. The ability of our model to discern these complex relationships not only demonstrates advanced multimodal comprehension capabilities but also significantly enhances the model’s forecast performance. By effectively integrating and analyzing multimodal data, the model offers a robust tool to capture complex market dynamics that are often missed by more traditional models.
5. Conclusions
This study has successfully demonstrated the significant potential of integrating textual data into economic time series forecasting with the proposed MM-iTransformer. We have shown that incorporating textual information markedly enhances forecasting accuracy. Our findings underscore that the inclusion of news text not only aligns with the inherently multimodal nature of economic forecasting but also significantly improves predictive accuracy as evidenced by the notable reduction in MSE for both the Gold-price and Forex datasets.
However, we acknowledge certain limitations in this study, particularly concerning the scope and synchronization of the datasets used. While our results validate the utility of textual information for forecasting, the relatively limited scope of our datasets may not fully encompass the diverse and region-specific characteristics of global financial markets. Furthermore, the challenge of aligning textual data with time series data is exacerbated by the scarcity of large, well-structured, and temporally synchronized datasets in the financial sector.
To overcome these limitations, we plan to develop a larger, more comprehensive dataset in future work. This enhanced dataset will aim to better synchronize region-specific and real-time news data with financial time series, providing a more robust basis for evaluating and validating the proposed method. Through these efforts, we hope to further advance the field of multimodal economic forecasting by leveraging a broader spectrum of synchronized data, thereby enriching our understanding and predictive capabilities within this complex domain.


