
Reproducibility and Accuracy of Two Facial Scanners: A 3D In Vivo Study


Abstract
1. Introduction
2. Materials and Methods
2.1. Scanning Phase
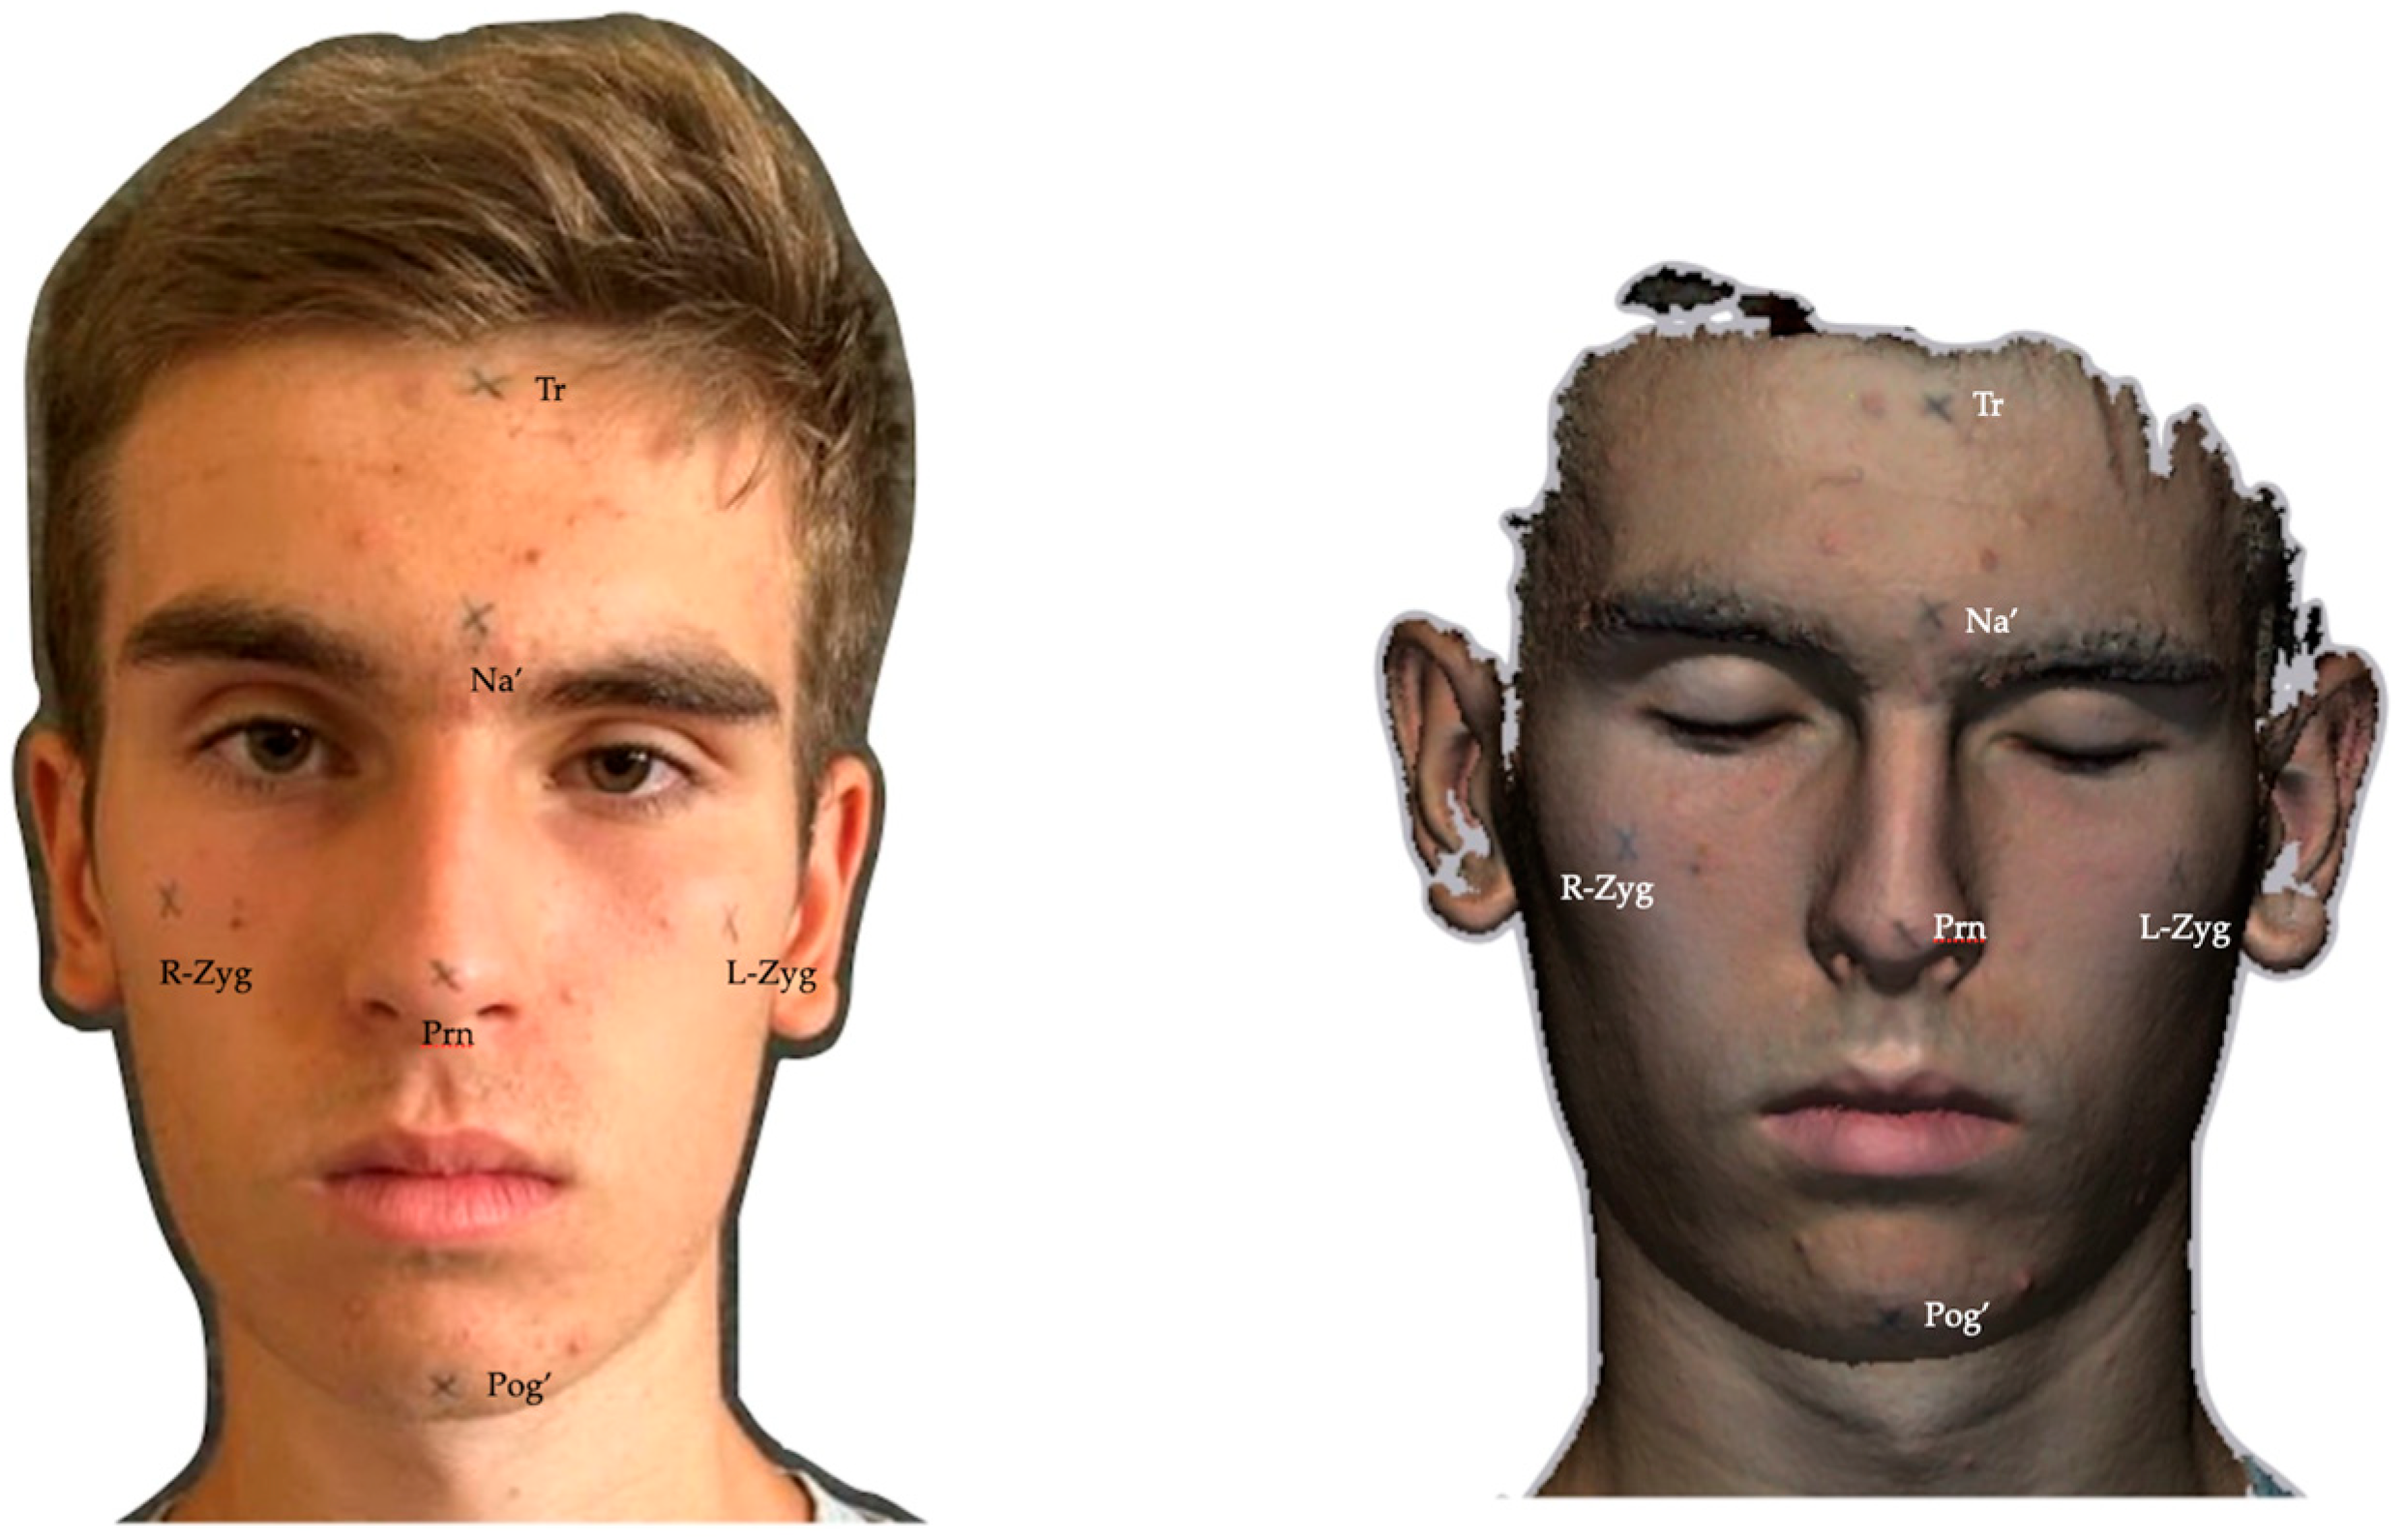
2.2. Anthropometric and Digital Measurements
2.3. Statistical Analysis
3. Results
3.1. Linear Measurements
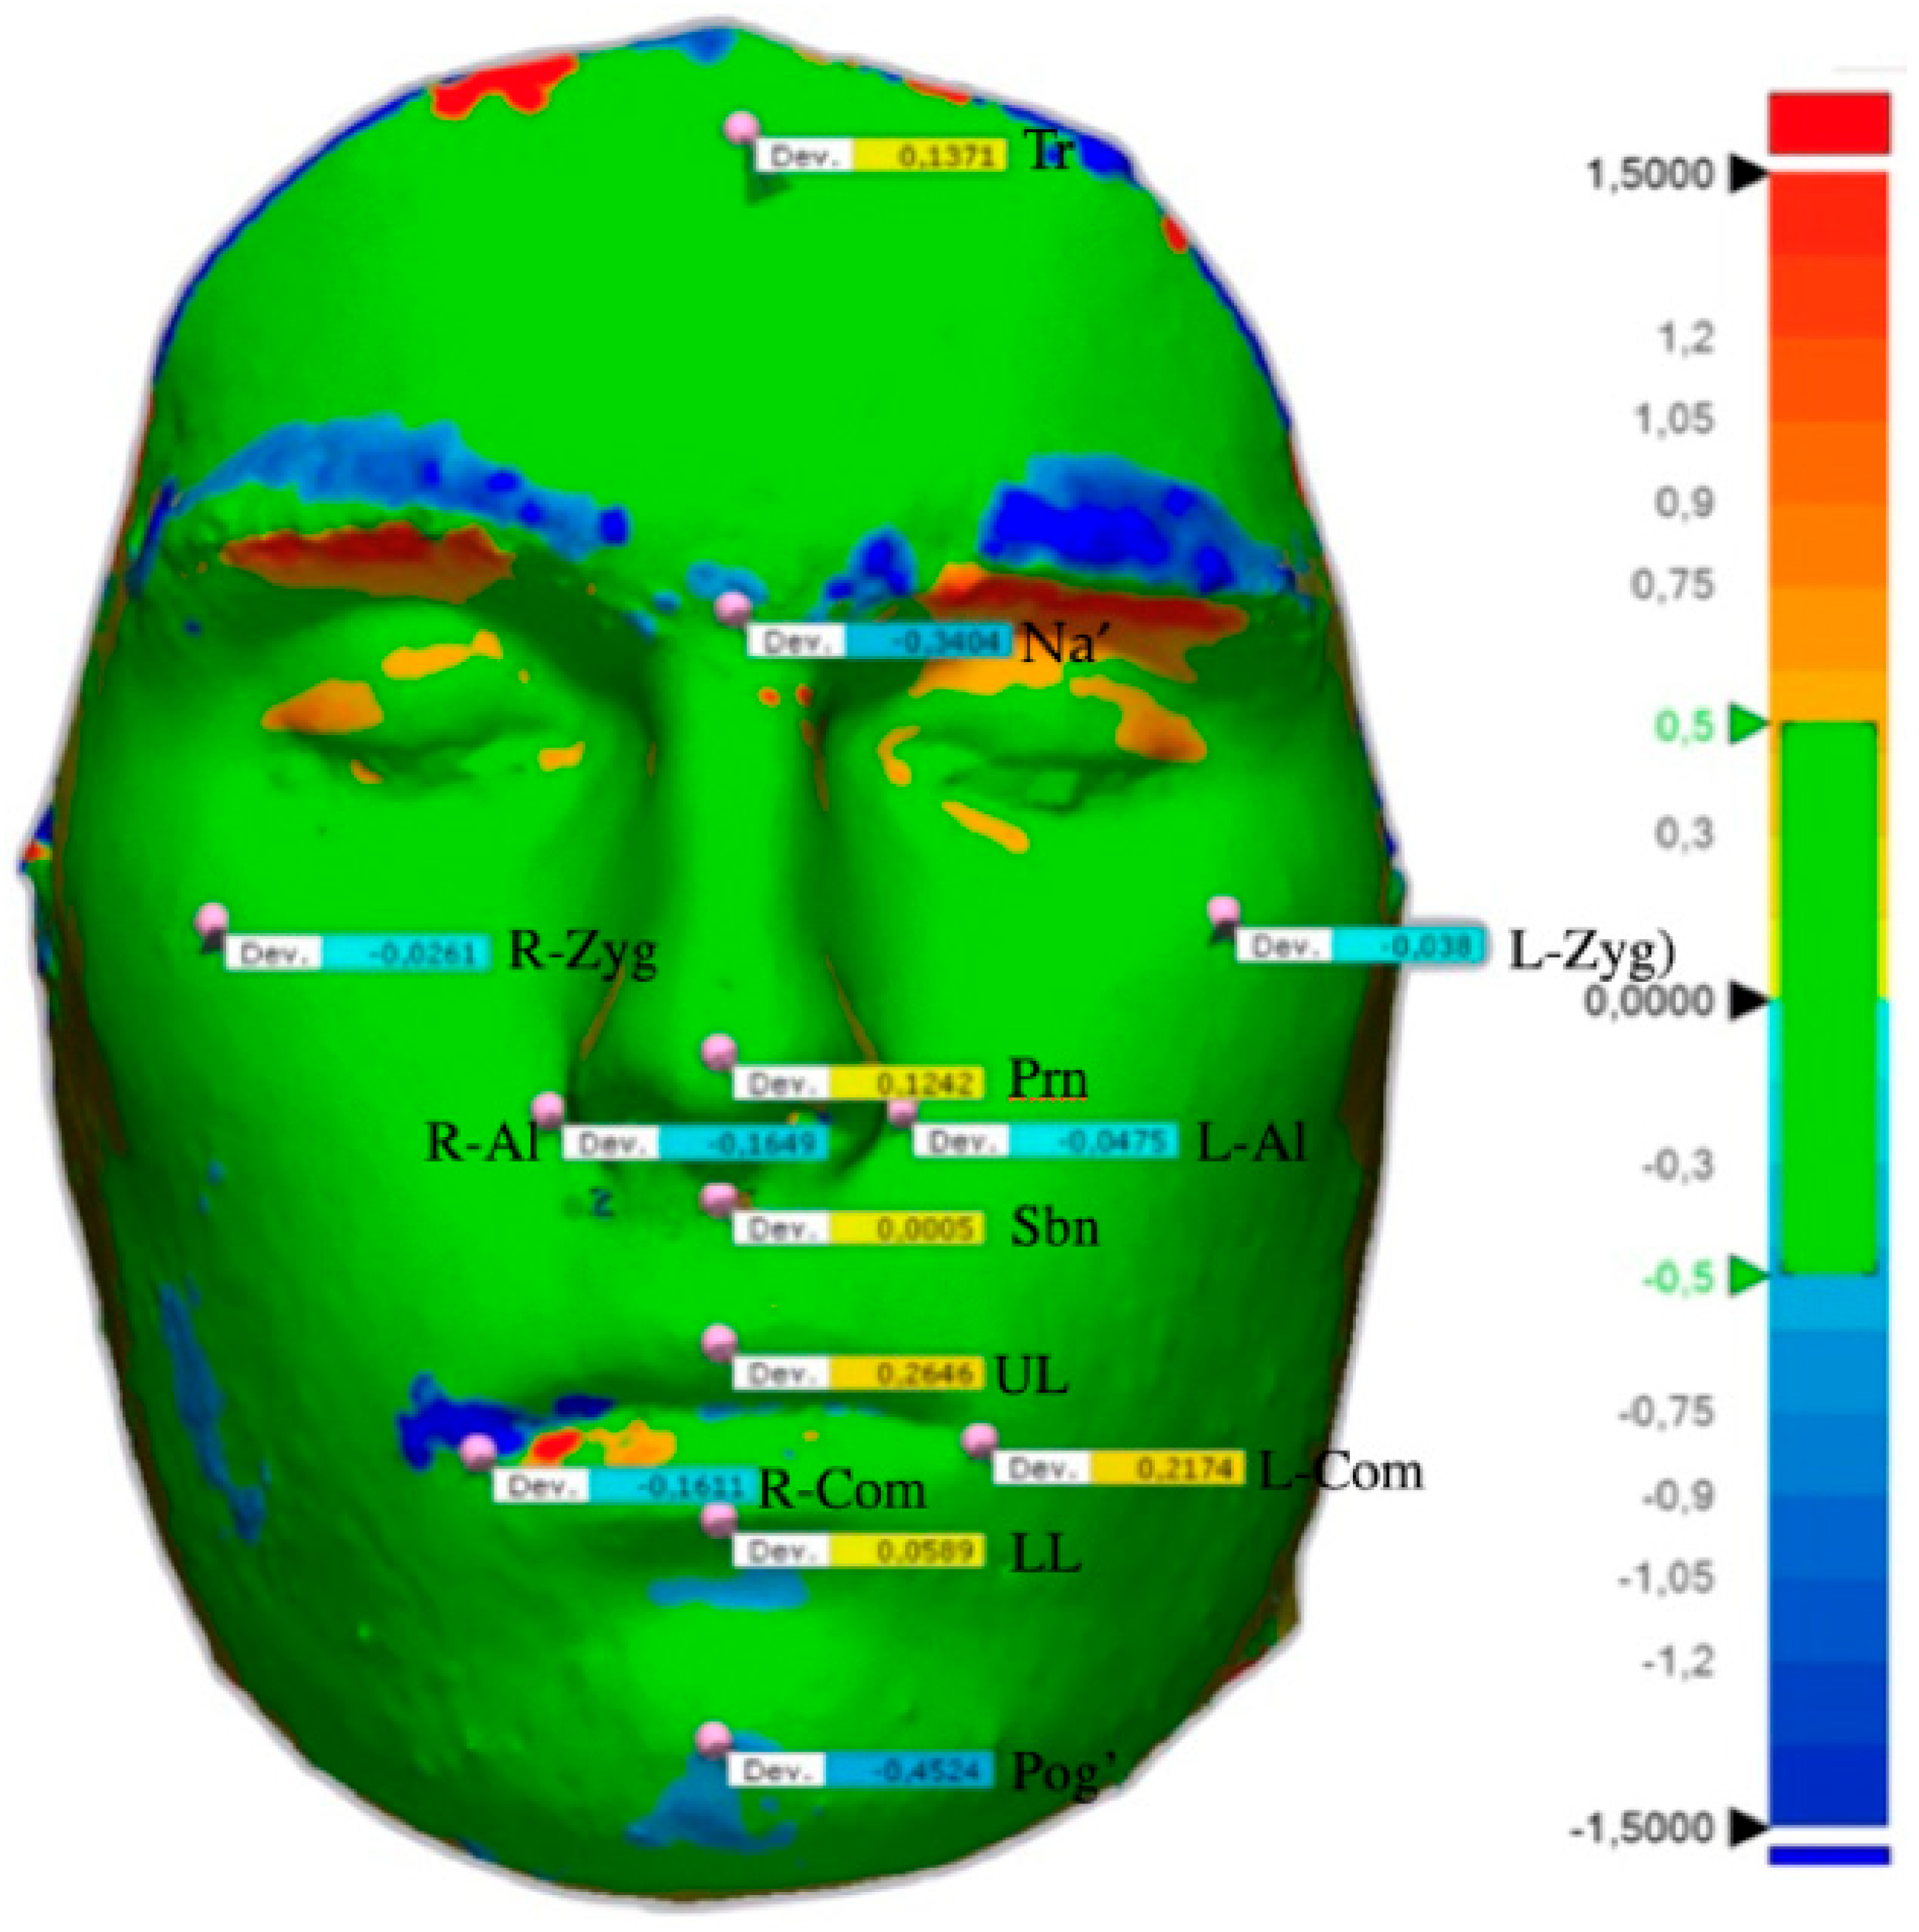
3.2. Points Measurements
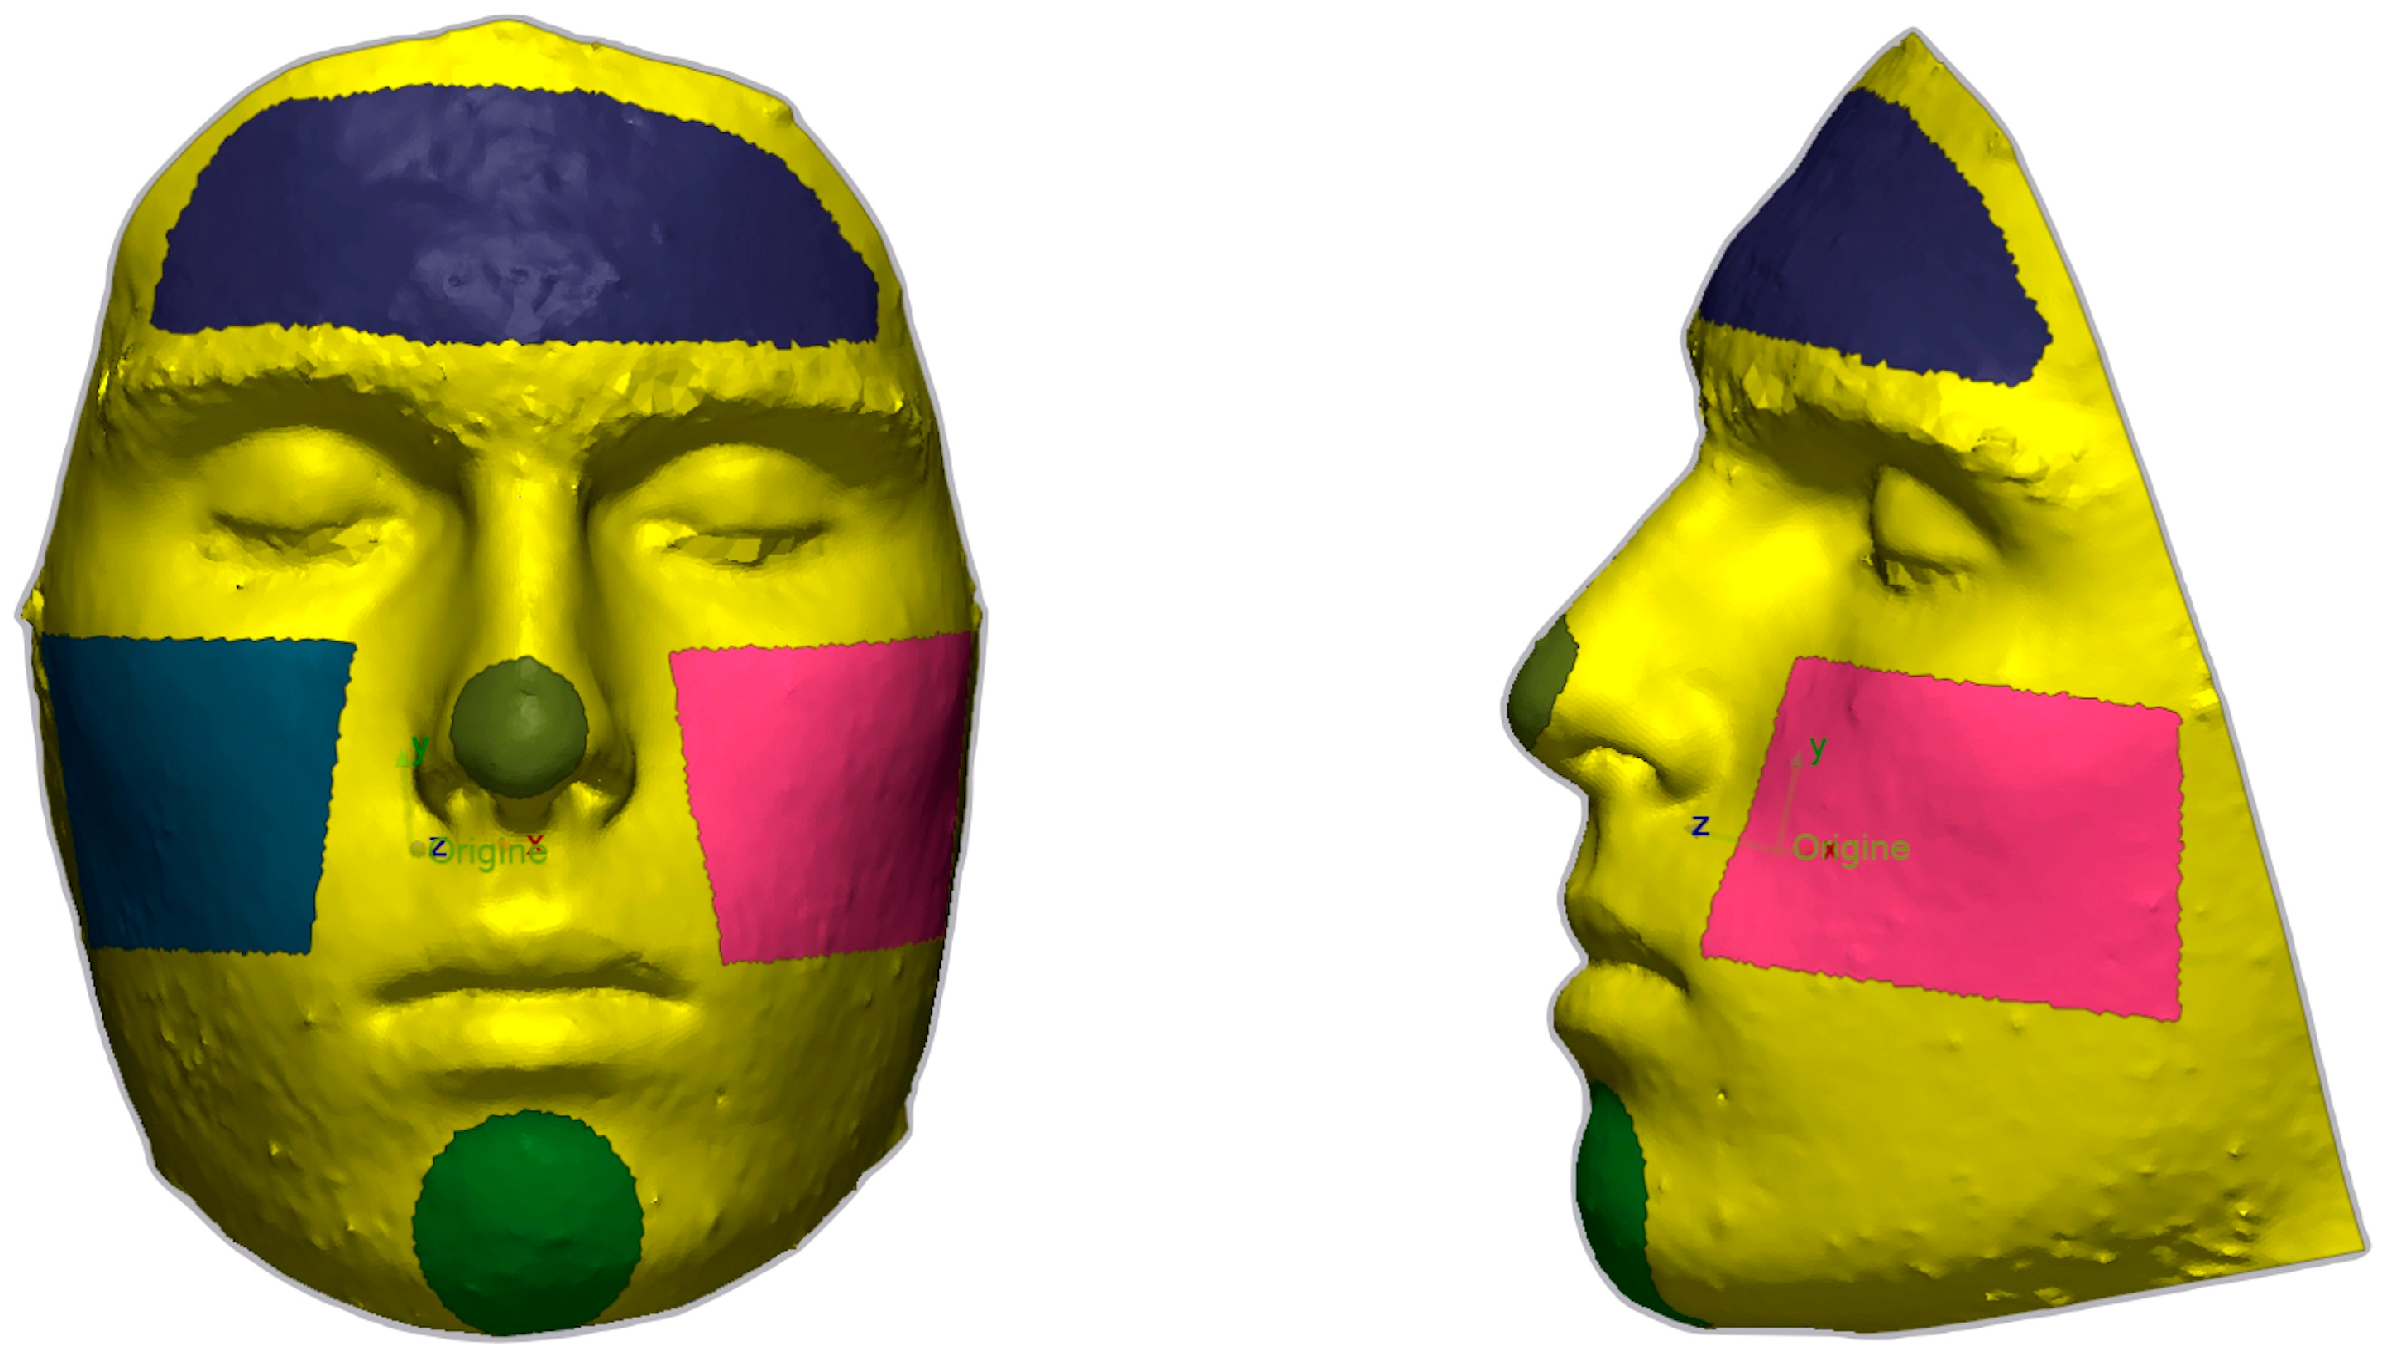
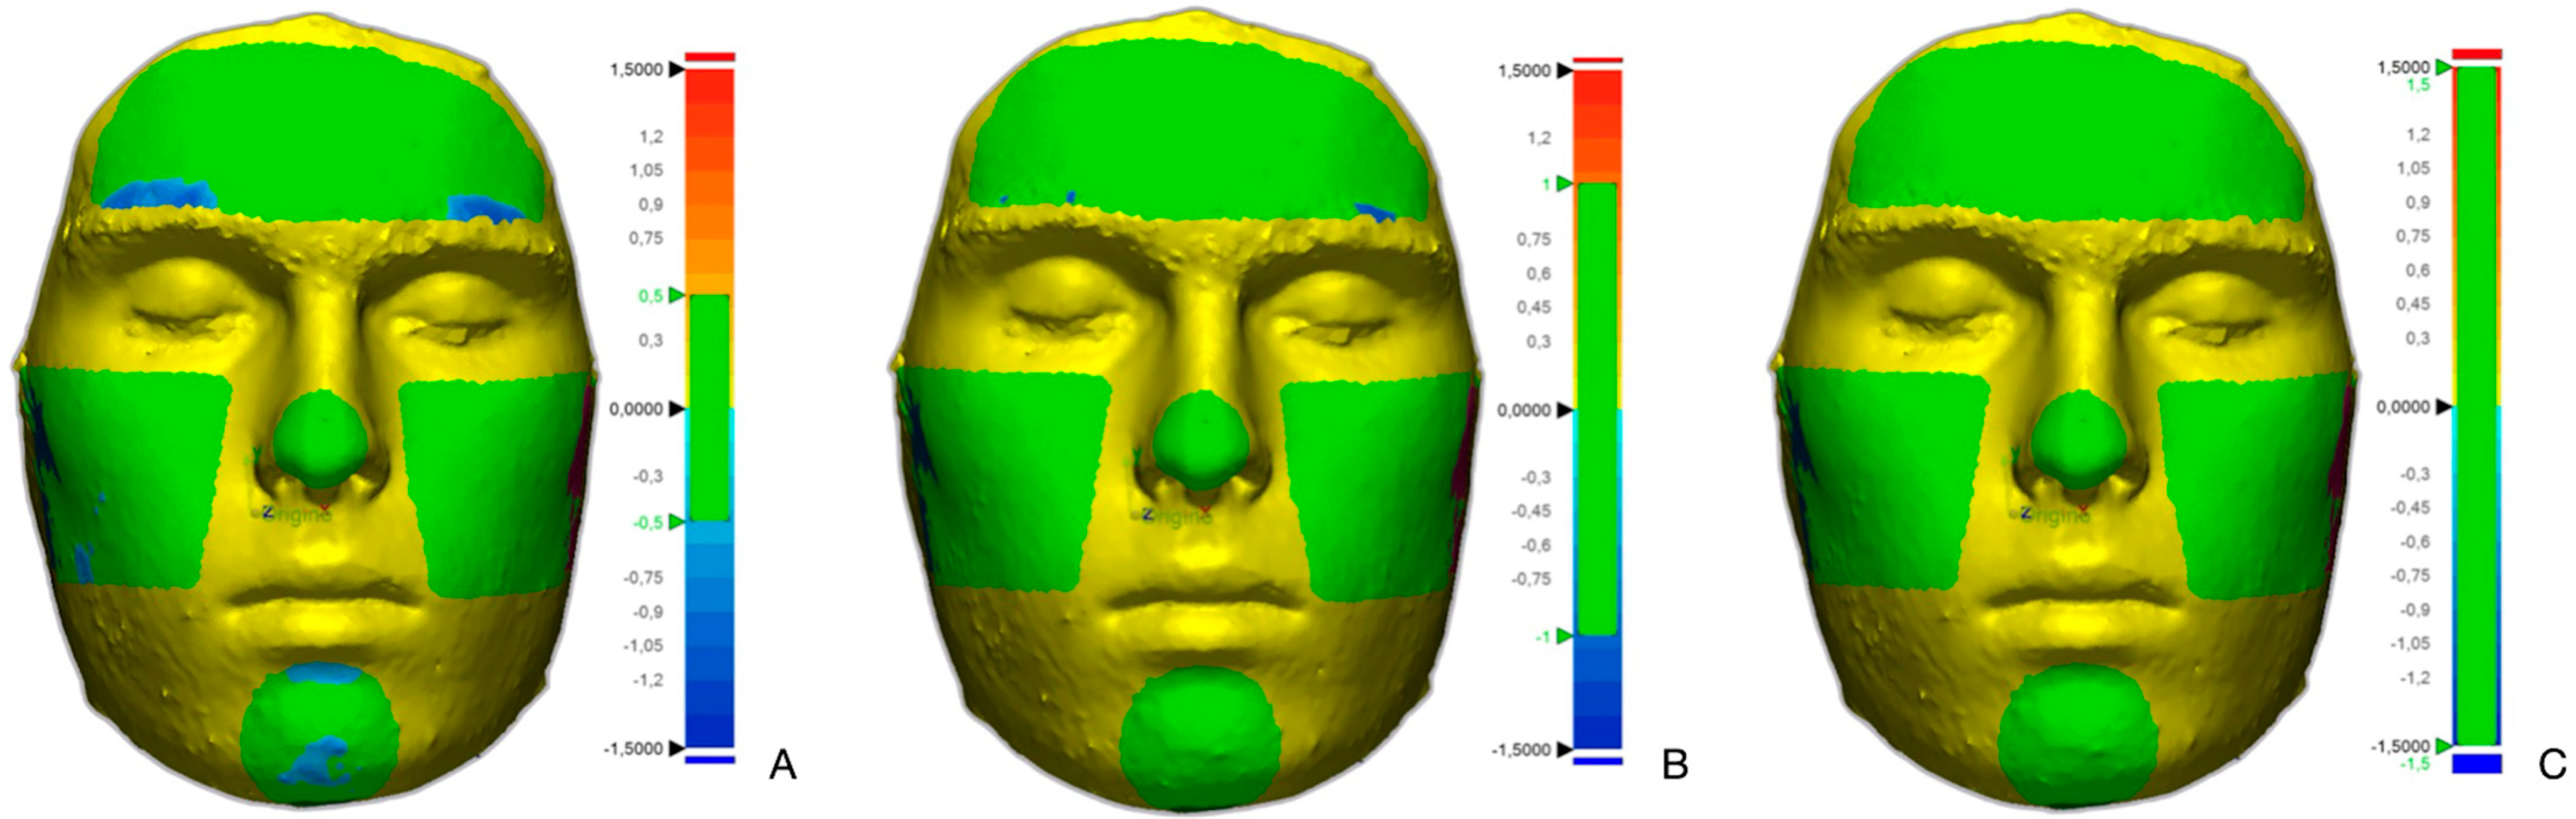
3.3. Analysis of the Areas
4. Discussion
5. Conclusions
- -
- The Vectra 3D and the Eiscan facial scanners generate 3D models with similar, consistent, and replicable measurements, suggesting no systematic advantage of one measurement tool over the other in terms of accuracy compared to anthropometric measurements.
- -
- The analysis of linear measurements on 3D facial scans has proved they are reliable and repeatable, showing no significant differences with respect to each other and with respect to anthropometric measurements. Similarly, all the cephalometric points analyzed turned out to be within the range from 0.5 mm to −0.5 mm, indicating a similarity between the Vectra 3D and the Einscan.
- -
- The comparison of the overlays in the areas of the scans shows that more than 70% of the averages of overlapping surfaces of the forehead, left cheek, right cheek, tip of nose, and chin areas fell within the highly reproducible band (0.5 mm to −0.5 mm). The nose and the right and left cheeks are the area with the highest average percentage of surface in the highly reproducible band (about 80%). Except for the forehead (82.52%), more than 90% of each area analyzed fell within the reproducible band (1.5 mm to −1.5 mm).
- -
- Three-dimensional facial scanners represent a promising tool in the field of dentistry and orthognathic surgery, allowing for a three-dimensional analysis of patients’ faces, treatment predictions, and soft tissue analysis without the use of radiation.
- -
- Future studies should aim to analyze different facial types as well as various environmental conditions to be considered for successful scanning.
Author Contributions
Funding
Institutional Review Board Statement
Informed Consent Statement
Data Availability Statement
Conflicts of Interest
References
- Hartmann, R.; Nieberle, F.; Palm, C.; Brébant, V.; Prantl, L.; Kuehle, R.; Reichert, T.E.; Taxis, J.; Ettl, T. Utility of Smartphone-based Three-dimensional Surface Imaging for Digital Facial Anthropometry. JPRAS Open 2024, 39, 330–343. [Google Scholar] [CrossRef] [PubMed]
- Andrews, J.; Alwafi, A.; Bichu, Y.M.; Pliska, B.T.; Mostafa, N.; Zou, B. Validation of three-dimensional facial imaging captured with smartphone-based photogrammetry application in comparison to stereophotogrammetry system. Heliyon 2023, 9, e15834. [Google Scholar] [CrossRef] [PubMed]
- Rasteau, S.; Sigaux, N.; Louvrier, A.; Bouletreau, P. Three-dimensional acquisition technologies for facial soft tissues—Applications and prospects in orthognathic surgery. J. Stomatol. Oral Maxillofac. Surg. 2020, 121, 721–728. [Google Scholar] [CrossRef] [PubMed]
- Gibelli, D.; Pucciarelli, V.; Caplova, Z.; Cappella, A.; Dolci, C.; Cattaneo, C.; Sforza, C. Validation of a low-cost laser scanner device for the assessment of three-dimensional facial anatomy in living subjects. J. Craniomaxillofac. Surg. 2018, 46, 1493–1499. [Google Scholar] [CrossRef]
- Antonacci, D.; Caponio, V.C.A.; Troiano, G.; Pompeo, M.G.; Gianfreda, F.; Canullo, L. Facial scanning technologies in the era of digital workflow: A systematic review and network meta-analysis. J. Prosthodont. Res. 2023, 67, 321–336. [Google Scholar] [CrossRef]
- Bohner, L.; Gamba, D.D.; Hanisch, M.; Marcio, B.S.; Tortamano Neto, P.; Laganá, D.C.; Sesma, N. Accuracy of digital technologies for the scanning of facial, skeletal, and intraoral tissues: A systematic review. J. Prosthet. Dent. 2019, 121, 246–251. [Google Scholar] [CrossRef]
- De Stefani, A.; Barone, M.; Hatami Alamdari, S.; Barjami, A.; Baciliero, U.; Apolloni, F.; Gracco, A.; Bruno, G. Validation of Vectra 3D Imaging Systems: A Review. Int. J. Environ. Res. Public Health 2022, 19, 8820. [Google Scholar] [CrossRef]
- Jearanai, T.; Samruajbenjakun, B.; Chanmanee, P. Relationship between Bilateral Landmarks of Facial Asymmetry in Skeletal Class II and Class III in Vertical Dimension: 3D Facial Scan and Cone-Beam Computed Tomography. Diagnostics 2024, 14, 590. [Google Scholar] [CrossRef]
- Pellitteri, F.; Brucculeri, L.; Spedicato, G.A.; Siciliani, G.; Lombardo, L. Comparison of the accuracy of digital face scans obtained by two different scanners. Angle Orthod. 2021, 91, 641–649. [Google Scholar] [CrossRef]
- Koban, K.C.; Perko, P.; Li, Z.; Xu, Y.; Giunta, R.E.; Alfertshofer, M.G.; Kohler, L.H.; Freytag, D.L.; Cotofana, S.; Frank, K. 3D Anthropometric Facial Imaging—A comparison of different 3D scanners. Facial Plast. Surg. Clin. N. Am. 2022, 30, 149–158. [Google Scholar] [CrossRef]
- Choi, J.W.; Lee, J.Y.; Oh, T.S.; Kwon, S.M.; Yang, S.J.; Koh, K.S. Frontal soft tissue analysis using a 3 dimensional camera following two-jaw rotational orthognathic surgery in skeletal class III patients. J. Craniomaxillofac. Surg. 2014, 42, 220–226. [Google Scholar] [CrossRef] [PubMed]
- Gašparović, B.; Morelato, L.; Lenac, K.; Mauša, G.; Zhurov, A.; Katić, V. Comparing Direct Measurements and Three-Dimensional (3D) Scans for Evaluating Facial Soft Tissue. Sensors 2023, 23, 2412. [Google Scholar] [CrossRef] [PubMed]
- Pellitteri, F.; Scisciola, F.; Cremonini, F.; Baciliero, M.; Lombardo, L. Accuracy of 3D facial scans: A comparison of three different scanning system in an in vivo study. Prog. Orthod. 2023, 24, 44. [Google Scholar] [CrossRef]
- Kim, S.H.; Jung, W.Y.; Seo, Y.J.; Kim, K.A.; Park, K.H.; Park, Y.G. Accuracy and precision of integumental linear dimensions in a three-dimensional facial imaging system. Korean J. Orthod. 2015, 45, 105–112. [Google Scholar] [CrossRef]
- Heike, C.L.; Upson, K.; Stuhaug, E.; Weinberg, S.M. 3D digital stereophotogrammetry: A practical guide to facial image acquisition. Head Face Med. 2010, 6, 18. [Google Scholar] [CrossRef]
- Quinzi, V.; Polizzi, A.; Ronsivalle, V.; Santonocito, S.; Conforte, C.; Manenti, R.J.; Isola, G.; Lo Giudice, A. Facial Scanning Accuracy with Stereophotogrammetry and Smartphone Technology in Children: A Systematic Review. Children 2022, 9, 1390. [Google Scholar] [CrossRef]
- Gibelli, D.; Pucciarelli, V.; Cappella, A.; Dolci, C.; Sforza, C. Are Portable Stereophotogrammetric Devices Reliable in Facial Imaging? A Validation Study of VECTRA H1 Device. J. Oral Maxillofac. Surg. 2018, 76, 1772–1784. [Google Scholar] [CrossRef]
- Weber, D.W.; Fallis, D.W.; Packer, M.D. Three-dimensional reproducibility of natural head position. Am. J. Orthod. Dentofac. Orthop. 2013, 143, 738–744. [Google Scholar] [CrossRef]
- Wang, X.W.; Liu, Z.J.; Diao, J.; Zhao, Y.J.; Jiang, J.H. Morphologic reproducibility in 6 regions of the 3-dimensional facial models acquired by a stand-ardized procedure: An in vivo study. Am. J. Orthod. Dentofac. Orthop. 2022, 161, e287–e295. [Google Scholar] [CrossRef]
- Amornvit, P.; Sanohkan, S. The Accuracy of Digital Face Scans Obtained from 3D Scanners: An In Vitro Study. Int. J. Environ. Res. Public Health 2019, 16, 5061. [Google Scholar] [CrossRef]
- Gallardo, Y.N.R.; Salazar-Gamarra, R.; Bohner, L.; De Oliveira, J.I.; Dib, L.L.; Sesma, N. Evaluation of the 3D error of 2 face-scanning systems: An in vitro analysis. J. Prosthet. Dent. 2023, 129, 630–636. [Google Scholar] [CrossRef] [PubMed]
- Sarkarat, F.; Tofighi, O.; Jamilian, A.; Fateh, A.; Abbaszadeh, F. Are Virtually Designed 3D Printed Surgical Splints Accurate Enough for Maxillary Reposition as an Intermediate Orthognathic Surgical Guide. J. Maxillofac. Oral Surg. 2023, 22, 861–872. [Google Scholar] [CrossRef] [PubMed] [PubMed Central]
- Li, Z.; Giunta, R.E.; Frank, K.; Schenck, T.L.; Koban, K.C. Reproducibility of Novel Soft-Tissue Landmarks on Three-Dimensional Human Facial Scan Images in Caucasian and Asian. Aesthetic Plast. Surg. 2022, 46, 719–731. [Google Scholar] [CrossRef] [PubMed]
- de Sá Gomes, C.F.; Libdy, M.R.; Normando, D. Scan time, reliability and accuracy of craniofacial measurements using a 3D light scanner. J. Oral Biol. Craniofac. Res. 2019, 9, 331–335. [Google Scholar] [CrossRef]
- Othman, S.A.; Ahmad, R.; Mericant, A.F.; Jamaludin, M. Reproducibility of facial soft tissue landmarks on facial images captured on a 3D camera. Aust. Orthod. J. 2013, 29, 58–65. [Google Scholar] [CrossRef]
- Wang, C.; Shi, Y.F.; Xiong, Q.; Xie, P.J.; Wu, J.H.; Liu, W.C. Trueness of One Stationary and Two Mobile Systems for Three-Dimensional Facial Scanning. Int. J. Prosthodont. 2022, 35, 350–356. [Google Scholar] [CrossRef]
- Hong, C.; Choi, K.; Kachroo, Y.; Kwon, T.; Nguyen, A.; McComb, R.; Moon, W. Evaluation of the 3dMDface system as a tool for soft tissue analysis. Orthod. Craniofac. Res. 2017, 20 (Suppl. 1), 119–124. [Google Scholar] [CrossRef] [PubMed] [PubMed Central]
- Dindaroğlu, F.; Kutlu, P.; Duran, G.S.; Görgülü, S.; Aslan, E. Accuracy and reliability of 3D stereophotogrammetry: A comparison to direct anthropometry and 2D photogrammetry. Angle Orthod. 2016, 86, 487–494. [Google Scholar] [CrossRef]
- Aljawad, H.; Lim, H.J.; Lee, K.C. Anthropometric Comparison of 3-Dimensional Facial Scan Taken With a Low-Cost Facial Scanner With Cone-Beam Computed Tomography Scan. J. Craniofac. Surg. 2023, 34, 1456–1458. [Google Scholar] [CrossRef]
- Oh, S.H.; Kang, J.H.; Seo, Y.K.; Lee, S.R.; Choi, H.Y.; Choi, Y.S.; Hwang, E.H. Linear accuracy of cone-beam computed tomography and a 3-dimensional facial scanning system: An anthropomorphic phantom study. Imaging Sci. Dent. 2018, 48, 111–119. [Google Scholar] [CrossRef]
- Fink, M.; Medelnik, J.; Strobel, K.; Hirschfelder, U.; Hofmann, E. Metric precision via soft-tissue landmarks in three-dimensional structured-light scans of human faces. J. Orofac. Orthop. 2014, 75, 133–143, (In English, German). [Google Scholar] [CrossRef] [PubMed]
- Leung, M.Y.; Lo, J.; Leung, Y.Y. Accuracy of Different Modalities to Record Natural Head Position in 3 Dimensions: A Systematic Review. J. Oral Maxillofac. Surg. 2016, 74, 2261–2284. [Google Scholar] [CrossRef] [PubMed]
- Staller, S.; Anigbo, J.; Stewart, K.; Dutra, V.; Turkkahraman, H. Precision and accuracy assessment of single and multicamera three-dimensional photogrammetry compared with direct anthropometry. Angle Orthod. 2022, 92, 635–641. [Google Scholar] [CrossRef] [PubMed]
- Revilla-León, M.; Pérez-Barquero, J.A.; Barmak, B.A.; Agustín-Panadero, R.; Fernández-Estevan, L.; Att, W. Facial scanning accuracy depending on the alignment algorithm and digitized surface area location: An in vitro study. J. Dent. 2021, 110, 103680. [Google Scholar] [CrossRef]
- Kau, C.H.; Richmond, S.; Zhurov, A.I.; Knox, J.; Chestnutt, I.; Hartles, F.; Playle, R. Reliability of measuring facial morphology with a 3dimensional laser scanning system. Am. J. Orthod. Dentofac. Orthop. 2005, 128, 424–430. [Google Scholar] [CrossRef]
- VECTRA-M3-User-Guide.pdf. Available online: http://canfieldupgrade.com/assets/media/VECTRA-M3-User-Guide.pdf (accessed on 10 October 2024).
- De Menezes, M.; Rosati, R.; Ferrario, V.F.; Sforza, C. Accuracy and reproducibility of a 3-dimensional stereophotogrammetric imaging system. J. Oral Maxillofac. Surg. 2010, 68, 2129–2135. [Google Scholar] [CrossRef]
- VECTRA-M3 Site. Available online: https://www.canfieldsci.com/imaging-systems/vectra-m3-3d-imaging-system/ (accessed on 10 October 2024).
- SHINING 3D Site. Available online: https://www.shining3d.com/professional-solutions/hybrid-light-source-handheld-3d-scanners/einscan-h2#software (accessed on 10 October 2024).
- Machado, V.; Botelho, J.; Mascarenhas, P.; Mendes, J.J.; Delgado, A. A systematic review and meta-analysis on Bolton’s ratios: Normal occlusion and malocclusion. J. Orthod. 2020, 47, 7–29. [Google Scholar] [CrossRef]
- Torlakovic, L.; Faerøvig, E. Age-related changes of the soft tissue profile from the second to the fourth decades of life. Angle Orthod. 2011, 81, 50–57. [Google Scholar] [CrossRef]
- Plooij, J.M.; Maal, T.J.; Haers, P.; Borstlap, W.A.; Kuijpers-Jagtman, A.M.; Bergé, S.J. Digital three dimensional image fusion processes for planning and evaluating orthodontics and orthognathic surgery. A systematic review. Int. J. Oral Maxillofac. Surg. 2011, 40, 341–352. [Google Scholar] [CrossRef]
- Karadeniz, E.I.; Gonzales, C.; Elekdag Turk, S.; Isci, D.; Sahin-Saglam, A.M.; Alkis, H.; Turk, T.; Darendeliler, M.A. The effect of fluoride on orthodontic tooth movement in humans. A two and three dimensional evaluation. Aust. Orthod. J. 2011, 27, 94–101. [Google Scholar] [CrossRef]

| Cephalometric Point | Definition |
|---|---|
| Trichion (Tr) | The most superior midline point on the forehead, located at the hairline where the forehead meets the scalp. It is anatomically situated at the junction of the frontal bone and the anterior hairline. |
| Soft tissue nasion (Na′) | The midpoint of the junction between the forehead and the nose. It corresponds to the most anterior point on the profile where the nasal dorsum transitions into the glabella, which is the smooth area between the eyebrows. |
| Pronasion (Prn) | The most projected point of the nasal tip, which is commonly referred to as the apex of the nose. |
| Left zygomatic (L-Zyg) | The most lateral point on the contour of the left zygomatic arch. It corresponds to the outermost point of convexity of the left cheekbone area when viewed from the side. This point is typically located in line with the outer corner of the left eye. |
| Right zygomatic (R-Zyg) | The most lateral point on the contour of the right zygomatic arch. It corresponds to the outermost point of convexity of the right cheekbone area when viewed from the side. This point is typically located in line with the outer corner of the right eye. |
| Soft tissue pogonion (Pog′) | The most projected point of the chin. |
| Cephalometric Point | Definition |
|---|---|
| Trichion (Tr) | The most superior midline point on the forehead, located at the hairline where the forehead meets the scalp. It is anatomically situated at the junction of the frontal bone and the anterior hairline. |
| Soft tissue nasion (Na′) | The most anterior point of the soft tissue frontonasal suture, located at the level of the 3-D cephalometric hard tissue nasion landmark. |
| Right zygomatic (R-Zyg) | The most superior point on the right zygomatic arch. |
| Left zygomatic (L-Zyg) | The most superior point on the left zygomatic arch. |
| Pronasion (Prn) | The most anterior midpoint of the nasal tip (on the right and left profile view). If a bifid nose is present, the more protruding tip is chosen. |
| Right alare (R-Al) | The most lateral point on the right alar contour. |
| Left alare (L-Al) | The most lateral point on the left alar contour. |
| Subnasal (Sbn) | Central midpoint on the nasolabial soft tissue contour between the columella crest and the upper lip. |
| Upper lip—UL | The midpoint of the vermilion line of the upper lip. |
| Right labial commissure (R-Com) | The point located at the right labial commissure. |
| Left labial commissure (L-Com) | The point located at the left labial commissure. |
| Lower lip (LL) | The midpoint of the vermilion line of the lower lip. |
| Soft tissue pogonion (Pog′) | The most anterior midpoint on the soft tissue contour of the chin located at the level of the 3D cephalometric hard tissue pogonion landmark. |
| Minimum (mm) | Mean (mm) | SD (mm) | Percentile 25 (mm) | Median (mm) | Percentile 75 (mm) | Maximum (mm) | |
|---|---|---|---|---|---|---|---|
| ANT Tr–Na | 27.47 | 38.42 | 5.05 | 35.92 | 39.55 | 41.26 | 48.29 |
| ANT Na–Prn | 47.80 | 57.21 | 3.91 | 55.83 | 58.15 | 59.66 | 62.26 |
| ANT Prn–Pog | 59.13 | 71.62 | 7.35 | 66.86 | 71.19 | 77.12 | 83.56 |
| ANT Zig–Zig | 94.73 | 103.29 | 6.27 | 97.93 | 102.18 | 105.99 | 119.27 |
| VEC Tr–Na | 28.10 | 38.37 | 5.11 | 35.37 | 39.38 | 41.47 | 47.77 |
| VEC Na–Prn | 45.96 | 56.90 | 4.32 | 55.59 | 57.33 | 59.95 | 62.80 |
| VEC Prn–Pog | 59.32 | 72.14 | 7.61 | 66.69 | 72.19 | 78.88 | 83.47 |
| VEC Zig–Zig | 94.10 | 102.95 | 6.35 | 98.08 | 102.06 | 106.28 | 119.34 |
| EIN Tr–Na | 28.56 | 38.70 | 5.01 | 36.50 | 39.53 | 41.23 | 48.60 |
| EIN Na–Prn | 48.55 | 57.63 | 3.92 | 56.16 | 58.77 | 60.41 | 62.30 |
| EIN Prn–Pog | 59.15 | 72.20 | 7.33 | 66.80 | 72.61 | 78.10 | 83.16 |
| EIN Zig–Zig | 94.23 | 103.18 | 6.67 | 98.07 | 102.34 | 105.88 | 119.88 |
| Variable | ICC |
|---|---|
| ANT Tr–Na | 0.999 |
| ANT Na–Prn | 0.995 |
| ANT Prn–Pog | 0.999 |
| ANT Zig–Zig | 0.999 |
| VEC Tr–Na | 0.986 |
| VEC Na–Prn | 0.974 |
| VEC Prn–Pog | 0.993 |
| VEC Zig–Zig | 0.989 |
| EIN Tr–Na | 0.993 |
| EIN Na–Prn | 0.974 |
| EIN Prn–Pog | 0.987 |
| EIN Zig–Zig | 0.995 |
| ANT | VEC | |||||||
|---|---|---|---|---|---|---|---|---|
| Minimum (mm) | Median (mm) | Maximum (mm) | Minimum (mm) | Median (mm) | Maximum (mm) | W | p | |
| Tr–Na | 35.92 | 39.55 | 41.26 | 35.37 | 39.38 | 41.47 | 80.00 | 0.546 |
| Na–Prn | 55.83 | 58.15 | 59.66 | 55.59 | 57.33 | 59.95 | 75.50 | 0.271 |
| Prn–Pog | 66.86 | 71.19 | 77.12 | 66.69 | 72.19 | 78.88 | 135.00 | 0.263 |
| Zig–Zig | 97.93 | 102.18 | 105.99 | 98.08 | 102.06 | 106.28 | 70.00 | 0.191 |
| ANT | EIN | |||||||
| Minimum (mm) | Median (mm) | Maximum (mm) | Minimum (mm) | Median (mm) | Maximum (mm) | W | p | |
| Tr–Na | 35.92 | 39.55 | 41.26 | 36.50 | 39.53 | 41.23 | 153.50 | 0.070 |
| Na–Prn | 55.83 | 58.15 | 59.66 | 56.16 | 58.77 | 60.41 | 140.00 | 0.191 |
| Prn–Pog | 66.86 | 71.19 | 77.12 | 66.80 | 72.61 | 78.10 | 134.50 | 0.271 |
| Zig–Zig | 97.93 | 102.18 | 105.99 | 98.07 | 102.34 | 105.88 | 84.00 | 0.433 |
| Minimum (mm) | Mean (mm) | SD (mm) | Percentile 25 (mm) | Median (mm) | Percentile 75 (mm) | Maximum (mm) | |
|---|---|---|---|---|---|---|---|
| Trichion | −0.9576 | 0.0691 | 0.4653 | −0.2040 | 0.0798 | 0.3323 | 1.0571 |
| Nasion | −1.0919 | −0.1232 | 0.4209 | −0.4476 | −0.1005 | 0.2036 | 0.4930 |
| Pronasion | −2.0569 | 0.0481 | 0.6468 | −0.0249 | 0.1048 | 0.3227 | 1.0907 |
| Subnasal | −1.2152 | 0.7387 | 1.2711 | −0.1802 | 0.5868 | 1.5739 | 3.5538 |
| Upper lip | −1.4785 | 0.2705 | 0.9270 | −0.1695 | 0.1616 | 1.0000 | 1.8152 |
| Lower lip | −1.6162 | 0.0867 | 1.2139 | −0.9781 | 0.3960 | 1.0638 | 2.2534 |
| Pogonion | −1.7705 | −0.3067 | 0.8115 | −0.8301 | −0.1784 | 0.2539 | 1.1284 |
| Left labial commissure | −1.8904 | −0.0425 | 1.6089 | −1.5048 | −0.2079 | 0.9305 | 3.3753 |
| Right labial commissure | −2.9855 | 0.2858 | 2.1971 | −0.9978 | −0.0780 | 1.3238 | 6.9258 |
| Left alare | −1.4099 | 0.1304 | 0.8296 | −0.4880 | 0.3358 | 0.6662 | 1.6933 |
| Right alare | −1.3692 | 0.0872 | 0.9847 | −0.6098 | −0.0315 | 0.5907 | 2.6395 |
| Left zygomatic | −0.9621 | −0.1617 | 0.3322 | −0.3351 | −0.1484 | 0.0686 | 0.4402 |
| Right zygomatic | −0.9740 | 0.0570 | 0.7289 | −0.2995 | 0.1185 | 0.3025 | 2.5619 |
| Variable | ICC |
|---|---|
| Trichion | 0.999 |
| Nasion | 0.999 |
| Pronasion | 0.998 |
| Subnasal | 0.999 |
| Upper lip | 0.999 |
| Lower lip | 0.999 |
| Pogonion | 0.999 |
| Left labial commissure | 0.999 |
| Right labial commissure | 0.999 |
| Left alare | 0.999 |
| Right alare | 0.999 |
| Left zygomatic | 0.909 |
| Right zygomatic | 0.999 |
| Minimum (mm) | Median (mm) | Maximum (mm) | W | p | |
|---|---|---|---|---|---|
| Trichion | −0.2040 | 0.0798 | 0.3323 | 127.00 | 0.411 |
| Nasion | −0.4476 | −0.1005 | 0.2036 | 74.00 | 0.247 |
| Pronasion | −0.0249 | 0.1048 | 0.3227 | 149.00 | 0.100 |
| Subnasal | −0.1802 | 0.5868 | 1.5739 | 168.00 | 0.052 |
| Upper lip | 0.1695 | 0.1616 | 1.0000 | 142.00 | 0.167 |
| Lower lip | −0.9781 | 0.3960 | 1.0638 | 111.00 | 0.823 |
| Pogonion | −0.8301 | −0.1784 | 0.2539 | 63.00 | 0.117 |
| Left labial commissure | −1.5048 | −0.2079 | 0.9305 | 93.00 | 0.654 |
| Right labial commissure | −0.9978 | −0.0780 | 1.3238 | 108.00 | 0.911 |
| Left alare | −0.4880 | 0.3358 | 0.6662 | 126.00 | 0.433 |
| Right alare | −0.6098 | −0.0315 | 0.5907 | 108.00 | 0.911 |
| Left zygomatic | −0.3351 | −0.1484 | 0.0686 | 52.00 | 0.05 |
| Right zygomatic | −0.2995 | 0.1185 | 0.3035 | 107.00 | 0.940 |
| Minimum (%) | Mean (%) | SD (%) | Percentile 25 (%) | Median (%) | Percentile 75 (%) | Maximum (%) | |
|---|---|---|---|---|---|---|---|
| Tip of the nose 0.5 (−0.5) | 0.00 | 80.22 | 34.93 | 74.22 | 99.71 | 100.00 | 100.00 |
| Tip of the nose 1 (−1) | 0.00 | 14.21 | 28.23 | 0.00 | 0.10 | 7.94 | 96.02 |
| Tip of the nose 1.5 (−1.5) | 0.00 | 0.73 | 3.28 | 0.00 | 0.00 | 0.00 | 14.66 |
| Tip of the nose > 1.5 | 0.00 | 0.00 | 0.00 | 0.00 | 0.00 | 0.00 | 0.00 |
| Tip of the nose < −1.5 | 0.00 | 4.27 | 19.08 | 0.00 | 0.00 | 0.00 | 85.34 |
| Forehead 0.5 (−0.5) | 49.35 | 71.72 | 14.27 | 60.38 | 70.94 | 79.57 | 99.29 |
| Forehead 1 (−1) | 0.71 | 8.67 | 8.17 | 2.46 | 5.96 | 12.49 | 29.36 |
| Forehead 1.5 (−1.5) | 0.00 | 2.13 | 1.26 | 1.20 | 2.06 | 2.98 | 5.50 |
| Forehead > 1.5 | 0.00 | 6.86 | 5.63 | 1.65 | 5.73 | 10.78 | 17.93 |
| Forehead < −1.5 | 0.00 | 10.63 | 9.76 | 3.17 | 8.29 | 15.02 | 37.43 |
| Chin 0.5 (−0.5) | 11.61 | 70.46 | 30.14 | 44.41 | 76.13 | 100.00 | 100.00 |
| Chin 1 (−1) | 0.00 | 23.97 | 24.15 | 0.00 | 23.64 | 39.73 | 72.67 |
| Chin 1.5 (−1.5) | 0.00 | 2.91 | 7.13 | 0.00 | 0.00 | 0.00 | 22.17 |
| Chin > 1.5 | 0.00 | 0.66 | 2.94 | 0.00 | 0.00 | 0.00 | 13.13 |
| Chin < −1.5 | 0.00 | 1.57 | 7.01 | 0.00 | 0.00 | 0.00 | 31.33 |
| Left cheek 0.5 (−0.5) | 37.41 | 80.80 | 19.15 | 70.75 | 84.31 | 98.01 | 100.00 |
| Left cheek 1 (−1) | 0.00 | 13.73 | 11.92 | 1.99 | 12.50 | 20.88 | 39.73 |
| Left cheek 1.5 (−1.5) | 0.00 | 4.19 | 7.42 | 0.00 | 0.00 | 7.82 | 23.90 |
| Left cheek > 1.5 | 0.00 | 0.58 | 2.58 | 0.00 | 0.00 | 0.00 | 11.52 |
| Left cheek < −1.5 | 0.00 | 0.33 | 1.03 | 0.00 | 0.00 | 0.00 | 3.74 |
| Right cheek 0.5 (−0.5) | 38.14 | 79.44 | 18.41 | 65.31 | 79.53 | 98.57 | 100.00 |
| Right cheek 1 (−1) | 0.00 | 14.60 | 12.96 | 1.43 | 13.56 | 22.79 | 42.44 |
| Right cheek 1.5 (−1.5) | 0.00 | 4.69 | 7.39 | 0.00 | 0.00 | 12.24 | 21.35 |
| Right cheek > 1.5 | 0.00 | 0.71 | 2.12 | 0.00 | 0.00 | 0.00 | 8.83 |
| Right cheek < 1.5 | 0.00 | 0.44 | 1.50 | 0.00 | 0.00 | 0.00 | 6.61 |
Disclaimer/Publisher’s Note: The statements, opinions and data contained in all publications are solely those of the individual author(s) and contributor(s) and not of MDPI and/or the editor(s). MDPI and/or the editor(s) disclaim responsibility for any injury to people or property resulting from any ideas, methods, instructions or products referred to in the content. |
© 2025 by the authors. Licensee MDPI, Basel, Switzerland. This article is an open access article distributed under the terms and conditions of the Creative Commons Attribution (CC BY) license (https://creativecommons.org/licenses/by/4.0/).
Share and Cite
Pellitteri, F.; Calza, M.; Baldi, G.; De Maio, M.; Lombardo, L. Reproducibility and Accuracy of Two Facial Scanners: A 3D In Vivo Study. Appl. Sci. 2025, 15, 1191. https://doi.org/10.3390/app15031191
Pellitteri F, Calza M, Baldi G, De Maio M, Lombardo L. Reproducibility and Accuracy of Two Facial Scanners: A 3D In Vivo Study. Applied Sciences. 2025; 15(3):1191. https://doi.org/10.3390/app15031191
Chicago/Turabian StylePellitteri, Federica, Marta Calza, Giacomo Baldi, Matteo De Maio, and Luca Lombardo. 2025. "Reproducibility and Accuracy of Two Facial Scanners: A 3D In Vivo Study" Applied Sciences 15, no. 3: 1191. https://doi.org/10.3390/app15031191
APA StylePellitteri, F., Calza, M., Baldi, G., De Maio, M., & Lombardo, L. (2025). Reproducibility and Accuracy of Two Facial Scanners: A 3D In Vivo Study. Applied Sciences, 15(3), 1191. https://doi.org/10.3390/app15031191