


A Combined High and Low Cycle Fatigue Life Prediction Model for Wind Turbine Blades

Abstract
1. Introduction
2. Miner’s Rule and Fatigue Damage Accumulation Under Variable Amplitude Cyclic Load
2.1. Miner’s Rule
2.2. Fatigue Damage Accumulation Under Variable Amplitude Cyclic Loading
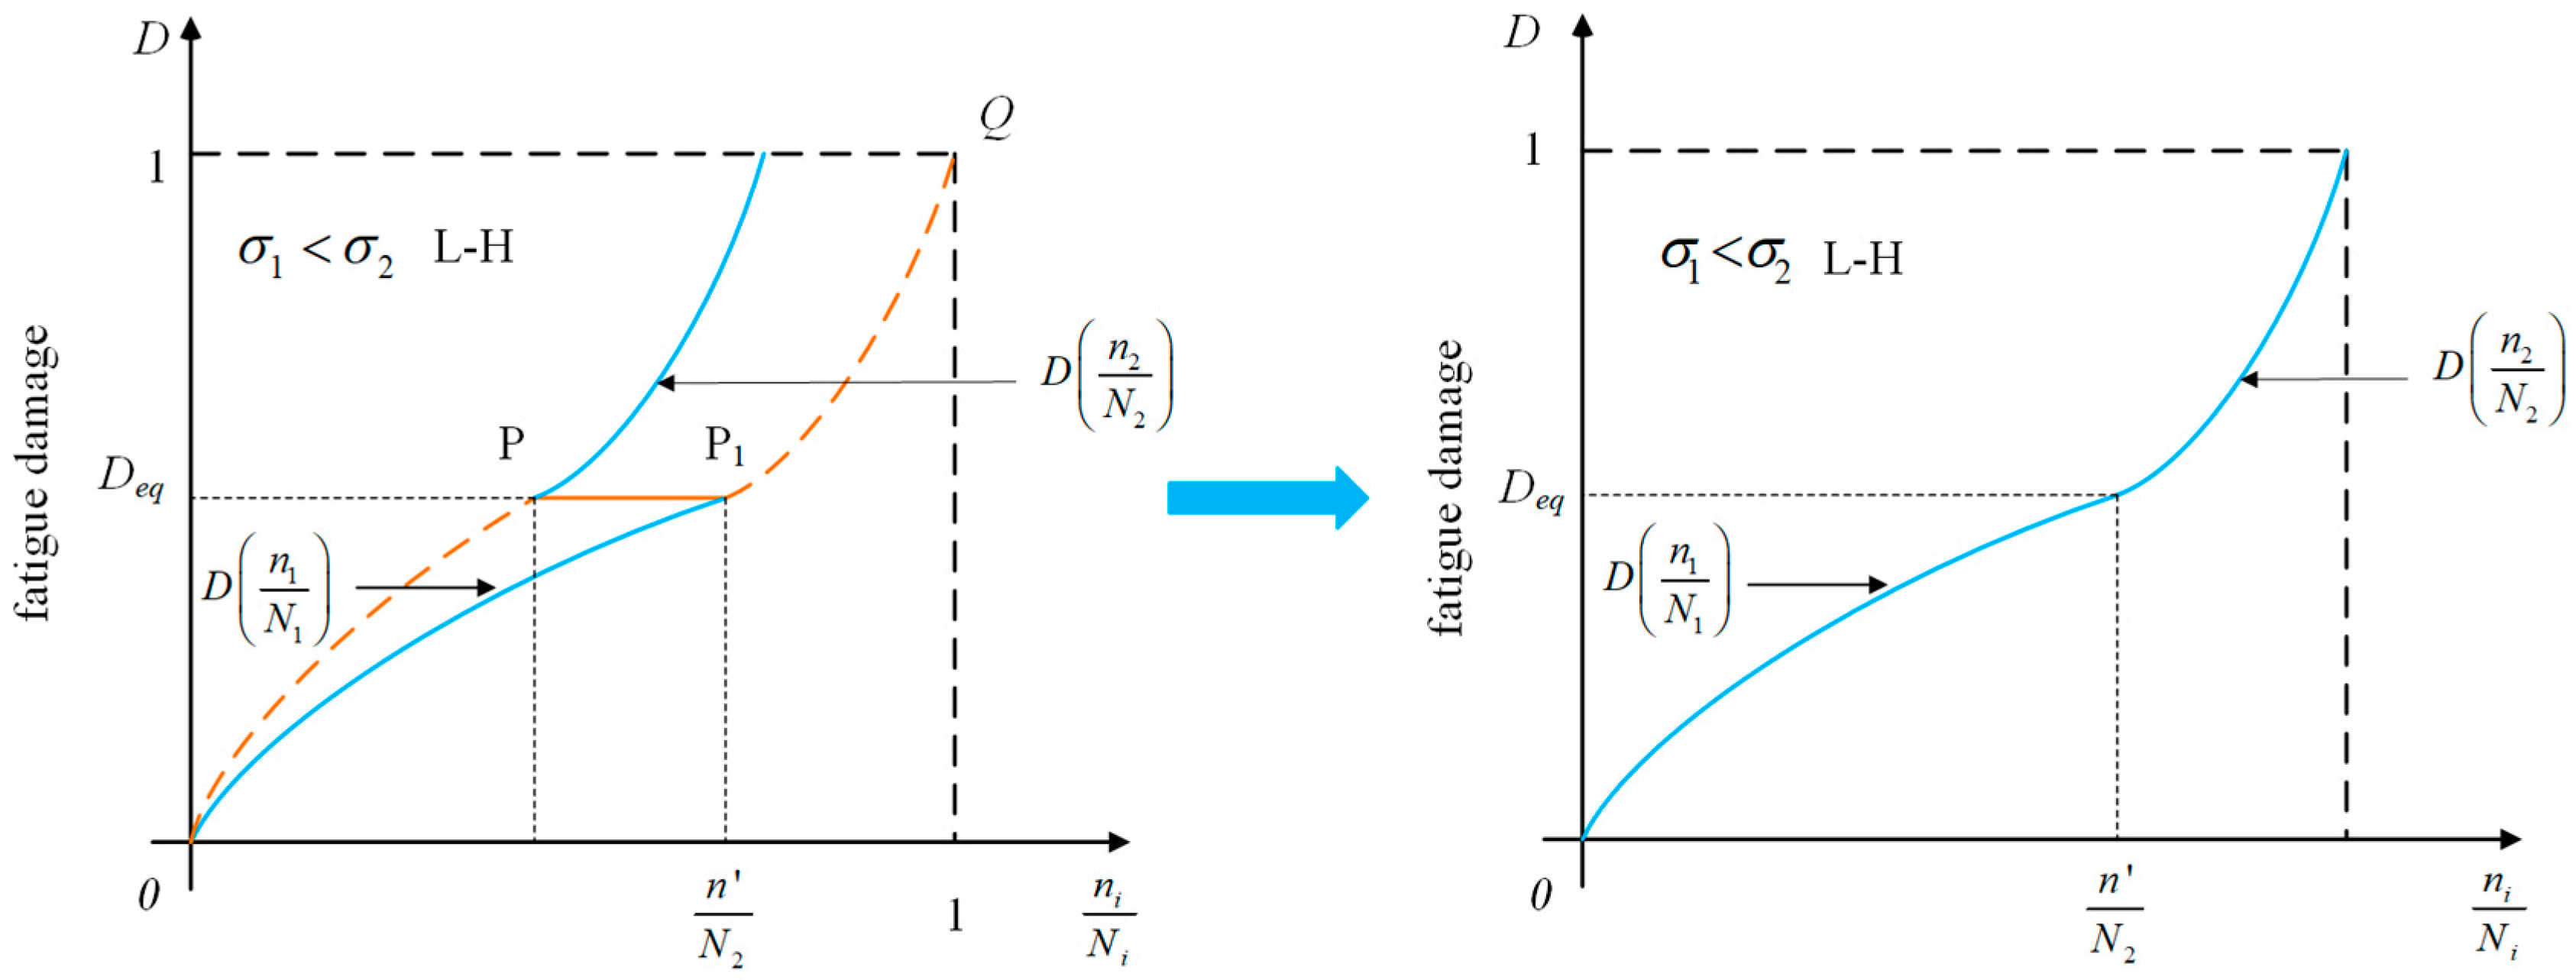
2.3. Nonlinear Damage Accumulation Considering Load Interactions
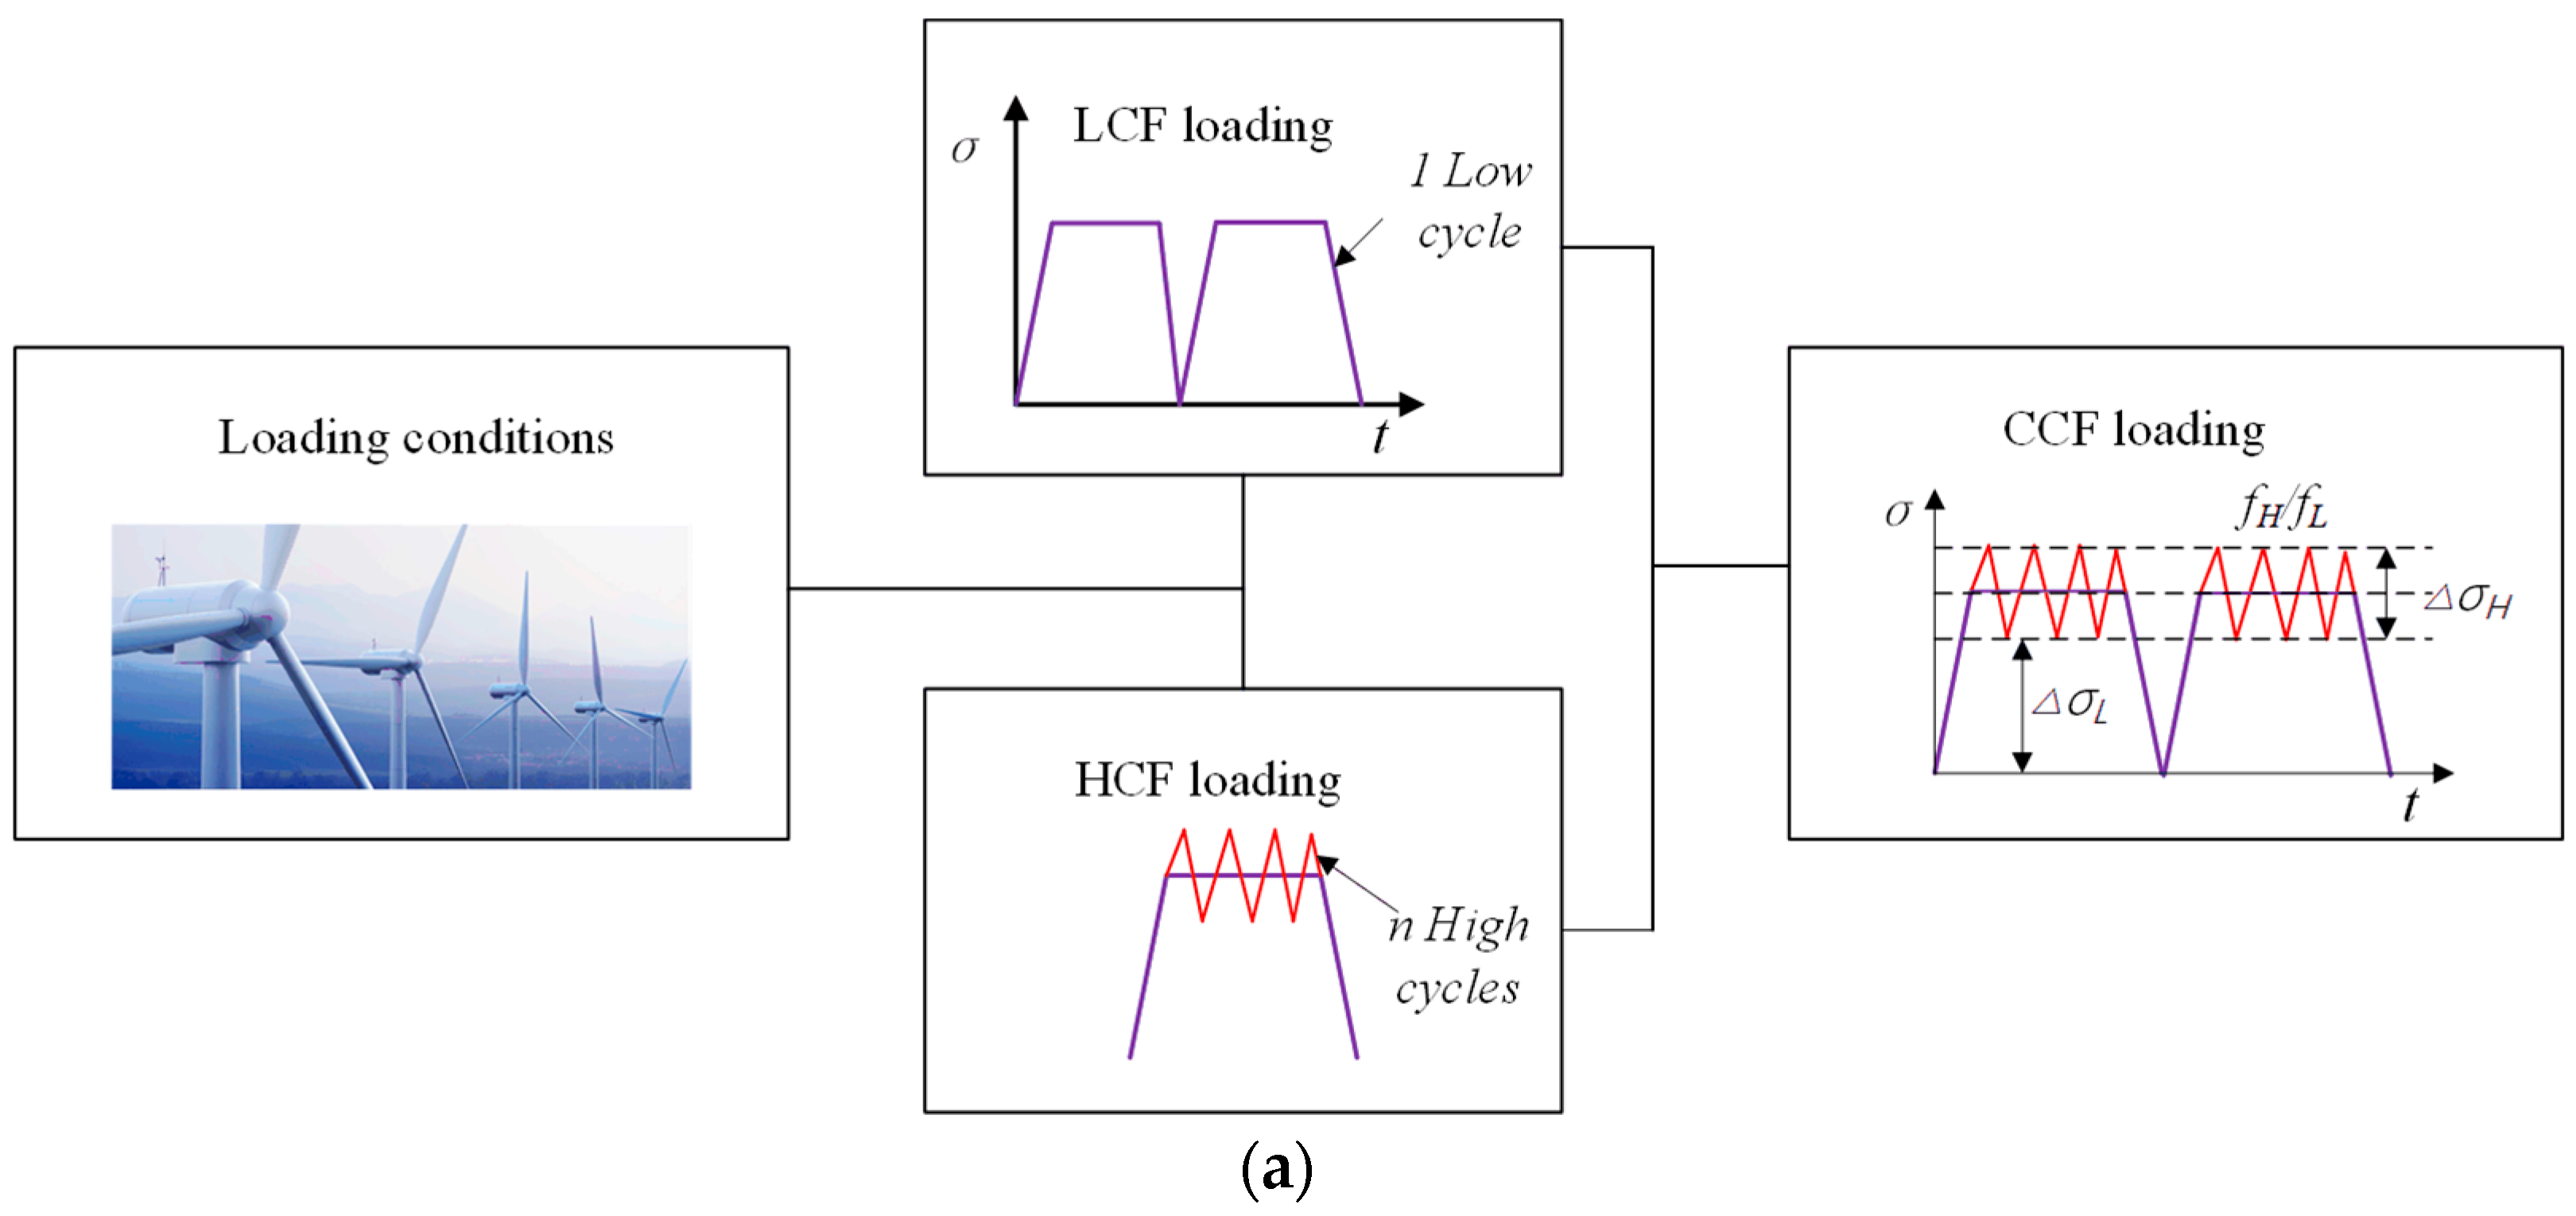
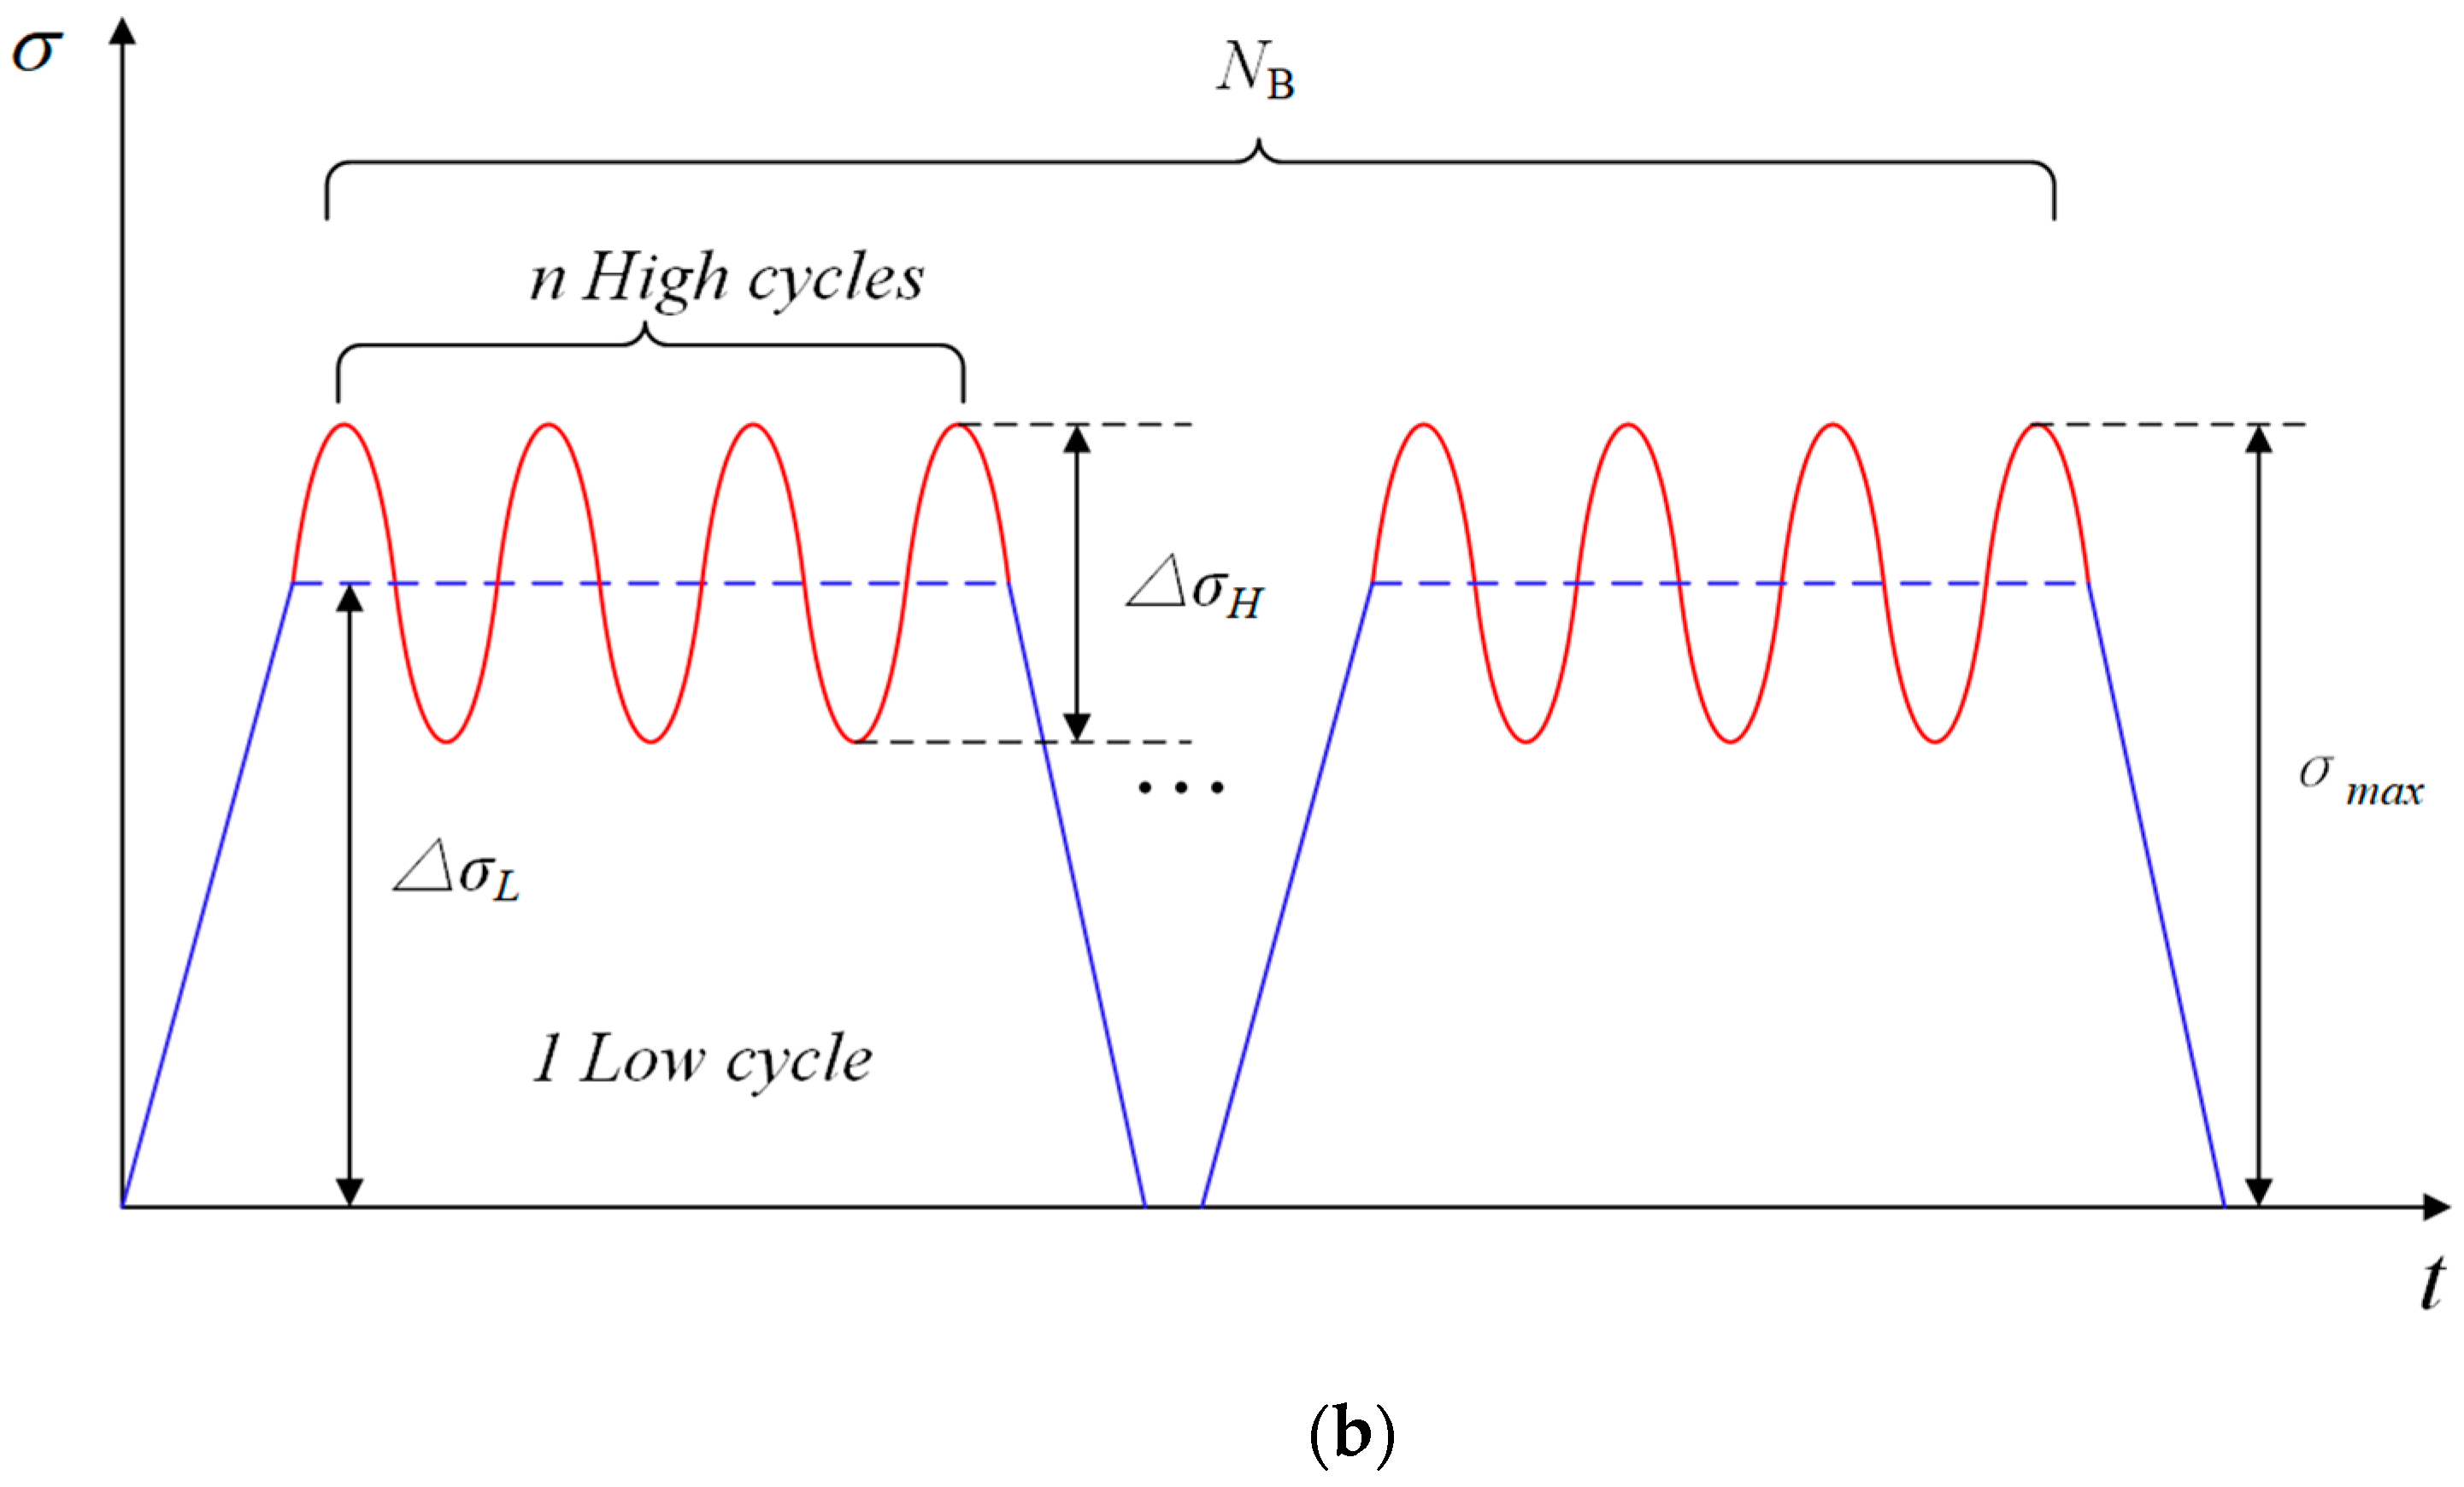
3. Outline of New CCF Life Prediction Model
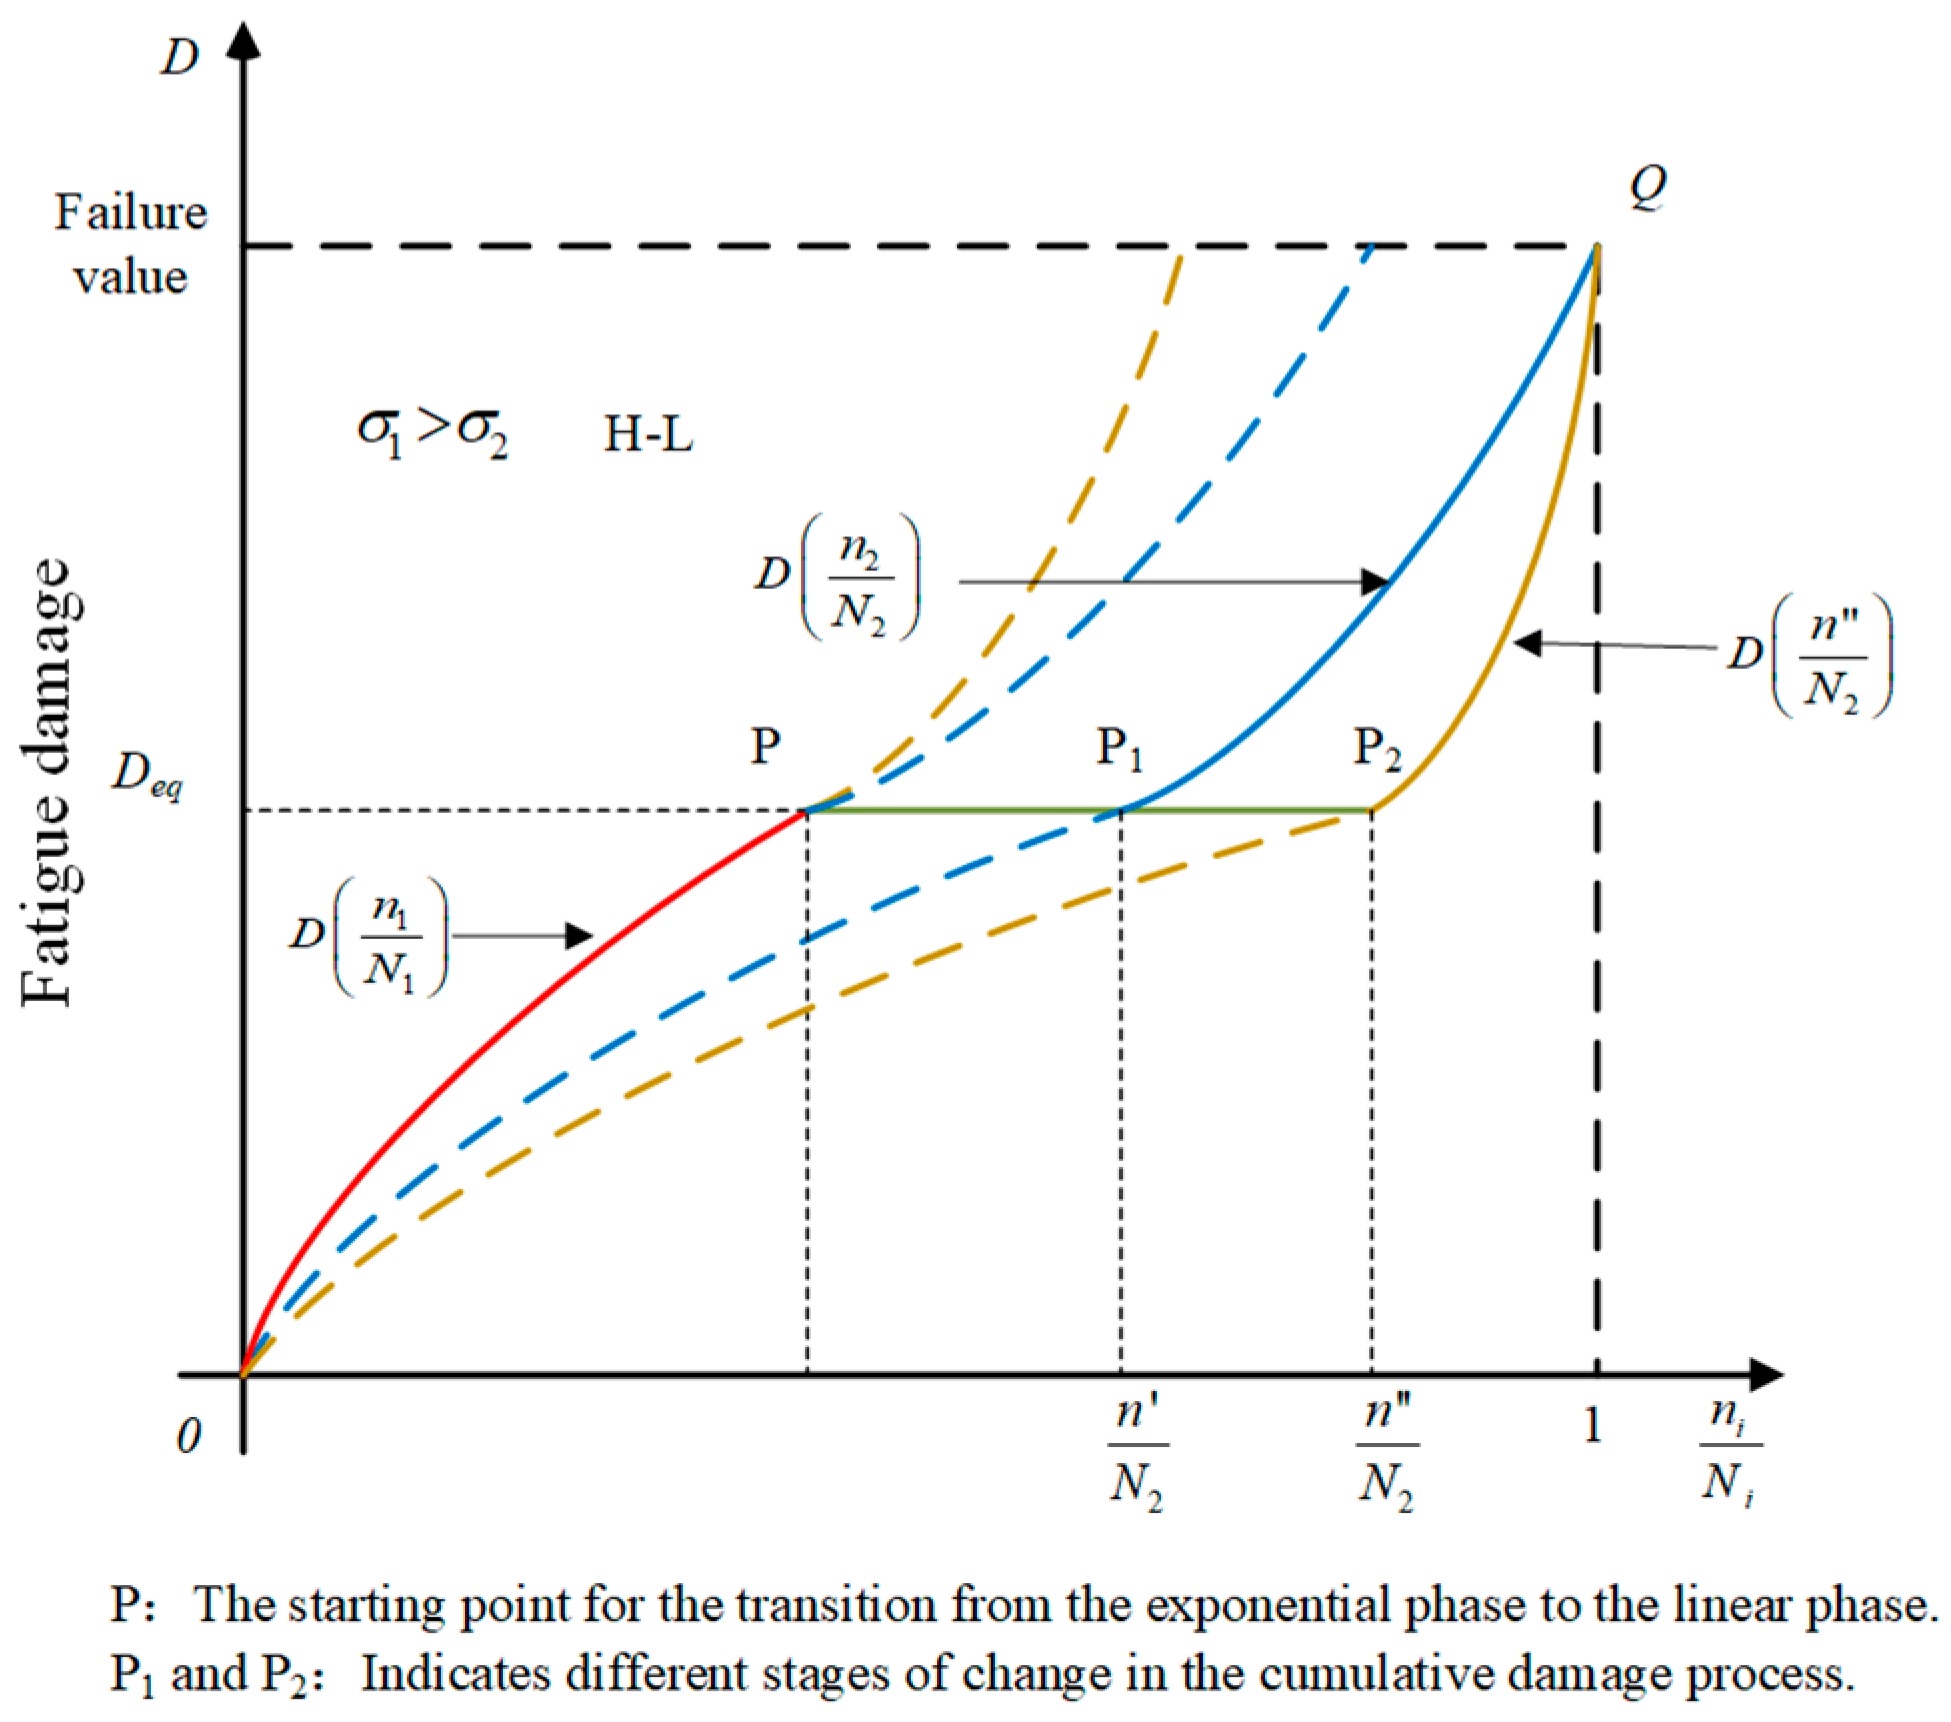
3.1. Nonlinear Fatigue Damage Considering Load Interactions
3.2. New CCF Life Prediction Model
4. Model Validation and Comparison
4.1. Model Validation Classical CCF Life Prediction Model
4.2. Model Validation
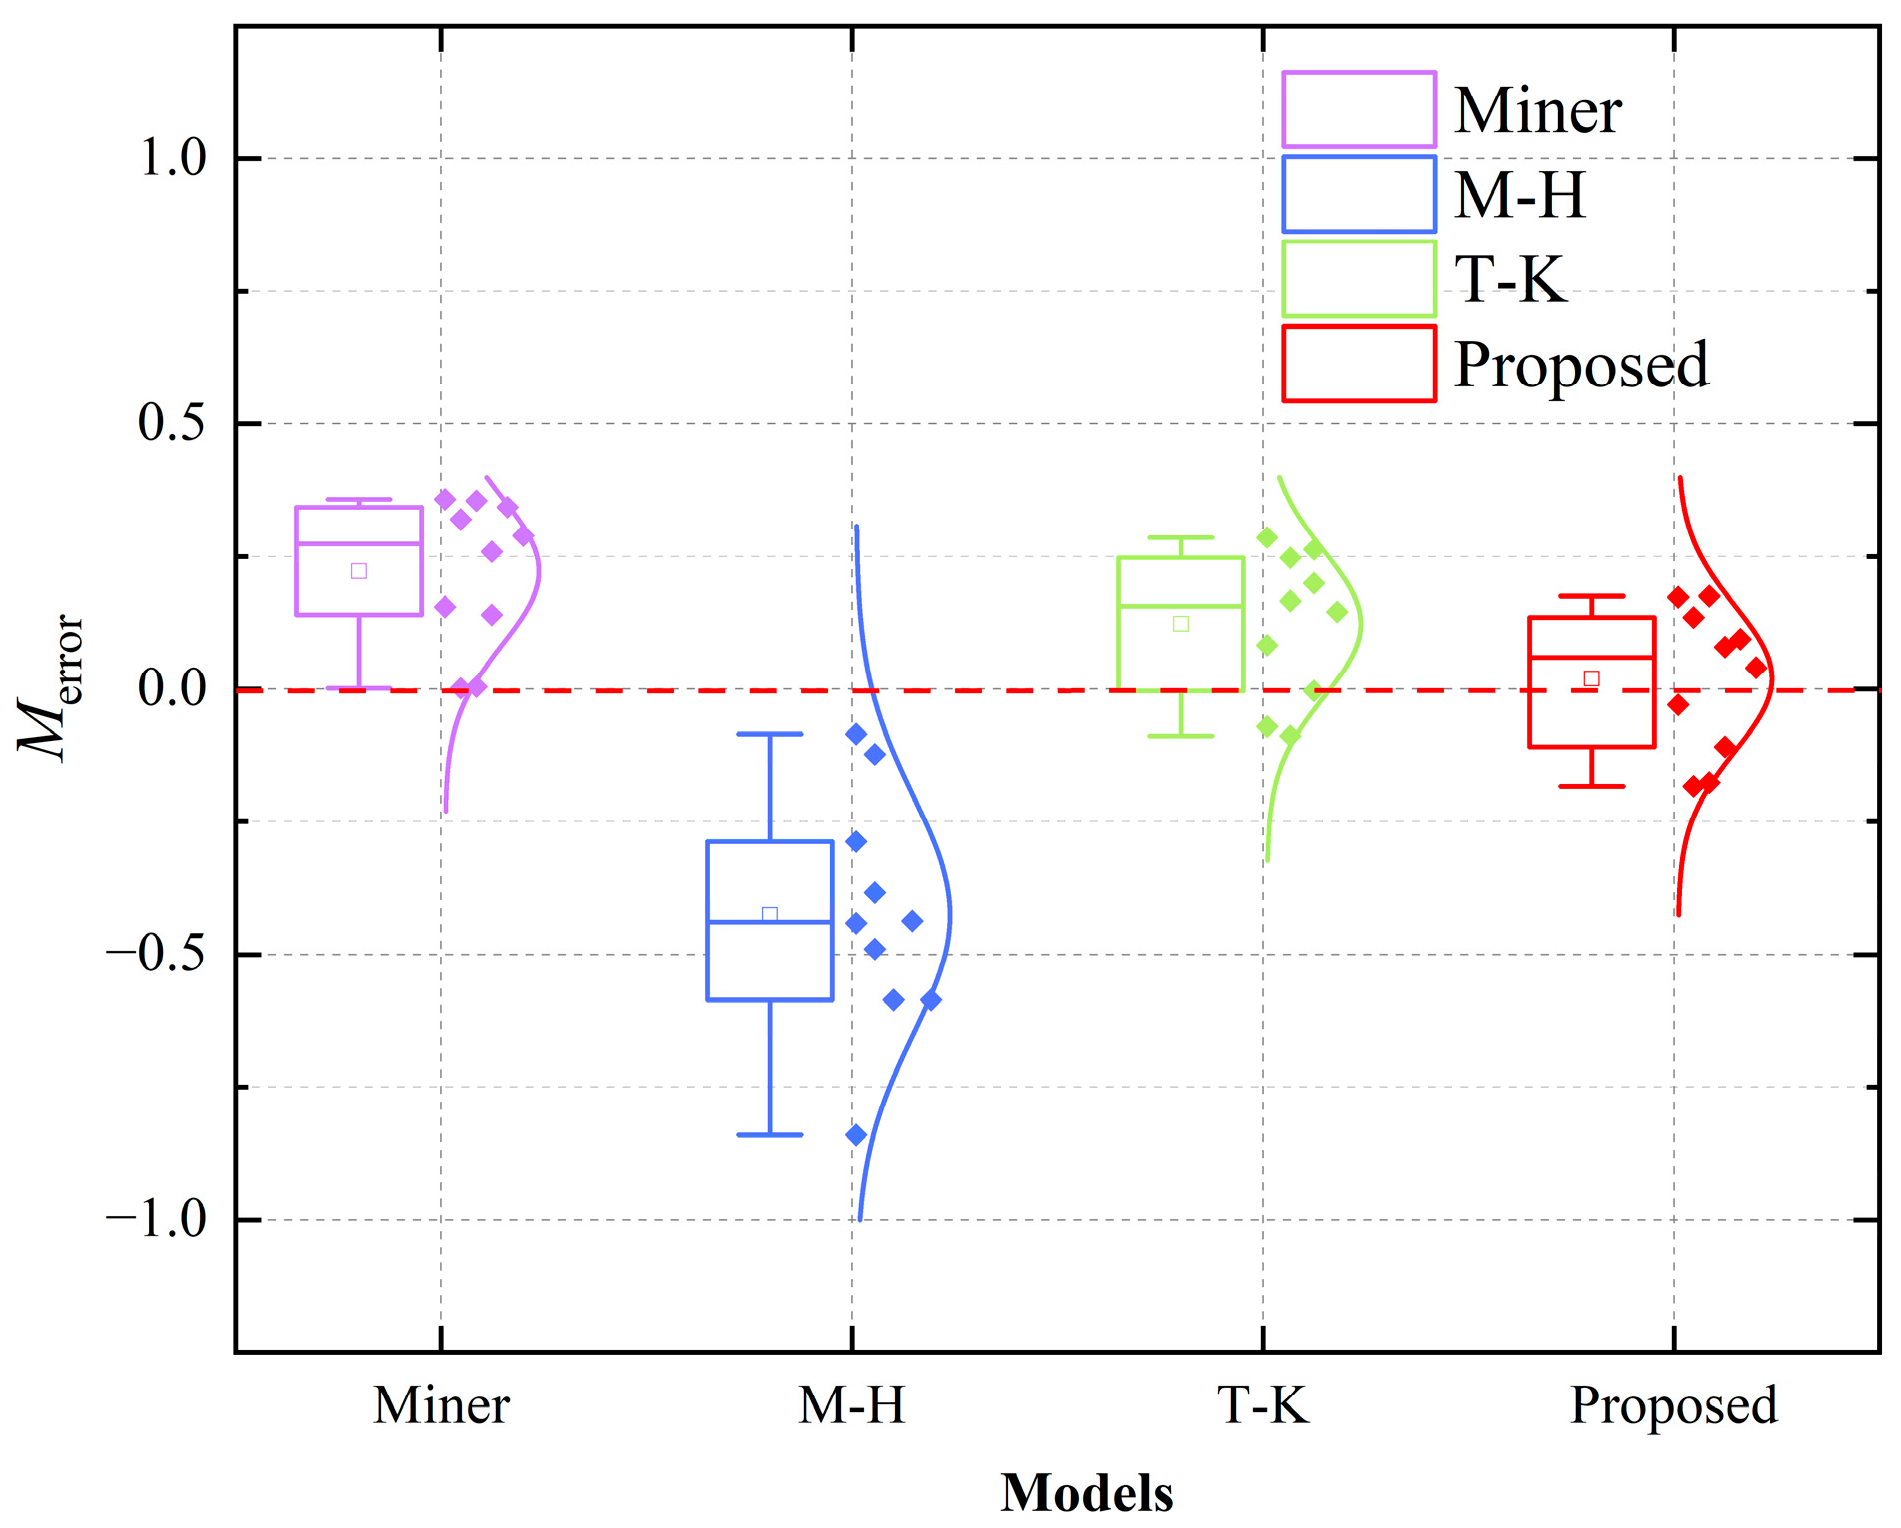
4.3. Modeling Error Assessment
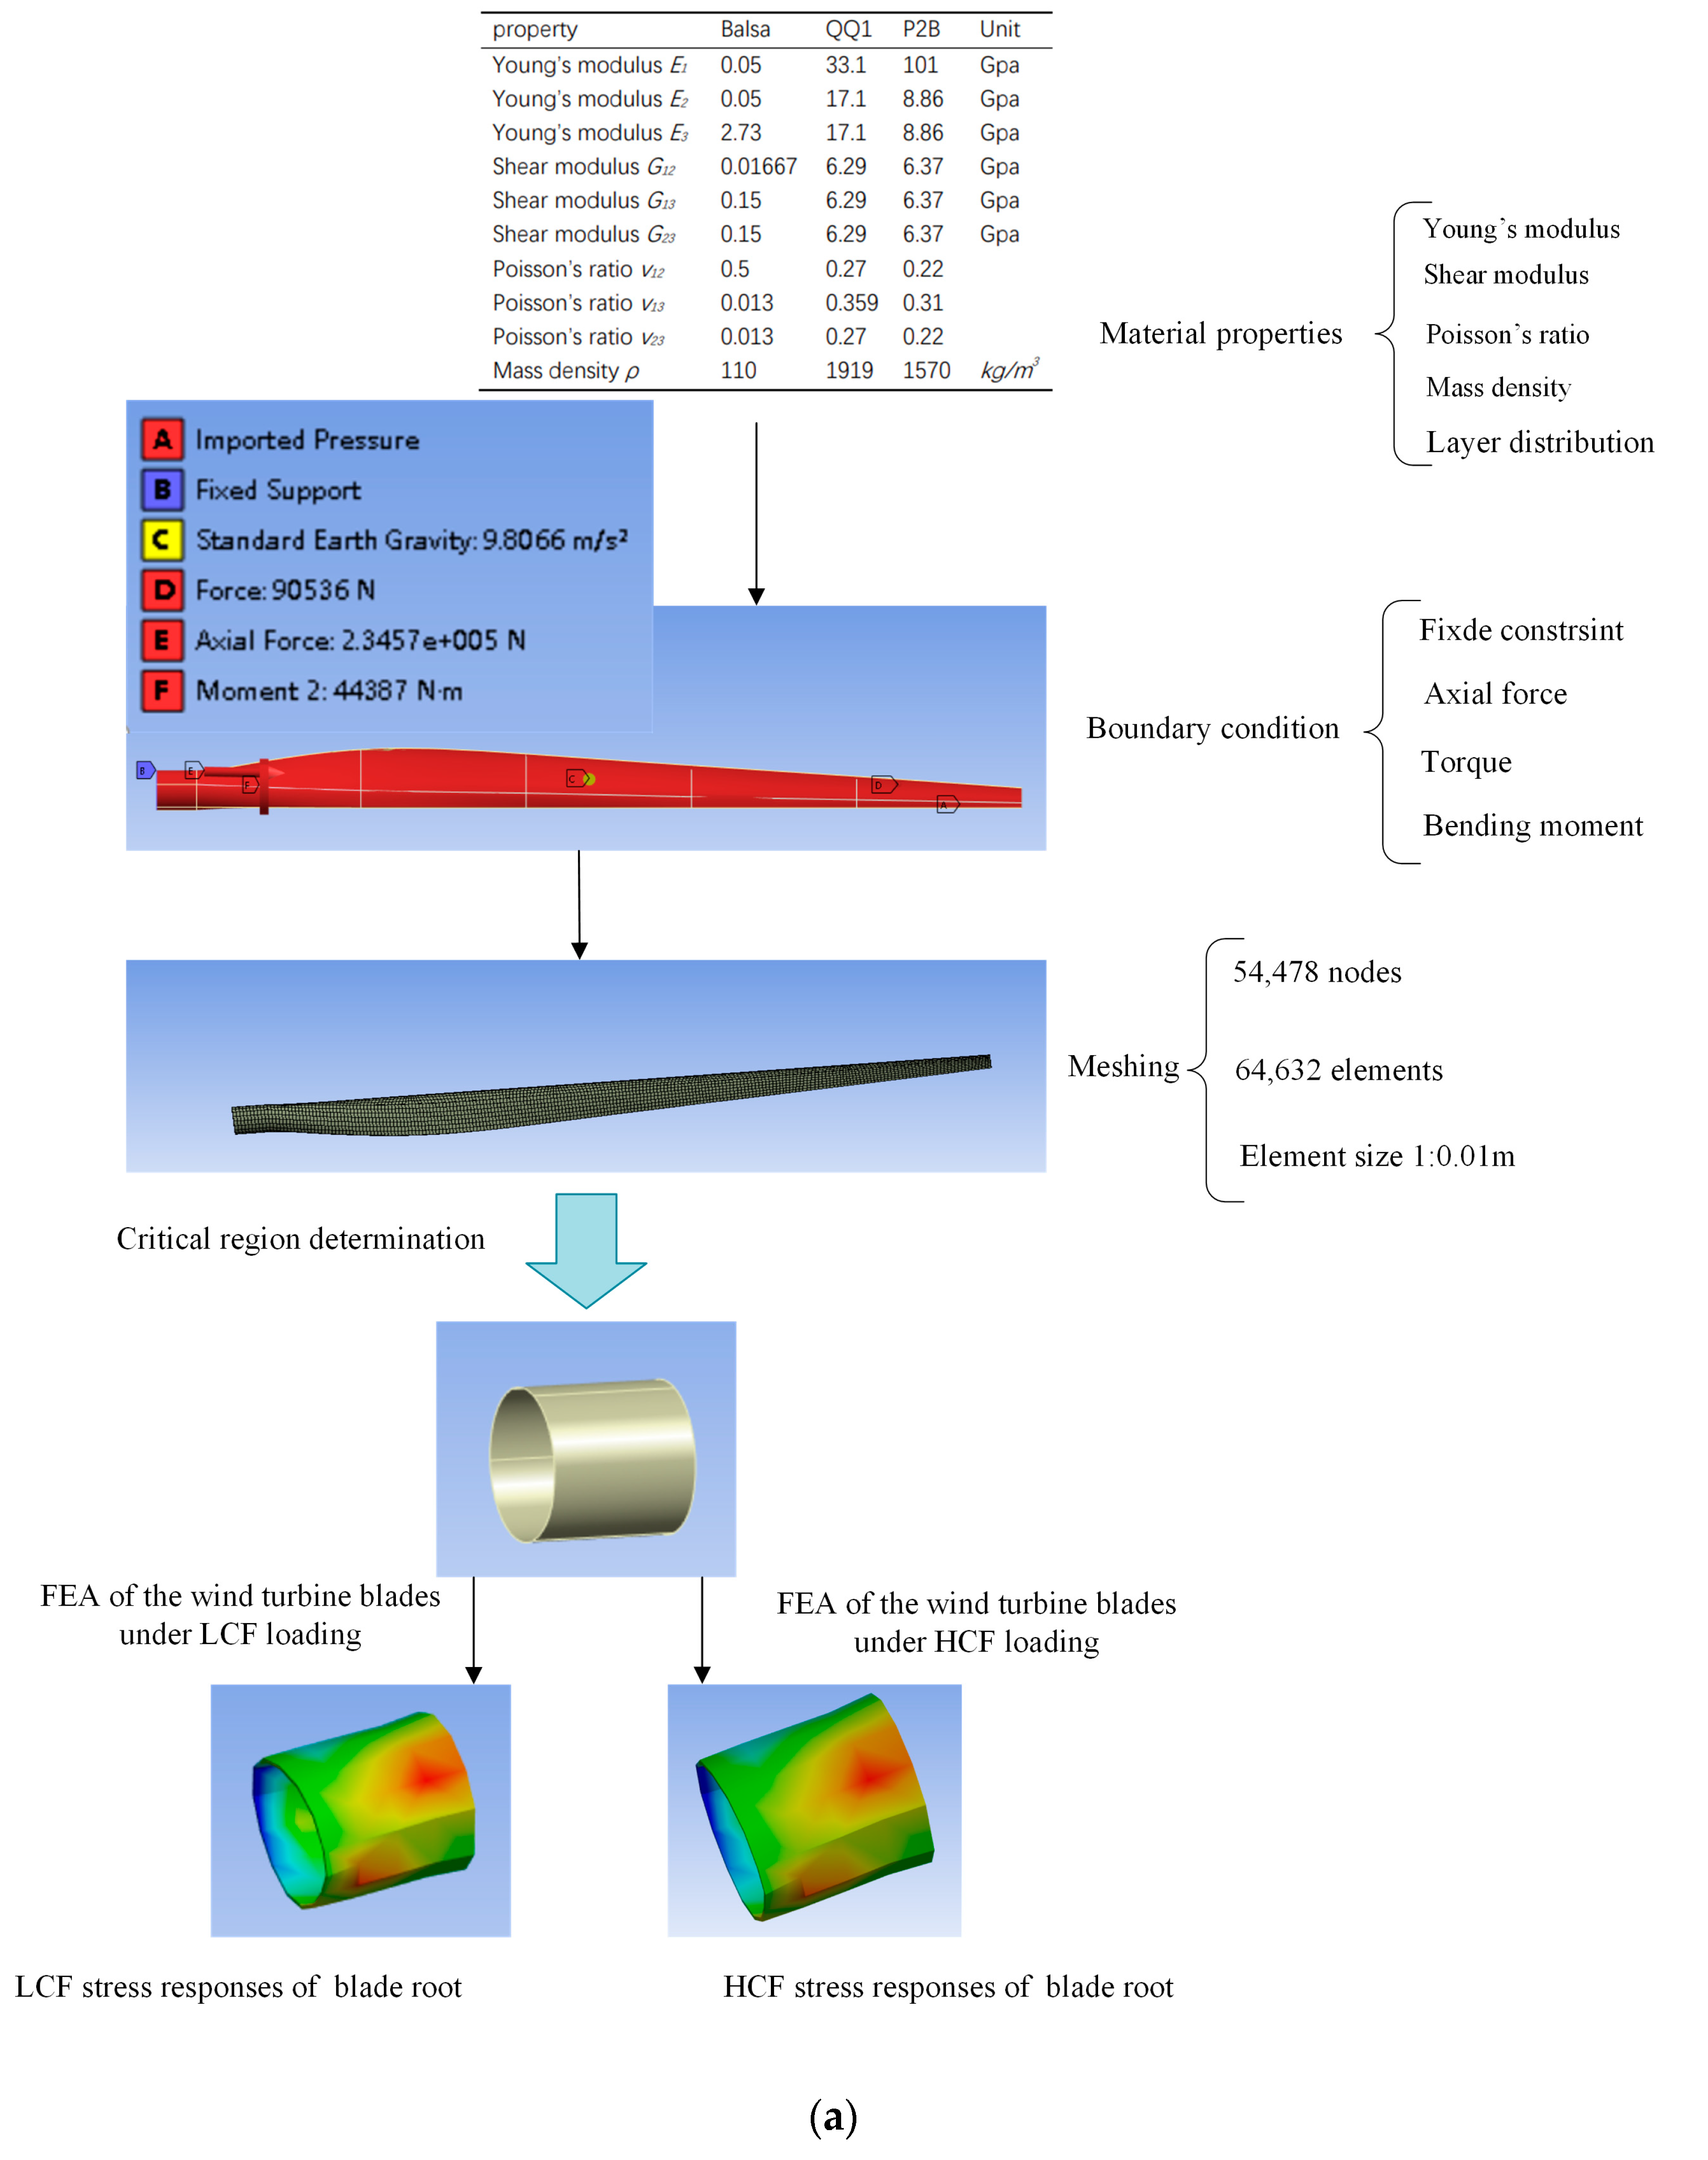
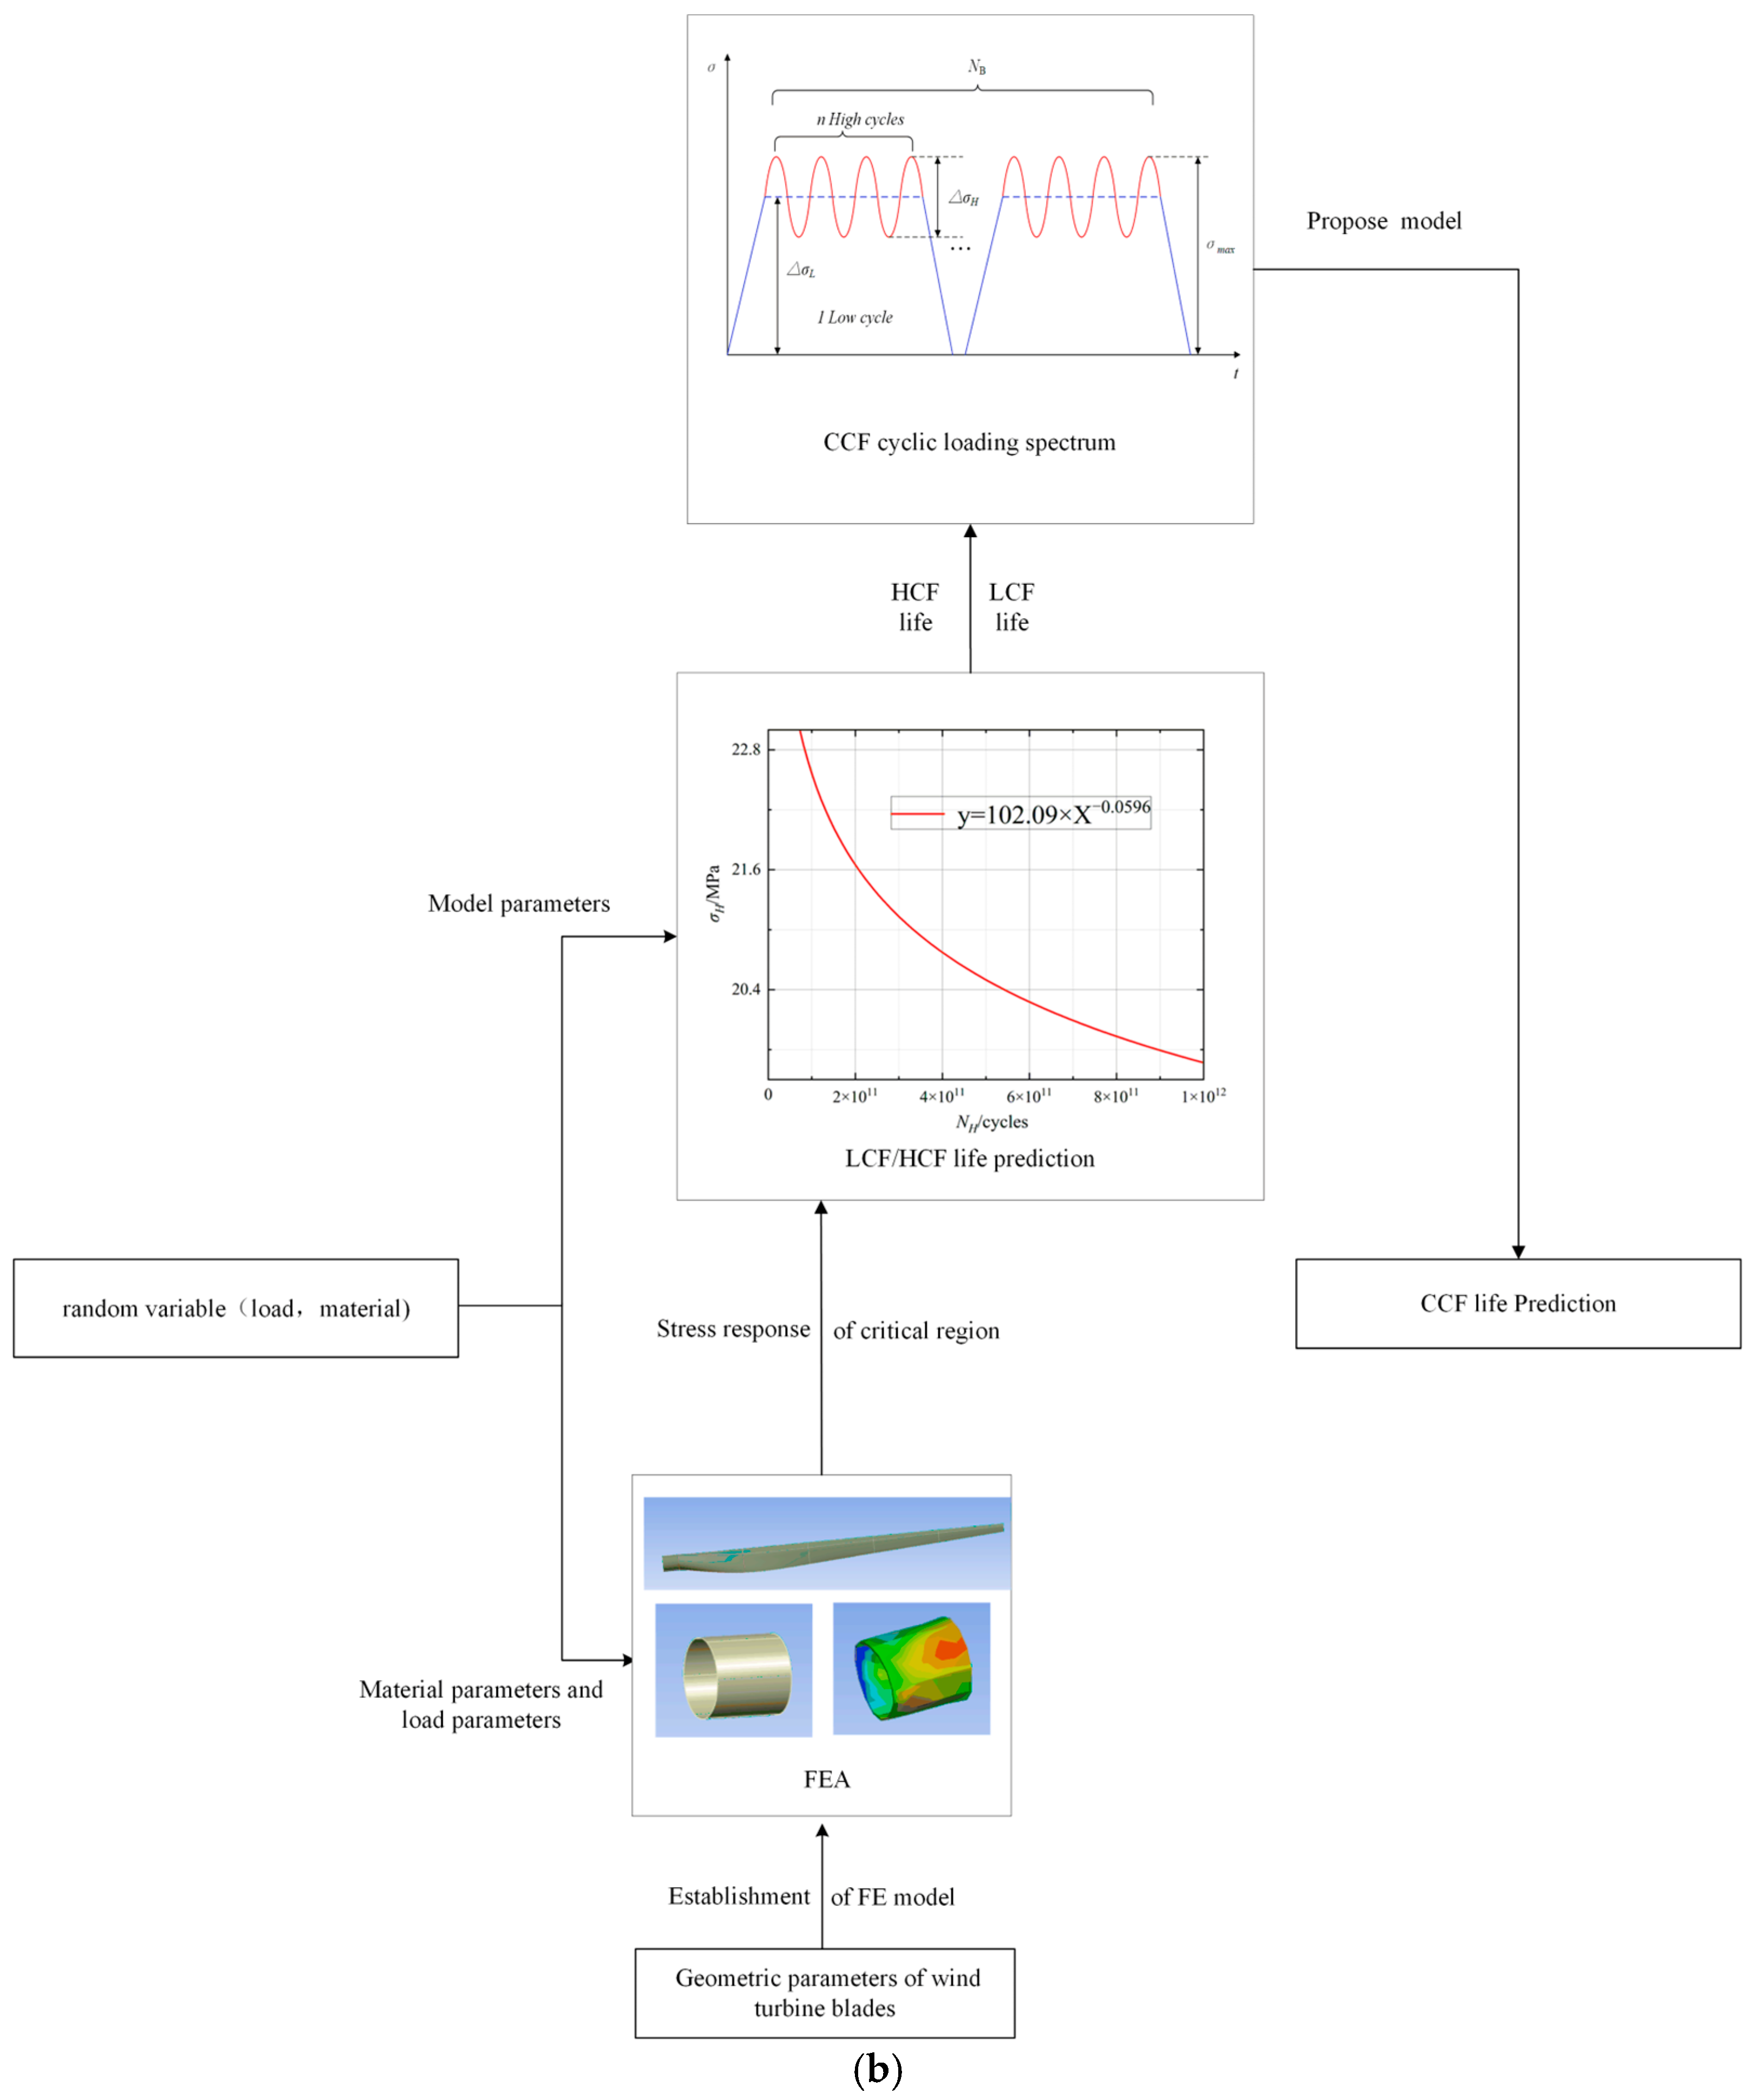
5. Wind Turbine Blade Life Prediction
6. Conclusions
- (1)
- Using damage curves to analyze the damage evolution process under CCF load, this paper proposes a CCF life prediction model that primarily takes into account the impacts of load sequence, load interaction, and load coupling.
- (2)
- Existing CCF experiments were used to evaluate the model’s robustness and prediction accuracy. The majority of our model’s results of prediction fall within the life factor ± 1.5 range when compared to Miner’s rule, the M-H model, and the T-K model. It is evident that the model’s anticipated life agrees well with the experimental life fitting curve, suggesting that our model is better suited to forecasting CCF life than other models due to its greater prediction accuracy and more accurate prediction error.
- (3)
- Based on Miner’s rule, this study introduces composite material damage components to present a new CCF life prediction model that can be used to estimate the CCF fatigue life of composite materials.
- (4)
- The proposed model, which integrates load interaction effects and nonlinear damage accumulation, provides highly accurate fatigue life predictions. Despite its increased computational complexity compared to traditional methods, it remains feasible for large-scale applications, such as evaluating the fatigue life of complex structures under variable amplitude loading. Future work will focus on further optimizing the model’s computational efficiency, including the use of high-performance computing and simplified versions for specific cases, ensuring its applicability to real-time and large-scale engineering problems.
Author Contributions
Funding
Institutional Review Board Statement
Informed Consent Statement
Data Availability Statement
Conflicts of Interest
References
- Zhang, Y.; Huang, R.; Li, Z. Fault Detection Method for Wind Turbine Generators Based on Attention-Based Modeling. Appl. Sci. 2023, 13, 9276. [Google Scholar] [CrossRef]
- Guo, Z.; Huang, D.; Yan, X.; Zhang, X.; Qi, M.; Fan, J. A damage coupled elastic-plastic constitutive model and its application on low cycle fatigue life prediction of turbine blade. Int. J. Fatigue 2020, 131, 105298. [Google Scholar] [CrossRef]
- Yuan, G.J.; Zhang, X.C.; Chen, B.; Tu, S.T.; Zhang, C.C. Low-cycle fatigue life prediction of a polycrystalline nickel-base superalloy using crystal plasticity modelling approach. J. Mater. Sci. Technol. 2020, 38, 28–38. [Google Scholar] [CrossRef]
- Zhang, X.; Zheng, M. Numerical Simulation of Fluid-Structure Coupling for a Multi-Blade Vertical-Axis Wind Turbine. Appl. Sci. 2023, 13, 8612. [Google Scholar] [CrossRef]
- Zhao, Y.; Gong, X.; Wang, J.; Zhang, L.; Bai, Y. Stress characteristics of horizontal-axis wind turbine blades under dynamic yaw. Appl. Sci. 2023, 13, 8418. [Google Scholar] [CrossRef]
- Gao, J.; Liu, Y.; Yuan, Y.; Heng, F. Residual strength modeling and reliability analysis of wind turbine gear under different random loadings. Mathematics 2023, 11, 4013. [Google Scholar] [CrossRef]
- Miao, Y.; Soltani, M.N.; Hajizadeh, A. A machine learning method for modeling wind farm fatigue load. Appl. Sci. 2022, 12, 7392. [Google Scholar] [CrossRef]
- Kuo, J.Y.; You, S.Y.; Lin, H.C.; Hsu, C.Y.; Lei, B. Constructing condition monitoring model of wind turbine blades. Mathematics 2022, 10, 972. [Google Scholar] [CrossRef]
- Ding, X.; Yan, X.; Guo, Z.; Guo, K. A combined low-and high-cycle life prediction model considering the closure effect of micro-defects. Fatigue Fract. Eng. Mater. Struct. 2022, 45, 2058–2071. [Google Scholar] [CrossRef]
- Schubel, P.J.; Crossley, R.J. Wind turbine blade design. Energies 2012, 5, 3425–3449. [Google Scholar] [CrossRef]
- Liu, L.; Gao, H.S.; Wang, J.D.; Zhang, C.J.; Wen, Z.X.; Yue, Z.F. Combined high and low cycle fatigue analysis of FGH96 alloy under high temperature conditions. Mater. Today Commun. 2024, 38, 108053. [Google Scholar] [CrossRef]
- Liu, L.; Gao, H.S.; Wang, J.D.; Zhang, C.J.; Wen, Z.X.; Yue, Z.F. Microstructure analysis and life prediction of DD6 superalloy under 760 °C combined high and low cycle fatigue conditions. Eng. Fract. Mech. 2024, 295, 109796. [Google Scholar] [CrossRef]
- Feng, C.; Long, Z.; Su, M.; Xu, L.; Zhao, L.; Han, Y. A physics-informed deep learning approach for combined cycle fatigue life prediction. J. Constr. Steel Res. 2024, 222, 109000. [Google Scholar] [CrossRef]
- Dowling, N.E. Estimation and correlation of fatigue lives for random loading. Int. J. Fatigue 1988, 10, 179–185. [Google Scholar] [CrossRef]
- Gao, J.; Heng, F.; Yuan, Y.; Liu, Y. A novel machine learning method for multiaxial fatigue life prediction: Improved adaptive neuro-fuzzy inference system. Int. J. Fatigue 2024, 178, 108007. [Google Scholar] [CrossRef]
- Mesmacque, G.; Garcia, S.; Amrouche, A.; Rubio-Gonzalez, C. Sequential law in multiaxial fatigue, a new damage indicator. Int. J. Fatigue 2005, 27, 461–467. [Google Scholar] [CrossRef]
- Bai, S.; Huang, H.Z.; Li, Y.F.; Yu, A.; Deng, Z. A modified damage accumulation model for life prediction of aero-engine materials under combined high and low cycle fatigue loading. Fatigue Fract. Eng. Mater. Struct. 2021, 44, 3121–3134. [Google Scholar] [CrossRef]
- Zhu, S.P.; Yue, P.; Yu, Z.Y.; Wang, Q.Y. A combined high and low cycle fatigue model for life prediction of turbine blades. Materials 2017, 10, 698. [Google Scholar] [CrossRef]
- Liu, P.; Wang, X.; Shen, Q.; Li, F.; Liu, M.; Sun, Y. On the consideration of loading interaction in combined high and low cycle fatigue life prediction. Fatigue Fract. Eng. Mater. Struct. 2023, 46, 2651–2661. [Google Scholar] [CrossRef]
- Yang, S.; Hu, W.; Meng, Q.; Zhao, B. A new continuum damage mechanics-based two-scale model for high-cycle fatigue life prediction considering the two-segment characteristic in S-N curves. Fatigue Fract. Eng. Mater. Struct. 2020, 43, 387–402. [Google Scholar] [CrossRef]
- Manson, S.S.; Halford, G.R. Practical implementation of the double linear damage rule and damage curve approach for treating cumulative fatigue damage. Int. J. Fract. 1981, 17, 169–192. [Google Scholar] [CrossRef]
- Trufyakov, V.I.; Koval’chuk, V.S. Determination of life under two-frequency loading. Report no. 2. Proposed method. Strength Mater. 1982, 14, 1303–1308. [Google Scholar] [CrossRef]
- Yue, P.; Zhou, C.; Zhang, J.; Zhang, X.; Du, X.; Liu, P. A comparative study on combined high and low cycle fatigue life prediction model considering loading interaction. Int. J. Damage Mech. 2024, 10567895241292747. [Google Scholar] [CrossRef]
- Yue, P.; Ma, J.; Zhou, C.; Zu, J.W.; Shi, B. Dynamic fatigue reliability analysis of turbine blades under combined high and low cycle loadings. Int. J. Damage Mech. 2021, 30, 825–844. [Google Scholar] [CrossRef]
- Han, L.; Huang, D.; Yan, X.; Chen, C.; Zhang, X.; Qi, M. Combined high and low cycle fatigue life prediction model based on damage mechanics and its application in determining the aluminized location of turbine blade. Int. J. Fatigue 2019, 127, 120–130. [Google Scholar] [CrossRef]
- Qiu, S.; Cui, H.; Zhang, H.; Wen, W.; Guo, J. A dual-threshold modelling approach for fatigue life prediction under combined high and low cycle fatigue. Int. J. Fatigue 2022, 164, 107110. [Google Scholar] [CrossRef]
- De Maio, U.; Greco, F.; Lonetti, P.; Pranno, A. Pranno, A. A combined ALE-cohesive fracture approach for the arbitrary crack growth analysis. Eng. Fract. Mech. 2024, 301, 109996. [Google Scholar] [CrossRef]
- Ha, D.; Kim, J.H.; Kim, T.; Joo, Y.S.; Yun, G.J. Multiscale fatigue damage model for CFRP laminates considering the effect of progressive interface debonding. Mech. Adv. Mater. Struct. 2022, 31, 2321–2333. [Google Scholar] [CrossRef]
- Zhang, L.; Liu, H.; Zhou, W. A Modified Damaged Stress Model for Fatigue Life Prediction Based on Load Interaction. Heliyon 2024, 10, e40357. [Google Scholar] [CrossRef] [PubMed]
- Hou, J.; Wang, X.; Guo, H.; Wang, Y.; Li, F.; Shen, Q. Combined high and low cycle fatigue life prediction model based on damage curve method considering loading interaction effect. Int. J. Damage Mech. 2023, 32, 185–203. [Google Scholar] [CrossRef]
- Gao, H.; Huang, H.Z.; Lv, Z.; Zuo, F.J.; Wang, H.K. An improved Corten-Dolan’s model based on damage and stress state effects. J. Mech. Sci. Technol. 2015, 29, 3215–3223. [Google Scholar] [CrossRef]
- Zhu, S.P.; Huang, H.Z.; Wang, Z.L. Fatigue life estimation considering damaging and strengthening of low amplitude loads under different load sequences using fuzzy sets approach. Int. J. Damage Mech. 2011, 20, 876–899. [Google Scholar] [CrossRef]
- Feng, Z.; Ma, Q.; An, Z.; Ma, H.; Bai, X. New fatigue life prediction model for composite materials considering load interaction effects. Int. J. Appl. Mech. 2023, 15, 1758–8251. [Google Scholar] [CrossRef]
- Strizhius, V. Fatigue damage accumulation under quasi-random loading of composite airframe elements. Mech. Compos. Mater. 2016, 52, 455–468. [Google Scholar] [CrossRef]
- Yue, P.; Li, H.; Dong, Y.; Zhang, J.F.; Zhou, C.Y. A modified nonlinear cumulative damage model for combined high and low cycle fatigue life prediction. Fatigue Fract. Eng. Mater. Struct. 2024, 47, 1300–1311. [Google Scholar] [CrossRef]
- Yue, P.; Ma, J.; Zhou, C.; Jiang, H.; Wriggers, P. A fatigue damage accumulation model for reliability analysis of engine components under combined cycle loadings. Fatigue Fract. Eng. Mater. Struct. 2020, 43, 1880–1892. [Google Scholar] [CrossRef]
- Wang, Z.; Zheng, T.; Shi, Q.; Chen, Z.; Zhang, L.; Zhou, J.; Sun, X.; Guo, L. Damage behavior and life prediction model of composite laminates under combined high and low cycle fatigue. Int. J. Fatigue 2024, 183, 108240. [Google Scholar] [CrossRef]
- Bai, S.; Huang, T.; Li, Y.; Lu, N.; Huang, H.Z. A probabilistic fatigue life prediction method under random combined high and low cycle fatigue load history. Reliab. Eng. Syst. Saf. 2023, 238, 109452. [Google Scholar] [CrossRef]
- ASTM D3479-07; Standard Test Method for Tension-Tension Fatigue of Polymer Matrix Composite Materials. ASTM International: West Conshohocken, PA, USA, 2007.
- Wu, J.; Huang, H.Z.; Li, Y.F.; Bai, S.; Yu, A.D. Probabilistic fatigue life prediction of an aero-engine turbine shaft. Aircr. Eng. Aerosp. Technol. 2022, 94, 1854–1871. [Google Scholar] [CrossRef]
- Hou, N.X.; Wen, Z.X.; Yu, Q.M.; Yue, Z.F. Application of a combined high and low cycle fatigue life model on life prediction of SC blade. Int. J. Fatigue 2009, 31, 616–619. [Google Scholar] [CrossRef]
- Liu, X.; Lin, B.; Luo, H. Dynamical measurement system for wind turbine fatigue load. Renew. Energy 2016, 86, 909–921. [Google Scholar] [CrossRef]
- Movahedi-Rad, A.V.; Keller, T.; Vassilopoulos, A.P. Fatigue damage in angle-ply GFRP laminates under tension-tension fatigue. Int. J. Fatigue 2018, 109, 60–69. [Google Scholar] [CrossRef]


| LCF Level | Experimental Condition | Sample | |
|---|---|---|---|
| 80% | 3% | CCF−80–3% | 3 |
| 80% | 5% | CCF−80–5% | 4 |
| 75% | 3% | CCF−75–3% | 3 |
| Span (m) | Relm (% Span) | Twist (Deg) | Chord (m) | Chord (% Span) |
|---|---|---|---|---|
| 3.094 | 0.075 | 42 | 2.533 | 0.061 |
| 5.156 | 0.125 | 32 | 2.816 | 0.068 |
| 7.219 | 0.175 | 23 | 3.074 | 0.075 |
| 9.281 | 0.225 | 15 | 3.210 | 0.078 |
| 11.344 | 0.275 | 11.5 | 3.112 | 0.075 |
| 13.4064 | 0.325 | 8.2 | 2.965 | 0.072 |
| 15.469 | 0.375 | 7 | 2.818 | 0.068 |
| 17.531 | 0.425 | 6 | 2.673 | 0.065 |
| 19.594 | 0.475 | 5 | 2.527 | 0.061 |
| 21.656 | 0.525 | 4 | 2.381 | 0.058 |
| 23.719 | 0.575 | 4.15 | 2.234 | 0.054 |
| 25.781 | 0.625 | 3.85 | 2.088 | 0.051 |
| 27.844 | 0.675 | 3.25 | 1.942 | 0.048 |
| 29.906 | 0.725 | 2.75 | 1.799 | 0.044 |
| 31.906 | 0.775 | 1.25 | 1.660 | 0.040 |
| 34.031 | 0.825 | 0.75 | 1.528 | 0.037 |
| 36.094 | 0.875 | 0.55 | 1.396 | 0.034 |
| 38.156 | 0.925 | 0.85 | 1.265 | 0.031 |
| 40.219 | 0.975 | 0.05 | 1.133 | 0.028 |
| 41.25 | 1 | 0 | 1 | 0.024 |
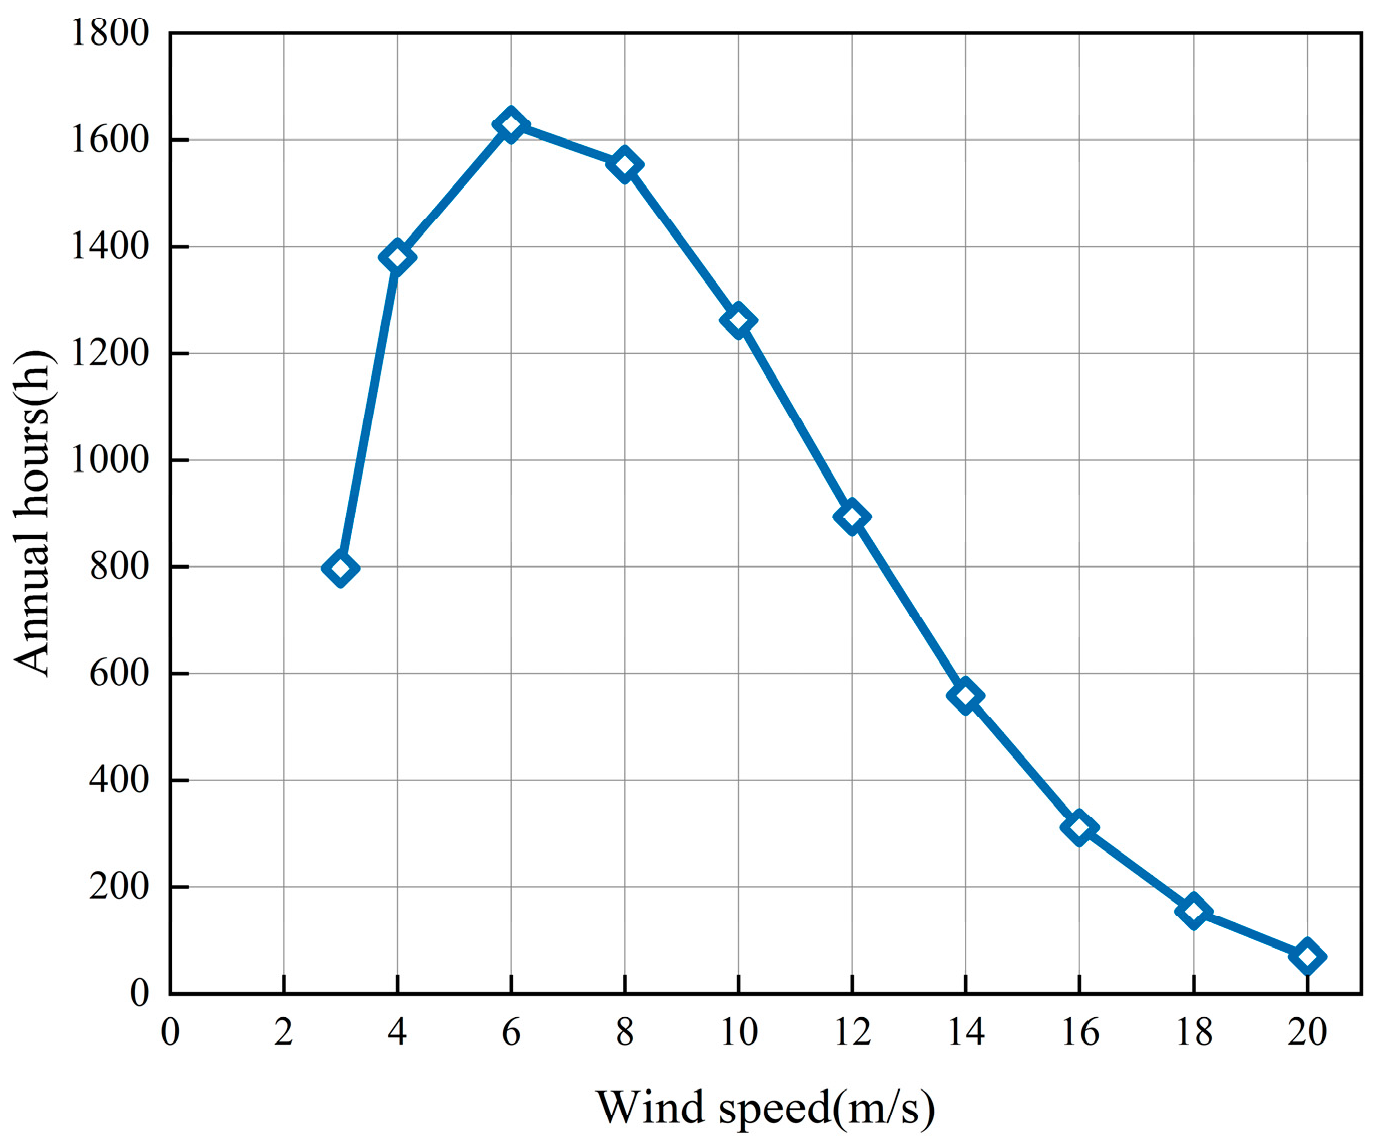
| Number | Wind Speed (m/s) | Annual Hours (h) | (MPa) | /103 (Cycles) |
|---|---|---|---|---|
| 1 | 3 | 797 | 28.86 | - |
| 2 | 4 | 1380 | 29.31 | - |
| 3 | 6 | 1629 | 39.37 | 6933 |
| 4 | 8 | 1554 | 45.56 | - |
| 5 | 10 | 1262 | 50.66 | - |
| 6 | 12 | 894 | 48.72 | - |
| 7 | 14 | 559 | 42.20 | 2125 |
| 8 | 16 | 311 | 41.22 | 3337.8 |
| 9 | 18 | 155 | 35.46 | 32,754 |
| 10 | 20 | 69 | 31.25 | 202,600 |
Disclaimer/Publisher’s Note: The statements, opinions and data contained in all publications are solely those of the individual author(s) and contributor(s) and not of MDPI and/or the editor(s). MDPI and/or the editor(s) disclaim responsibility for any injury to people or property resulting from any ideas, methods, instructions or products referred to in the content. |
© 2025 by the authors. Licensee MDPI, Basel, Switzerland. This article is an open access article distributed under the terms and conditions of the Creative Commons Attribution (CC BY) license (https://creativecommons.org/licenses/by/4.0/).
Share and Cite
Li, M.; Gao, J.; Zhou, J. A Combined High and Low Cycle Fatigue Life Prediction Model for Wind Turbine Blades. Appl. Sci. 2025, 15, 1173. https://doi.org/10.3390/app15031173
Li M, Gao J, Zhou J. A Combined High and Low Cycle Fatigue Life Prediction Model for Wind Turbine Blades. Applied Sciences. 2025; 15(3):1173. https://doi.org/10.3390/app15031173
Chicago/Turabian StyleLi, Miaomiao, Jianxiong Gao, and Jianxing Zhou. 2025. "A Combined High and Low Cycle Fatigue Life Prediction Model for Wind Turbine Blades" Applied Sciences 15, no. 3: 1173. https://doi.org/10.3390/app15031173
APA StyleLi, M., Gao, J., & Zhou, J. (2025). A Combined High and Low Cycle Fatigue Life Prediction Model for Wind Turbine Blades. Applied Sciences, 15(3), 1173. https://doi.org/10.3390/app15031173