Article

Reliability-Constrained Structural Design Optimization Using Visual Programming in Building Information Modeling (BIM) Projects

Department of Digital Engineering and Construction (DEC), Institute of Technology and Management in Construction (TMB), Gotthard-Franz-Straße 3, 76131 Karlsruhe, Germany
*
Author to whom correspondence should be addressed.
Appl. Sci. 2025, 15(3), 1025; https://doi.org/10.3390/app15031025
Submission received: 4 November 2024 / Revised: 1 January 2025 / Accepted: 2 January 2025 / Published: 21 January 2025

Abstract

:

Featured Application

Artificial intelligence (AI)-based structural design optimization based on reliability in building information modeling (BIM) projects.

Abstract

Providing safe, environmentally conscious, and cost-effective designs is the primary duty of civil engineers. To this end, many different algorithms and methods have been developed in parallel with the progress of digital technologies over the past decades. Techniques such as AI-based Metaheuristic Algorithms (MAs), Reliability Analysis, and Building Information Modelling (BIM) are some of those methods that serve this purpose. The present study focuses on establishing a design optimization methodology by implementing the techniques in the open literature on one software environment to create a robust engineering and architectural workflow. The methodology involves multiple stages such as (i) creating parametric trusses employing Visual Programming (VP) software Dynamo (Version: 3.0.4); (ii) performing a First-order Reliability Method (FORM) analysis which includes a Finite Element Method (FEM) analysis as a Limit State Function (LSF); (iii) employing MAs to achieve optimum design variables under uncertain design constraints; (iv) testing the methodology with various real-word examples and scenarios; (v) creating an optimized model on Robot Structural Analysis 2024 (RSA) software in real time in the purpose of further adjustments. The results demonstrated that creating a design optimization workflow by utilizing a BIM environment can enhance the design process by easing the storing, sharing, and utilizing of design data by different branches capable of performing different complicated tasks successfully.

1. Introduction

Structural optimization has become a prevalent topic among researchers since one of the main objectives of engineers is to design the most economical design while satisfying safety codes [1,2]. Combining structural optimization with a reliability analysis and performing Reliability-Based Design Optimization (RBDO) by utilizing Building Information Modelling (BIM) tools and Visual Programming (VP) is assumed to be a decent contribution to open literature as stochastic values create real-world scenarios in contrast to the traditional focus on deterministic values. Conventional engineering focuses on design optimization with deterministic values by utilizing safety factors to mitigate uncertainties; however, as with most rule-based strategies, this technique runs the high risk of underdesign, yielding to structural failure, or overdesign, resulting in waste and increased cost. Establishing this critical optimum value for the safety factor presents a significant challenge since it is dependent upon many uncertain parameters, such as material properties, geometric tolerances/imperfections, loading, and analytical model uncertainties [3]. Furthermore, ignoring the impact of uncertainties might result in disasters, as was observed in the İzmit and Kahramanmaraş earthquakes, where many of the structures failed, causing a comparable number of casualties to the Nagasaki nuclear attack [4,5,6]. Therefore, the use of advanced techniques, such as RBDO via Metaheuristic Algorithms (MAs), may become necessary to account for uncertainties in the design process [7]. Consequently, the present study aims to find optimized designs under reliability constraints by employing MAs. The First-Order Reliability Method (FORM) has been used for reliability analysis, while Monte Carlo Simulation (MCS) has been utilized to test the correctness of reliability analysis. The initial methodology was designed to employ Robot Structural Analysis (RSA), as studied in [8], for Finite Element Method (FEM) analyses; however, long computational times made it inefficient to use. Thus, the methodology has been updated, and the Python library PyNite has been utilized instead of RSA. Nevertheless, the study also provides important insights about the potential use of RSA and the obstacles behind it. Even though a significant bottleneck of the proposed method is the time required for steps such as the FEM and FORM analysis [9,10], according to the findings, it is possible to achieve safer as well as cost-efficient designs by the proposed method in a reasonable computational time.

2. State of the Art

The following subsections present the state of the art related to the methods presented in this study. The subsections describe current developments in structural design optimization, reliability analysis, and BIM integration, establishing the foundation for the proposed methodology.

2.1. Structural Design Optimization

Design optimization deals with creating better structures iteratively by using different algorithms in the process. It can be performed for reliability constraints or deterministic values by following existing methods proposed by researchers. However, a seamless workflow is needed for Architecture, Engineering, and Construction (AEC) specialists to optimize their design, since the available methods heavily depend on commercial software and technical knowledge. Most of the literature relies either on standalone analysis tools, commercial software, or algorithms coded specifically as part of the research [11,12,13,14,15]. For example, in [13], the authors optimized prestressed truss structures by considering shape and size variables by following AISC-ASD specifications and employing the parameter-free Jaya algorithm via custom computer software coded for the study.
These state-of-the-art studies, along with others, highlight the current bottleneck in the literature on structural optimization within a BIM environment, aiming to make it more accessible and easier to use for designers who are not experienced in coding but in design. Nevertheless, some studies employ BIM for optimization purposes and leverage the advantages of BIM for enhanced collaboration, operation, and maintenance. The referenced review article [16] explores the literature on structural optimization through standardized interfaces and visualization platforms while discussing the implementation and impact of BIM in structural engineering practices.
In the same direction, the referenced article [8] provides a streamlined framework using VP and parametric modelling techniques to optimize space trusses through Autodesk tools such as Revit, Dynamo, and RSA. This workflow has been enhanced by employing API technology to speed up the FEM process and reduce the overhead between Dynamo and RSA in [17]. Another example [18] explores the possibility of creating a custom plugin to use Revit for the structural optimization of steel structures by following existing codes by employing RSA through API along with LCA through Tally to obtain environmentally conscious designs in a BIM environment. Moreover, the referenced study [19] used a combination of platforms with Grasshopper and Rhino and explored shell structure optimization to maximize structural efficiency and minimize the maximum displacement under vertical loads via user-defined and AI-generated design spaces.
In line with the presented literature, this research proposes an optimization workflow in a BIM environment that enables the user to optimize the design under uncertain constraints and find the optimum design by considering two conflicting objectives: mass and reliability. Because of the complex nature of this problem, employing AI-based MAs is common practice. Various algorithms have been developed and improved to address the increasing complexity of such optimization problems. A brief literature review was performed to select an MA for the examples section.

2.2. Metaheuristic Algorithms

The Genetic Algorithm (GA), a well-established method that mimics evolutionary theory, is one of the most widely used AI methods among researchers [20,21,22,23,24,25]. GAs are a subset of Evolutionary Algorithms (EAs) that utilize techniques based on natural biological processes, including mutation, crossover, and elimination, to find optimal solutions to complex problems such as the combinatorial knapsack problem and the travelling salesman problem. The main principle here is Darwin’s survival of the fittest idea to iteratively remove unfit solutions [26].
Differential Evolution (DE) is also one of the more advanced EAs and is regarded as an improvement over GAs. DE utilizes crossover and mutation like GAs but works on vectors in a multi-dimensional search space. The variants of DE are denoted as DE/x/y/z, where x specifies the method in which a vector is chosen for mutation, y represents the different perturbations between pairs of vectors, and z indicates the crossover method. It is reported that DE provided superior performance compared with other methods in terms of the number of required functions [27,28].
On the other hand, Ant Colony Optimization (ACO) emulates the foraging behaviour of ants, where ants leave pheromone trails on the path to indicate advantageous ways for other colony members to follow. With time, the intensity of those pheromone’s paths accumulates and converges towards one optimal way to reach the objective, guiding the decision-making process [29,30]. Similarly, Particle Swarm Optimization (PSO) mimics the collective behaviour of bird or fish flocks, addressing problems by utilizing a population-based approach. The particles move through the search space, where they adjust their position and velocity based on both their own experience and the experience of neighbouring particles, collectively guiding the swarm toward optimal solutions through iterative processes [31].
More recent and successful MA approaches, such as improving the Follow the Leader (iFTL) Algorithm, improve upon the Follow the Leader (FTL) technique that copies the movement of a sheep in a flock. The study [32] focuses on redefining the FTL algorithm to define both the exploration and exploitation phases to solve the issue that arises from using the initial approach. The improved algorithm showed better outcomes than other algorithms and provided efficiency in the exploitation occurrence along with exploration. It was verified with several benchmarks such as truss designs; the outcomes reveal enhanced reliability and precision. The Bonobo Optimizer (BO) algorithm is another recent optimization technique based on the primates’ social and mating strategies, such as fission–fusion.
In the context of truss structure sizing, the algorithm with discrete and continuous variables has been coded in MATLAB in the referenced article and has proven effective regarding the number of individual runs and convergence rate. However, the effectiveness of this algorithm should be examined in future work to apply it to more general and complicated structures in comparison with the truss systems [12]. The Artificial Bee Colony (ABC) method, inspired by the honeybees’ food-searching activity, is utilized in [33] to find optimum structures and member sizes of the truss to minimize buckling, stress, and displacement limit constraints. Its practical impact pertains to showcasing the algorithm’s efficiency, which may be a clear way to enhance more research by utilizing the described approach in different applications and increase the chances of obtaining lighter designs. However, the base parameters of the ABC algorithm that have the most impact on its success were not set up properly in the studies [33,34]. The Weighted Superposition Attraction-Repulsion (WSAR) Algorithm is one of the recent swarm-intelligence-based MAs to solve the multiple-frequency-constraint’s complex problem of truss optimization. The referenced work [35] interlinks the parameter-free Constraint Handling Technique (CHT) with a Finite Element (FE) matrix model coded in MATLAB to calculate the frequency. The findings reveal that the WSAR finds lighter designs and satisfies all the frequency limits better than other MAs.
Most MAs work probabilistically and use standard input parameters such as the population size and generation number. Apart from these generic control parameters, there are more algorithm-specific ones that need to be fine-tuned, including the mutation probability, crossover probability, inertia weight, and the number of onlookers, scout, or employed bees, as well as the harmony memory consideration rate, pitch adjusting rate, etc. It is even more important to set these parameters appropriately since they are more sensitive and directly impact the algorithm performance. Improper tuning can increase the degree of complexity or result in local optimal solutions.
Another optimization technique developed from swarm intelligence is termed the Jaya algorithm, which optimizes for the best solution, while, at the same time, distancing itself from the worst [36]. The Jaya algorithm provides a parameter less solution to avoid these problems. It has been implemented on 24 constrained and 30 unconstrained benchmark functions and compared with other efficient optimization techniques like GA, PSO, ABC, and TLBO, yielding superior results by reaching the global optimum in fewer function evaluations [37].
Moreover, hybrid algorithms have been advanced to take advantage of some algorithms, while, at the same time, minimizing the negatives. The Particle Swarm Optimizer Cultural (PSOC) hybrid method as a PSO algorithm integrated with the Cultural Algorithm (CA) to increase the PSO convergence speed and decrease the computational time expenses. The study [38] presents the success of the proposed hybrid algorithm by solving truss structure problems and comparing the performances with the traditional PSO and other MAs. The Hybrid Intelligent GA (HIGA) combines the GA with a Deep Neural Network (DNN) to improve the algorithm’s truss optimization process. Unlike using heuristic optimization alone or at the same level as GA, this method achieves more satisfactory results through successive integration with Machine Learning (ML). The research proves that the HIGA approach enhances the accuracy and the speed of the optimization procedures while noting that its deployment may demand the involvement of specialists in ML field [39].
Even though those algorithms are powerful, problems arise in real-life situations, mostly in the form of Multi-Objective Optimization (MOO) problems in which several objectives represent two or more conflicting factors. These problems are usually solved using Non-dominated Sorting Genetic Algorithm II (NSGA-II), NSGA-III, and Decomposition-based approaches. NSGA-II was later formed by Deb et al. in 2002 as an enhancement of NSGA to solve the problems, including the technicality of the procedure and the shortcomings in the diversity of solutions. In the NSGA-II algorithm, all analyzed solutions are divided into non-dominated categories and their quality is determined using the fast non-dominated sorting technique, while the crowded-comparison operator and the preservation of the diversity of solutions are used to identify a rich set of Pareto-optimal solutions [40]. NSGA-III, also known as reference-point-based NSGA-II, is an enhanced version of NSGA-II created by Deb and Jain in 2014. NSGA-III uses a reference-point-based approach to enhance the capability of preserving diversity when the objective space dimension increases. The algorithm preprocesses the objective space and places each solution into a comparable framework based on the reference point. Through a niche-preserving operation, solutions that are most aligned with the reference points are selected [41]. Another method involves decomposing the problems called the Multi-Objective Evolutionary Algorithm based on Decomposition (MOEA/D). These methods function in the approach of breaking down a many-objective optimization problem into numerous Single-Objective Optimization (SOO) problems, making the computation much easier than other methods, such as NSGA-II and NSGA-III [42]. The referenced study [43] compares the performance of three MOEAs, NSGA-II, NSGA-III, and MOEA/D, by solving a multi-objective Rosenbrock function. The results depict that MOEA/D provides superior performance compared to NSGA-II and NSGA-III in terms of cost, standard deviation, and execution time.

2.3. Relability Analysis

As mentioned previously, the design codes create a path to follow to achieve one of the many missions of civil engineers: to create safe buildings. However, in real-world scenarios, the design parameters are quite uncertain since there are profound levels of ambiguity in environmental excitations and the system parameters and models [44]. The referenced article states [45], “A truly optimum design should consider the behaviour of the structure for various types of loading conditions as well as possible strength deteriorations”, where the concept of the reliability analysis of structures emerged, which considers uncertainties in real-world problems. Through a stochastic reliability analysis, a structure’s performance or reliability is meant to be maximized, while, at the same time, guaranteeing structures to perform as was intended despite the presence of variability. It follows the processes that aim to calculate the Limit State Function (LSF), which separates the safe region from the failure region [46] with the aim of modelling uncertainties and the violation of engineering practices [47].
There are some difficulties in adapting the method in structural optimization as nonlinear mathematical problems characterized by restrictions on the probability that design requirements will be met within a specific period need to be solved. An iterative procedure that includes sub-optimization problems and reliability databases is used to obtain efficient solutions to that type of problem [48,49]; however, computational power was the main obstacle ahead of this method for decades. To employ RBDO, the reliability index or probability of failure must be calculated. There are different methods, such as the FORM, Second-Order Reliability Method (SORM), and MCS, available in the literature to calculate the probability of failure (for more information, please refer to [50,51,52]).
With the advent of computers, the computational power obstacle has been diminished and, as the pioneering research referenced in the article [53], employed GAs to perform RBDO for space trusses. Another approach has been proposed for the RBDO of steel plate girders with corrugated webs [54]. The research combines the FEM with tools such as the Stochastic Perturbation Technique (SPT), Semi-Analytical Approach (AM), and MCS for uncertainties because of manufacturing imperfections or corrosion effects. Based on the limit states such as Ultimate Limit State (ULS) and Serviceability Limit State (SLS) and taking the reliability investigation with time dependency into account, it illustrates how to identify the optimum girder cross-sectional areas to achieve reliability over a fifty-year service duration.
In [55], the RBDO method for industrial robots based on simulation and principles of probability has been described. The method combines Latin Hypercube Sampling, computer simulation, the response surface method, and the Sequential Optimization and Reliability Assessment (SORA) algorithm to increase the reliability of the design. It shows that it can make robot arms lighter by substantial margins while possessing equal dependability. A different focus on the computational aspect of the reliability-based topology optimization (RBTO) problem and the use of stochastic-gradient-based approaches studied by [56]. The authors approximated failure probabilities and improved layouts at lesser computational costs with a minimum of random samples per iteration.
Many researchers preferred using OpenSees for their methodology since it facilitates the integration of reliability analysis with structural optimization processes and works with Tool Command Language (Tcl) scripting for the integration without requiring the code compilation of the source code, interface, and GAs. The referenced study [52] describes approaches developed to provide a reliability-based methodology for the optimum design of three-dimensional trusses, namely, the transmission towers. The integration of Multi-Objective GAs (MOGAs) and FE is used in this study, together with OpenSees 3.7.0 software, which is dedicated to detailed reliability assessments under random wind loading for the development of the tower’s topology and geometric and member sizes. The methodology also bears the advantage of using the importance sampling technique to cut down computer time and focus on sensitive random variables. The findings of the study indicate that the proposed methodology identifies the relationship between the conflicting objectives, the reliability index, and the overall weight, thus equipping the design engineers with the information that can enable informed decisions.
The efficient implementation of Optimization with Nonlinear Structural Reliability Analysis is presented in another article [57] by employing OpenSees. This method enhances the reliability and performance of the structural designs by incorporating variability of such values as design parameters and structural parameters by employing the FORM. The results demonstrate several numerical examples of how optimization can be effective in real-life structures such as trusses and frames. The referenced study [7] appears as another example that uses GAs in conjunction with Nonlinear FE Reliability Analysis using OpenSees to analyze RBDO. The paper shows that, using GAs along with FE analysis, one can solve real-world optimization problems that are nonlinear and probabilistic. This makes it possible to design structures that satisfy the reliability requirements under uncertain loads such as wind, earthquake, and wave loads. Another manuscript [58] presents a strategy incorporating a Complex-Step Approximation (CSA) option with the FORM for sensitivity analysis and RBDO. For more information on the structural and system reliability analysis with a theoretical background and real-world examples, readers can refer to the referenced book [59].
Briefly, RBDO methods are mostly general and can suit any problem; they do not often depend on the deterministic information of the functions, such as derivatives, included in the formulation of the problem, but can also deal with definite design variables [9]. As can be observed, the examined literature examples mostly employ textual programming or software rather than specialized AEC applications. Due to these reasons, the present study utilizes VP, parametric modelling, and the FORM in the BIM environment to perform RBDO, accelerating its adoption and enabling the widespread application of established methodologies from the rich literature in design workflows. This significance of the present study has been, moreover, enhanced by validating the proposed methodology with real-world examples and providing and comparing RBDO optimized models with structurally optimized models, along with employing different MA. Moreover, visualization and validation with MCS and RSA models provide seamless integration and reliability towards the study’s significance. Lastly, all codes are open-source and can be found on a specifically created GitHub account [60], which provides a valuable chance for the reproducibility and enhancement of the proposed methodology.

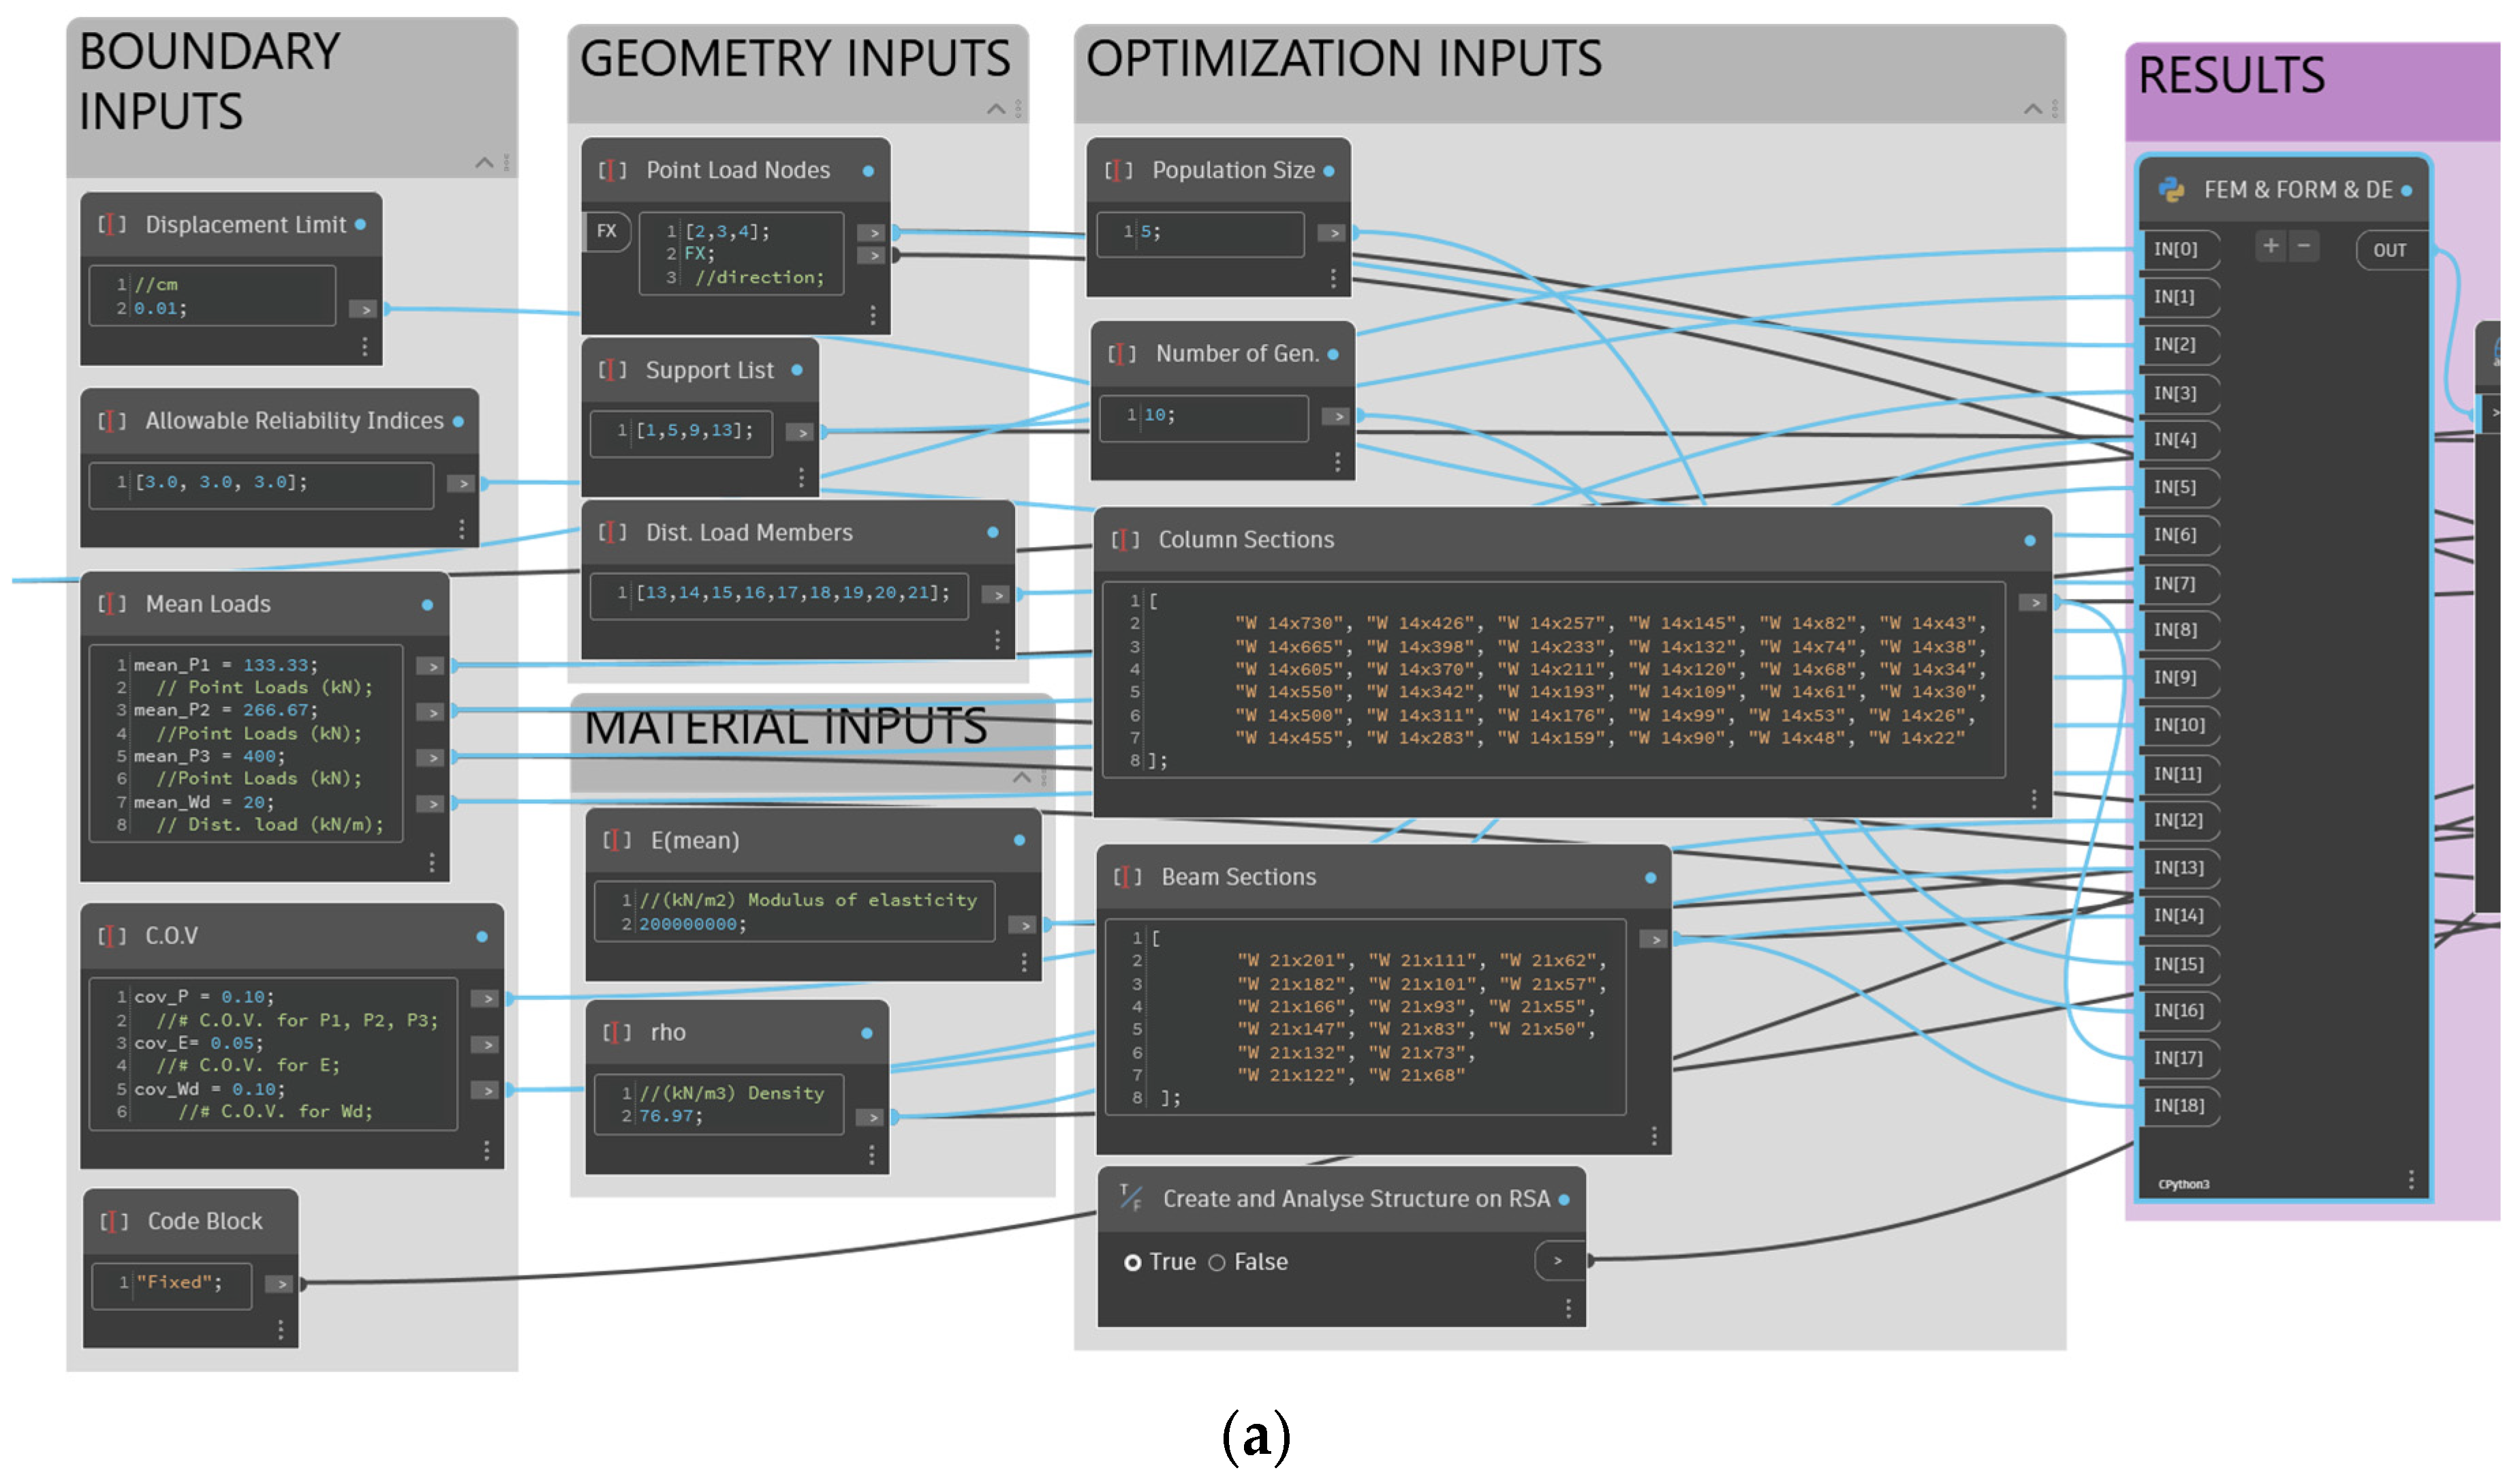
3. Materials and Methods

The workflow for the present study, presented in Figure 1, encompasses the following main phases:
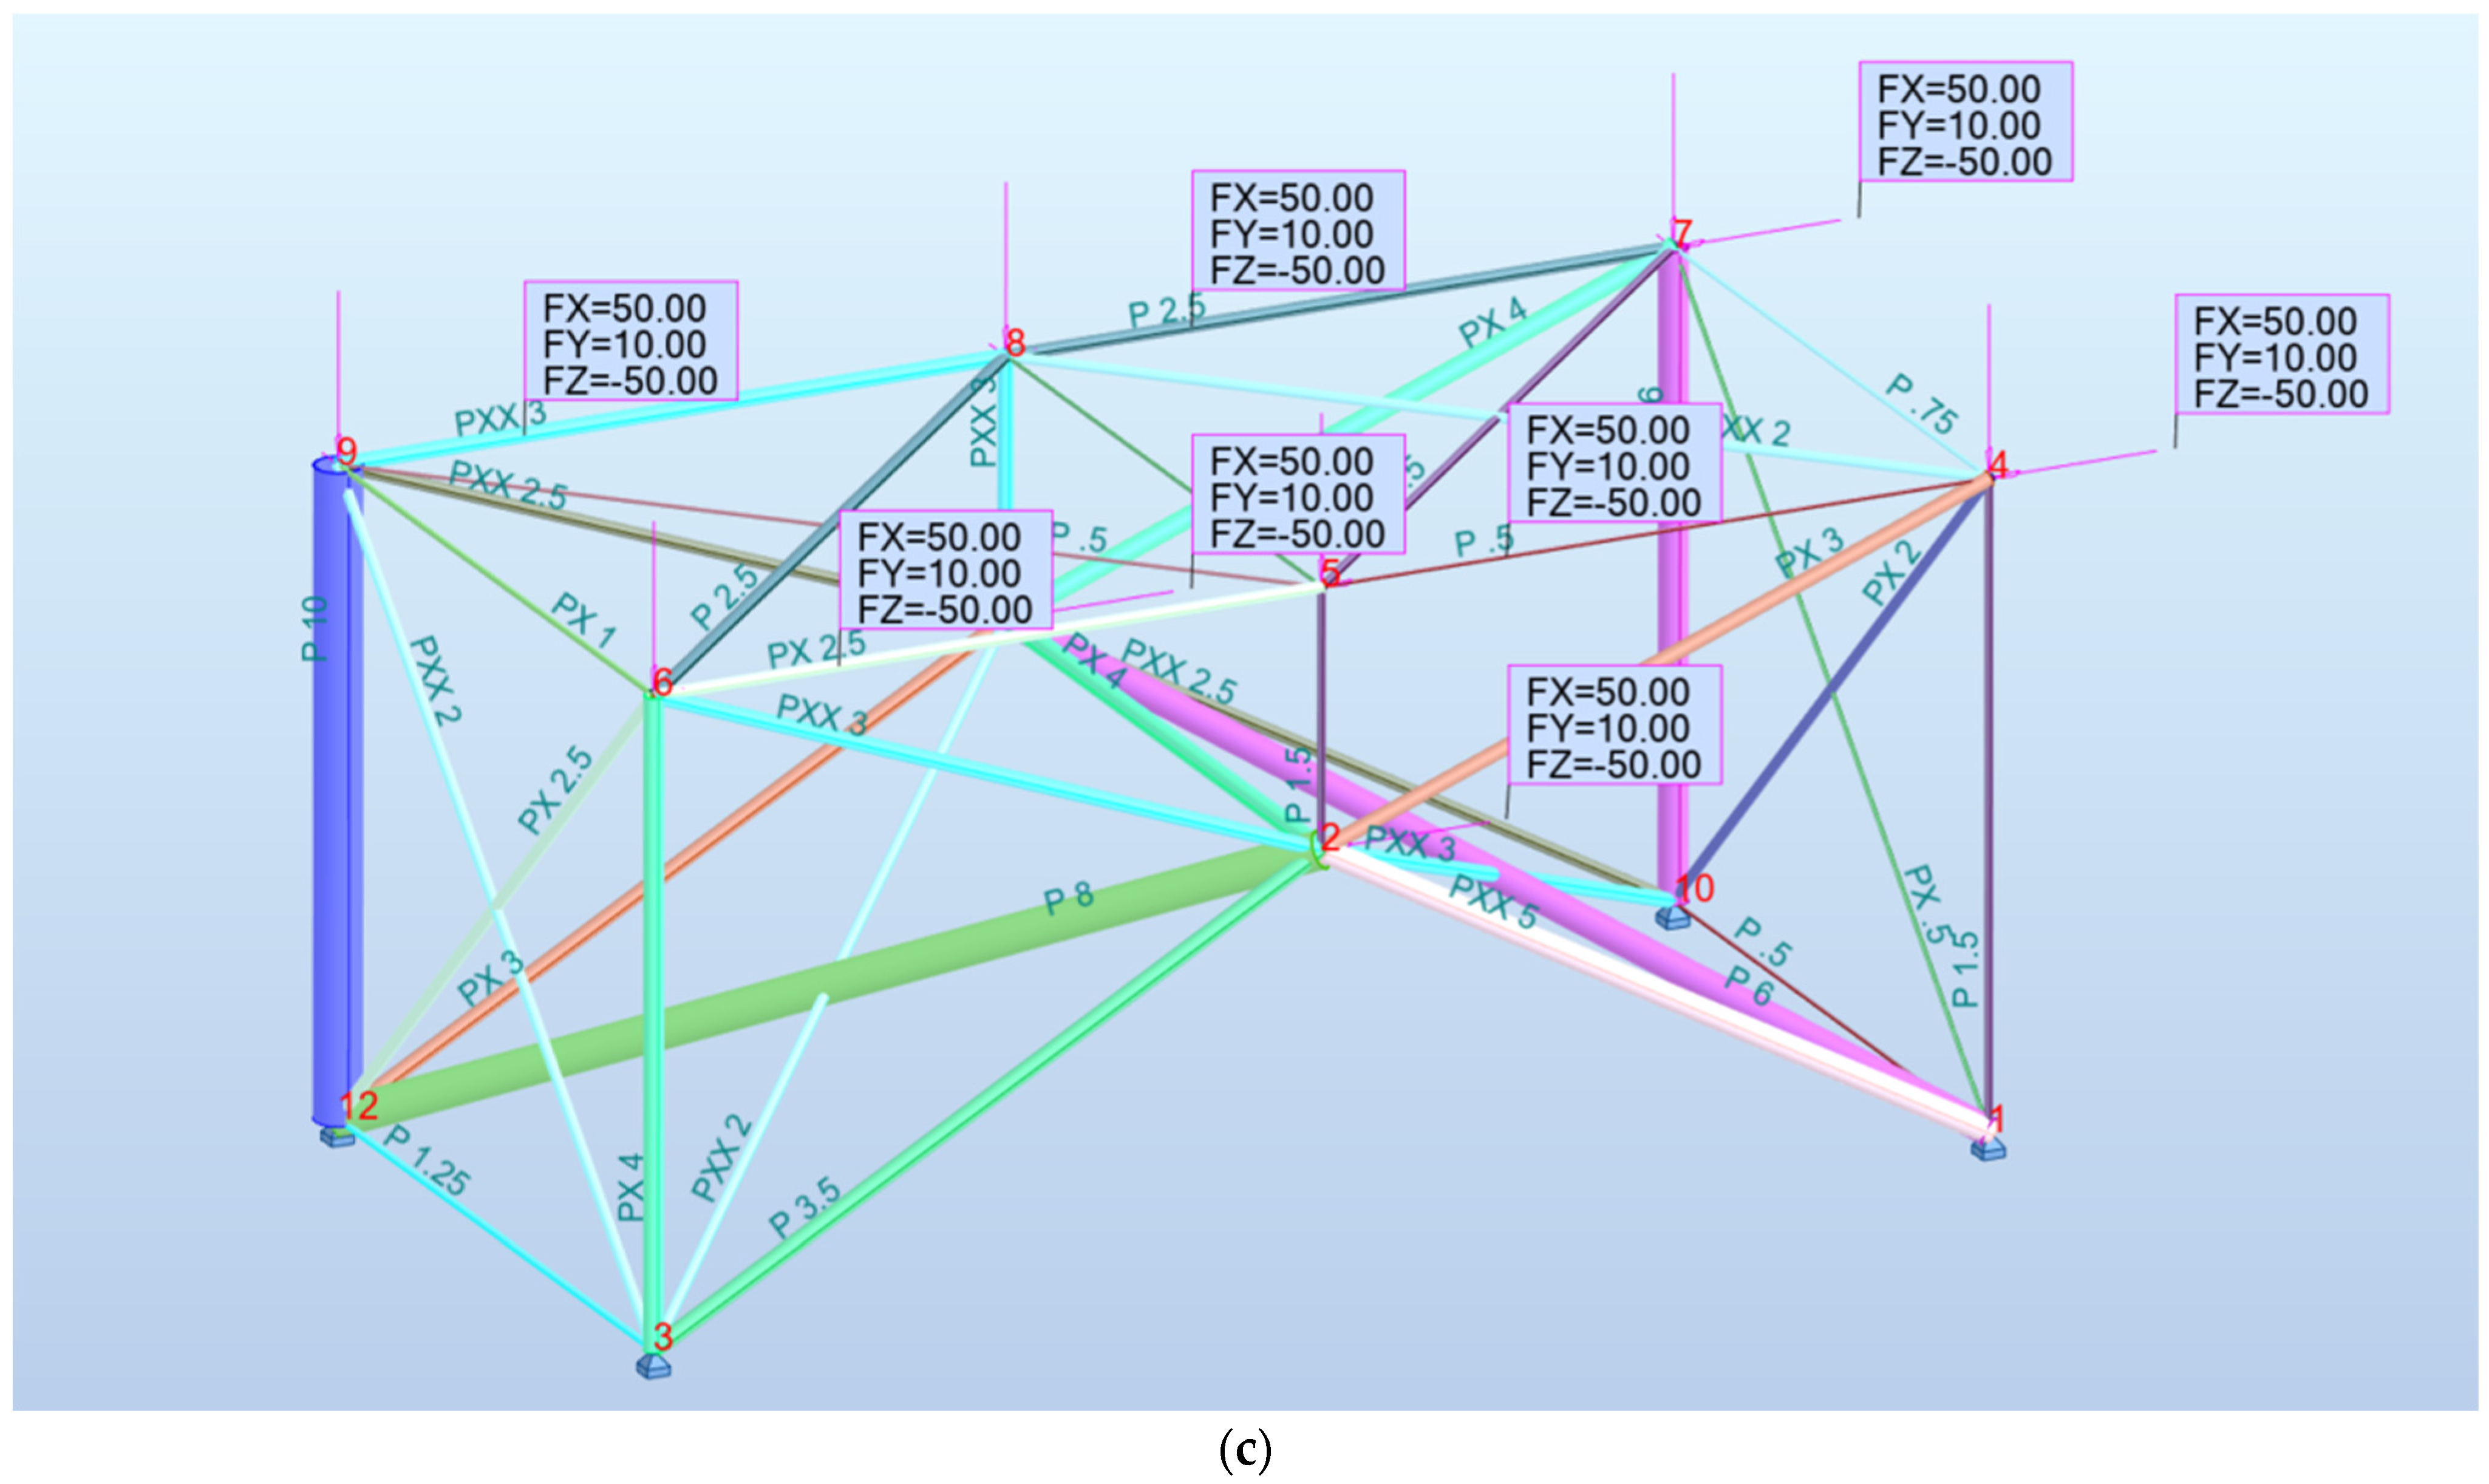
  • Create parametric trusses by using VP (Figure 2);
  • Create a FEM model to perform structural analyses (Figure 3);
  • Perform reliability analysis (Figure 4);
  • Change the design variables with MAs and perform multiple reliability analyses until design criteria are fulfilled (Figure 5);
  • Import the optimized model to the BIM environment for refinement (Figure 6).
Figure 1. Comprehensive workflow of the VP-based RBDO methodology: (a) overall illustration of the Dynamo VP script used in this study; and (b) the flowchart of the proposed methodology.
Applsci 15 01025 g001

3.1. Problem Formulation

The reliability optimization problem aims to find optimum parameters for a structure, such as cross-sectional area or node coordinates, by considering the minimization of an objective such as cost or mass while satisfying constraints such as displacement, stress, or minimum probability of structure failure [61]. This process can be mathematically presented as follows:
Find design variables such as cross-sectional area or nodal coordinates:
A T , x T = A 1 ,   A 2 ,   ,   A n ,   x 1 ,   x 2 ,   ,   x n 2 T
where A 1 ,   A 2 , ,   A n represent the sizes of the structural elements and x 1 ,   x 2 ,   ,   x n 2 represent the coordinates of the nodes in the structure—that minimizes or maximizes objective function:
min f A , x = m = 1 n A i ρ i l i
where min f A , x represents the structure’s mass or some other objective measure to be minimized or maximized, A i is the cross-sectional size of the i -th element, ρ i is the material density of the i -th element, l i is the length of the i -th element, and n is the total number of elements—while satisfying:
prob g A , x 0 Φ β = P f max
where g A , x 0 denotes LSF calculated based on a set of uncertain variables, demand, and capacity of the system. This function defines the success of a structure, and it usually checks if the demand D A , x from the structure or structural element exceeds the capacity C A , x of that element, depending on different variables A , x [52]. β stands for reliability index, and, using this value, the probability of failure ( P f max ) can be calculated using the cumulative distribution function of the standard normal distribution ( Φ ). Here, limit states depend on the designer’s decision, and it can be chosen as SLS, which measures maximum displacement; or ULS, which measures maximum stresses due to external loads; or both [52], which can be formulated as follows:
g 1 A , x = u A , x u max 0 g 2 A , x = σ A , x σ max 0
where σ A , x is the stress values calculated, and σ max is the allowable stress. Similarly, u A , x is the displacements on the nodes, and u max is the allowable displacement. Moreover, the design variables A and x must have specific bounds to ensure practical and feasible designs:
A m i n A A m a x x m i n x x m a x
A m i n and A m a x are the minimum and maximum allowable values for the cross-sectional areas of the structural elements. Similarly, x m i n and x m a x are the minimum and maximum allowable values for the coordinates of the nodes.

3.2. Computational Software and Hardware

All the experiments and tests have been performed on a Notebook with an Intel Core i7-12650H processor, 16 GB RAM (2 × 8 GB), 512 GB SSD, an RTX 4070 8 GB graphics card, and Windows 11 Home operating system. In our study, Dynamo (Version: 3.0.4) has been utilized for the VP environment. Through Dynamo, structures that want to be optimized can be created, and boundary conditions and inputs can be defined. Moreover, Dynamo’s seamless integration with BIM tools such as Revit and RSA, along with its ability to employ Python scripts within its environment, results in utilizing textual programming and addressing the limitations of VP with TP, thereby enhancing the workflow’s robustness and feasibility. Python (Version: 3.9.12) has been utilized to perform FEM, and FORM analysis, along with MAs. Python’s ability to perform faster than Dynamo in processes that require more computational power was invaluable for this study. PyNiteFEA (Version: 0.0.94), a basic 3D structural FEM library created to be utilized in Python by D. Craig Brinck, has been utilized for structural analysis. For further documentation, the reader can refer to the referenced website [62].
The present study employs PyMOO (Version: 0.6.1) library [63], which is an open-source framework created for Python that provides multiple essential MAs such as GA, PSO, DE, NSGA-II, NSGA-III, and MOEA/D, along with various CHTs such as Feasibility First, and Constraint Violation (CV) as Penalty. In the proposed framework, conflicting objectives are considered as constraints, and SOO is performed using both DE and GA algorithms. DE was chosen as the primary method since, according to [64], it is the most utilized and successful algorithm among scholars, while GA, which serves as a foundation in the field of MAs, was implemented to provide alternative results. Another advantage of DE is that it is a parameter-free and easy-to-use algorithm, which saves the users effort in tuning parameters as mentioned previously.
Although GA and DE were chosen for this study, the proposed methodology can be easily adapted to other algorithms. We should mention that the selection and comparison of different MAs are out of scope since our primary aim is to provide a streamlined workflow for RBDO using BIM tools. For this reason, the number of separate analysis runs was kept low. While the outcomes provide significant insights about the MAs, it should be noted that these algorithms mostly use trial-and-error logic and heavily depend on randomness. To properly evaluate the performance of the MAs, a separate study focusing on this area, such as [64,65,66,67,68,69,70,71], would need to be conducted with more run cycles and tuned parameters; however, this is also beyond the scope of the present study.
In this manuscript, PyMOO was utilized to optimize the performance of multiple structures under uncertain circumstances, enabling efficient design creation by combining MAs with RBDO along with FEM analysis to create safe, cost-efficient, and reliable structures. Pystra (Version: 1.3.0), a robust framework for defining random variables, probabilistic models, and employing algorithms to estimate failure probabilities in engineering systems, was an instrumental Python library in conducting the reliability assessments necessary for this study, allowing for rigorous uncertainty quantification. Further documentation about the library can be found in [72]. For the reliability assessments, the Finite Difference Method (FDM), which estimates the derivatives numerically by perturbing the input parameters slightly and observing the change in the system response, has been utilized.

3.3. Design and Development of Parametric Models

The first step, as has been mentioned before, is creating the structure to be optimized on Dynamo by employing visual scripting. For that, node coordinates must be defined using integer sliders or code blocks. Then, a wire model can be created using a line node to connect the created nodes on Dynamo. After those steps, a list containing all created wire elements with corresponding geometry and location information is obtained as demonstrated in Figure 2. A detailed explanation of the structure creature process and utilized nodes can be found in the referenced article [8].

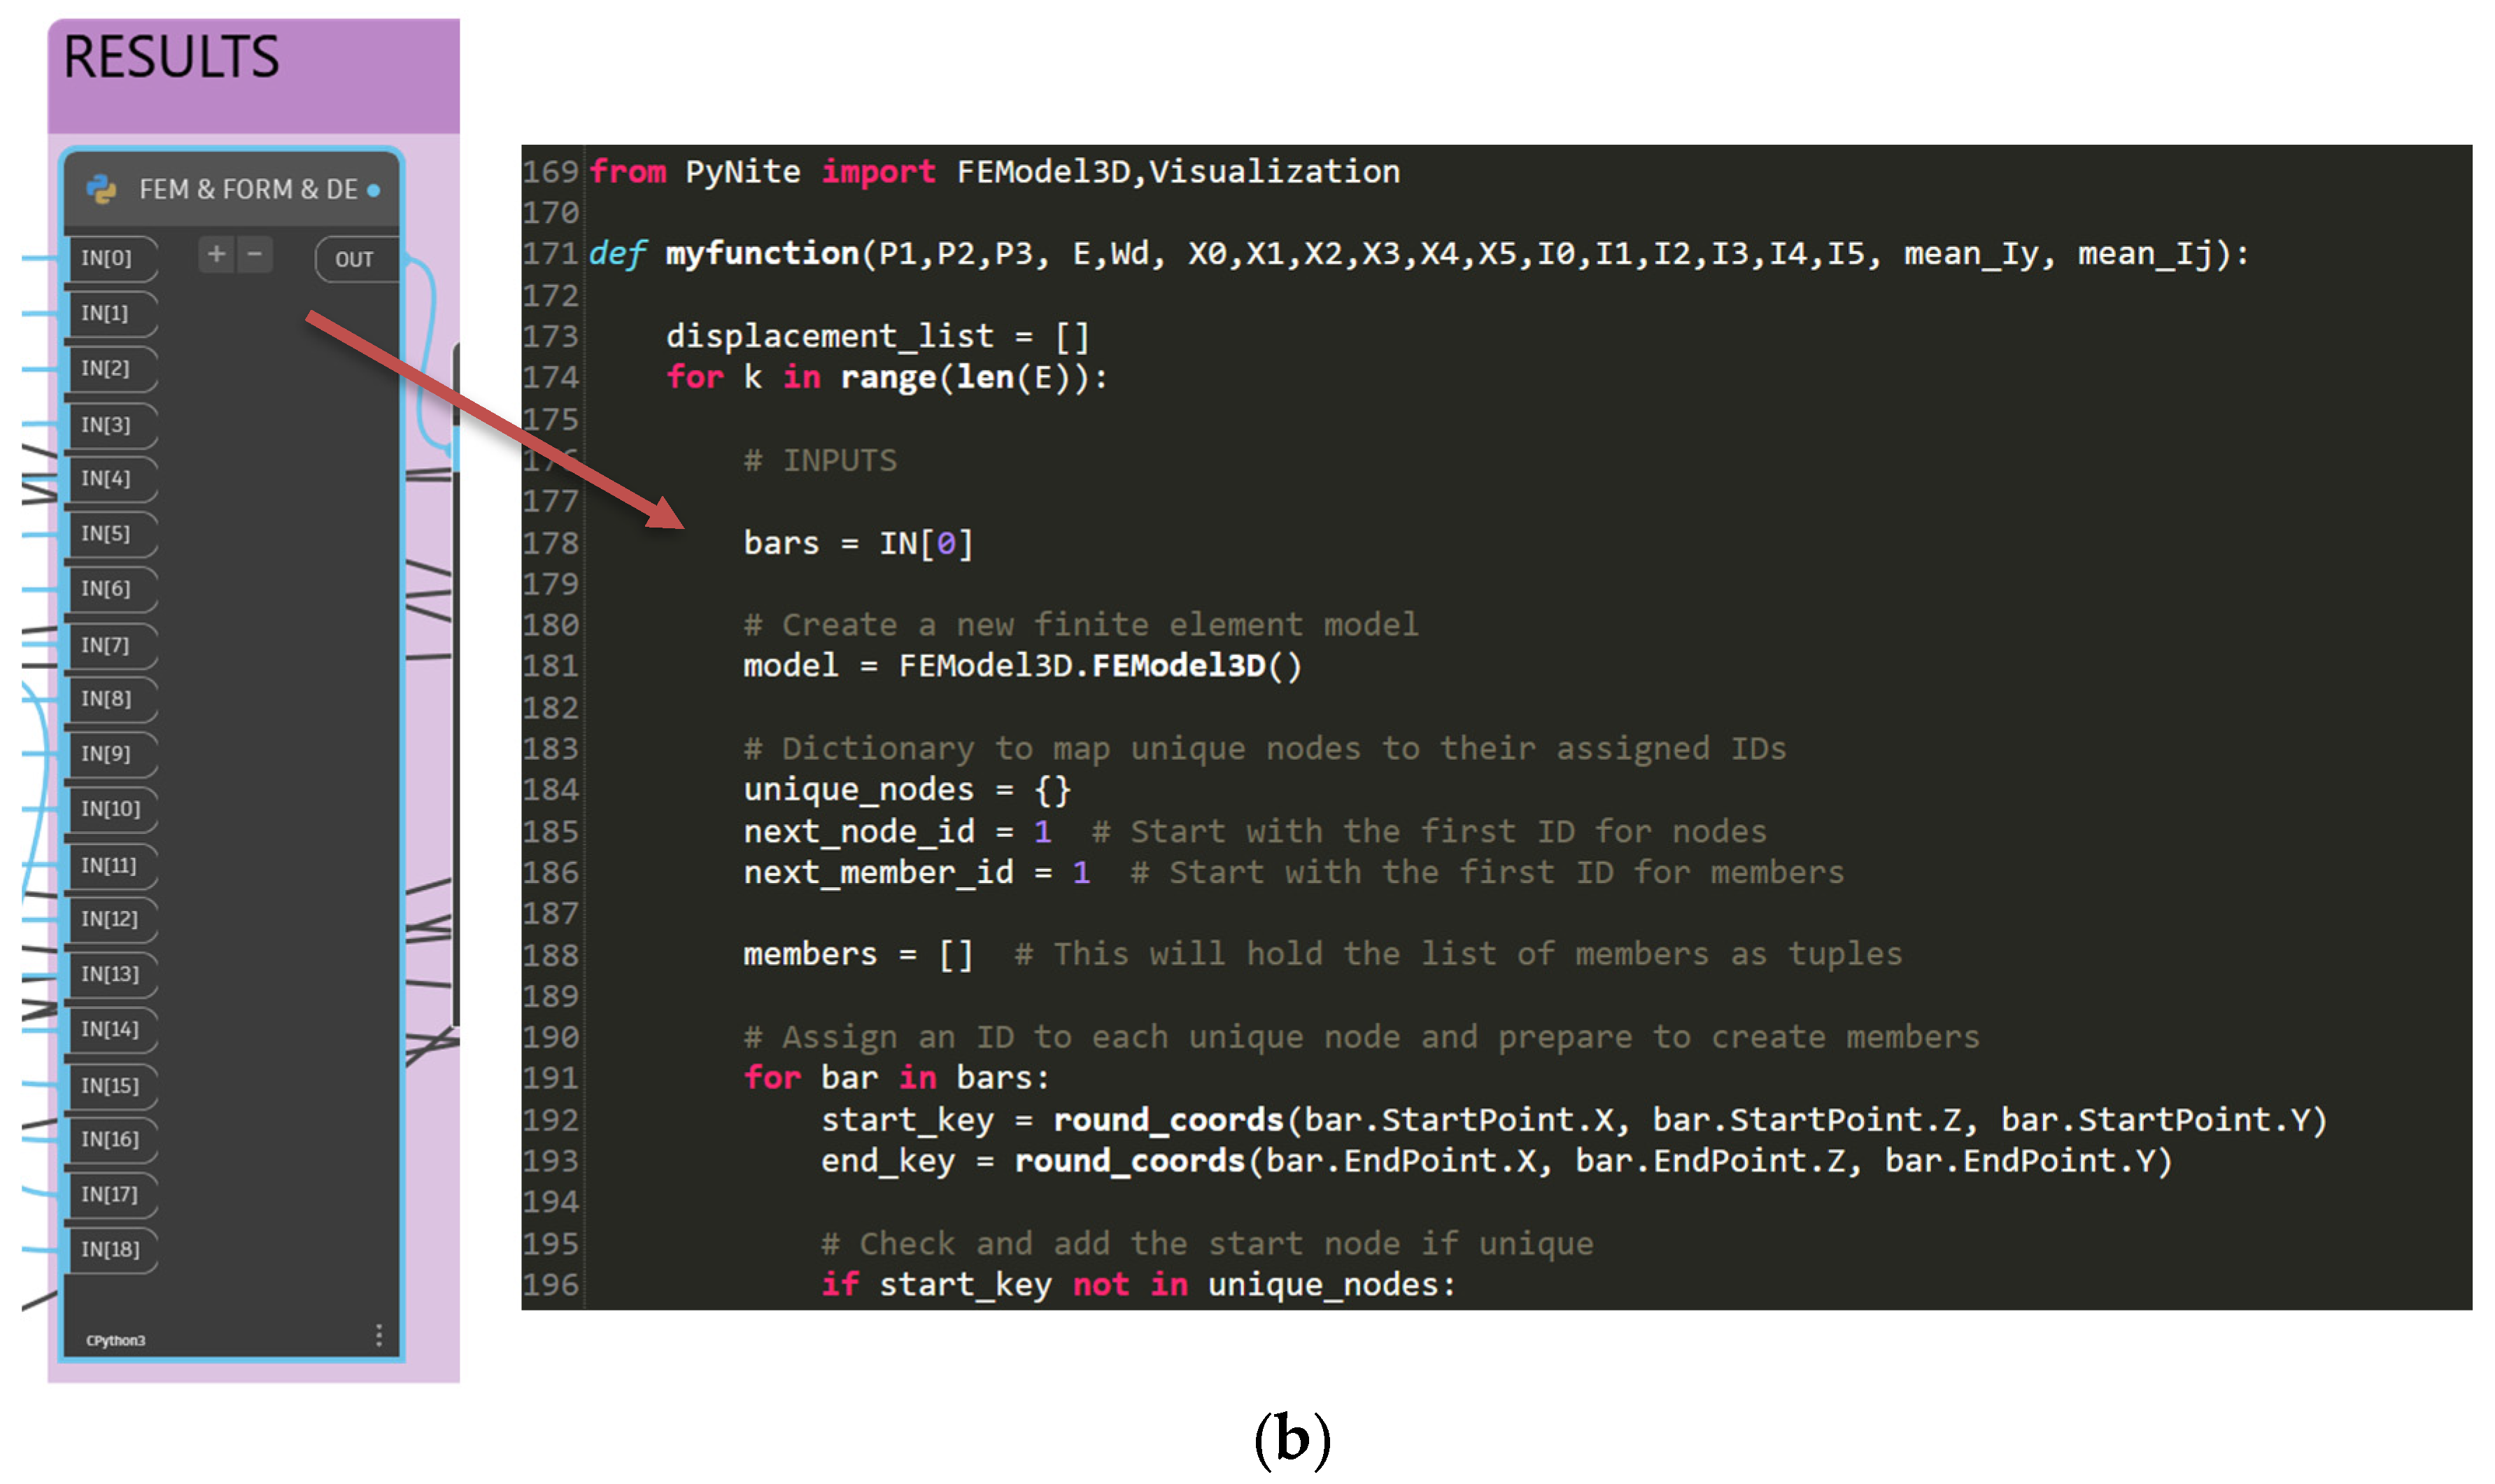
3.4. Structural Analysis in Dynamo Visual Programming

In this part, all input parameters used during the workflow, such as population size, generation number, design variables, etc., are defined as presented in Figure 3a. Subsequently, a Python node is utilized to obtain LSF results using the created wire model on Dynamo. The list created in the previous section is connected to the Python node with “IN[0]” as depicted in Figure 3b. As can be understood from the figure, the list is defined as an input that contains all the elements and corresponding information. Based on those obtained information, a structure and FEM model are created to perform structural analysis, which will give the displacement results for different evaluations. For this step, the PyNite Python library is utilized and the pseudo-code is presented in Algorithm 1 to provide better understanding. For more detailed information about the Python code, please refer to the GitHub website [60].
Algorithm 1: FEM Analysis on Dynamo Through Python Node
  Input: Initial design variables (e.g., loads)
  Output: FEM results (e.g. displacements)
1.Initialize results list;
2.for k in design configurations do
3.Initialize model, nodes and member lists;
4.for bar in IN[0], where IN[0] is Dynamo structural elements list, do
5.Extract nodes and members from Dynamo;
6.Assign IDs to start and end nodes, create FEM model;
end
7.Add supports to model;
8.Add material properties from Dynamo inputs;
9.Add section properties from Dynamo inputs;
10.for i, member in members do
11.Add member to model with material and section properties;
end
12.Add loads from Dynamo inputs;
13.Analyze model;
14.Append FEM results to results list;
end
15.Return FEM results;

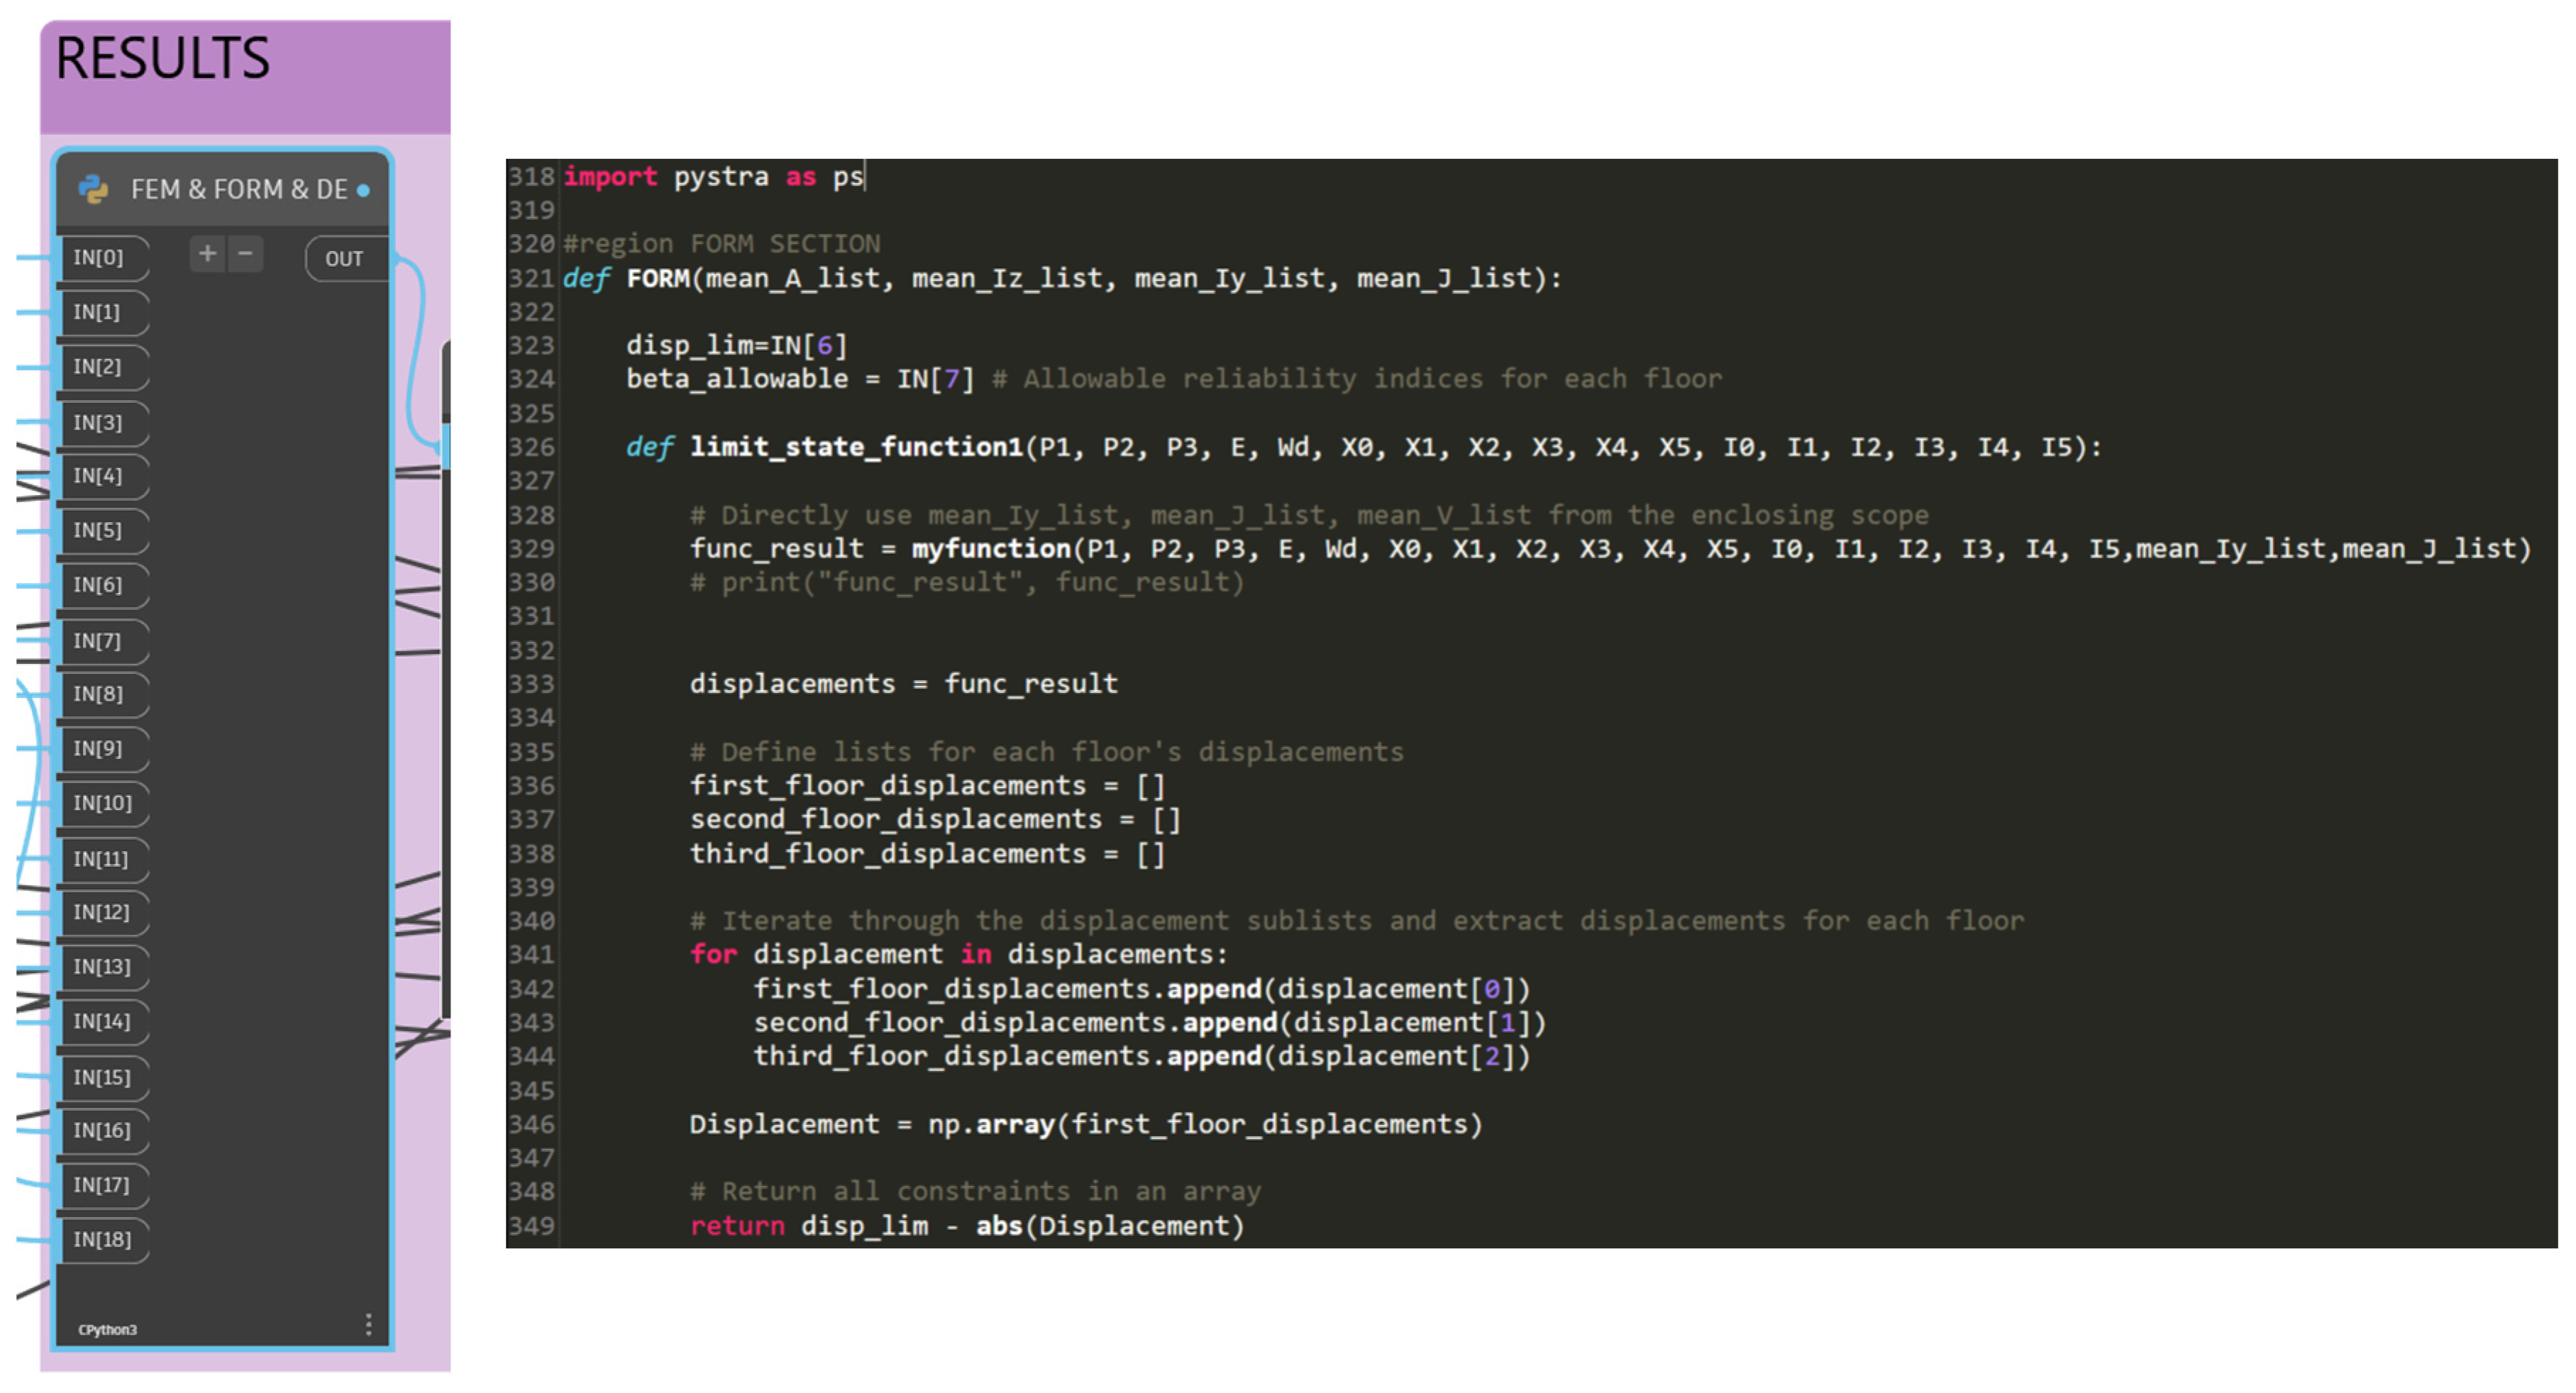
3.5. Reliability Analysis

This study implemented a reliability analysis to assess the structural efficacy and security. As previously mentioned, reliability analysis guarantees structural design safety under uncertain circumstances. That is why the variability in materials and loads’ properties should be considered to realize precise and safe structural design. For this reason, the objective function of this study is constrained by the reliability index (β). This value is calculated by the generation of the FEM model through the PyNite and FORM analysis through the Pystra library to perform multiple FEM analyses for uncertain variables representing distinct design scenarios by using the Python node depicted with a part of the code in Figure 4. The distribution of design variables can be adjusted along with specified mean and standard deviations corresponding to the probabilistic nature of the variables, as depicted in Figure 3a. Certain failure conditions of the structure, defined through LSF, must be met with constraints specified by the inputs in Figure 4. The LSF can be the displacement at a particular node or entire structure, or stress values limited to a certain amount. Based on the results obtained from FORM analysis, the reliability index, which quantifies the issue of safety and gives a clue to the safety margin of the structure and the probability of failure, which was estimated from the reliability index, were determined for each design scenario. The higher value of β suggests that the probability of failure is lower. For better understanding, following pseudo-code, which serves as a foundation for the corresponding Python implementation shown in Figure 4, has been prepared and presented in Algorithm 2.
Algorithm 2: FORM Analysis on Dynamo Through Python Node
  Input: Structure with mean-COV values for design variables (e.g., elasticity modulus)
  Output: Constraint violation
1.Initialize violation list;
2.Set displacement limits from Dynamo;
3.Set allowable reliability from Dynamo;
4.Create stochastic model with predefined random variables;
5.Define FEM based LSF by using logic in Algorithm 1;
6.while i < imax, where imax is maximum iteration number, do
7.Compute LSF by calling FEM model;
8.Update the search point;
9.Check convergence;
10.if converged: break;
11.i ← i + 1;
end
12.Get beta values;
13.Calculate violation = (beta_allowable − beta)/beta_allowable;
14.Return violation list;

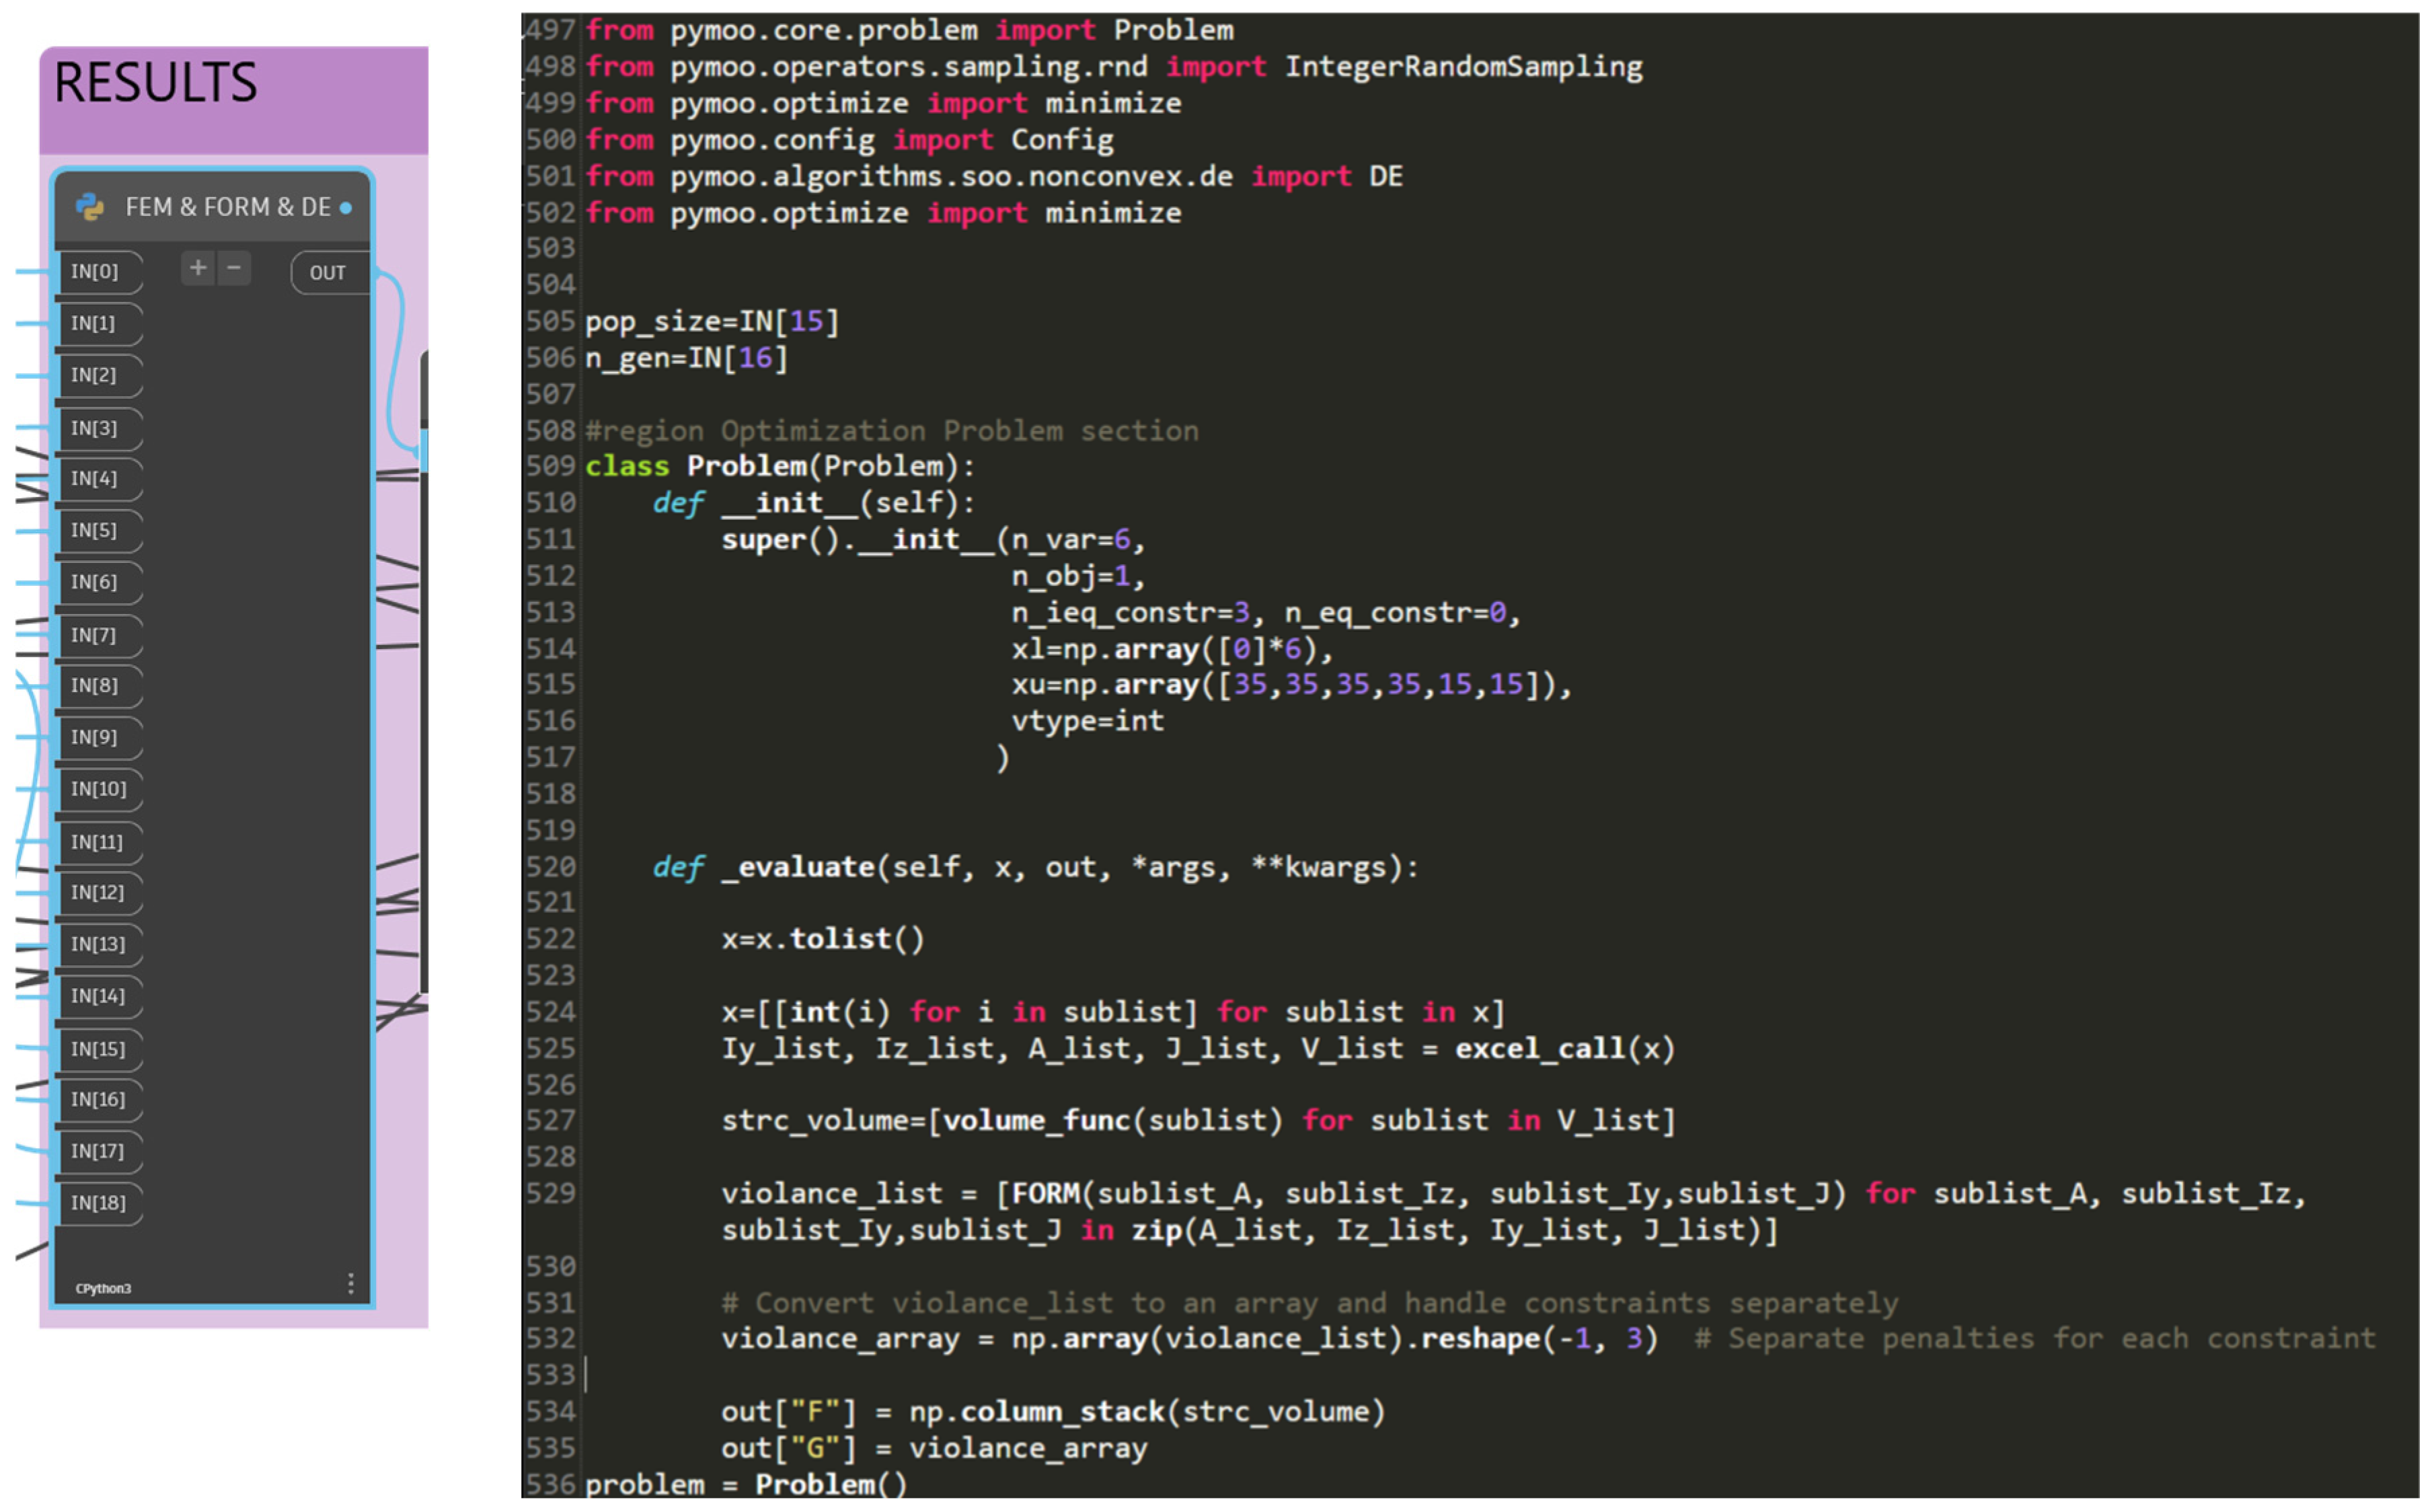
3.6. AI-Based Optimization

The structural optimization section of the methodology redesigns the structural model to decrease the structure’s overall mass, volume, or cost, together with its associated risks. This section combines previously explained FEM analysis and reliability analysis with an optimization algorithm as a way of determining the best design. One of the major concerns of structural optimization lies in identifying the corresponding cross-sectional areas of structural members that can lead to the establishment of a lighter structure, while, at the same time, meeting predefined criteria. As previously mentioned, the PyMOO library has been utilized to employ AI-based MAs in this process. Conforming to PyMOO’s problem class, the indicated optimization problem is defined as presented in Figure 5. In this class, the design variables, such as cross-sectional dimensions or node coordinates, must be defined along with the lower and upper bounds of these variables. The number of objectives must be specified. Here, reliability constraints can be defined as objectives, and problems can be solved by using MOO algorithms. Reliability can be also defined as a constraint for the problem, and optimization can be solved using Single-Objective Optimization (SOO) algorithms. In the present study, the authors have preferred using the single-objective function to be minimized by applying constraint, which is the reliability index. The optimization process is performed with the help of two different MAs, namely, GAs and DE algorithms, population-based optimization algorithms suitable for solving complex multi-dimensional problems. As a CHT, the Adaptive Epsilon Constraint Handling technique from PyMOO with “perc_eps_until” value of 0.25, which represents the percentage of the total optimization run at which the ϵ value should become zero (please refer to [17] for more information), has been employed. DE is used with Latin Hypercube Sampling (LHS) as a sampling method to generate the initial population by breaking the range of all the variables into LHS intervals and selecting one random value within the entire intervals. Mutation is also an essential part of DE, which can be described as the production of a new candidate solution by adding a weighted difference of two population vectors to another vector. The DE variant used in this study is DE/rand/1/bin, which means that exactly one difference vector is used, and binomial crossover is used. The crossover rate in the study was set at 0.3, which means the percentage of the total elements taken from the mutant vector is 30%. The GA parameters are integer random sampling with duplicate elimination, simulated binary crossover (SBX) with a probability value set to 1 and eta value set to 3, and polynomial mutation (PM) with a probability value set to 1 and eta value set to 3. Although DE and GA are chosen as the main algorithms, the proposed workflow allows using various algorithms with different settings, facilitated by the PyMoo library depending on designers’ preference. The pseudo-code for the optimization part has been depicted in Algorithm 3.
Algorithm 3: RBDO Problem Definition and Optimization
  Input: Optimization problem with parameters (e.g., population size)
  Output: Optimized design variables (e.g., cross-sectional areas)
1.Define the optimization problem by using logic in Algorithm 2;
2.Set MA and CHT (e.g., GA with penalty method);
3.Set lower and upper bounds for the design variables;
4.Set constraints for optimization problem;
5.Initialize constraint violation list;
6.while k < kmax, where kmax is generation number, do
7.Compute reliability violations by employing FORM
8.Compute objective functions (e.g., mass)
9.Check convergence;
10.if converged: break;
11.kk + 1;
12.Create new population;
end
13.Return reliability based optimized design variables;
Furthermore, to facilitate the use of real-world cross-sections, another function has been integrated into our methodology. The ‘excel_call’ function pulls structural section properties from AISC data [73] for specified column and beam sections based on section names. First, it loads the file and maps the indices to a predefined list of section names. For each section, it extracts key properties: moments of inertia (Iy, Iz), cross-sectional area (A), polar moment of inertia (J), volume (V), etc. The retrieved values are converted to SI units for consistency. The function processes multiple sets of indices in a single call, returning these properties in separate lists and optimizing for batch analysis in structural simulations. The pseudo-code for this function is also presented in Algorithm 4.
Algorithm 4: Processing AISC Data on Dynamo
  Input: AISC data path
  Output: AISC section properties (e.g. cross-sectional areas)
1.Load Excel file from specified path on Dynamo and read into dataframe;
2.for each set of section indices do
3.Select sections from dataframe based on section indices;
4.Initialize lists for extracted data (e.g., moment of inertia);
5.foreach section in selected sections do
6.if section exists in dataframe then;
7. Read section properties from dataframe;
8. Convert extracted values to required units;
9. Append converted properties to respective lists;
end
end
10.Append these lists to the corresponding overall lists;
end
11.Return lists of transformed section properties from an Excel file;

3.7. Interoperability with BIM Software

One of the many benefits of using Dynamo is its seamless integration with other Autodesk tools, such as Revit and RSA. In a previous study [8], the integration between Revit has been demonstrated. Since this study does not employ RSA for FEM analyses, a script has been prepared (Figure 6) to import the optimized model directly to RSA by using API for further adjustments. With this method, the designers can perform further analysis, such as stability or structural performance, or visualize the model on RSA. After the designer decides on the final version, the model can be directly imported from RSA to Revit using import tools available on RSA.
Moreover, the results section of the workflow presented in Figure 6 provides valuable insights into the optimization process. In the first watch window, the details of the optimization process are shown, including the number of generations and evaluations, constraint violations, and the best solutions found. The optimized variable indices are displayed and can be used to recreate the structural model. The second part of Figure 6 works with a “Boolean” input. If “True” is selected, the model will be directly created on RSA, and the structural analysis will be performed and saved as an RSA file to the specified directory, as demonstrated in Figure 6. The pseudo-code detailing the generation and analysis procedure for a model in the RSA is presented in Algorithm 5.
Algorithm 5: Generate and Analyze Model on RSA
  Input: Optimized design variables along with geometry, material, boundary, etc.
  Output: RSA model and FEM results
1.Check Boolean input from Dynamo;
2.if RSA option on Dynamo is True then
3.Load RSA API library and import API;
4.Initialize Robot Application;
5.Define unique node identification system;
6.Assign an ID to each unique node using rounded coordinates;
7.Create nodes and bars in RSA;
8.Define supports and their types;
9.Create and apply load cases from Dynamo inputs;
10.Define material properties from Dynamo inputs;
11.Assign sections to bars based on input indexes;
12.Run calculation engine;
13.Save the project;
14.Print “Structure Created on RSA and Analysis have been started”;
end
15.else
16.Print “Option is not selected”;
end
17.Return RSA file for optimized model;

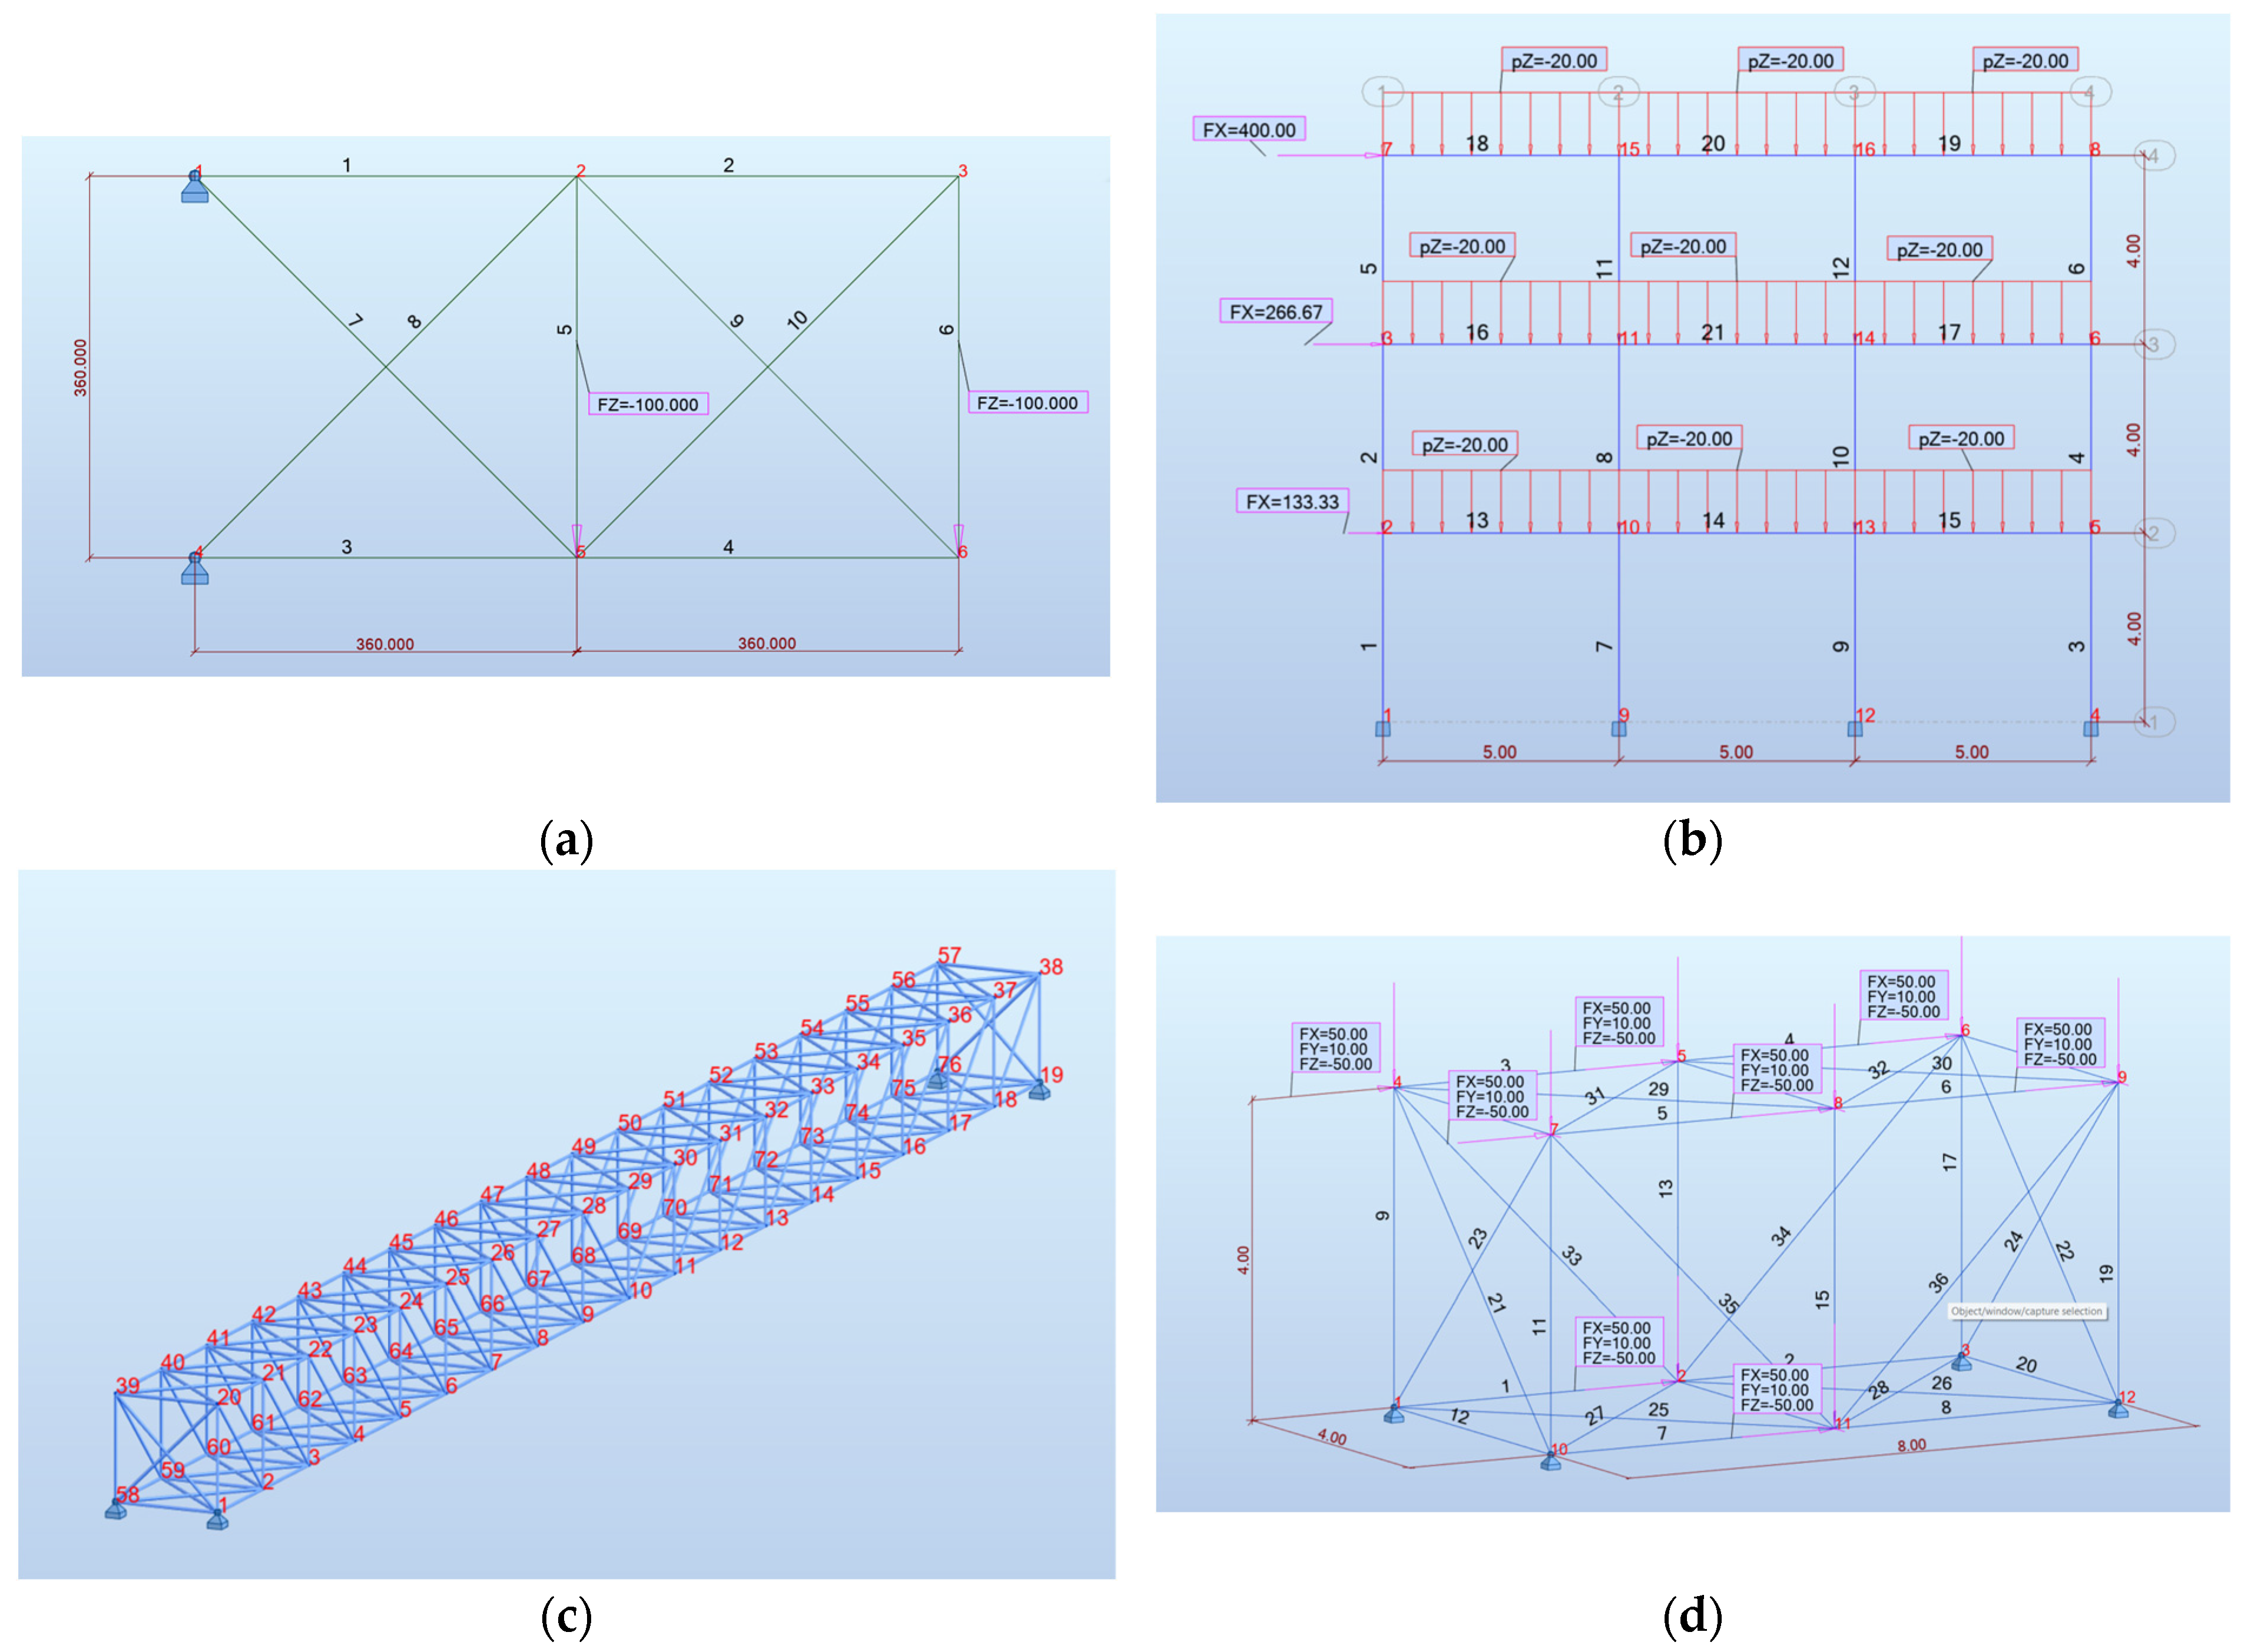
4. Experimental Case Studies and Results

This section presents experimental outcomes for various benchmark problems. These problems, detailed in the Experimental Setup section, are addressed using RBDO through the DE algorithm and GA and the proposed methodology. The separate run cycles, population size, and generation number were kept the same for the GA and DE, along with separate run numbers. The algorithms that gave the best result were presented in the Result and Analysis section. These were then applied to two examples obtained from the open literature, namely, RBDO examples and conventional structural optimization examples with deterministic values. For the conventional examples, MCS was applied to determine their reliability indices, allowing for a comprehensive comparison to demonstrate the effectiveness of the proposed method. Even though the created methodology can optimize structures based on their cross-sectional area (size optimization), nodal coordinates (shape optimization), and the existence of elements or nodes (topology optimization), the current study’s scope focuses on reliability-based size and shape optimization. As previously mentioned, one of the ideas was utilizing RSA, another BIM tool, for FEM analysis; however, the long waiting time made this option impossible. To provide better insight into the time cost, Table 1 has been presented to researchers. The scripts and corresponding Python code for the reproducibility of the experimental setup and methodology, along with detailed instructions, can be found in the dedicated GitHub repository for this study [60].

4.1. Experimental Setup

The first example is a standardized benchmark problem for structural optimization and is preferred by many scholars [21,23,53,74] to validate their methodology. Similarly, this 10-bar truss, whose geometric configuration is given in Figure 7, has been selected as the first example for this research. The problem and material properties of the problem are sourced from the referenced article [57], and they are defined as follows: The cross-sectional areas, Ai, of the truss members will be determined during the analysis. The applied load Fz has a mean value of 100 kips and is modelled with a normal distribution. The modulus of elasticity E for the material is specified with a mean value of 1000 ksi. All those parameters are assumed to follow a normal distribution with a coefficient of variation (COV) of 0.05. The lower and upper bounds for cross-sectional areas are 0–35 in2 for this problem. In that regard, this is considered a continuous RBDO problem, with the objective function considered as the mass of the structure. LSF is formulated as g X = 2 Δ y X , which indicates limited displacement occurred by X uncertain variables on the y-axis at node 6 by 2 in.
For the second example, the optimization of a multi-story steel frame with three levels and three bays, which is subjected to a combination of concentrated forces and distributed loads, as illustrated in Figure 7, is studied. The frame design incorporates 17 random parameters to maintain comparability with the original study: six associated with the cross-sectional areas of structural components, six related to the moments of inertia of these components, one representing the Young’s modulus of the material, three variables for horizontal forces, and one for the dead loads on the beams. Moreover, several parameters are considered uncertain and are characterized by their respective probability distributions, mean values, and COV. The cross-sectional area (A) and the moment of inertia (I) are both assumed to follow a lognormal distribution, with their mean values determined by the proposed method and a COV of 0.05. The modulus of elasticity E is also lognormally distributed, with a mean value of 200,000 MPa and a COV of 0.05. The distributed load WD follows a normal distribution with a mean of 20 kN/m and a COV of 0.10. The point loads P1, P2, and P3 are modelled as lognormal distributions with mean values of 133.33 kN, 266.67 kN, and 400.00 kN, respectively, each having a COV of 0.10. The frame’s 21 elements have been consolidated into six distinct groups, as explained in [57]. The design variables are word steel sections for the frame’s columns and beams, making the example a discrete RBDO problem. A list containing 36 different W14 column profiles and 16 different W21 beam profiles for each design variable is sourced from the AISC LRFD Manual [73] for optimization. The objective function of this optimization is to minimize the structural volume while ensuring that the inter-story drift does not exceed 0.01 m, which is in line with three defined reliability constraints for all stories.
In the final example, a 3D structure is sourced from referenced article [75] which proposed a new standard benchmarking suite called “ISCSO 2016-2022” for evaluating structural optimization algorithms using problems from the International Student Competition in Structural Optimization (ISCSO) [76]. The authors aim to address the lack of challenging modern benchmarks in the field. Each benchmark problem is formulated to minimize the mass of truss structures while adhering to constraints on strength and displacement based on AISC-LRFD standards [77]. The paper and website provide detailed formulations for different test cases, ensuring consistency and accuracy in comparison. The ISCSO 2019 problem, which has 260 truss members and 270 design variables, presented in Figure 7c, has been adopted for this study.
However, to optimize it within a reasonable computational time, the problem has been scaled by using three nodes in the x direction instead of 19. This new 36-member space truss structure, shown in Figure 7d, represents a complex three-dimensional structural system commonly used in industrial applications. The cross-sectional areas of the members are selected from a discrete set of 37 standard pipe sections sourced from [77], which could also be found in [76]. The loading conditions include three independent forces: P1 and P2 with mean values of 50 kN acting in the x and y directions, respectively, and P3 with a mean value of 10 kN acting in the negative z direction. The material properties are characterized by a modulus of elasticity (E) with a mean value of 200,000,000 kN/m2.
The optimization problem considers both sizing variables (cross-sections for all members) and shape variables (z-coordinates of bottom nodes) with bounds of −2500 mm to 3500 mm, making it a mixed discrete–continuous RBDO problem with 38 random variables. For reliability analysis, all random variables (P1, P2, P3, and E) follow lognormal distributions, while the y coordinates follow a normal distribution with a standard deviation of 0.05. The objective function is the total mass of the structure. The LSF is formulated based on the maximum nodal displacement, with a constraint of 2.5 mm in any direction. This ensures the structure maintains its serviceability under the uncertain loading and material conditions. The reliability requirement is specified with a target reliability index (β) of 3.0, corresponding to a probability of failure of approximately 0.00135.

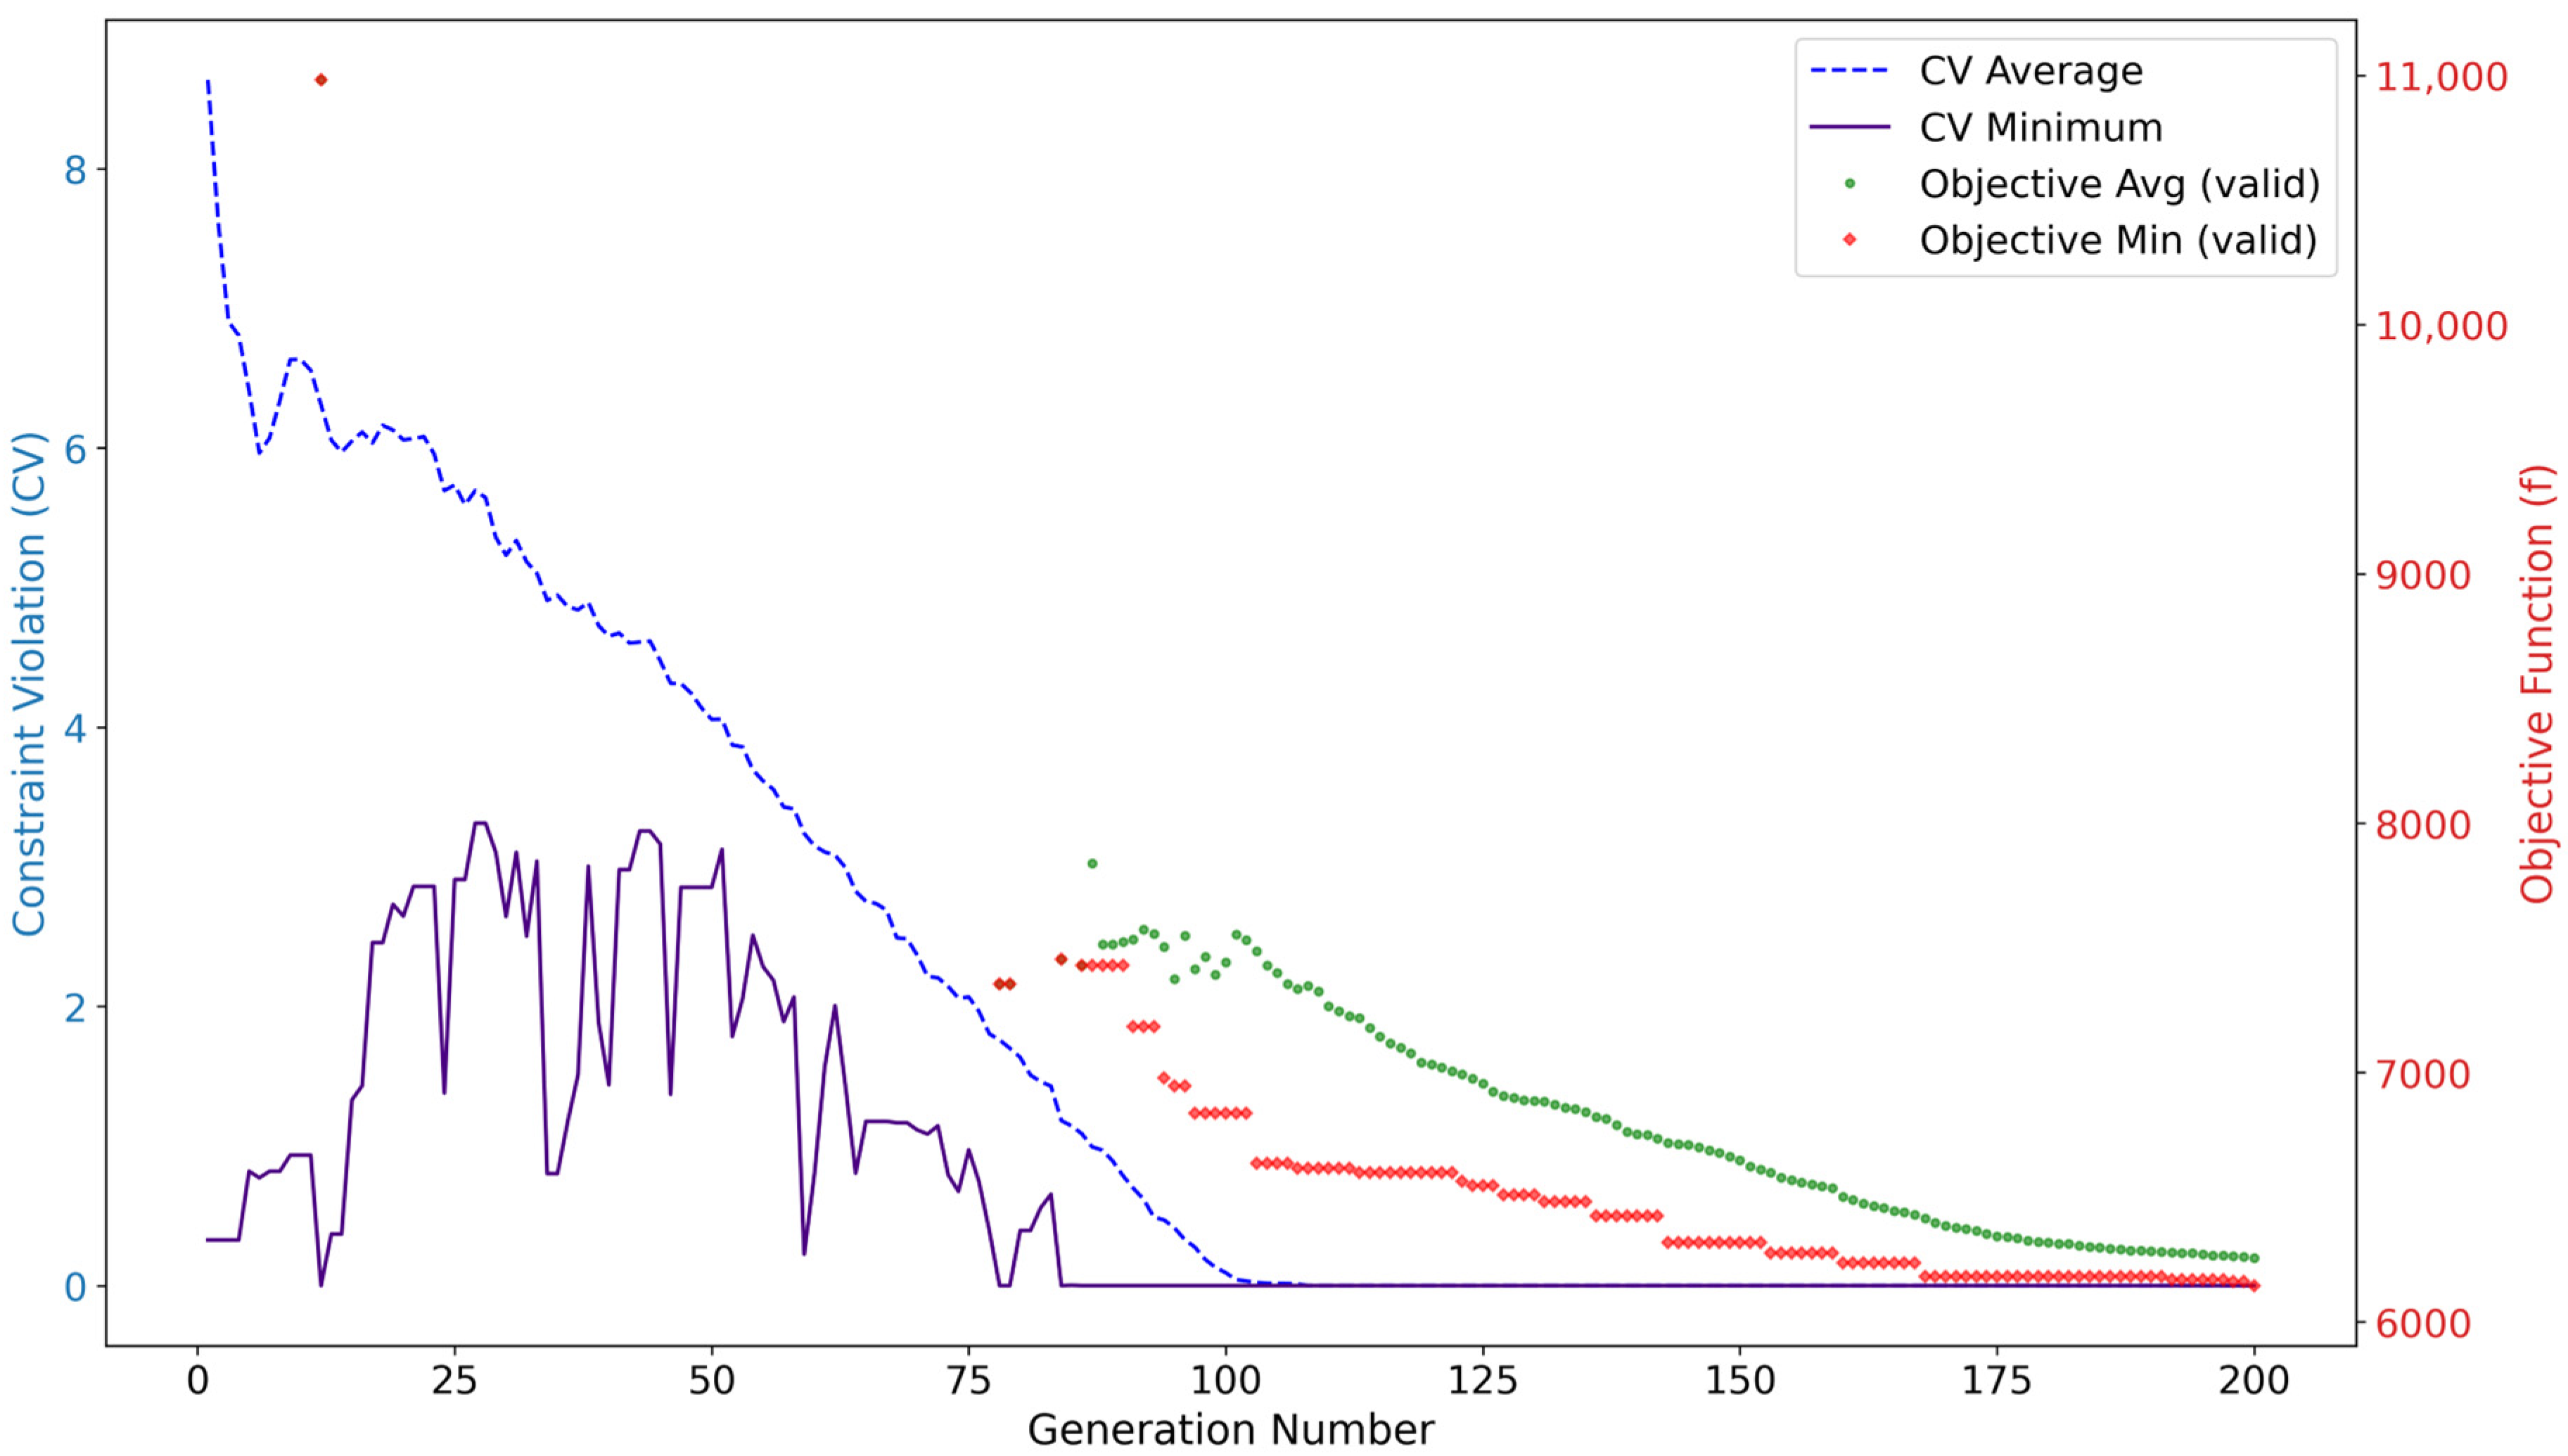
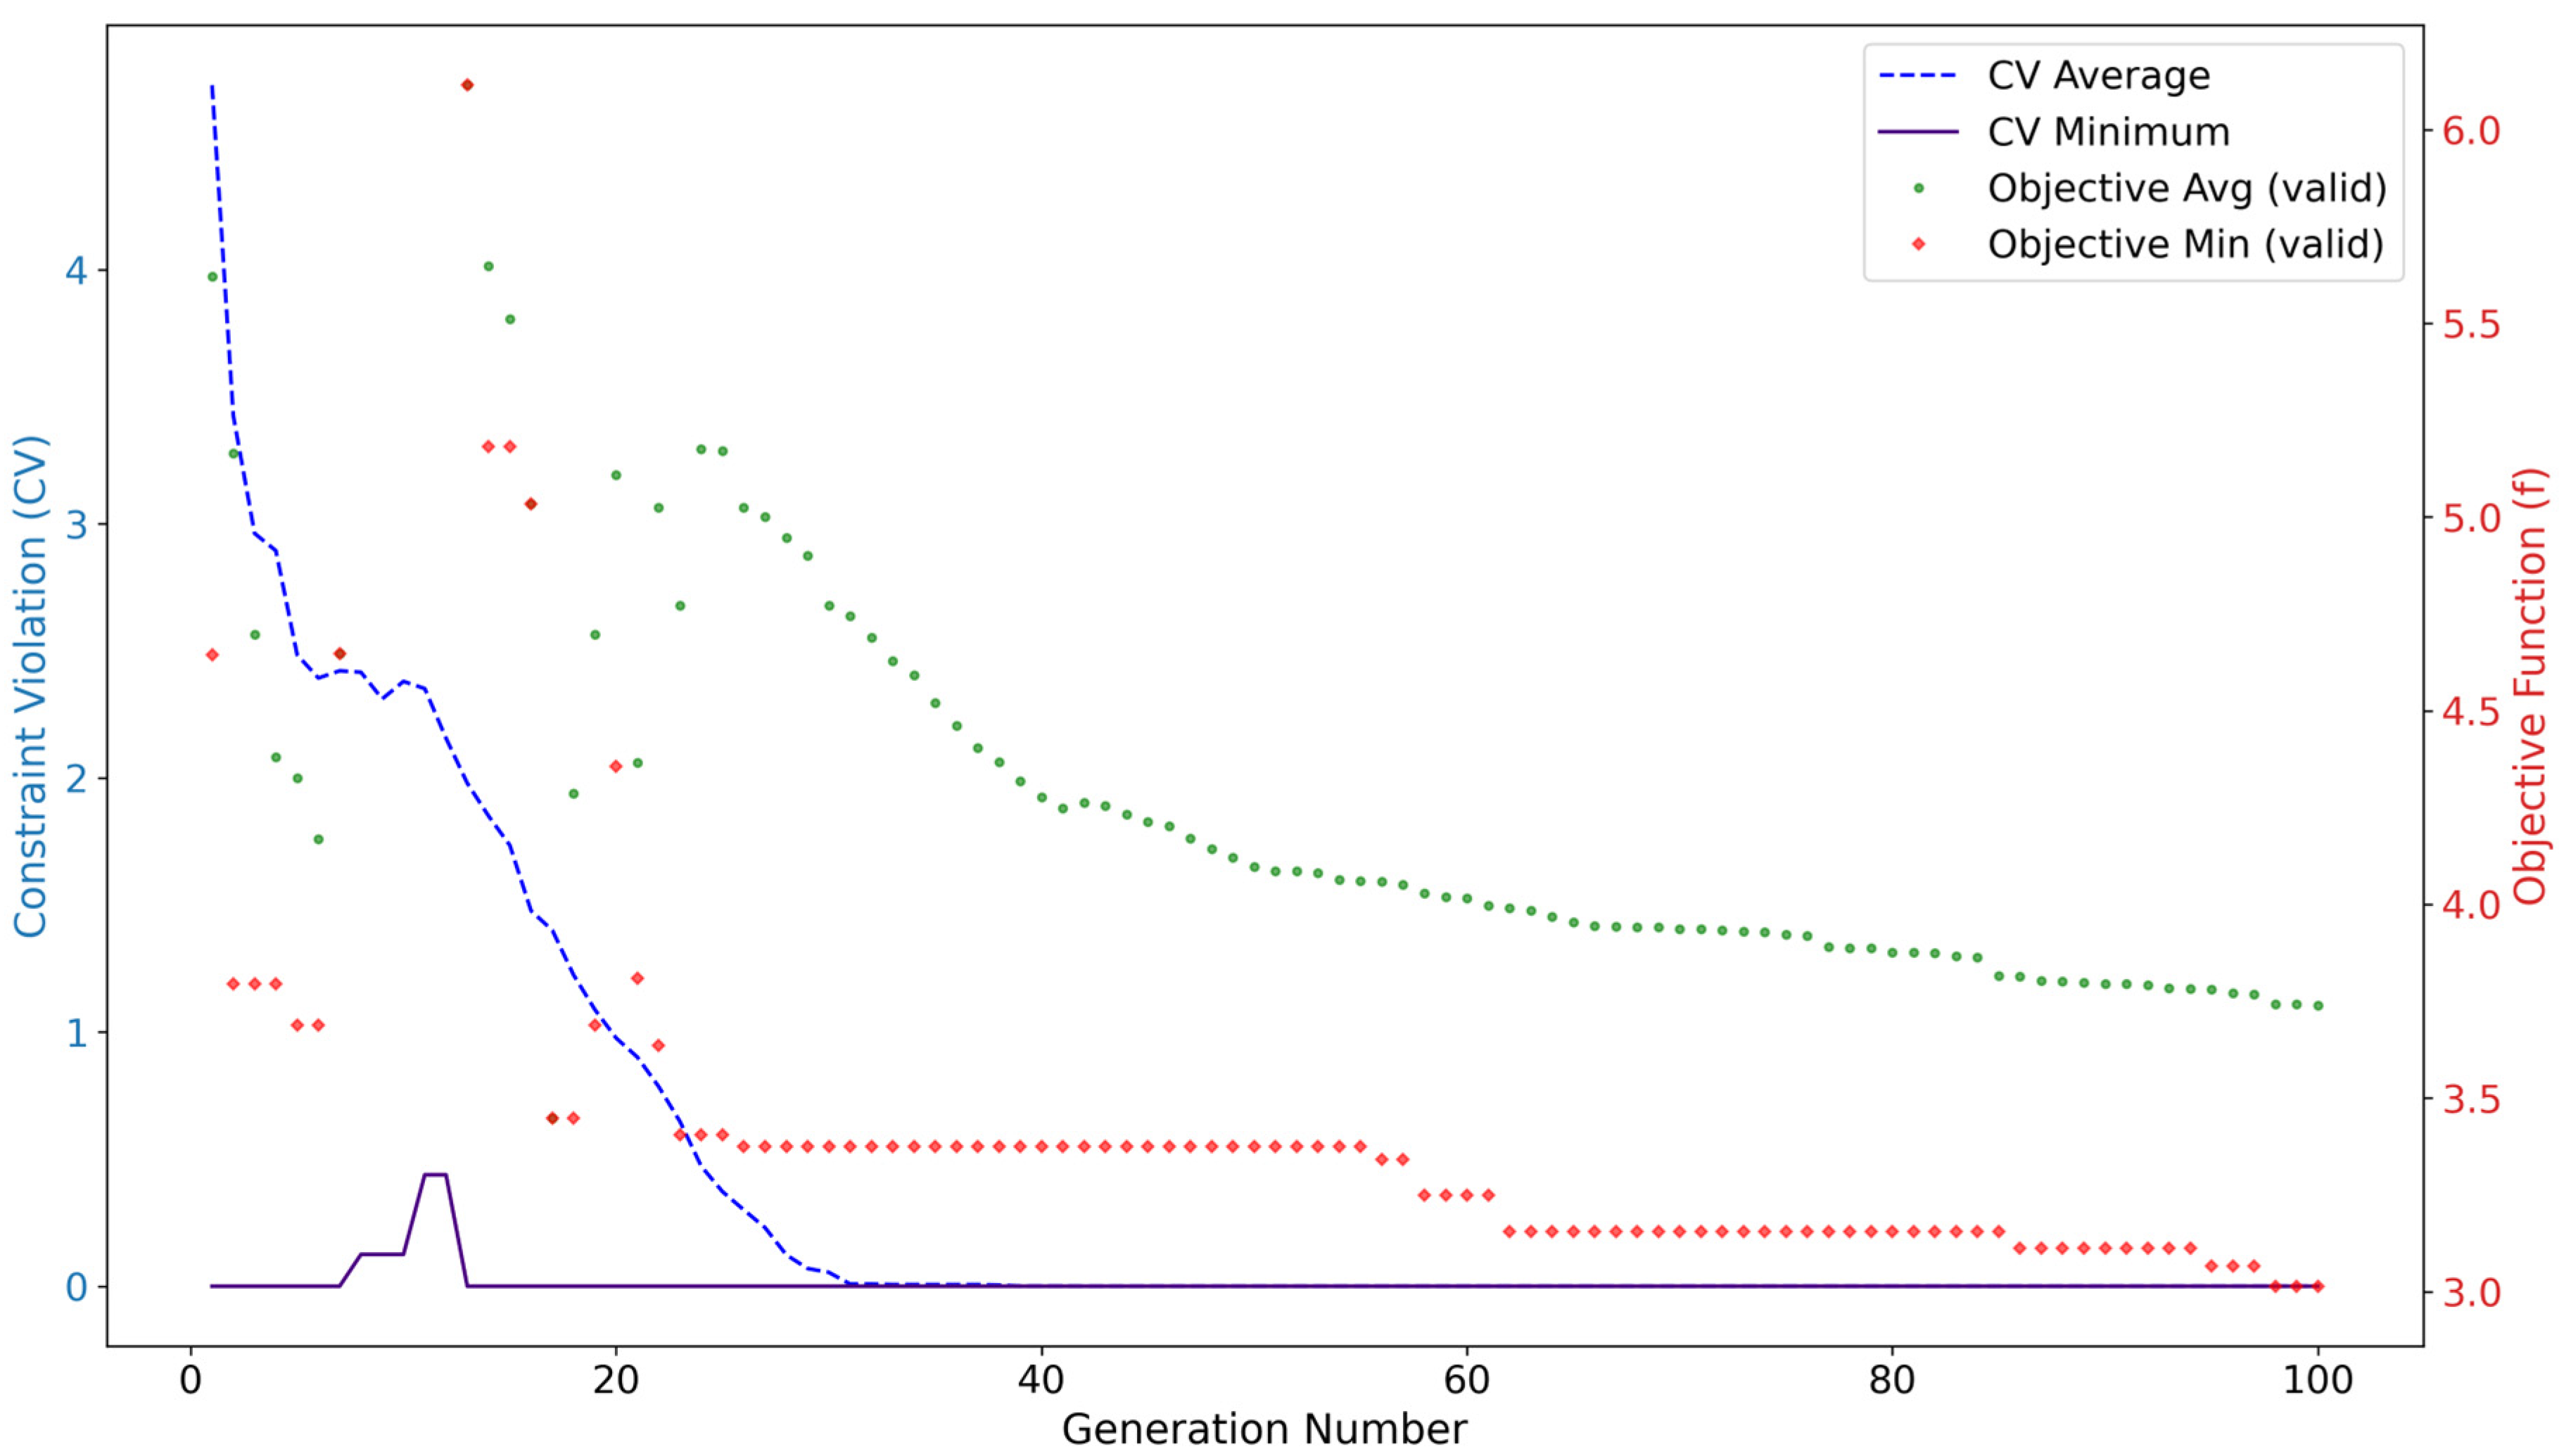
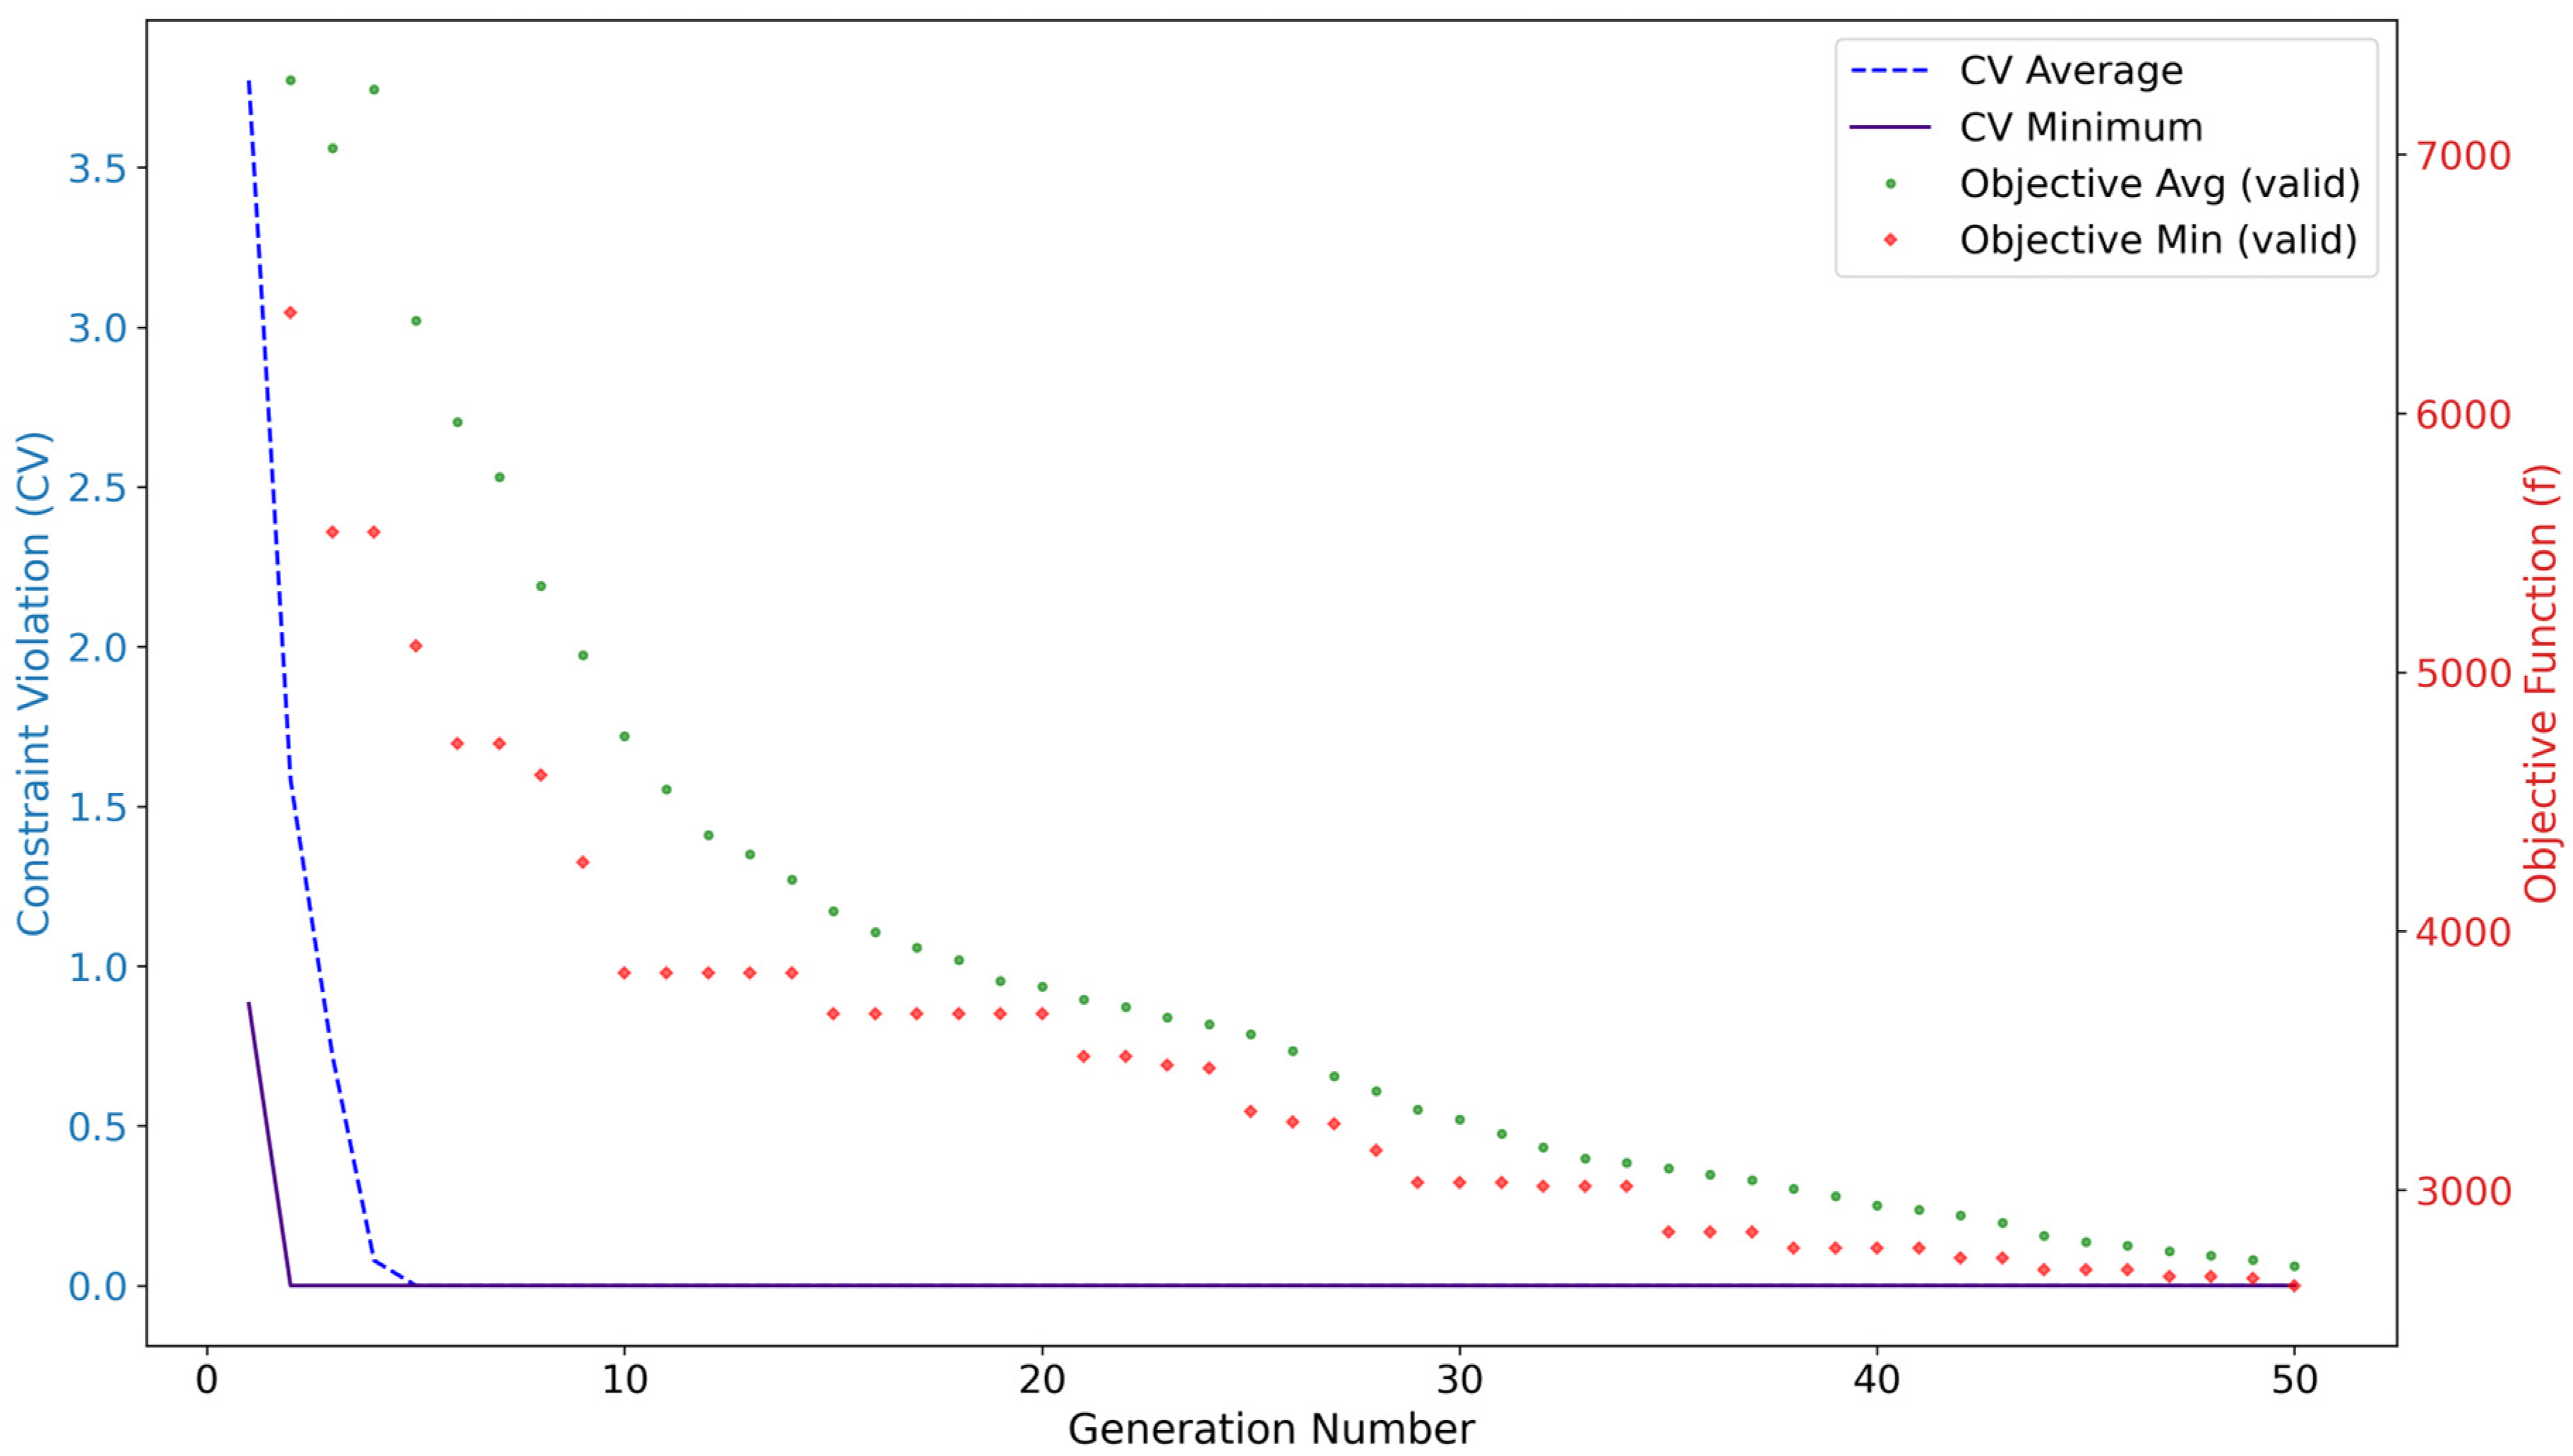
4.2. Results and Analysis

For the results section, the structures are optimized with the constraints and configurations explained in the previous section. Python scripts have been prepared to compute the MCS to provide and verify the reliability of optimized structures. Additionally, results from structural optimizations found in the literature have been used to compare the reliability of these structures with those optimized using RBDO in this study. Table 2 provides a comprehensive comparison of the RBDO results with other RBDO results, along with the comparison of results obtained in this study by RBDO and other studies that used regular optimization methods for the 10-bar truss structure.
It is important to note that the first two studies [8,21] employed real-world discrete cross-sectional areas as design variables, while the last [57] and current study used continuous sectional properties. However, there is a clear difference in reliability between the two methods. The proposed method in this study successfully achieved a better objective function without violating the reliability constraint (3) compared with the [57]. According to the results, there is a 51.1% chance of failure of the optimized structure by [21] while the present study optimized the structure with a probability of failure of less than 0.15%. It also provided a comparable objective result while significantly improving reliability compared to traditional methods. This demonstrates that RBDO can both minimize the mass and enhance safety under uncertain conditions. Figure 8 presents the convergence history of the DE algorithm, which provided a better result compared with the GA for this example, with Adaptive Epsilon Constraint Handling for the best run cycle. This constraint handling technique allows relaxing the constraint, epsilon (ε), using a dynamic threshold value which adapts overtime during the optimization process instead of strictly enforcing constraints. Over time, this ε is adjusted to become stricter, allowing infeasible solutions early on. However, as the epsilon value decreases, only solutions that closely satisfy the constraints are accepted, guiding the algorithm toward a feasible solution space as shown in Figure 8. The workflow took approximately 190 min to finalize 10,000 FORM evaluations along with FEM evaluations in 200 generations which is acceptable by considering the authors previously studied structural optimization methods with the RSA [8,17].
To adapt the proposed method to frame structures, a three-bay, four-story frame structure is optimized on the cross-sectional areas using RBDO. Sectional areas, as mentioned above, consist of discrete and real-world cross-sectional areas. Table 3 presents the comparison of results with open literature and optimized sections, along with other important outcomes.
The results in Table 3 indicate that RBDO provides more reliable structures under uncertainty. Overall, DE with the adaptive epsilon constraint handling method yielded a better objective with a smaller generation population size and required fewer runs compared to the results reported in the literature. Moreover, the proposed methodology achieved a minimum probability of failure equal to 0.102%, which meets typical structural reliability requirements and is considered a safe structure, whereas structural optimization without a reliability constraint led to an extremely high probability of failure (48.4%), indicating that the structure is practically unsafe and that nearly half of all cases would face failure.
RBDO required approximately 400 min to perform 5000 FORM analyses, along with FEM evaluations in 100 generations. As can be seen, this value is more than four times higher compared to the previous example. Since FORM is an iterative method that searches for the most probable point (MPP) of failure, different structures can exhibit different convergence characteristics based on the nonlinearity of the limit state function. Additionally, there are three limit states defined for this example, which significantly increases the FEM calls within the FORM function. Nevertheless, it is an important example of RBDO that highlights the main bottleneck of current applications. Figure 9 provides insights into graphics about the convergence history and optimization process.
To show the adaptability of the proposed method to 3D structures, a 36-bar space truss example is optimized on the cross-sectional areas and bottom node’s z coordinates using RBDO. Sectional areas, as mentioned above, consists of discrete and real-world cross-sectional areas. Table 3 presents the results.
The results in Table 4 found by GA provide important insights about the RBDO applicability in real-world examples and systems, illustrating how the mass gap increases when the computational cost is higher, which is a current problem of the proposed methodology. This issue prevented the authors from performing analyses with larger population and generation sizes to find optimal values for RBDO, as well as from optimizing the original ISCO-2019 problem, because a single FORM evaluation took around 45 min. Hence, creating an RBDO similar to previous examples would require approximately 400 h with the previously specified computer. In addition, the increased FEM calculation time for a considerably more complex problem with 270 design variables and 260 elements contributed to longer runtimes. For instance, one FEM calculation took approximately 0.04 s for the 10-bar and frame structure, while it was 0.97 for the original ISCO-2019 problem.
Nevertheless, it was possible to complete RBDO for the adjusted version of the ISCO-2019 problem in 250 min with 1500 FORM evaluations across 50 generations, creating a safer structure by reducing the probability of failure from 68.5% to 0.102% at the cost of an additional ~1000 kg. Figure 10 offers insights into graphics about the convergence history and optimization process. Moreover, Figure 11 presents both reliability-optimized structures with the corresponding optimized cross-sections after being imported to the RSA automatically for further adjustments via the created methodology.

5. Discussion

The manuscript provides a clear understanding of the application of MAs, reliability analysis, and structural optimization in the context of the BIM environment for reliability-constrained structural design optimization. The proposed methodology for design creation and optimization incorporates VP, and AI-based metaheuristic approaches that allow the process to go from design creation to the assessment of reliability in consideration of the design variable uncertainties, such as material properties and loading conditions. The direct integration of the RBDO into BIM tools allows for interdisciplinary work and makes the proposed workflow suitable for implementing real-world engineering projects. All in all, this integration between the optimization and BIM environments ensures that the data are well-shared and boosts the decision-making processes that occur in the design stage. The results section showed that the proposed framework efficiently optimizes the benchmark problems obtained from the literature for this study.
At the same time, the study revealed certain opportunities to improve the work, one of which is the time required to obtain FE and reliability analysis solutions when working on complex structures. Further research may be devoted to parallel processing or other computational efficiency methods to address this bottleneck. Moreover, if the function optimization uses an AI-driven initial design generation function, one can reduce computation times besides having a good starting structure within which the optimization will be made. Moreover, the geometric configuration of the structure can be created in Dynamo with AI by simply providing the specifications in text form. Further improvements could involve extending the methodology to more complex structures, making it even more suitable for larger problems.
Altogether, the proposed approach is both effective and efficient, since it combines reliability analysis and metaheuristic optimization algorithms supported by AI and advanced BIM tools. The proposed method equips designers with an innovative tool for developing safe, economical, and resilient structures under uncertainty.

Author Contributions

Conceptualization, R.M. and F.Y.; methodology, R.M. and F.Y.; software, F.Y.; validation, F.Y.; formal analysis, F.Y.; investigation, R.M. and F.Y.; resources, R.M.; data curation, F.Y.; writing—original draft preparation, F.Y.; writing—review and editing, R.M.; visualization, F.Y.; supervision, R.M.; project administration, R.M.; funding acquisition, R.M. All authors have read and agreed to the published version of the manuscript.

Funding

This research was made possible by the generous endowment funds provided by GOLDBECK GmbH to establish the Endowed Junior Professorship in Digital Engineering and Construction (DEC) at the Institute of Technology and Management in Construction (TMB) of the Karlsruhe Institute of Technology (KIT). The authors wish to acknowledge the support provided by the KIT Publication Fund of the Karlsruhe Institute of Technology in supplying the APC.

Institutional Review Board Statement

Not applicable.

Informed Consent Statement

Not applicable.

Data Availability Statement

The raw data supporting the conclusions of this article will be made available by the authors upon request.

Conflicts of Interest

The authors declare no conflicts of interest.

References

  1. Beaurepaire, P.; Jensen, H.A.; Schuëller, G.I.; Valdebenito, M.A. Reliability-Based Optimization Using Bridge Importance Sampling. Probabilistic Eng. Mech. 2013, 34, 48–57. [Google Scholar] [CrossRef]
  2. Hadjisophocleous, G.V.; Benichou, N. Performance Criteria Used in Fire Safety Design. Autom. Constr. 1999, 8, 489–501. [Google Scholar] [CrossRef]
  3. Kharmanda, G.; Olhoff, N.; El-Hami, A. Optimum Values of Structural Safety Factors for a Predefined Reliability Level with Extension to Multiple Limit States. Struct. Multidiscip. Optim. 2004, 27, 421–434. [Google Scholar] [CrossRef]
  4. Tomonaga, M. The Atomic Bombings of Hiroshima and Nagasaki: A Summary of the Human Consequences, 1945-2018, and Lessons for Homo Sapiens to End the Nuclear Weapon Age. J. Peace Nucl. Disarm. 2019, 2, 491–517. [Google Scholar] [CrossRef]
  5. Canpolat, N.; Saygılı, S.; Sever, L. Earthquake in Turkey: Disasters and Children Preparing for the Unexpected Supporting the Vulnerable! Turk. Arch. Pediatr. 2023, 58, 119–121. [Google Scholar] [CrossRef]
  6. Scawthorn, C.; Johnson, G.S. Preliminary Report: Kocaeli (Izmit) Earthquake of 17 August 1999. Eng. Struct. 2000, 22, 727–745. [Google Scholar] [CrossRef]
  7. Celorrio, L. Reliability-Based Design Optimization of Structures Combining Genetic Algorithms and Finite Element Reliability Analysis. Adv. Intell. Syst. Comput. 2015, 368, 143–152. [Google Scholar] [CrossRef]
  8. Yavan, F.; Maalek, R.; Toğan, V. Structural Optimization of Trusses in Building Information Modeling (BIM) Projects Using Visual Programming, Evolutionary Algorithms, and Life Cycle Assessment (LCA) Tools. Buildings 2024, 14, 1532. [Google Scholar] [CrossRef]
  9. Jensen, H.; Valdebenito, M.; Sepúlveda, J.; Becerra, L. Discrete Variable Structural Optimization of Systems under Stochastic Earthquake Excitation. In Structural Seismic Design Optimization and Earthquake Engineering: Formulations and Applications; Plevris, V., Mitropoulou, C., Lagaros, N., Eds.; IGI Global: Hershey, PA, USA, 2012; pp. 51–75. [Google Scholar] [CrossRef]
  10. Koch, P.; Kodiyalam, S. Variable Complexity Structural Reliability Analysis for Efficient Reliability-Based Design Optimization. In Proceedings of the 40th Structures, Structural Dynamics, and Materials Conference and Exhibit, St. Louis, MO, USA, 12–15 April 1999; p. 1210. [Google Scholar]
  11. Liu, Y.; Wang, Z.; Lu, H.; Ye, J.; Zhao, Y.; Min Xie, Y. Layout Optimization of Truss Structures with Modular Constraints. Structures 2023, 55, 1460–1469. [Google Scholar] [CrossRef]
  12. Goodarzimehr, V.; Topal, U.; Das, A.K.; Vo-Duy, T. Bonobo Optimizer Algorithm for Optimum Design of Truss Structures with Static Constraints. Structures 2023, 50, 400–417. [Google Scholar] [CrossRef]
  13. Aydın, Z. Size, Layout and Tendon Profile Optimization of Prestressed Steel Trusses Using Jaya Algorithm. Structures 2022, 40, 284–294. [Google Scholar] [CrossRef]
  14. Vasani, A.; Patel, R.; Savsani, V.; Savsani, P. Parametric Analysis of Genetic Algorithm Toolbox for Truss Problem Optimization. In Reliability and Risk Assessment in Engineering; Gupta, V.K., Varde, P.V., Kankar, P.K., Joshi, N., Eds.; Springer: Singapore, 2020; pp. 389–398. [Google Scholar]
  15. Machairas, V.; Tsangrassoulis, A.; Axarli, K. Algorithms for Optimization of Building Design: A Review. Renew. Sustain. Energy Rev. 2014, 31, 101–112. [Google Scholar] [CrossRef]
  16. Chi, H.-L.; Wang, X.; Jiao, Y. BIM-Enabled Structural Design: Impacts and Future Developments in Structural Modelling, Analysis and Optimisation Processes. Arch. Comput. Methods Eng. 2015, 22, 135–151. [Google Scholar] [CrossRef]
  17. Yavan, F.; Maalek, R.; Maalek, S. Enhancing Spatial Truss Designs by Integrating Metaheuristic Optimization Techniques via Visual Programming in BIM-Based Projects. In Redefining the Art of Structural Design, Proceedings of the IASS 2024 Symposium, Zürich, Switzerland, 26–30 August 2024; Block, P., Boller, G., DeWolf, C., Pauli, J., Kaufmann, W., Eds.; International Association for Shell and Spatial Structures (IASS): Madrid, Spain, 2024. [Google Scholar]
  18. Eleftheriadis, S.; Mumovic, D.; Greening, P.; Chronis, A. BIM Enabled Optimisation Framework for Environmentally Responsible and Structurally Efficient Design Systems. In Proceedings of the 32nd International Symposium on Automation and Robotics in Construction and Mining—ISARC 2015, Oulu, Finland, 15–18 June 2015. [Google Scholar] [CrossRef]
  19. Mirra, G.; Pugnale, A. Comparison between Human-Defined and AI-Generated Design Spaces for the Optimisation of Shell Structures. Structures 2021, 34, 2950–2961. [Google Scholar] [CrossRef]
  20. Liu, Z.; Sun, H.; Charkaoui, A.; Hassan, N.M.; Bahroun, Z.; Jiang, J.; Wang, S.; Zhao, L.; Li, W.; Yao, Q.; et al. You May Also like Nonlinear Stress Analysis of Key Joints of Steel Truss Bridge Enhancing Mechanical Properties of Cellular Core Sandwich Panels: A Review of Topological Parameters and Design Improvements Research on Parametric Finite Element Analysis Method of Escalator Truss Truss Optimization Using Genetic Algorithm and FEA. J. Phys. Conf. Ser. 1965, 1, 12134. [Google Scholar] [CrossRef]
  21. Rajeev, S.; Krishnamoorthy, C.S. Discrete Optimization of Structures Using Genetic Algorithms. J. Struct. Eng. 1992, 118, 1233–1250. [Google Scholar] [CrossRef]
  22. Rasheed, K.M. GADO: A Genetic Algorithm for Continuous Design Optimization; Rutgers University, School of Graduate Studies: New Brunswick, NJ, USA, 1998; ISBN 0591759950. [Google Scholar]
  23. Groenwold, A.A.; Stander, N.; Snyman, J.A. A Regional Genetic Algorithm for the Discrete Optimal Design of Truss Structures. Int. J. Numer. Methods Eng. 1999, 44, 749–766. [Google Scholar] [CrossRef]
  24. Toǧan, V.; Daloǧlu, A.T. An Improved Genetic Algorithm with Initial Population Strategy and Self-Adaptive Member Grouping. Comput. Struct. 2008, 86, 1204–1218. [Google Scholar] [CrossRef]
  25. Darko, A.; Chan, A.P.C.; Adabre, M.A.; Edwards, D.J.; Hosseini, M.R.; Ameyaw, E.E. Artificial Intelligence in the AEC Industry: Scientometric Analysis and Visualization of Research Activities. Autom. Constr. 2020, 112, 103081. [Google Scholar] [CrossRef]
  26. Goldberg, D.E. Genetic Algorithms in Search, Optimization and Machine Learning, 1st ed.; Addison-Wesley Longman Publishing Co., Inc.: Boston, MA, USA, 1989; ISBN 0201157675. [Google Scholar]
  27. Talatahari, S.; Gandomi, A.H.; Yang, X.S.; Deb, S. Optimum Design of Frame Structures Using the Eagle Strategy with Differential Evolution. Eng. Struct. 2015, 91, 16–25. [Google Scholar] [CrossRef]
  28. Storn, R.; Price, K. Differential Evolution—A Simple and Efficient Heuristic for Global Optimization over Continuous Spaces. J. Glob. Optim. 1997, 11, 341–359. [Google Scholar] [CrossRef]
  29. Dorigo, M.; Birattari, M.; Stutzle, T. Ant Colony Optimization. IEEE Comput. Intell. Mag. 2006, 1, 28–39. [Google Scholar] [CrossRef]
  30. Dorigo, M.; Di Caro, G. Ant Colony Optimization: A New Meta-Heuristic. CEC 1999, 2, 1470–1477. [Google Scholar] [CrossRef]
  31. Kennedy, J.; Eberhart, R. Particle Swarm Optimization. In Proceedings of the ICNN’95—International Conference on Neural Networks, Perth, Australia, 27 November–1 December 1995; Volume 4, pp. 1942–1948. [Google Scholar] [CrossRef]
  32. Singh, P.; Kottath, R.; Tejani, G.G. Ameliorated Follow The Leader: Algorithm and Application to Truss Design Problem. Structures 2022, 42, 181–204. [Google Scholar] [CrossRef]
  33. Jawad, F.K.J.; Ozturk, C.; Dansheng, W.; Mahmood, M.; Al-Azzawi, O.; Al-Jemely, A. Sizing and Layout Optimization of Truss Structures with Artificial Bee Colony Algorithm. Structures 2021, 30, 546–559. [Google Scholar] [CrossRef]
  34. Alqattan, Z.N.; Abdullah, R. A Hybrid Artificial Bee Colony Algorithm for Numerical Function Optimization. Int. J. Mod. Phys. 2015, 26, 1550109. [Google Scholar] [CrossRef]
  35. Baykasoğlu, A.; Baykasoğlu, C. Weighted Superposition Attraction-Repulsion (WSAR) Algorithm for Truss Optimization with Multiple Frequency Constraints. Structures 2021, 30, 253–264. [Google Scholar] [CrossRef]
  36. Pradhan, C.; Bhende, C.N. Online Load Frequency Control in Wind Integrated Power Systems Using Modified Jaya Optimization. Eng. Appl. Artif. Intell. 2019, 77, 212–228. [Google Scholar] [CrossRef]
  37. Rao, R.V. Jaya: A Simple and New Optimization Algorithm for Solving Constrained and Unconstrained Optimization Problems. Int. J. Ind. Eng. Comput. 2016, 7, 19–34. [Google Scholar] [CrossRef]
  38. Jafari, M.; Salajegheh, E.; Salajegheh, J. Optimal Design of Truss Structures Using a Hybrid Method Based on Particle Swarm Optimizer and Cultural Algorithm. Structures 2021, 32, 391–405. [Google Scholar] [CrossRef]
  39. Liu, J.; Xia, Y. A Hybrid Intelligent Genetic Algorithm for Truss Optimization Based on Deep Neutral Network. Swarm Evol. Comput. 2022, 73, 101120. [Google Scholar] [CrossRef]
  40. Deb, K.; Pratap, A.; Agarwal, S.; Meyarivan, T. A Fast and Elitist Multiobjective Genetic Algorithm: NSGA-II. IEEE Trans. Evol. Comput. 2002, 6, 182–197. [Google Scholar] [CrossRef]
  41. Deb, K.; Jain, H. An Evolutionary Many-Objective Optimization Algorithm Using Reference-Point-Based Nondominated Sorting Approach, Part I: Solving Problems with Box Constraints. IEEE Trans. Evol. Comput. 2014, 18, 577–601. [Google Scholar] [CrossRef]
  42. Zhang, Q.; Li, H. MOEA/D: A Multiobjective Evolutionary Algorithm Based on Decomposition. IEEE Trans. Evol. Comput. 2007, 11, 712–731. [Google Scholar] [CrossRef]
  43. Makkar, P.; Sikka, S.; Malhotra, A. Empirical Evaluation of NSGA II, NSGA III, and MOEA/D Optimization Algorithms on Multi-Objective Target; Springer: Singapore, 2022; pp. 23–31. [Google Scholar] [CrossRef]
  44. Jensen, H.A.; Valdebenito, M.A.; Schuëller, G.I. An Efficient Reliability-Based Optimization Scheme for Uncertain Linear Systems Subject to General Gaussian Excitation. Comput. Methods Appl. Mech. Eng. 2008, 198, 72–87. [Google Scholar] [CrossRef]
  45. Moses, F. Approaches to Structural Reliability and Optimization; University of Waterloo, Department of Civil Engineering: Waterloo, ON, Canada, 1968. [Google Scholar]
  46. Burton, S.; Hajela, P. Reliability-Based Shape Optimization of Truss Structures. In Proceedings of the 19th AIAA Applied Aerodynamics Conference; Fluid Dynamics and Co-located Conferences, Anaheim, CA, USA, 11–14 June 2001; American Institute of Aeronautics and Astronautics: Reston, VA, USA, 2001. [Google Scholar]
  47. Choi, S.-K.; Canfield, R.A.; Grandhi, R.V. Reliability-Based Structural Optimization. In Reliability-Based Structural Design; Springer: London, UK, 2007; pp. 153–202. ISBN 978-1-84628-445-8. [Google Scholar]
  48. Jensen, H.A. Structural Optimization of Linear Dynamical Systems under Stochastic Excitation: A Moving Reliability Database Approach. Comput. Methods Appl. Mech. Eng. 2005, 194, 1757–1778. [Google Scholar] [CrossRef]
  49. Vietor, T. Stochastic Optimization for Mechanical Structures. Math. Methods Oper. Res. 1997, 46, 377–408. [Google Scholar] [CrossRef]
  50. Enevoldsen, I.; Sørensen, J.D. Reliability-Based Optimization in Structural Engineering. Struct. Saf. 1994, 15, 169–196. [Google Scholar] [CrossRef]
  51. Jensen, H.A.; Valdebenito, M.A.; Schuëller, G.I.; Kusanovic, D.S. Reliability-Based Optimization of Stochastic Systems Using Line Search. Comput. Methods Appl. Mech. Eng. 2009, 198, 3915–3924. [Google Scholar] [CrossRef]
  52. Mathakari, S.; Gardoni, P.; Agarwal, P.; Raich, A.; Haukaas, T. Reliability-Based Optimal Design of Electrical Transmission Towers Using Multi-Objective Genetic Algorithms. Comput.-Aided Civ. Infrastruct. Eng. 2007, 22, 282–292. [Google Scholar] [CrossRef]
  53. Thampan, C.K.P.V.; Krishnamoorthy, C.S. System Reliability-Based Configuration Optimization of Trusses. J. Struct. Eng. 2001, 127, 947–956. [Google Scholar] [CrossRef]
  54. Sokołowski, D.; Kamiński, M. Stochastic Reliability-Based Design Optimization Framework for the Steel Plate Girder with Corrugated Web Subjected to Corrosion. Materials 2022, 15, 7170. [Google Scholar] [CrossRef]
  55. Zhang, L.-X.; Meng, X.-J.; Ding, Z.-J.; Han, H.-X. Simulation-Based Reliability Design Optimization Method for Industrial Robot Structural Design. Appl. Sci. 2023, 13, 3776. [Google Scholar] [CrossRef]
  56. De, S.; Maute, K.; Doostan, A. Reliability-Based Topology Optimization Using Stochastic Gradients. Struct. Multidiscip. Optim. 2021, 64, 3089–3108. [Google Scholar] [CrossRef]
  57. Shayanfar, M.; Abbasnia, R.; Khodam, A. Development of a GA-Based Method for Reliability-Based Optimization of Structures with Discrete and Continuous Design Variables Using OpenSees and Tcl. Finite Elem. Anal. Des. 2014, 90, 61–73. [Google Scholar] [CrossRef]
  58. Chun, J. Reliability-Based Design Optimization of Structures Using Complex-Step Approximation with Sensitivity Analysis. Appl. Sci. 2021, 11, 4708. [Google Scholar] [CrossRef]
  59. Der Kiureghian, A. Structural and System Reliability; Cambridge University Press: Cambridge, UK, 2022; ISBN 9781108991889. [Google Scholar]
  60. GitHub—Ugurfeyzullah/Reliability-Constrained-Structural-Design-Optimization-Using-BIM-Based-Tools. Available online: https://github.com/ugurfeyzullah/Reliability-Constrained-Structural-Design-Optimization-Using-BIM-Based-Tools/tree/main (accessed on 12 September 2024).
  61. Chen, J.J.; Duan, B.Y. Structural Optimization by Displaying the Reliability Constraints. Comput. Struct. 1994, 50, 777–783. [Google Scholar] [CrossRef]
  62. JWock82/PyNite: A 3D Structural Engineering Finite Element Library for Python. Available online: https://github.com/JWock82/PyNite (accessed on 18 July 2024).
  63. Blank, J.; Deb, K. Pymoo: Multi-Objective Optimization in Python. IEEE Access 2020, 8, 89497–89509. [Google Scholar] [CrossRef]
  64. Ma, Z.; Wu, G.; Suganthan, P.N.; Song, A.; Luo, Q. Performance Assessment and Exhaustive Listing of 500+ Nature-Inspired Metaheuristic Algorithms. Swarm Evol. Comput. 2023, 77, 101248. [Google Scholar] [CrossRef]
  65. Glover, F.; Sörensen, K. Metaheuristics. Scholarpedia 2015, 10, 6532. [Google Scholar] [CrossRef]
  66. Silberholz, J.; Golden, B.; Smith, R.H.; Gendreau, M.; Potvin, J.-Y. Comparison of Metaheuristics. Int. Ser. Oper. Res. Manag. Sci. 2010, 146, 625–640. [Google Scholar] [CrossRef]
  67. Lagaros, N.D.; Kournoutos, M.; Kallioras, N.A.; Nordas, A.N. Constraint Handling Techniques for Metaheuristics: A State-of-the-Art Review and New Variants. Optim. Eng. 2023, 24, 2251–2298. [Google Scholar] [CrossRef]
  68. Blum, C.; Roli, A. Metaheuristics in Combinatorial Optimization: Overview and Conceptual Comparison. ACM Comput. Surv. 2003, 35, 268–308. [Google Scholar] [CrossRef]
  69. Abdel-Basset, M.; Abdel-Fatah, L.; Sangaiah, A.K. Metaheuristic Algorithms: A Comprehensive Review. In Computational Intelligence for Multimedia Big Data on the Cloud with Engineering Applications; Sangaiah, A.K., Sheng, M., Zhang, Z., Eds.; Intelligent Data-Centric Systems; Academic Press: Cambridge, MA, USA, 2018; pp. 185–231. ISBN 978-0-12-813314-9. [Google Scholar] [CrossRef]
  70. Halim, A.H.; Ismail, I.; Das, S. Performance Assessment of the Metaheuristic Optimization Algorithms: An Exhaustive Review. Artif. Intell. Rev. 2021, 54, 2323–2409. [Google Scholar] [CrossRef]
  71. Sonmez, M. Performance Comparison of Metaheuristic Algorithms for the Optimal Design of Space Trusses. Arab. J. Sci. Eng. 2018, 43, 5265–5281. [Google Scholar] [CrossRef]
  72. Welcome to Pystra’s Documentation!—PySTRA 1.3.0 Documentation. Available online: https://pystra.github.io/pystra/index.html (accessed on 22 July 2024).
  73. AISC Shapes Database V16.0, American Institute of Steel Construction. Available online: https://www.aisc.org/publications/steel-construction-manual-resources/16th-ed-steel-construction-manual/aisc-shapes-database-v16.0/ (accessed on 11 September 2024).
  74. Camp, C.V.; Bichon, B.J. Design of Space Trusses Using Ant Colony Optimization. J. Struct. Eng. 2004, 130, 741–751. [Google Scholar] [CrossRef]
  75. Kazemzadeh Azad, S.; Kazemzadeh Azad, S. A Standard Benchmarking Suite for Structural Optimization Algorithms: ISCSO 2016–2022. Structures 2023, 58, 105409. [Google Scholar] [CrossRef]
  76. Optimization Problem and Winner of ISCSO 2019—Bright Optimizer. Available online: https://www.brightoptimizer.com/problem-iscso2019/ (accessed on 19 December 2024).
  77. American Institute of Steel Construction. Manual of Steel Construction: Load & Resistance Factor Design; American Institute of Steel Construction, Inc.: Chicago, IL, USA, 1994; Volume 2. [Google Scholar]
Figure 2. Integration of VP in structural design using Dynamo: (a) illustration of the Dynamo interface showcasing the VP script used to define the geometrical parameters of a 2D frame structure, including node placement for columns and beams; and (b) the wire model visualization of the parametrically modelled 2D frame structure as generated by the VP script.
Applsci 15 01025 g002
Figure 3. Visual and functional overview of structural analysis software integration with FORM, FEM, and DE algorithms: (a) graphical user interface showing the interactive setup of boundary and material inputs within Dynamo; and (b) excerpt from the Python code highlighting key functions used to process structural analysis data, demonstrating the integration of FEM, FORM, and DE within the framework.
Applsci 15 01025 g003aApplsci 15 01025 g003b
Figure 4. Overview of FORM reliability analysis showing a Python script excerpt illustrating the implementation of Pystra library for FORM analysis.
Applsci 15 01025 g004
Figure 5. Overview of optimization algorithm and data handling for structural design.
Applsci 15 01025 g005
Figure 6. The results section of the software interface showing a detailed list of optimized variables and illustrating the outcome of the optimization algorithm.
Applsci 15 01025 g006
Figure 7. Structures chosen for the results section are as follows: (a) 10-bar truss structure; (b) 2D frame structure; (c) ISCSO 2019 problem; and (d) 3D-36 bar truss structure.
Applsci 15 01025 g007
Figure 8. Convergence history for 10-bar truss.
Applsci 15 01025 g008
Figure 9. Convergence history for frame structure.
Applsci 15 01025 g009
Figure 10. Convergence history for 3D 36-bar truss structure.
Applsci 15 01025 g010
Figure 11. The final version of the structures with corresponding sections: (a) 10-bar truss, (b) 2D frame structure, and (c) 3D 36-bar truss structure.
Applsci 15 01025 g011aApplsci 15 01025 g011b
Table 1. Time required for FEM analyses.
Dynamo Nodes
[8]
RSA API
[34]
Python Library
This Study
Required Time (Min. Approximately)240300.4
Number of FEM Evaluation200200200
Table 2. Comparison of 10-bar truss results.
Structural OptimizationRBDO
[21][8][57]This Study
Objective (kg)2549.222763.062817.402787.55
β M C S −0.0270.293.013.0022
Employed MAGAGAGADE
Population Size202010050
Generation Number2020500100
Separate Runs-10502 × GA, 2 × DE
A1 (cm2)216.128600181.289960221.625363223.489362
A2 (cm2) 10.45159223.1612440.6451600.783208
A3 (cm2)141.935200165.160960191.502843196.122331
A4 (cm2)99.999800128.386840169.515790125.815885
A5 (cm2)10.45159210.3225600.6451600.749852
A6 (cm2)11.61288027.2257520.6451600.679507
A7 (cm2)91.612720115.48364021.52898926.795538
A8 (cm2)128.386840125.161040182.928666189.808710
A9 (cm2)128.386840115.483640168.631921174.270183
A10 (cm2)16.90319222.5160840.6451600.652246
Table 3. Comparison of frame structure results.
Structural OptimizationRBDO
This Study[57]This Study
Objective (m3)2.383.063.014
β 1 M C S , β 2 M C S , β 3 M C S 1.75, 0.17, 0.04 4.65, 3.04, 3.124.11, 3.084, 3.12
Employed MAGAGADE
Population Size5010050
Generation Number100120100
Separate Runs2 × DE, 2 × GA502 × DE, 2 × GA
A1 (cm2)206.45334.19250.32
A2 (cm2) 170.97187.74227.74
A3 (cm2)441.93487.74487.74
A4 (cm2)250.32366.45334.19
A5 (cm2)278.71345.81382.58
A6 (cm2)118.06176.13157.42
Table 4. Comparison of 3D 36-bar truss structure results.
Structural OptimizationRBDO
This StudyThis Study
Objective (kg)1678.392631.06
β M C S −0.483.07
Employed MAGAGA
Population Size3030
Generation Number5050
Separate Runs2 × DE, 2 × GA2 × DE, 2 × GA
A1 (cm2)6.903272.9031
A2 (cm2)35.999917.2903
A3 (cm2)19.48381.6129
A4 (cm2)6.903214.5161
A5 (cm2)19.483810.9677
A6 (cm2)14.516135.2903
A7 (cm2)28.451625.9999
A8 (cm2)20.45162.7935
A9 (cm2)39.41935.1548
A10 (cm2)6.90322.1484
A11 (cm2)14.516135.9999
A12 (cm2)2.06451.6129
A13 (cm2)28.45165.1548
A14 (cm2)3.18712.0645
A15 (cm2)17.161335.2903
A16 (cm2)4.122628.4516
A17 (cm2)17.290328.4516
A18 (cm2)2.06454.1226
A19 (cm2)9.548476.774
A20 (cm2)4.12264.3161
A21 (cm2)27.74199.5484
A22 (cm2)2.793514.5161
A23 (cm2)2.06452.0645
A24 (cm2)5.683917.1613
A25 (cm2)23.741935.9999
A26 (cm2)6.903254.1934
A27 (cm2)3.187135.2903
A28 (cm2)19.483817.1613
A29 (cm2)1.612917.1613
A30 (cm2)4.31611.6129
A31 (cm2)4.31615.1548
A32 (cm2)6.903210.9677
A33 (cm2)25.999919.4838
A34 (cm2)19.483835.2903
A35 (cm2)20.451628.4516
A36 (cm2)20.451625.9999
Z1 (cm)18222.8
Z2 (cm)2361248.4
Disclaimer/Publisher’s Note: The statements, opinions and data contained in all publications are solely those of the individual author(s) and contributor(s) and not of MDPI and/or the editor(s). MDPI and/or the editor(s) disclaim responsibility for any injury to people or property resulting from any ideas, methods, instructions or products referred to in the content.

