1. Introduction
SCADA systems originated during the 1940s to address the growing need for remote monitoring and control of industrial processes. Initially developed for power utilities and manufacturing, these systems used relays and switchgear to automate operations. In the 1960s, with advancements in computing and telecommunications, SCADA systems evolved to include Remote Terminal Units (RTUs), allowing real-time data acquisition and control over long distances [
1]. The introduction of microprocessors in the 1970s enabled SCADA systems to transition from analogue to digital. This era marked the beginning of Programmable Logic Controllers (PLCs) and the development of Distributed Control Systems (DCS), allowing for more sophisticated automation. By the 1980s, SCADA systems were being applied beyond traditional industries, including energy management. This foundational role has only expanded; a 2024 critical review by Gnana Swathika et al. [
2] confirmed that SCADA and PLC systems remain the technological backbone for automating dynamic systems across smart buildings and the energy sector, evolving to meet new demands for cybersecurity and distributed control.
The 1990s witnessed the rise of networked SCADA systems, leveraging the power of Ethernet and the internet to connect geographically dispersed assets [
3]. This enabled remote monitoring and control, improving operational efficiency and reducing downtime. The integration of open communication protocols, such as Modbus and DNP3, fostered interoperability between different SCADA systems and devices. During this period, photovoltaic (PV) energy generation also began to emerge as a cornerstone of the global energy transition [
4], driven by a significant reduction in cost and increasing efficiency of solar cells [
5]. Ensuring the reliability of these evolving technologies requires rigorous verification and optimization of the installed system. For instance, a 2025 review by Fedenko and Dzundza [
6] emphasized that complementing material advancements with active solar tracking systems, using precise, algorithm-driven control of module tilt angles, is critical for maximizing energy yield and enhancing the economic profitability of modern PV installations. As PV applications diversify, monitoring strategies must also adapt to new form factors. For instance, Kavaliauskas et al. [
7] recently investigated an automatic monitoring system specifically for flexible PV modules, demonstrating that real-time data acquisition is crucial for optimizing charge controller efficiency (MPPT vs. PWM) under the unstable solar conditions typical of non-rigid installations. The adoption of PV technology has seen remarkable growth, with Spain standing out as a leader in the energy transition, reaching over 24 GW of photovoltaic capacity by the end of 2023 [
8,
9].
Initial SCADA applications for small-scale PV installations were often rudimentary, with limited fault detection and basic monitoring capabilities [
10]. The advent of the Internet revolutionized these systems, enabling remote web-based monitoring. With solar energy becoming increasingly vital to national grids, the functionality of SCADA systems needed to evolve to visualize both standard parameters and advanced metrics. This need led to the introduction of the IEC 61724-1 standard for PV performance monitoring [
11], which provided consistent metrics for irradiance, temperature, and energy yield that were subsequently adopted by SCADA systems.
In recent years, SCADA systems have fully embraced advancements in cloud computing, big data analytics, and the Internet of Things (IoT) [
12]. Recent advancements have also explored more flexible, low-cost monitoring architectures as alternatives to traditional industrial systems. For example, a recent study by Ferlito et al. [
13] demonstrated the design of an IoT-based SCADA system using an ESP32 microcontroller, which leverages a publish/subscribe model for cost-effective, real-time data acquisition in PV installations. Recent research has also focused on the architectural integration of different control and monitoring platforms to enhance system flexibility. For instance, a study by Aditya and Pratomo [
14] proposed a design that integrates SCADA, PLC, and IoT systems. This integrated approach was shown to optimize overall energy management by enabling intelligent operational modes that switch between PV generation, battery storage, and utility power. Parallel to these developments in PV, the Concentrated Solar Power (CSP) sector is also evolving towards open interoperability. Carballo et al. [
15] recently presented a SCADA system based on the OPC UA standard [
16] and Wi-Fi mesh networks, demonstrating that open-source software protocols can effectively manage distributed field assets like heliostats, offering a flexible alternative to rigid proprietary communication stacks. Further expanding on cloud integration, a 2025 study by Rao et al. [
17] developed a smart monitoring framework that integrates IoT sensors with cloud platforms (e.g., ThingSpeak), facilitating the real-time, remote visualization of PV performance metrics directly on mobile devices.
Alongside the challenges of monitoring large-scale silicon PV installations, the broader field of photovoltaic conversion continues to see rapid innovation in specialized, high-efficiency applications. For instance, recent work by Fafard and Masson [
18] in the niche area of laser power converters has demonstrated vertical multi-junction cells with conversion efficiencies exceeding 61% for power-over-fiber systems.
Cloud-based platforms offer enhanced scalability and cost-effectiveness for managing multiple installations across different locations [
19,
20], while the integration of IoT devices, such as ESP32 microcontrollers, enables low-cost data acquisition and system development [
21]. The field has seen significant advancements, as evidenced by a 2017 study that introduced an innovative fault diagnostic algorithm using characteristic impedance [
22], and the design of a SCADA system using the Siemens S7-1200 PLC, which provides real-time data visualization and logging [
23]. More recent work has also focused on critical operational issues, such as soiling loss estimation and cleaning event detection using SCADA data [
20]. Expanding the scope of diagnostic tools, a 2025 review by Martinez-Gil et al. [
24] analysed advanced maintenance techniques, highlighting the growing role of Unmanned Aerial Vehicles (UAVs) equipped with thermal imaging. Their analysis suggests that combining aerial inspections with artificial intelligence for hotspot and soiling detection offers a complementary layer of physical fault diagnosis alongside electrical monitoring. The convergence of connectivity and analytics has led to the emergence of the Artificial Intelligence of Things (AIoT). As detailed in a comprehensive 2025 review by Boucif et al. [
25], AIoT architecture combine the granular data acquisition of IoT with the decision-making power of AI, enabling advanced functionalities like intelligent fault detection and autonomous control directly at the network edge. Complementing these cost-effective solutions, Alombah et al. [
26] presented the conception and experimental validation of an advanced IoT-based monitoring architecture. Their study demonstrated that low-cost sensor integration coupled with real-time cloud transmission can effectively evaluate PV performance, offering a viable alternative to traditional SCADA for distributed applications. Further emphasizing cost-efficiency, Nkinyam et al. [
27] recently developed a low-cost IoT monitoring device integrating Arduino and GSM modules. Their work highlights the transition from manual, multimeter-based inspections to automated remote supervision, significantly reducing the operational costs associated with frequent technician site visits. Addressing the specific challenges of deployment in resource-limited environments, Rouibah et al. [
28] proposed a smart prototype integrating wireless sensor networks for remote PV monitoring. Their experimental validation demonstrated that IoT-based solutions can overcome the logistical barriers of conventional monitoring in rural areas, ensuring reliable performance assessment even in geographically isolated installations.
A significant branch of modern research has focused on applying machine learning (ML) models directly to SCADA data to automate fault detection. For example, a recent study by Syamsuddin et al. [
29] demonstrated a predictive maintenance framework, successfully using algorithms like Isolation Forest and Autoencoders to analyze historical SCADA data and automatically detect operational anomalies. This data-driven approach complements operator-focused diagnostic frameworks by providing a pathway to automated predictive alerts.
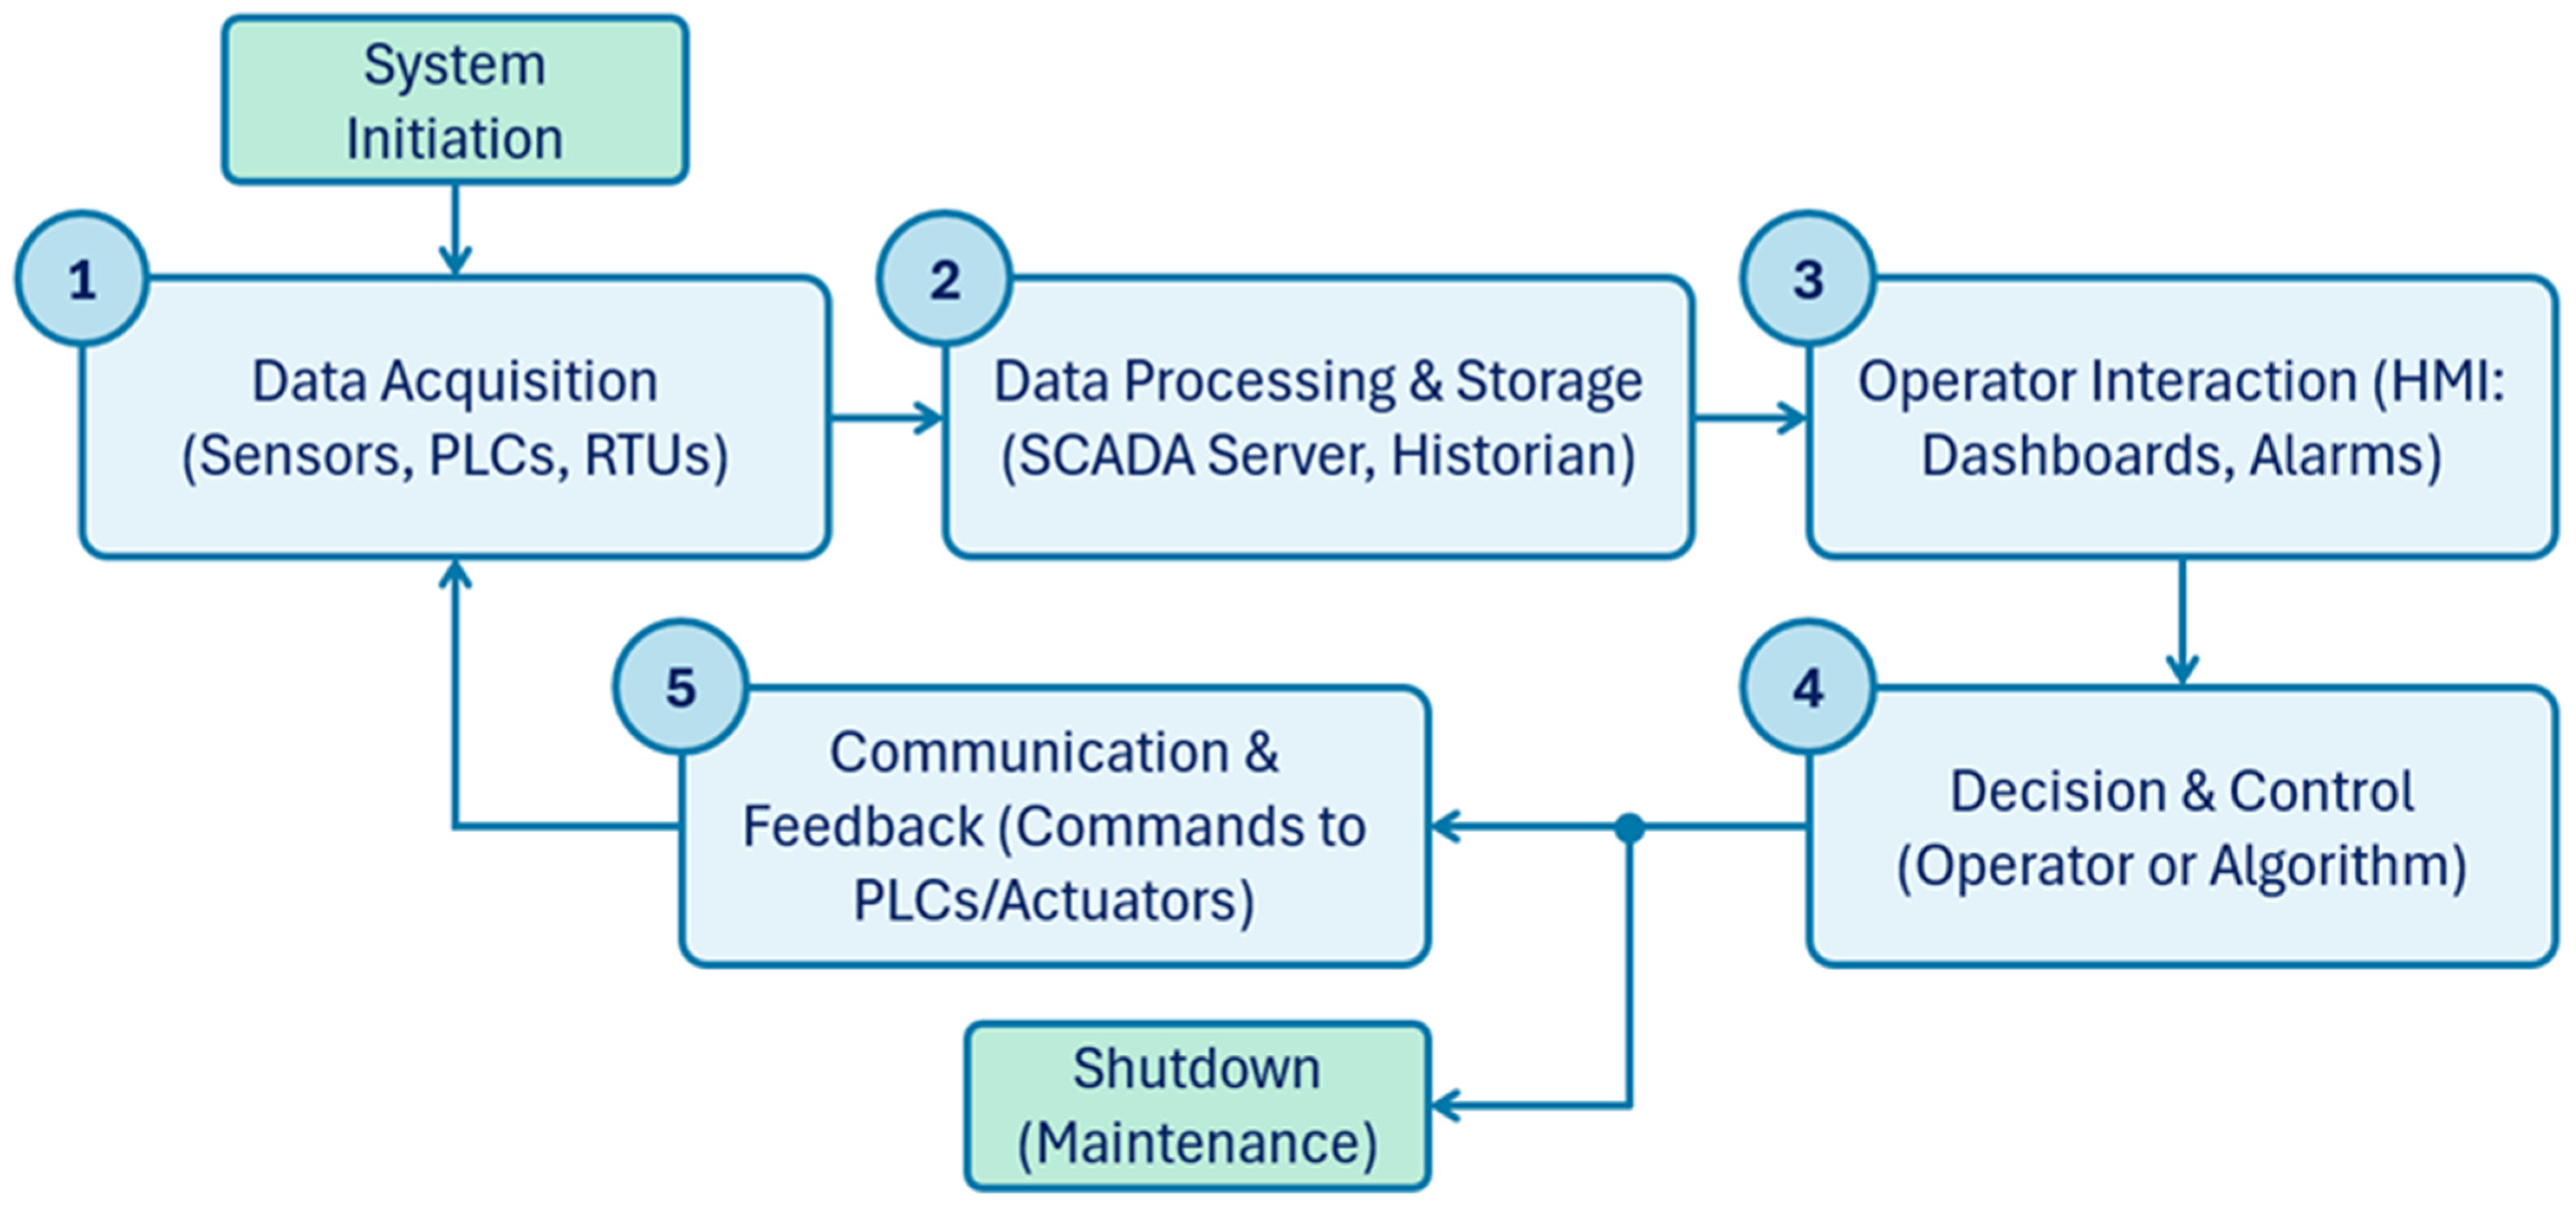
Beyond its definition, the general operation of any modern SCADA system follows a continuous, cyclical process. This loop begins with Data Acquisition, where PLCs and RTUs gather real-time data from field sensors (e.g., irradiance, temperature, power). This data is then transmitted via a Communication Network (e.g., PROFINET, Modbus) to a central server for Data Processing and Storage, where it is contextualized, calculated into KPIs, and logged in a historian database. Next, in the Operator Interaction phase, the processed information is presented on a Human–Machine Interface (HMI) in the form of graphs, alarms, and dashboards. This enables the Decision and Control stage, where an operator (or an automated algorithm) can send commands back to the PLCs to manage the process, completing the Communication and Feedback loop and enabling Continuous Monitoring. This fundamental operational flow, which also includes states for system initiation and maintenance, is illustrated conceptually in
Figure 1.
In the table below, the historical evolution of PV-SCADA is presented to provide a clear, concise overview,
Table 1.
From its electromechanical origins in the 1940s to today’s cloud-native, IoT-powered platforms, PV-SCADA has progressed through waves of telecom integration, digital microprocessor control, energy-management expansion, and Ethernet-based networking; each stage introducing new capabilities (real-time telemetry, automated control loops, standardized KPIs) alongside fresh challenges (cybersecurity, data silos, latency, model drift), as shown in
Table 1. The publication of IEC 61724-1 [
11] brought consistency to PV performance tracking, while cloud and edge architectures enabled scalable analytics and AI-driven fault detection. Modern best practices now center on open, interoperable protocols (IEC 61850 [
35], MQTT/TLS [
36]), hybrid edge–cloud orchestration, zero-trust security, federated machine-learning updates, and secure over-the-air firmware pipelines, offering a clear roadmap for resilient, efficient, and future-proof solar plant monitoring.
These studies often involve the monitoring and analysis of various key parameters related to the PV system’s performance and environmental conditions. The analysis of these parameters provides valuable insights into the performance, efficiency, and reliability of photovoltaic systems, contributing to the advancement of solar energy technology
Table 2. These parameters and requirements are standardized by IEC 61724-1 [
11].
While existing SCADA systems and the standard parameters defined by IEC 61724-1 [
11] are proficient at monitoring generation-centric metrics (e.g., Pout, Eout), they often fail to provide deep insights into the energy flow dynamics of modern self-consumption configurations. As demonstrated in our prior theoretical work [
34], standard metrics are insufficient for accurately assessing performance in rooftop PV systems as they do not properly disaggregate energy flows, failing to distinguish between self-consumed energy and grid-exported energy.
This reveals a distinct research gap: there is a lack of validated, industrial-grade SCADA frameworks that go beyond the IEC 61724-1 standard to implement and leverage these more advanced, disaggregated performance indicators (such as SCR, SSR, and disaggregated PRs) for real-time diagnostics. Although the theory for these parameters exists [
34], their practical, validated implementation and diagnostic superiority in an industrial environment have not been quantitatively demonstrated.
The objective of this work is to address this gap. This work serves as the practical, experimental validation of the new performance parameters proposed theoretically in [
34], demonstrating their implementation and diagnostic utility within a robust industrial SCADA environment. This SCADA system will be developed in accordance with the IEC 61724-1 standard [
11], incorporating the new parameters proposed [
34], such as the Self-Consumption Ratio (SCR), Self-Sufficiency Ratio (SSR), and the disaggregated performance ratios for self-consumption (PR_SC) and grid export (PR_TG). These new metrics offer a more accurate assessment of rooftop PV systems compared to existing parameters that focus solely on load matching and grid usage. By integrating these parameters into the SCADA system, which in this work is implemented using the Siemens SIMATIC platform (S7-1500 PLC and WinCC Unified HMI), it will be possible to perform a complete analysis of a photovoltaic system, including its energy production, self-consumption patterns, and overall performance, enabling operators and researchers to optimize system operation and maximize energy yield.
To achieve this, the research presented in this work is guided by two clear objectives stemming from this gap. The primary scientific goal is to quantitatively validate the diagnostic superiority of these disaggregated parameters, demonstrating through comparative benchmarking that they provide a faster and more accurate assessment of system health than standard metrics alone. The corresponding utilitarian goal is to provide a validated and reproducible industrial-grade framework that translates this theoretical advantage into a tangible tool for operators, enabling them to accelerate fault diagnosis, optimize self-consumption, and make more informed, data-driven decisions on asset management.
2. Materials and Methods
2.1. System Architecture and Platforms
The proposed system is designed for implementation on a programmable logic controller (PLC), specifically the Siemens SIMATIC S7-1500 [
37]. This PLC was selected for its processing power and memory capacity. This allows for complex control algorithms and the management of large datasets. Also, this PLC is facilitating high-speed deterministic communication. The S7-1500’s processing speed, characterized by a 0.3 ns bit performance, ensures rapid response times critical for real-time control. Technical specifications of selected PLC are presented in the
Appendix A.
The digital twin of the PLC was implemented using Siemens PLCSIM Advanced v6.0 [
38]. This simulation software was chosen for its ability to accurately replicate the behavior of the physical PLC, enabling offline testing and development.
Siemens Plant Simulation v2404 was selected to create a simulation of the photovoltaic (PV) system [
39]. This choice was driven by several factors. First, the software’s ability to import and utilize real-world data from the monitoring system of an existing PV installation was crucial for creating an accurate model. Second, and perhaps most importantly, Plant Simulation’s robust PLCSIM Advanced v6.0 interface allowed for seamless integration with the PLC. This feature enabled the simulation of the PV system’s output as a direct input to the PLC, replicating the behavior of the physical system and allowing for thorough testing and validation of the control logic. While Plant Simulation offers advanced 3D modeling capabilities, a 2D representation was deemed sufficient for this specific application.
The SCADA system was designed for deployment on a SIMATIC HMI MTP2200 PRO panel. For simulation purposes, the system can also be run on a standard PC using WinCC Unified Runtime v20, which offers a modern, web-based interface, cross-platform compatibility, and easy integration with other systems. This setup allows for flexible development and testing without the need for physical hardware [
40]. Detailed characteristics of the selected components are presented in the
Appendix A.
The selection of the Siemens TIA Portal v20 ecosystem, including the SIMATIC S7-1500 PLC, WinCC Unified, and associated simulation platforms, was a strategic decision predicated on three core industrial requirements: scalability, adaptability, and security. While alternative IoT or open-source SCADA solutions exist, the integrated nature of this industrial-grade platform provides a cohesive and cost-effective development environment. The engineering efficiency gained by utilizing a single framework for PLC logic, HMI design, and high-fidelity digital twin simulation via PLCSIM Advanced significantly reduces long-term maintenance overhead and ensures component compatibility, a critical factor in cost-effectiveness over the system’s lifecycle. Furthermore, the framework’s architecture is inherently scalable; the logic and HMI developed for the high-performance CPU 1518 can be seamlessly deployed on smaller S7-1500 controllers for residential applications or scaled up for utility-scale plants without fundamental redesign, ensuring broad applicability.
This integrated approach also provides a robust foundation for addressing the critical challenge of cybersecurity in modern energy systems. The proposed framework was designed with a “Security by Design” philosophy, leveraging the native security features of the SIMATIC platform. Communication between the SIMATIC HMI MTP2200 PRO panel and the S7-1500 PLC is encrypted by default, mitigating the risk of data interception or man-in-the-middle attacks. The user and role definitions detailed in
Section 3.3 are not merely an operational feature but a cornerstone of the security concept, enforcing the principle of least privilege to prevent unauthorized system modifications. The WinCC Unified Comfort Pro environment provides comprehensive audit trails and centralized user administration, ensuring that all actions are logged and traceable. While the metrological accuracy of any measurement is ultimately defined by the physical sensors, the industrial-grade nature of this setup ensures exceptionally high data fidelity. The deterministic communication between the S7-1500 PLC and the MTP2200 HMI guarantees that the data, once digitized, is processed and visualized with lossless integrity.
This focus on an integrated, secure, and data-driven platform aligns with contemporary frameworks for effective PV system instrumentation, which emphasize the strategic importance of sensor deployment, data acquisition pipelines, and diagnostic-focused analysis. While such conceptual frameworks effectively outline the high-level requirements for robust fault detection [
41], they often remain agnostic to the specific implementation platform. Our research provides a practical instantiation of these principles, demonstrating how they can be realized within a cohesive industrial ecosystem. The WinCC Unified platform provides the robust and scalable pipeline necessary for the high-resolution data acquisition and management that advanced diagnostics demand. More importantly, it enables the synergistic integration and real-time visualization of our proposed energy-flow indicators (SCR, SSR), which move beyond simple component monitoring to provide a holistic view of the system’s energy autonomy. Therefore, this work serves as a validated case study, demonstrating how the theoretical requirements for effective, fault-focused instrumentation can be successfully implemented within a secure and scalable industrial platform, translating conceptual design into tangible operational intelligence.
This study was validated using data from two distinct, real-world case studies at the University of Jaén, Spain, to demonstrate the framework’s applicability across different system scales. The first, case study 1, is a 2.97 kW residential-scale, single-string installation on building A3, composed of 11 photovoltaic modules (270 Wp each) connected in series. The second, case study 2, is a larger, 58.5 kW commercial-scale system on building C3, comprising 180 modules (325 Wp each) arranged as 9 strings with 20 modules per string.
Figure 2 provides a generalized schematic diagram that is conceptually applicable to the architecture of both systems. It is important to clarify that the 2.97 kW residential-scale system (Case Study 1) was the subject of our prior theoretical work [
34], which established the mathematical definitions for the new performance parameters. This work builds on that work by using this system, along with the new, larger commercial-scale system (Case Study 2), as the real-world platforms for our SCADA implementation and quantitative validation.
The overall metrological accuracy of the monitoring systems is governed by the precision of its field instrumentation, based on manufacturer specifications. The pyranometers is a Secondary Standard compliant with ISO 9060 [
42], with a total hourly uncertainty of ≤3%, while the primary electrical sensors for current, voltage, and power are Class A with a precision of ±2.0%. The subsequent processing and visualization of these measurements within the industrial-grade control and SCADA platform are designed to preserve the integrity of the digitized data. These environmental parameters, specifically in-plane irradiance (Gi) and module temperature (Tmod) as listed in
Table 2, are fundamental inputs. They are not merely monitored but are actively used by the SCADA system to calculate all advanced performance indicators and to provide the context for the weather-based diagnostic analysis presented in this work.
The electrical design of both the residential and commercial-scale systems was optimized to match their respective inverter’s input voltage range, ensuring maximum energy harvest for each application. Utilizing these distinct, real-world installations allows for the evaluation of system behavior under authentic irradiance and temperature conditions, validating a straightforward and replicable monitoring methodology across different scales.
2.2. Data Acquisition and Novel Performance Metrics
The photovoltaic simulation developed in Plant Simulation operates using real-world data obtained from an actual PV installation. These data are transferred to the simulated programmable logic controller (PLC) through PLCSIM Advanced, replicating the behavior and communication of a real PV system. A simplified scheme illustrating the entire data flow from real installation to simulated PLC and HMI is presented in
Figure 3.
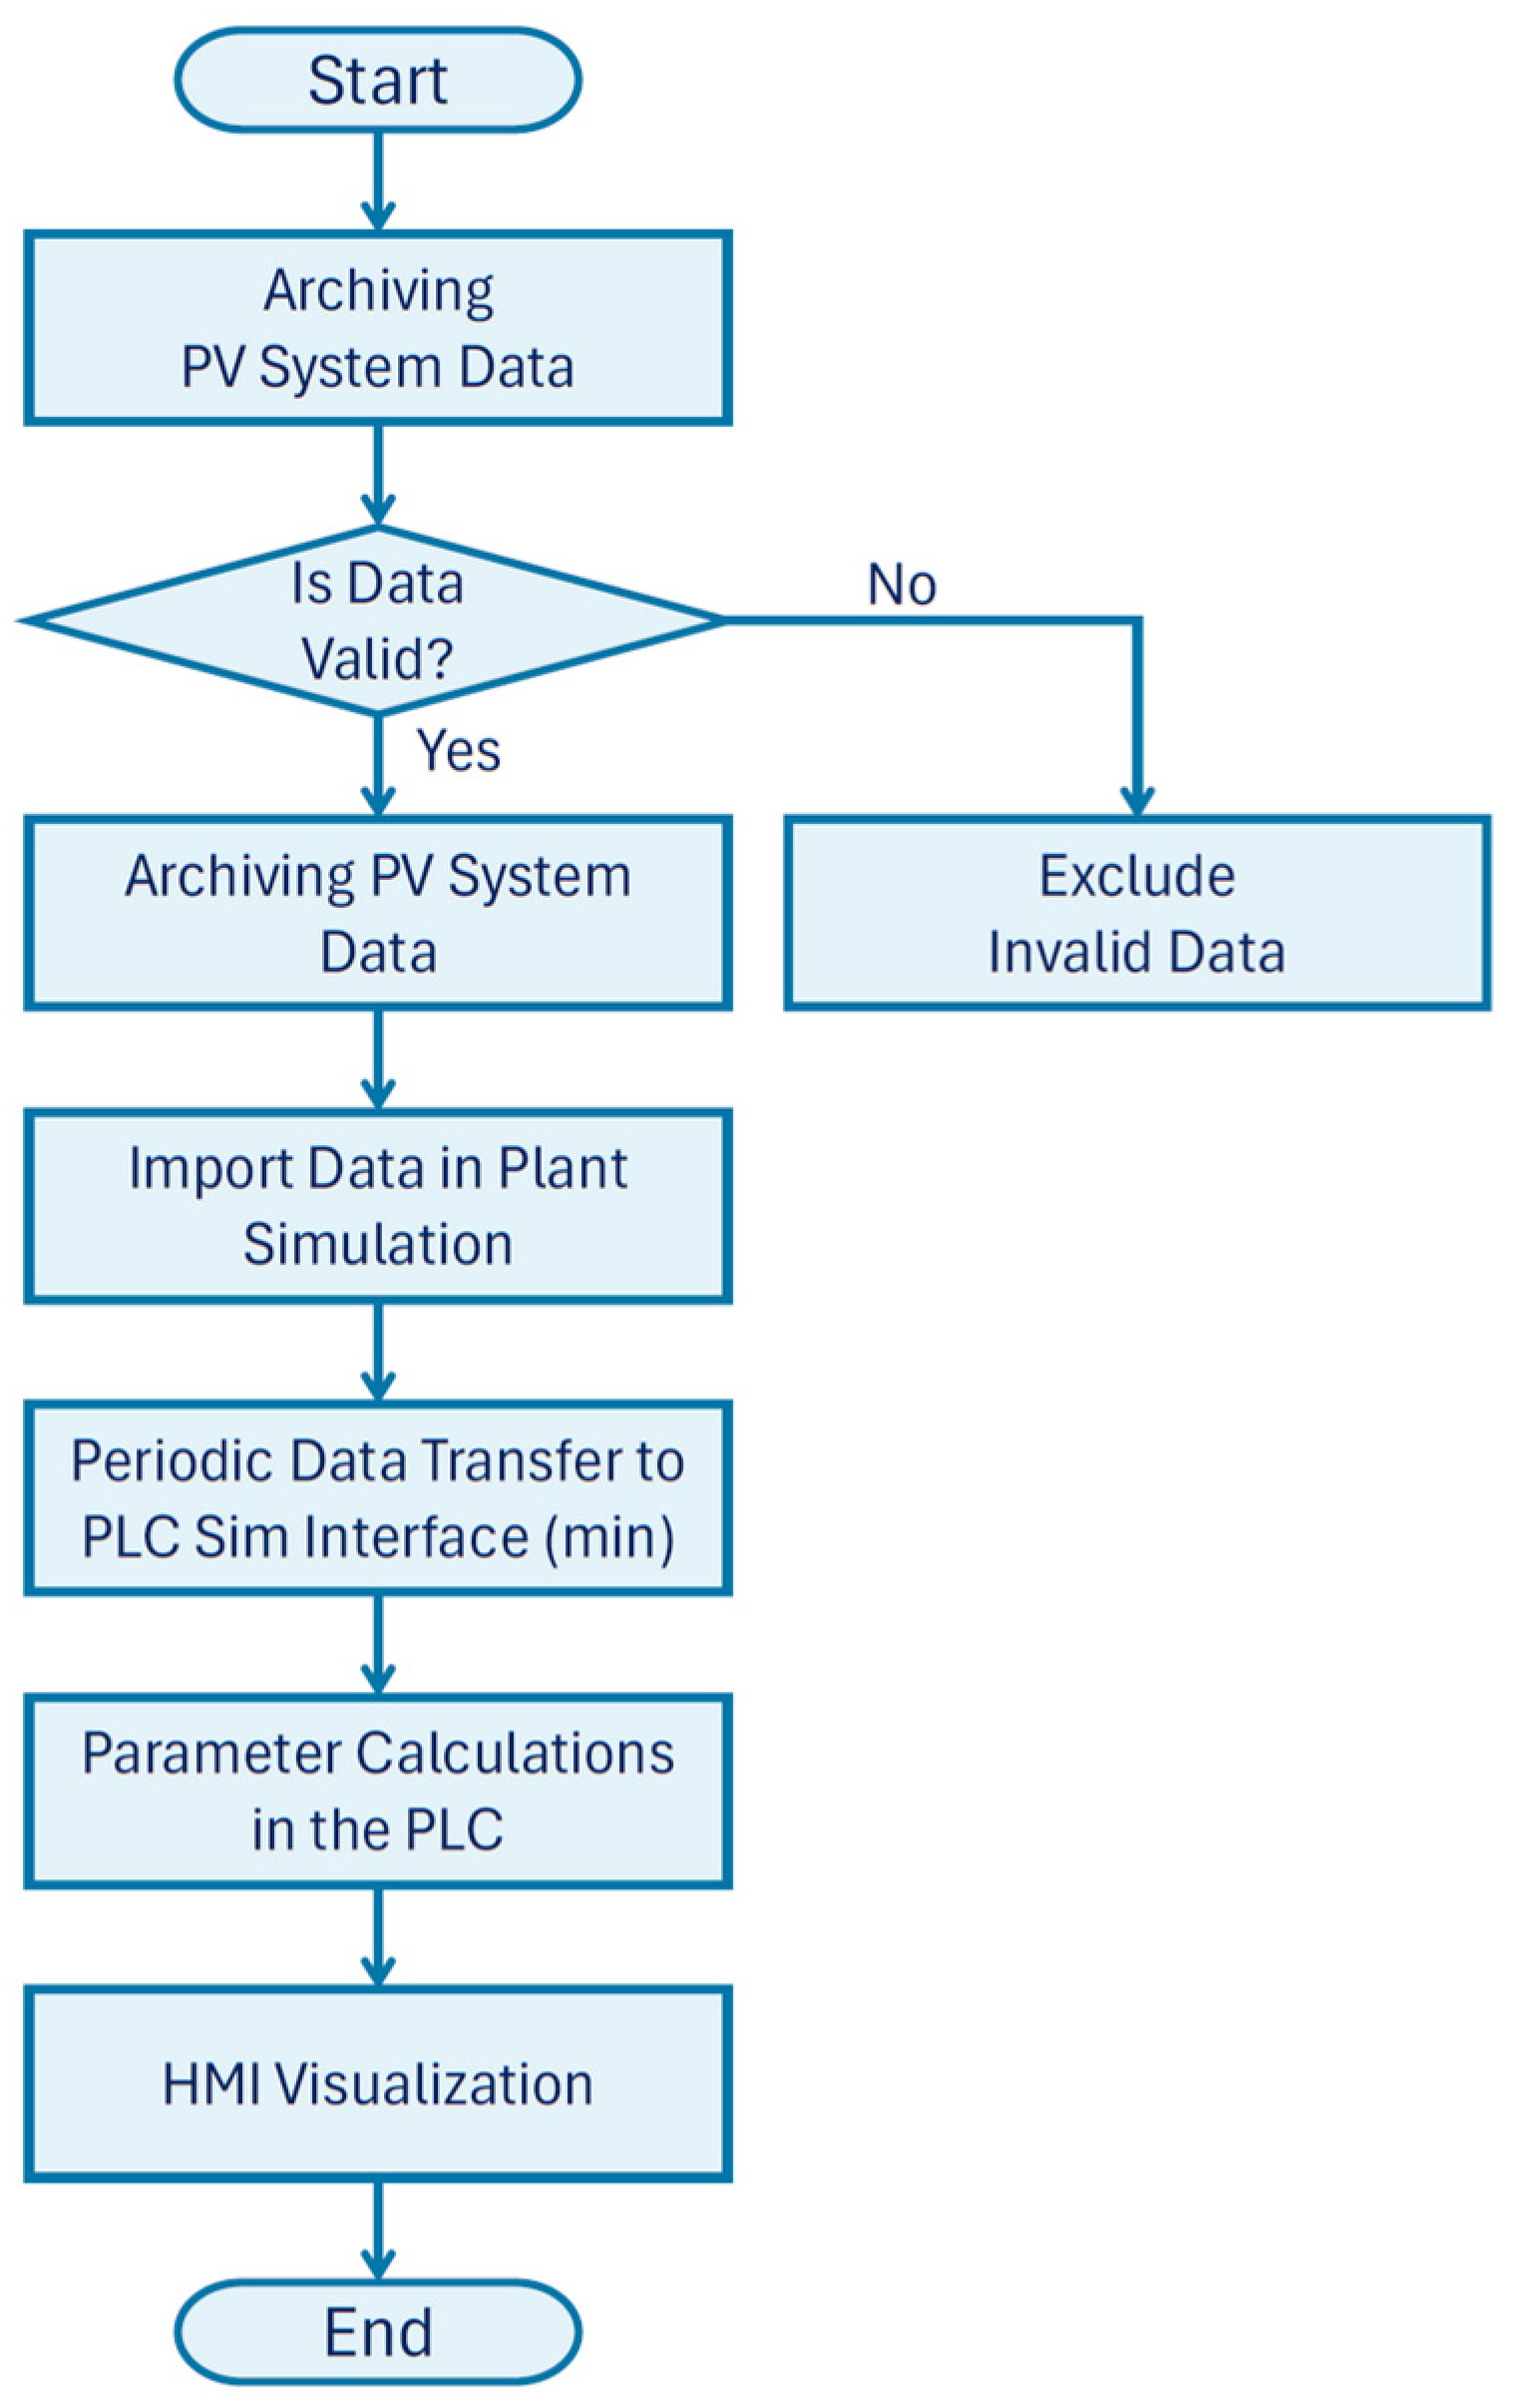
To clarify the simulation methodology used for this work, the following flowchart in
Figure 4 provides a visual representation of the simulation setup, detailing the data pipeline from the real PV installations into the simulated PLC environment.
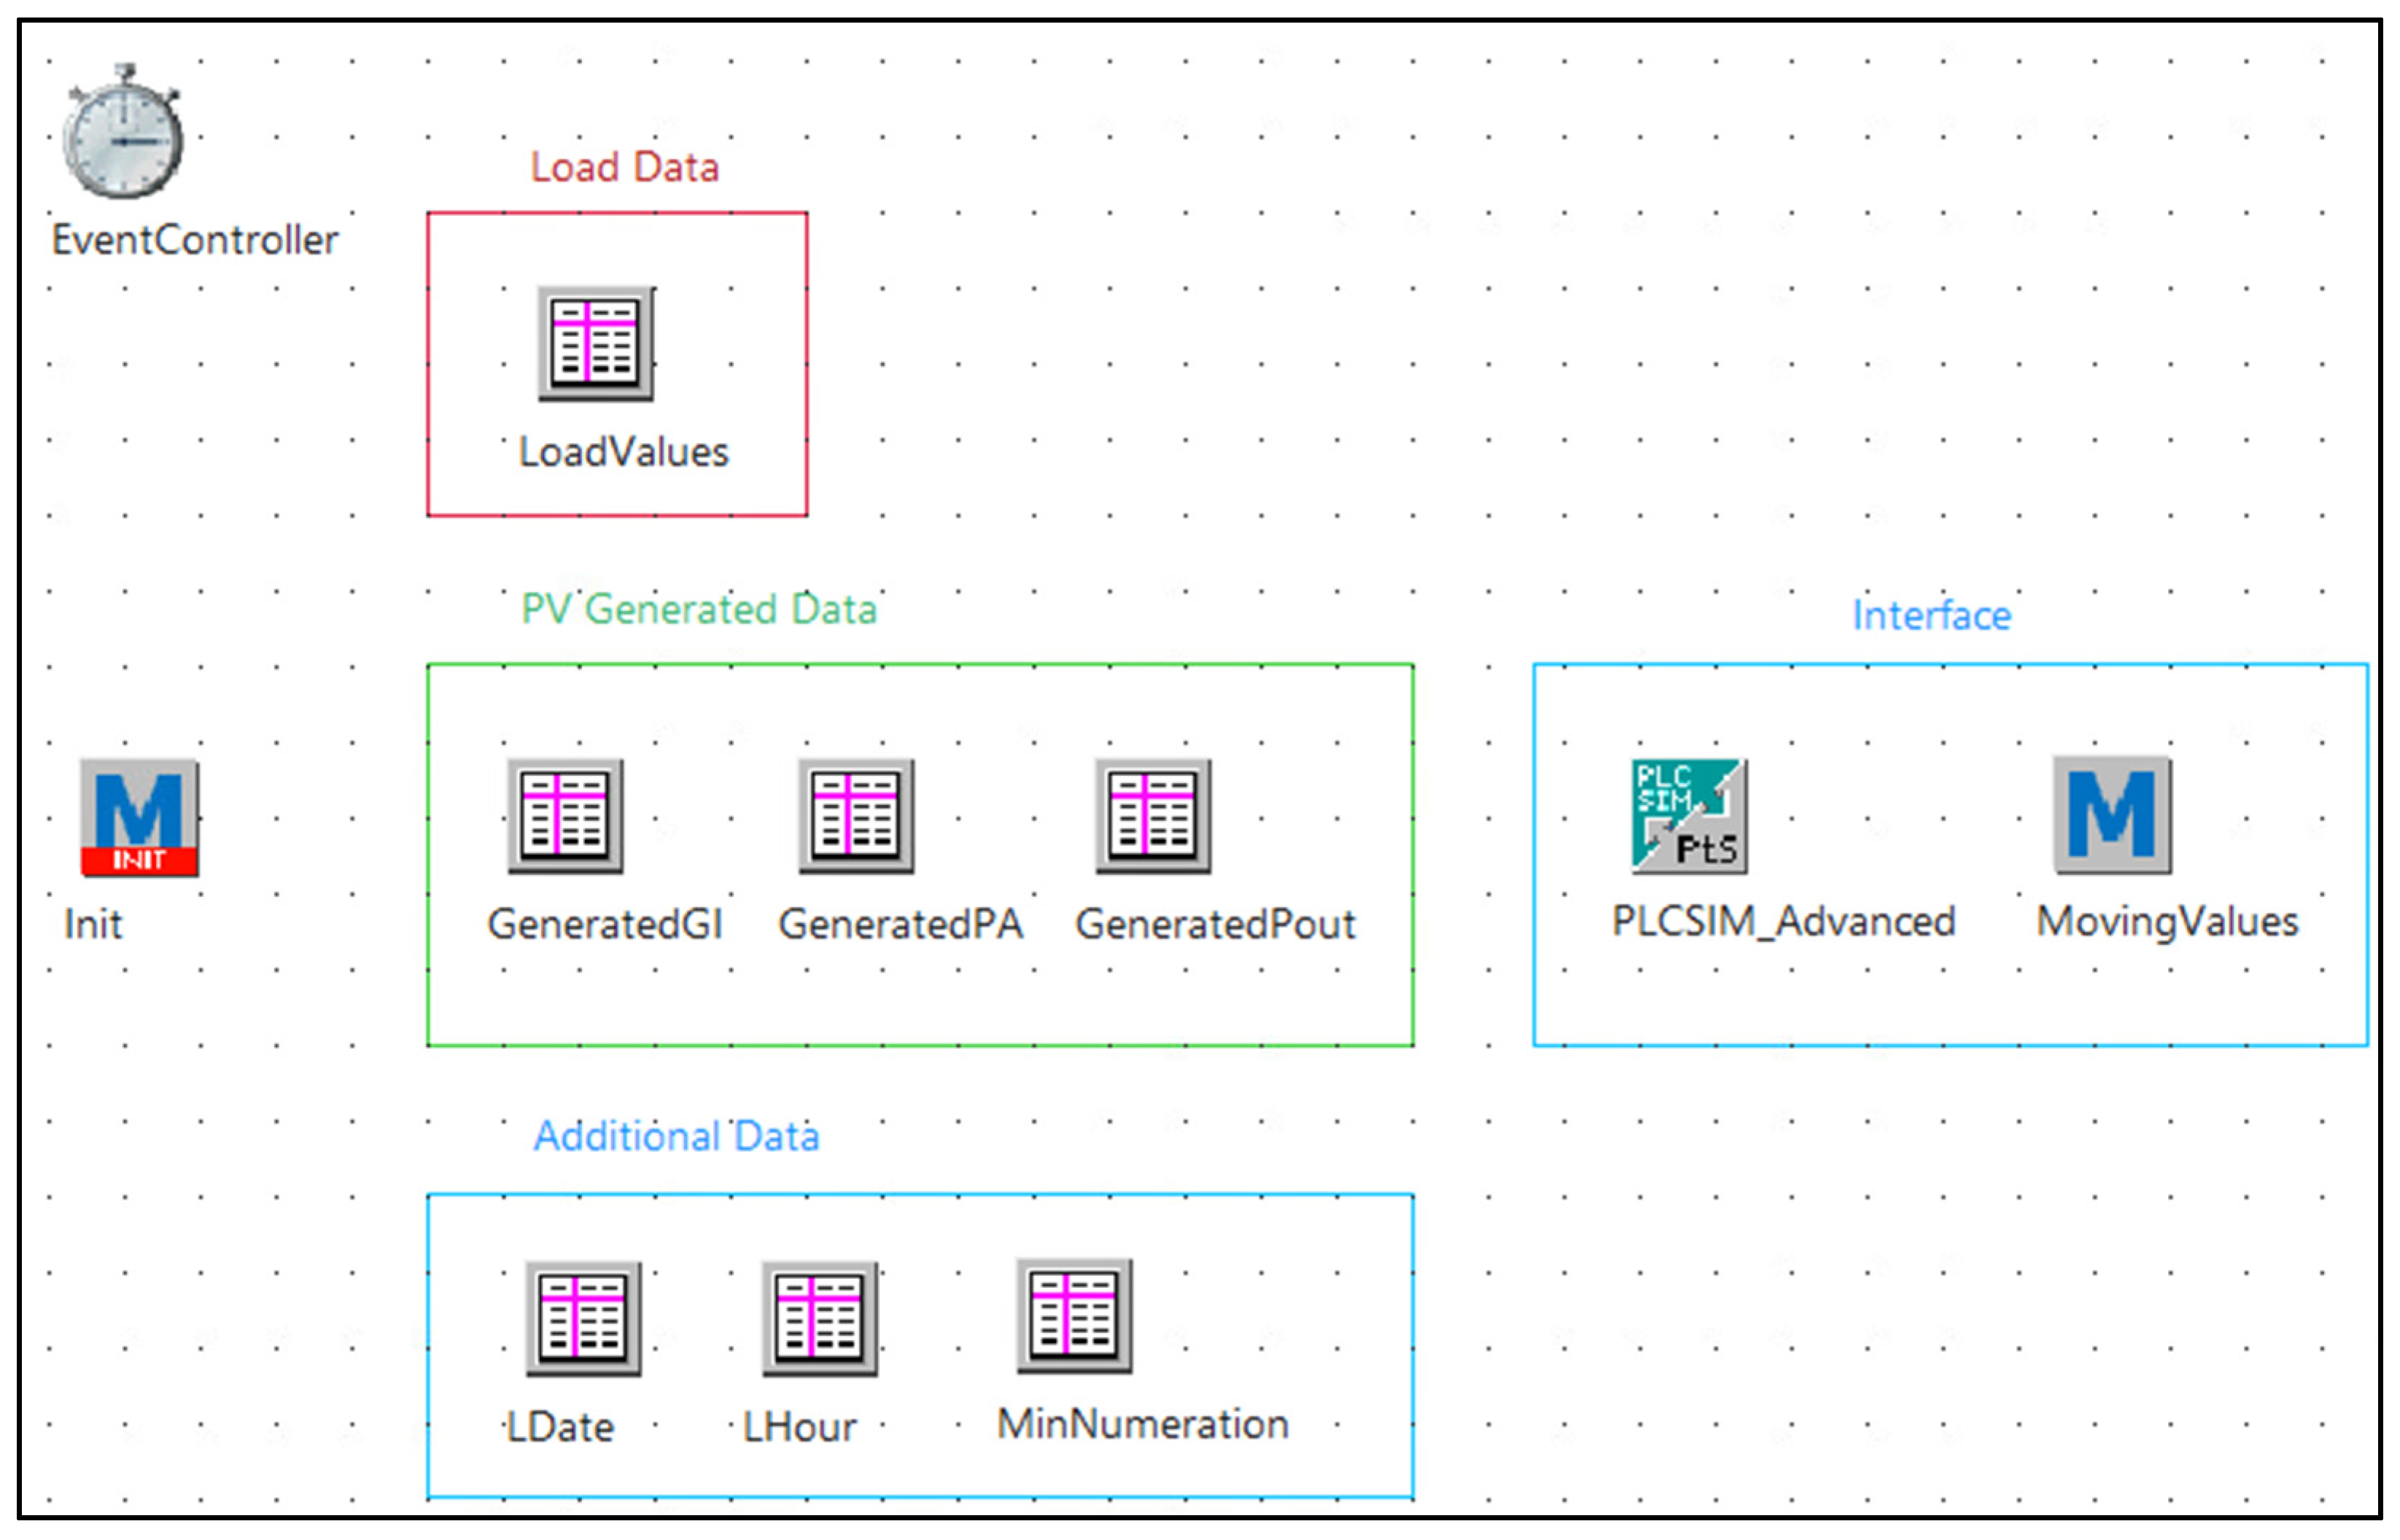
Once the data are received, the control logic implemented within the PLC program processes the inputs, simulating the system’s operational behavior. The calculated outputs are then visualized in real time on the HMI screen or can also be displayed on a standard monitor via WinCC Runtime, effectively reproducing the monitoring environment of a real installation. The developed simulation interface in Plant Simulation is organized in a block structure, as depicted in
Figure 5.
To ensure the simulation accurately reflects real-world behavior, the foundational data streamed into the simulated PLC must be clearly defined. These primary inputs, sourced from the physical installations, are summarized in
Table 3. This dataset includes the key environmental (Gi), generation (PA, Pout), and load (PL) metrics, along with the associated timestamps, which are fed into the PLC at one-minute intervals to drive all subsequent real-time calculations.
Monitoring a rooftop PV station through both the classical metrics defined in IEC 61724-1 [
11], such as array energy yield, final system yield and performance ratio, and the newly introduced self-consumption and to-grid yields, performance ratios and non-self-consumption losses, offers a far more nuanced understanding of system behavior in real time [
34]. By quantifying not only overall energy production and balance-of-system losses, but also explicitly separating the fraction of generated power that is directly consumed on-site versus exported to the grid (and the associated capture and BOS inefficiencies), operators can swiftly detect deviations from expected performance, optimize array sizing, and maximize economic returns,
Table 4. In the formulas given below which involves summation, τk denotes the length of the kth recording interval within a reporting period, τ, which may be daily, monthly or annual. And P0 denotes the installed PV power capacity. These normalized indices also allow meaningful comparisons across installations of different capacities, supporting preventive maintenance and design validation. The new parameters used in this framework, along with a detailed case study, were first defined and presented in our prior theoretical work [
34].
2.3. SCADA Functionalities
The software environments detailed in this section are integral components of the research methodology. The TIA Portal environment was the specific platform used to implement the real-time calculation logic for the novel, disaggregated performance indicators (e.g., SCR, SSR) defined in
Table 4. The WinCC Unified environment was subsequently used to design the high-speed diagnostic HMI. This HMI is not presented as a mere software feature but constitutes the specific experimental variable subjected to quantitative validation in the Mean-Time-to-Detection (MTTD) benchmarking study (
Section 3.2). The following figures, therefore, illustrate the tangible implementation of the research method itself.
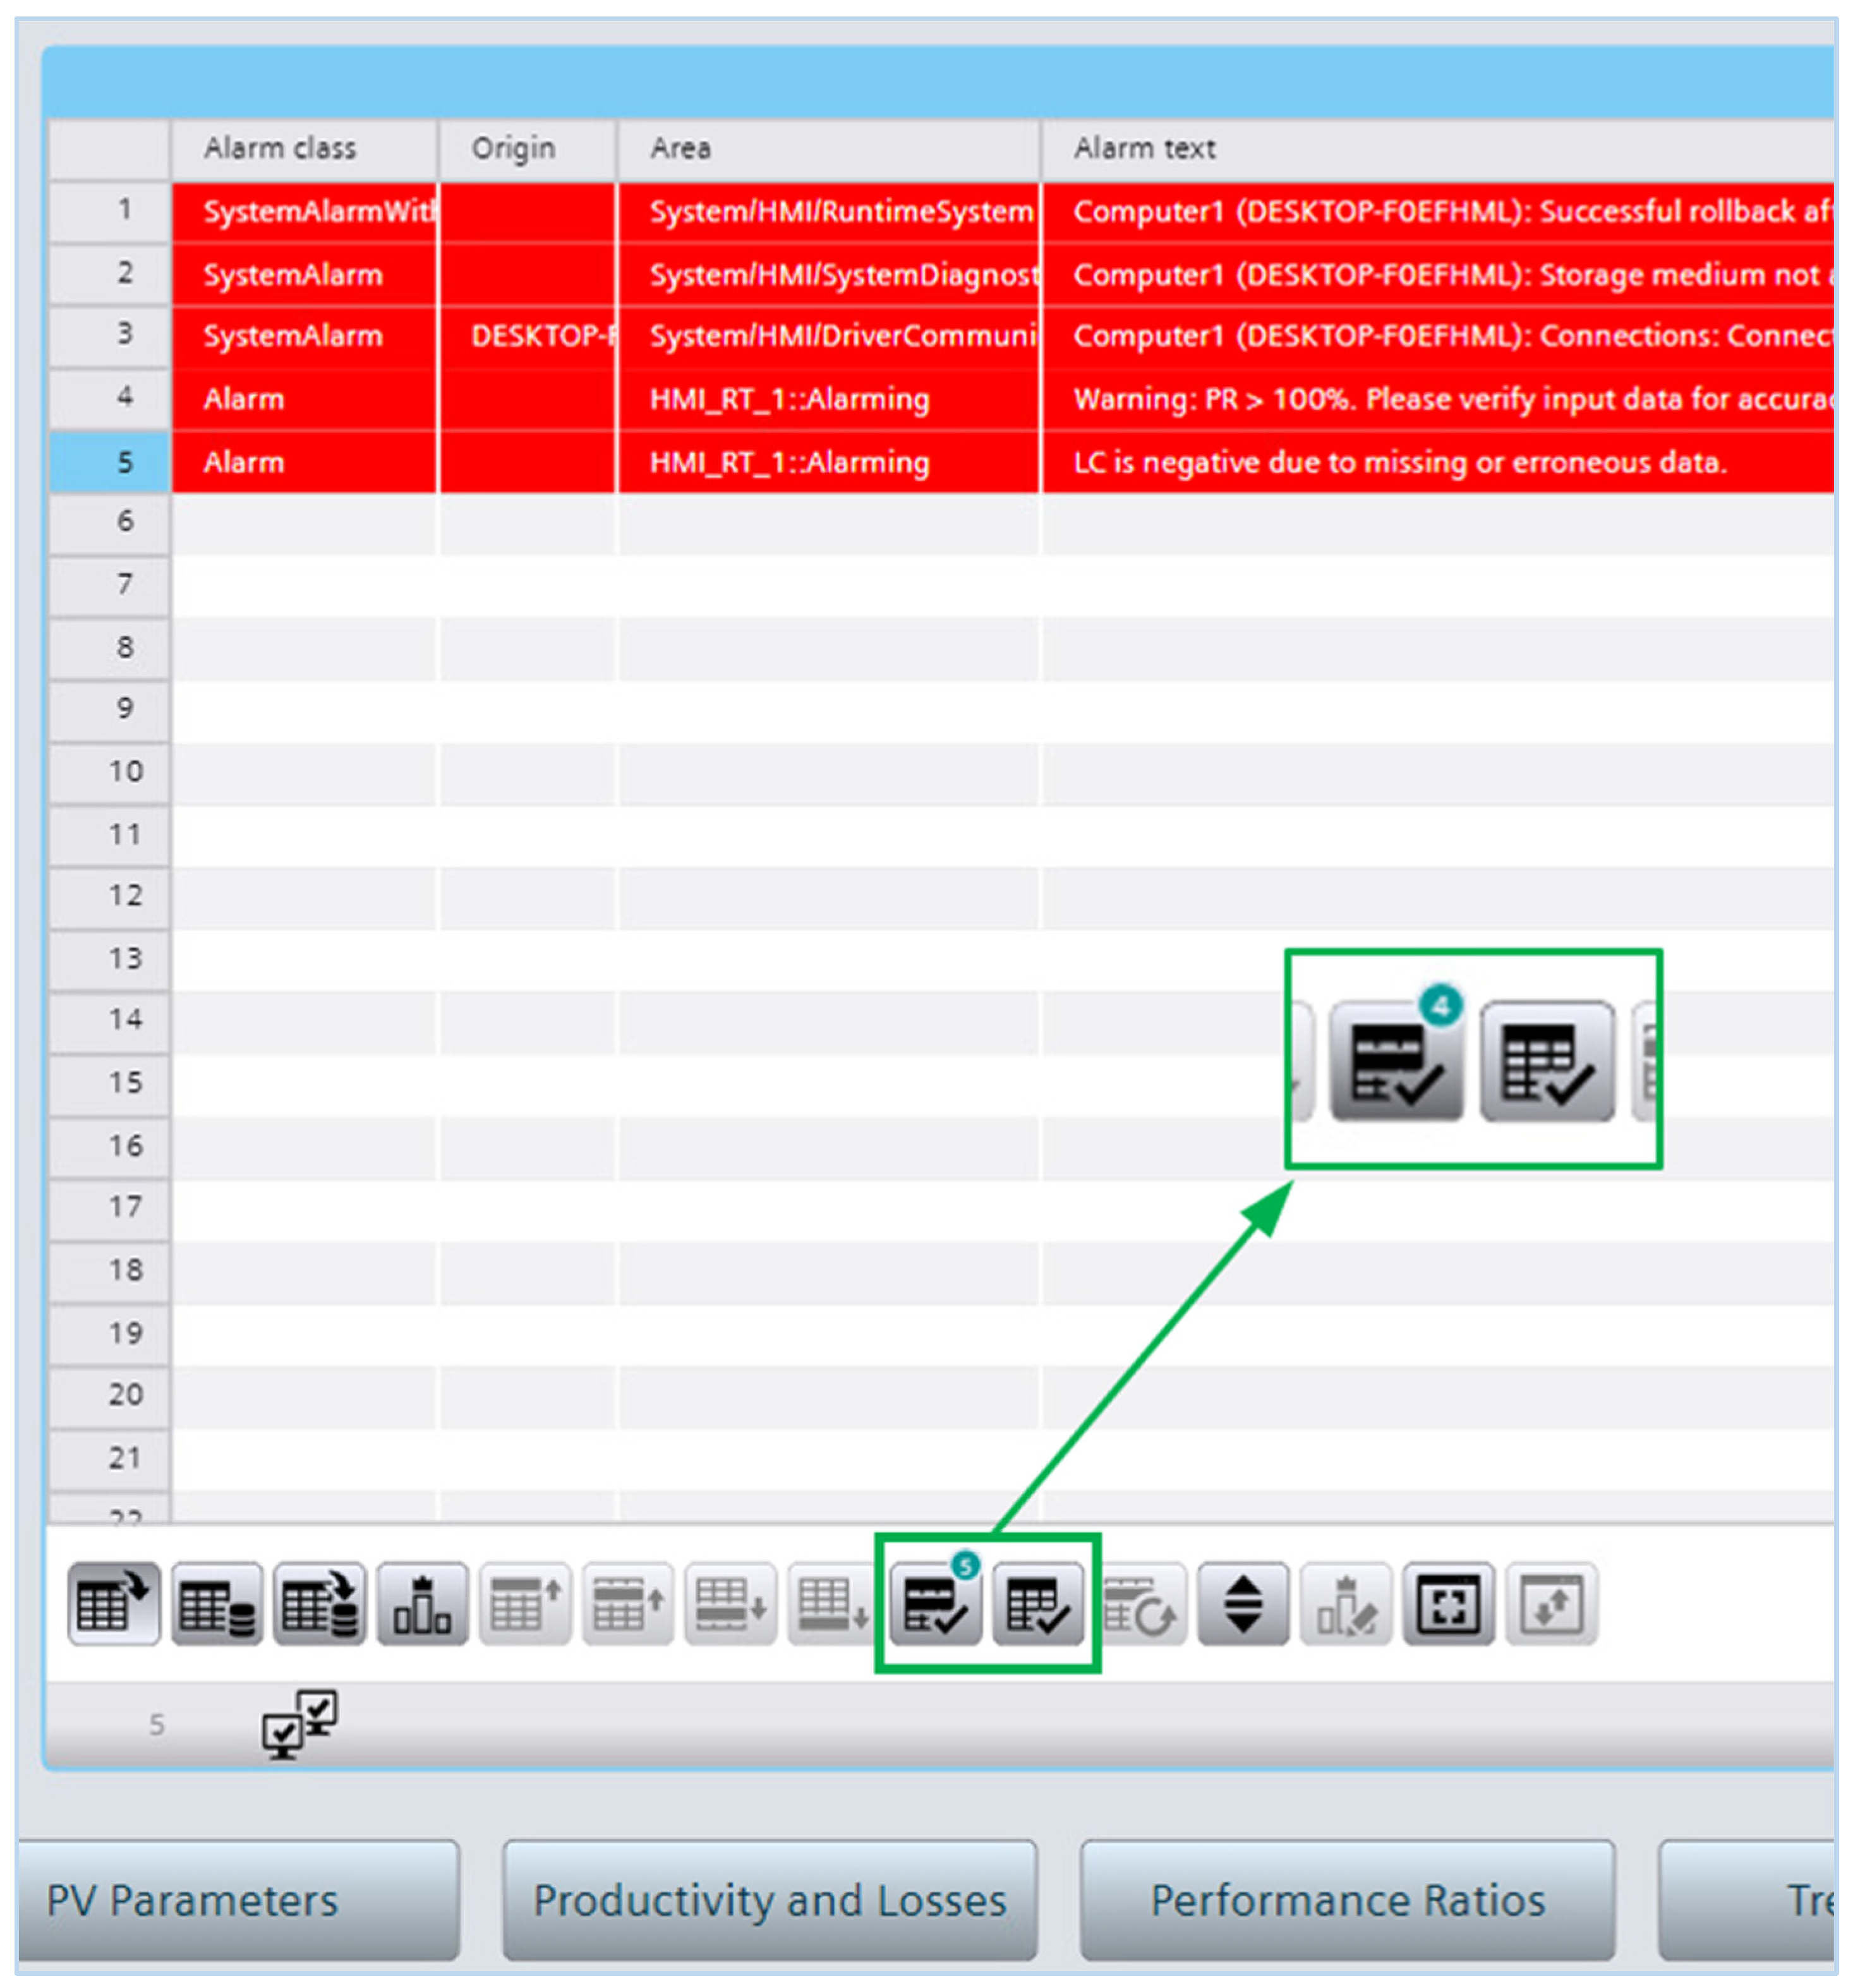
WinCC Unified’s alarm framework delivers a robust, user-centric approach for managing fault conditions in PV installations by combining prioritized, class-based alerts with flexible acknowledgement,
Figure 6, and tailored HMI workflows. Alarms are categorized into informational messages, warnings, and critical faults—each assigned a priority level so that urgent events (e.g., inverter over temperature or string voltage excursions) are prominently displayed. When triggered, alarms appear in a centralized, timestamped list on the HMI, complete with metadata (object path, process value, origin) and can be acknowledged individually or in bulk. Acknowledgement actions not only clear on-screen indicators but also record user ID, time, and optional comments to support traceability and post-event analysis.
Role-based filtering enables different user groups—such as shift supervisors, maintenance engineers, and grid-compliance officers—to view only relevant alarms, ensuring that, for instance, maintenance staff focus on module temperature or junction-box anomalies while compliance officers monitor grid-export limits. WinCC Unified also supports context-sensitive pop-ups and soft-key confirmations on touch HMIs, allowing technicians to review alarm details, confirm corrective actions, and seamlessly return to main dashboards. For advanced PV configurations like bifacial arrays or trackers, custom alarm logic can detect deviations from predictive irradiance or alignment models, automatically opening trend charts (e.g., irradiance versus module temperature) to aid diagnostics. Built-in escalation rules can forward unacknowledged critical alarms via email or push notifications through OPC UA or REST APIs, preventing off-hours oversight. Finally, strict role-based permissions ensure that only authorized personnel can clear high-risk alarms (e.g., arc-fault detections), supporting both operational safety and regulatory compliance across diverse PV plant deployments.
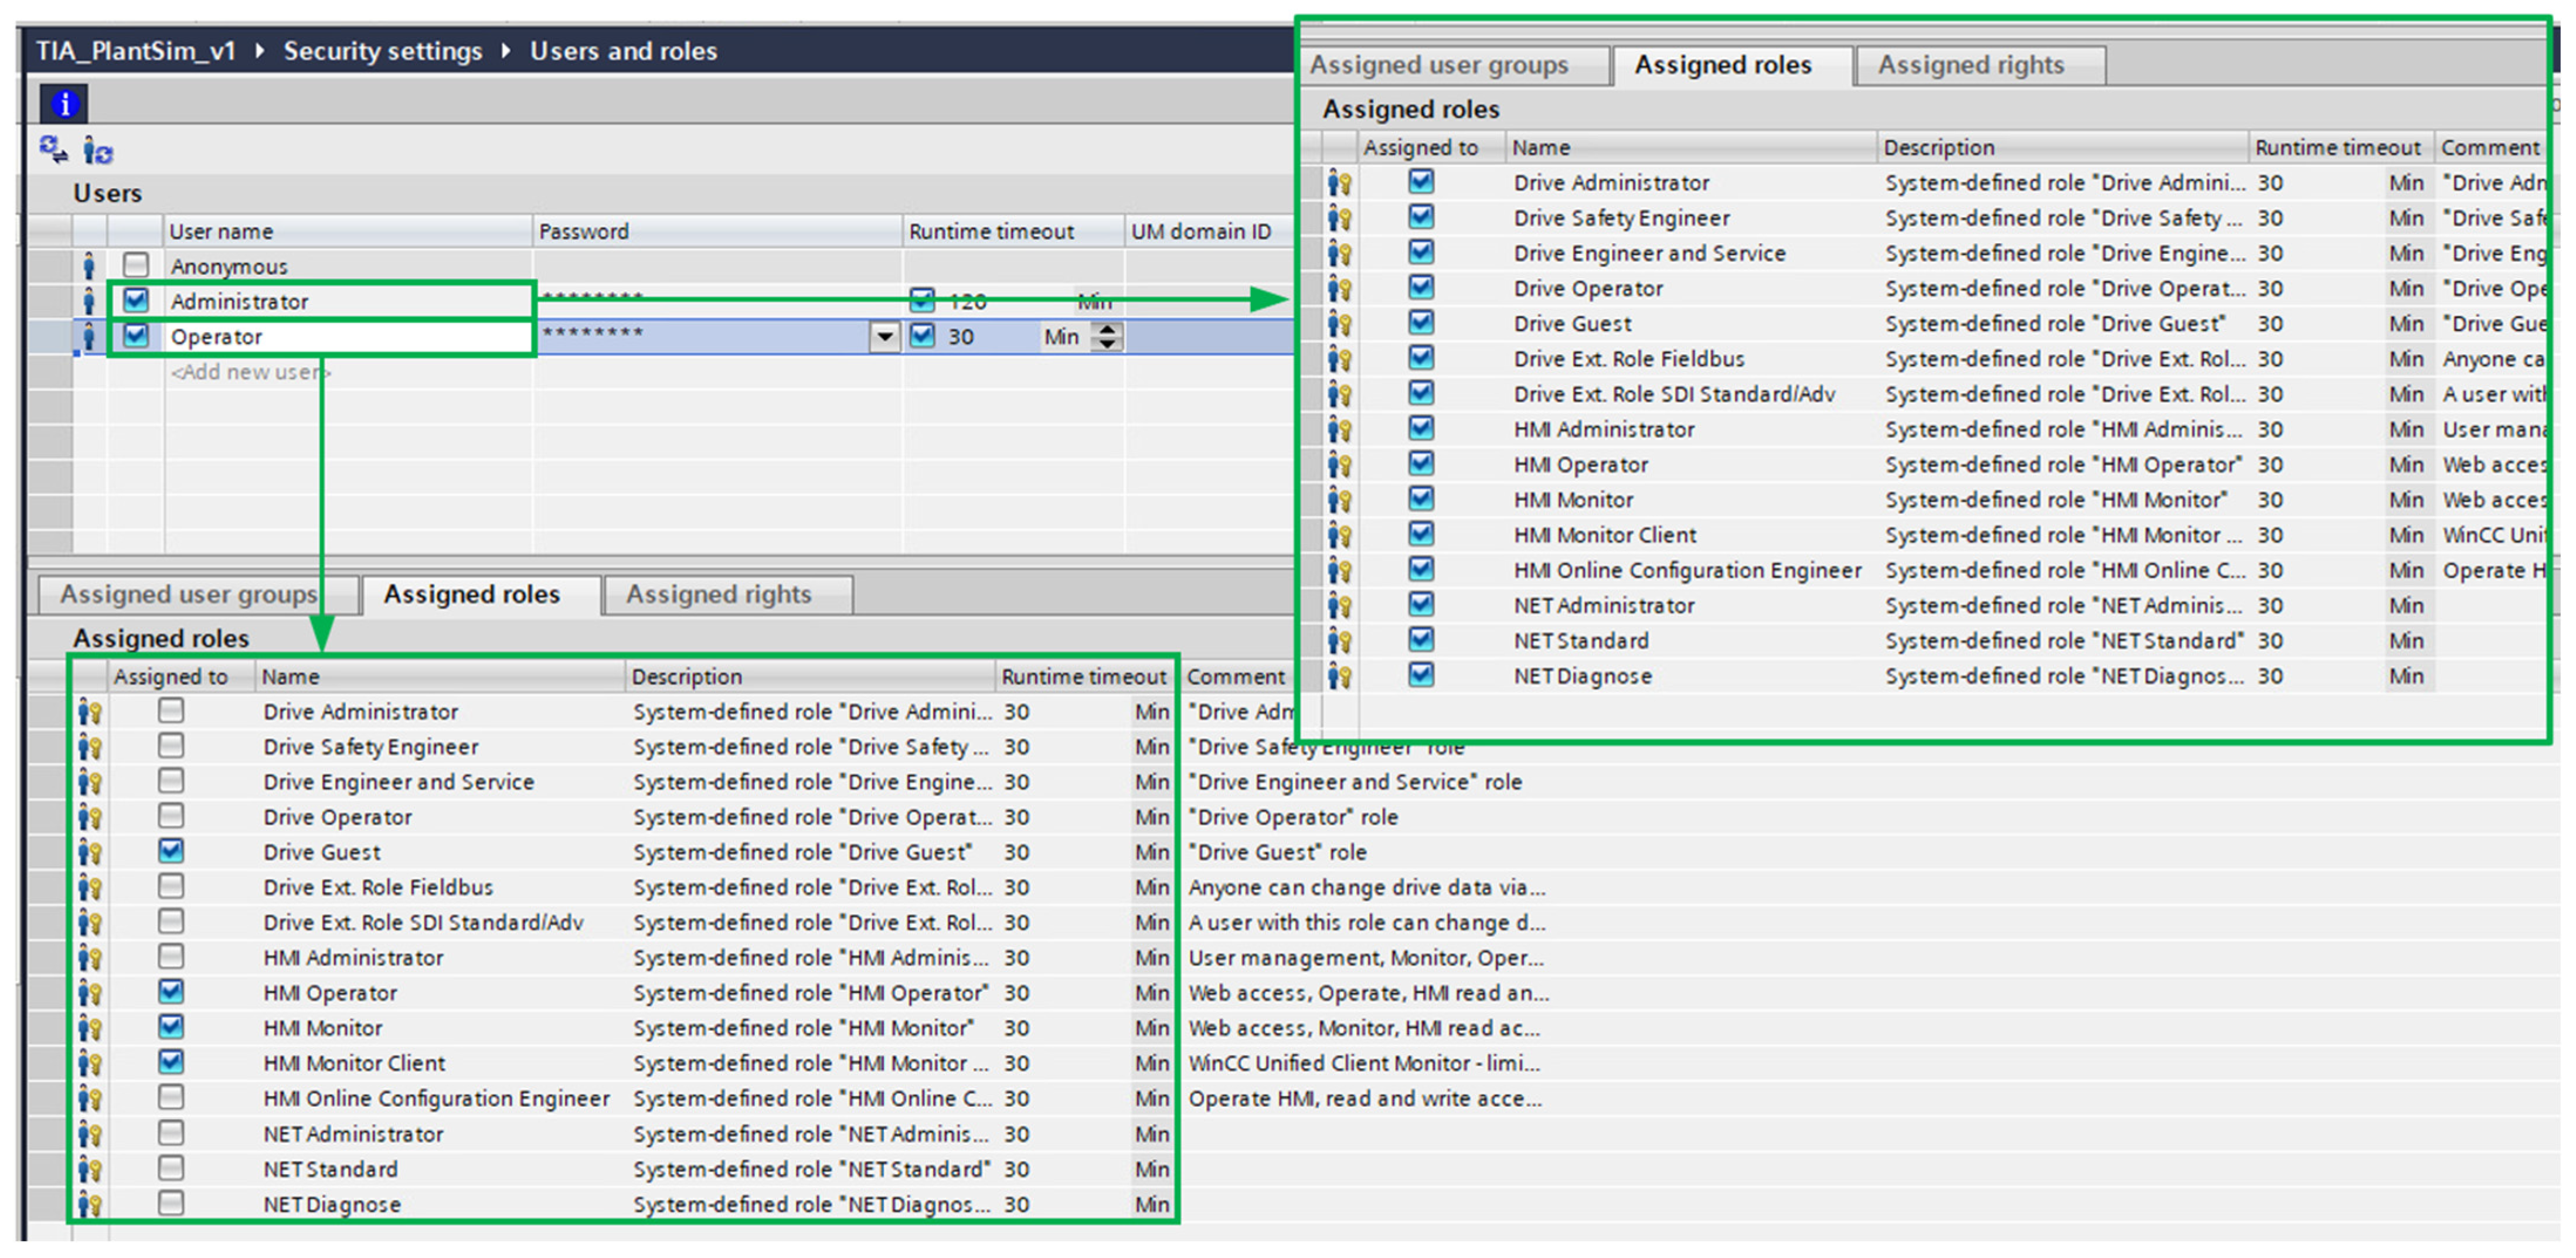
In TIA Portal, defining users and roles at the PLC level establishes a foundational layer of access control and traceability that directly enhances the security, reliability, and usability of the WinCC Unified HMI in a PV installation. By creating distinct user accounts, such as Operator, Technician, Engineer, and Administrator, with tailored permissions for reading process values, acknowledging alarms, modifying setpoints, or updating logic, the PLC enforces who can perform which actions,
Figure 7. When integrated with WinCC Unified’s user management, these role definitions propagate seamlessly to the HMI, enabling the same credentials and rights to govern access to screens, controls, and maintenance functions without redundant account maintenance. For example, an Operator login might permit only monitoring dashboards and alarm acknowledgement, while a technician can also access diagnostic trend charts and execute firmware updates; an Engineer can adjust advanced control parameters for MPPT algorithms, and an Administrator retains full authority to change user roles, security settings, and project configurations.
This alignment of PLC- and HMI-level roles ensures that critical PV-system operations—such as changing inverter set points, resetting trip conditions, or initiating commissioning routines—are restricted to qualified personnel, reducing the risk of inadvertent misconfiguration or safety breaches. Furthermore, centralized user auditing in TIA Portal and WinCC Unified captures every login, logout, parameter change, and alarm acknowledgement with user ID and timestamp, providing a comprehensive audit trail for regulatory compliance (e.g., grid-code reporting) and forensic analysis after incidents.
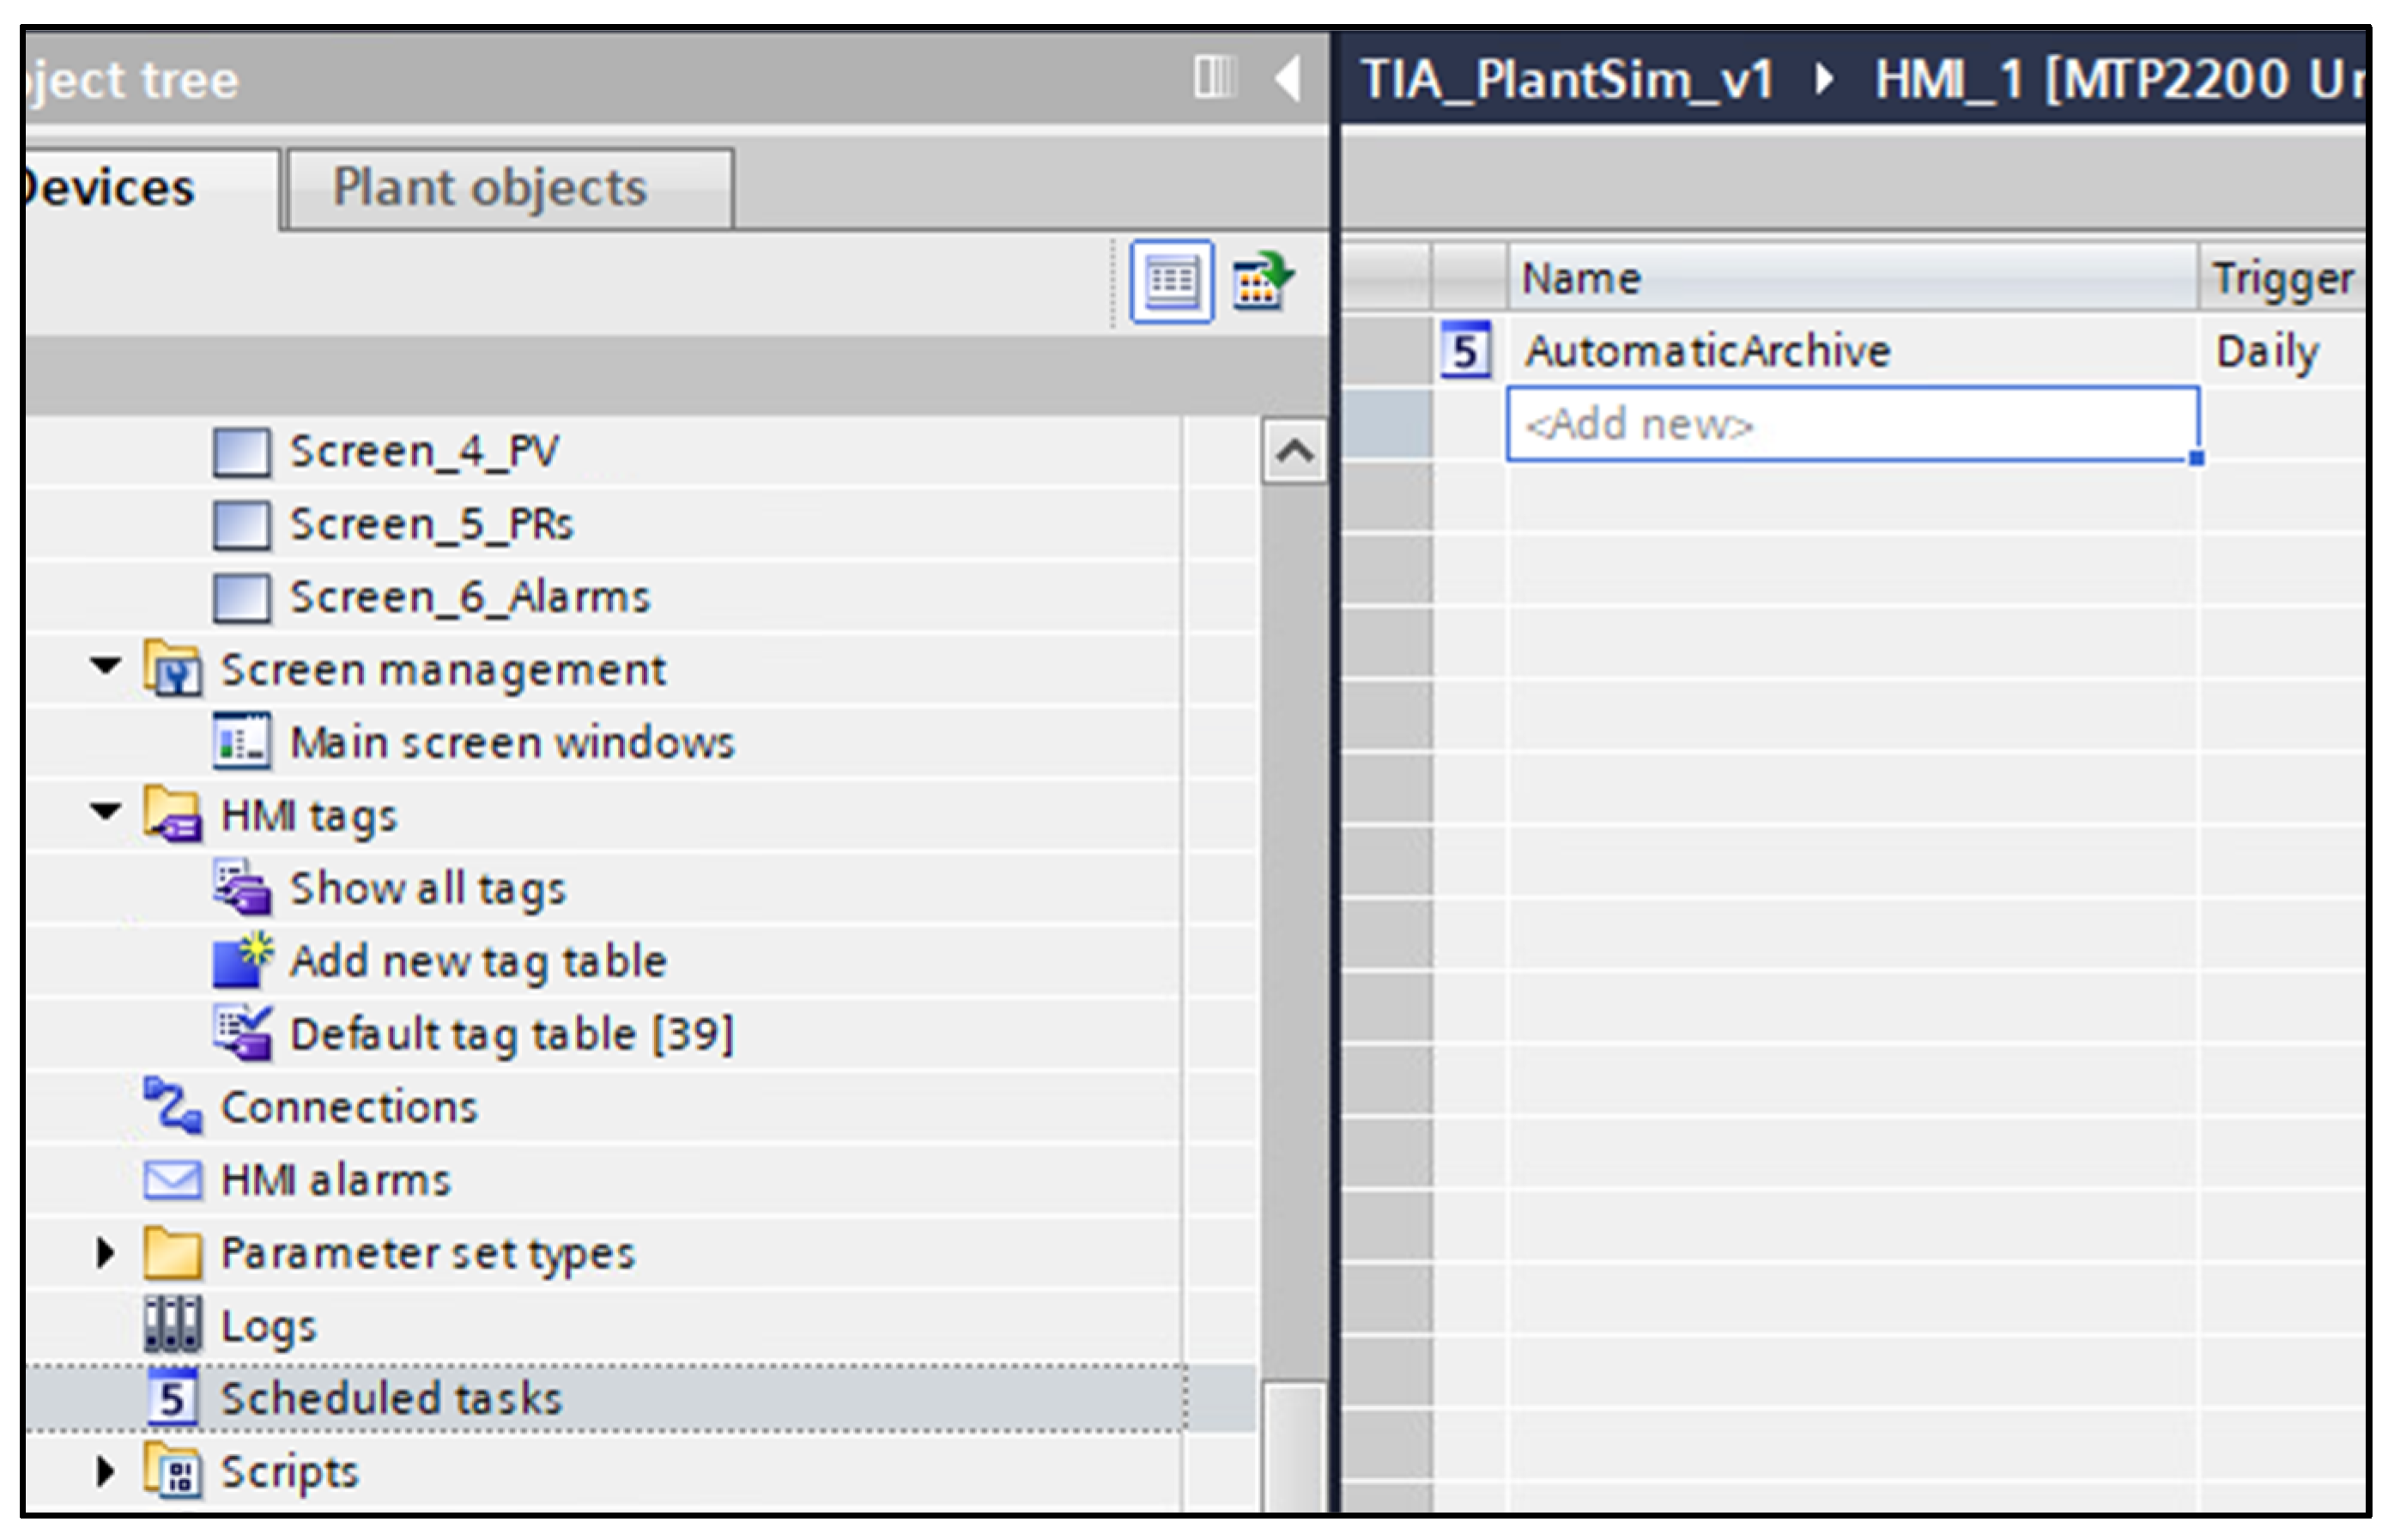
In this WinCC Unified project within TIA Portal, the “Scheduled tasks” feature enables fully automated execution of routine operations without any manual intervention—by defining named jobs, their triggers, and associated actions. “AutomaticArchive” task,
Figure 8, that was configured for this project to run daily at a specified time helped automatically export historical process data, alarm logs and trend snapshots to on board USB storage, it could also be some network share instead.
Beyond archiving, you can create additional scheduled tasks to launch custom scripts (JavaScript or VBScript) that generate performance reports, upload key performance indicators (KPIs) to a cloud database, purge old log entries, or even trigger remote notifications via email or MQTT. Triggers are highly flexible: tasks can be set to execute at fixed times, after system start up, on tag-value changes, or at cyclic intervals. Each task’s configuration pane allows you to specify parameters such as file paths, script names, or archive filters and to enable or disable tasks centrally. By leveraging scheduled tasks, PV-plant operators gain “set-and-forget” reliability: plant data is archived consistently, maintenance reports are delivered on time, and housekeeping routines (like log cleanup) run autonomously. This not only frees engineers from repetitive chores but also ensures regulatory compliance and supports proactive maintenance through predictable, timely data management.
2.4. Definition of Anomaly Scenarios for Benchmarking
Conventional photovoltaic monitoring, while standardized by norms like IEC 61724-1 [
11], has traditionally focused on generation-centric metrics such as the Performance Ratio (PR). While essential, these parameters often fail to provide timely insights into the dynamic interplay between on-site generation, building consumption, and grid interaction. This limitation can mask critical operational anomalies where generation efficiency appears normal, yet the system’s overall energy management objectives are failing. This research addressed this gap by developing and validating a novel HMI framework built upon a refined theoretical foundation that prioritizes real-time, high-resolution energy flow analysis.
To provide a quantitative benchmark, a simulated study was conducted to measure the Mean-Time-to-Detection (MTTD) for critical operational anomalies. For the benchmark case, a traditional SCADA interface relying on daily aggregated IEC 61724-1 parameters presented an MTTD of 15 min for identifying supply–demand discrepancies. Control case is an operator using a standard interface that only shows the basic IEC 61724-1 parameters: Hi, E_A, E_L, Eout, nBOS, Y_A, Y_f, Y_r, L_C, LBOS and PR. In contrast, our proposed HMI, which provides real-time visualization of novel indicators for self-consumption and system diagnostics: E_PVSC, Y_fPVSC, Y_fTG, LNSC; reduced the MTTD to 3 min. This represents an 81.66% improvement in diagnostic speed. The three most common anomaly scenarios were defined.
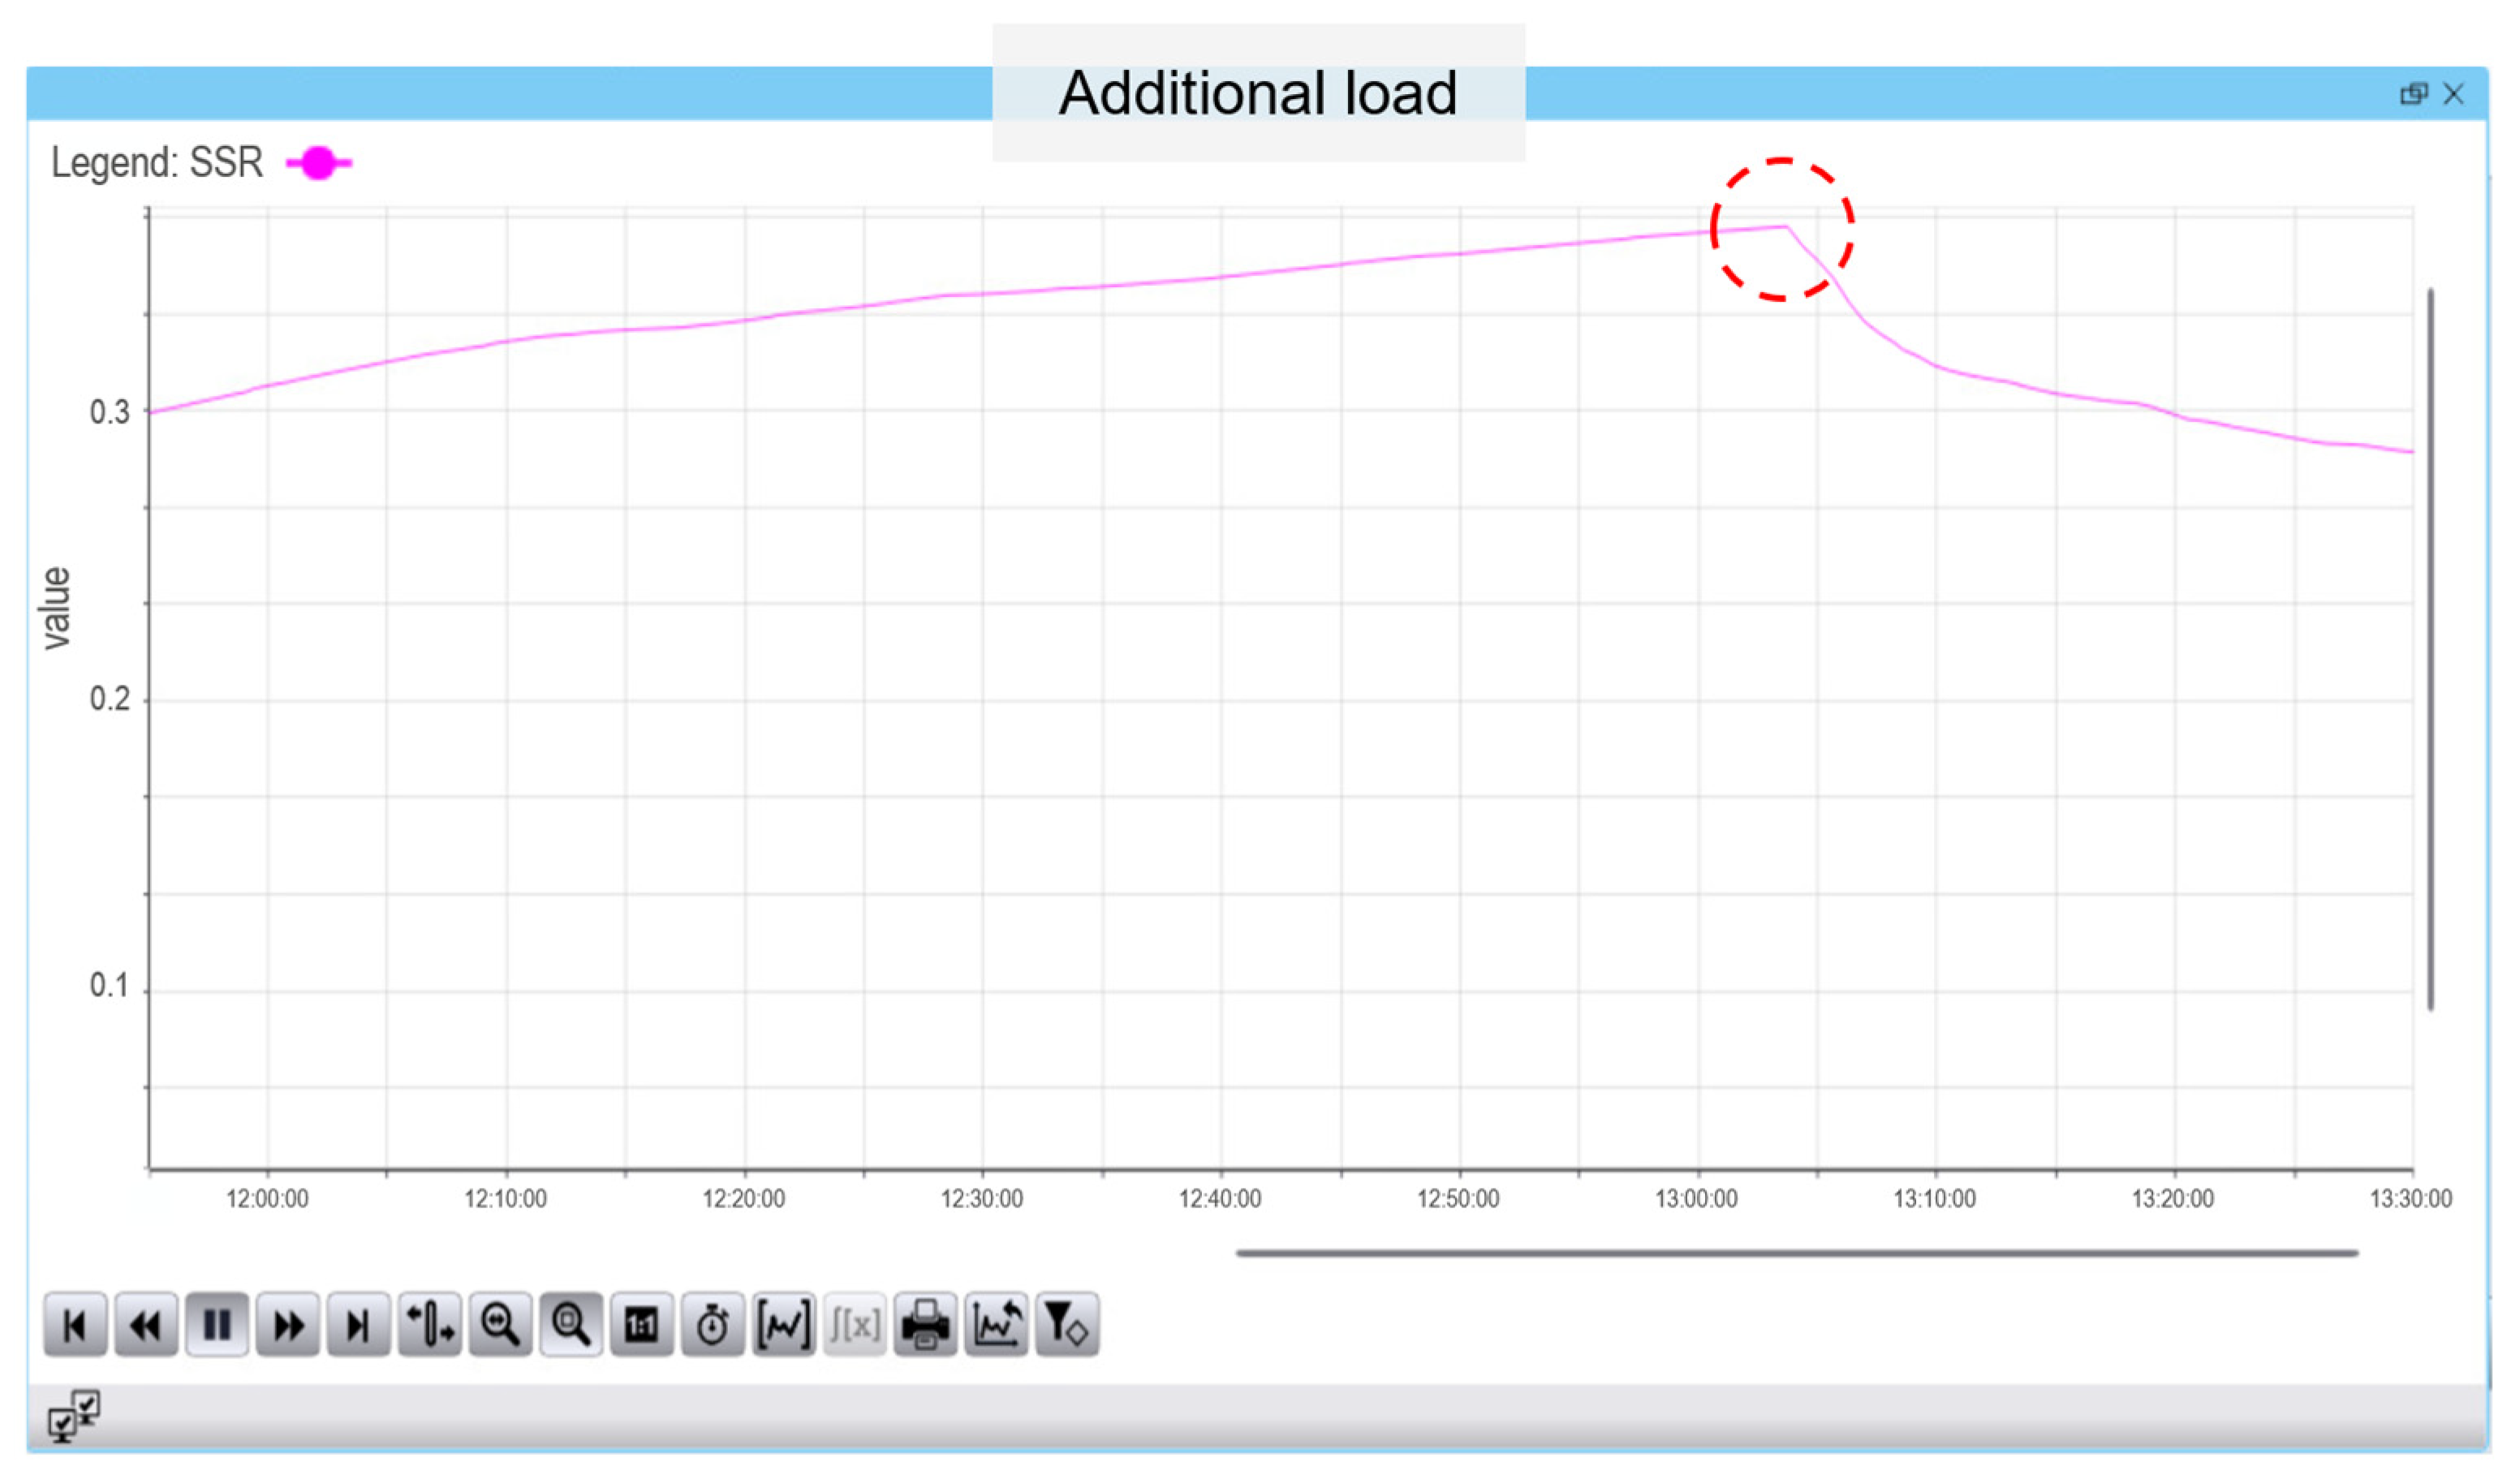
Scenario A: Load Spike. A large, unexpected load (like an HVAC unit) turns on, significantly changing the system’s self-sufficiency. With a “traditional” SCADA, this event is difficult to classify as a PV system anomaly. An operator would simply observe an increase in building load and grid import, but since standard, generation-focused metrics like the Performance Ratio (PR) remain unaffected, there is no immediate context to flag the sudden drop in energy autonomy as a critical event. In contrast, the proposed HMI immediately detects this change, as the real-time Self-Sufficiency Ratio (SSR) value suddenly decreases, red circle in
Figure 9, indicating that the PV system is now covering a much smaller fraction of the building’s total load.
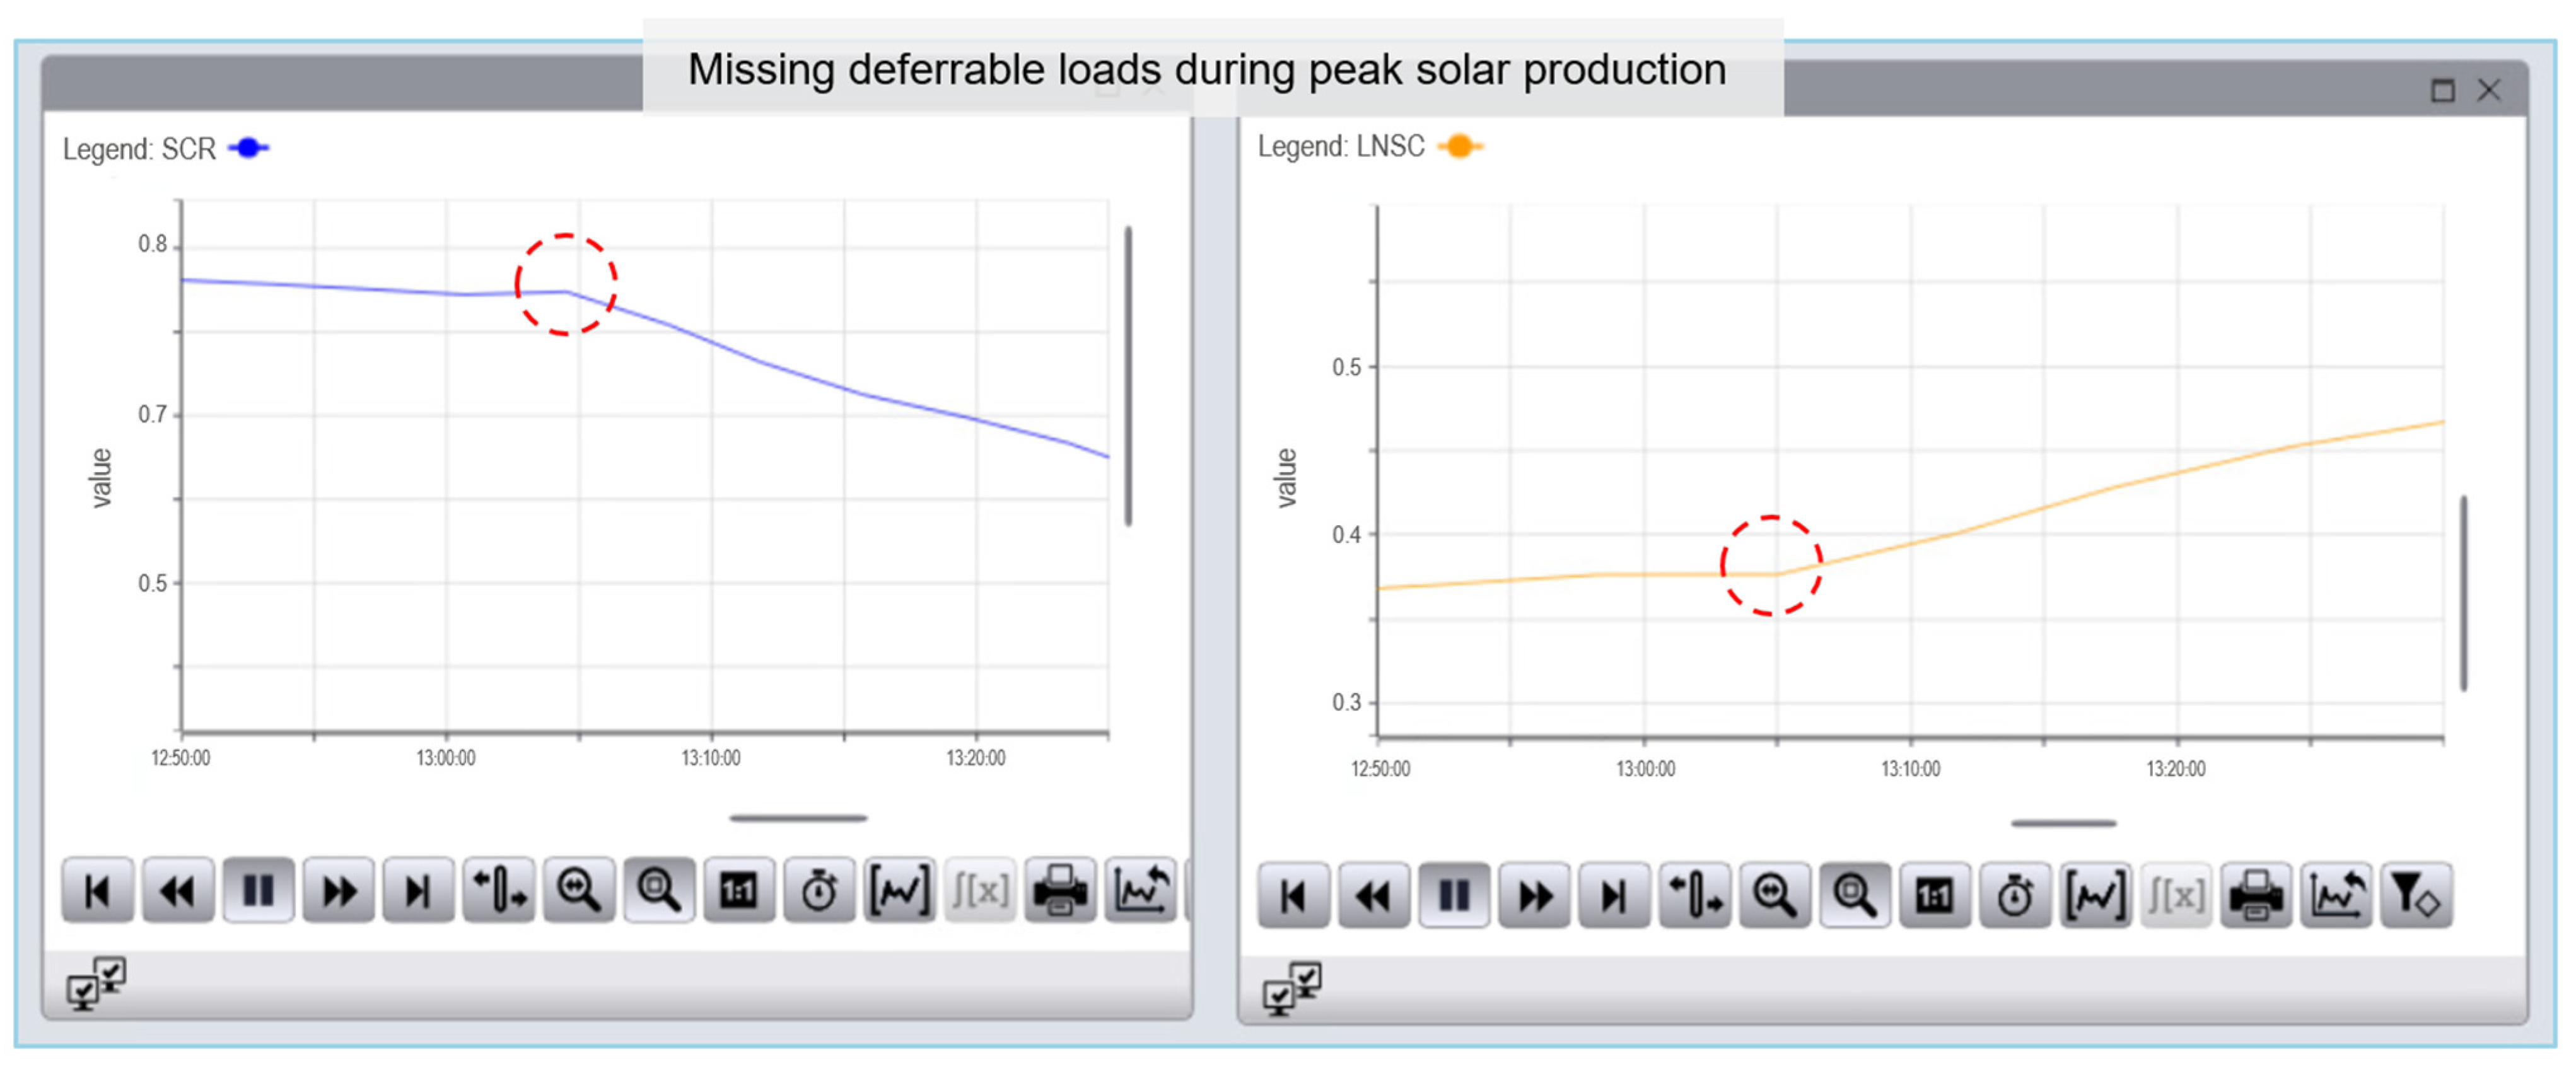
Scenario B: Deferrable Load Activation Failure. Many modern systems are designed to maximize self-consumption by automatically turning on “deferrable” loads, like a water heater, a battery charger, or an EV charger during peak solar production. This scenario simulates a failure where the control system fails to activate this load. An operator using a traditional SCADA would see high PV generation and grid export, resulting in an excellent Performance Ratio (PR) that makes the anomaly indistinguishable from a normal productive day, requiring a time-consuming manual investigation for eventual detection. In contrast, the proposed HMI provides an instantaneous diagnosis by displaying two simultaneous and opposing signals on the dashboard: the Self-Consumption Ratio (SCR) plummets while the Non-Self-Consumed Losses (LNSC) increases, red circles in
Figure 10.
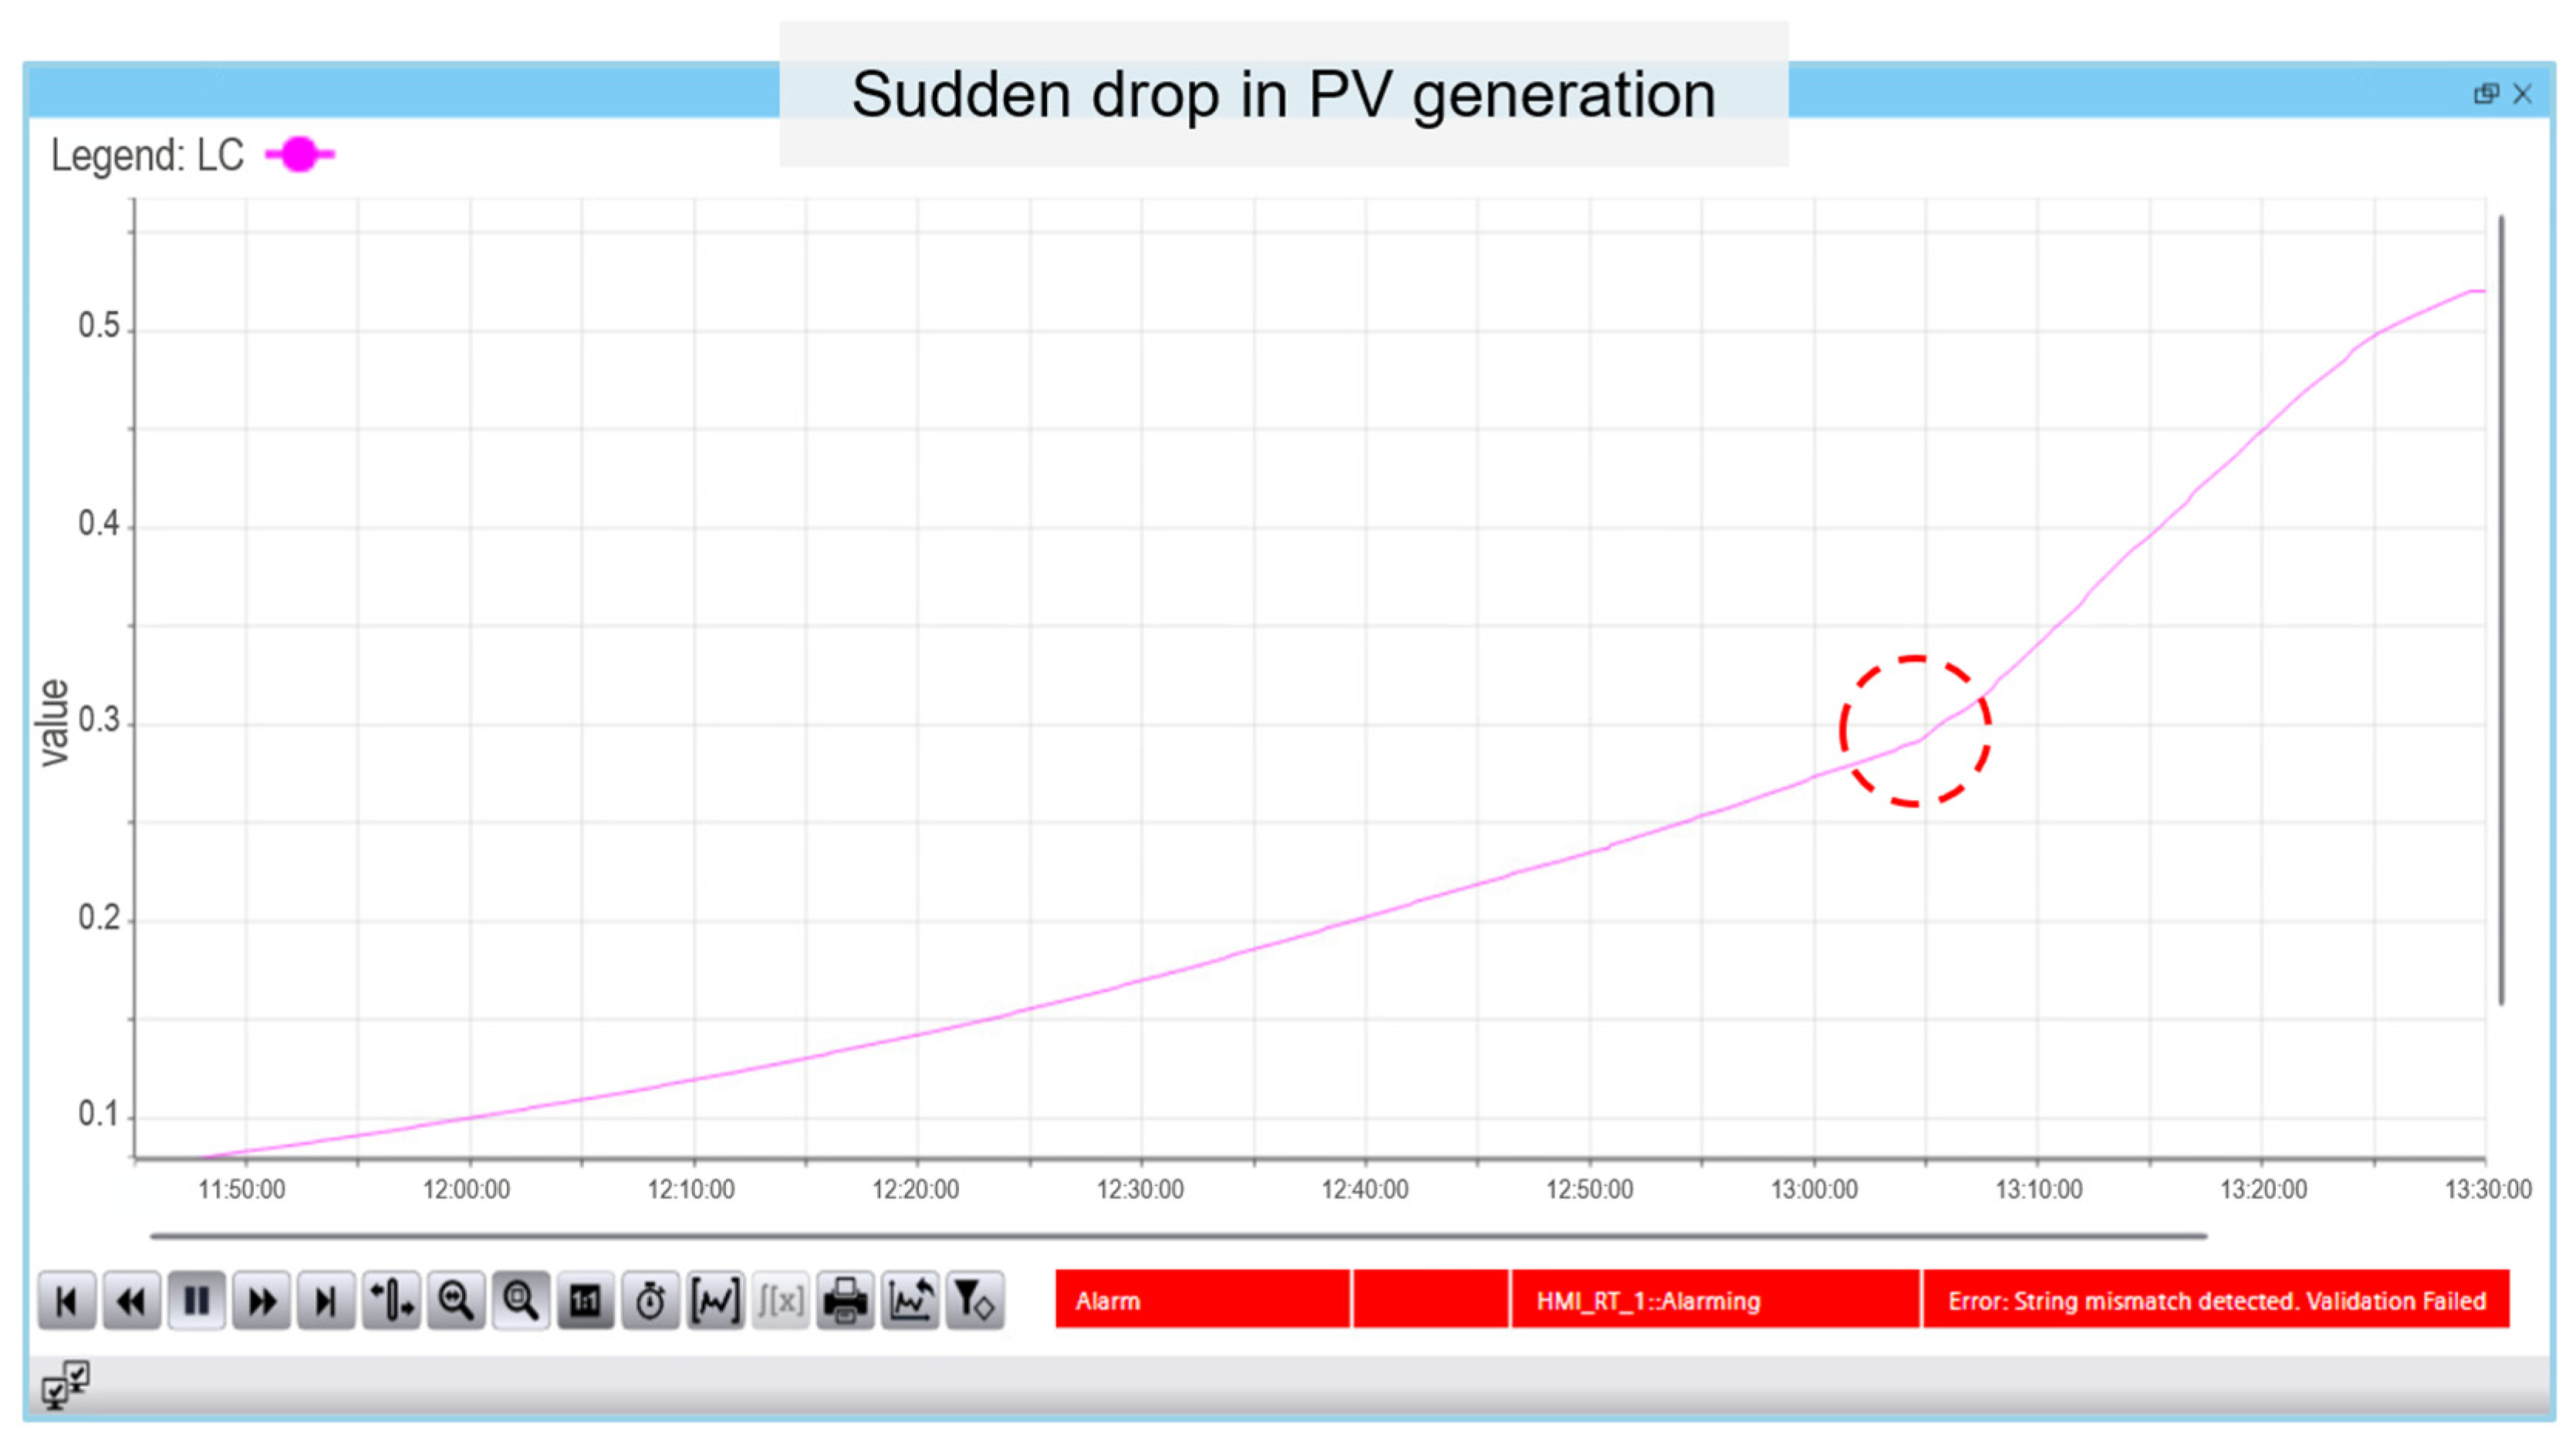
Scenario C: String Mismatch. A string mismatch is characterized by a sudden drop in generation from a single string, often due to partial soiling or a component fault, while overall site irradiation remains high. While an operator using a traditional SCADA would observe an increase in the Array Capture Loss (LC), this change can be too subtle to distinguish from normal fluctuations over short timeframes, often delaying detection by several minutes. In contrast, the proposed HMI visualizes the LC on a high-resolution, real-time graph where the anomaly is immediately apparent as a sharp jump from its normal operating range. This clear visual cue, coupled with a user-configurable alarm, provides an instant and unambiguous alert that a fault exists within the PV array, red circle in
Figure 11.
The results of the MTTD analysis are provided in the result section. For the purposes of the quantitative benchmarking presented in
Section 3.2, a clear reference method was established. The “control case” or “baseline” for the MTTD study consists of an operator viewing a standard, conventional monitoring interface limited only to the parameters defined by the IEC 61724-1 standard (e.g., PR, Yf). The “proposed HMI” is the one developed in this work, which includes all standard parameters plus the new, high-resolution energy-flow indicators (SCR, SSR, L_NSC, etc.). The comparison thus scientifically isolates and quantifies the additional diagnostic value provided by the new indicators.
2.5. Probabilistic Simulation Methodology
To address the critical need for assessing the framework’s performance under real-world operational uncertainties and to validate the generalizability of our methodology, a comprehensive Monte Carlo simulation was conducted. The simulation’s input data was derived from high-resolution, one-minute power measurements, which were aggregated into an hourly time series of energy in Watt-hours (Wh) to ensure a high-fidelity representation of the system’s dynamics. This analysis moves beyond the deterministic results of a single case study to a probabilistic evaluation, rigorously testing the stability of the proposed indicators against key stochastic variables, including year-to-year weather variability, fluctuations in building load profiles, and long-term component degradation. By simulating 10,000 plausible operational hours, we can quantify the expected performance and inherent uncertainty of each key parameter. The results provide compelling quantitative evidence of the framework’s robustness and reveal the distinct statistical signatures of each indicator.
Based on five years of historical data, the stochastic inputs for the model exhibit significant variability,
Table 5. The A3 building’s average power load, case study 1, (PL) is 233.66 W and the average global irradiance (Gi) in Jaén is 219.55 W/m
2, yet both are characterized by high volatility, with standard deviations larger than their respective mean values. In contrast, the photovoltaic system’s operational metrics demonstrate consistent and high performance. The system maintains an average Performance Ratio (PR) of 82.33% with a very low standard deviation of only 3.71%, indicating stable efficiency. Similarly, the Balance of System (nBOS) components operate with a consistently high efficiency, averaging 92.66%.
3. Results
The proposed SCADA system can be configured for flexible analysis periods, including daily, monthly, or yearly monitoring, depending on the desired PLC program settings. Daily analysis of photovoltaic systems using SCADA is crucial for ensuring optimal performance, identifying losses, and maintaining system efficiency. Key productivity and loss rate parameters such as nBOS, Yr, LC, Yf, YfPVSC, YA, LBOS, YfTG and LNSC provide insights into daily energy generation efficiency and deviations from expected output. These metrics help operators detect underperformance and take corrective actions before significant losses accumulate. In addition to yield and loss rates, SCADA systems monitor Hi, EA, Eout, EPVSC, EL, ETG, and EFG. By analyzing these daily, operators can correlate energy production with environmental conditions, optimizing energy dispatch strategies and identifying anomalies such as excessive transmission losses or inverter inefficiencies. Performance ratios such as PR, SCR, SSR, PRSC, PRTG offer a comprehensive assessment of system efficiency. A daily review of these indicators allows for real-time tracking of system degradation, early detection of issues like shading or soiling. Through continuous SCADA-based monitoring, operators can enhance predictive maintenance, reduce downtime, and optimize PV system performance, ensuring maximum energy output and long-term economic viability.
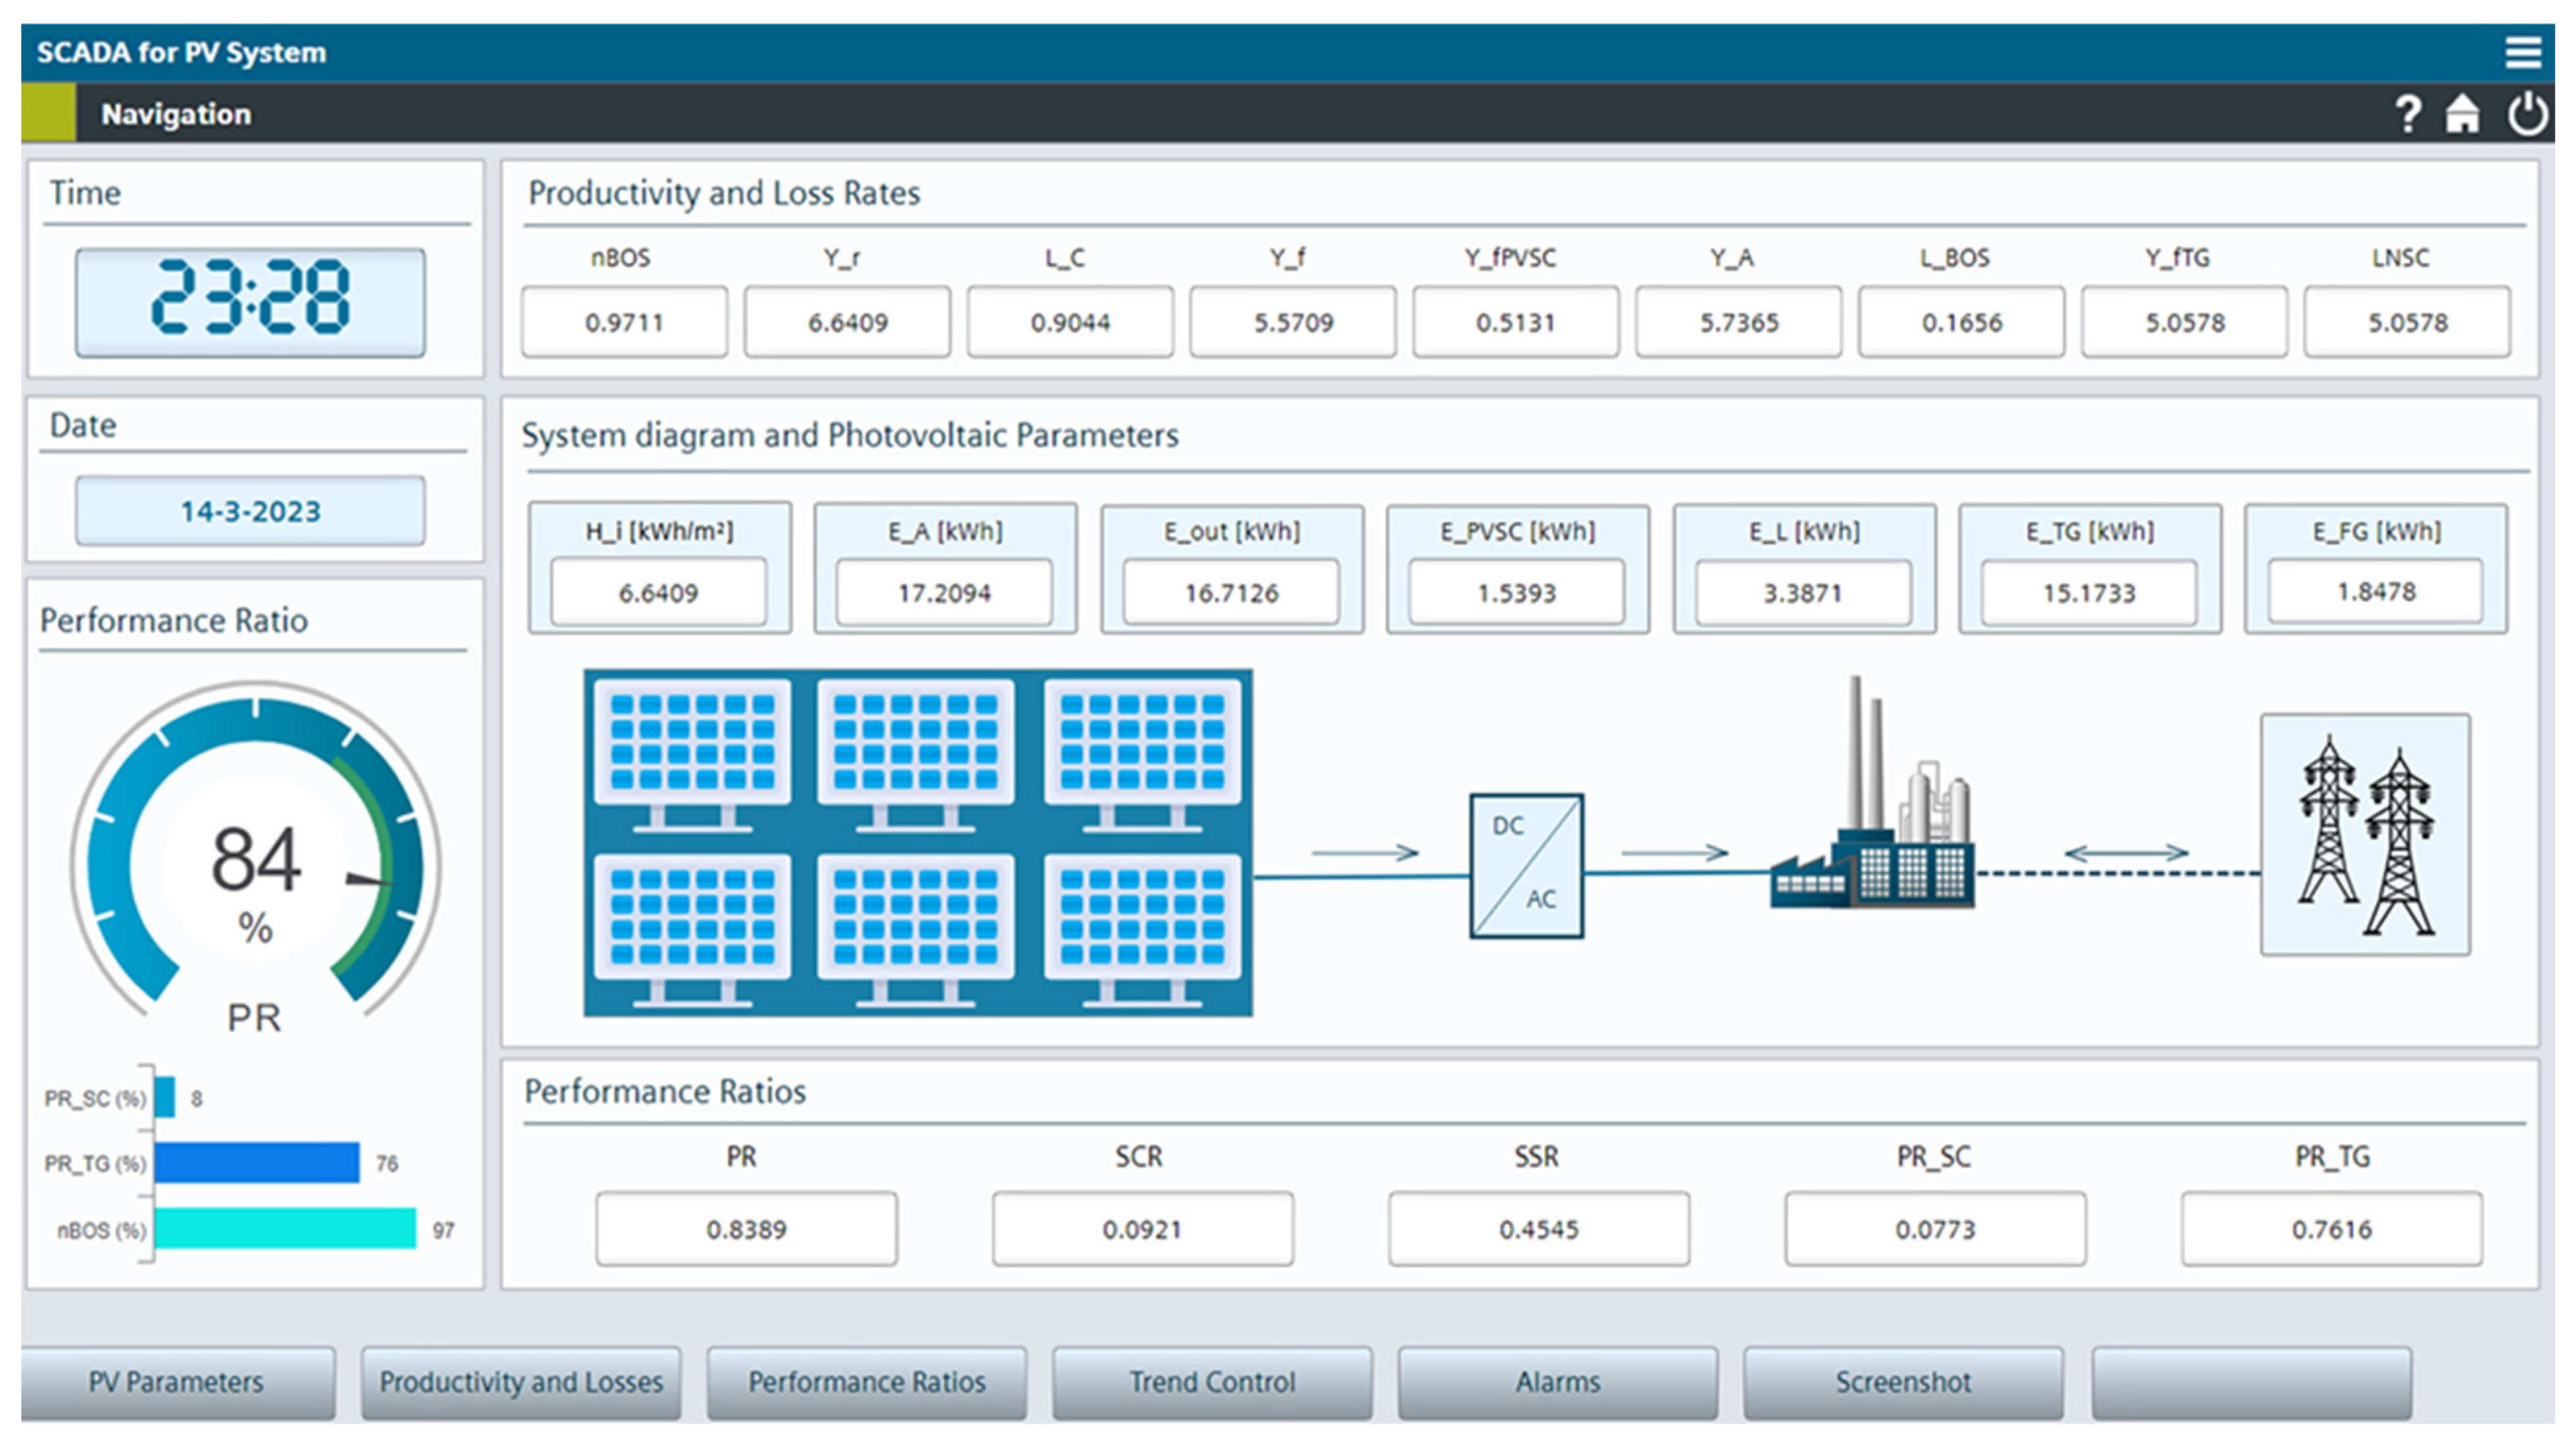
HMI SCADA interface designed in this work provides a comprehensive overview of a photovoltaic system’s performance,
Figure 12.
The clean layout features a tabbed navigation for accessing different aspects of the system, including PV Parameters, Productivity and Losses, Performance Ratios, Trend control, and alarms. A prominent system diagram visually represents the energy flow from the solar panels through the DC/AC conversion and connection to the grid. Key metrics such as solar irradiance (Hi), energy available (EA), energy output (Eout), and various energy and loss parameters are clearly displayed with labels and units. A large, circular gauge emphasizes the overall performance ratio (PR), supplemented by additional performance ratios below. The interface prioritizes real-time monitoring and analysis, enabling operators to quickly assess system health, identify potential issues, and make informed decisions to optimize performance and efficiency.
3.1. Sub-Screens Layouts and Functionalities
Along the bottom of the main HMI dashboard is a row of navigation buttons “PV Parameters”, “Productivity and Losses”, “Performance Ratios”, “Trend Control”, “Alarms”, and “Screenshot”. Each of these buttons is hard-coded to jump the operator to a dedicated sub-screen tailored to that topic. “Alarms” shows the alarm list table and “Screenshot” provides an interface for capturing and archiving the current table and trend widgets. This modular screen-per-function approach keeps the HMI clean, focused, and intuitive.
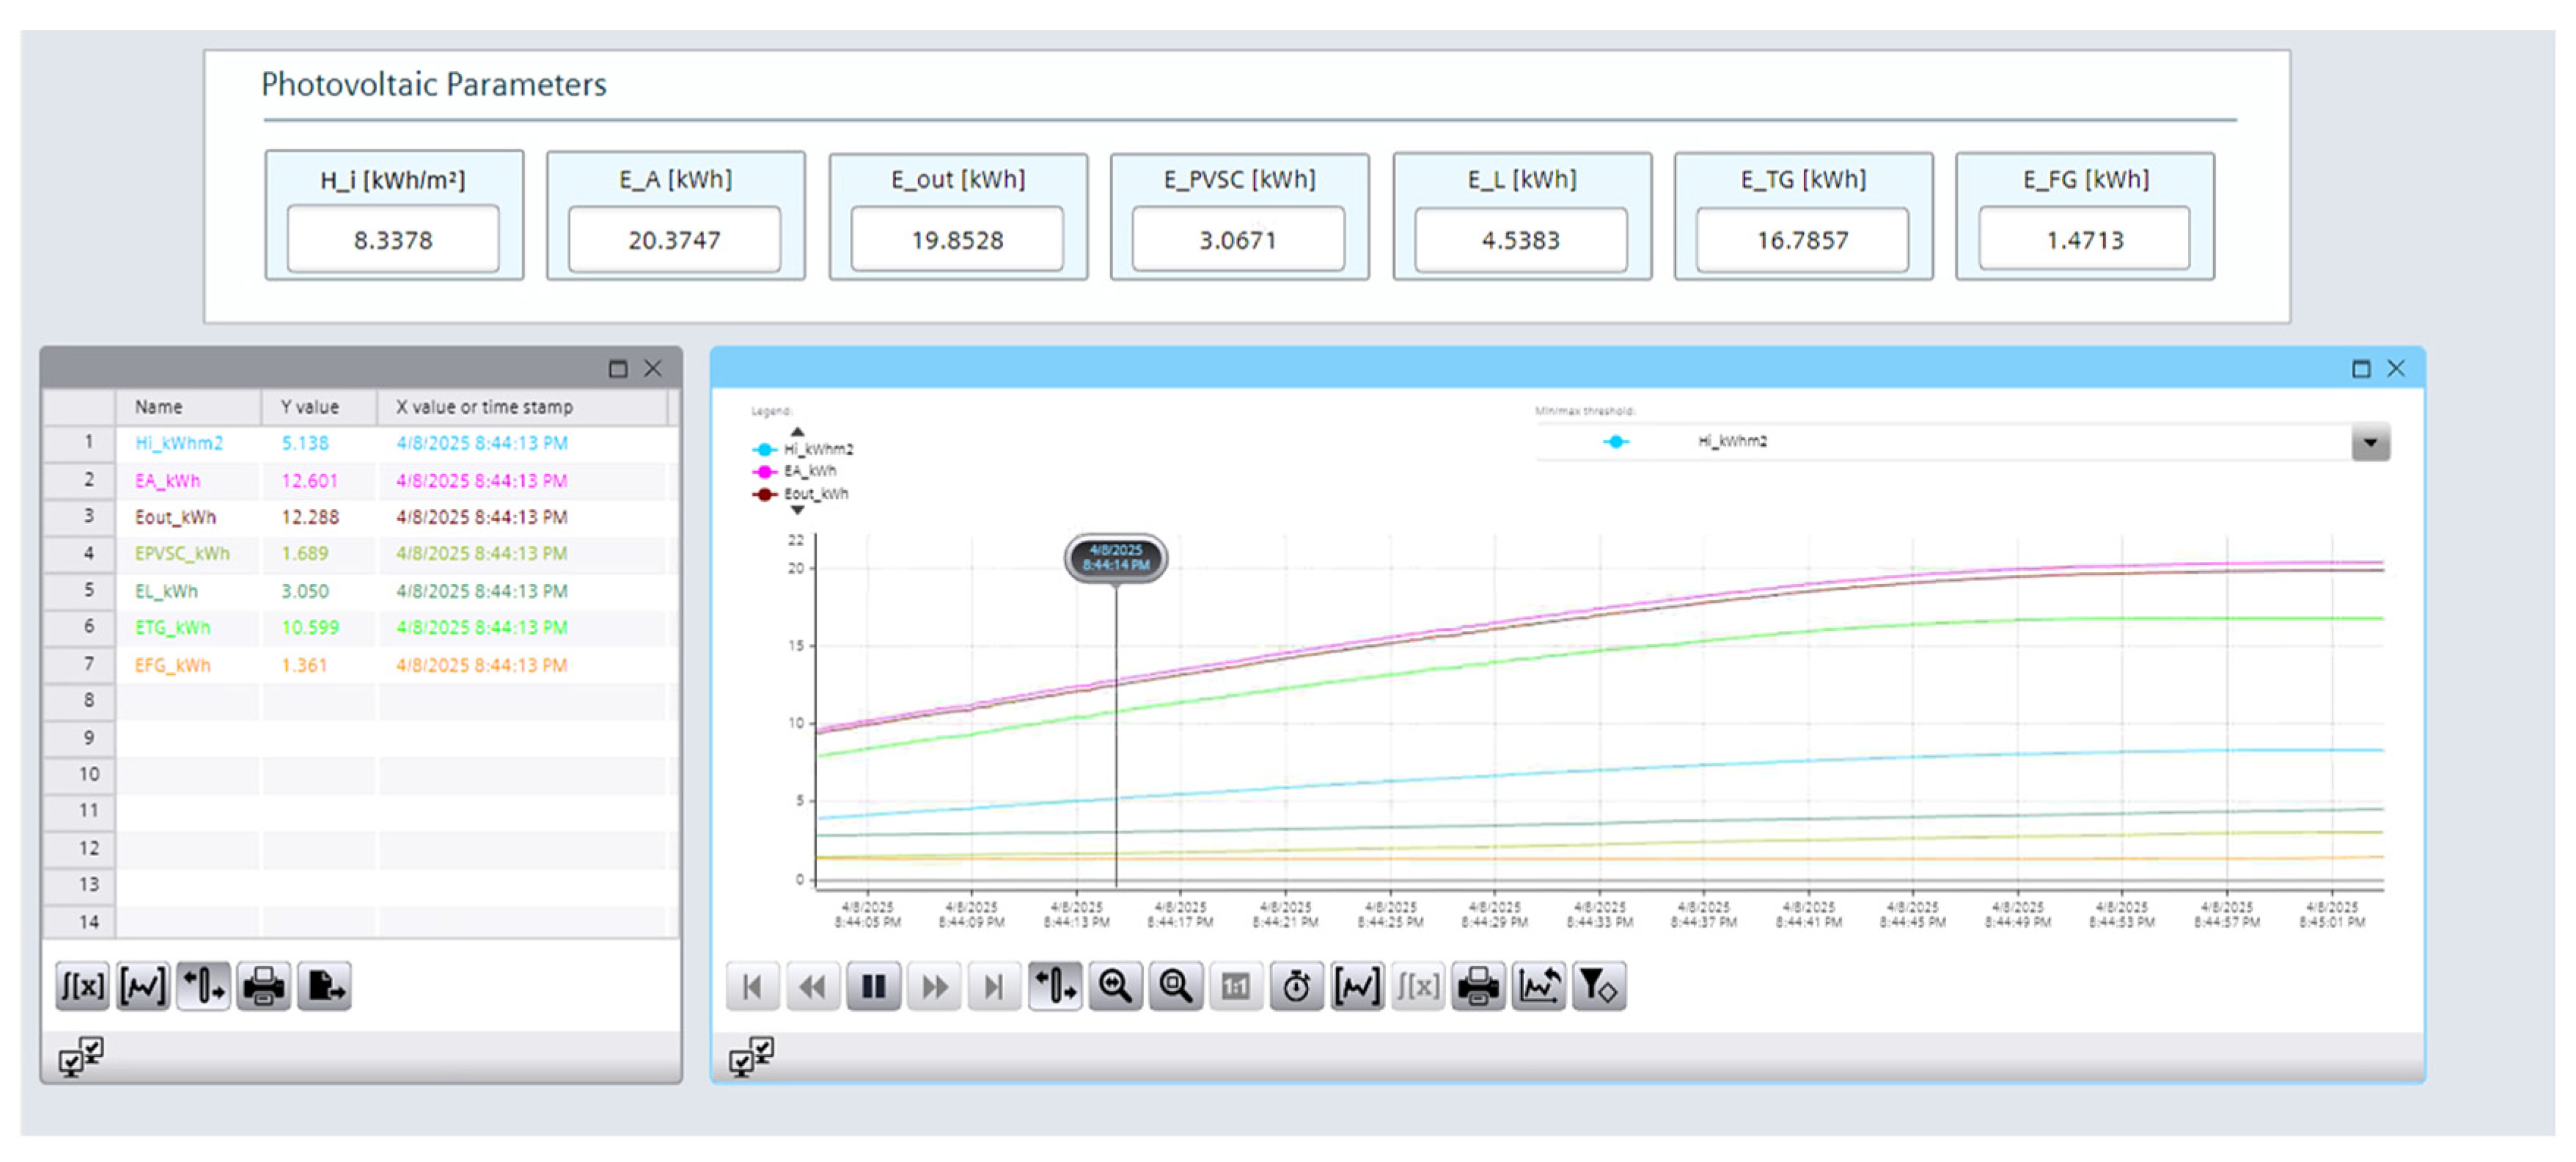
The “Photovoltaic Parameters” screen serves as a dedicated interface for monitoring the core energy values of the PV system in real time,
Figure 13. This screen displays a selected set of key parameters: H_i [kWh/m
2]—in-plane irradiation, representing the solar energy received by the module surface, E_A [kWh]—PV array output energy, E_out [kWh]—total AC energy output from the inverter, E_PVSC [kWh]—self-consumed energy, E_L [kWh]—total energy consumption, E_TG [kWh]—energy exported to the grid, E_FG [kWh]—energy supplied from the grid to cover the remaining load.
These parameters are organized in a Variable Watch Table on the left side of the screen, which provides a live numerical snapshot of each tag’s current value along with a timestamp, helping operators assess system performance at a glance. Alongside this table, a Trend Control graph dynamically visualizes the historical behavior of these variables, allowing users to analyze their evolution over time. The trend view enhances situational awareness by enabling quick detection of anomalies, gradual changes in system output, or correlation between solar irradiance and energy flows.
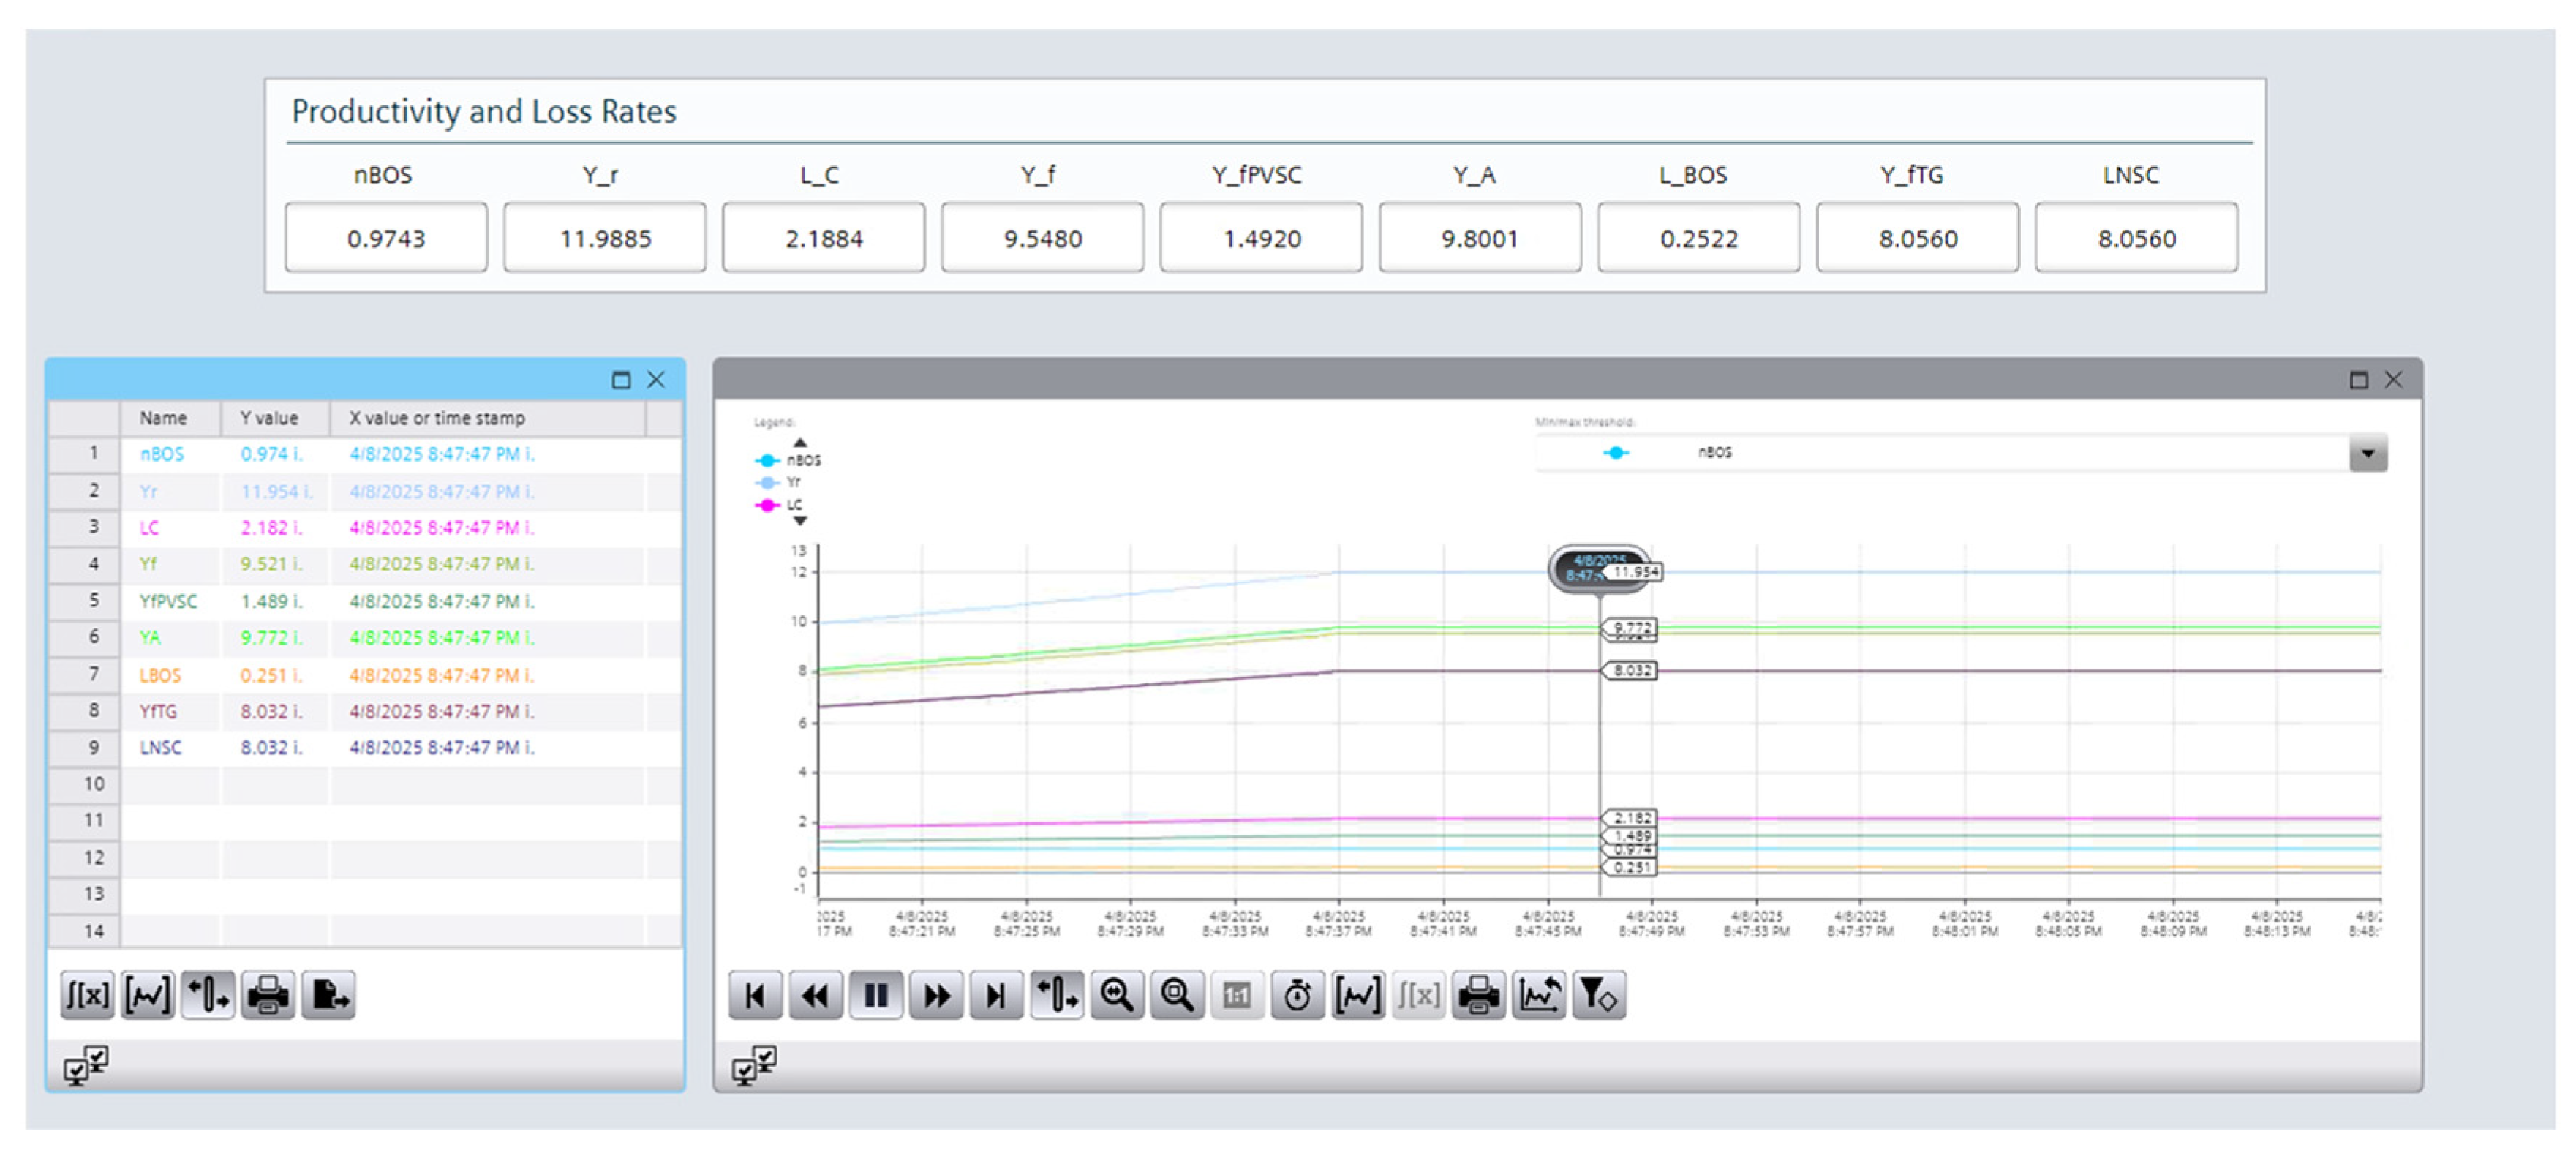
The “Productivity and Losses” screen follows the same intuitive layout combining a Variable Watch Table with a Trend Control chart to deliver both immediate values and historical insights,
Figure 14. This screen focuses on advanced performance indicators and loss components critical for evaluating system efficiency and diagnosing productivity shortfalls. The displayed parameters include: nBOS—balance of system efficiency, Y_r—reference yield based on irradiance, L_C—capture losses due to PV module, Y_f—final yield, Y_fPVSC—yield of the self-consumed energy per kW, Y_A—array energy yield, L_BOS—BOS-related losses from inverter, cables, etc., Y_fTG—yield of the energy exported to the grid, LNSC—non-self-consumed losses, i.e., energy that cannot be used or exported.
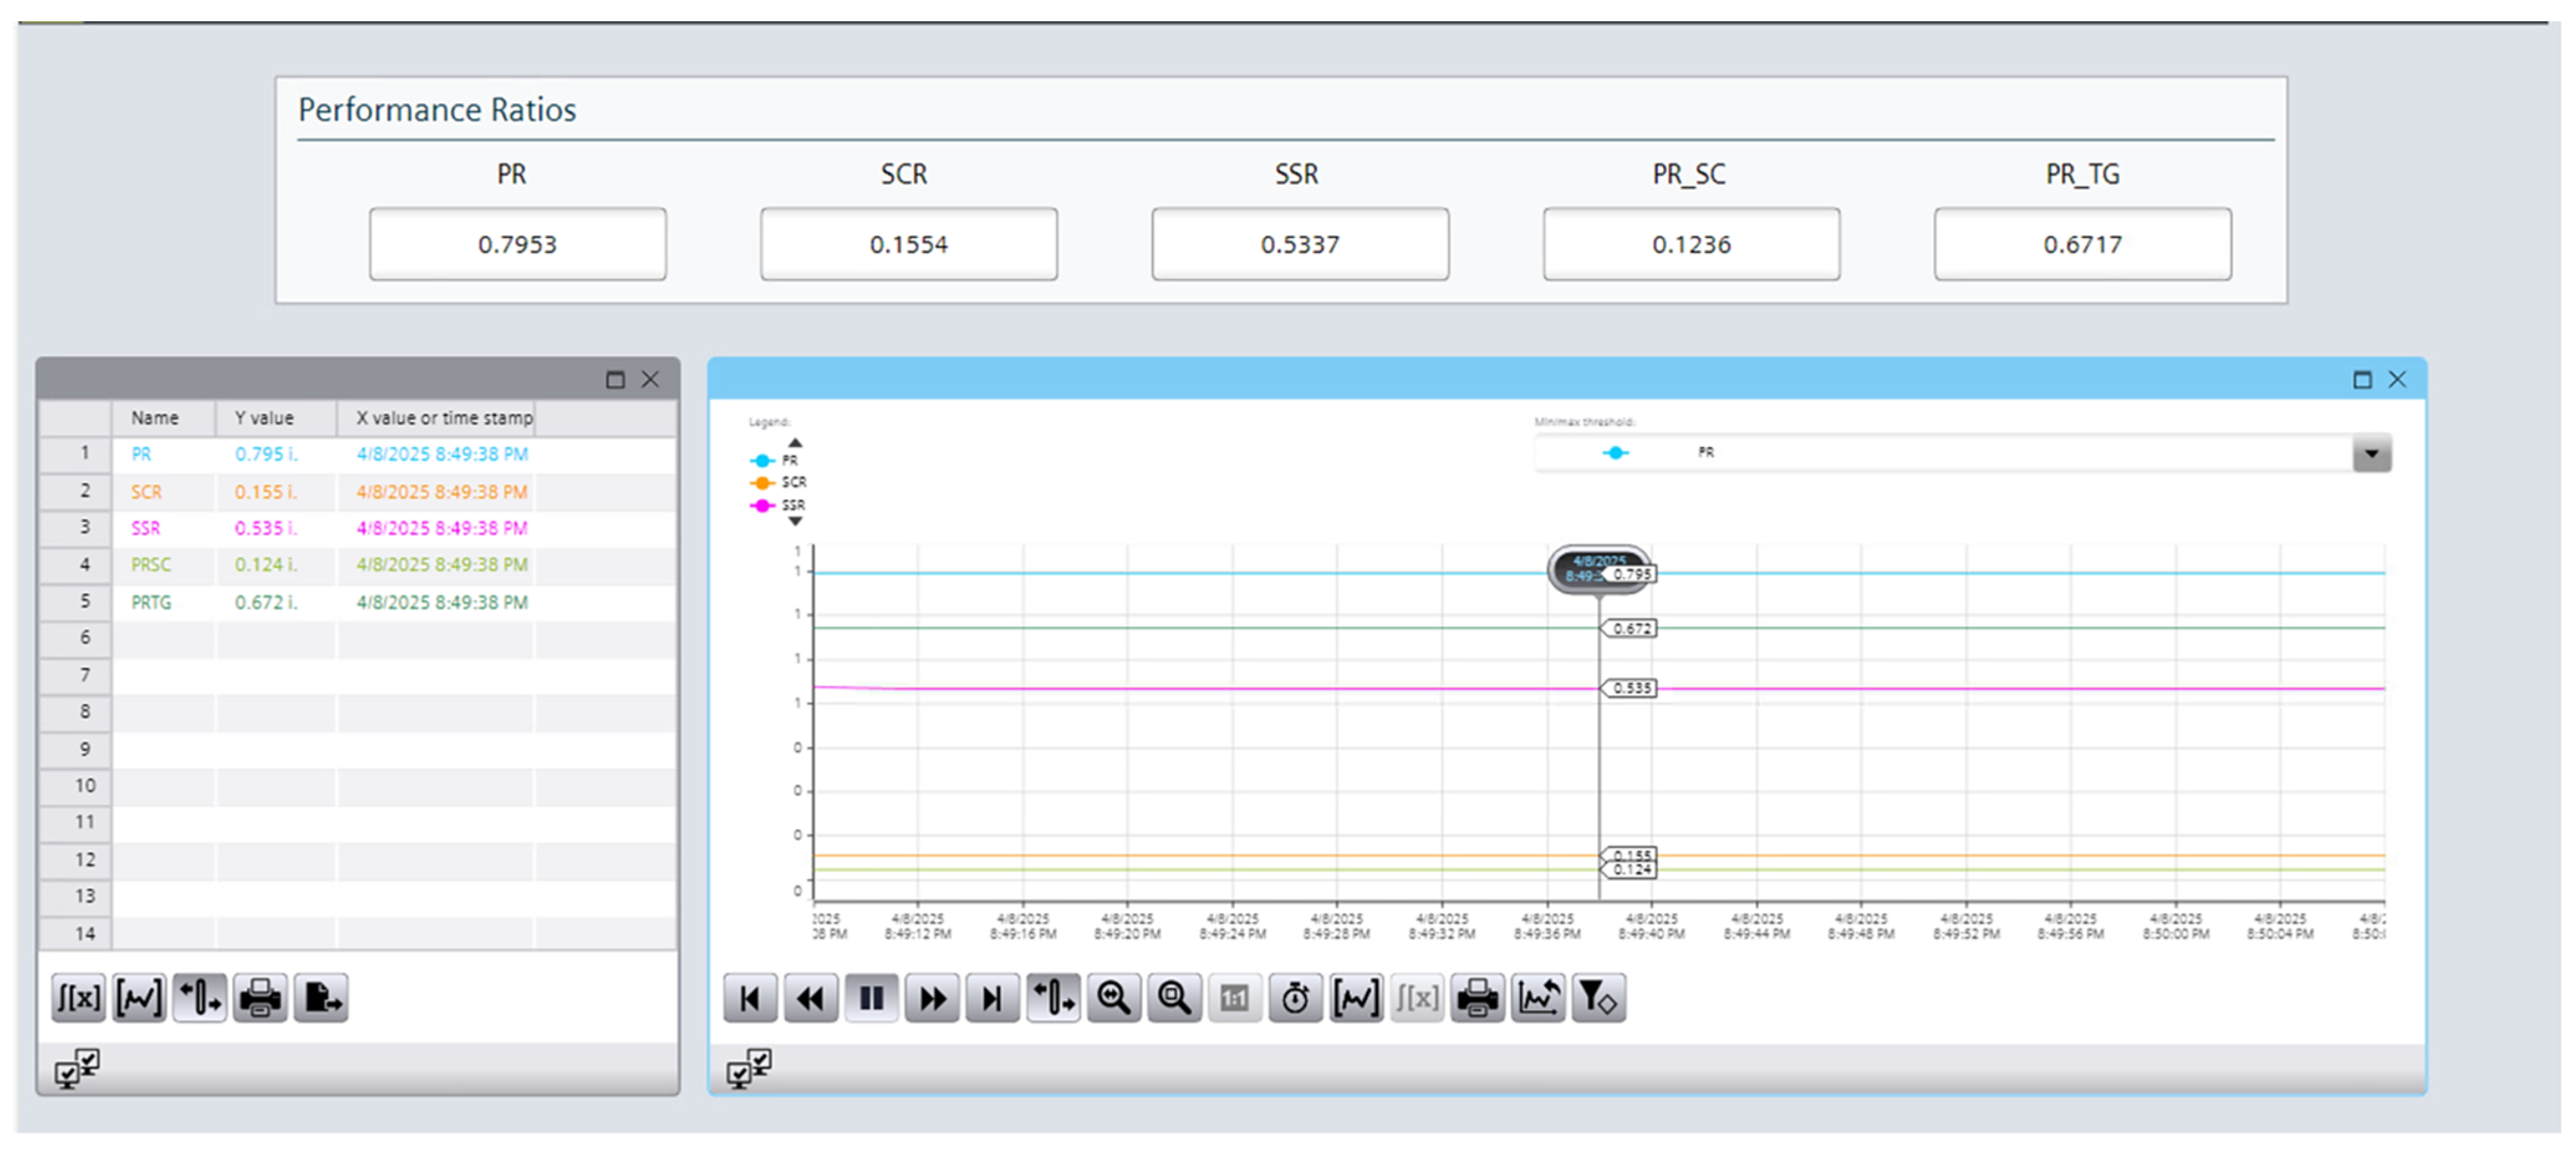
The “Performance Ratios” screen is designed to give a detailed view of the overall efficiency and energy utilization structure of the PV system, using the same clear and functional layout as the previous screens,
Figure 15. It features a Variable Watch Table and a corresponding trend control chart, both focusing on normalized performance indicators that provide insights beyond raw energy values. The monitored parameters include PR—total Performance Ratio, indicating overall system efficiency relative to ideal conditions, SCR—self-consumption ratio, SSR—self-sufficiency ratio, PR_SC—performance ratio specific to the self-consumed energy, PR_TG—performance ratio of the energy exported to the grid.
The Variable Watch Table presents the current values of these performance ratios along with timestamps, offering a real-time snapshot of how effectively the PV system is operating in both self-consumption and grid-feed modes. This is especially important for installations focused on maximizing local energy use or optimizing export strategies. The Trend Control provides time-based visualization of how these performance ratios vary throughout the day or over longer periods. This enables operators to detect patterns such as decreasing self-sufficiency during cloudy seasons, improving PR_SC with system tuning, or discrepancies between expected and actual PR_TG due to inverter or export limitations.
The general “Trend Control” screen serves as a centralized, flexible monitoring interface where operators can view and compare all key PV system variables—ranging from raw measurements to calculated performance indicators—within a unified Trend Control and Variable Watch Table layout,
Figure 16. Unlike the specialized screens that focus on grouped parameter categories, this screen allows users to customize which tags are displayed, offering complete freedom to select any combination of variables based on the current diagnostic or analytical need.
This dual visualization, tabular and graphical, not only improves readability but also supports efficient diagnostics and decision-making. By combining real-time and historical data on a single screen, operators can understand how actual system behavior aligns with expectations, identify performance trends, and take timely corrective actions if necessary. The screen structure is designed for clarity and accessibility, making it an essential tool for both routine supervision and in-depth performance analysis of the photovoltaic installation. All displayed data can be instantly archived using dedicated buttons.
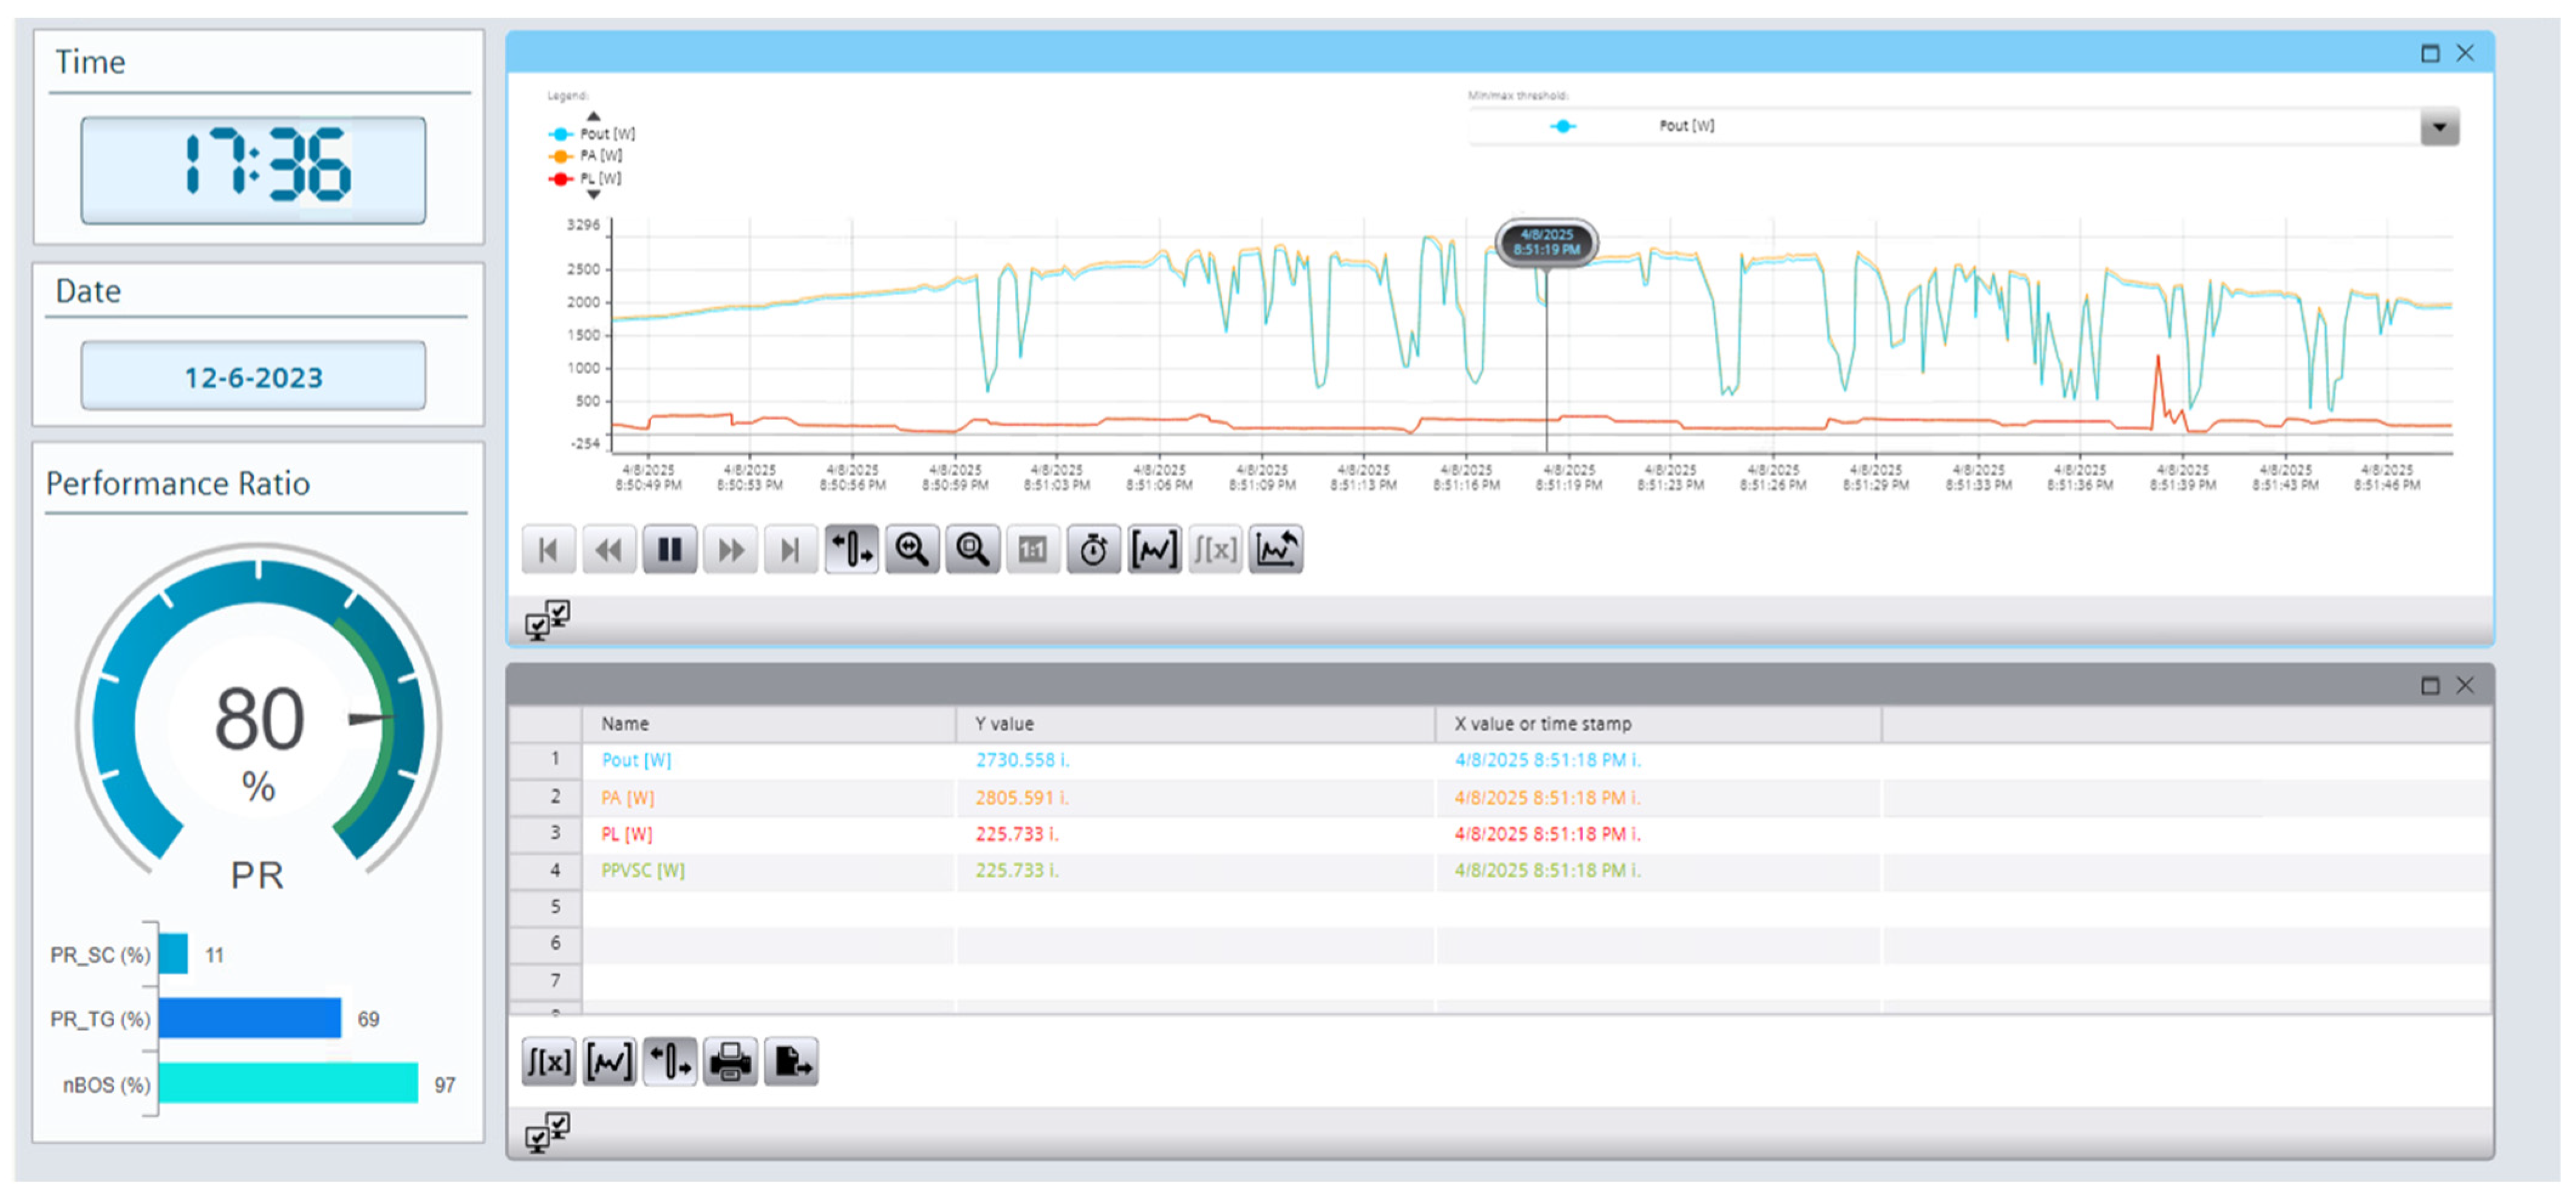
This SCADA dashboard is not just eye-pleasing, it is built for performance. It displays 21 essential KPIs alongside the current date and time, all in a clean, single-screen layout with a 0.1 s live-data refresh. At the center of the interface, the System Performance Ratio (PR) is emphasized through a large radial gauge visualization, making it the immediate focal point. This design choice is not just aesthetic; it provides instant insight into overall system efficiency without requiring interpretation of numbers or navigation through tabs. By drawing the operator’s attention to the most critical performance indicator in real time, the gauge enables faster decision-making, quicker anomaly detection, and more efficient response times. The result is a dashboard that minimizes downtime, boosts situational awareness, and significantly reduces cognitive load during monitoring.
3.2. Comparative Benchmarking of Diagnostic Speed (MTTD)
To substantiate the claims of improvement, this study moved beyond descriptive analysis to provide a quantitative benchmark of the proposed framework. A comparative study was conducted to measure the Mean-Time-to-Detection (MTTD) for critical anomalies, benchmarking our HMI against a standard interface limited to conventional iec 61724-1 parameters. To ensure the statistical reliability of these findings, a total of 20 trials were conducted for each of the three anomaly scenarios. This sample size was deemed sufficient to confirm the consistency of the detection times and to ensure the resulting average MTTD, presented in
Table 6, is a robust and repeatable representation of the HMI’s diagnostic performance. The results were conclusive. For scenarios such as sudden load spikes or the failure of deferrable load activation, events where the PR remains deceptively normal, our proposed HMI provided an immediate and unambiguous diagnosis. Across all tested scenarios, the proposed HMI reduced the MTTD from an average of over 15 min to under 3 min, representing a consistent diagnostic speed improvement of over 80%. The MTTD results are presented in a
Table 6.
It is important to clarify that this percentage represents a relative improvement in diagnostic speed, calculated in relation to the baseline MTTD of the “control case”, that is, the legacy situation of an operator using a standard IEC 61724-1 interface. This is not a change of percentage points, but a relative reduction in time. For example, as shown in Scenario A, the reduction from a ~15 min detection time to a 3 min detection time is a 12 min saving, which constitutes an 80% reduction relative to the 15 min baseline ((15 − 3)/15 = 0.80).
This quantitative evidence validates the core theoretical contribution of this work. The novelty lies not in the reinvention of individual indices like SCR or SSR, which have been discussed in prior literature, but in their synergistic integration into a diagnostic framework that fundamentally shifts the monitoring paradigm from generation efficiency to holistic energy autonomy. This provides a more rigorous characterization of system performance than is possible with conventional metrics alone.
In conclusion, this research has demonstrated through concrete numerical results, that an HMI framework centered on high-resolution energy flow indicators significantly outperforms standard monitoring practices in the rapid detection of critical operational faults. This methodology provides a validated blueprint for next-generation SCADA systems, enabling faster operational responses, optimizing energy self-consumption, and ultimately enhancing the economic and technical performance of integrated PV systems in the built environment.
3.3. Robustness and Uncertainty Analysis
The simulation results, which were derived from the 10,000 h probabilistic study using the methodology and inputs defined in
Section 2.5, confirm the statistical robustness of the indicators. The photovoltaic system’s operational metrics demonstrate consistent and high performance. The system maintains an average Performance Ratio (PR) of 82.33% with a very low standard deviation of only 3.71%, indicating stable efficiency. Similarly, the Balance of System (nBOS) components operate with a consistently high efficiency, averaging 92.66% with a standard deviation of 6.30%.
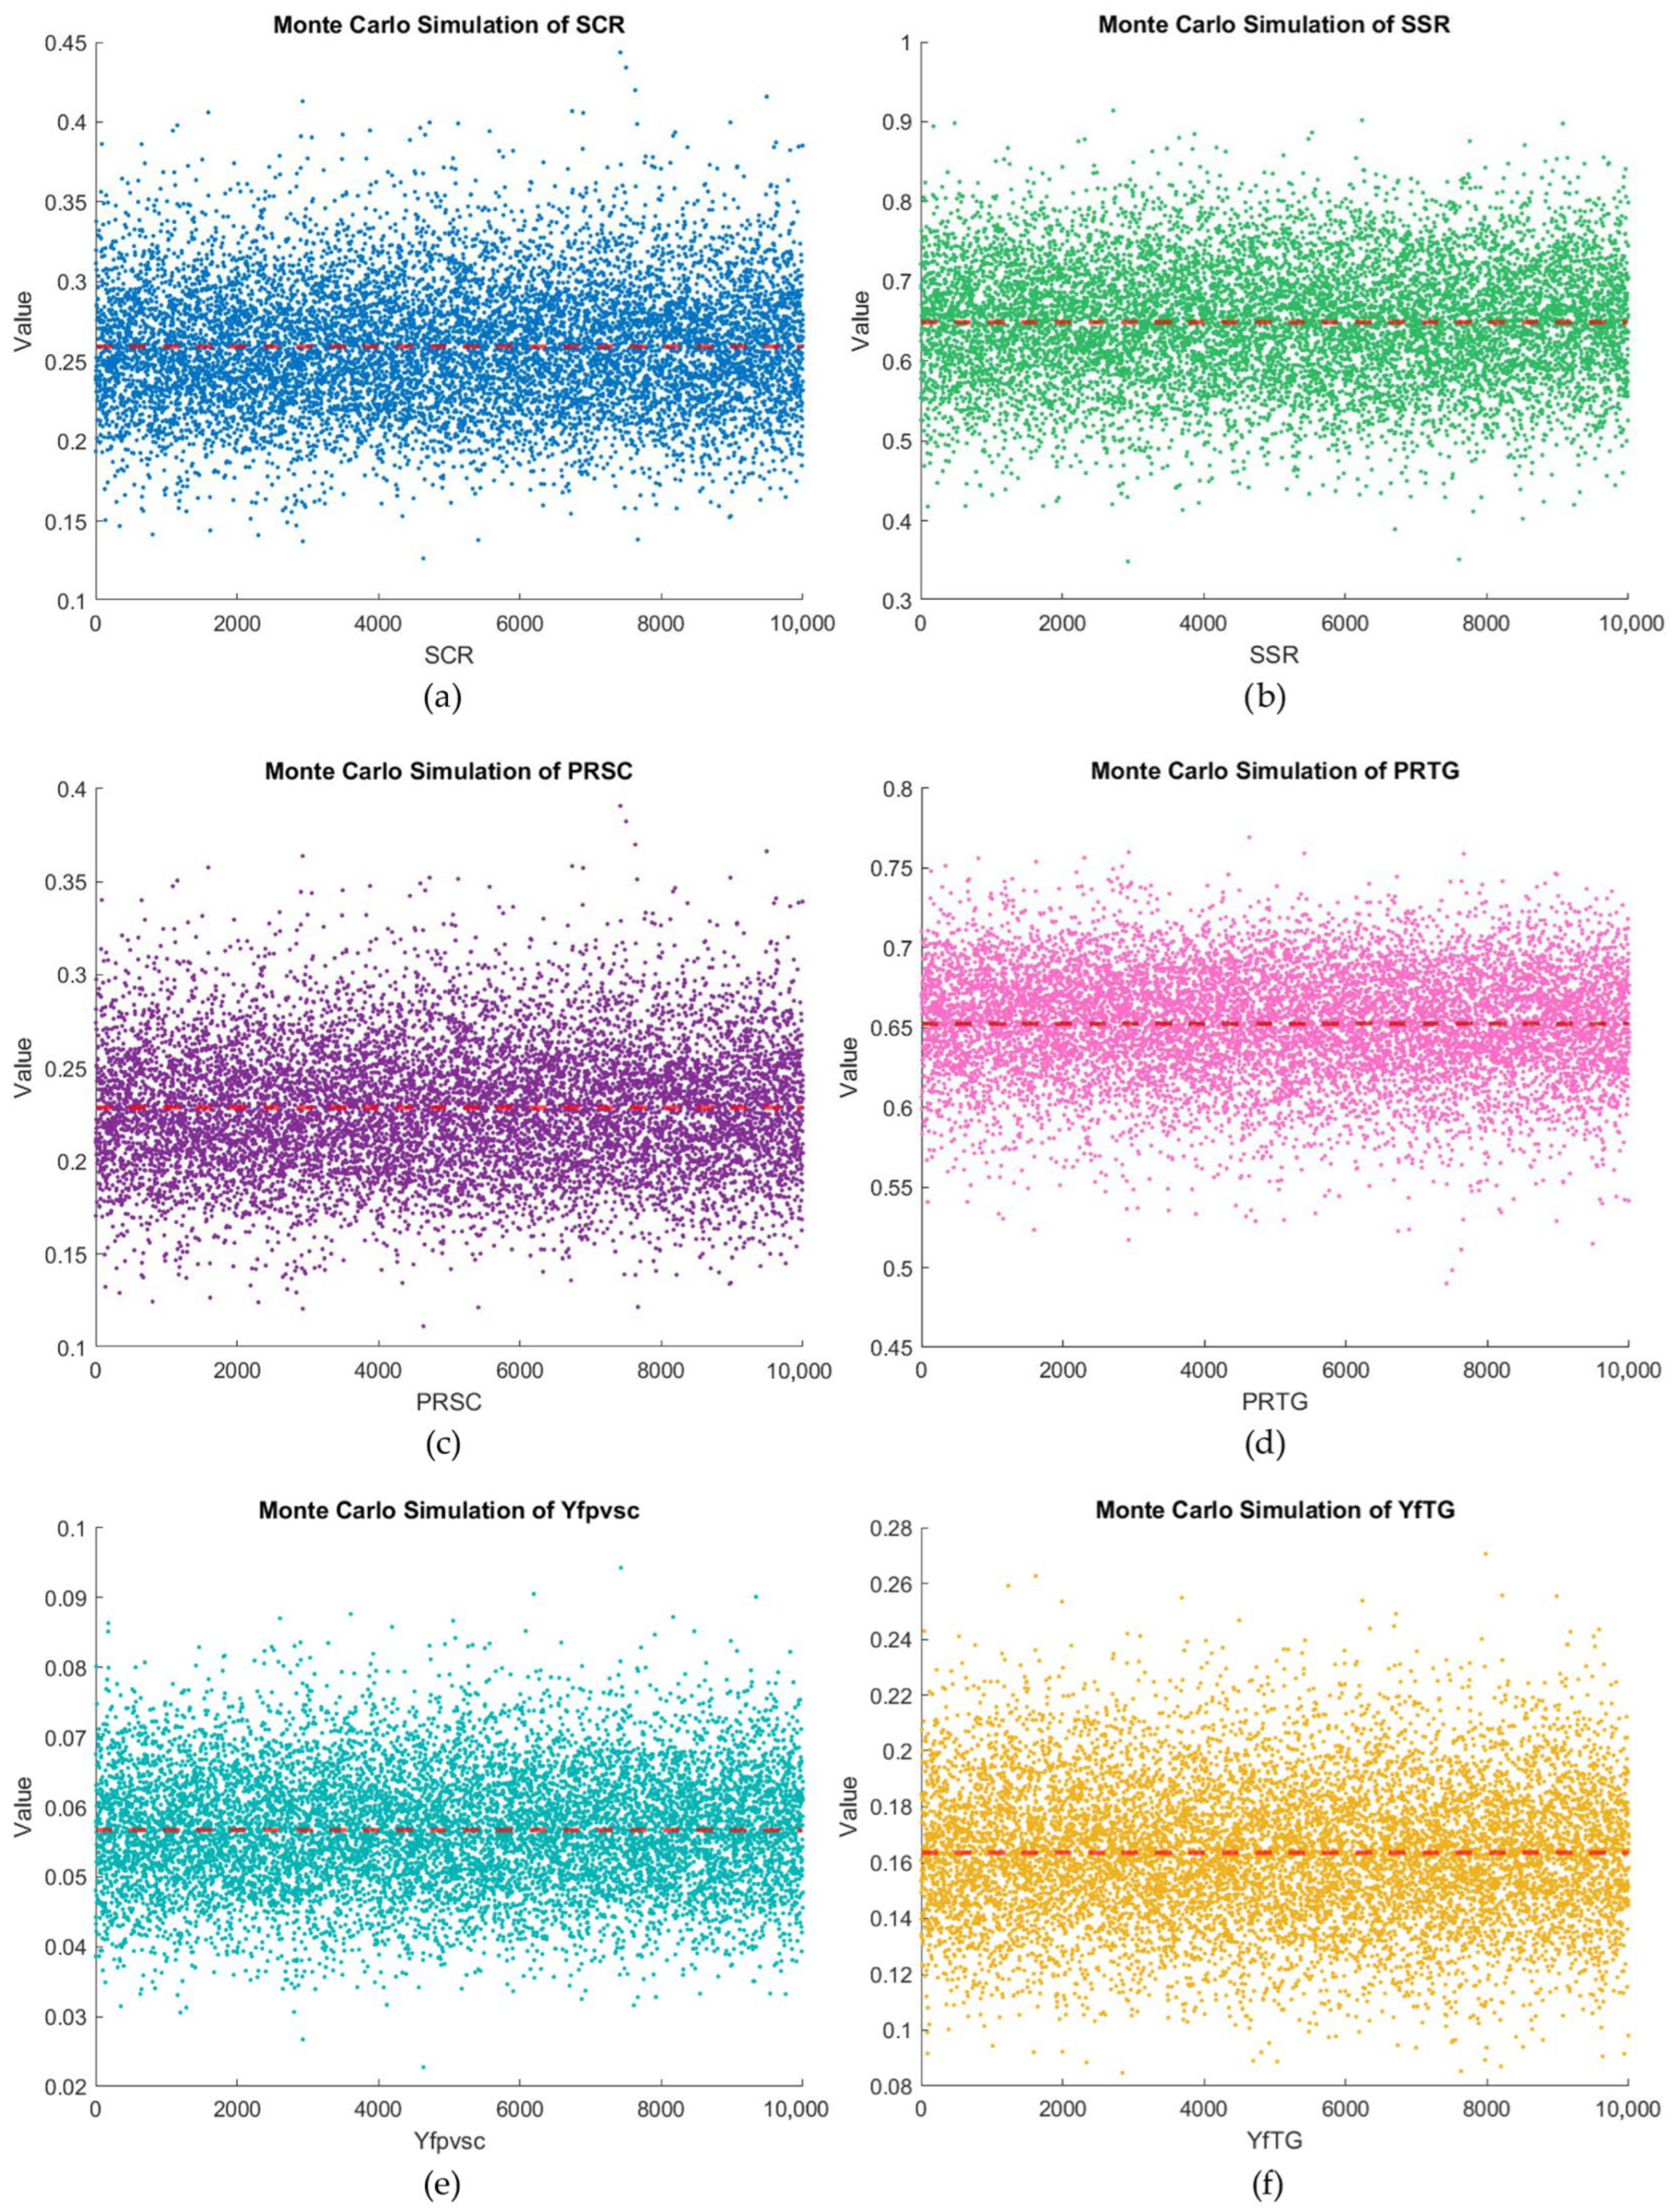
Energy Autonomy Indicators (SCR & SSR),
Figure 17a,b. The core indicators of energy autonomy demonstrated predictable behavior under uncertainty. The Self-Sufficiency Ratio (SSR), with a mean of 0.6497 (65.0%) and a standard deviation of 0.0753 (7.5%), showed a relatively tight distribution. This indicates that the system reliably covers a majority of the building’s load across a wide range of conditions. The Self-Consumption Ratio (SCR) exhibited a mean of 0.2594 (25.9%) with a standard deviation of 0.0395 (4.0%). This lower mean and tight distribution suggest a consistent operational pattern where a specific fraction of PV energy is consumed on-site, with the remainder consistently available for other uses.
Performance Ratio Indicators (PR_SC & PR_TG),
Figure 17c,d. The analysis of the disaggregated Performance Ratios reveals a clear distinction in the performance of the system’s energy pathways. The PR_TG (to grid-exported ratio) is notably high, with a mean of 0.6523 (65.2%). This indicates that the system is highly effective at converting the available solar resource (Reference Yield) into usable energy delivered to the grid during periods of surplus generation. Conversely, the PR_SC (self-consumed ratio) has a lower mean of 0.2285 (22.9%). Critically, both indicators exhibit an identical, low standard deviation of 0.0348 (3.5%). This finding is significant: it demonstrates that while the effectiveness of the two pathways differs, their stability and predictability are equally high. This consistency is fundamental for anomaly detection, as any deviation from these stable baselines can be confidently attributed to an operational fault rather than random noise.
Energy Yields (Y_fPVSC & Y_fTG),
Figure 17e,f. The analysis of the energy yields reveals the system’s typical operational behaviour and its inherent volatility. The average hourly energy exported to the grid (Y_fTG) is the dominant pathway in magnitude, with a mean of 0.1640 Wh⋅W
−1. In contrast, the average hourly self-consumed energy (Y_fPVSC) is substantially lower, with a mean of 0.0569 Wh⋅W
−1. More importantly, the to-grid exported energy is also significantly more volatile, exhibiting a standard deviation of 0.0249, nearly three times that of the self-consumed energy’s standard deviation of 0.0088. This is a critical finding that validates the model’s physical realism: as the residual energy flow, the grid export is subject to the combined stochasticity of both solar generation and on-site load, and the simulation correctly captures its resulting high degree of uncertainty.
This uncertainty analysis allows us to move beyond descriptive conclusions to make statistically valid claims. By analysing the probability distributions, we can establish a confidence interval for expected performance. For instance, based on the SSR distribution, we can state with 80% confidence that the annual Self-Sufficiency Ratio for this system will lie between 55.3% (P90) and 74.6% (P10). This probabilistic approach provides a powerful tool for energy forecasting and risk assessment.
In conclusion, the Monte Carlo analysis confirms that the proposed indicators are not merely descriptive but are statistically robust metrics that reliably characterize system performance under a wide range of operational uncertainties. This rigorous validation strengthens the scientific foundation of our framework and provides the quantitative evidence that our methodology, while demonstrated on a single system, is built on sound principles that are broadly applicable for enhancing the monitoring and diagnostics of integrated PV systems.
4. Discussion
The results obtained demonstrate that the proposed SCADA system not only achieves high-fidelity monitoring of large-scale PV plants but also unlocks advanced capabilities for predictive energy management and preemptive fault detection. Integration of novel parameters—such as the self-consumption ratio (SCR), self-sufficiency ratio (SSR), and dedicated performance ratios for self-consumption (PR_SC) and grid export (PR_TG)—provides a more granular view of energy flows under both self-consumption and export scenarios. This aligns with the working hypothesis that embedding these metrics within a modern SCADA platform would yield actionable insights beyond what IEC 61724-1 [
11] alone can offer.
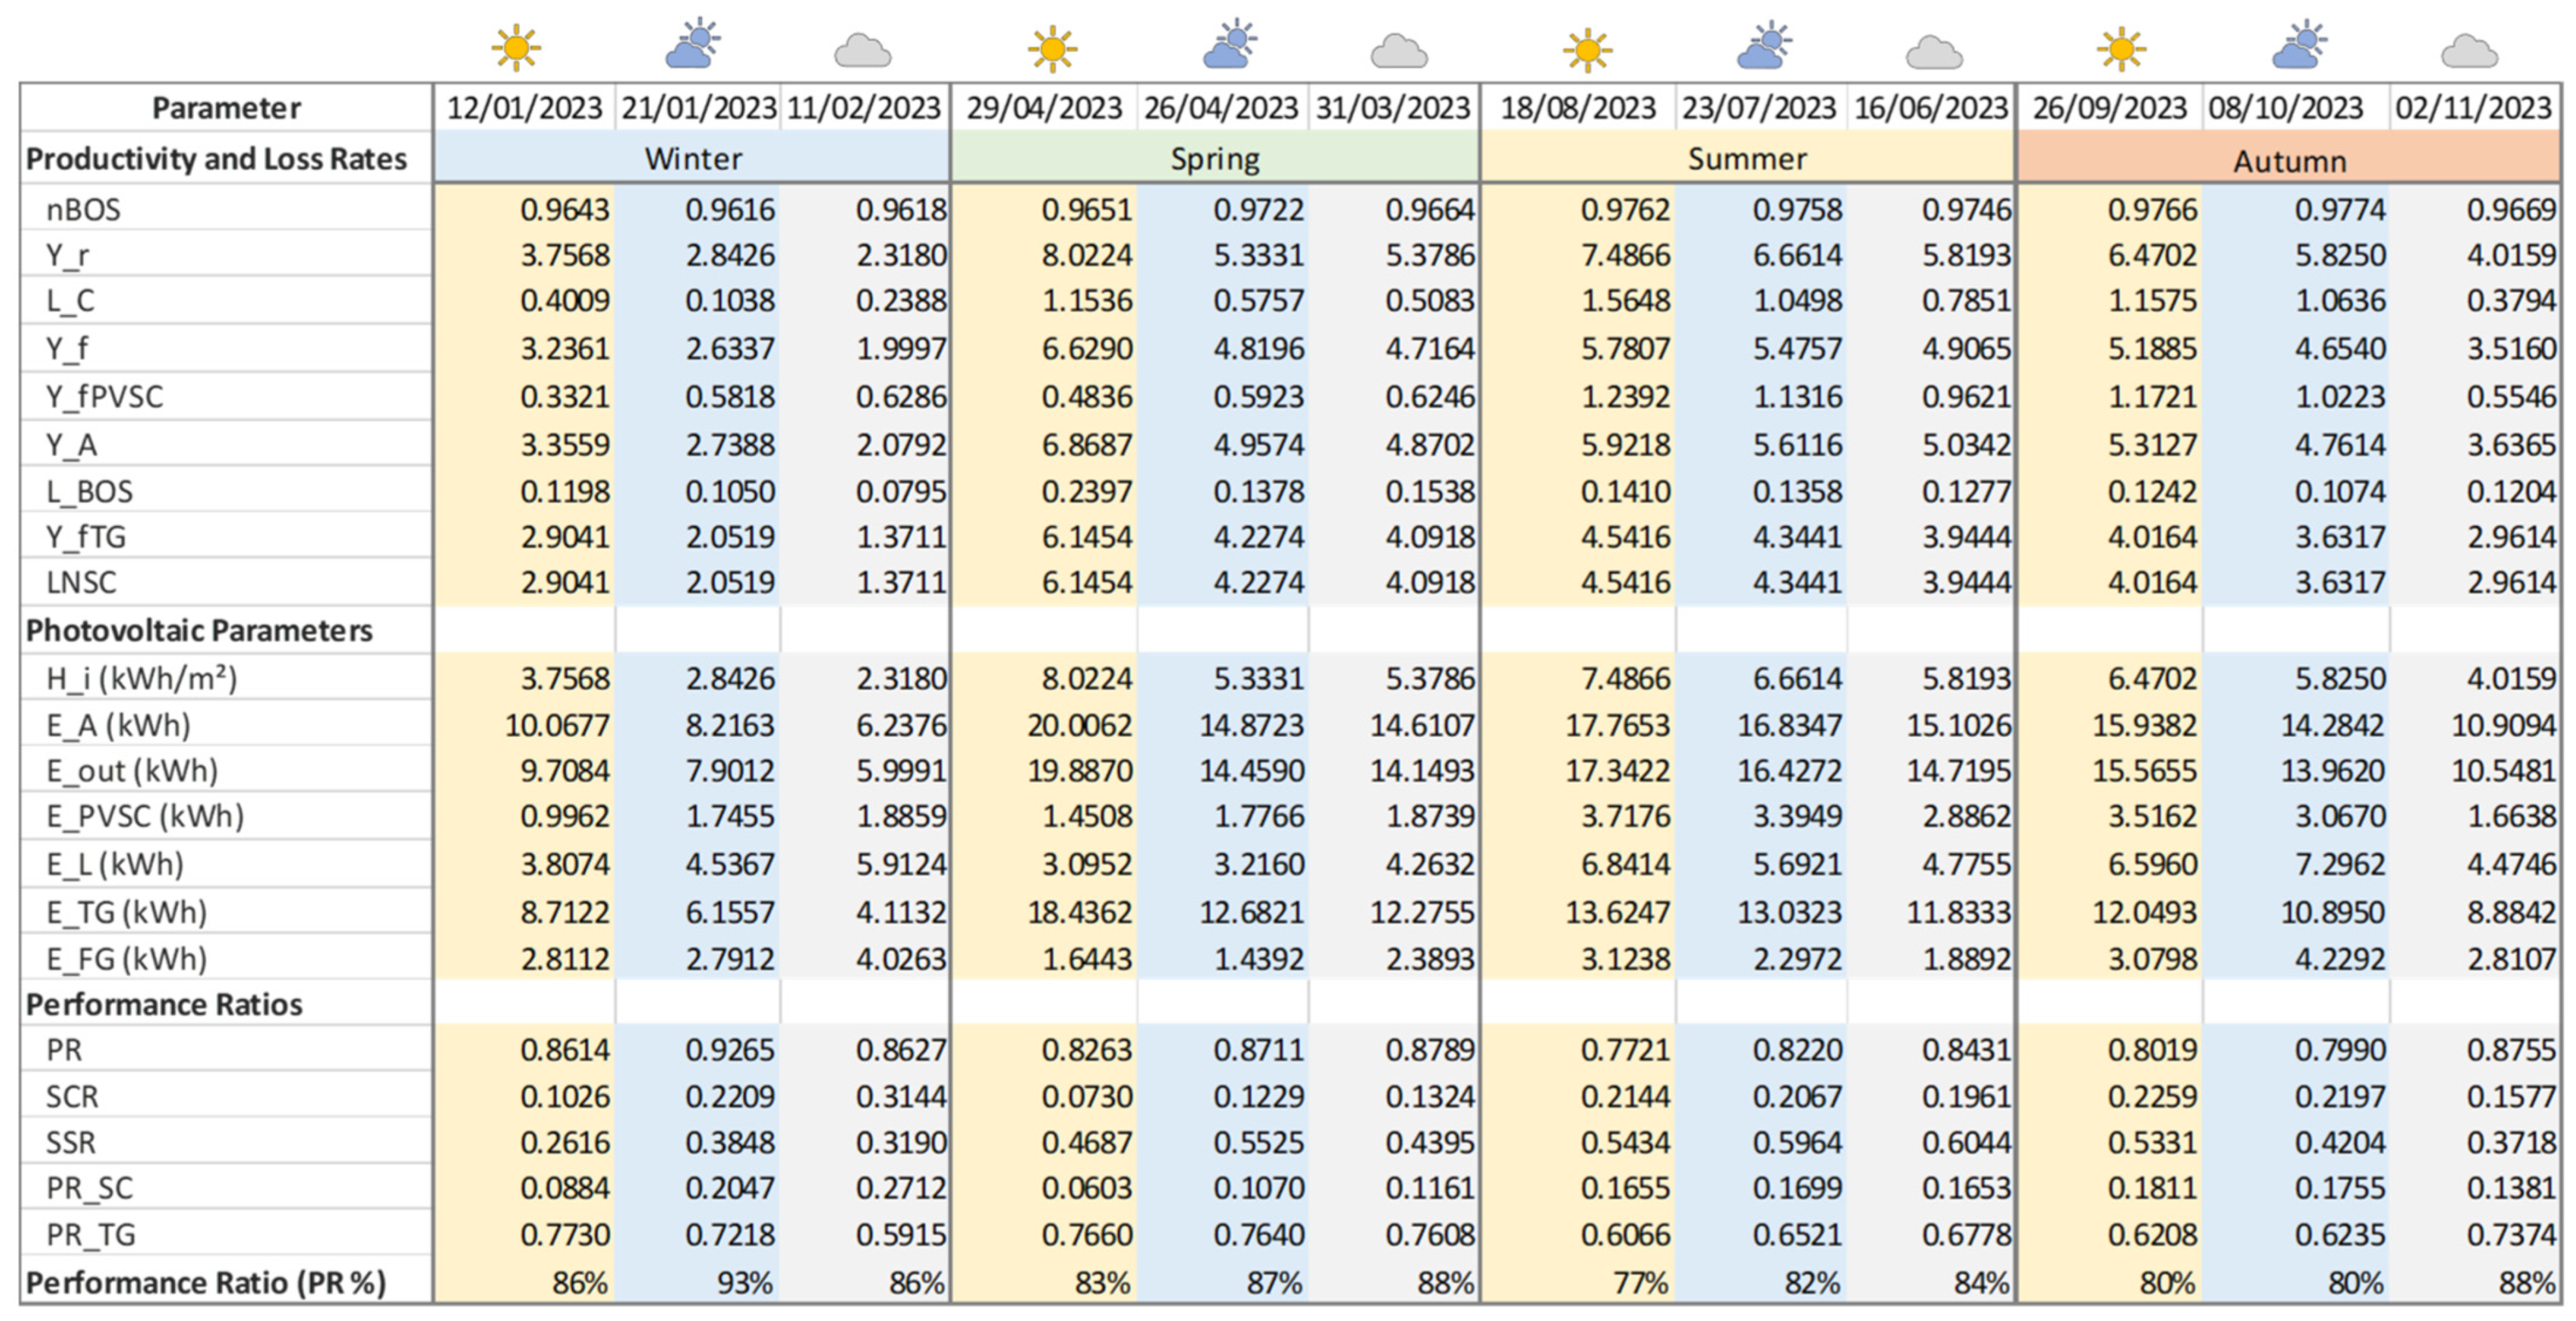
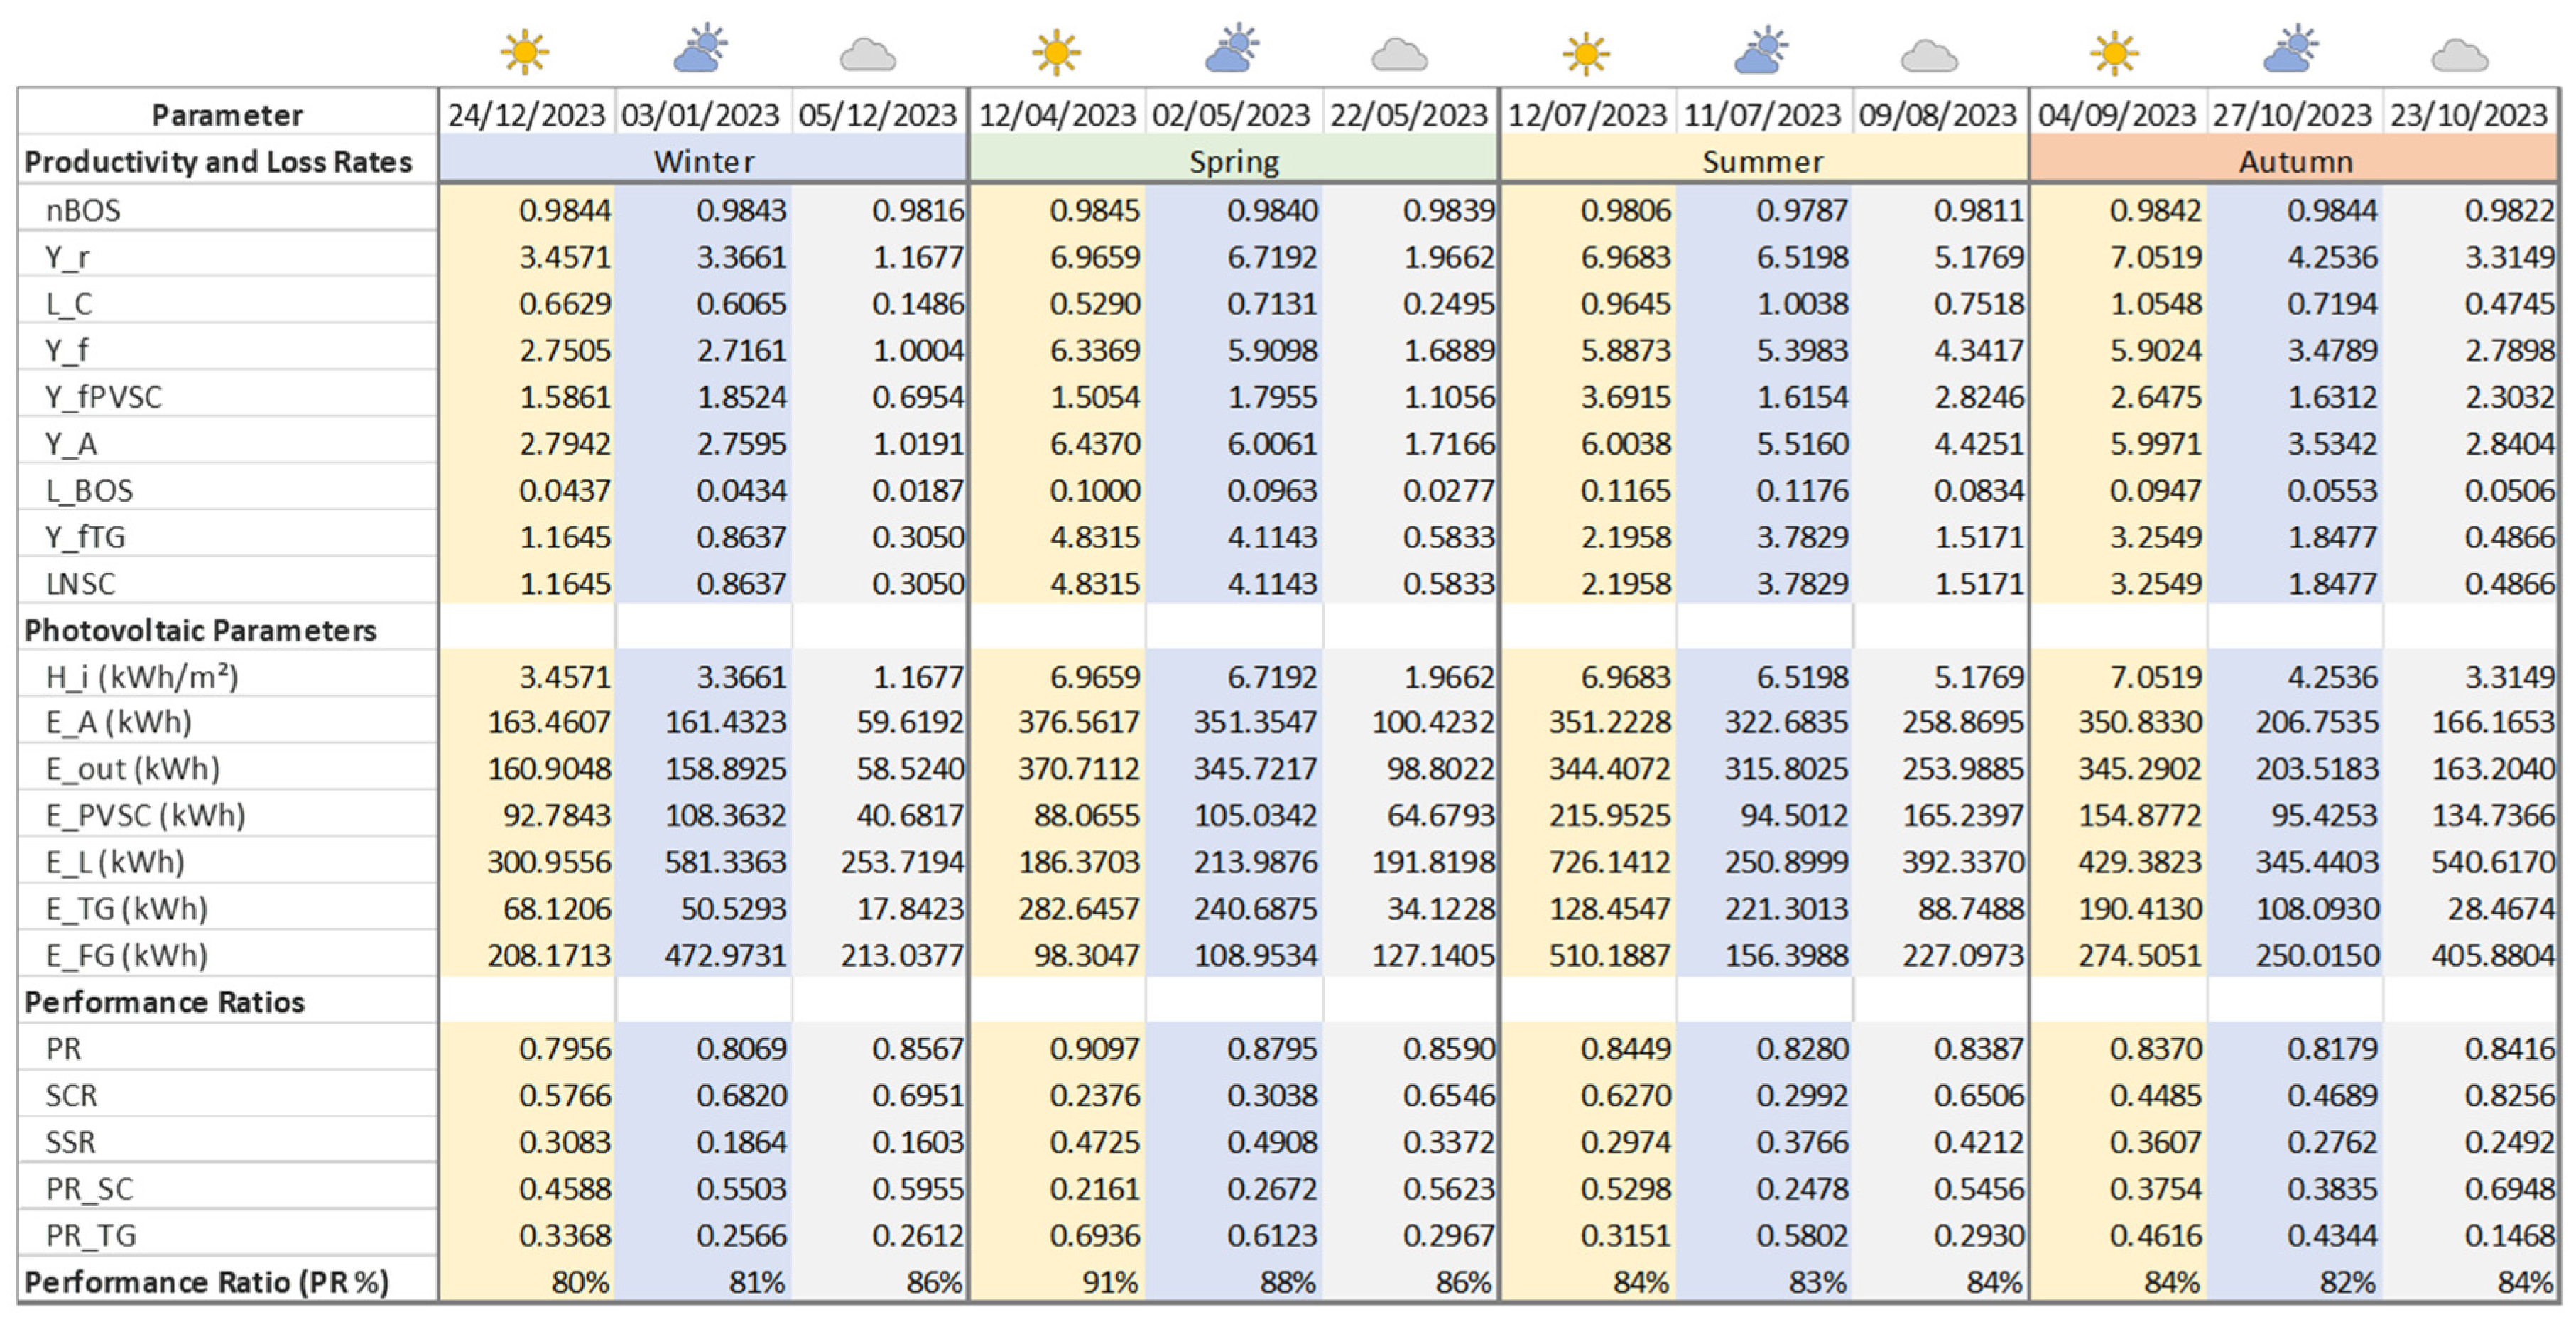
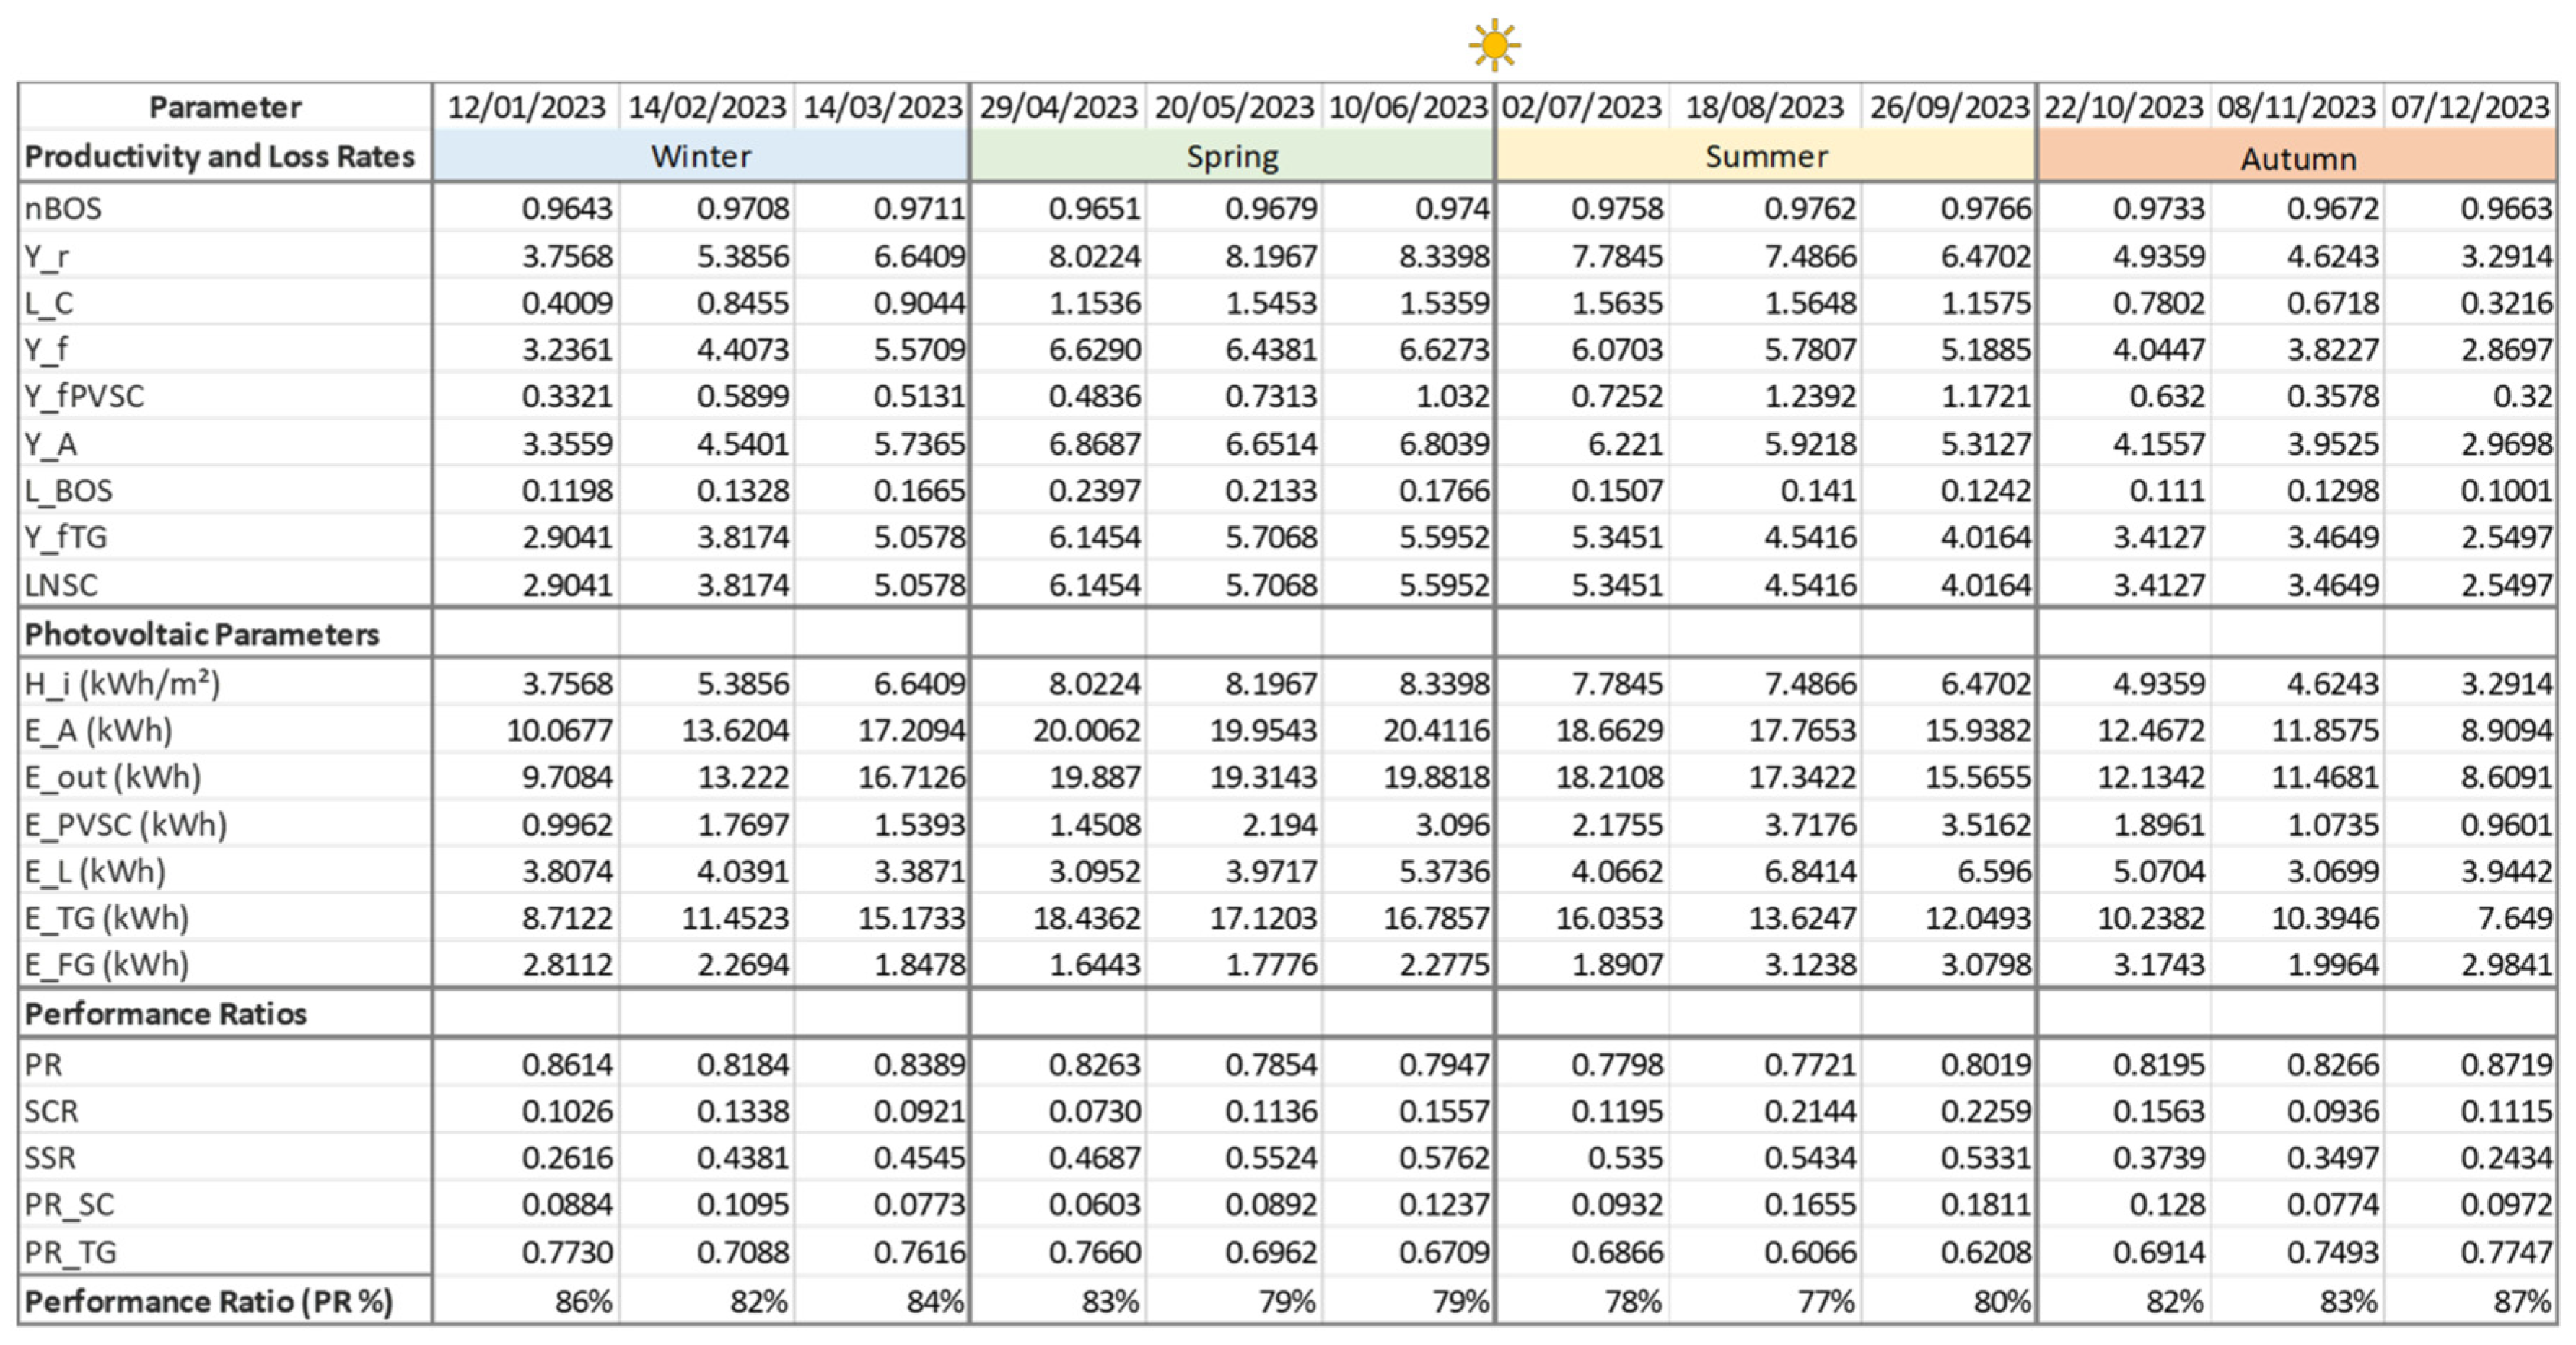
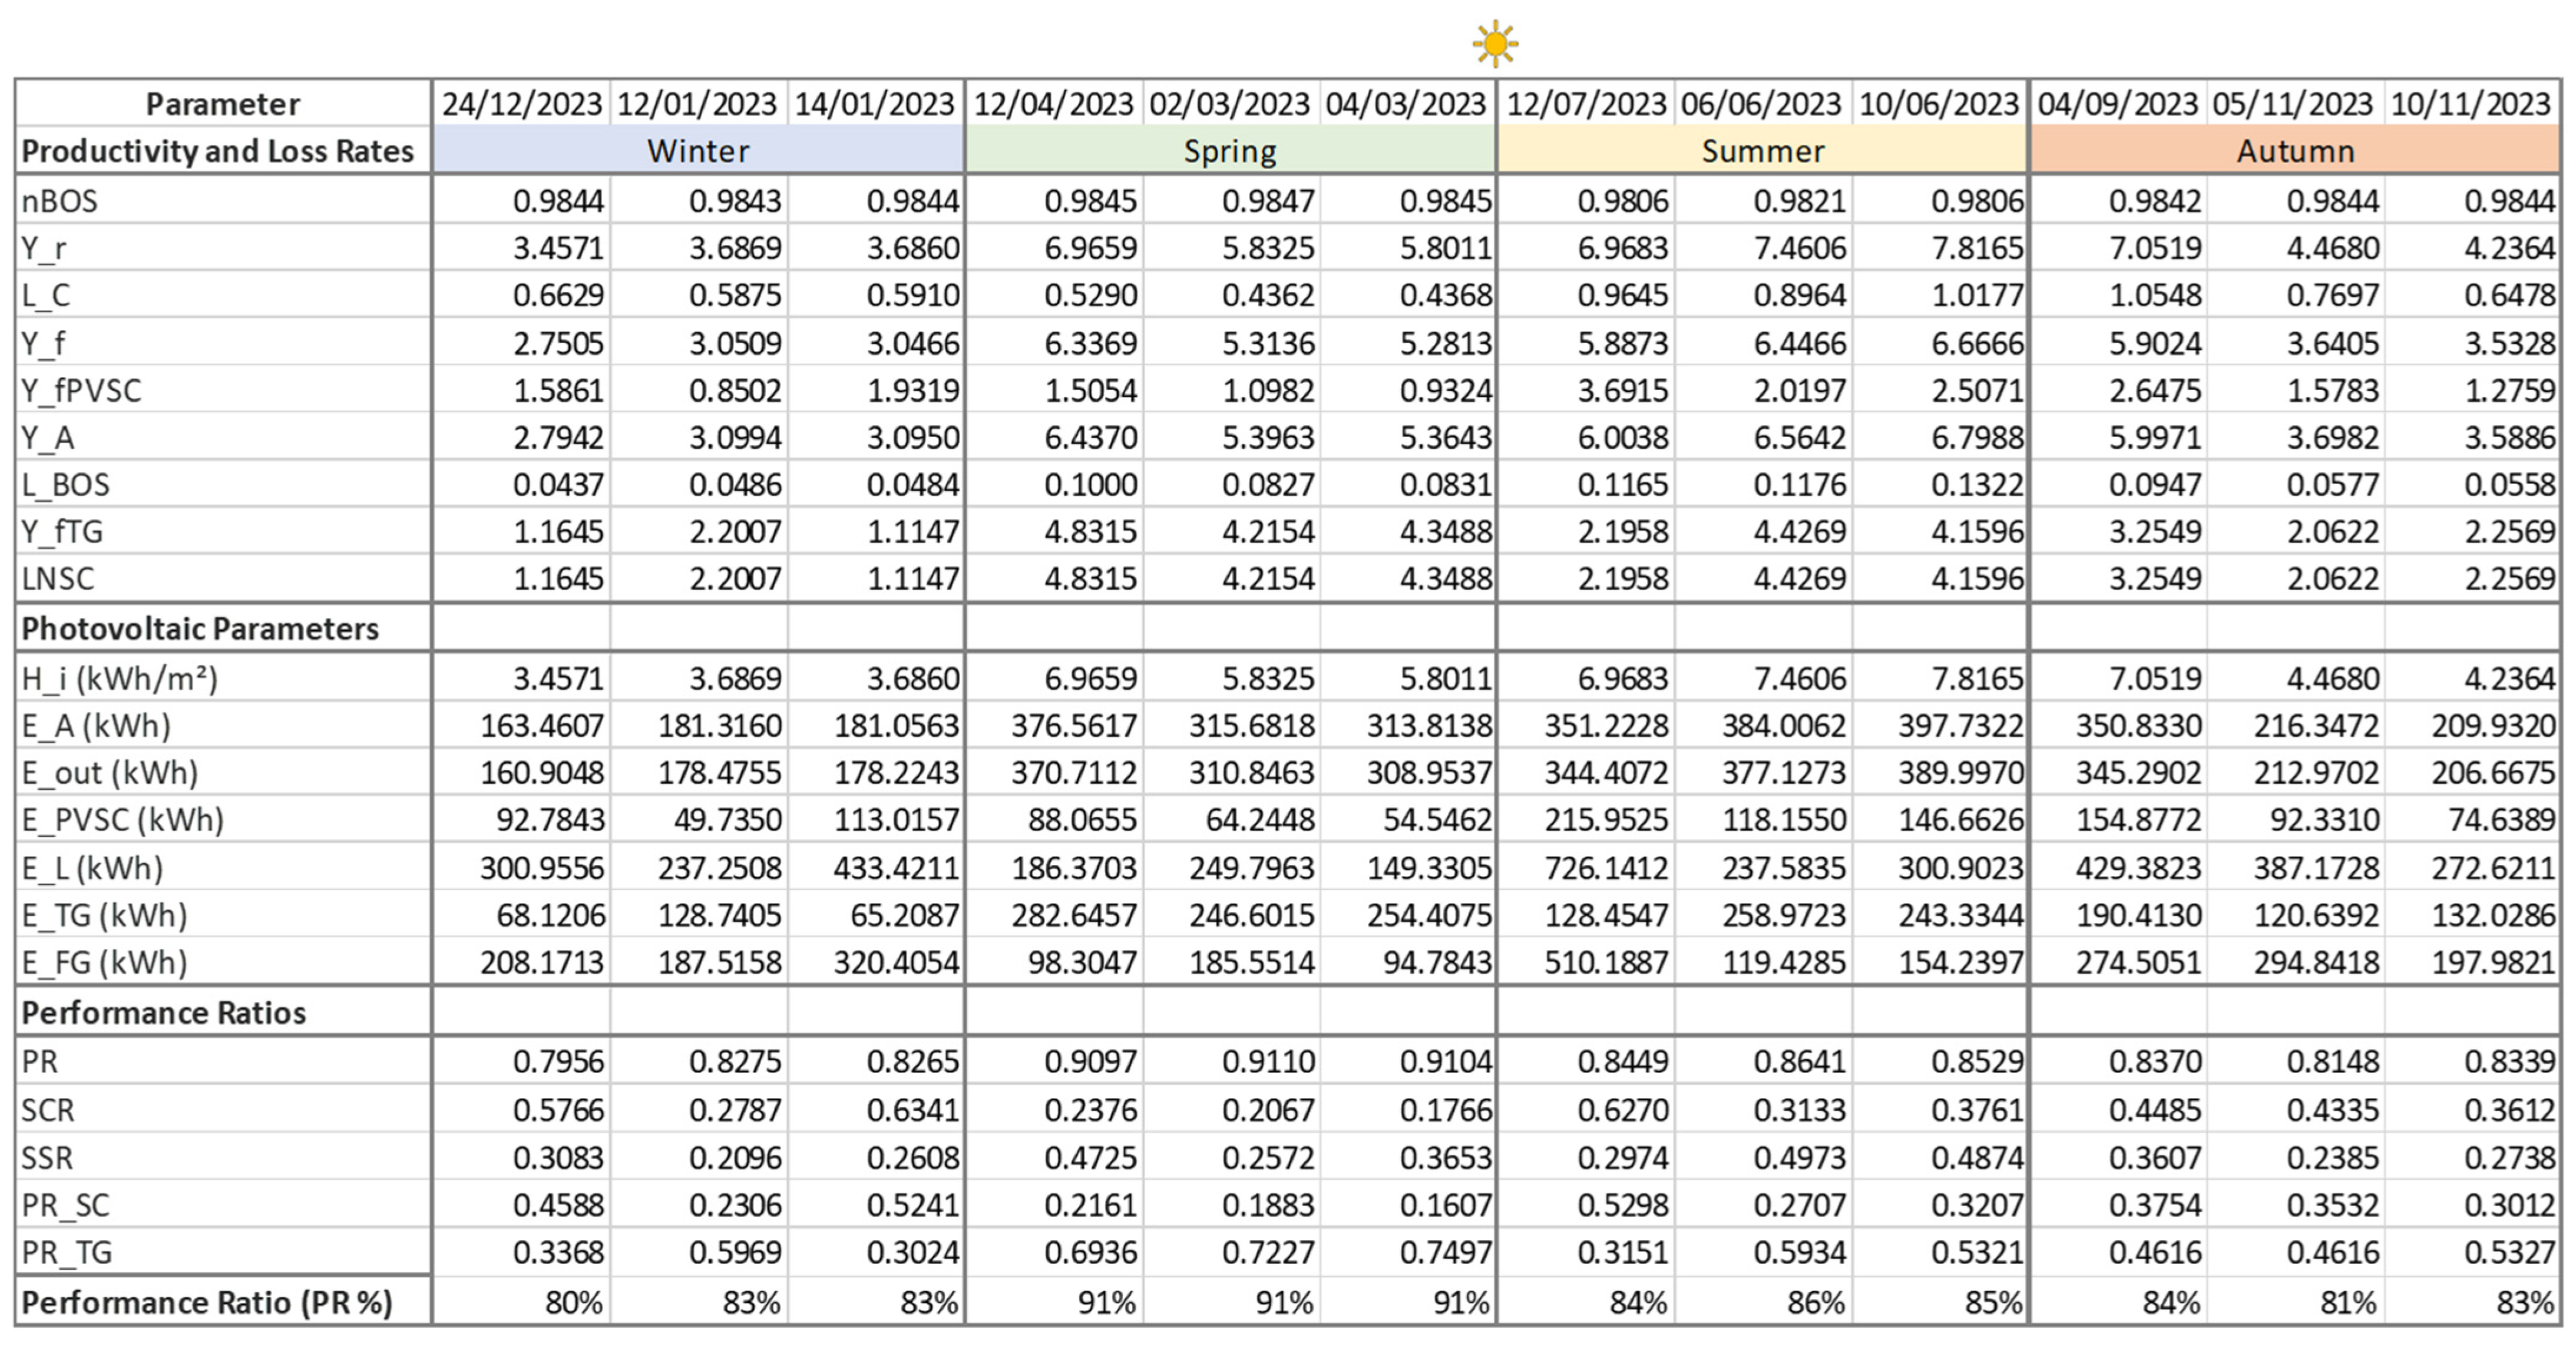
A comprehensive performance analysis for both case studies: Case Study 1–2.97 kW, Building A3; Case Study 2–58.5 kW, Building C3; detailing key SCADA-derived productivity, energy, and efficiency parameters categorized by season and under distinct weather conditions (sunny, partially clouded, and completely clouded), is provided in
Appendix B. Its importance lies in understanding seasonal variations and their impact on PV system performances. This information provides essential insights for optimizing systems operation throughout the year. Operators can adjust strategies for self-consumption, battery storage, or grid export based on expected seasonal variations in energy generation and losses for each system.
Table 7 presents a comparative analysis of the average Performance Ratio (PR), Self-Consumption Ratio (SCR), and Self-Sufficiency Ratio (SSR) for both case studies, with the SCADA-derived values disaggregated by season and under distinct weather conditions (sunny, partially clouded, and completely clouded).
The diagnostic analysis of the 2.97 kW residential-scale system (A3) provides a compelling case study on the framework’s ability to uncover significant operational inefficiencies that would be missed by standard monitoring,
Table 7. While the system’s technical health was confirmed by a solid Performance Ratio (PR) of 84.5%, the SCADA framework revealed a critical operational imbalance: an extremely low Self-Consumption Ratio (SCR) of only 18.22% alongside a moderate Self-Sufficiency Ratio (SSR) of 45.8%. This quantitative signature identifies a severe temporal mismatch between PV generation and on-site load, indicating that over 80% of the clean energy produced is exported to the grid, representing a substantial loss of potential value. This data-driven insight led to a re-prioritization of improvement strategies, with the primary and most immediate recommendation being the implementation of aggressive load-shifting to address the low SCR. As a secondary strategy, the data now provides a strong business case for evaluating the addition of a Battery Energy Storage System (BESS) to capture the significant energy surplus, a step that should be considered before any potential system expansion. This process demonstrates the framework’s crucial diagnostic capability, transforming what appears to be a technically healthy system into a clear opportunity for significant economic and operational optimization.
The analysis of the 58.5 kW commercial-scale system (C3) demonstrates the framework’s ability to diagnose the strategic mismatch between generation and a high-demand load profile,
Table 7. While the system exhibits excellent technical health, confirmed by a strong Performance Ratio (PR) of 84.3%, its energy flow indicators reveal a surprising operational reality. A healthy Self-Consumption Ratio (SCR) of 53.91% is starkly contrasted by a very low Self-Sufficiency Ratio (SSR) of only 32.81%. This quantitative signature definitively characterizes the installation as technically sound but significantly undersized for an energy-intensive facility, capable of covering less than a third of its total demand. This data-driven insight immediately clarifies the primary strategic imperative: a significant expansion of the PV generation capacity is the most impactful, and likely only, path toward meaningful energy independence for this building. This case study highlights the framework’s strategic value, moving beyond simple performance monitoring to provide the unambiguous, quantitative evidence needed to guide major capital investment decisions and correctly prioritize asset management strategies.
Table 8 focuses specifically on sunny days, which represent the maximum potential generation scenario for the PV systems. It is crucial for identifying trends, setting benchmarks, and assessing long-term system degradation. This table is essential for long-term system evaluation. By analyzing sunny days, operators can determine whether losses are seasonal or due to system degradation. It also helps adjust predictive models for energy production, leading to better integration with smart grids and demand-response strategies.
The clear-sky day analysis for the 2.97 kW residential-scale system (A3) provides a critical baseline of its maximum operational potential and dramatically reinforces the primary diagnosis of a severe temporal mismatch between generation and on-site load,
Table 8. Under these ideal irradiance conditions, the Self-Consumption Ratio (SCR) plummets to a mere 13.27%, significantly lower than the annual average, indicating that on its most productive days, nearly 90% of the generated energy is exported as surplus. Simultaneously, the Self-Sufficiency Ratio (SSR) remains moderate at 44.42%, confirming that even under optimal conditions, the system is fundamentally undersized for the building’s total 24 h energy demand. The system’s technical health is confirmed by a solid Performance Ratio (PR) of 81.64%, which remains high and stable, isolating the issue as one of energy utilization, not generation efficiency. This new insight adds a layer of urgency to the strategic recommendations, framing aggressive load-shifting and the evaluation of a Battery Energy Storage System (BESS) as essential measures to capture this significant, otherwise wasted, energy potential.
The clear-sky day analysis for the 58.5 kW commercial-scale system (C3) provides a definitive baseline of its maximum operational potential and reinforces the primary diagnosis of a significant mismatch between generation and load,
Table 8. Under these ideal irradiance conditions, the system demonstrates excellent technical health, achieving a Performance Ratio (PR) of 85.24%, slightly higher than its seasonal annual average and confirming the high quality of the installation. However, the energy flow indicators reveal a critical new insight: on these most productive days, the Self-Consumption Ratio (SCR) plummets to 38.92%, a sharp drop from the season’s annual average (53.91%). This confirms that while the system is drastically undersized for the building’s total annual energy needs (as shown by a consistently low SSR of 33.57%), it paradoxically generates a massive, unutilized energy surplus on sunny days. This finding makes the strategic case for intervention even more compelling, highlighting that any future expansion of the PV array must be preceded or accompanied by measures to absorb this surplus, such as the integration of a Battery Energy Storage System (BESS) or the electrification of new loads from other university’s buildings, to prevent the exacerbation of energy wastage.
Daily SCADA analysis plays a crucial role in predictive maintenance, allowing operators to detect early signs of performance degradation, such as a declining Performance Ratio (PR) or increasing system losses (LC, LBOS, LNSC). Identifying these trends in advance prevents unexpected failures, reduces downtime, and extends the lifespan of photovoltaic (PV) components. Additionally, SCADA-based monitoring optimizes energy distribution by analyzing how much energy is self-consumed (E_PVSC) versus exported to the grid (E_TG). This information enables operators to implement load-shifting strategies, ensuring that self-consumption is maximized and surplus energy is efficiently managed. Furthermore, economic planning benefits significantly from SCADA data analysis. By examining seasonal and monthly trends in energy generation (H_i, Y_f, Y_fTG) and self-consumption metrics (SCR, SSR), operators can accurately predict revenue fluctuations and optimize energy sales agreements, leading to better financial stability and improved return on investment.
In particular, our simulation studies within Plant Simulation by Siemens confirmed that accurate real-time acquisition of electrical and meteorological data enables the intelligent algorithms to forecast daily generation.
WinCC Unified brings a modern, web-based SCADA solution to PV plant monitoring by combining responsive HTML5 visualization with an open, extensible architecture-native OPC UA and REST API support make it effortless to integrate all desired parameters like while built-in cloud and edge connectivity ensures low-latency control loops and scalable data storage; additionally, its unified engineering environment accelerates project rollout and standardization across sites, and comprehensive diagnostics, role-based access control and encrypted communications safeguard both system uptime and data integrity. This can substantially reduce downtime and maintenance costs, highlighting the practical implications for plant operators and maintenance teams.
It is important to also acknowledge the limitations and future trajectory of this work. The current framework excels at accelerated fault diagnosis (reducing MTTD) but does not yet extend to prognostics (predicting Remaining Useful Life). This, however, represents the clear next step: the high-resolution, real-time data and seasonal baselines established here are the essential foundations for developing predictive maintenance models. Future work will focus on feeding this data into machine learning algorithms to predict soiling, degradation, and incipient faults before they occur. In terms of scalability and smart grid integration, the use of a standards-based industrial platform makes the framework inherently scalable. Its ability to provide accurate, real-time SCR and SSR data is a critical enabler for future demand-response programs, distributed energy resource management, and providing ancillary services to the grid.
The framework’s implications also extend directly to the system’s economic performance. The 80% reduction in MTTD translates to a quantifiable decrease in energy yield losses by minimizing the time faults go undetected, providing a direct, positive financial impact by maximizing revenue. Moreover, the granular, real-world analysis of SCR and SSR, as demonstrated in the case studies, moves beyond technical metrics to provide the essential business intelligence for asset managers. This data-driven insight validates high-stakes capital expenditure decisions, such as sizing and justifying a BESS or prioritizing system expansion, thereby optimizing the asset’s overall return on investment (ROI).
Looking ahead, future research should explore the integration of machine-learning models for anomaly classification, the inclusion of energy storage dynamics into the SCADA framework, and the evaluation of cybersecurity measures for protecting remote monitoring infrastructures. Field validation across diverse climatic zones and grid configurations will also be crucial to generalize the system’s robustness. Altogether, this work lays a foundation for intelligent, standardized monitoring solutions that address the evolving demands of smart grids and distributed generation.
5. Conclusions
SCADA systems are the unsung backbone of modern industrial and energy infrastructures, quietly knitting together sensors, controllers and operators into a single, real-time command and control network. They turn raw field data: temperatures, pressures, currents into actionable insights, automate safety-critical processes, and give engineers the power to spot issues and optimize performance from anywhere. Without SCADA, we’d be flying blind: maintenance would be reactive, outages longer, and overall efficiency would decrease. In short, SCADA is what makes large-scale systems reliable, scalable and responsive to both everyday needs and unexpected events.
This work has presented a validated industrial SCADA framework for the accelerated fault diagnosis of PV systems. By integrating advanced indicators such as SCR, SSR, PRSC, and PRTG, this work moves beyond the standard IEC 61724-1 framework, offering a more complete view of system behaviour under various energy management scenarios. This granular analysis, which includes disaggregating performance by season and weather conditions, provides practical insights for optimizing energy dispatch, load-shifting, and long-term planning.
From a practical engineering perspective, the validated framework presented here serves as a scalable blueprint. As it is built upon a widely adopted industrial platform (Siemens), its diagnostic logic and HMI templates can be efficiently reproduced and deployed by asset managers and engineering, procurement, and construction (EPC) firms. This provides a standardized solution to upgrade existing monitoring systems, enabling a direct translation from this study’s findings to tangible improvements in real-world operational intelligence. The practical superiority of this framework over conventional monitoring was quantitatively confirmed. By integrating advanced, disaggregated indicators such as SCR, SSR, PR_SC, and PR_TG, our methodology moves beyond the limitations of the standard IEC 61724-1 framework to offer a more complete view of system behavior. This enhancement was validated in our comparative benchmarking study, which demonstrated a dramatic reduction in Mean-Time-to-Detection (MTTD) for critical energy management failures, consistently improving diagnostic speed by over 80%. This capability for rapid diagnosis, combined with the practical insights offered by the seasonal categorization of energy flow metrics, provides operators with a powerful tool for optimizing energy dispatch, improving load-shifting strategies, and making more informed long-term planning decisions.
This work has successfully demonstrated the diagnostic superiority of a high-speed, validated SCADA framework. By integrating novel energy-flow indicators (SCR, SSR) with an industrial-grade platform, we have moved beyond standard HMI development to deliver a new diagnostic methodology. The core research contributions are clear: (1) a quantitative MTTD benchmark proved the framework is over 80% faster at diagnosing critical faults that standard IEC 61724-1 monitoring misses; (2) a 10,000 h probabilistic simulation validated the statistical robustness of these indicators; and (3) the case-study analysis demonstrated the framework’s ability to translate this data into actionable, strategic intelligence for real-world asset management. This work, therefore, provides a validated and reproducible blueprint for the next generation of industrial monitoring systems, proving that the integration of high-resolution, diagnostic-focused indicators is essential for enhancing the operational reliability and economic performance of modern PV systems.
Simulation studies have confirmed that combining accurate real-time monitoring with intelligent algorithms opens the door to reliable daily forecasting and proactive energy management. Moreover, the use of WinCC Unified allows for fast deployment, high interoperability, and future scalability. These characteristics are essential for smart grid integration and the digitalization of energy systems.
Ultimately, this SCADA framework is more than just a monitoring tool, it is a foundation for building smarter, more resilient photovoltaic infrastructures. It enables stakeholders to act ahead of problems, optimize system usage, and achieve greater energy independence. Looking forward, this work opens opportunities for further development in machine learning integration, storage analysis, and enhanced cybersecurity for photovoltaic systems.
In a world increasingly shaped by renewable energy, reliable data is power. And with the right systems in place, that power can be fully realized for sustainability, economic resilience, and technological progress.
