1. Introduction
Alzheimer’s disease (AD) is a progressive neurodegenerative disorder that severely affects memory, cognition, and daily living abilities. According to the World Health Organization, over 139 million people will suffer from dementia by 2050, of whom 60–80% will be AD [
1]. Currently, no curative therapies capable of reversing the course of AD have been identified, and only a few medications have shown potential to slow disease progression in its early stages [
2]. This underscores the urgent need for objective biomarkers that can enable early-stage detection. Within this continuum, mild cognitive impairment (MCI) is widely regarded as an intermediate stage between normal aging and AD. Therefore, early detection of AD and MCI is crucial for timely intervention and for delaying disease progression.
Existing diagnostic approaches include clinical neurological and cognitive assessments (e.g., the Mini-Mental State Examination, MMSE; the Montreal Cognitive Assessment, MoCA), fluid biomarker measurements (such as cerebrospinal fluid Aβ and Tau proteins, as well as blood-based biomarkers), and neuroimaging techniques (e.g., magnetic resonance imaging, MRI; positron emission tomography, PET) [
3]. Although these methods demonstrate high accuracy and effectiveness in the clinical diagnosis of AD, they still exhibit several limitations. For example, clinical assessments rely heavily on subjective judgment and lack objective quantification; fluid biomarker measurements are invasive; and neuroimaging techniques are associated with high equipment requirements and substantial examination costs. These factors hinder the feasibility of applying such methods in large-scale population screening and long-term follow-up.
Against this background, electrophysiological methods based on electroencephalography (EEG), which directly reflect changes in brain activity, have attracted increasing attention in recent years and have yielded promising results in the identification of AD and MCI. For example, Rezaee et al. [
4] decomposed EEG signals into sub-bands across two datasets and employed a deep CascadeNet model, achieving classification accuracies of 98.84% and 97.78%, respectively. In addition, Kim et al. [
5] conducted two evaluation tasks—CAUEEG-Dementia and CAUEEG-Abnormal—on a larger-scale dataset, the Chung-Ang University Hospital EEG (CAUEEG), and proposed an end-to-end deep learning (DL) model, CEEDNet, which attained ROC-AUC scores of 0.90 and 0.86 for the two tasks, respectively. Despite the promising performance of EEG-based automatic identification of AD and MCI, EEG acquisition still relies on multi-channel scalp electrodes and strictly controlled experimental conditions, making it difficult to support convenient and continuous monitoring in daily settings.
Notably, AD and cardiovascular diseases may share common pathophysiological mechanisms [
6,
7]. The prospective ARIC–Neurocognitive Study reported that midlife electrocardiographic evidence of left ventricular hypertrophy was independently associated with an increased risk of dementia over approximately 20 years of follow-up, suggesting a potential shared pathological basis between cardiovascular structural remodeling and neurodegeneration [
8]. Isaksen et al. [
9] identified several common electrocardiogram (ECG) markers associated with AD using a Cox proportional hazards model and demonstrated that these markers improved AD risk prediction. Pathological aggregation of AD-related β-amyloid and tau proteins can lead to neuronal dysfunction and reduced autonomic nervous system complexity [
10]. As a key indicator reflecting the balance between sympathetic and parasympathetic regulation, heart rate variability (HRV) derived from ECG signals can sensitively capture alterations in autonomic function [
11]. Numerous studies consistently show that cognitive decline is closely associated with reduced HRV. For instance, Imbimbo et al. [
12] found that ultra-low-frequency HRV features were positively correlated with MoCA scores among 50 participants with cardiovascular risk factors, indicating that poorer cognitive performance was associated with lower HRV levels. Similarly, in a retrospective study of patients with MCI, Kim et al. [
13] reported that individuals who later progressed to AD or dementia with Lewy bodies exhibited lower HRV levels (SDNN, RMSSD, LF, HF). In another study from the same group, elderly women with cognitive impairment—defined by MMSE scores below 24—also showed reduced high-frequency HRV power [
14]. Building on these findings, an increasing number of studies have modeled HRV features for the identification of cognitive impairment. Xavier et al. [
15], based on a cohort of 297 participants, demonstrated significant differences in time-domain HRV features between individuals with MCI and normal controls (NC), achieving an MCI classification accuracy of 80.80% using models such as support vector machines (SVM). These findings suggest that ECG signals may contain information reflective of the underlying pathological changes and disease progression of AD. Compared with EEG, ECG—well-suited for wearable devices and home-based monitoring—shows substantial potential for the identification of AD and MCI.
In recent years, various DL architectures, such as convolutional neural networks (CNNs), recurrent neural networks (RNNs), and Transformers, have achieved remarkable success in fields including computer vision, time-series prediction, and natural language processing—primarily due to their strong capabilities in automatic feature extraction. Concurrently, an increasing number of studies have applied DL methods to medical diagnostic tasks. Huggins et al. [
16] constructed EEG-based topographic maps and, after modifying the AlexNet architecture, achieved an accuracy of 98.9% in a three-class classification task involving AD, MCI, and NC. Furthermore, feature fusion strategies, which combine handcrafted features with feature representations automatically extracted by DL models, have been shown to improve classification performance in cardiovascular and neurological disease detection [
17].
Despite these advancements, studies that use ECG signals as the primary modality for identifying AD and MCI remain limited. Therefore, this study aims to investigate the feasibility of using ECG signals and HRV features for the early detection of AD and MCI.
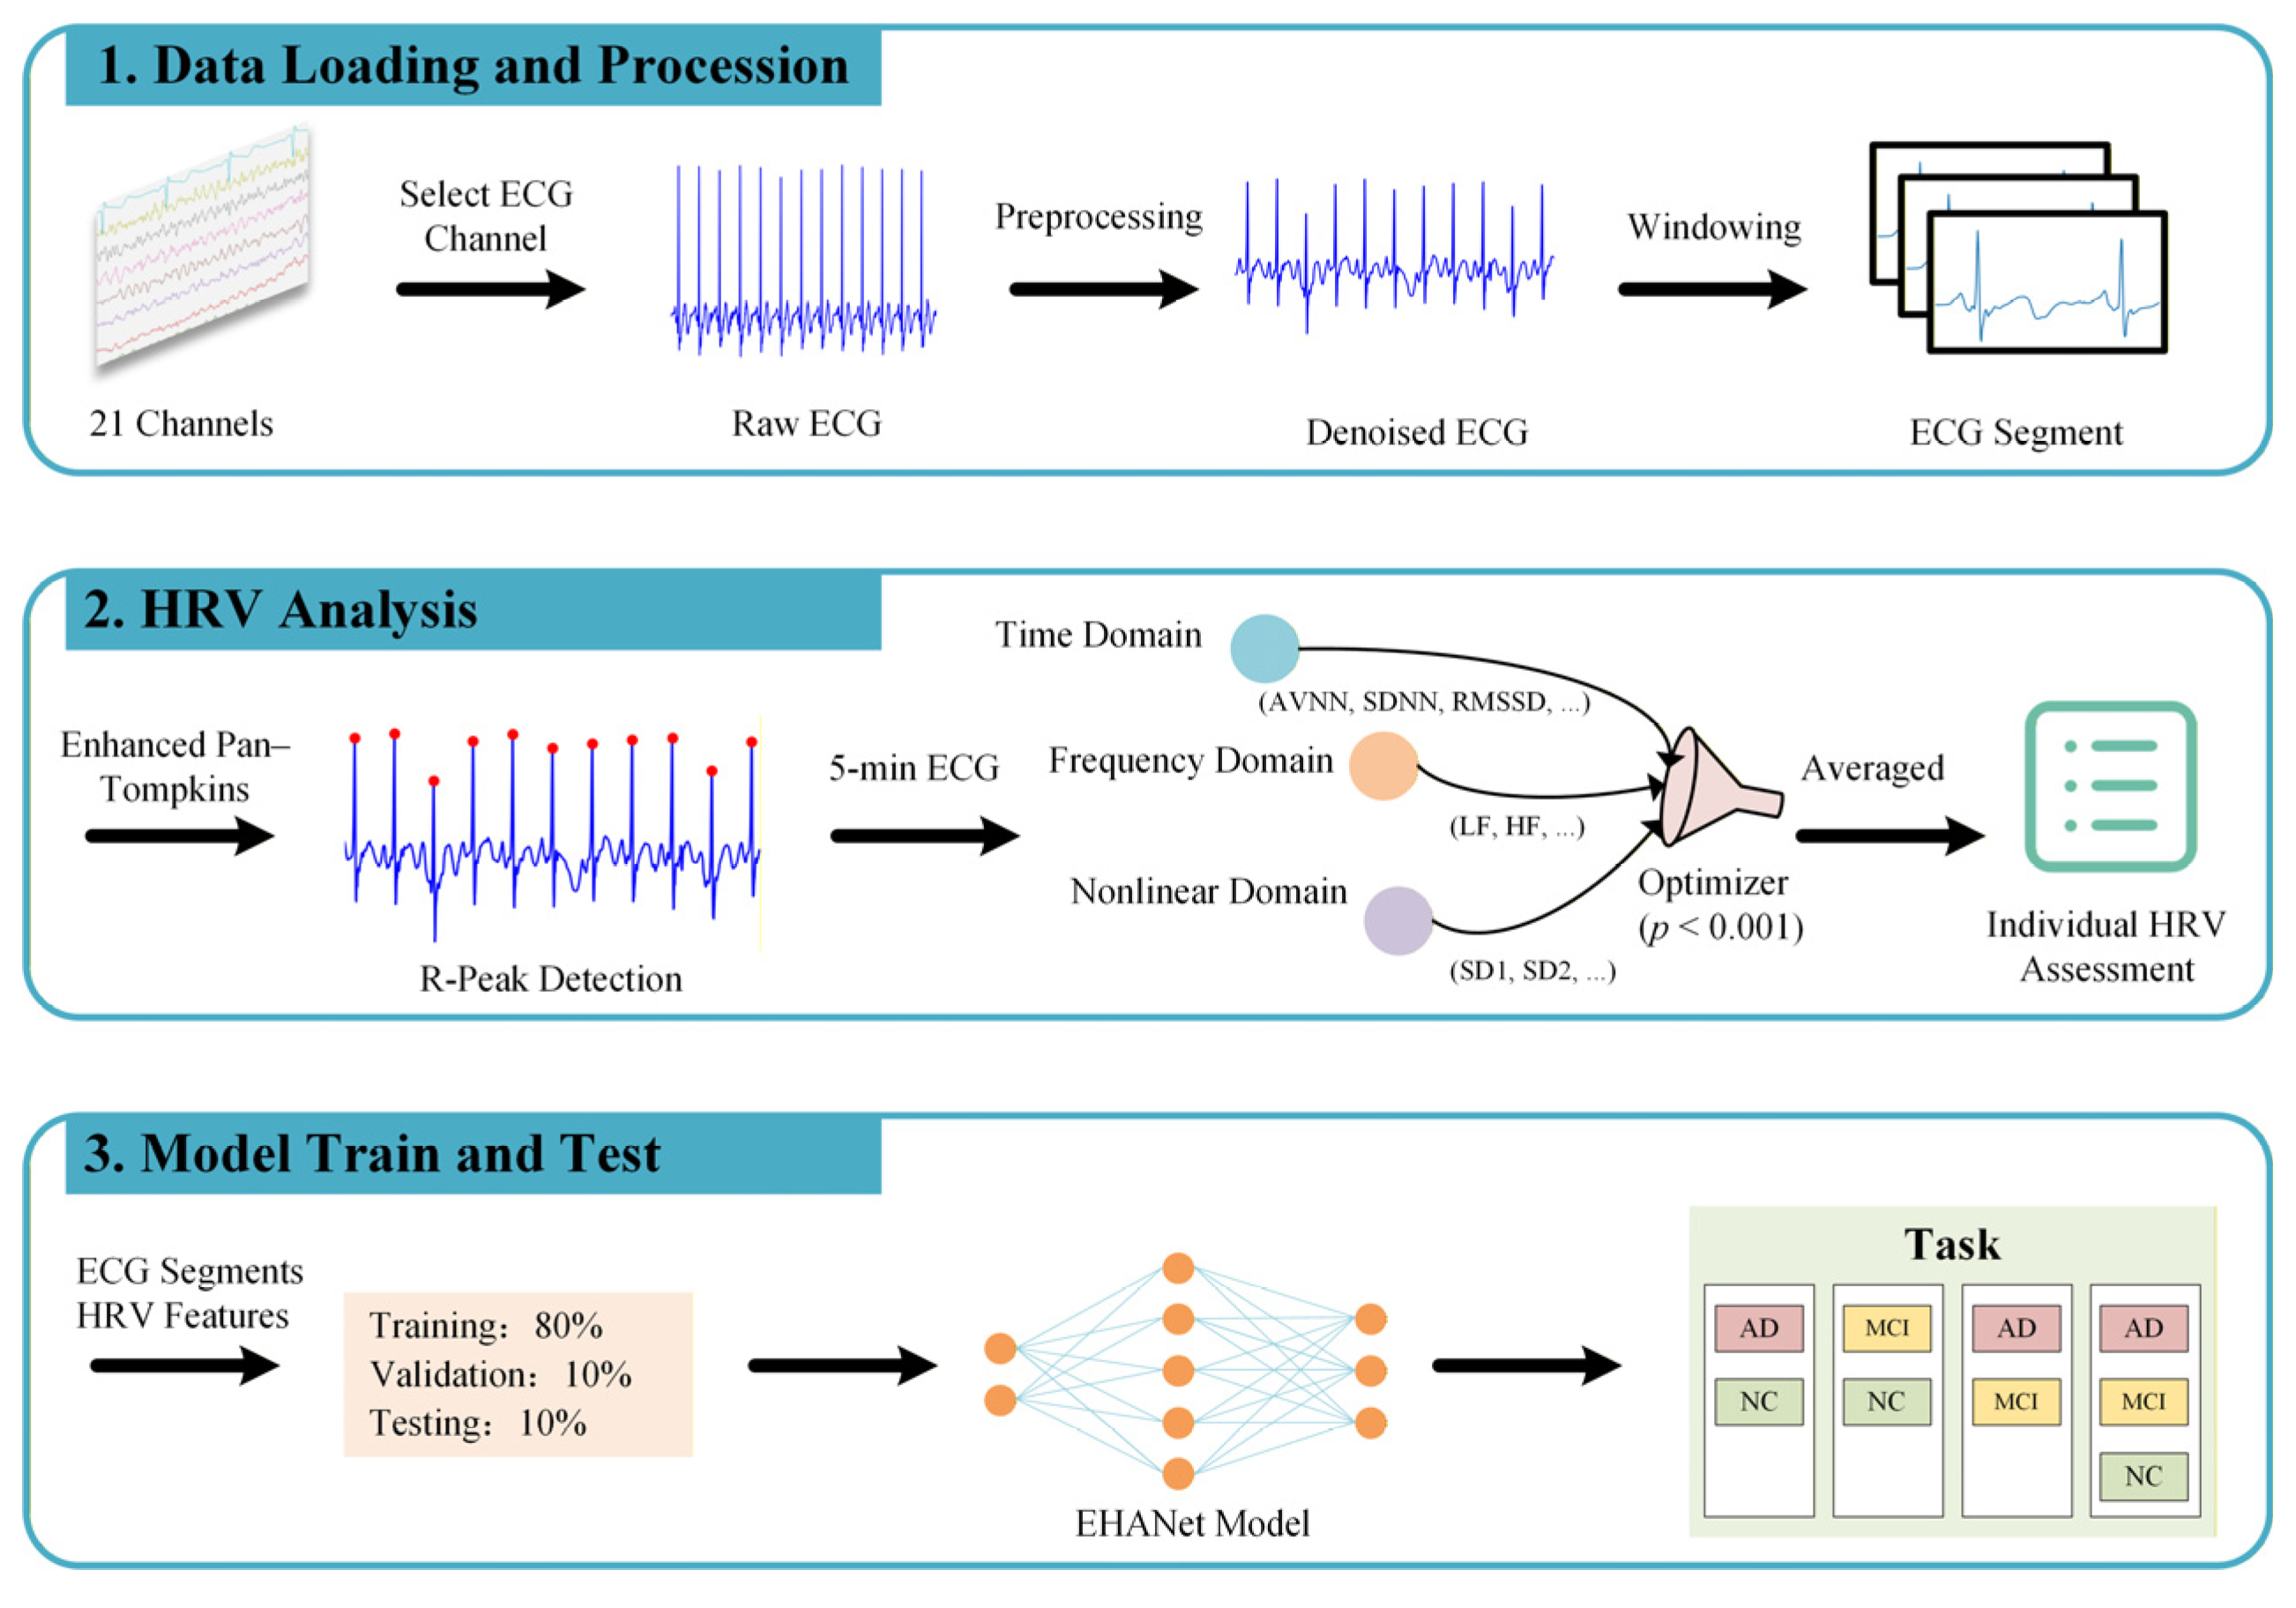
Figure 1 illustrates the proposed hybrid learning framework that integrates HRV features with ECG sequences. The main contributions of this work are summarized as follows:
- 1.
Comprehensive HRV quantification and visualization of group differences across AD, MCI, and NC subjects;
- 2.
Development of a novel hybrid DL framework, the ECG and HRV Attention Network (EHANet), integrating HRV features with ECG sequences;
- 3.
Systematic evaluation across four classification tasks (AD vs. NC, MCI vs. NC, AD vs. MCI, AD vs. MCI vs. NC).
The remainder of this paper is organized as follows:
Section 2 introduces the dataset, preprocessing, and methodology;
Section 3 presents the experimental results;
Section 4 discusses the findings, including limitations and future work; and
Section 5 concludes the study.
2. Materials and Methods
This section provides an overview of the dataset used in this study, the preprocessing procedures applied to the data, the methods for HRV quantification, the implementation of the EHANet model, and the approaches employed for evaluating the model’s performance. To ensure full transparency and reproducibility of all steps proposed in this work, we provide the data preprocessing scripts, the custom functions for HRV feature computation, and the implementation of the EHANet model as electronic
Supplementary Materials.
2.1. Data Source
Currently, publicly available ECG datasets containing AD patients are scarce, particularly large-scale datasets suitable for DL models. In 2023, Kim et al. [
5] introduced the CAUEEG dataset in their EEG-based study of NC, MCI, and dementia. This dataset includes multiple dementia subtypes (e.g., AD, Parkinson’s disease, vascular dementia), different forms of MCI (amnestic and non-amnestic), as well as healthy controls. Each subject record comprises 21 channels, with the first 19 channels corresponding to EEG signals and the 20th channel recording ECG signals. For this study, we extracted only the ECG channel for analysis.
The dataset contains diagnostic labels assigned by clinicians based on standardized criteria and neuropsychological tests, covering 28 diagnostic categories. To align with the National Institute on Aging and Alzheimer’s Association (NIA-AA) 2011 diagnostic guidelines [
18], which define three clinical stages (preclinical, MCI, and dementia), we consolidated the original labels into three groups: AD, MCI, and NC, as shown in
Table 1. The average age of participants was 70.77 ± 9.90 years, with a male-to-female ratio of 5:3, and each record had an average duration of 13.34 ± 2.83 min.
2.2. Preprocessing
ECG signals are highly susceptible to contamination from acquisition devices and environmental conditions, including motion artifacts, poor electrode contact, and power-line interference [
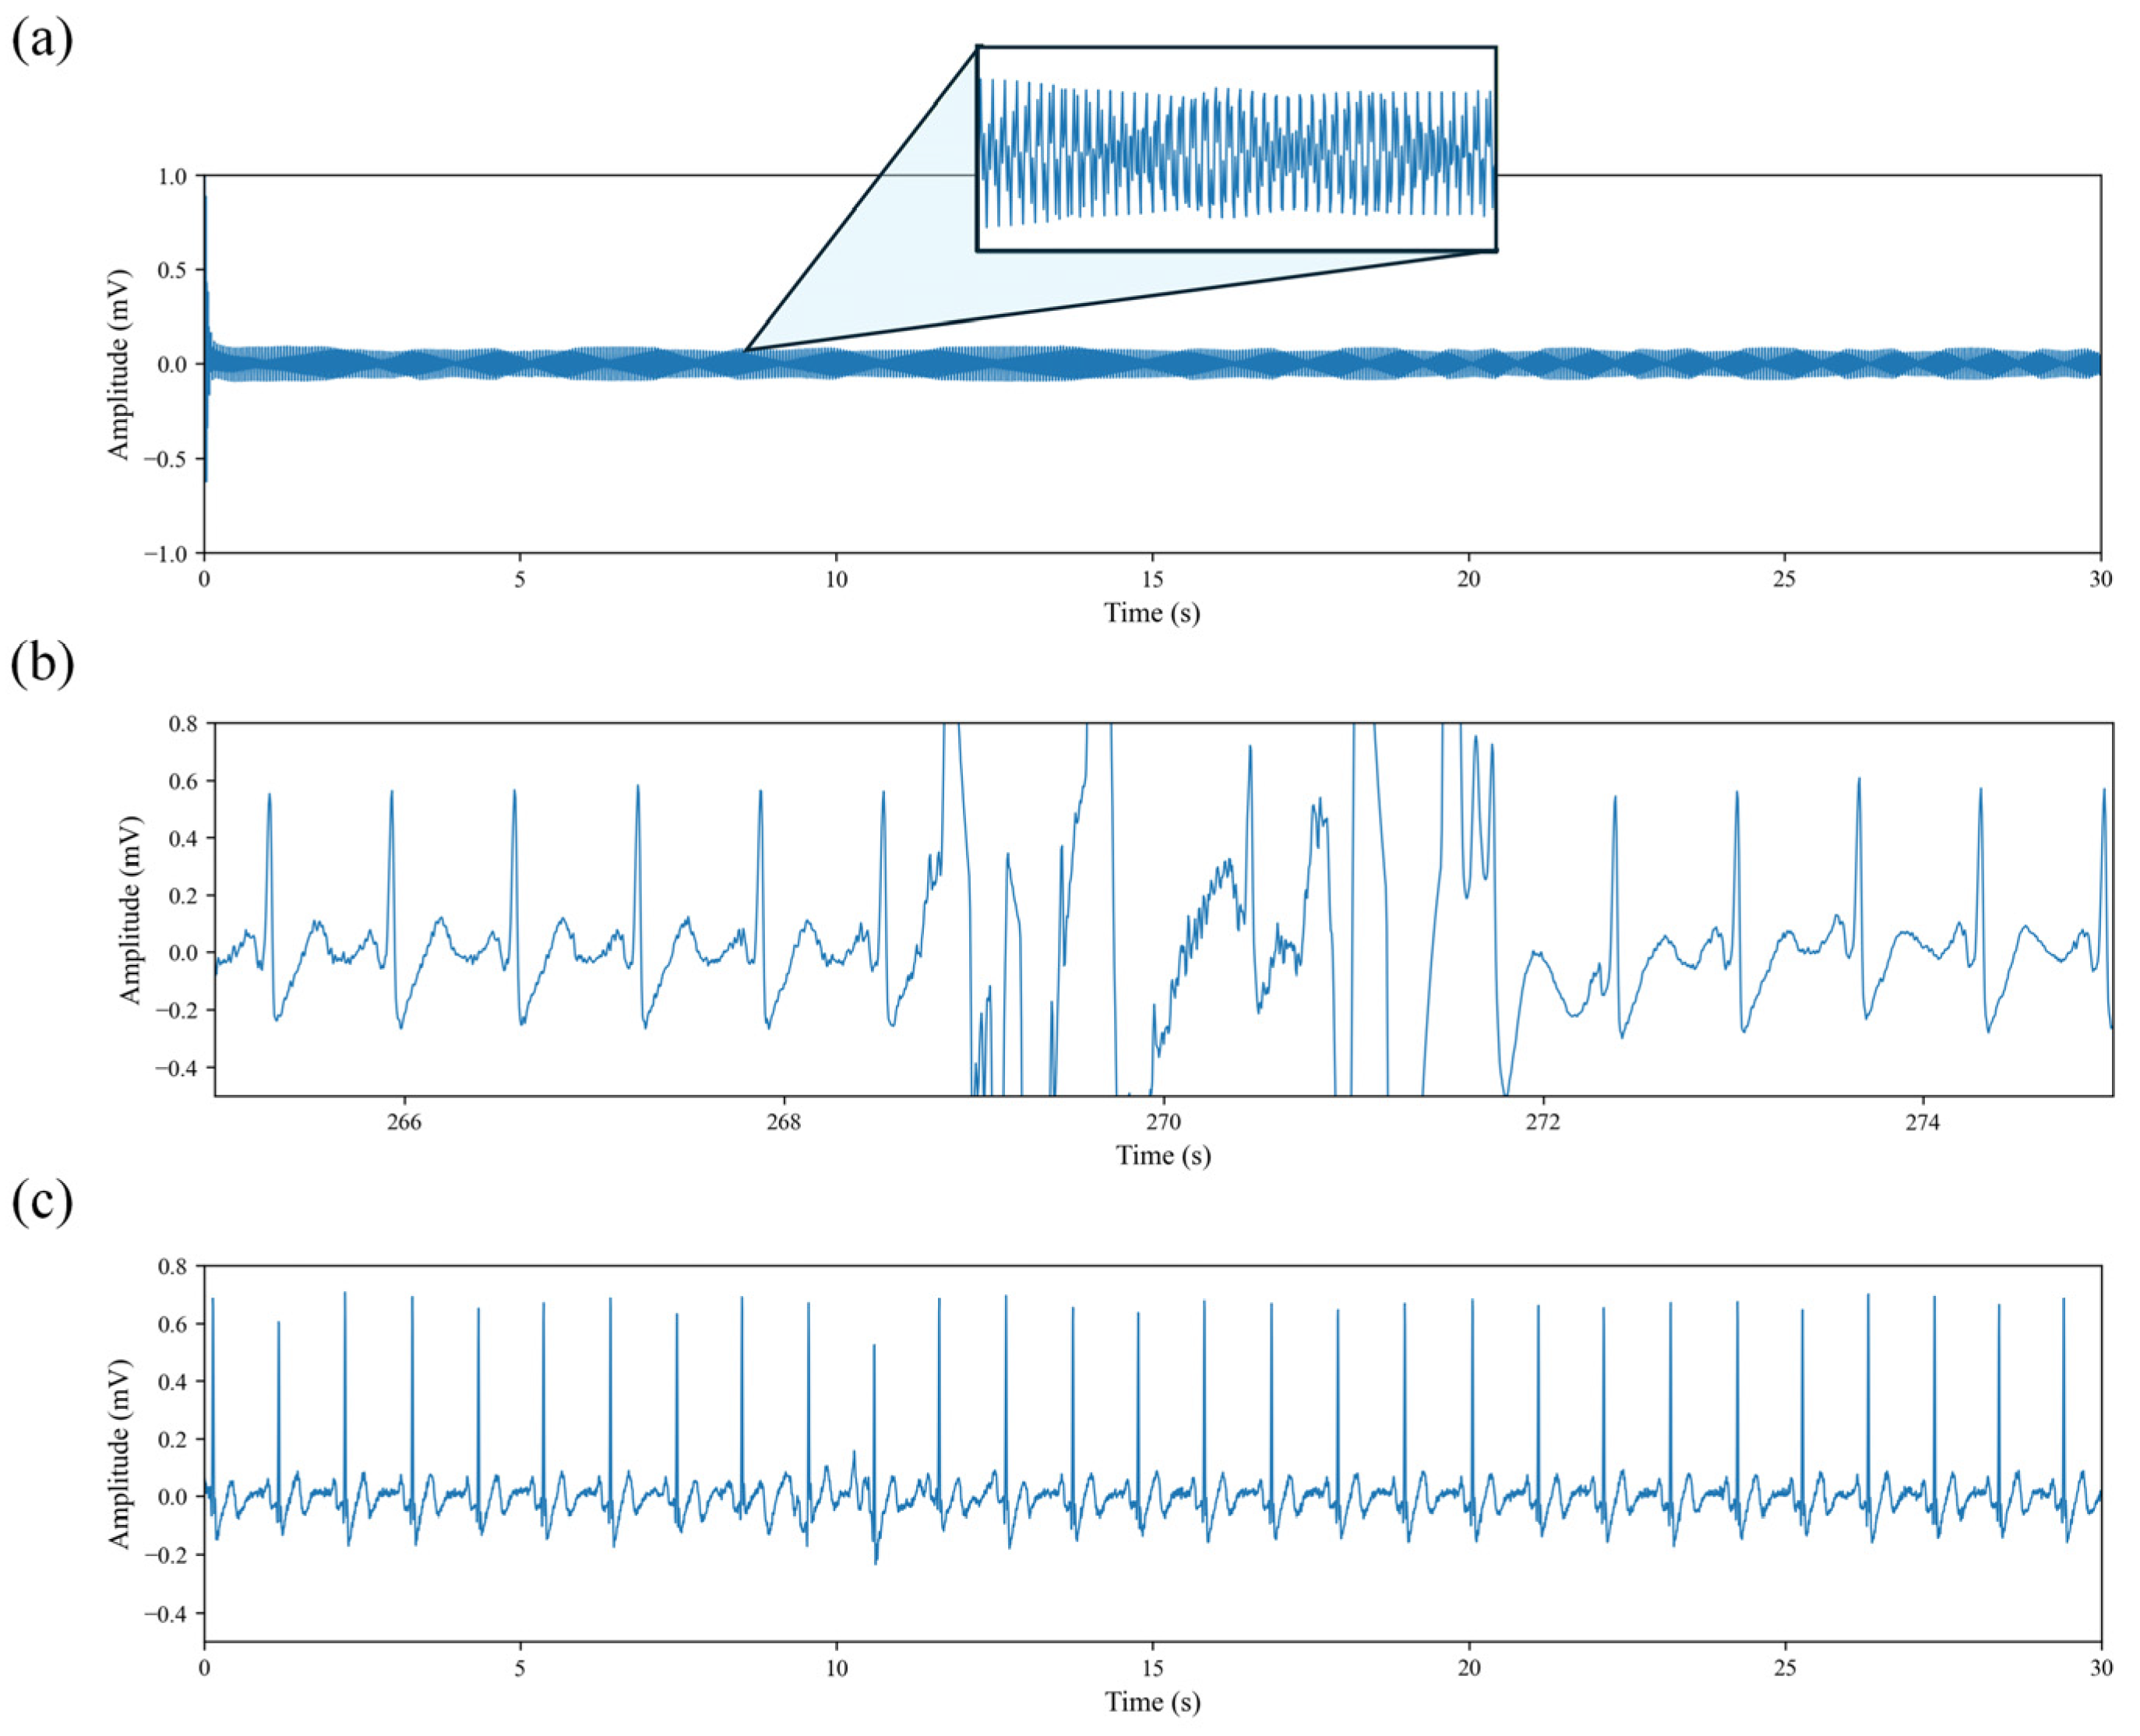
19]. After the publicly available dataset had already undergone power-line noise removal, we performed additional preprocessing steps to address remaining issues. As illustrated in
Figure 2, certain recordings presented severe signal degradation. In particular, the waveform shown in
Figure 2a contains no recognizable physiological information. After manually inspecting the ECG recordings of all subjects, such segments were excluded from subsequent analyses, as they provide no meaningful contribution to the objectives of this study.
Figure 2b illustrates the presence of high-amplitude motion artifacts widely observed in the dataset. Although these artifacts account for only 3.06 ± 2.17% of each individual recording, 87.63% of all recordings are affected. To prevent such artifacts from biasing the cardiac waveform and HRV features, we identified and removed the contaminated segments, retaining only the portions with stable cardiac activity. This ensures the reliability of HRV indices and provides stable input signals for the DL model.
The discontinuity in the time axis caused by artifact removal was addressed using an R-peak-anchored, cycle-level stitching strategy, in which adjacent clean segments were connected only at the boundaries of complete RR intervals to maintain physiological rhythm consistency [
20].
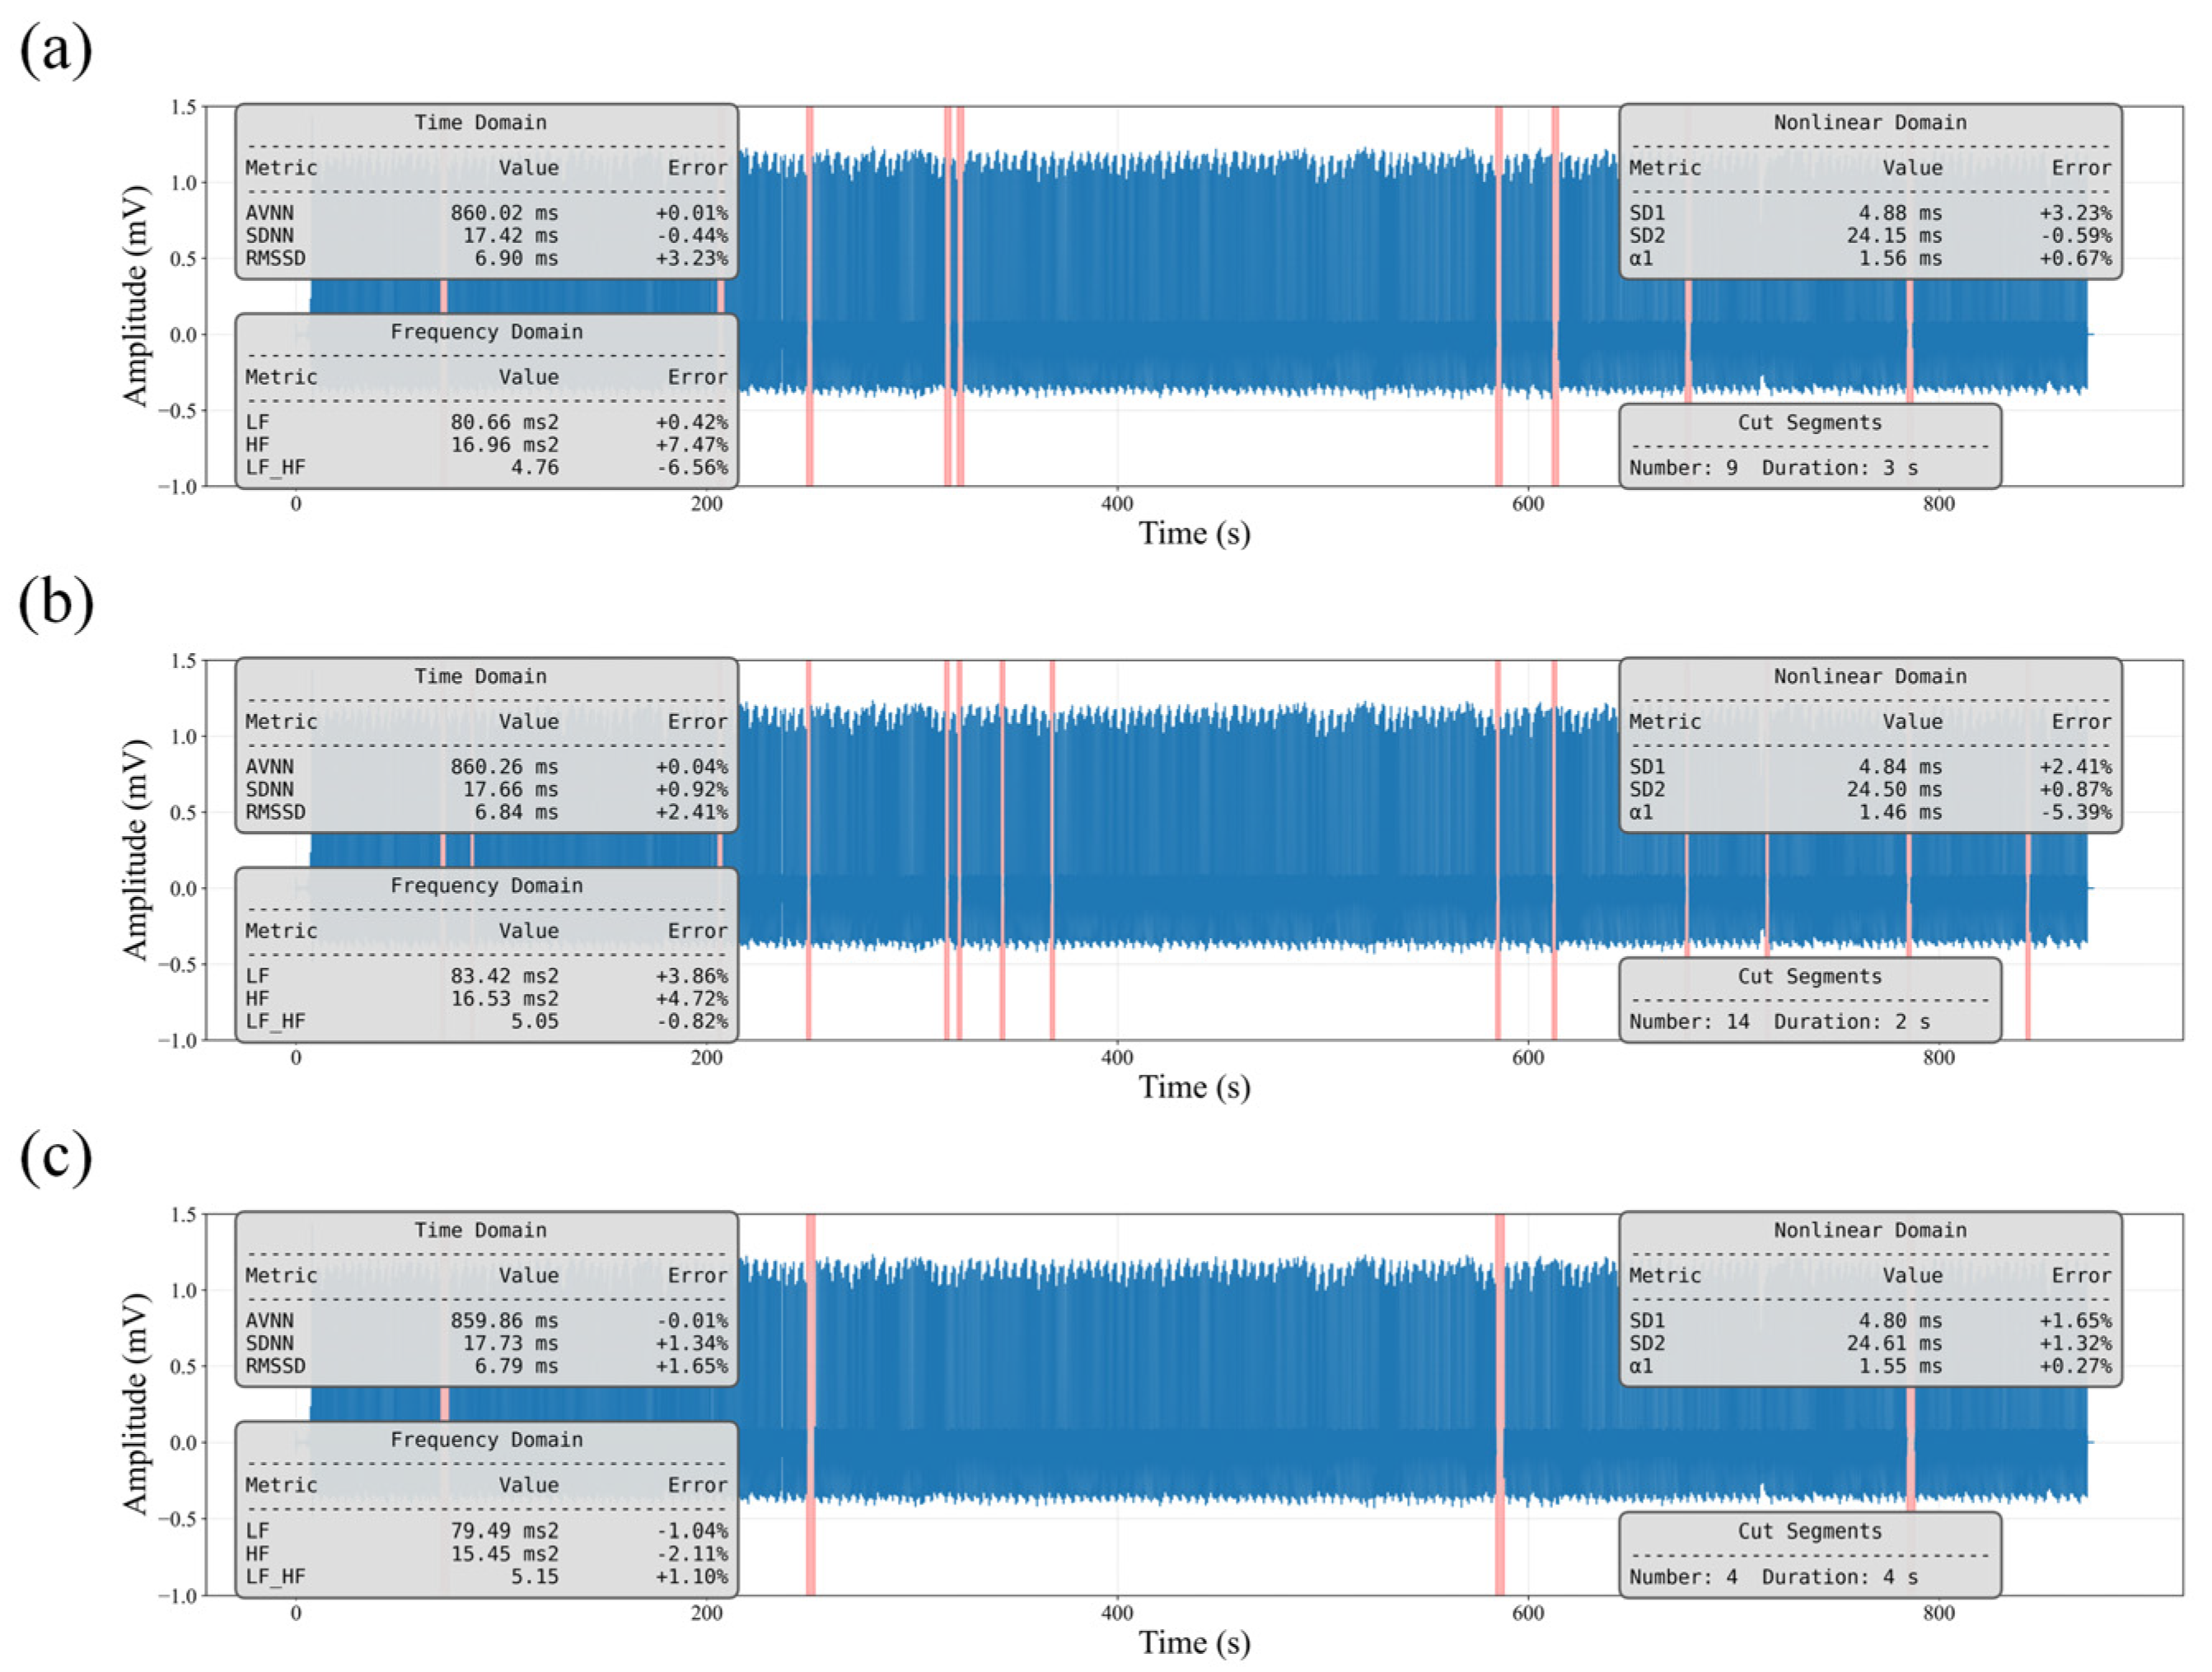
To verify that this strategy does not introduce systematic bias, we conducted a simulation experiment on clean ECG recordings by randomly removing segments and reconstructing the signals. As shown in
Figure 3, the Value denotes the HRV level computed from the reconstructed signal, while Error represents its percentage deviation from the original HRV values. All errors were below 10%, indicating that the impact of this procedure on HRV information is negligible.
To improve signal consistency and enhance the stability of model training, we applied a threshold-based denoising method using the Discrete Wavelet Transform (DWT) to the ECG signal shown in
Figure 2c. Specifically, a minimax thresholding strategy [
21] was employed to adaptively shrink the high-frequency detail coefficients, thereby suppressing residual high-frequency components while preserving the morphology and temporal characteristics of the QRS complexes. The DWT-denoised ECG signal was then used for subsequent HRV analysis and as input to the DL model.
After data cleaning, we excluded recordings with a duration of less than 5 min. This criterion follows the recommendations of the European Society of Cardiology and the North American Society of Pacing and Electrophysiology [
22], which specify the minimum required length for HRV analysis. It should be noted that a relatively large proportion of recordings in the NC group were removed during preprocessing. This is because this group contained a higher number of invalid or low-quality ECG signals, resulting in more recordings failing to meet the minimum duration or quality requirements.
Table 2 summarizes the composition of the dataset before and after preprocessing.
2.3. HRV Quantitative Analysis
The association between HRV and AD can be interpreted through the cholinergic hypothesis, which proposes that impairments in memory and cognitive function arise from the degeneration of cholinergic neurons and the resulting deficiency of acetylcholine [
23]. As the vagus nerve constitutes a major cholinergic pathway involved in cardiac autonomic regulation, alterations or reductions in HRV may therefore reflect cholinergic dysfunction and indicate the progression of AD.
We introduced a lightweight modification to the classical Pan–Tompkins algorithm to reduce missed and false detections of R peaks. When the interval between adjacent R–R intervals (RRIs) exceeded 1.75 times the median RRI, the segment was considered a potential missed-detection region. Candidate peaks were then uniformly distributed within this interval and verified through local maximum search to identify omitted R peaks. In addition, a minimum RRI threshold of 400 ms was applied to suppress noise-induced false detections, consistent with the typical physiological range observed during resting conditions [
24].
We implemented the quantitative HRV analysis of ECG signals using the PyCharm integrated development environment (JetBrains, version 2024.1.4) and Python 3.9.20. The analysis was conducted with the support of major scientific computing libraries, including NumPy (version 1.26.4), SciPy (version 1.13.1), and pandas (version 2.2.3).
We extracted 39 HRV features across the time-domain, frequency-domain, and nonlinear domains, as summarized in
Table 3. Notably, within the nonlinear analysis, Shannon entropy (ShanEn) was computed using the symbolic dynamics method under two strategies: a ternary symbolization based on consecutive RRI differences and a binary symbolization relative to the mean RRI, yielding the features ShanEn-diff and ShanEn-mean, respectively. In addition, heart rate fragmentation (HRF) metrics were included, as these indicators are sensitive to pathological disruptions in beat-to-beat heart rate dynamics [
25].
To evaluate the group differences in each HRV feature among the AD, MCI, and NC groups, we performed univariate comparisons and applied the Kruskal–Wallis non-parametric test to assess overall significance. Using a threshold of p < 0.001, features that exhibited highly significant group differences were retained as discriminative candidates for subsequent model construction.
2.4. EHANet Architecture
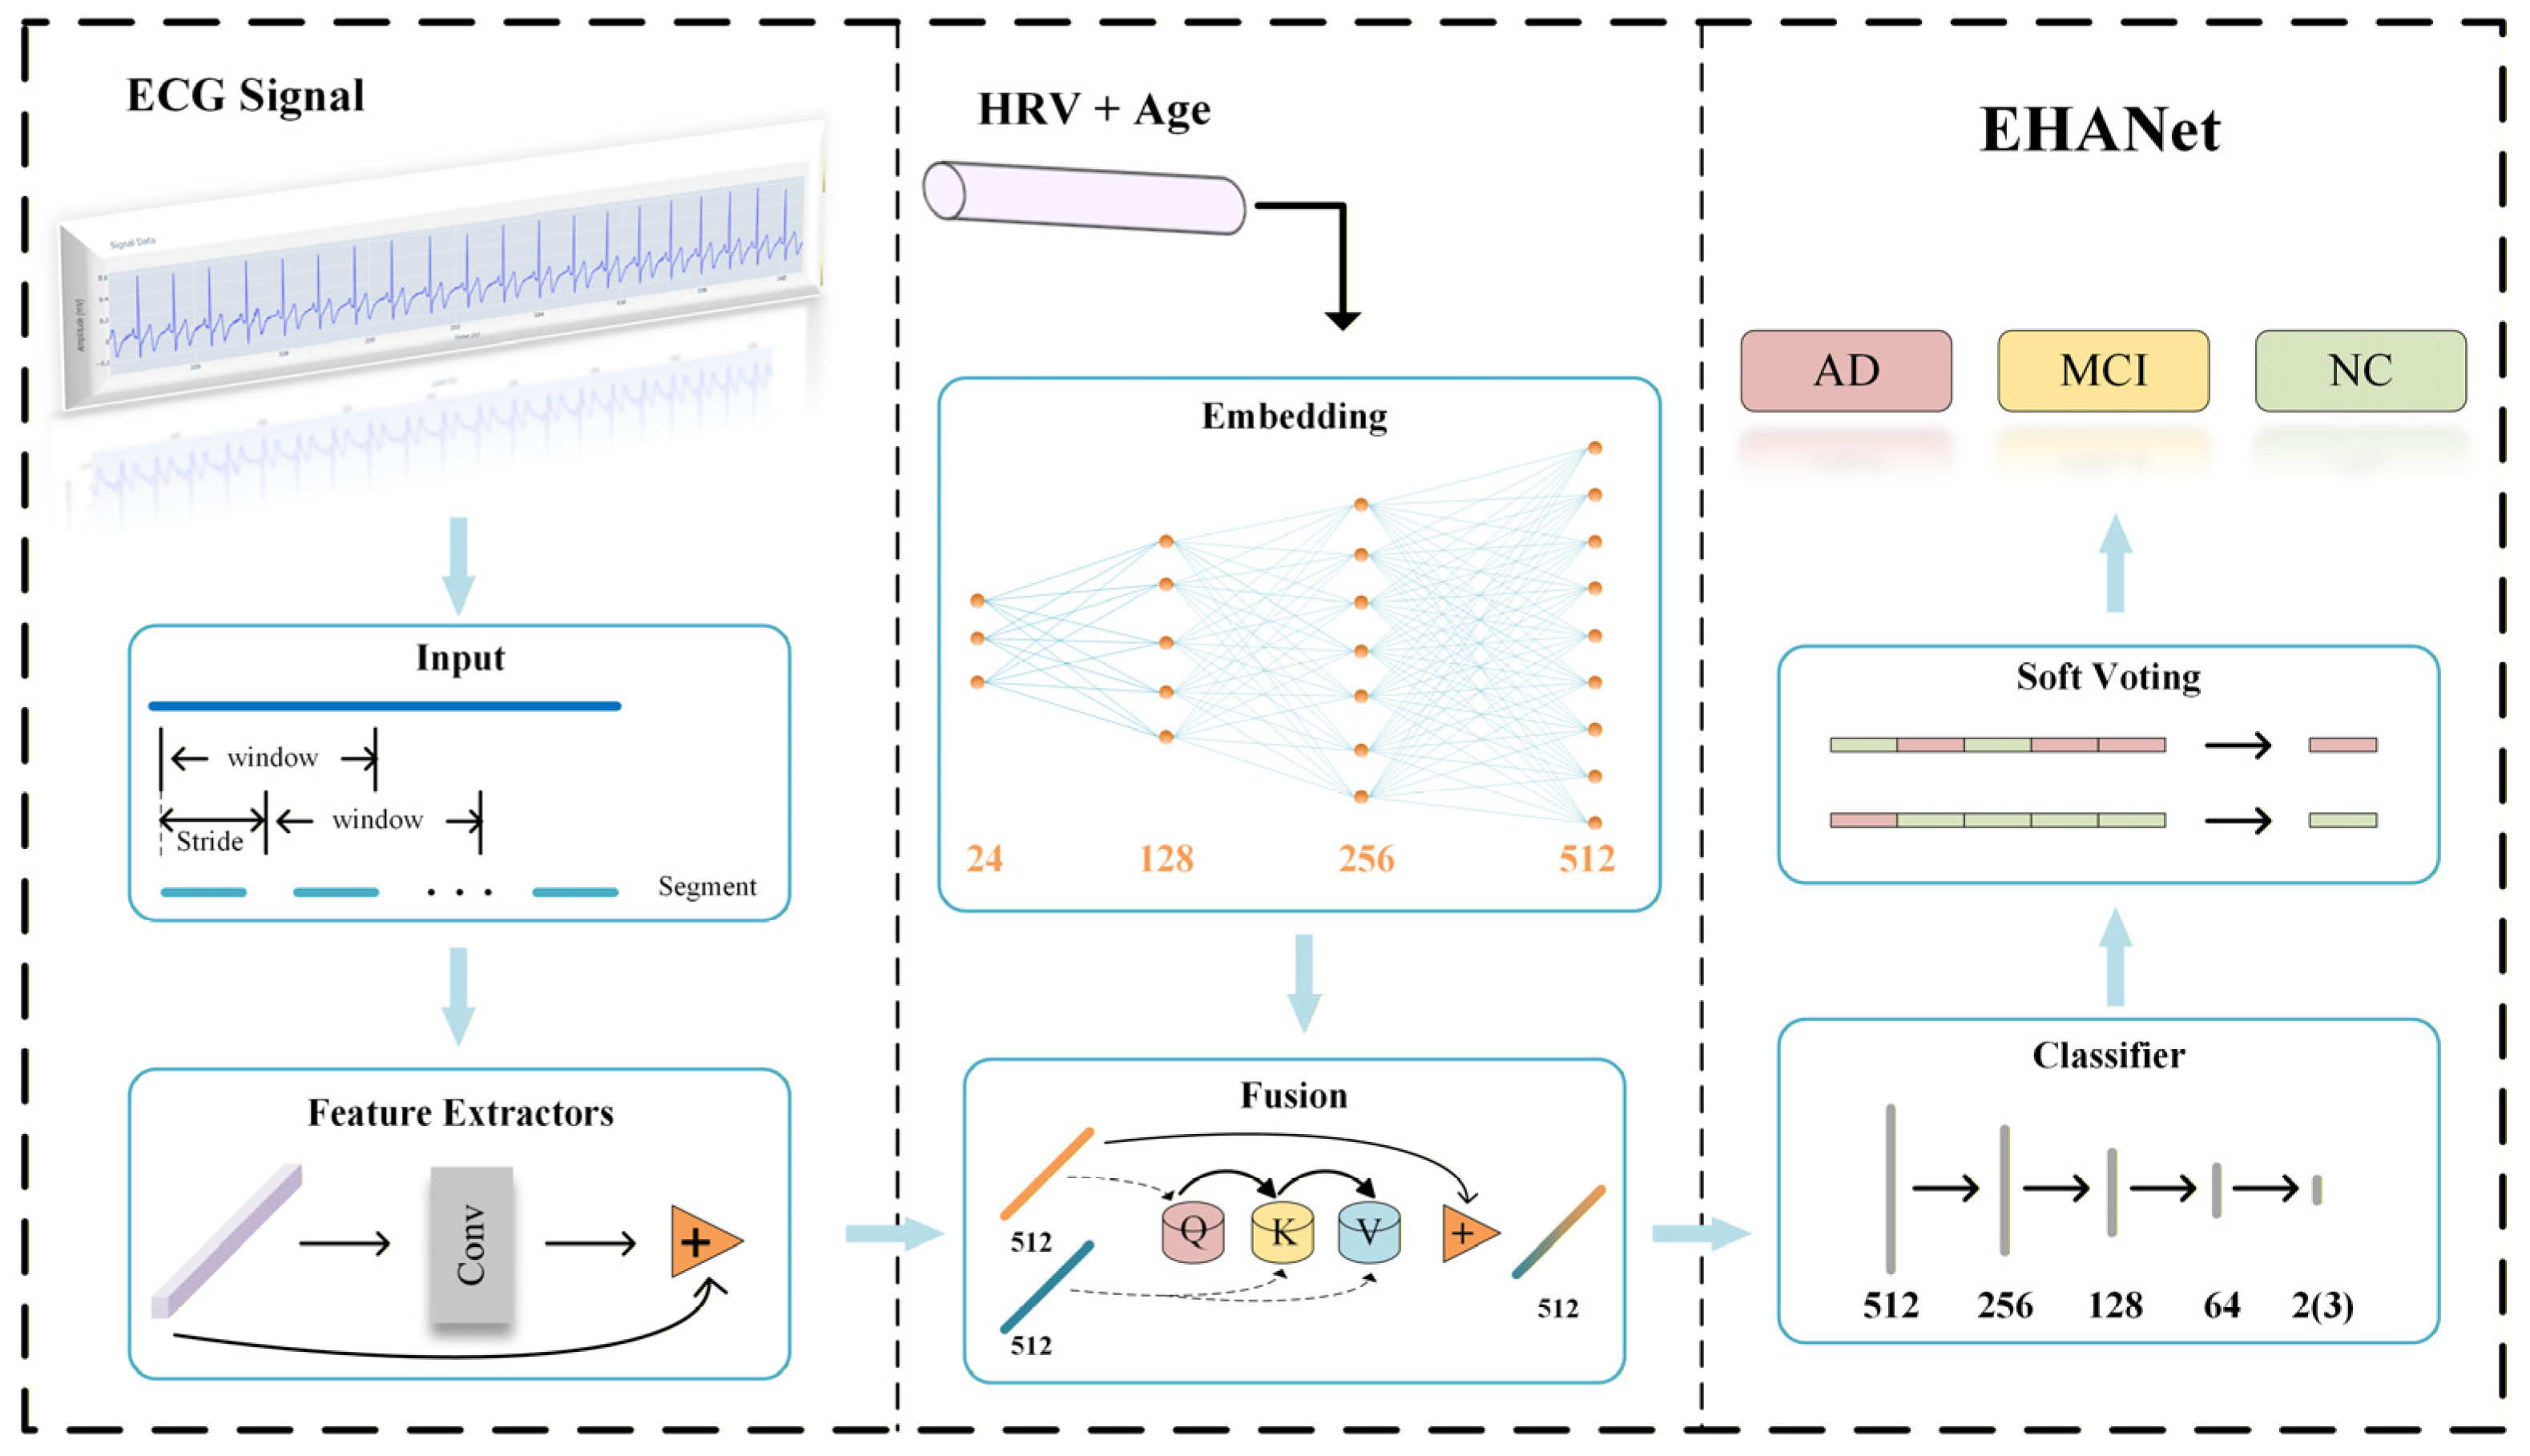
The EHANet framework proposed in this study adopts a hybrid feature learning strategy, integrating deep features (DFs) from ECG sequences with empirical features (EFs) derived from HRV analysis and age. The architecture, illustrated in
Figure 4, consists of five stages: preprocessing, feature extraction, feature fusion, classification, and soft voting. The preprocessing pipeline generates fixed-length training samples with matched labels, converts them into Tensor format, applies z-score normalization, and uses a DataLoader for mini-batch training.
For feature extraction, we implemented a one-dimensional residual convolutional network based on ResNet18 [
26], which has demonstrated strong performance in ECG classification tasks due to its skip-connection design [
27]. The network comprises four residual stages, each with two residual blocks, as illustrated in
Figure 5. Each block introduces identity mappings via skip connections, expressed in Equation (1), which alleviate gradient vanishing as depth increases.
where
denotes the input vector,
the residual mapping function, and
the output of the residual connection.
From the 39 HRV features described in
Section 3.2, we selected 23 features with highly significant group differences (
p < 0.001) as EF and further included age, yielding a 24-dimensional EF vector. During feature fusion, EF is projected to the same dimensional space as DF through three fully connected layers. A cross-attention mechanism [
28] is then applied, where EF vectors act as queries, and similarity with DF (keys) produces attention weights used to aggregate DF (values). Residual connections preserve original information and enhance training stability.
The classifier consists of three hidden fully connected layers followed by a final classification layer, transforming feature dimensions from 512 to 256, 128, 64, and the output dimension corresponding to the number of classes. Segment-level predictions are aggregated into subject-level results using a soft voting strategy, as defined in Equation (2).
where
denotes the predicted subject-level label,
the prediction probability of the
-th segment for category
, and
the total number of ECG segments for the subject.
Throughout the model, ReLU activation is employed, with Softmax used in the final classification layer. Batch normalization and layer normalization are applied as normalization strategies. Max pooling and adaptive average pooling are used for downsampling. Dropout is applied with rates of 0.15 in the feature learning module and 0.3–0.5 in the classifier to reduce overfitting.
2.5. Performance Evaluation
To evaluate the performance of the proposed architecture, this study employs accuracy, precision, recall, F1-score, and the Area Under the Receiver Operating Characteristic Curve (AUC) as evaluation metrics. As these metrics are widely used in the literature, their mathematical definitions are omitted for brevity.
2.6. Ablation Study Design
To quantify the contribution of each input modality, we performed an ablation study by evaluating the model under three input configurations: (1) HRV-only, (2) ECG-only, and (3) the combined HRV + ECG input. By selectively removing one modality at a time, the ablation design enables us to assess the individual and complementary effects of HRV features and raw ECG segments on classification performance. The same training protocol and subject-wise data splits were used across all ablation settings to ensure fair comparison.
3. Experimental Results and Analysis
3.1. Experimental Setup
All experiments were conducted on a workstation equipped with an Intel i7-14700KF CPU and an NVIDIA GeForce RTX 4060 GPU. HRV quantitative analysis was carried out using Python libraries, and the DL framework was implemented in PyTorch. The entire pipeline, including data preprocessing, model training, and evaluation, was executed in Python 3.9.20 with PyTorch 2.5.1 and CUDA 12.1.
3.2. Statistical Analysis
To obtain the HRV level for each subject, a 5-min sliding window with a 30 s overlap was applied to their ECG recordings, as the recording durations varied across subjects. The HRV features computed from all segments of a given subject were then averaged to derive the final HRV indices for that subject.
We computed all features listed in
Table 3, and based on the Kruskal–Wallis nonparametric test with a significance threshold of
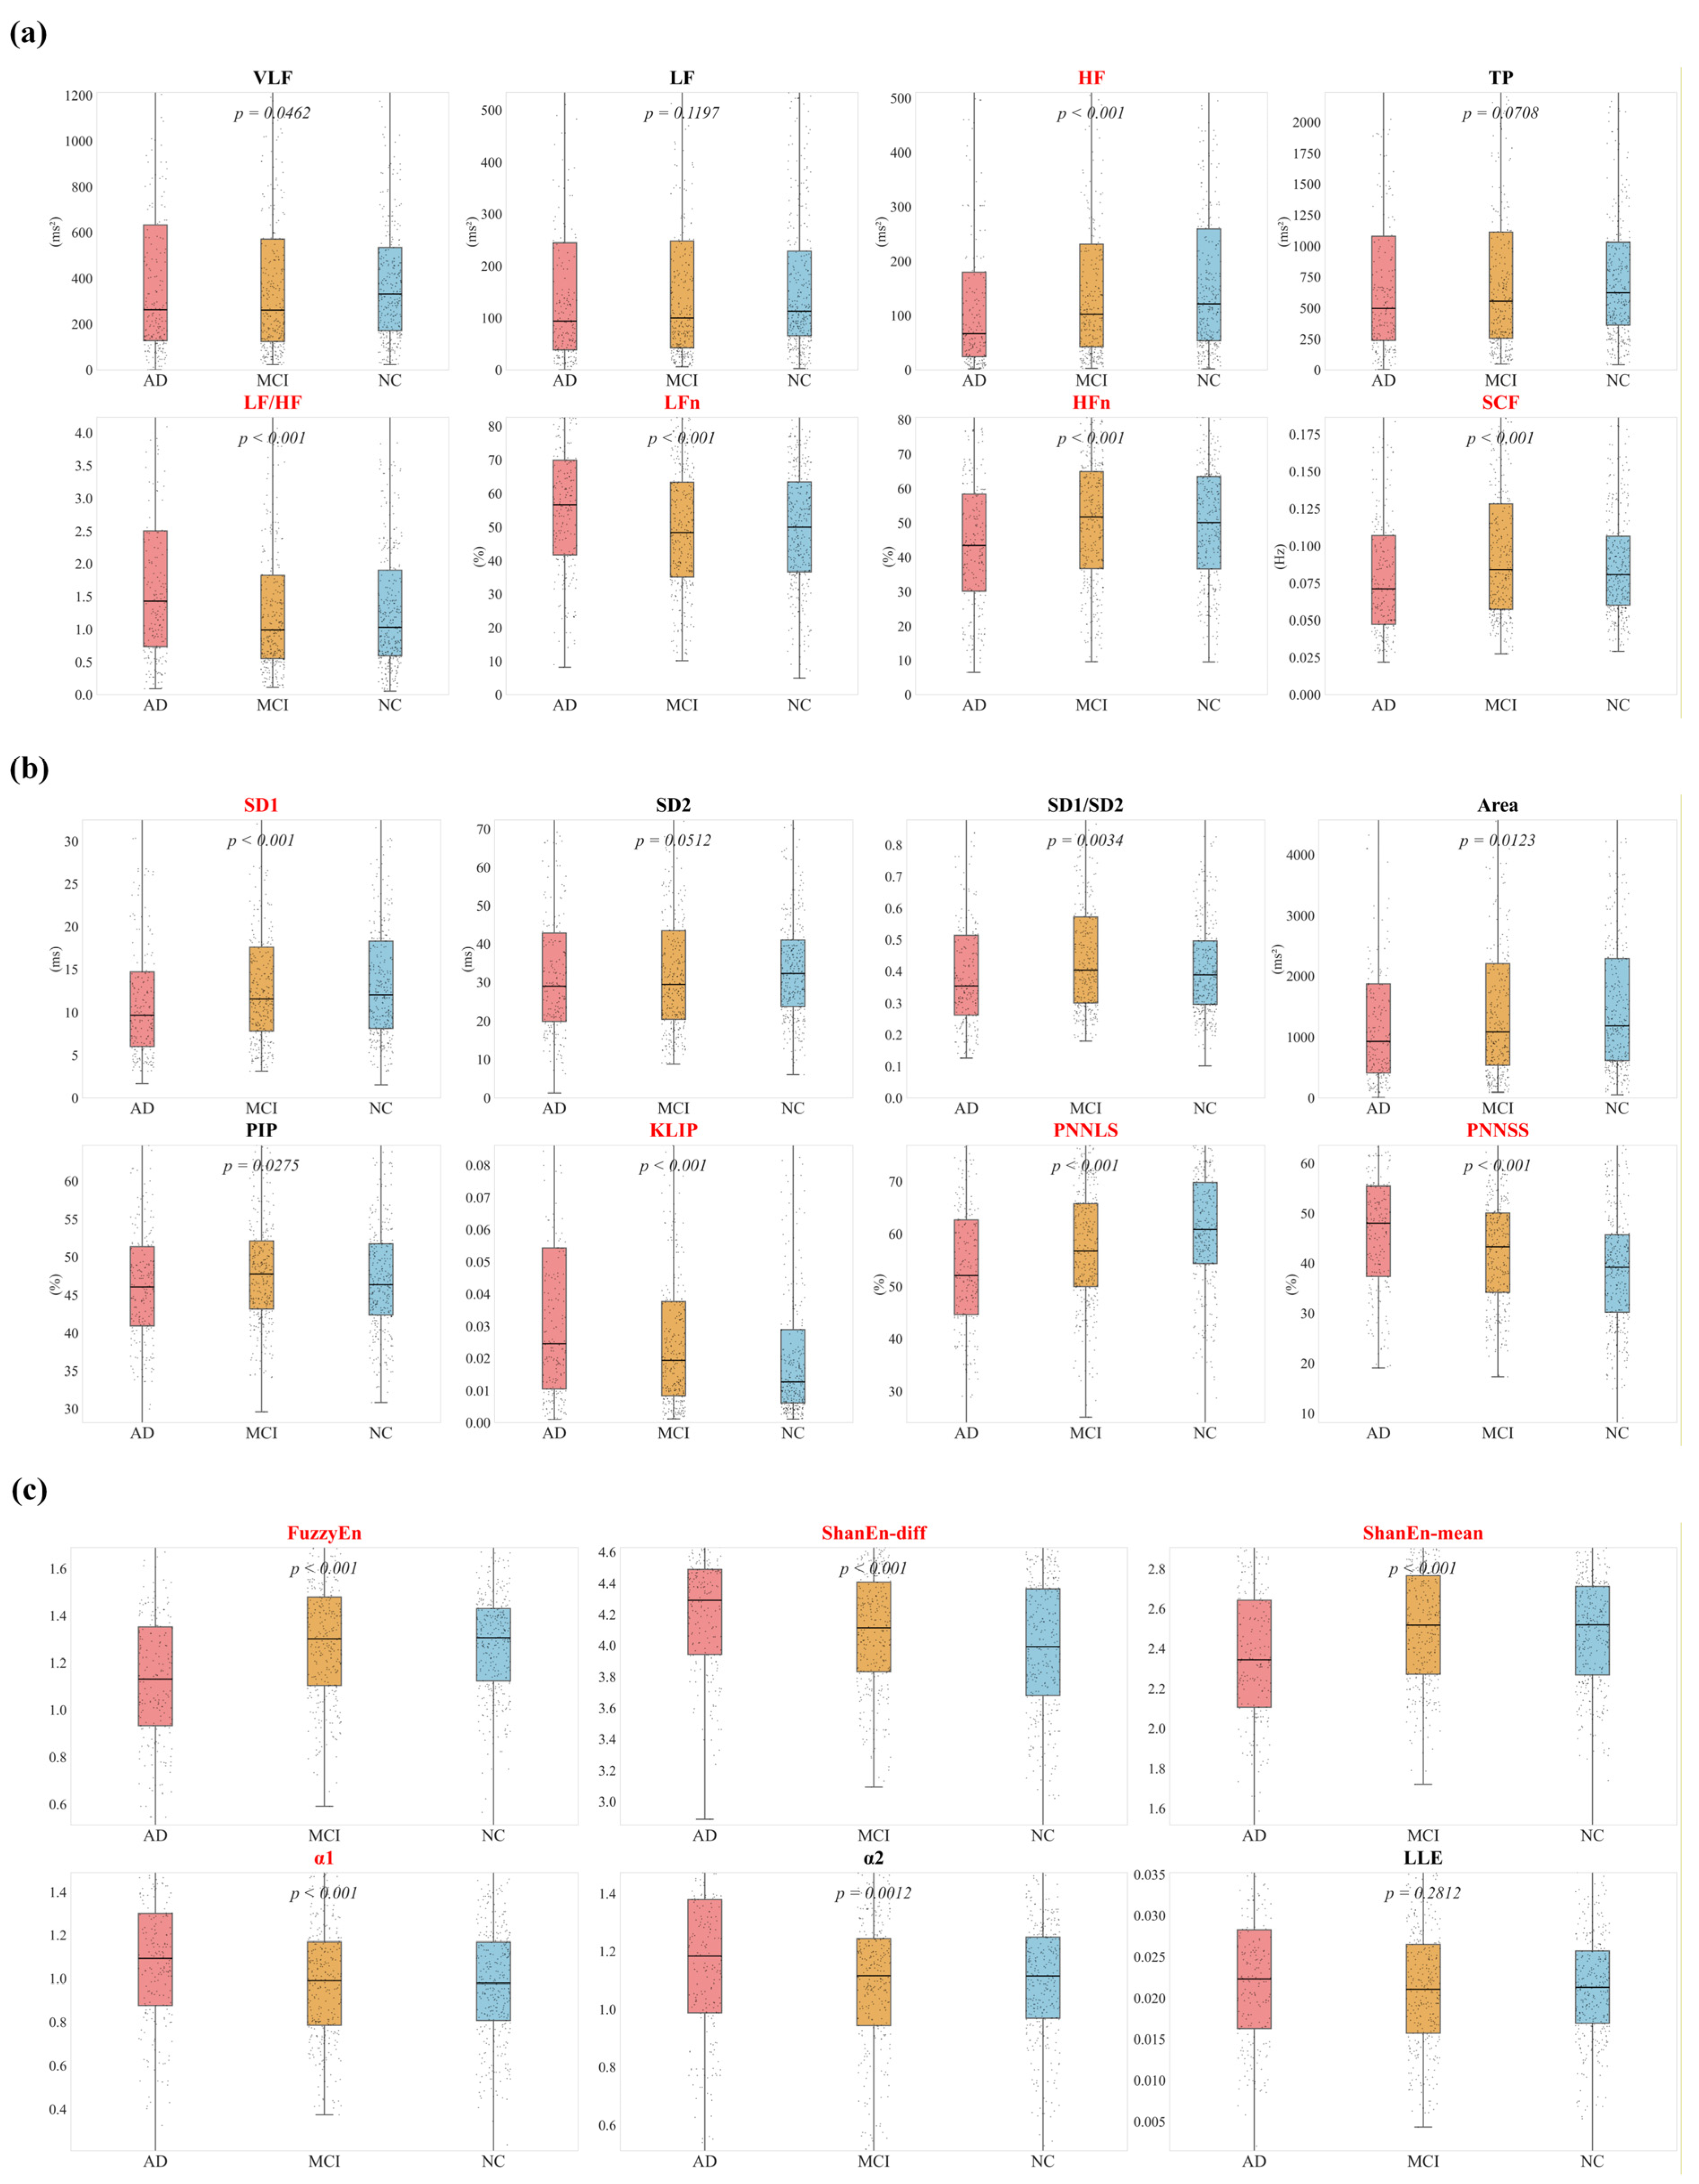
p < 0.001, 23 features were selected as candidate features. The results are presented in
Figure 6 and
Figure 7.
Figure 6 illustrates time-domain results. Among the standard indices, RMSSD, SDSD, TINN, and TI showed a progressive decline from NC to MCI to AD, consistent with reduced parasympathetic function. Within the PNNx family, indices with successive RRI differences ≤30 ms demonstrated highly significant inter-group differences (
p < 0.001). However, the discriminative ability decreased as
x increased, and no significant difference was found for the conventional PNN50 (
p = 0.2242).
Figure 7 presents results from frequency-domain and nonlinear analyses. In
Figure 7a, AD patients exhibited the lowest HF values, reflecting impaired vagal modulation. In
Figure 7b, KLIP and PNNSS, which quantify fragmentation, were significantly elevated in AD, while PNNLS, which measures continuity, was reduced, indicating marked disruption of heart rate regulation. In
Figure 7c, entropy-based features provided additional insights: FuzzyEn values were lower in AD, suggesting reduced regulatory capacity and increased regularity of HRV. Shannon entropy showed divergent behaviors, with ShanEn-diff elevated in AD, possibly reflecting disordered pseudo-complexity, whereas ShanEn-mean was decreased, indicating impaired baseline regulation.
3.3. Experimental Validation of EHANet
To avoid subject-level data leakage between the training, validation, and test sets, we first performed subject-level data splitting using an 8:1:1 split. Each subject was assigned exclusively to one of the three sets, and all of their raw ECG recordings were strictly confined to that assigned subset. After this subject-wise partitioning, we conducted segmentation within each subset. Because the recording durations varied across subjects, a sliding window of 60 s with 50% overlap was applied to the complete ECG recordings of each subject to generate fixed-length segments suitable for the DL model input.
The processed 60s ECG segments, the selected 23 HRV features, and the age information were used as inputs to the EHANet model. Considering that a single subject-wise split may be affected by randomness, we employed five independent repetitions of the entire splitting procedure using different random seeds to obtain a robust and representative performance evaluation. In each repetition, the model was retrained, validated, and tested based on a newly generated subject-wise split, resulting in five mutually exclusive and independent training, validation, and test sets. The final model performance was summarized across the five experiments to assess the stability and generalizability of the model under varying data distributions.
The EHANet model was trained with a batch size of 64 and an initial learning rate of 1 × 10⁻⁴. A warm-up phase with a learning rate of 1 × 10⁻⁵ was applied at the beginning of training, followed by a step-decay schedule with a decay factor of 0.1. The Adam optimizer was used, and the loss function was cross-entropy. Training was performed for up to 100 epochs with an early stopping strategy. Dropout rates of 0.15 and 0.5, together with batch normalization, were employed to enhance training stability. Model weights were initialized using the default PyTorch initialization scheme.
The EHANet framework was evaluated across four classification tasks (AD vs. NC, MCI vs. NC, AD vs. MCI, and AD vs. MCI vs. NC). We analyzed both the segment-level classification performance and the subject-level performance obtained by aggregating all 60s segments from the same subject using a soft-voting strategy.
In
Table 4, we report the averaged results across the five experimental repetitions for all four classification tasks, reflecting the overall classification capability of the model. The best performance was achieved in distinguishing AD from NC, where both segment-level and subject-level accuracies and macro-averaged F1 scores exceeded 86%. In the AD vs. MCI task, the accuracies at both levels reached approximately 82%. In contrast, the performance for MCI vs. NC was relatively lower (74.64% at the segment level and 76.0% at the subject level), which aligns with extensive clinical evidence showing that MCI and normal aging share overlapping physiological and cognitive characteristics, making this distinction inherently challenging. Notably, achieving such performance using only non-invasive ECG signals suggests that meaningful cognitive status information can indeed be extracted from ECG-derived dynamics. For the three-class classification task, the overall accuracy and other macro-averaged metrics remained around 74%, demonstrating the robustness of the proposed method.
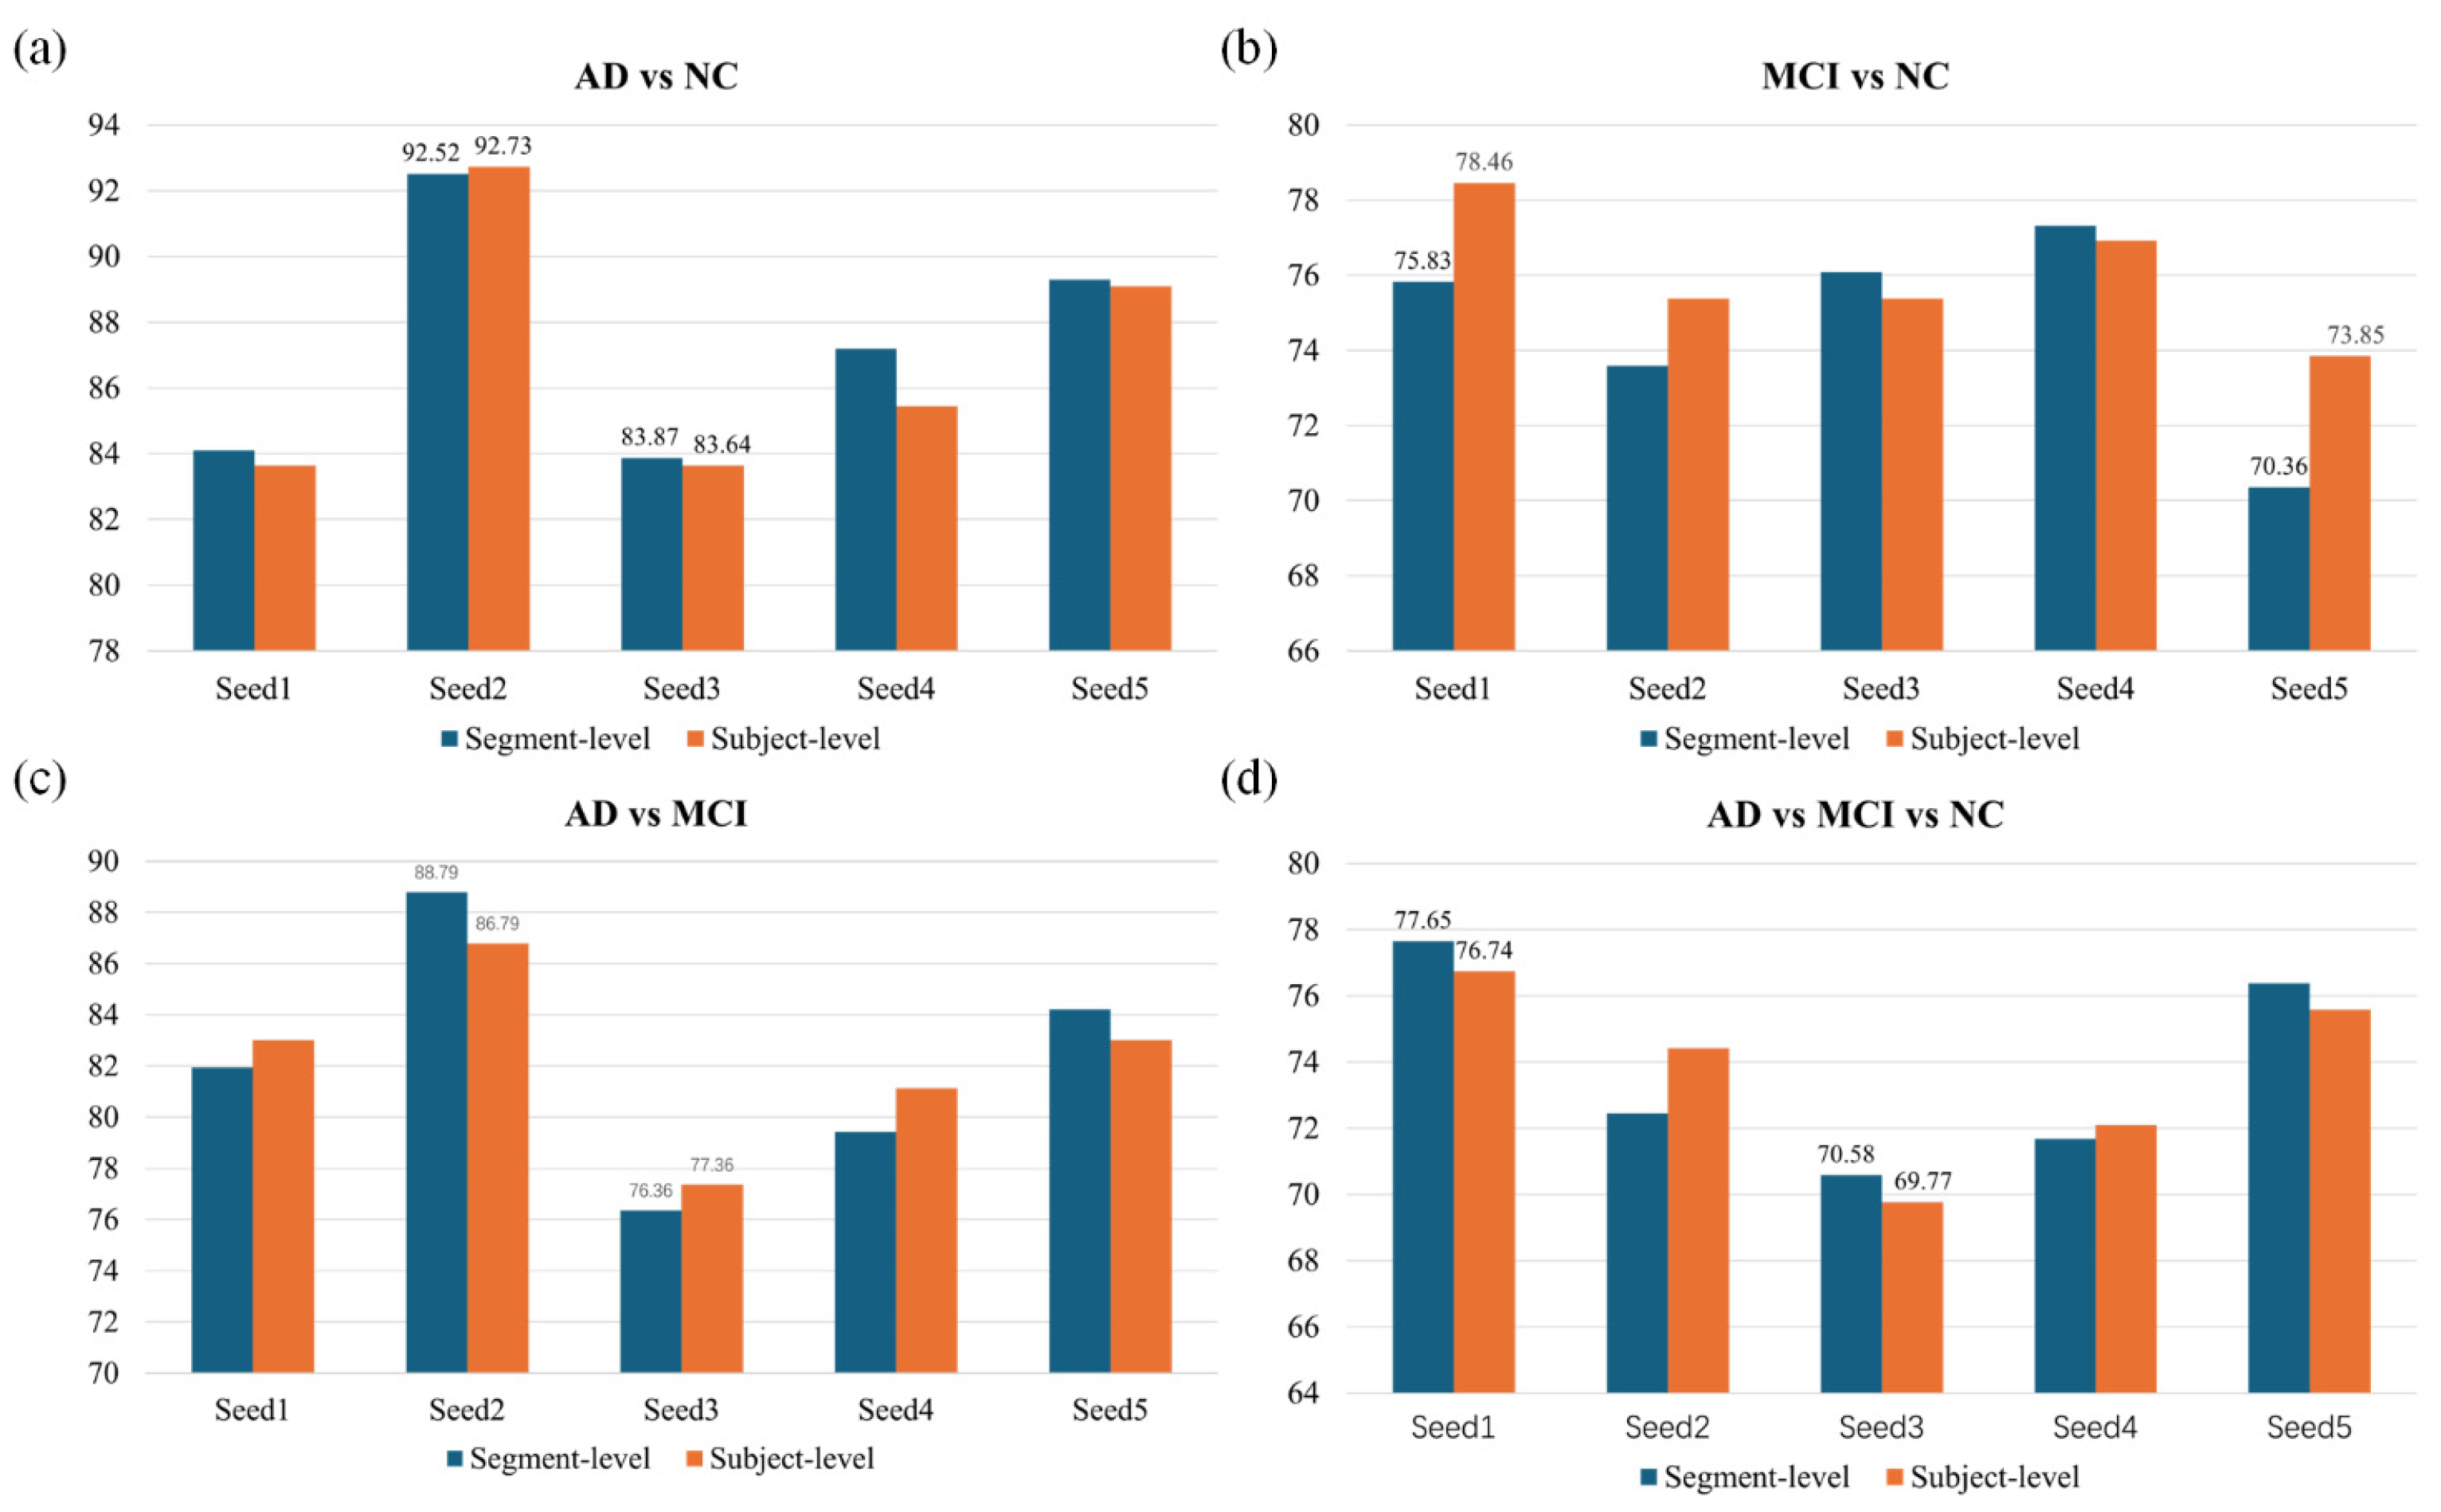
To further evaluate robustness,
Figure 8 presents results across five random seeds for all classification tasks. Subject-level aggregation generally provided more stable outcomes than segment-level predictions, particularly for MCI vs. NC and the three-class task, where pooling reduced variability and improved consistency. In contrast, AD vs. NC and AD vs. MCI showed comparable performance at both levels, indicating that even short ECG segments contained sufficient discriminatory information. These findings confirm that EHANet maintains reliable performance across different random initializations and evaluation levels.
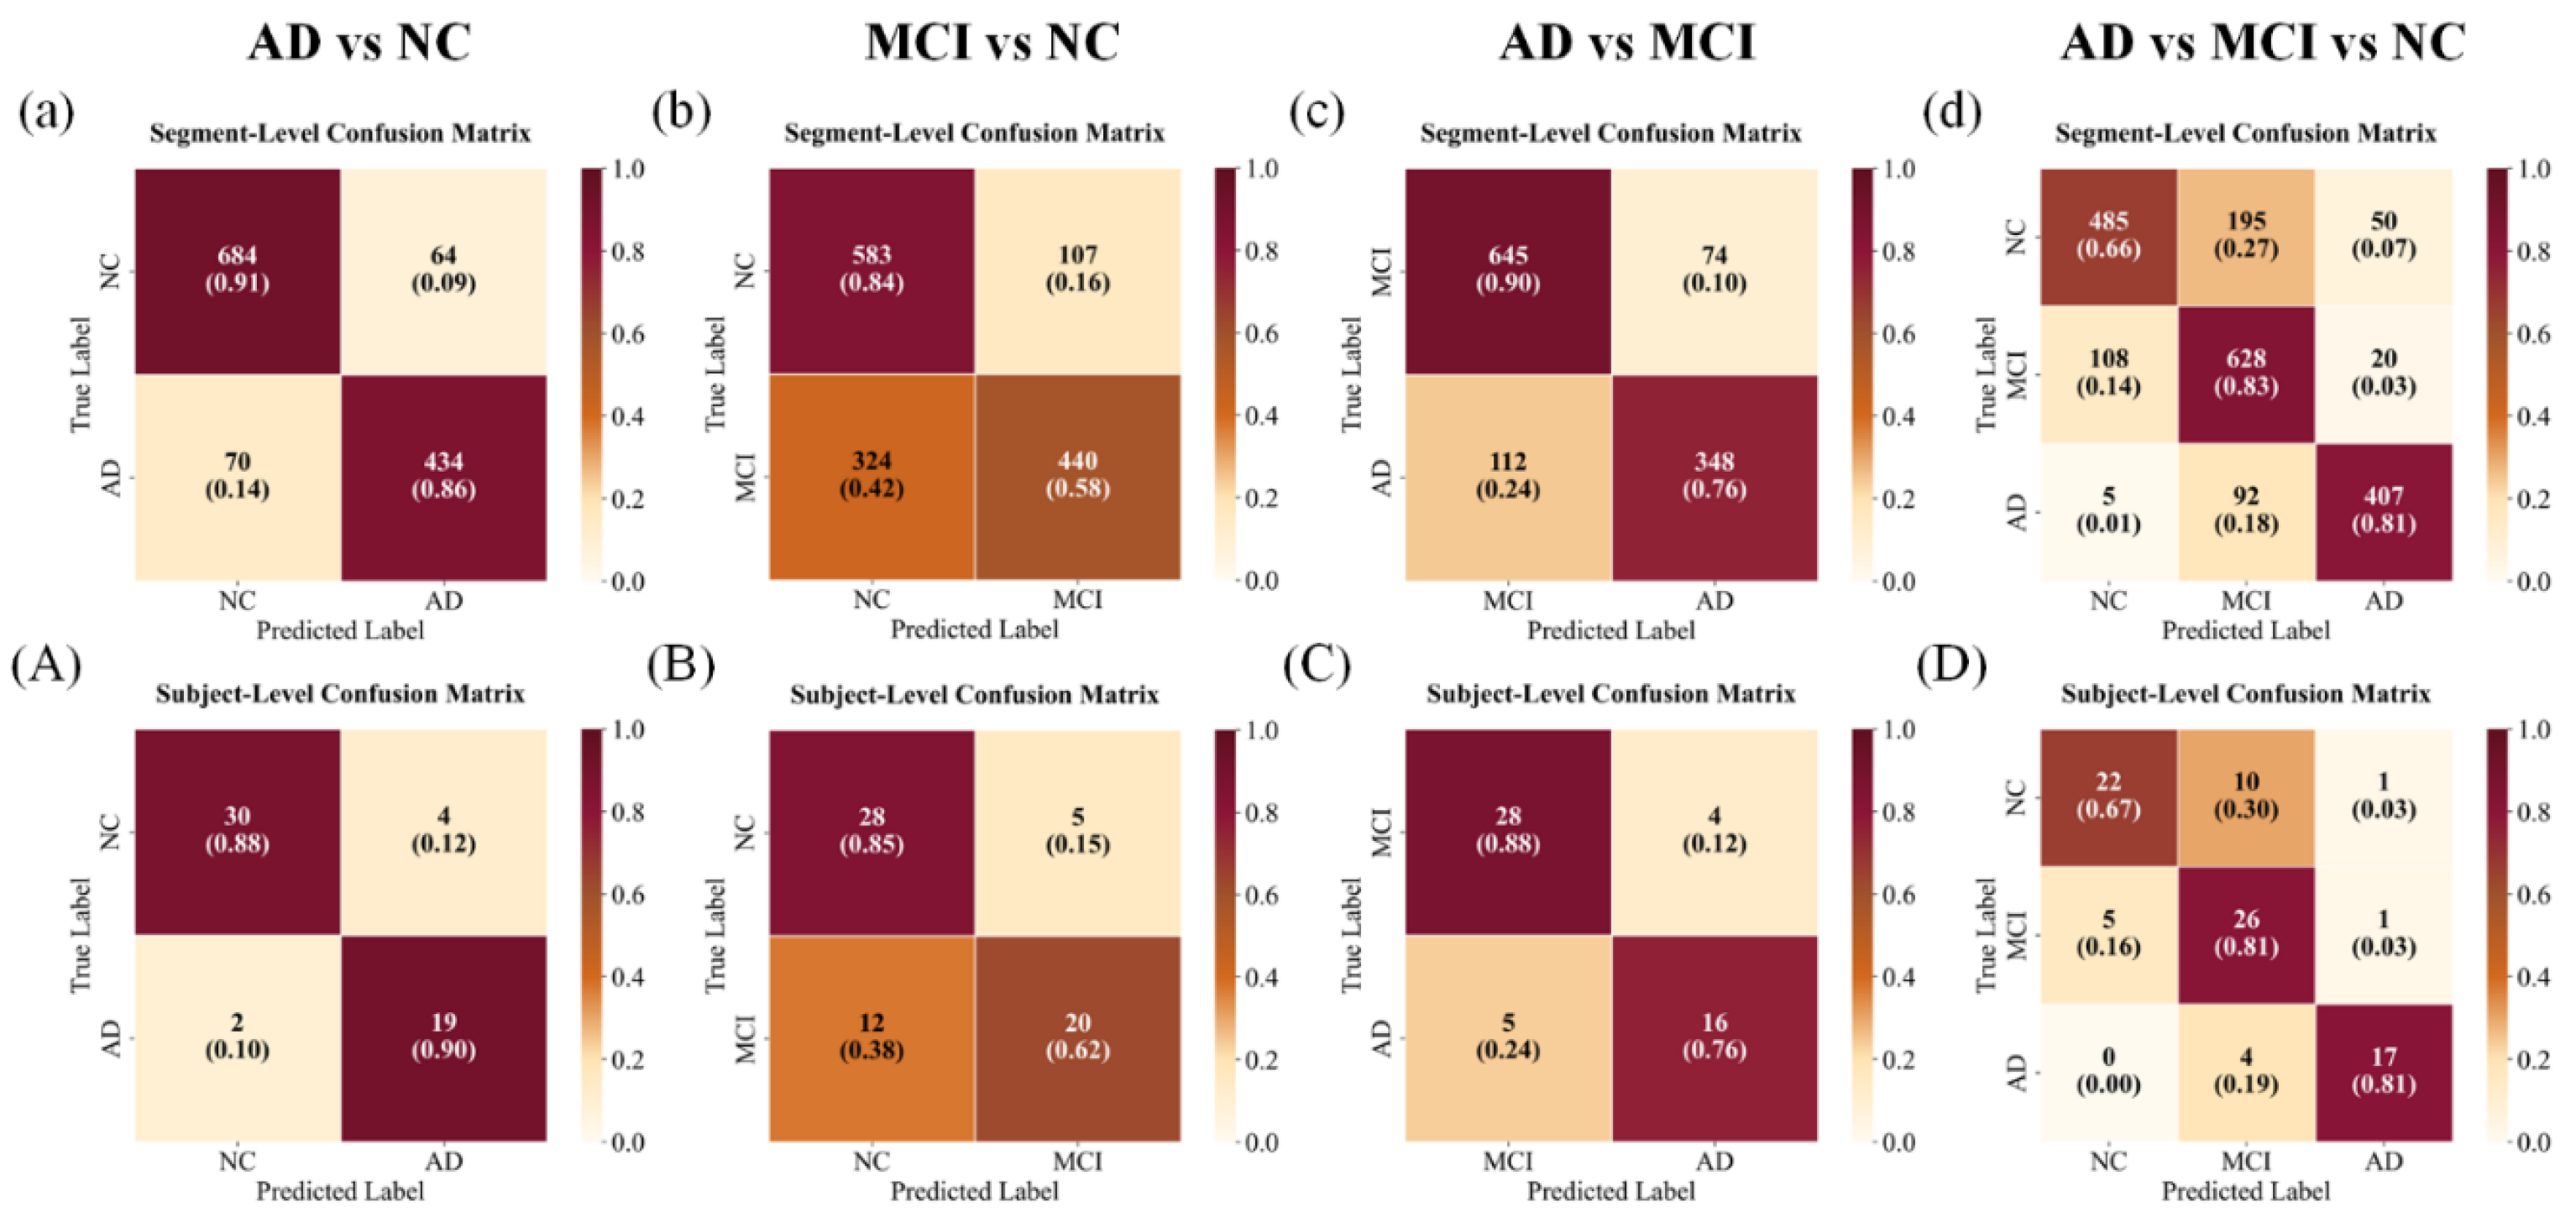
Confusion matrices are presented in
Figure 9. For AD vs. NC, the model achieved high separability, with only a small proportion of AD subjects misclassified as NC. In contrast, MCI vs. NC exhibited substantial overlap, where nearly 40% of MCI subjects were predicted as NC at the subject level, reflecting their clinical continuum. For AD vs. MCI, misclassifications were fewer but still noticeable, primarily involving AD predicted as MCI. In the three-class setting, MCI showed overlap with both AD and NC, resulting in off-diagonal errors. Nevertheless, subject-level aggregation reduced these misclassifications compared with segment-level predictions, demonstrating the stabilizing effect of majority voting.
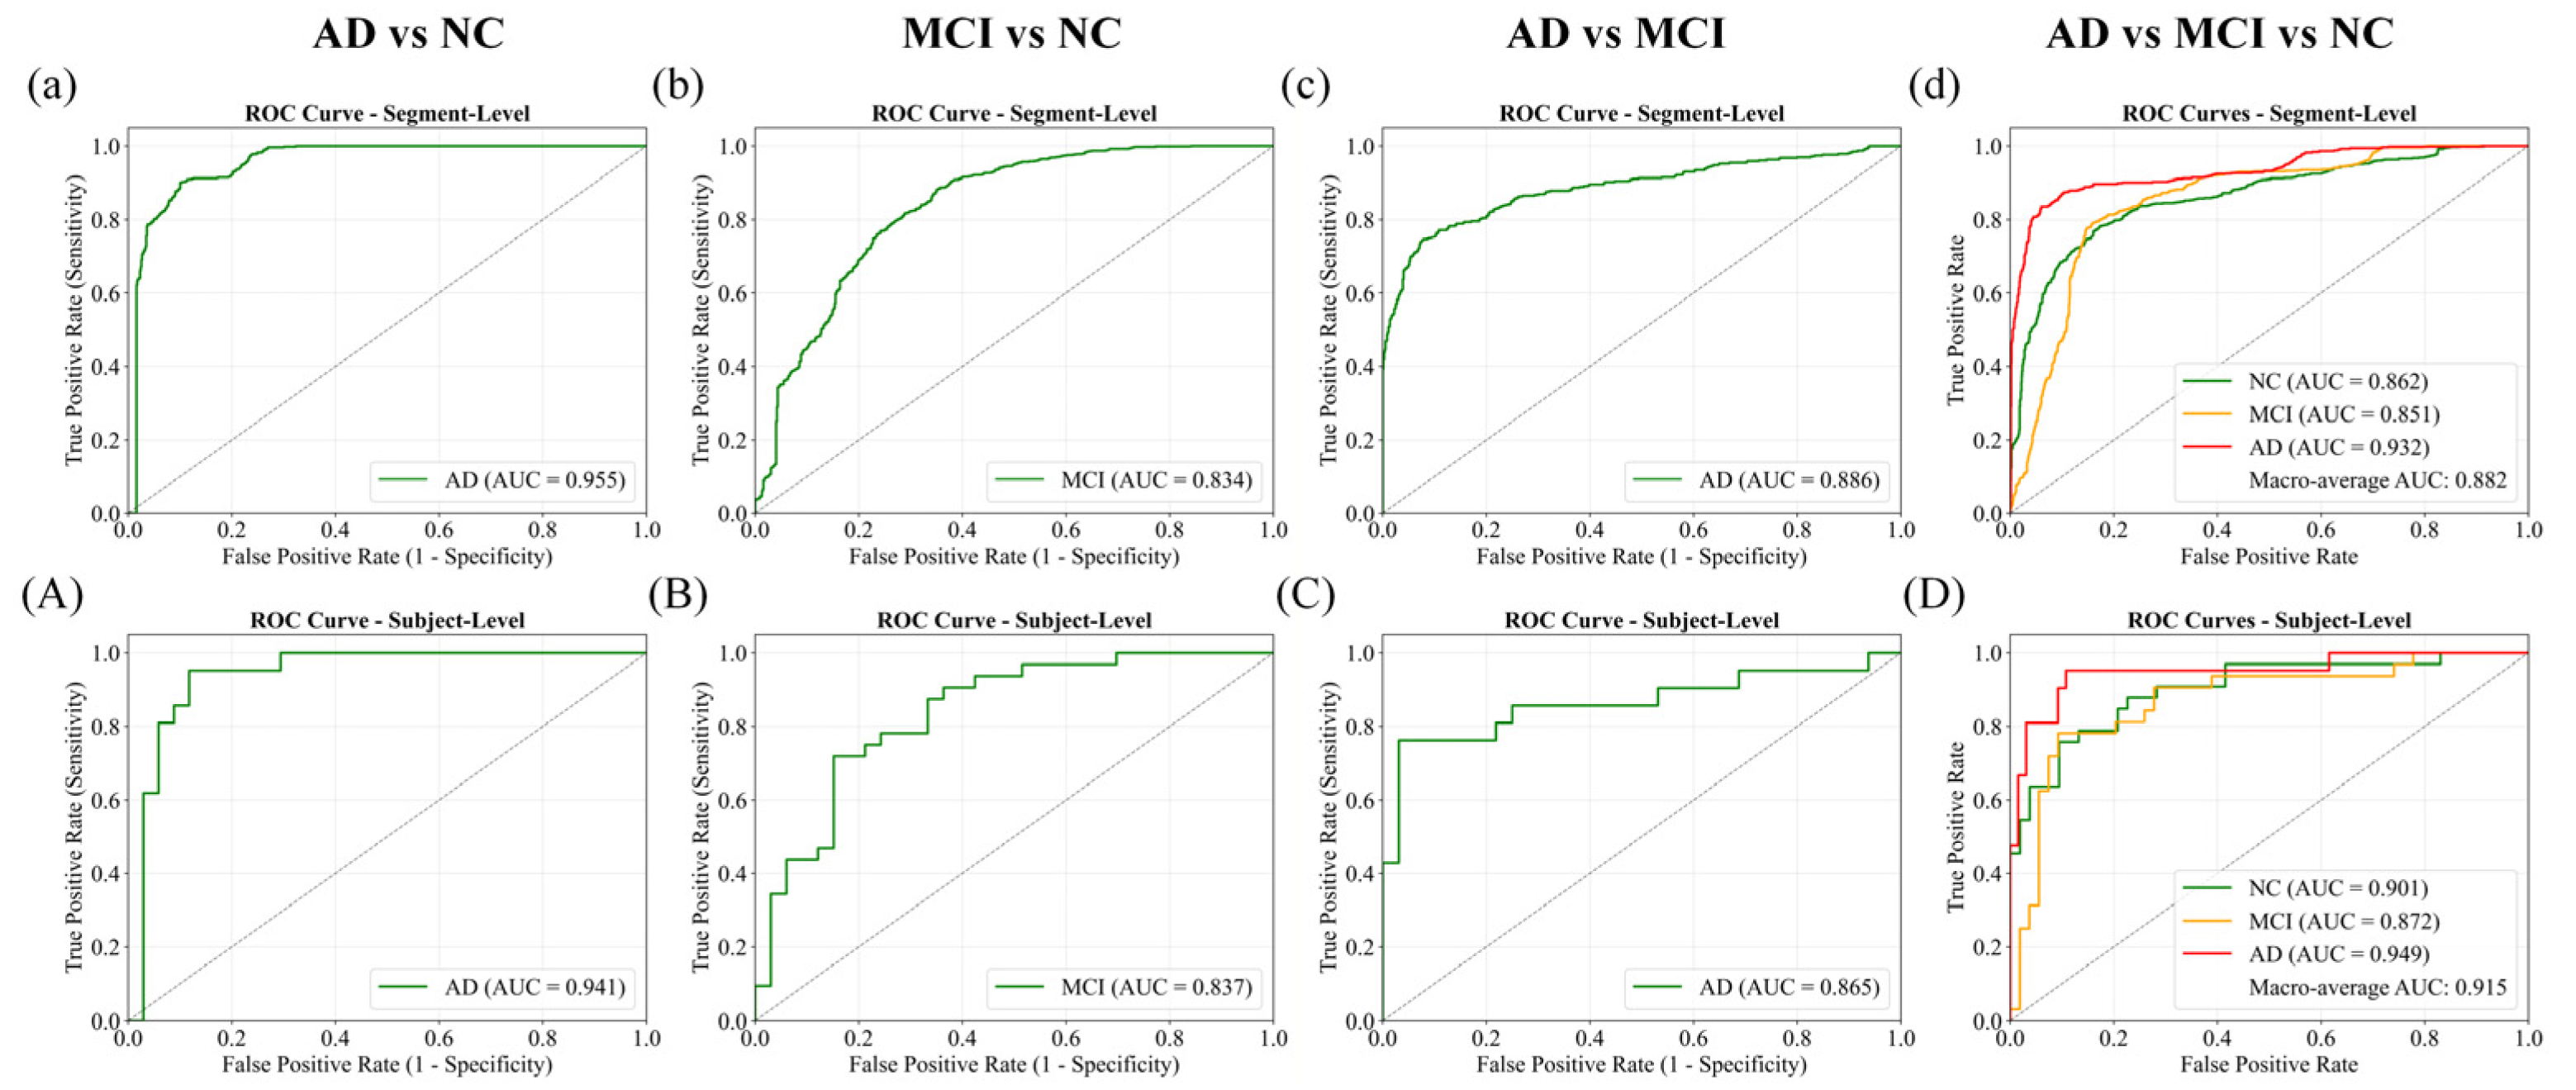
Receiver Operating Characteristic (ROC) curves with corresponding AUC values are presented in
Figure 10. The AD vs. NC task achieved the best discrimination, with AUCs of 0.955 at the segment level and 0.941 at the subject level. AD vs. MCI also performed strongly (0.886 and 0.865), while MCI vs. NC showed lower separability, with AUCs around 0.834–0.837. In the three-class scenario, one-vs.-rest ROC curves confirmed effective separation, yielding macro-average AUCs of 0.882 at the segment level and 0.915 after subject-level aggregation, underscoring the benefit of majority voting in enhancing robustness.
The ablation study results in
Table 5 further underscore the advantage of the hybrid framework. Models trained with HRV or ECG alone consistently underperformed compared with the fused approach. For instance, in AD vs. NC, HRV-only and ECG-only models achieved 73.09% and 76.0% accuracy, respectively, whereas the combined model reached 86.91%. Likewise, for AD vs. MCI, accuracies improved from 63.77% (HRV) and 73.58% (ECG) to 82.26% with fusion. Even in the more challenging MCI vs. NC and three-class tasks, fusion yielded clear gains over single-modality inputs. These results confirm the complementary nature of handcrafted HRV metrics and deep ECG representations, demonstrating that their integration substantially enhances diagnostic performance.
4. Discussion
In this study, we validated the feasibility of diagnosing AD and MCI using ECG signals through both statistical HRV analysis and a hybrid DL framework. Based on the CAUEEG dataset, we demonstrated that HRV features exhibited significant inter-group differences, and that our proposed EHANet, which integrates ECG sequence features with HRV metrics, achieved robust classification performance across four diagnostic tasks. These findings highlight the potential of ECG as a non-invasive and cost-effective biomarker for the early detection of cognitive impairment.
Our HRV analysis, covering time, frequency, and nonlinear domains, revealed progressive alterations in autonomic regulation from NC to MCI to AD. Indices such as RMSSD, HF, and FuzzyEn were reduced in AD, reflecting diminished parasympathetic modulation and loss of physiological complexity, while measures of fragmentation (KLIP, PNNSS, ShanEn-diff) increased, indicating disordered and pathological rhythm irregularities. These results are consistent with previous studies reporting reduced HRV in dementia and its correlation with cognitive decline [
6,
25]. Notably, several features displayed a graded trend across groups, supporting the hypothesis that autonomic dysfunction progresses alongside disease severity.
Nevertheless, we also observed substantial overlap among groups, particularly between MCI and NC. Features such as LF/HF, LFn, and HFn showed significant decreases only in AD patients, consistent with previous findings [
29] that no clear differences exist between MCI and NC under resting conditions. This overlap highlights the clear limitation of relying solely on handcrafted HRV features, as our ablation experiments demonstrated that HRV alone achieved only 51.16% accuracy in the three-class classification, confirming its insufficient diagnostic reliability despite retaining partial discriminative value.
The advantage of EHANet lies in its capacity to fuse HRV metrics with ECG sequence representations. Ablation experiments showed that both ECG- and HRV-only models underperformed compared with the hybrid approach, confirming the complementary nature of handcrafted and learned features. By leveraging residual convolutional networks for sequence modeling and a cross-attention mechanism for feature integration, EHANet effectively captured both heart rate variability and subtle morphological information from ECG, resulting in superior performance, particularly in distinguishing AD from NC and AD from MCI.
To further contextualize our findings, we compared EHANet with state-of-the-art approaches reported in the recent literature, as summarized in
Table 6. Imaging-based methods, such as Hao et al. [
30], achieved high accuracy in binary AD vs. NC classification (95.14%), but their reliance on MRI and PET limits scalability due to cost and invasiveness. EEG-based studies [
4,
5,
31,
32] also reported strong performance, often exceeding 95%, yet these approaches require multi-channel recordings under controlled conditions, which are less practical for routine monitoring. In addition, Xavier et al. [
15] investigated ECG signals with conventional machine learning models, reaching 80.80% accuracy for MCI vs. non-MCI, but this was restricted to a single binary task. By contrast, our proposed ECG-based framework achieved 86.91% in AD vs. NC and 82.26% in AD vs. MCI, with stable performance of 76.0% in MCI vs. NC and 73.72% in the three-class classification. While slightly lower than EEG or imaging modalities, our results highlight the practicality of ECG as a low-cost, portable, and non-invasive tool suitable for large-scale screening and long-term monitoring of cognitive impairment.
Despite these promising results, several limitations must be acknowledged. First, our validation was conducted on a single dataset, which may limit generalizability. Second, sample size remains modest compared with large-scale imaging or genetic studies. Future research should include multi-center datasets with diverse demographics to further confirm the robustness of ECG-based biomarkers. Additionally, integration with other modalities, such as EEG or clinical assessments, may enhance diagnostic accuracy. Finally, real-world validation using wearable devices is necessary to fully establish ECG’s role as a practical tool for early AD and MCI screening.
5. Conclusions
ECG signals can be easily acquired from wearable devices, offering non-invasiveness, portability, and low cost, which makes them highly suitable for long-term monitoring and large-scale screening. If effectively applied to AD detection, they could reduce the psychological, temporal, and economic burden on patients while alleviating national healthcare costs.
In this study, we investigated AD, MCI, and NC subjects from the CAUEEG dataset. We conducted a comprehensive HRV analysis across time, frequency, and nonlinear domains, identifying 23 features with significant group differences (p < 0.001). Furthermore, we proposed the EHANet DL architecture, which fuses ECG sequences with HRV features, and systematically evaluated its performance in four classification tasks. The final accuracies achieved were 86.91%, 76.0%, 82.26%, and 73.72% for AD vs. NC, MCI vs. NC, AD vs. MCI, and AD vs. MCI vs. NC, respectively. These results confirm that ECG signals, when combined with HRV features, can serve as an effective biomarker for the early detection and daily monitoring of AD and MCI.
