Article

Implications of Discrete vs. Continuously Adjustable Current for Electrically Heated Catalytic Converters

by
Marko Petkovšek
1,*,
Peter Zajec
1,
Mitja Nemec
1,
Andraž Rihar
1,
Danjel Vončina
1,
Vanja Ambrožič
1,
Jure Golob
2 and
David Nedeljković
1
1
Faculty of Electrical Engineering, University of Ljubljana, Trzaska 25, SI-1000 Ljubljana, Slovenia
2
BU Hidria Advancetec, Hidria, Poljubinj 89a, SI-5220 Tolmin, Slovenia
*
Author to whom correspondence should be addressed.
Appl. Sci. 2025, 15(23), 12483; https://doi.org/10.3390/app152312483
Submission received: 26 October 2025 / Revised: 21 November 2025 / Accepted: 22 November 2025 / Published: 25 November 2025
(This article belongs to the Section Electrical, Electronics and Communications Engineering)

Abstract

Despite the obvious shift in daily commuting towards electromobility, internal combustion engines (ICEs) still dominate the market, particularly in the transport sector. Their main drawback—cold-start emissions—has driven the development of active control strategies beyond passive exhaust optimizations. An electrically heated catalytic converter (EHC) helps the catalytic converter reach the light-off temperature more quickly through active control; however, it places additional demands on the already strained onboard electrical power distribution network. This paper presents a case study comparing two power supply and control configurations for managing the temperature of the EHC: (i) a smart-switch-based approach using bang-bang control, and (ii) a DC/DC converter with a proportional–integral–derivative (PID) controller. To define key target requirements for a dedicated DC/DC converter suitable for real-world conditions, measurement data such as temperature and electrical power demand were gathered through preliminary pollutant emissions tests performed in a laboratory environment using a programmable bench power supply. For the selected test procedure, engine cold-start emissions using various heater power supply scenarios were reduced by a factor of 6 for Total Hydrocarbons (THC) and by a factor of 5 for Carbon Monoxide (CO). Based on a comparative analysis of power supply parameters, a custom four-leg interleaved Buck converter was developed to meet the target power requirement and to specifically reduce voltage overstress caused by parasitic inductances in the onboard distribution network during rapid load current transients. The efficiency of the proposed DC/DC converter reached 95.8%. Unlike a bang-bang-controlled smart switch, the use of the DC/DC converter reduces both electrical and thermal stress on the vehicle’s cable harness.

1. Introduction

In recent decades, a marked trend of population migration towards larger urban centres and their surrounding areas has become increasingly evident [1,2]. Although urban environments are often perceived as offering advantages such as proximity to employment opportunities, educational institutions, healthcare facilities, and other services, the prevailing lack of environmental awareness and suboptimal use of e-mobility solutions and public transport often result in continued reliance on privately owned motor vehicles powered by internal combustion engines (ICEs).
This reliance is reflected in vehicle registration data, with a 0.8% increase in the number of newly registered cars in Europe in 2024, of which approximately 83% are either fully fossil-fuel powered or hybrid vehicles. Diesel-powered cars account for approximately about 12% of all new registrations [3]. Their market share is gradually declining due to electric vehicles (EVs) and other alternative fuel vehicles, but this transformation is relatively slow. Increased traffic density, particularly pronounced in major urban areas, is largely driven by daily commuting from peripheral and more remote regions. This has led to longer travel times over relatively short distances, as an average European Union employee travels 25 to 30 km per day, requiring an average of 80 to 90 min [4,5]. Such conditions lead to prolonged low-speed driving and frequent traffic congestion, contributing substantially to exhaust emissions from ICE vehicles and exerting a significant negative impact on the environment. Although emissions per vehicle are declining annually due to increasingly stringent environmental regulations and advancements in automotive technologies, the cumulative environmental burden remains considerable. Manufacturers of ICEs are meeting emissions limits through improvements to engine design and advanced fuel and air flow control. However, the main component that reduces harmful exhaust gases is the modern exhaust system with a catalytic converter, where, at high temperatures, harmful gases are converted into less harmful ones.
Preheating exhaust gases to improve catalytic converter efficiency, whether in traditional internal combustion vehicles or hybrid vehicles with auxiliary traction batteries, inevitably increases the consumption of primary energy sources. This includes both fuel and stored electrical energy [6]. Such an increase directly affects the overall energy management of the propulsion system, which has been a major focus of many research studies [7,8,9,10]. Notably, higher use of fossil fuels not only reduces fuel efficiency but also raises NOx emissions, worsening environmental problems. At the same time, greater electrical energy demand affects battery sizing and, more recently, influences the design and optimization of hybrid energy storage systems (HESSs) [6,11,12,13,14,15,16].
Methods for supplying heating power vary considerably. For example, Hamedi et al. adjusted the heating power using a variable voltage and current supply at three different levels (443 W, 603 W, and 885 W). In [17], Culbertson et al. (2015) described a heater comprising five spiral-wound heating elements, each rated at 6 kW, and demonstrated the scalability of such solutions. Likewise, Velmurugan et al. [18] compared adaptive temperature control with constant-power heating, highlighting the influence of control strategy on overall energy management. From an electronics perspective, Fricke et al. [19] studied the design of electronic control units (ECUs) that use isolated DC/DC converters optimized for different heating elements. Among the topologies explored for high-voltage batteries, the Phase Shift Full Bridge (PSFB) is identified as a commonly used solution. While bang-bang control strategies have been widely examined in earlier works [9,20], particularly regarding trade-offs between energy delivery and overall system performance, system-level assessments often remain oversimplified. Even when battery models and related losses are included, the supply current is frequently approximated as a simple DC waveform, or sometimes the waveform details are entirely ignored [12,17]. This overlooks the fact that bang-bang control inherently generates a pulsating current waveform. As a result, critical issues such as disturbances in the vehicle electric distribution network—especially those caused by high di/dt values, and impact on management accuracy—are inadequately explored in existing studies.
This study investigates the integration of a supplementary electric heater into a validated internal combustion engine (ICE) test system to experimentally determine the electrical power required for effective catalyst preheating. Although a validated ICE test system and a comprehensive dataset from previous campaigns—including measurements of engine efficiency, pollutant-specific emissions, thermodynamic properties and operational behaviour across various conditions—were available, these were not utilized due to the unknown heat transfer modelling between the heater and catalyst. Consequently, estimating the needed power theoretically would require a detailed heat transfer analysis, which is complex due to factors such as intake air flow, exhaust gas properties, component thermal mass, and heater–catalyst geometry, making such modelling highly uncertain. To overcome these limitations, a fully experimental approach was adopted in this study, enabling direct measurement of the heater’s real-world effect and providing a reliable basis for subsequent optimization.
The paper is organized as follows. Section 2 reviews the background of pollutant emissions measurement in internal combustion engines, focusing on the operating characteristics of the catalytic converter (CC), particularly the Diesel Oxidation Catalyst (DOC) used in diesel ICEs. The section discusses how CC efficiency in reducing harmful emissions depends on its temperature, introduces the concept of an electrically heated catalytic converter (EHC) employing a pre-heating strategy, and outlines the standardized test procedures used to enable comparable emission assessments. Section 3 presents preliminary experimental results from the test engine setup under two configurations: (i) with an OEM-equipped catalytic converter and (ii) with an EHC. This section also analyses the electrical power required for emission reduction when using the EHC, based on real-time measurements. These insights form the foundation for Section 4, which describes the development of a customized DC/DC converter for onboard EHC operation. Section 5 analyses experimental results with the proposed DC/DC converter and EHC in terms of pollutant emissions reduction and investigates power delivery issues for two common control approaches.

2. Diesel Internal Combustion Engine Pollutant Assessment—From Regulatory and Testing Requirements to Typical EHC Arrangements

2.1. Pollutant Emissions and Catalytic Converter

Pollutant emissions such as Total Hydrocarbons (THC), Carbon monoxide (CO), and Nitrogen oxides (NOx) from ICEs vary greatly. Their values depend mainly on the ICE type (diesel or petrol), the vehicle manufacturer’s technology, driving conditions, and driving style. The main component that can significantly reduce polluting emissions from diesel ICEs is an efficient exhaust system, including its pertinent CC and a DPF (Diesel Particulate Filter). The CC operates on the principle of oxidation—a chemical reaction that converts CO into CO2, hydrocarbons into CO2 and water, and NOx into nitrogen and oxygen—while the DPF acts as a physical barrier to capture particulate matter (soot) from the exhaust gases. In this paper, we focus on a CC designed to reduce the harmful emissions of diesel ICEs, primarily THC and CO.
Several factors affect the efficiency of the catalytic process, as thoroughly reviewed in [21,22], but catalyst temperature is the most crucial. During engine operation, exhaust gases flow through the CC, gradually raising its temperature from a cold start. Although the temperature-efficiency relationship is not straightforward, studies consistently report that the light-off temperature, at which the CC reaches 50% efficiency, typically exceeds 250 degrees Celsius [23,24]. Reducing both the light-off temperature and the light-off time—the interval from engine start to 50% CC efficiency—has become a major focus of recent research, aiming to minimize cold-start emissions [12,16,17] and improve overall system performance. Technologies implemented to increase CC efficiency at engine start-up range from the split catalyst converter (pre-cat) [25], a smaller unit that warms up more quickly in front of the main catalyst, to gas collection and retention using a lean NOx trap (LNT) adsorber [26], and electrically heated catalysts, which have proved to be a very efficient approach since the 1980s, although initially only in premium class vehicles [27]. The EHC directly addresses the main reason for the CC not operating efficiently, which is its low temperature. This occurs not only at initial engine start, but also during modern driving conditions involving many relatively short journeys, low-speed driving, or idling (start–stop function). The same effect is inherent in hybrid vehicles, where the CC unit is not fully functional due to only intermittent ICE operation, resulting again in input gases that are too cool to start and maintain the desired chemical processes inside the CC [24,28].

2.2. Pollutant Emissions Test Procedures

To obtain representative and comparable values not only for pollutant emissions but also for energy efficiency across different propulsion technologies, various test procedures have been introduced by researchers and car manufacturers worldwide [29,30,31,32,33,34]. However, since the early 1990s, European (and other) car manufacturers have primarily relied on the NEDC (New European Driving Cycle) test cycle [35], which has been updated over the years to reflect changes in technology and evolving driving habits. The test consists of two parts: the first is a series of four repetitions of an ECE15 urban driving cycle, and the second is the Extra Urban Driving Cycle (EUDC), which is suitable for higher speeds. Both parts were selected to reflect typical driving conditions in busy European cities, with four lower-speed ECE15 repetitions followed by a second part where the vehicle accelerates up to 120 km/h, as shown in Figure 1a. Modern driving conditions, and especially the introduction of other propulsion technologies (electrically assisted hybrid and then electric vehicles), led to a new testing protocol—the WLTP (Worldwide harmonized Light vehicles Testing Procedure), which was adopted in 2017 [36]. This test aims to represent modern real-life driving conditions more accurately, as it incorporates quicker accelerations, higher average speeds throughout the test (Figure 1b), and the influence of other equipment used in the car. A thorough comparison between the NEDC and WLTP procedures was provided by Pavlovic et al. in [37], even before the official introduction of the WLTP. In addition to these two testing procedures, other tests have been developed to address specific research aspects in more detail, as reported in [38,39,40,41,42]. However, it should be emphasized that the majority of available data is still obtained using the relatively simple-to-implement NEDC and the more demanding (as it requires more data points) and longer WLTP procedure.

2.3. Typical Layouts/Arrangements of Electrically Heated Catalytic Converters

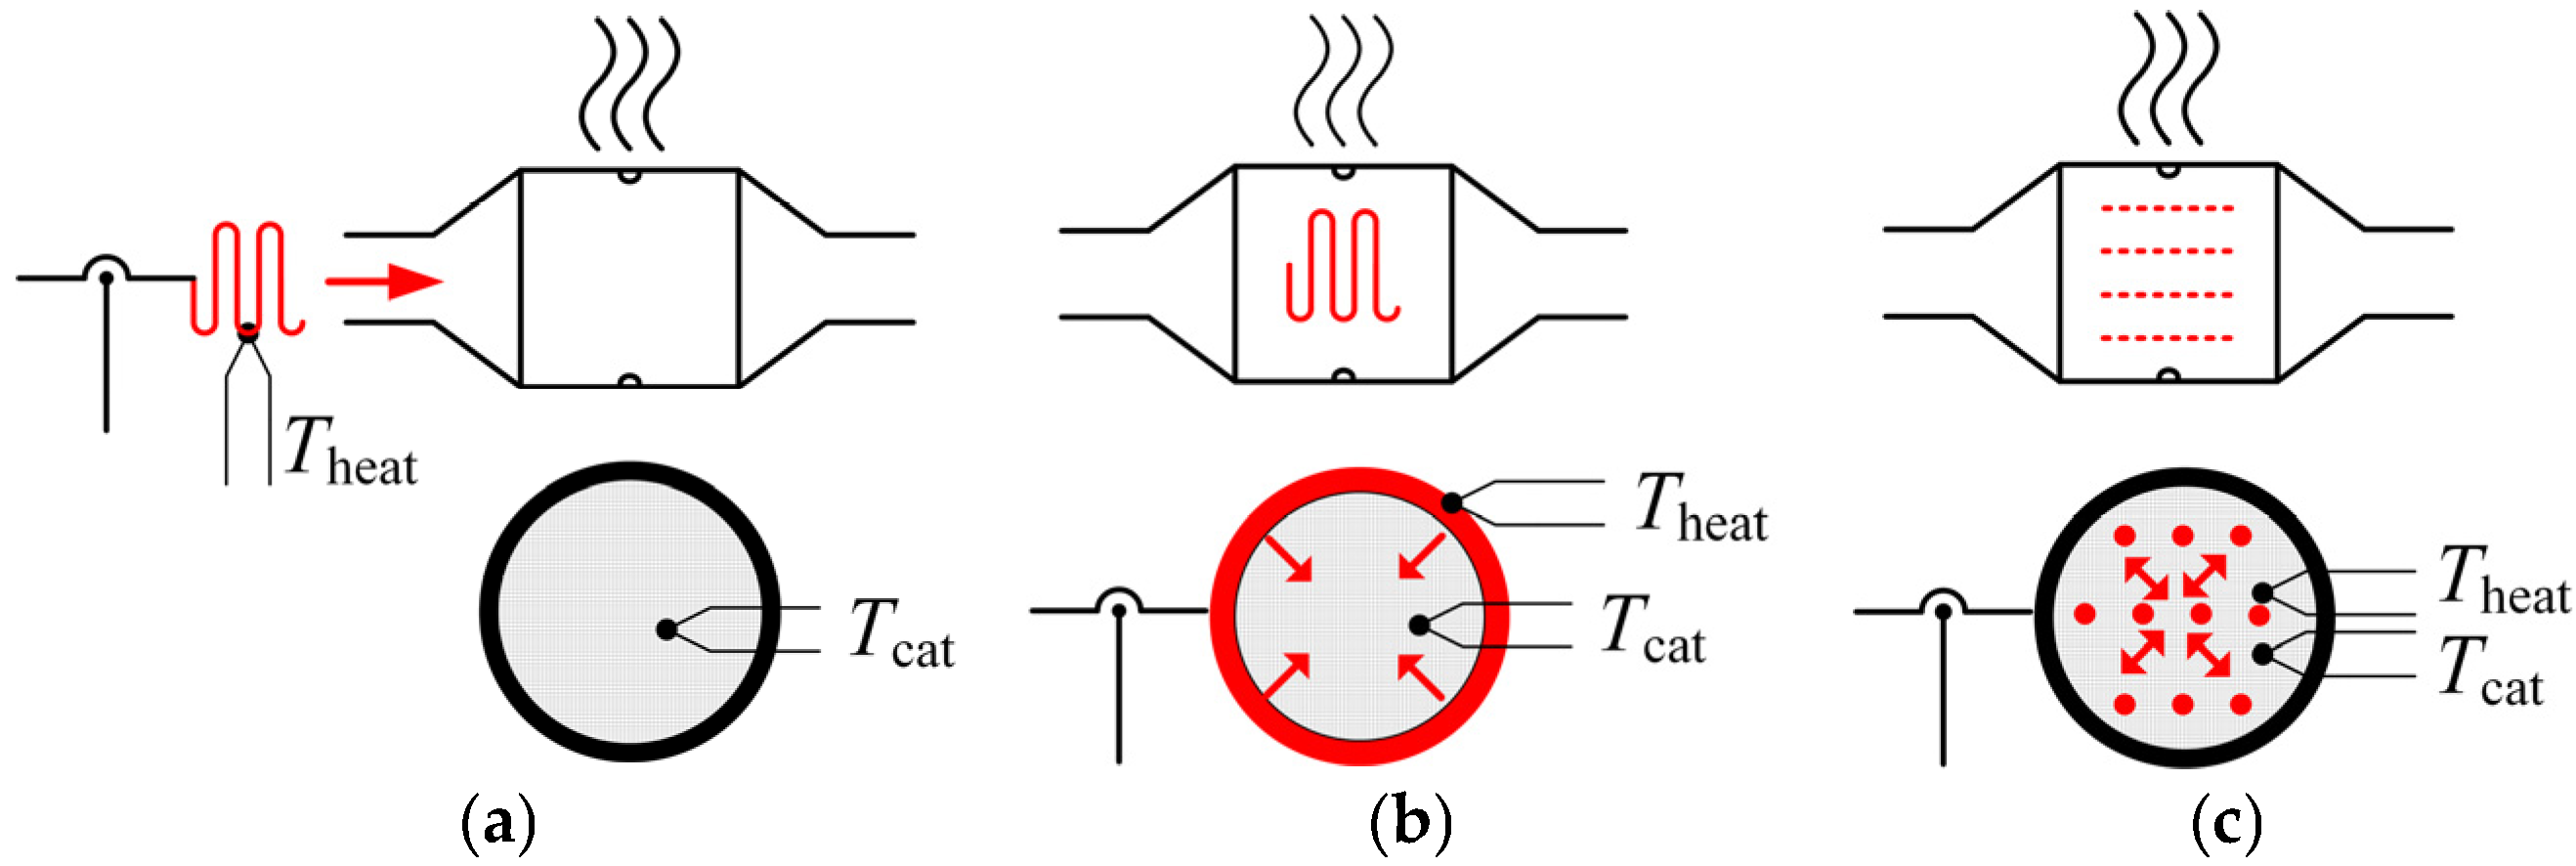
Known EHC layouts, as shown in Figure 2, can be broadly classified into three fundamental concepts, which primarily differ in the mechanism and efficiency of heating the CC substrate. The first two approaches involve indirect heating, where a dedicated heater is placed either (Figure 2a) upstream [43] or (Figure 2b) wrapped around or inside [44] the CC, transferring heat through conduction and convection. One of the main drawbacks of the first solution is that thermal energy transfer of energy from the heater to the CC substrate relies on convection. This layout is susceptible to variations in exhaust airflow, which can significantly reduce the efficiency during ICE cold starts or when the ICE operates at low speed. The second approach requires a dedicated CC with EH component being either fitted onto or installed inside the catalyst already at the CC design stage, which presents a considerable challenge when selecting suitable materials for both optimal chemical processes and efficient heat transfer. On the positive side, it is independent of exhaust airflow. The third concept employs inductive heating [45], where the core of the CC substrate is directly heated via electromagnetic induction (Figure 2c), again eliminating energy transfer via exhaust airflow. This distinction is crucial for the overall efficiency of the system, particularly to improve the response under transient ICE operation, such as during cold starts.

3. Experimental Setup with a Custom Upstream Heater Installed in Front of the CC

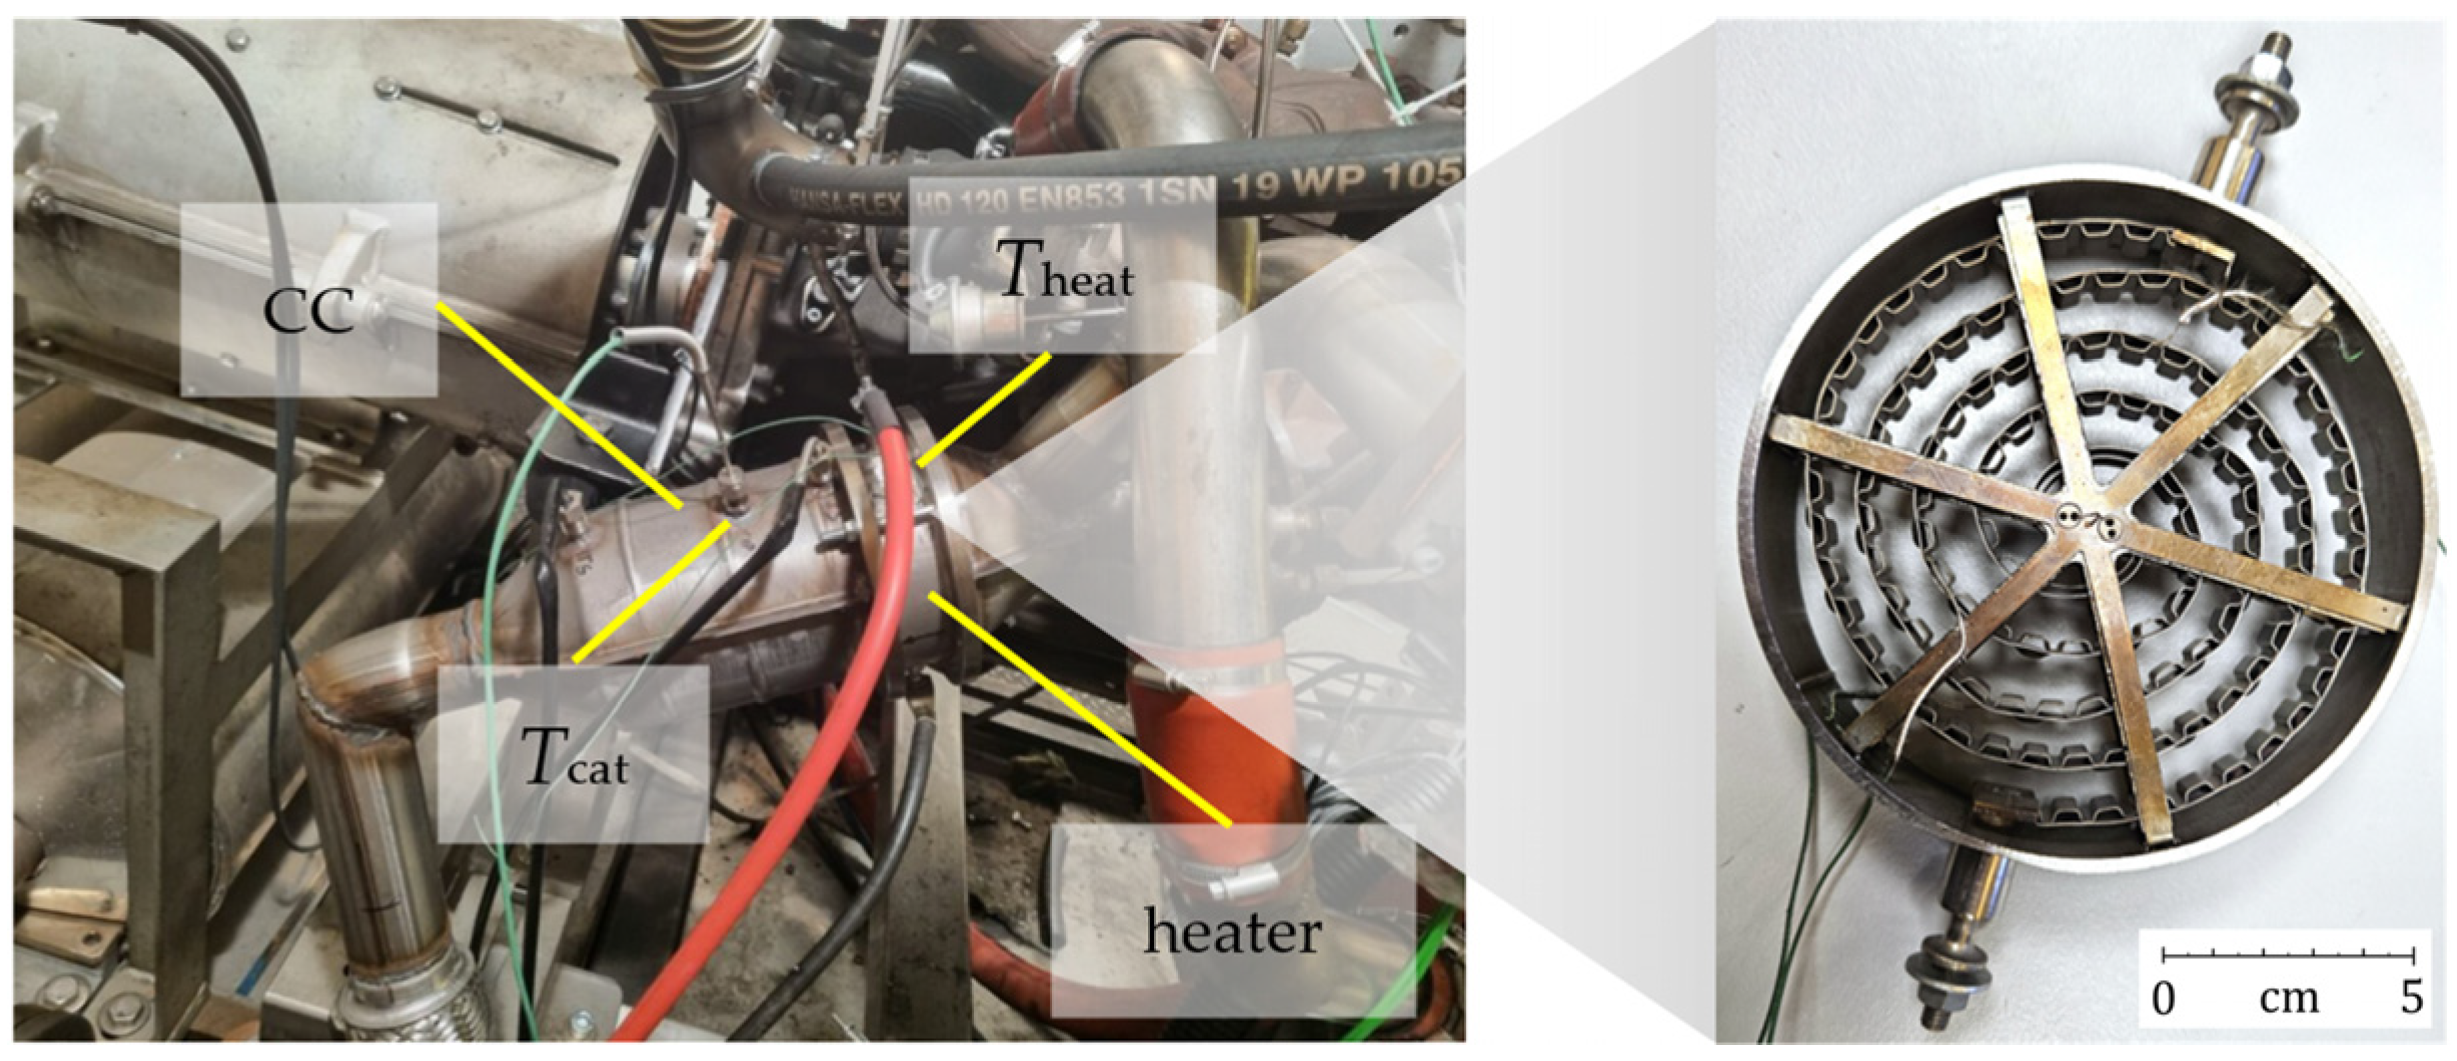
We implemented an EHC layout, as shown in Figure 2a, by integrating a custom-designed heater (130 mm diameter, 30 mm height) with a nominal resistance of 0.42 Ω, positioned between the ICE exhaust manifold and the existing CC (Figure 3). Although this placement does not provide an ideal thermal configuration, it allowed us to preserve the integrity of the existing exhaust system with minimal mechanical modifications—an essential requirement at the time, as parallel measurement activities depended on the system remaining largely unaltered.
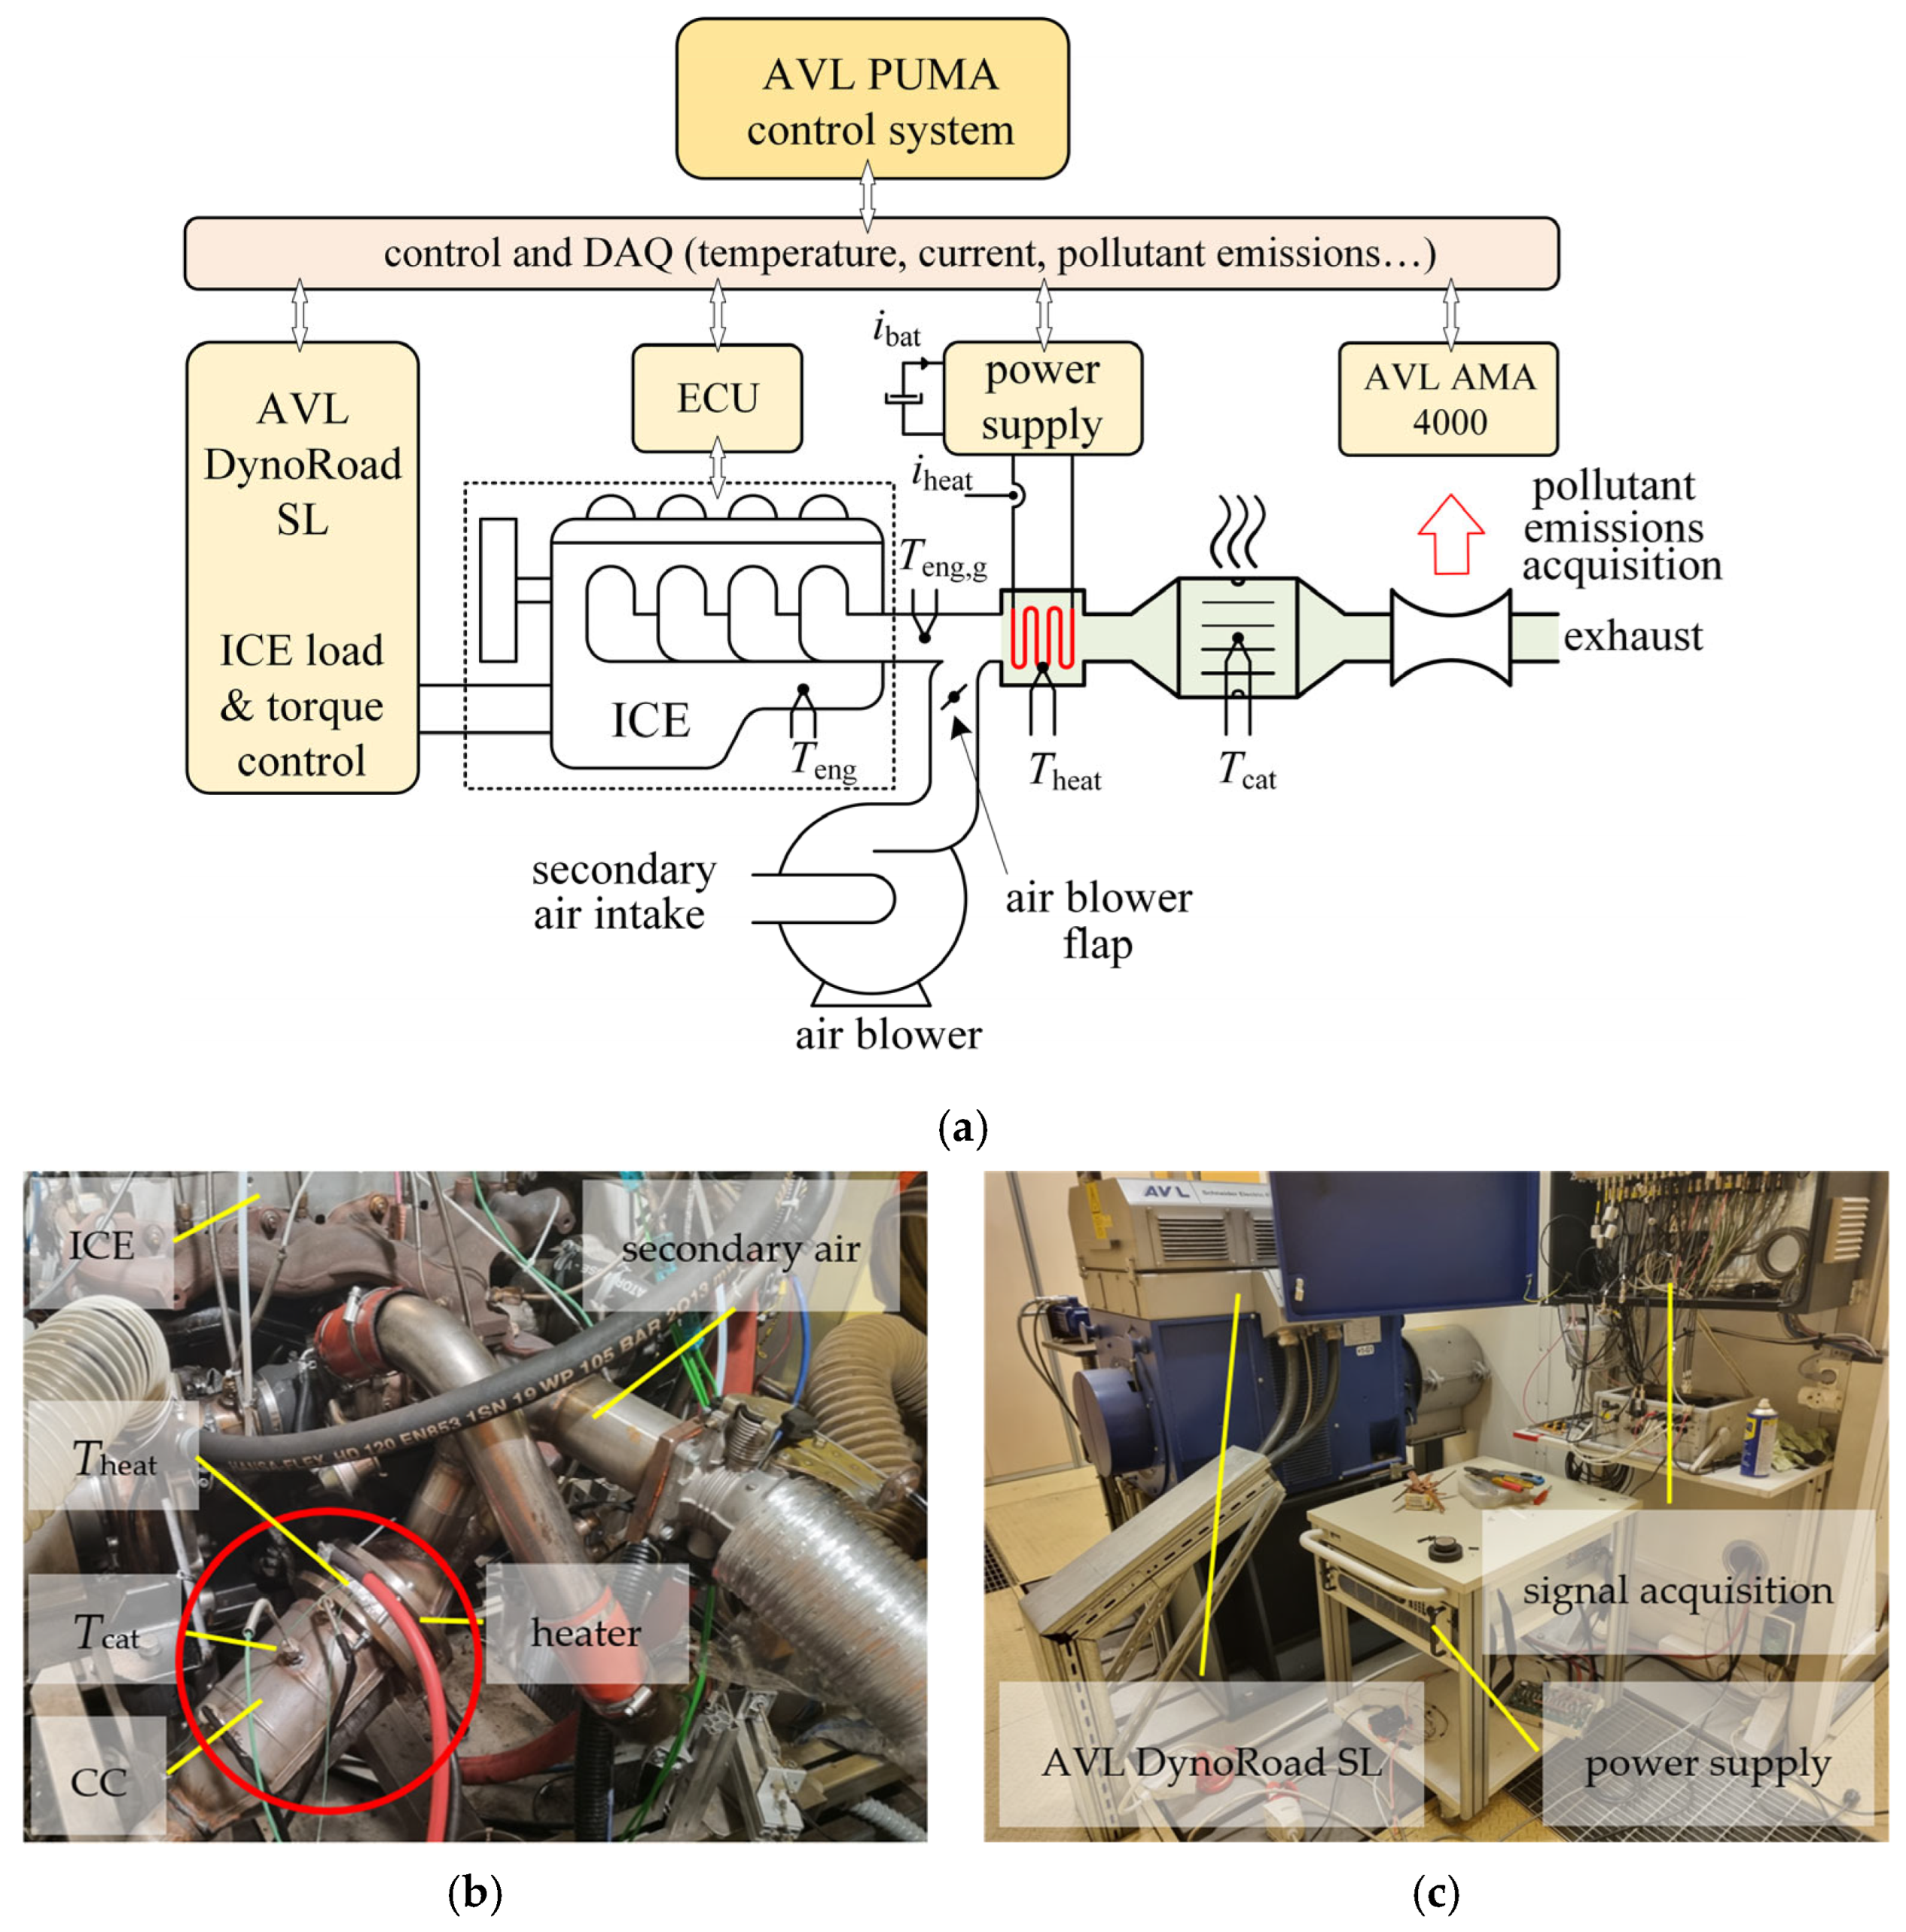
The ICE used in the system was a 2500 cm3, 100 kW common rail injection turbo diesel engine VM R425 (EURO 4 class) equipped with an OEM catalytic converter. The main components of the test setup are shown in Figure 4a, including an air blower for secondary airflow, an air blower flap, and thermal sensors (Figure 4b), which were added as necessary modifications to enable flexible airflow control and precise thermal monitoring. Secondary airflow was actively controlled by the testing procedure, with airflow enabled only during the engine-off phase to ensure sufficient heat transfer from the heater to the CC. After ICE start-up, the secondary air flap was closed automatically to prevent exhaust gases from escaping through the fan into the testing environment. It should be emphasized that the electric heater can only be activated if there is either exhaust flow or secondary airflow present, ensuring sufficient heat transfer and preventing the heater from exceeding its thermal limit.
Pollutant emissions, including THC, CO, CO2, and O2, were measured using the AVL AMA 4000 (AVL, Graz, Austria) emission test bench, which has a nominal accuracy below 1%, together with the auxiliary equipment. The obtained emissions results represent the volumetric concentrations of individual pollutants in the exhaust gas, and not the regulatory emissions figures provided by car manufacturers. In the following discussion, only the two most indicative pollutants, CO and THC, are considered. The AVL PUMA control system managed data acquisition (DAQ) of relevant temperatures, key electrical and mechanical quantities, the heater’s power supply, and control of ICE operation (speed, load, and torque) via the ICE’s electronic control unit (ECU) and the AVL DynoRoad SL unit (Figure 4c).

3.1. Experimental Results of Pollutant Emissions with OEM-Equipped CC

Pollutant emissions tests were conducted with a test cycle, based on the NEDC cycle shown in Figure 1a, but significantly extended to investigate the correlation between engine temperature Teng, engine exhaust gas temperature Teng,g, catalyst core temperature Tcat and, in particular, the two most indicative parameters of pollutant emissions—CO and THC—of the OEM-equipped catalytic converter (CC) with and without an electrical heater. We performed several tests under identical operating conditions to exclude possible variations and to confirm repeatability. To ensure the same starting point, only one test per day was conducted in a controlled environment with a room temperature of 21 °C for each set of studied parameters, following the selected speed profile and ICE load/torque data. The selected speed profile consisted of four ECE15 cycles, followed by four EUDCs, and concluded with another four ECE15 cycles, as shown in Figure 5.
A detailed analysis of emissions was conducted for various intervals of the tested speed profile (labelled 1 to 4 in Figure 5a,b). In interval 1 (from 0 s to 340 s), we aimed to encompass the emissions accumulated from the engine’s cold start at ambient temperature until the end of the first ECE15 cycle. Interval 2 (from 340 s to 950 s) sums the emissions of the following three ECE15 repetitions. Interval 3 (from 950 s to 2530 s) addresses the four EUDC repetitions, whereas interval 4 (from 2530 s to 3350 s), with its four ECE15 repetitions, was selected for direct comparison with the combined intervals 1 and 2.
In the absence of electrical heating, the results shown in Figure 5 indicate that Tcat, influenced by the engine exhaust gases with an average temperature of Teng,g, does not reach the light-off temperature required for the catalyst to operate efficiently (i.e., above 250 °C) when running at low speeds, specifically in intervals 1 and 2 during the four ECE15 repetitions—from 150 s to 950 s. However, in interval 3, with higher speeds (four repetitions of the EUDC), Tcat is sufficiently high to efficiently reduce emissions. In the final part of the test (interval 4), where the engine again followed the four ECE15 cycle speed profile, pollutant emissions rise once more due to insufficient CC temperature. It is evident from Figure 5a that Teng in this part is considerably higher compared to values during intervals 1 and 2 of the initial four ECE15 cycles. However, the difference in Tcat between the observed intervals (1 and 2 vs. 4) is not as pronounced, as it closely follows the same pattern and values in both sections in correlation with vehicle speed. Comparing the cumulative volumetric concentrations in Figure 5b for intervals 1 and 2 with those in interval 4, it can be concluded that, despite having the same speed profile and duration, interval 4 exhibits significantly lower emissions—a reduction by 71.8% and 71.6% was calculated for CO and THC compared to values in intervals 1 and 2, respectively. If the initial spike in interval 1 of CO and THC emissions is attributed to cold start with residual pollutants from previous ICE operation, the subsequent data clearly suggests that Teng also plays an important role in the overall reduction in pollutant emissions.

3.2. Comparative Bench-Test Assessment of Discrete Versus Continuously Adjustable Current for EHC Heating

In our initial tests, which aimed to verify the temperature control strategy and estimate the power requirements for the custom DC/DC converter, we used a programmable laboratory power supply, ITECH (IT6010C-80-240). This approach is common in experimental evaluations of EHC performance, where the device is powered in a controlled laboratory environment by a programmable DC source. Although such equipment does not comply with automotive compliance standards, it is sufficient for simulating real operating conditions and provides the flexibility required for dynamic control during testing. The programmability of the ITECH enabled us to replicate two supply scenarios (Figure 6) representative of the final system: (i) Discrete supply mode—the heater is powered directly from the onboard battery via a smart switch. In this case, the heating element is driven in an on/off (bang-bang) manner, where a semiconductor switch (typically high-side) is opened or closed depending on whether the measured temperature is below or above the set thresholds, and (ii) Continuous supply mode—the heater receives power through an intermediate current-controlled DC/DC converter. Here, the temperature loop is implemented as a continuous proportional–integral–derivative (PID) controller that defines the reference current for the converter’s internal control loop. The converter then adjusts its output current smoothly, allowing finer regulation of heater power and tighter temperature stability. The main distinction is that bang-bang control with a smart switch produces a discrete on/off heater current, whereas PID control via a DC/DC converter yields a continuously adjustable current.
In both scenarios, the laboratory power supply was set to a maximum output voltage of 48 V, corresponding to a peak power of 5.5 kW supplied to the heater (ignoring transmission and conversion losses). This power level was sufficient to ensure a rapid temperature increase in the catalyst (Tcat) before ICE start, thereby accelerating the activation of chemical processes in the EHC. For reference, the target catalyst temperature Tcat* was set via the AVL PUMA control unit to 300 °C—an arbitrary but conservative value above the initially estimated CC light-off temperature, while the heater reference temperature Theat* was limited to 750 °C, the upper limit of the installed heater. The parameters of the bang-bang controller and both PID controllers used within the AVL PUMA control unit were tuned experimentally to achieve an adequate response.

3.2.1. Discrete Supply Mode with Bang-Bang Control

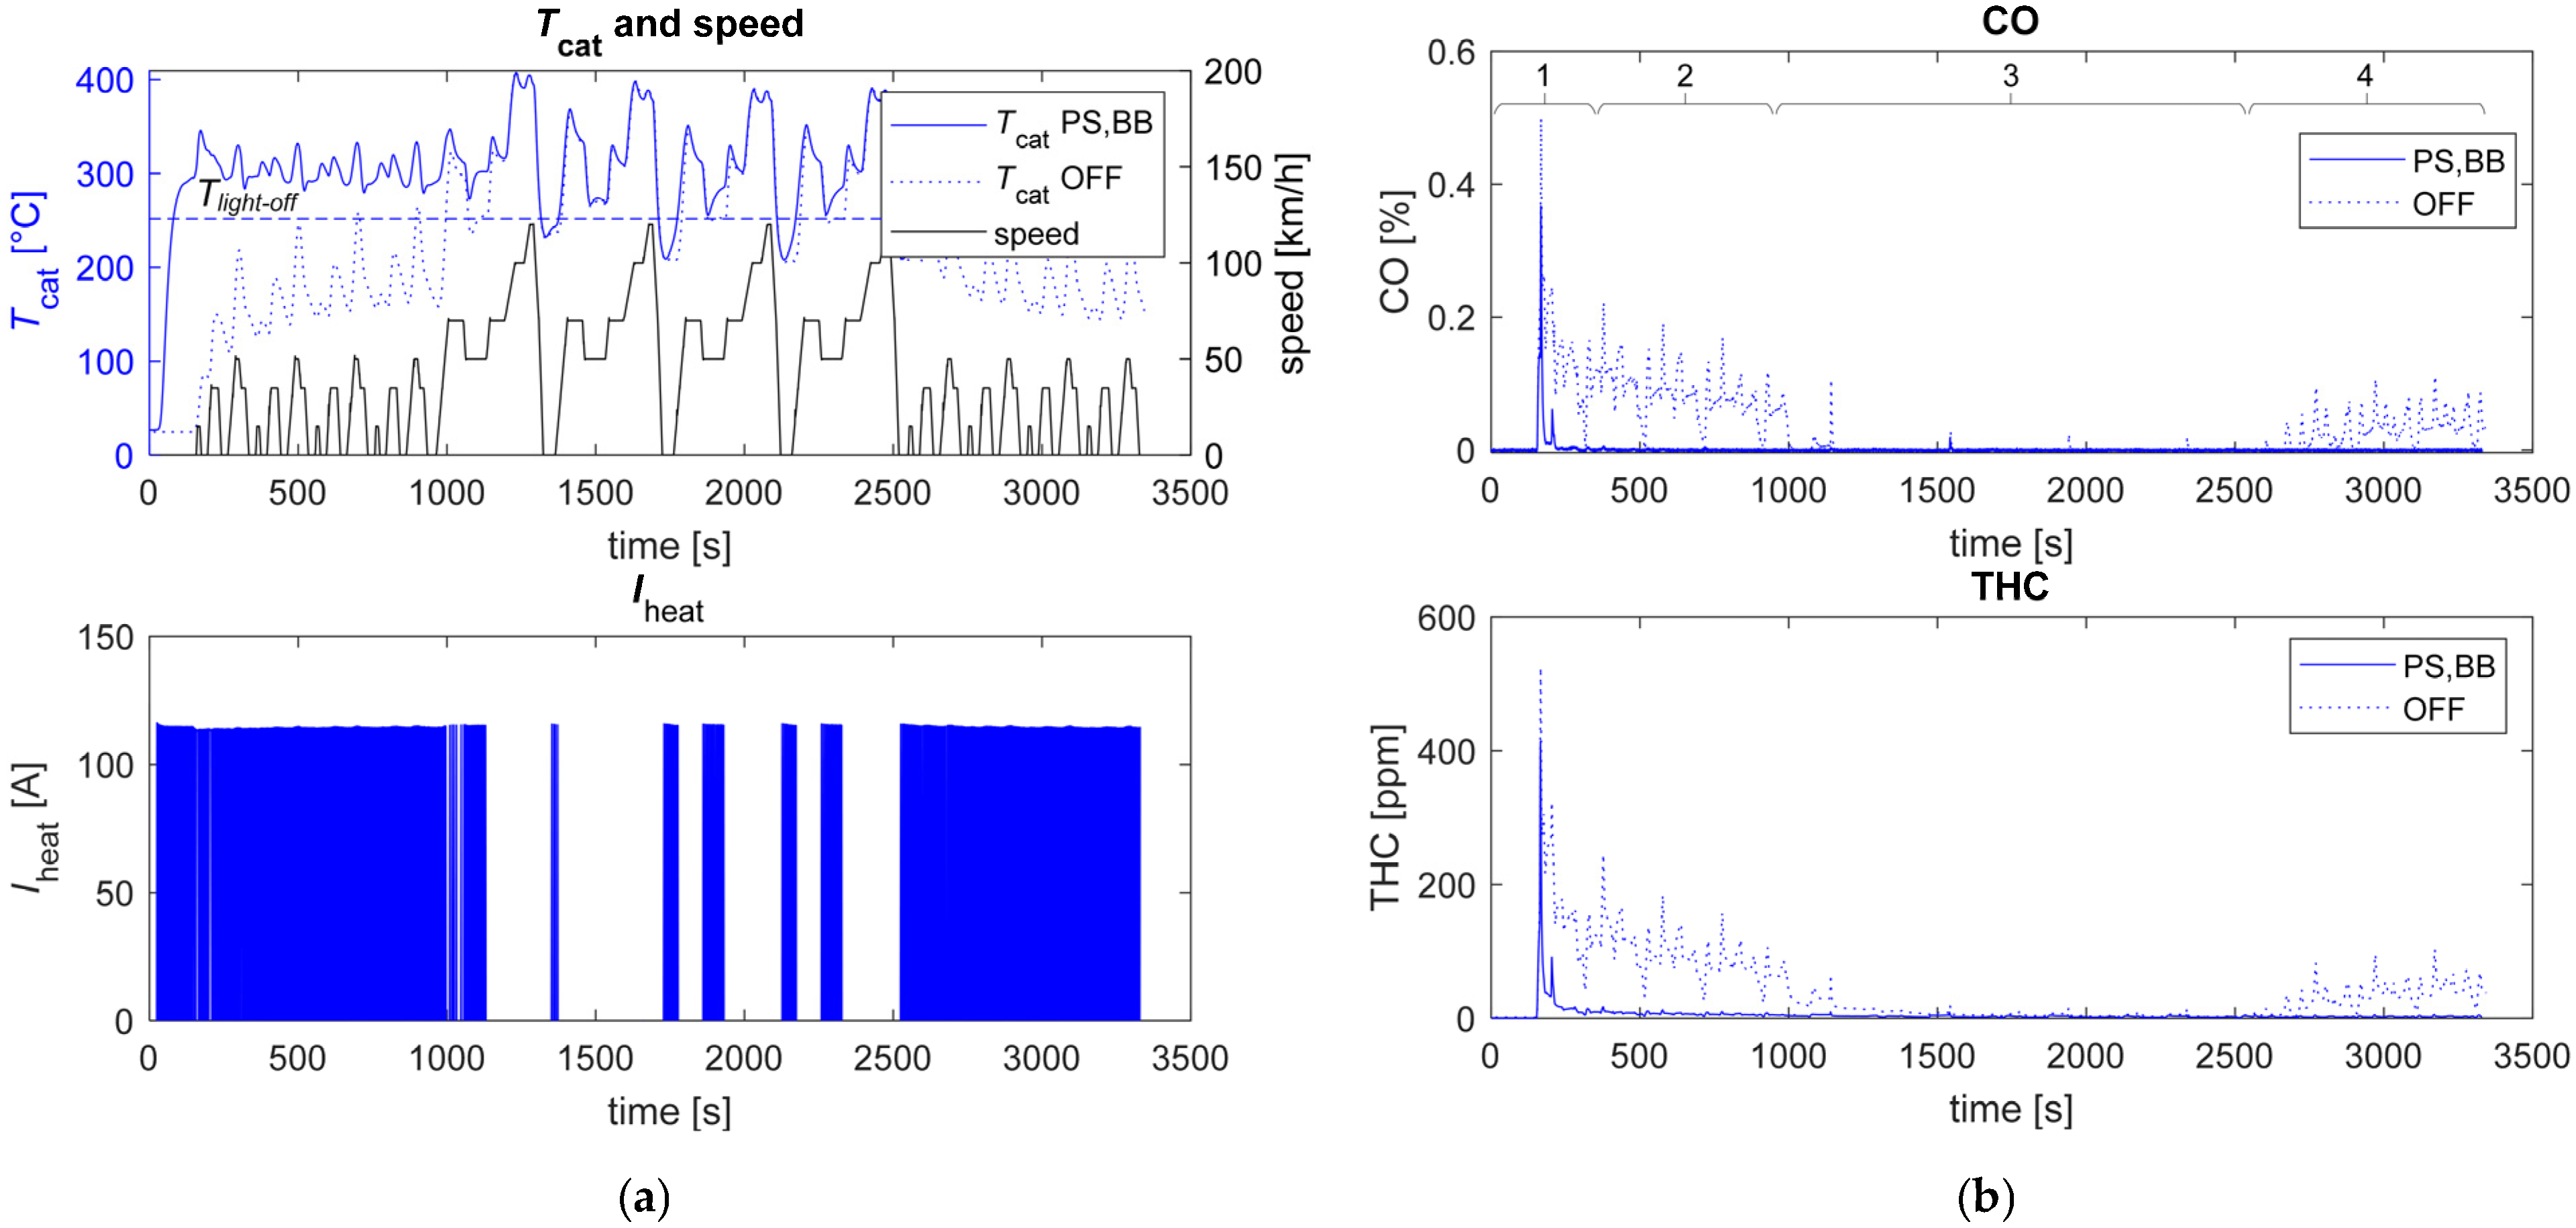
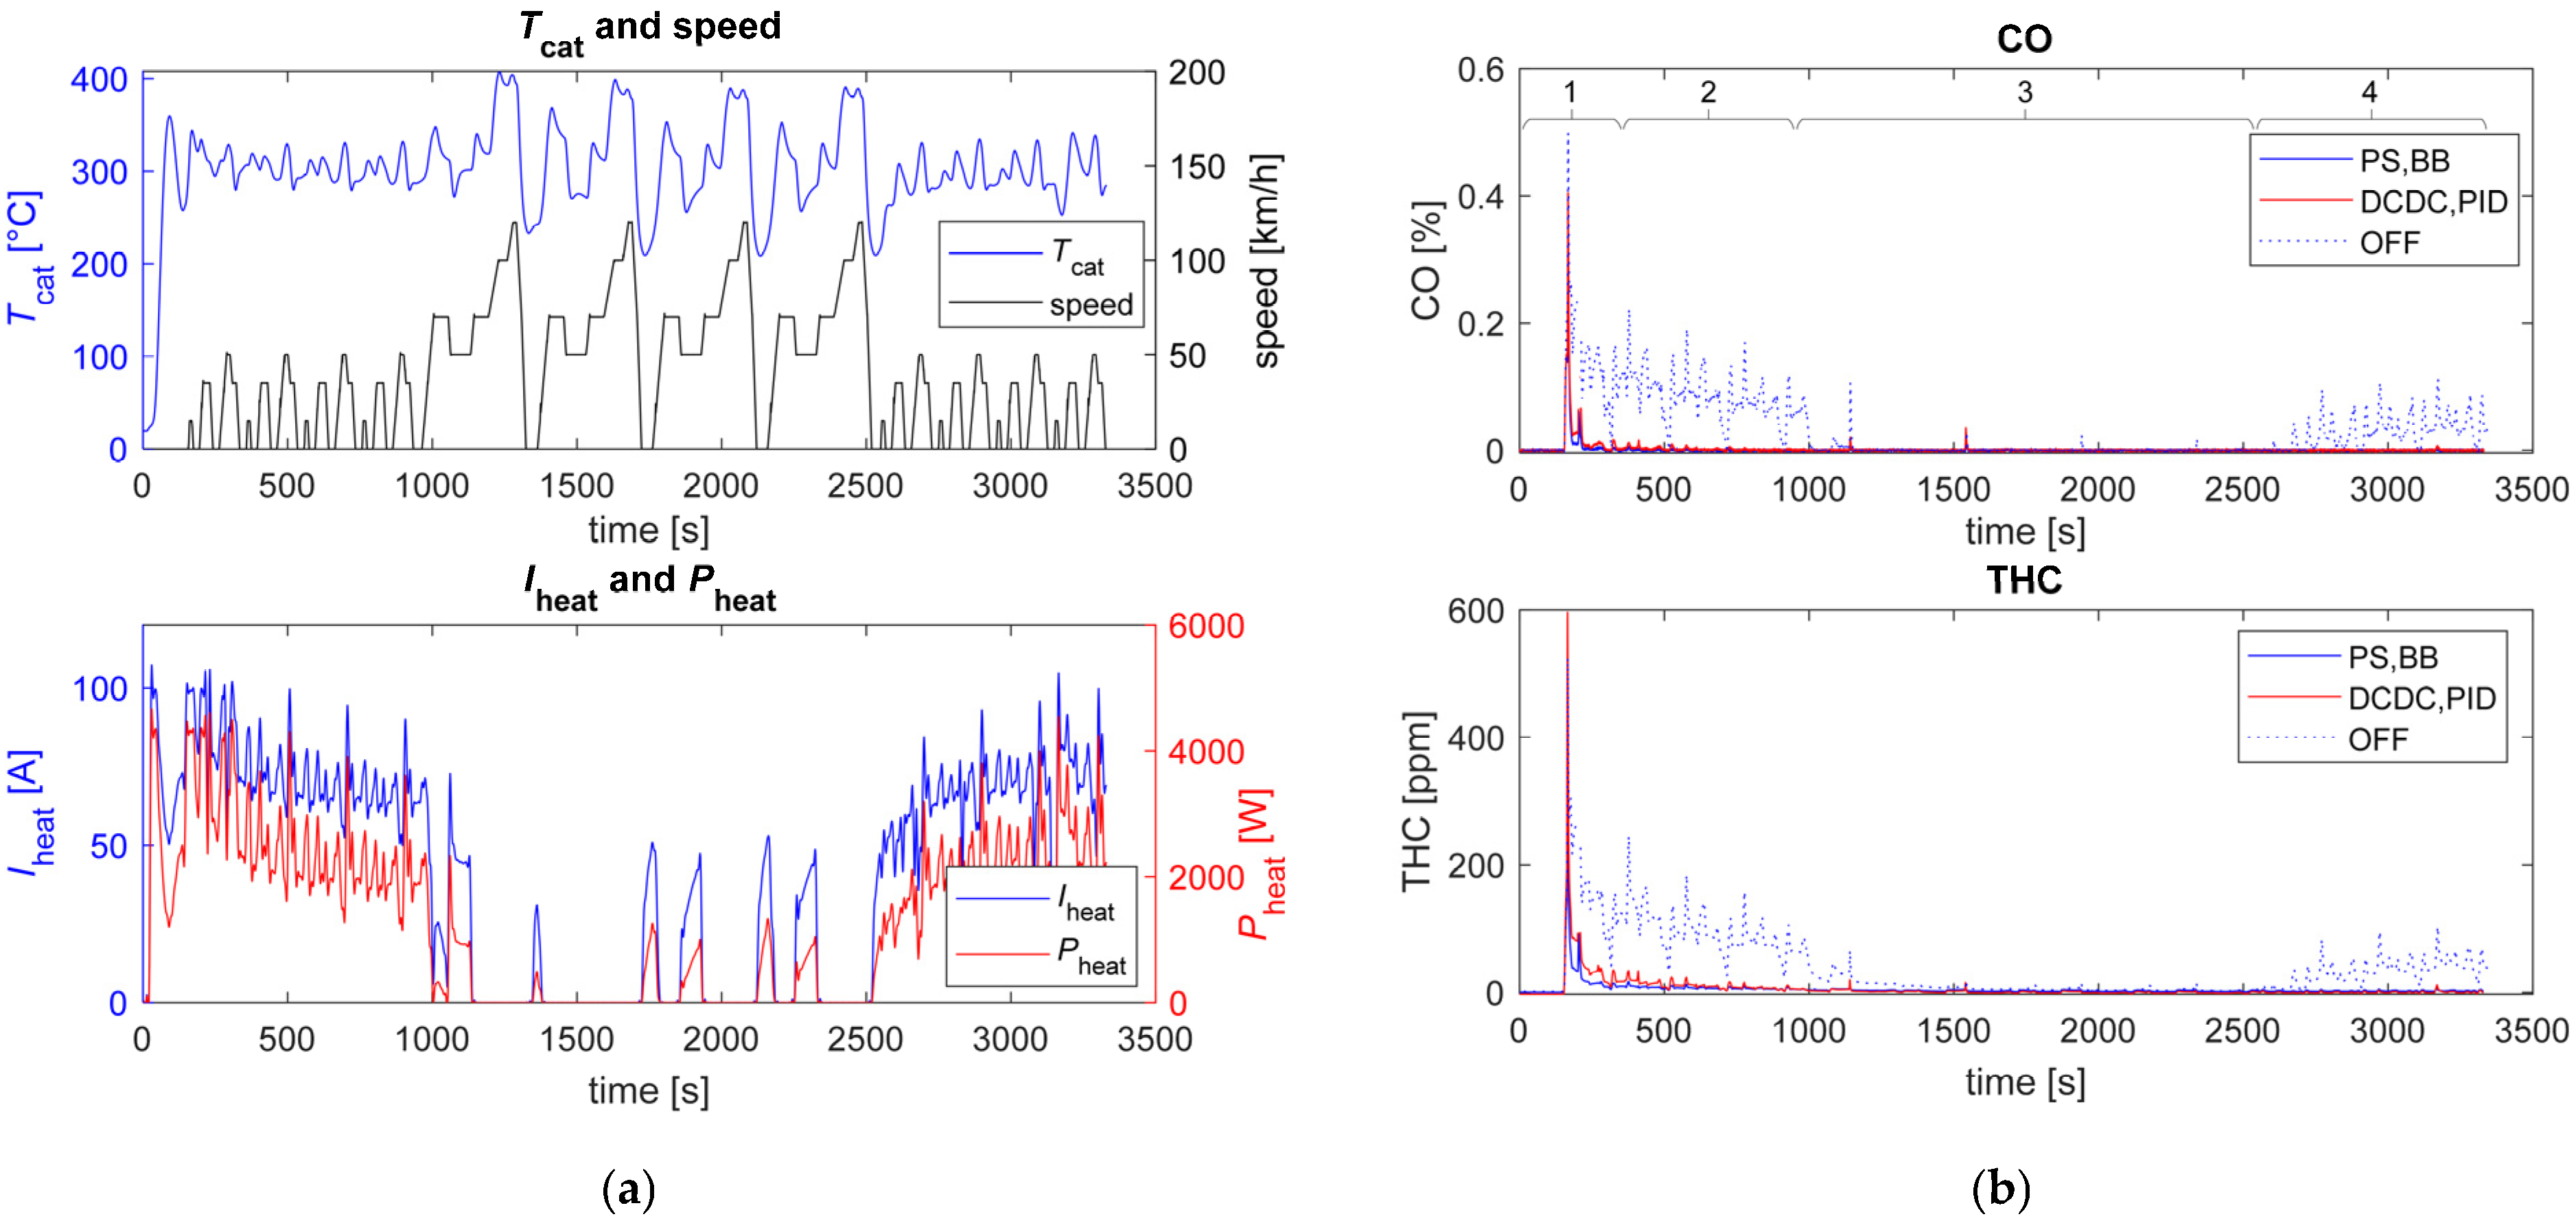
The most distinctive feature of bang-bang control is the shape of the current. As shown by the time course of the heater current in Figure 7a, obtained using a laboratory power supply with bang-bang control (labelled PS,BB), this approach produces a highly pulsating current that switches between 0 and 115 A. However, due to the significantly larger thermal time constants of both the heater and the catalyst, along with the moderate rate of heat transfer from the heater to the catalyst, these current pulsations do not present a problem for thermal performance. In fact, the Tcat temperature curve is suitably smooth while also exhibiting sufficient dynamics.
As seen in Figure 7a, Tcat (labelled PS,BB) exceeds the light-off temperature well before the actual start of the ICE and remains close to Tlight-off even when the ICE is inactive (start–stop function). This demonstrates the EHC’s suitability for modern mild-hybrid concepts and aligns with regulatory trends, which focus on early activation during the ICE ignition phase and subsequent low-speed, i.e., urban, driving—denoted by the ECE15 cycle. For comparison, the dotted line for Tcat (OFF) in Figure 7a corresponds to operation with electrical heating disengaged (as in Figure 5a). During the following four repetitions of the EUDC, the vehicle reaches higher speeds, causing the engine exhaust gas temperature Teng,g and consequently Tcat to rise significantly—often above 400 °C. Since this temperature exceeds the EHC core reference temperature of 300 °C, the need for additional electric heating is considerably reduced during high-speed segments (above approximately 70 km/h), as seen from the Iheat time profile.
However, when the vehicle enters idle mode, Tcat quickly falls significantly below the reference level, requiring renewed electrical assistance. The combination of reduced airflow and less effective heat transfer from the heater during idling slows the CC temperature response to increased current Iheat. Once the vehicle accelerates again to higher speeds (approximately 70 km/h), the need for electrical heating decreases accordingly. Examining Figure 7b and considering the Tcat time plots in Figure 7a we can conclude that pollutant emissions are significantly reduced with the implementation of the EHC, once the light-off temperature is surpassed.
The average cumulative volumetric concentrations of emissions without the EHC (OFF) in intervals 1 to 4, as shown in Figure 5, serve as the basis for calculating emissions reduction with the EHC. Table 1 presents the calculated CO and THC concentrations in all four intervals of the selected speed profile (Figure 5a). Focusing on interval 1, with the EHC implemented using bang-bang control (PS,BB), CO emissions are reduced more than six-fold—down to 14.0% of their initial level, or an 86% reduction compared to the no-heating option (OFF). In the same interval, THC values are reduced five-fold (down to 19.6%, or an 80.4% reduction). However, the main contribution to accumulated emissions in this interval still comes from the initial engine cold start, even though Tcat control was active before the ICE start. An even more significant reduction in emissions is observed in interval 2 with reductions of 99.6% and 92.7% for CO and THC, respectively. In interval 3, during the four repetitions of the EUDC, it is evident that emissions reduction achieved with the EHC also provides benefits compared to the no-heating option, even though emissions in this interval are already low without the EHC due to higher speeds. As expected, a greater difference in favour of the EHC occurs again in interval 4—the average CO and THC concentrations are reduced by 99.7% and 92.2%, respectively, compared to results with no electrical heating. Additionally, there is a notable difference in average cumulative concentrations between the two sets of four ECE15 repetitions: the first includes the ICE cold-start scenario (intervals 1 and 2), while the second (interval 4) continues from the “high-speed” interval 3. Specifically, interval 4, due to a higher and steady Teng (plotted in Figure 5 for reference), exhibits significantly lower emissions—reductions of 99.6% and 95.3% compared to intervals 1 and 2 were calculated for CO and THC concentrations, respectively.

3.2.2. Continuous Supply Mode with PID Control

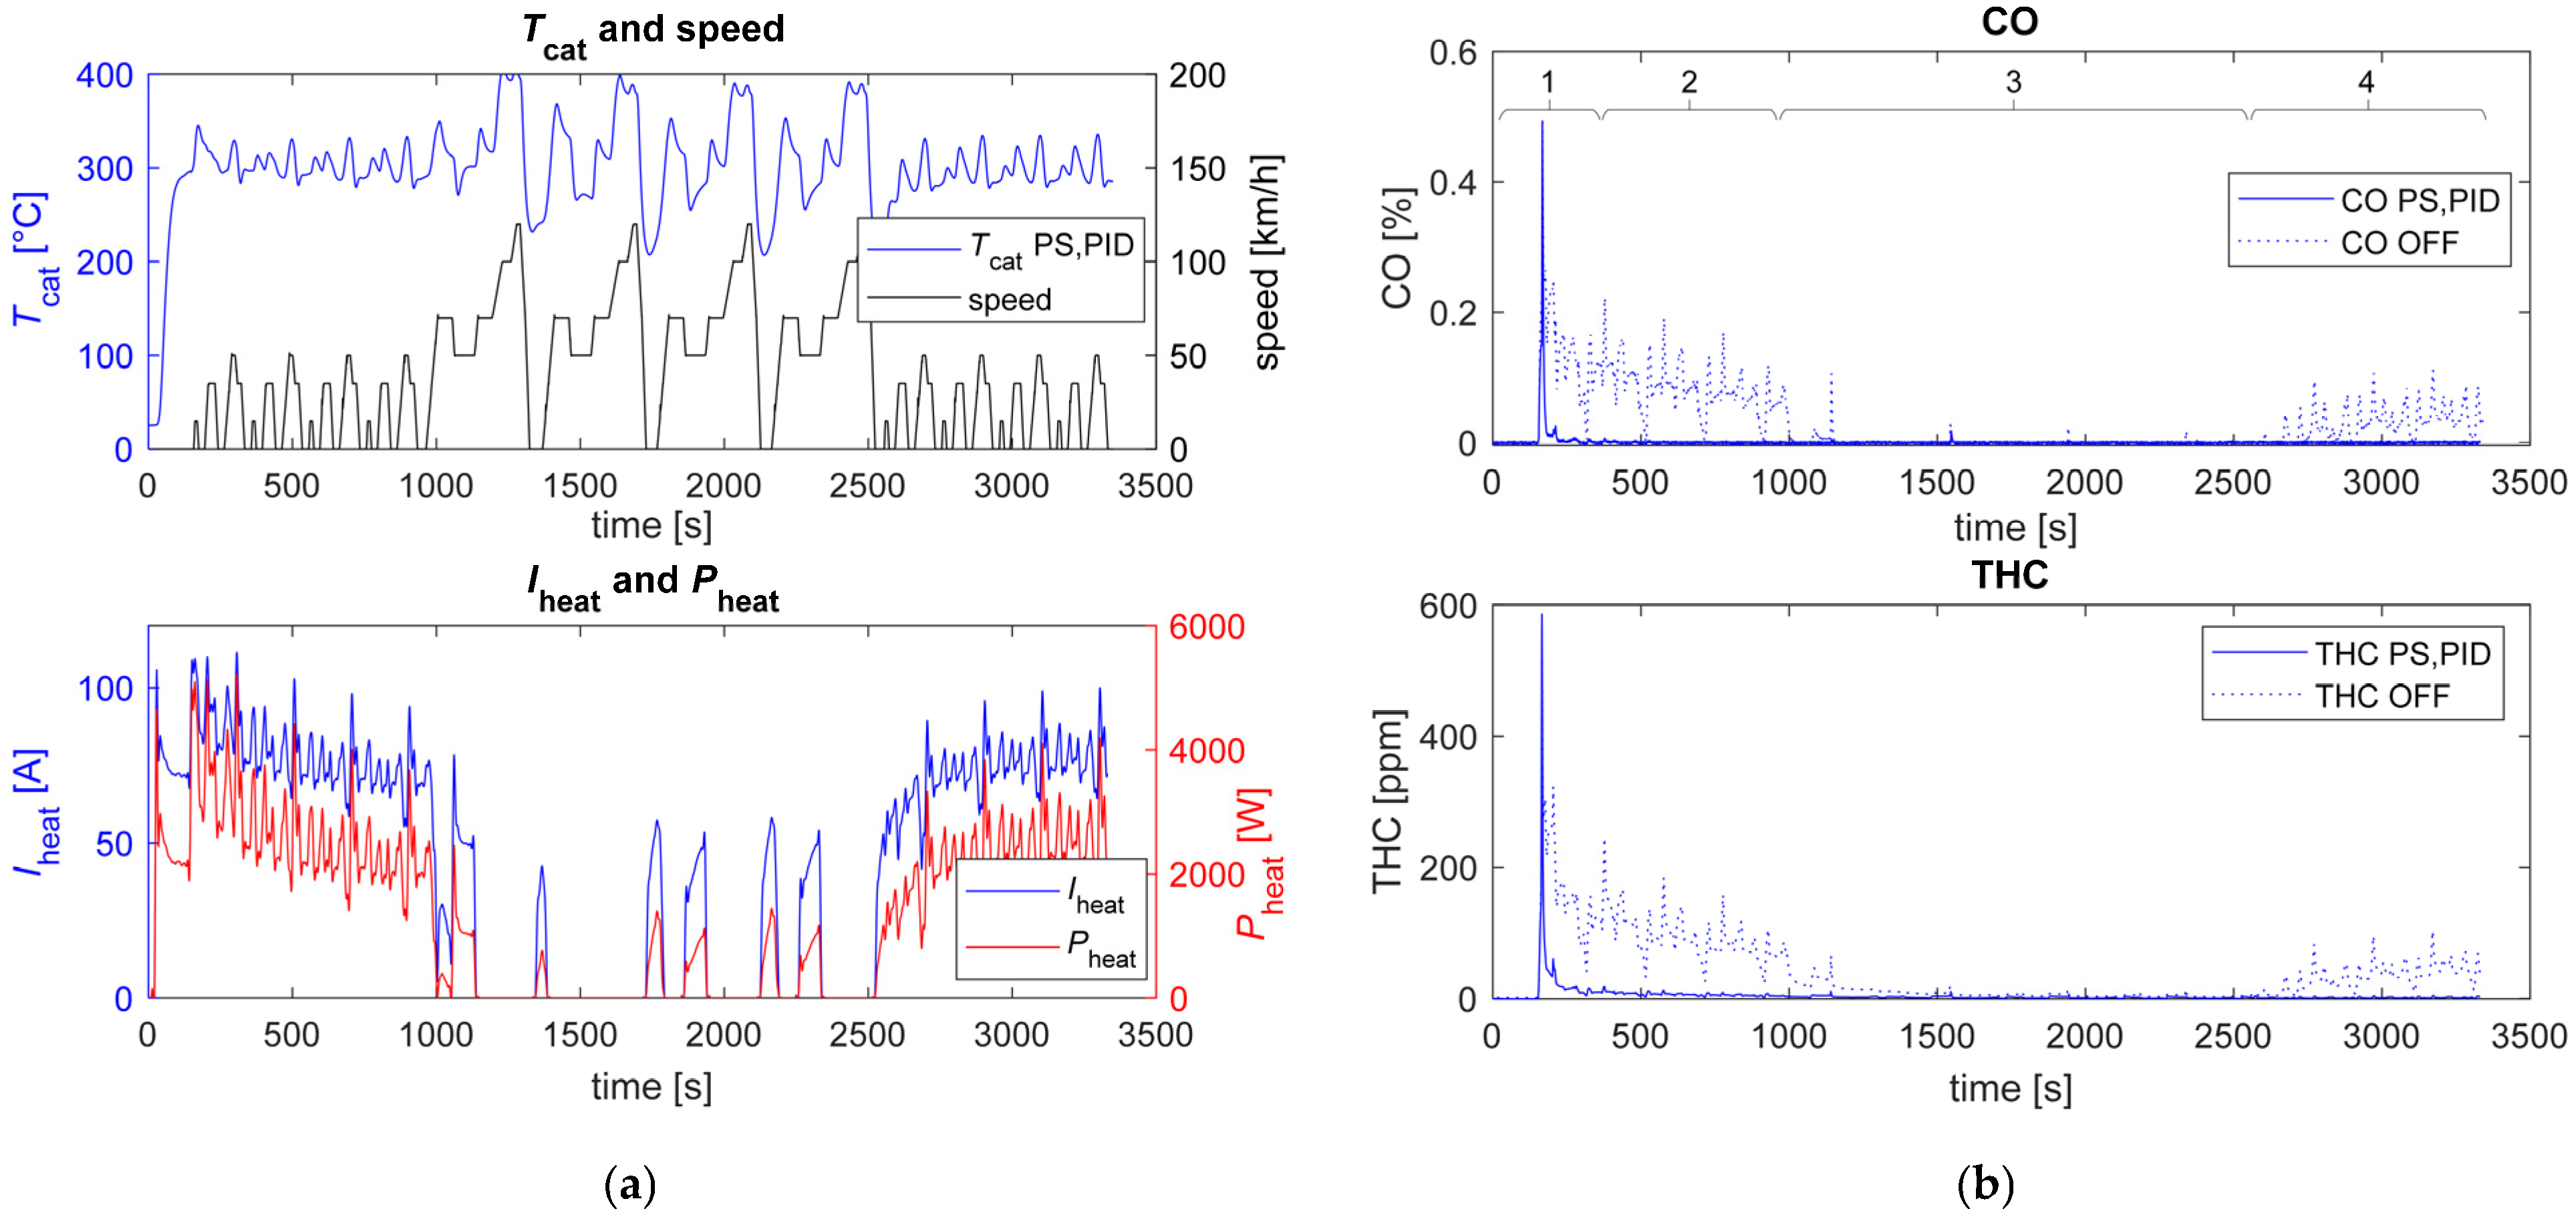
In the second EHC test, the bang-bang controller was replaced with a PID controller featuring a continuous output (labelled PS,PID). This allowed the heater current to be adjusted over the full range from 0 A to 115 A, enabling smoother control compared to the bang-bang setup. Additionally, the rate of change was increased through power supply settings, providing a better match with the DC/DC-supplied system.
Figure 8 presents experimental results showing both pollutant emissions and the electrical power/current required to maintain the catalyst temperature at 300 °C, independent of ICE operation. The data demonstrate that with electrical assistance, a sufficient catalyst temperature can be effectively maintained in the low-speed region. Notably, the peak power drawn from the supply remains similar to that in the bang-bang control scenario—exceeding 5 kW—during transient events, such as those occurring just after ICE start-up. However, once the ICE is running, power demand rapidly drops to an average of around 2.5 kW during the four successive ECE15 cycles.
At the lowest speeds of the NEDC cycle (interval 3, or from 950 s to 2530 s on the time scale), the average electrical power required for the catalyst decreases further, reaching approximately 1 kW only in short intervals during acceleration or deceleration transients. Otherwise, there is no need for additional electrical heating of the catalyst, as its temperature remains sufficiently high for proper operation, resulting in reduced pollutant emissions.
Similarly to the BB control scenario, a reduction in emissions was also calculated for the selected four intervals using the PID approach. Results (labelled PS,PID) are summed and presented in Table 1, together with the results of the BB control (PS,BB). As expected, there is no significant difference between the two control strategies, as they both provide nearly identical thermal responses of the EHC. Again, the CO and THC emissions in all intervals are significantly reduced compared to emissions without the EHC, with practically identical values.
Figure 7a and Figure 8a illustrate the distinct current and power profiles associated with the two control strategies. As shown in the Iheat time plot in Figure 7a, the bang-bang approach produces sharp, intermittent power surges, consistently reaching the system’s maximum output of 5.5 kW. This operation drives the current to its peak limit whenever the smart switch is engaged. In contrast, the PID-controlled system (PS,PID), as seen in Figure 8a, maintains a smoother power demand from the supply source, producing notably reduced peak current levels, even during transient conditions. Specifically, noticeable but brief current and power fluctuations surging above the average, but never reaching the peak values of BB, are also observed in the PID system during sudden changes in ICE speed.
These fluctuations are primarily driven by rapid changes in airflow during the acceleration or deceleration phases. A sudden increase in airflow enhances convection, resulting in a decrease in heater temperature. The controller then compensates for this drop by increasing the current to achieve thermal balance. This cooling effect is more clearly observed in the Tcat profile in Figure 5 (or the dotted line Tcat OFF in Figure 7a) with a deactivated heater, as the CC temperature changes more significantly due to the absence of an active controller. Despite these temporary current peaks, the system’s thermal inertia ensures a smoother response, even though the current peaks could lead to a severely increased Theat, which is limited through control to 750 °C.

4. Implications of Discrete Versus Continuous Current Demand in Onboard Electrical Distribution Networks

4.1. Background for Control Strategy and Topology Selection

The choice of control strategy for catalyst heating significantly affects not only thermal performance but also power quality, system reliability, and overall energy efficiency. Bang-bang control paired with a smart switch presents challenges due to its inherently abrupt switching behaviour, resulting in steep current (di/dt) and voltage (dv/dt) transients. These rapid transitions cause the heater current to alternate sharply between zero and peak power levels (up to 5.5 kW), producing a pulsating current profile.
Such abrupt changes are difficult to manage, especially in an onboard power system where multiple subsystems share a limited energy source, such as a 48 V battery. The resulting di/dt-induced stress, combined with parasitic inductances in the power distribution network, can lead to severe voltage fluctuations. These effects are further intensified when capacitive decoupling is inadequate or poorly positioned, increasing the risk of overvoltage or undervoltage conditions.
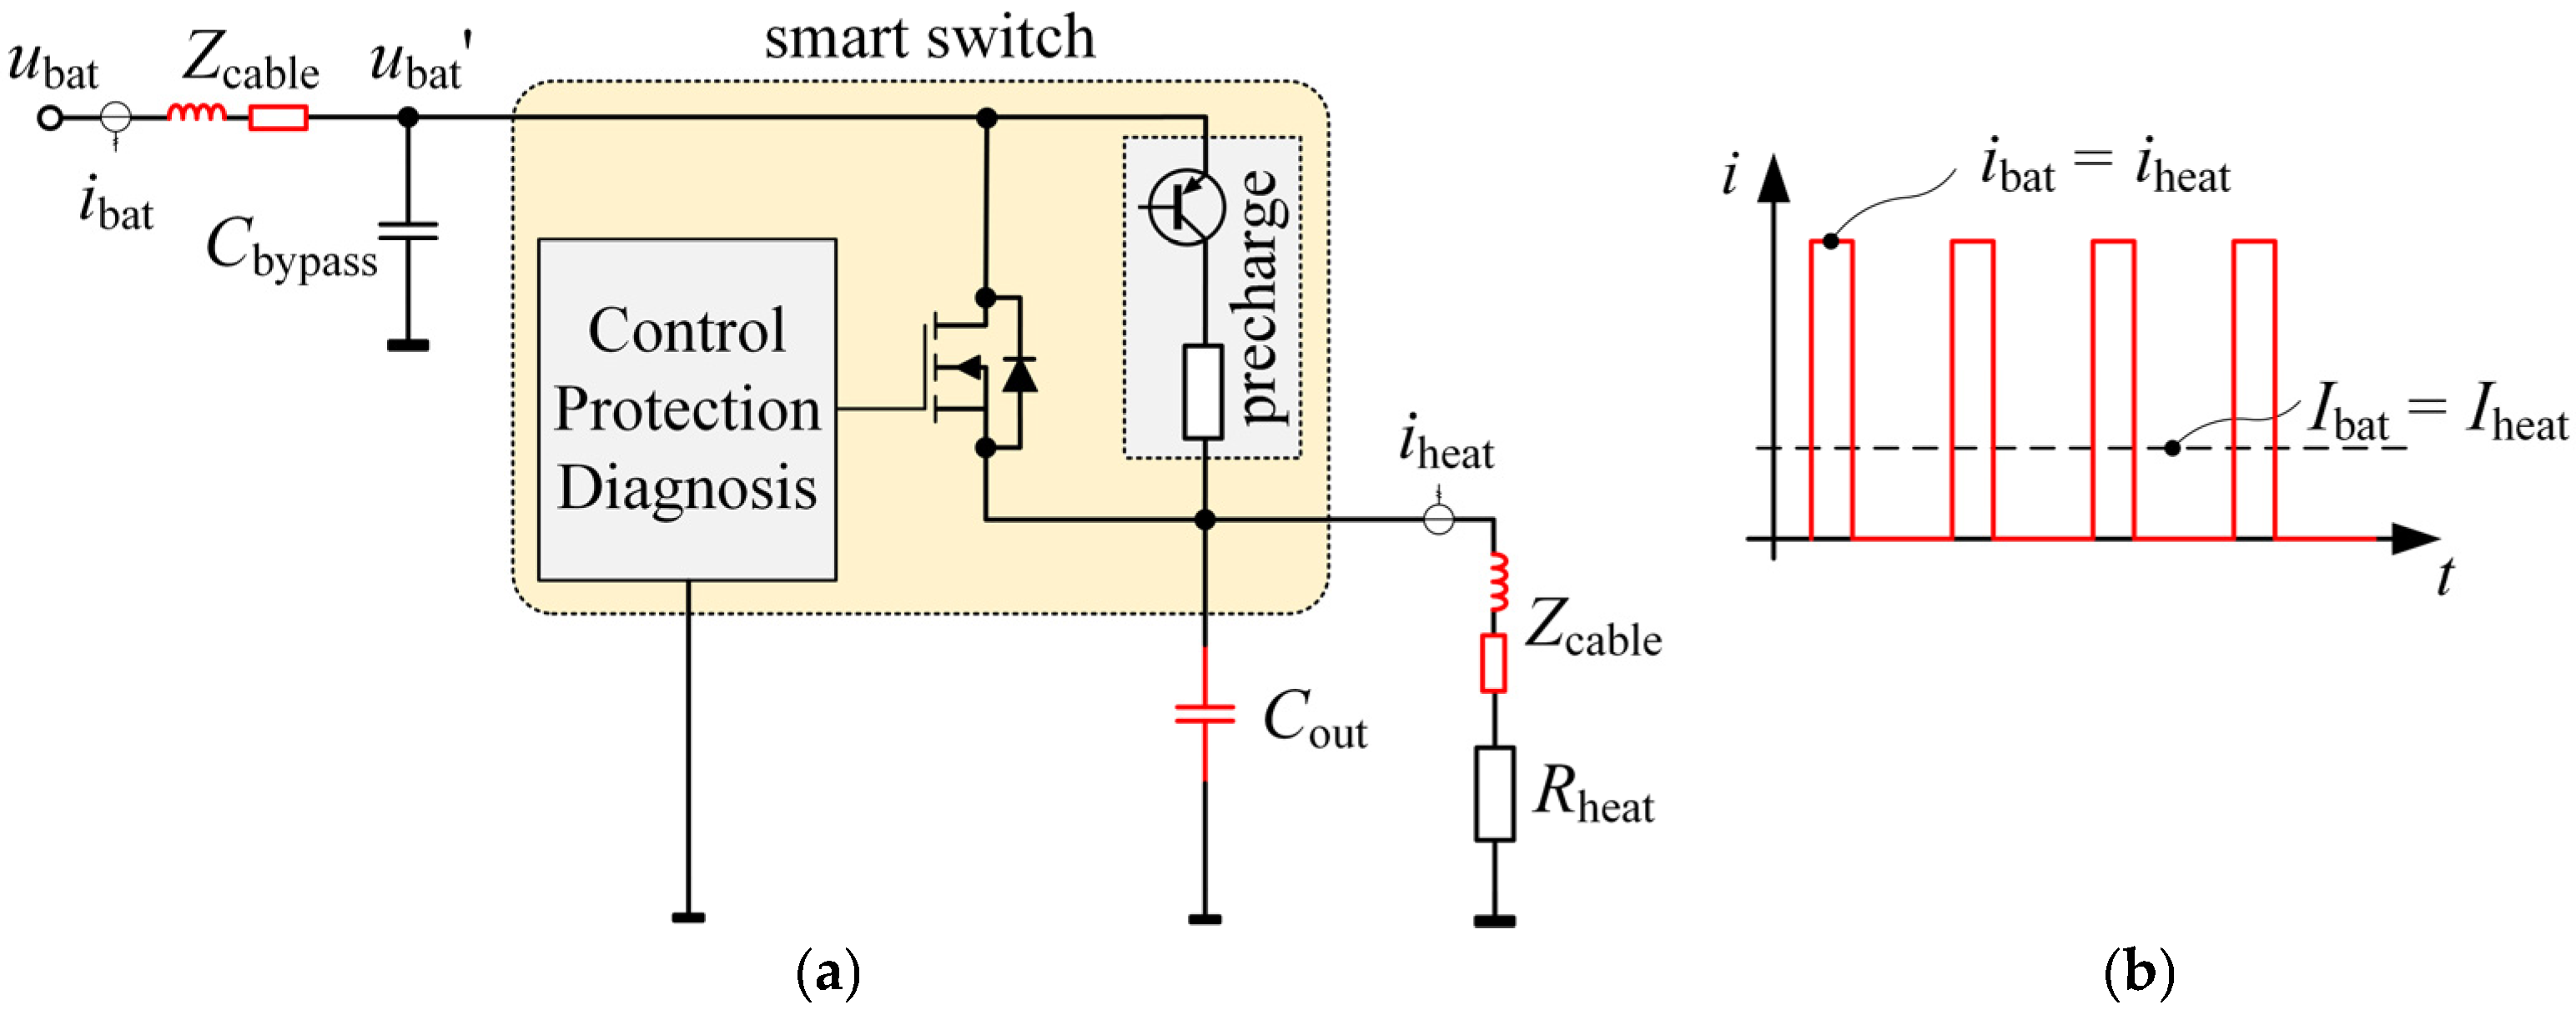
This problem is particularly pronounced in high-side smart-switch configurations, where only minimal bypass capacitance (e.g., 10 nF to 100 nF) is typically placed in parallel with the input terminal of the switch, as shown in Figure 9, mainly to suppress electromagnetic interference [46,47]. Such small values of MLCC capacitors are effective for high-frequency noise bypassing but do not provide sufficient storage to absorb large and rapid energy spikes. As a result, voltage overstress can occur across the smart switch during such events, leading to dangerous conditions including gate oxide degradation, avalanche breakdown, and other long-term reliability issues [48,49,50]. Moreover, due to their preferred low complexity and highly integrated designs, smart switches are rarely protected with additional snubbers or bulky decoupling energy storage, which increases vulnerability and limits the number of switching events to mitigate thermal stress on the component.
In contrast, the PID-controlled DC/DC converter provides smoother current transitions by continuously adjusting its duty cycle. Unlike the smart switch, DC/DC converter topologies inherently include bulk capacitive decoupling at both the input and output sides. These features reduce peak current on both sides, thereby lowering demands on the cable harness, and also minimize the rate of current and voltage transients throughout the power distribution network. As a result, the reliability of other loads sharing the same power source is expected to improve.
Such performance is particularly important in modern vehicles utilizing both 12 V and 48 V electrical architectures, where the distribution network must support a wide range of loads, including sensitive control electronics, safety-critical components and infotainment systems. Ensuring smooth and reliable power delivery is essential to maintain driving performance, safety and overall user experience. For reference, a comparison of key parameters for two control strategies and hence topologies is given in Table 2.

4.2. Custom-Made DC/DC Converter

Power converters for automotive applications are among the most demanding types of electronic devices, as they must meet a wide range of stringent technical specifications. These requirements concern vehicle safety in traffic and the protection of the driver and passengers. Beyond these safety aspects, there is a strong focus on achieving high energy efficiency, expressed as power-to-weight (W/kg) and power-to-volume (W/dm3) ratios [51,52]. Meeting these requirements necessitates high levels of integration and the use of advanced, high-performance semiconductor components and PCB layouts.
Converter topology depends largely on the vehicle’s electrical architecture. In high-voltage systems (e.g., 400–800 V), isolated topologies are commonly used to ensure galvanic isolation between the high-voltage and low-voltage sides, which is critical for safety. In contrast, in 48 V architectures—now increasingly common for auxiliary systems and mild hybrid drivetrains—non-isolated topologies such as buck, boost, and their combinations predominate.
Despite their impressive capabilities, such DC/DC converters are not typically implemented using basic topologies. This is due to the need to convert high power at relatively low voltages, resulting in extremely high currents on both the input and output sides. These current levels would cause excessive losses and electromagnetic interference, as well as impractically large and heavy components, if basic converter topologies were used. Another important consideration is the required range of output voltage or current adjustment, which often exceeds the capabilities of basic converter topologies and requires more advanced designs to maintain efficiency and control across varying load conditions.
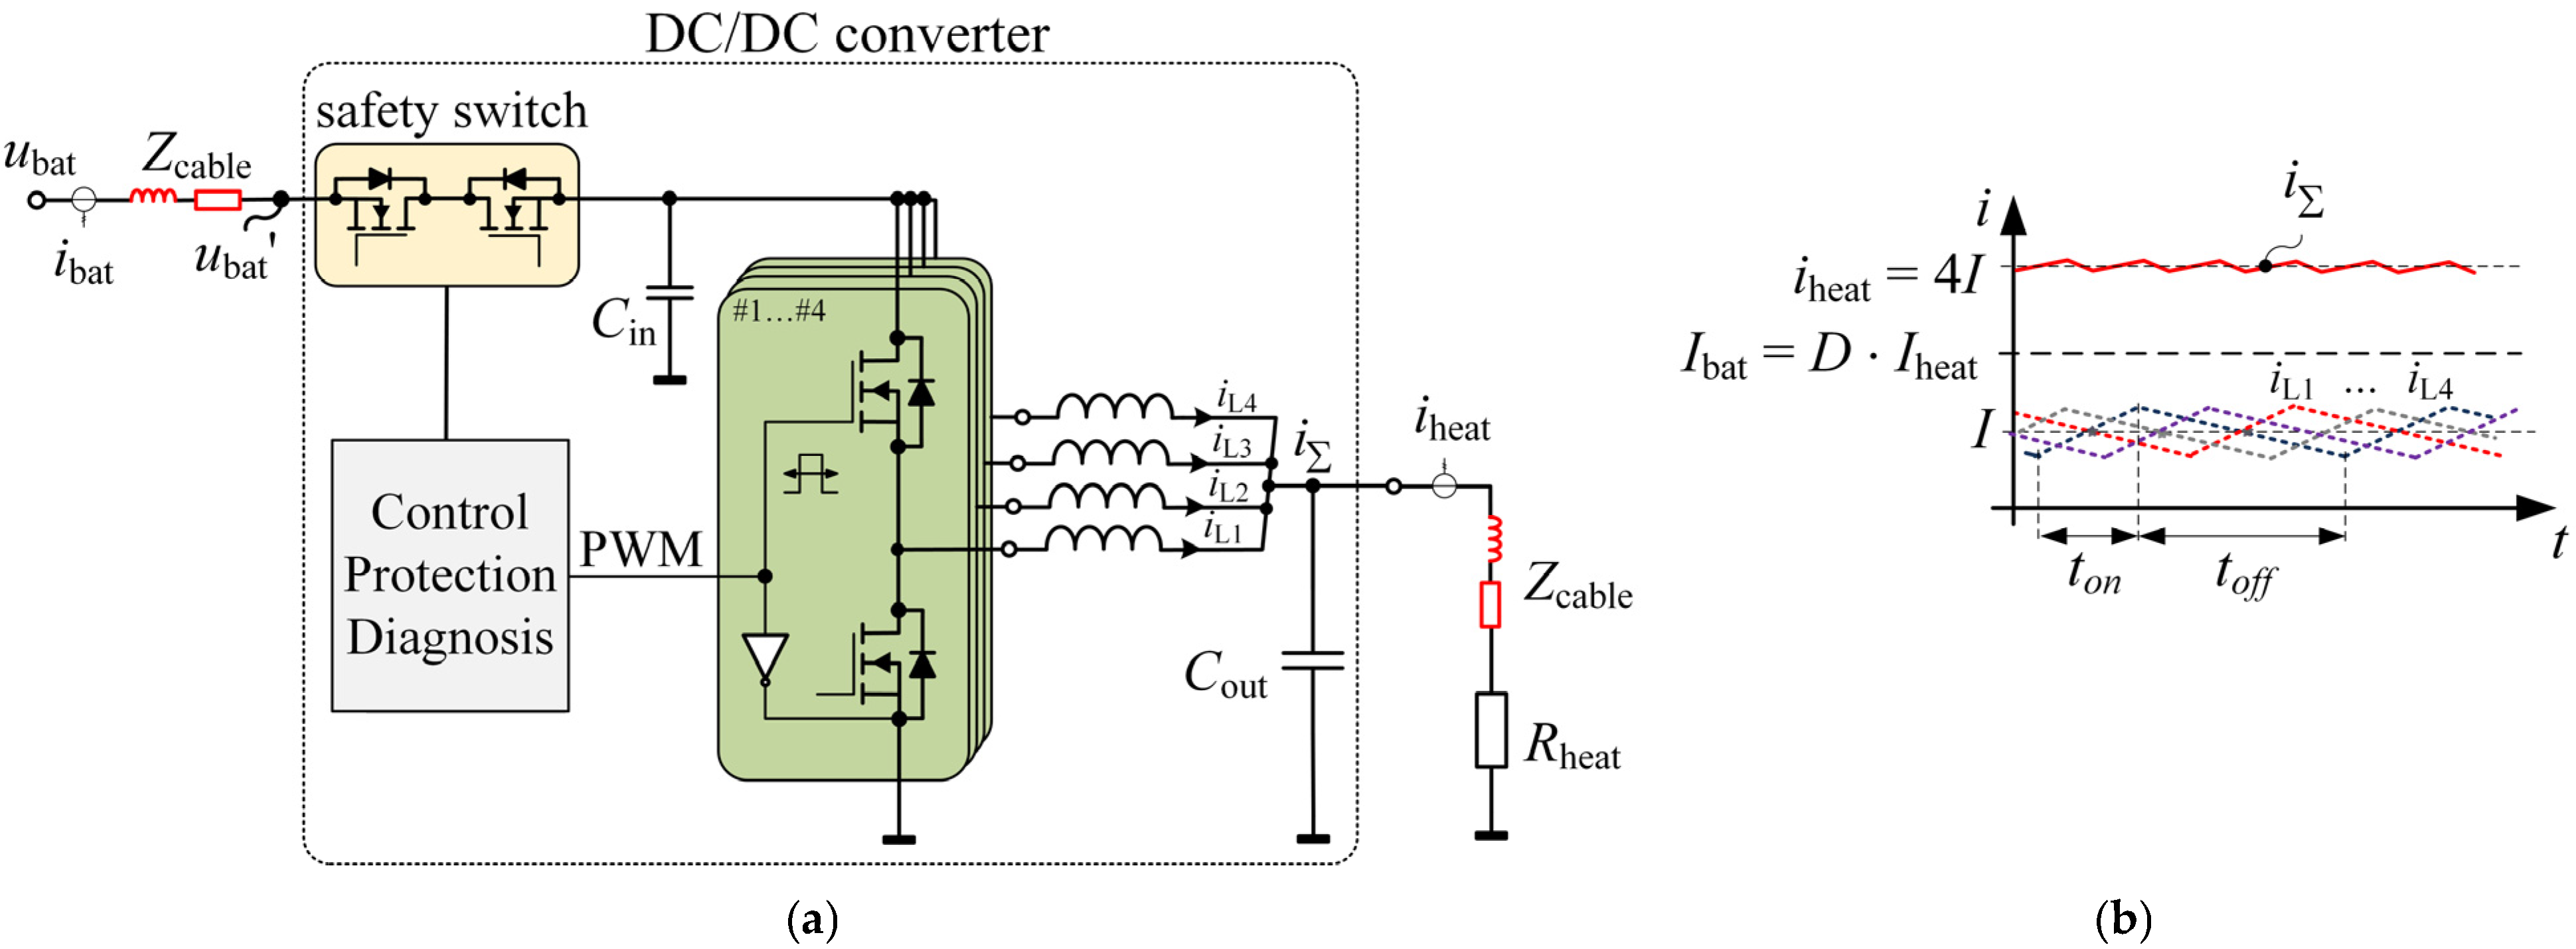
As a result, more complex and optimized topologies are used. These are not straightforward but instead consist of modular, multi-leg configurations (Figure 10). They feature parallel transistor legs operating in an interleaved manner with phase-shifted PWM signals [53,54]. This phase interleaving enables balanced power distribution and significantly increases the effective ripple frequency of both input and output currents and voltages. Consequently, compared to smart-switch configurations, the size and cost of bulk capacitors and EMI filters can be significantly reduced, and—most importantly—the voltage stress from the distribution network can be entirely avoided, provided that the current demand rate is properly restricted through converter control.
The proposed converter design is based on a four-leg interleaved buck topology. It incorporates a safety-critical feature: a semiconductor safety switch at the input that operates autonomously, independently of the main microcontroller, and disconnects the converter in the event of faults, thereby enhancing system robustness and meeting automotive safety requirements. The converter operates by sequentially activating the four transistor legs, with the microcontroller managing current balancing and synchronization. Under nominal load, all four legs are active, distributing load current evenly among the individual inductors to minimize conduction and switching losses. Additionally, to improve efficiency at lower power demands, leg-shedding techniques are applied, selectively turning off certain legs [54]. This reduces the number of active switching components and, consequently, switching losses, while also distributing the thermal load more evenly. Although advanced techniques such as adaptive dead-time control and zero-voltage switching (ZVS) can further optimize switching performance, they were not implemented in this design. The current architecture prioritizes reliability and simplicity, which are critical for long-term operation in passive cooling environments.
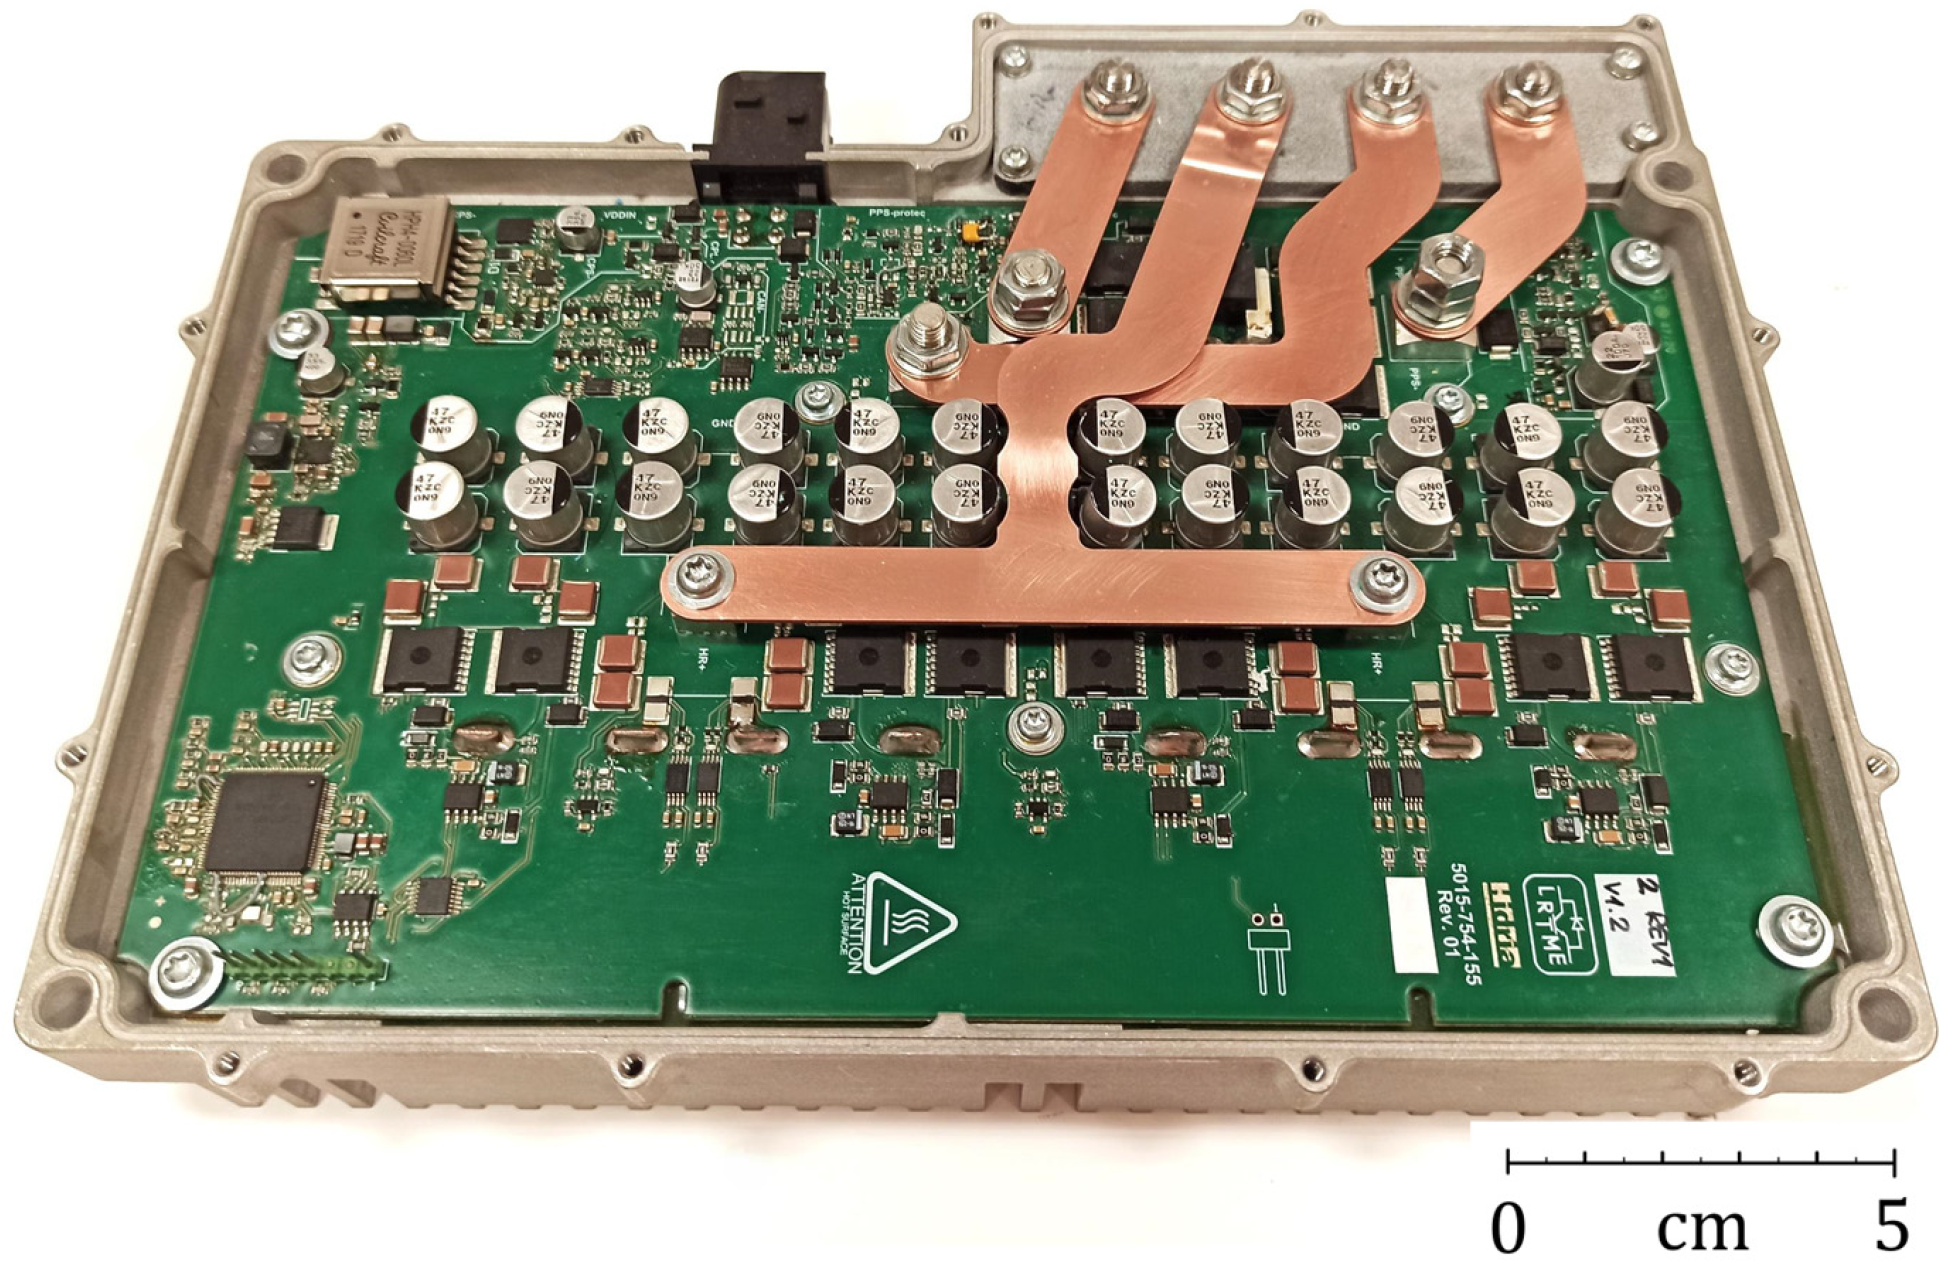
The converter (Figure 11), rated for a continuous output power of 3.7 kW, a short-term peak of 4.5 kW, and an efficiency of 95.8%, is designed in compliance with LV148 and ISO16750, ensuring nominal functionality across a wide supply voltage range. It features a fanless, passively cooled design to ensure silent operation and improved system reliability by eliminating mechanical components prone to failure. Heat generated during operation is efficiently dissipated through a thermally optimized aluminum casing.

5. Assessment and Analysis of Experimental Results Using a Custom-Made DC/DC Converter with Emphasis on Pollutant Emissions and Electrical Parameters

To evaluate the impact of the DC/DC converter, a comprehensive set of experiments was conducted, focusing on its behaviour under both steady-state conditions and dynamic load transients. In addition, a comparative analysis was performed between two practical methods for supplying power to the Electrically Heated Catalyst (EHC): a bang-bang-controlled (BB) high-side switch implemented with the Infineon 48 V Battery Switch demo board [55], and a controlled DC/DC converter (DCDC), as described in Section 4.2.

5.1. Pollutant Emissions

Emission measurements with the dedicated DC/DC converter were conducted in the same test environment (Figure 12) and under identical operating conditions as the preliminary assessments reported in Section 3 (Figure 4). The only difference was that the laboratory power supply was now used solely to emulate the battery with its parameters. The results in Figure 13 show that, although the PID-controlled DC/DC converter (labelled DCDC,PID) has a lower nominal power rating of Pnom=3.7 kW (compared to the 5.5 kW required by the bang-bang concept), it achieves emission levels fully comparable to those of a bang-bang-controlled (PS,BB) high-side switch or a PID-controlled supply with a continuous output (PS,PID in Figure 8b) obtained during the pre-design phase.
Regardless of the chosen concept—discrete (PS,BB) or continuous (PS,PID or DCDC,PID)—a comparison of EHC pollutant emissions with emissions without EHC (OFF) clearly justifies the use of electrical heating during initial engine start-up or idling conditions, when exhaust gas temperatures are insufficient. However, this assessment alone does not clearly favour one solution over the other, as both approaches achieve similar reductions in emissions and maintain comparable thermal profiles during the test, as can be seen by comparing Figure 13a with Figure 7a.

5.2. Battery-Side Power and Current Delivery

Similar Tcat temperature profiles for the two control concepts might lead to premature conclusions, suggesting that neither the type of power actuator nor the control scheme affects the system’s power management. Such simplified interpretations are common in the literature, where reported results often focus solely on heater power levels—as intentionally demonstrated in the preliminary bench test, where the programmable supply voltage matched the heater’s, excluding transmission and conversion losses. Similar oversimplifications appear in many reported studies [13,15,17], where the form of the current supplied by the power electronics is unspecified, despite some actuators operating with bang-bang or similar on/off control methods. More critically, waveform characteristics are often completely ignored by authors introducing equivalent battery models [56,57,58,59], where dissipative losses are calculated without considering the impact of discrete versus continuous current profiles, despite their significant influence on energy throughput efficiency.
This is why the subsequent analysis, which considers the electrical parameters at the supply side, reveals more noticeable differences between both approaches and highlights the critical role of current in power management.
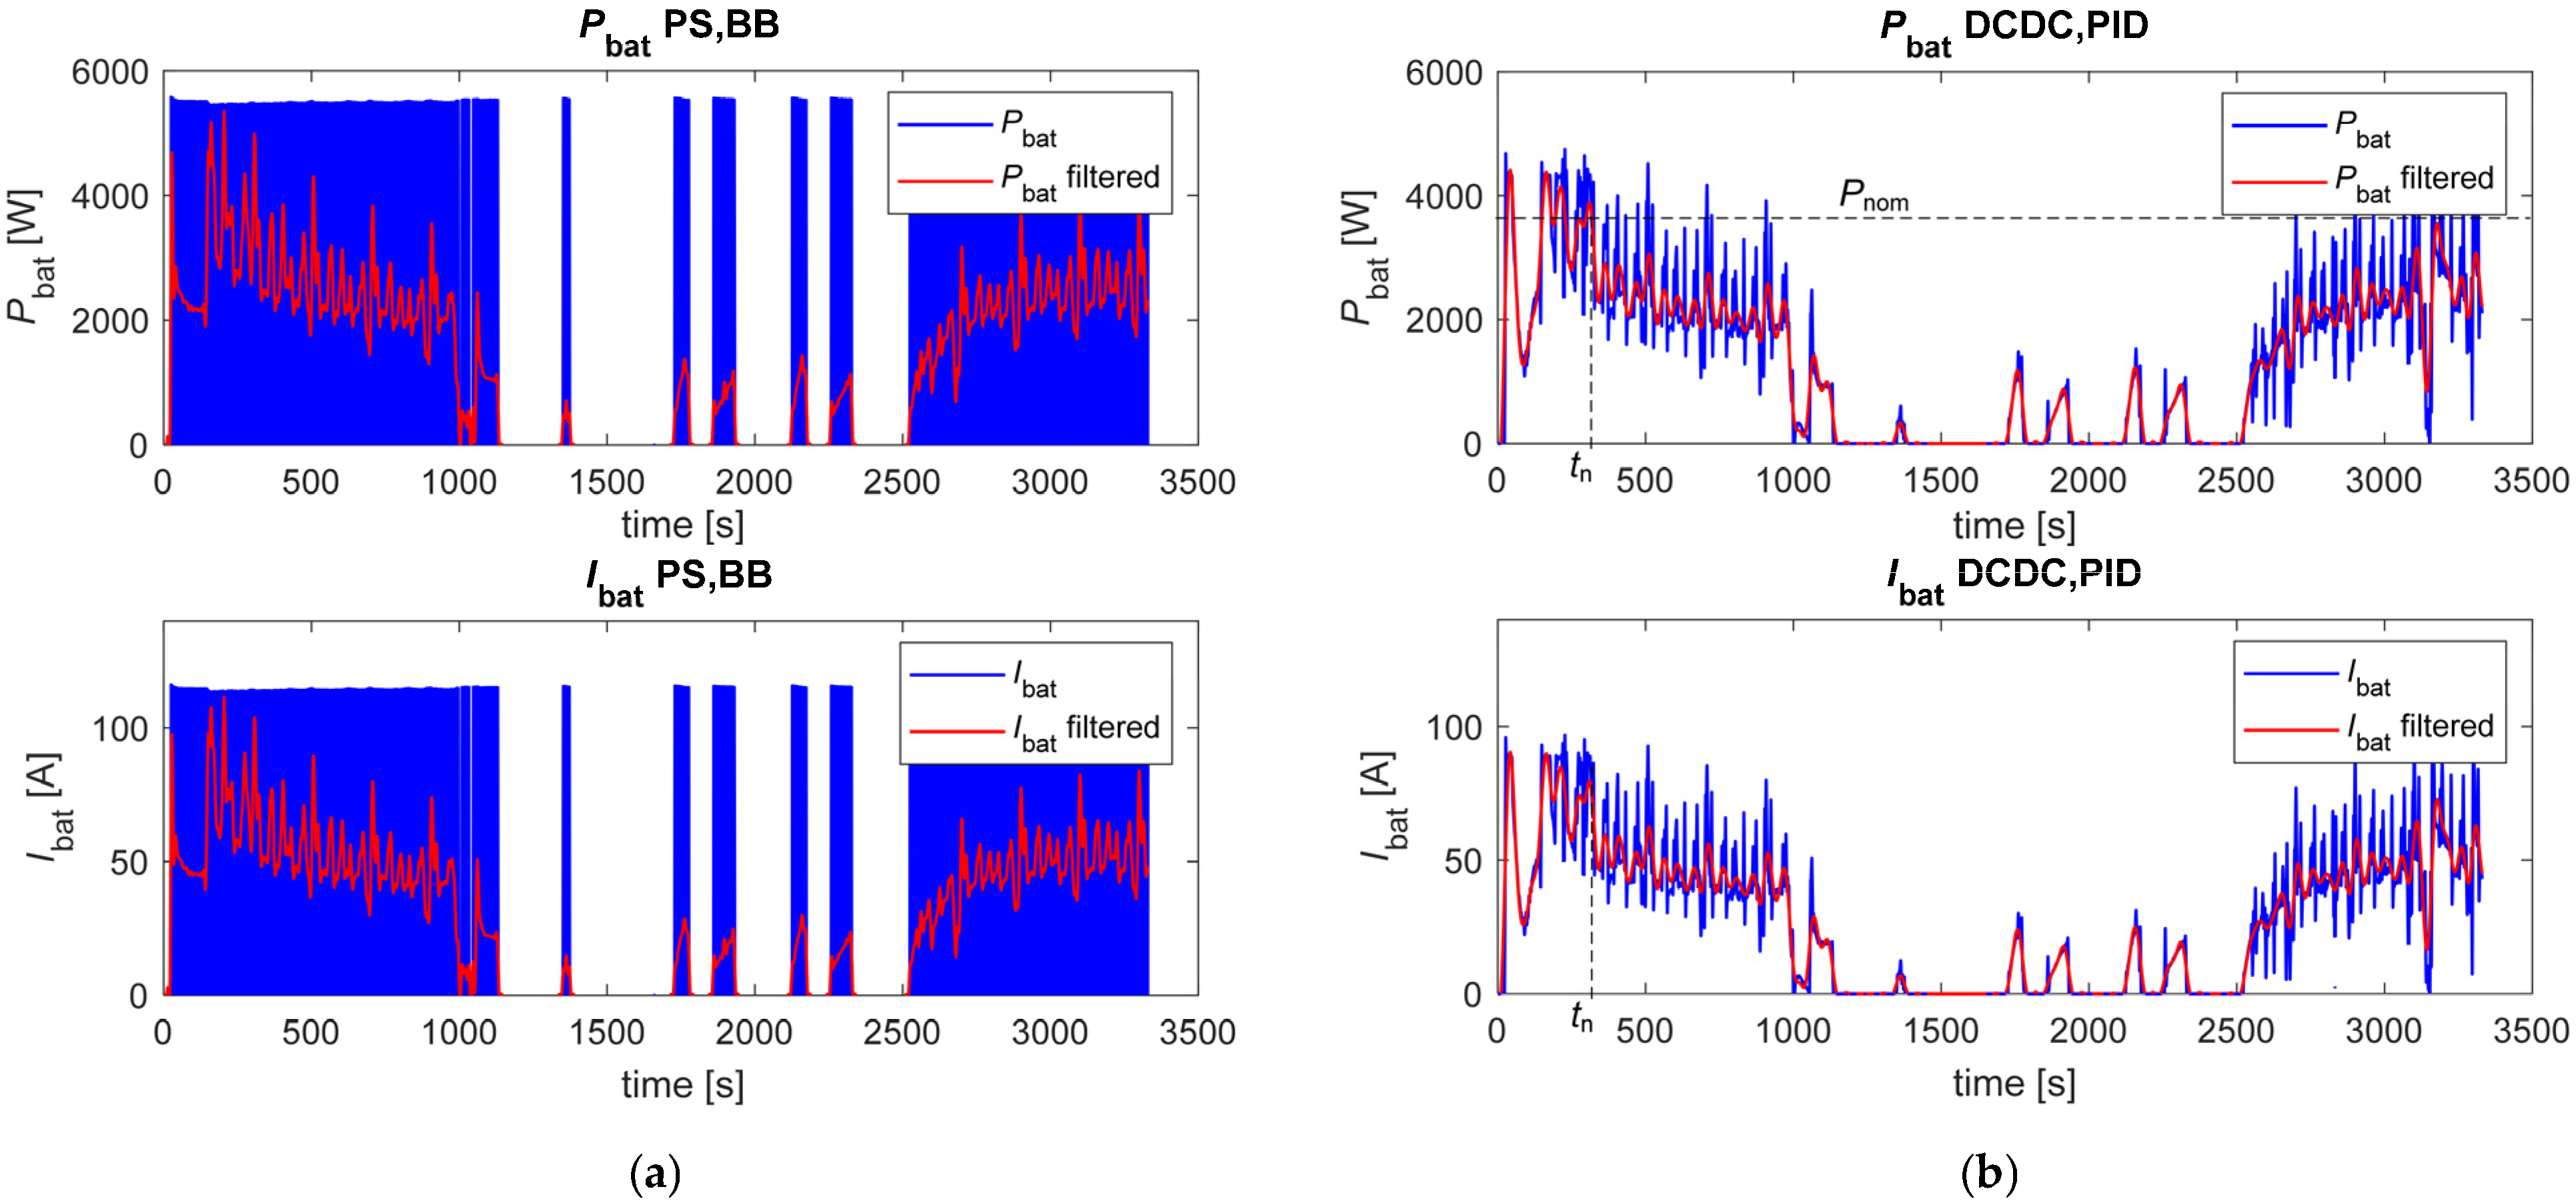
Figure 14 displays instantaneous Pbat and Ibat values (in blue) sampled every 10 ms, which were further processed with a Butterworth 8th-order filter to extract and compare the average values (in red) of battery current and power responsible for the power demand in both control methods. While the bang-bang method (PS,BB) imposes a full-load electrical stress by abruptly switching the load on and off (Figure 14a), the PID-controlled DC/DC converter (DCDC,PID) in Figure 14b, by contrast, provides gradual instantaneous current and power profiles with less pronounced peaks.
This reduction in instantaneous peaks becomes particularly noticeable when the demanded power falls below the converter’s nominal power, Pnom, which, in the case shown in Figure 14b, occurs from the time mark labelled tn onwards. From this point, both the power supply and distribution network experience significantly lower stress, resulting in improved overall efficiency.
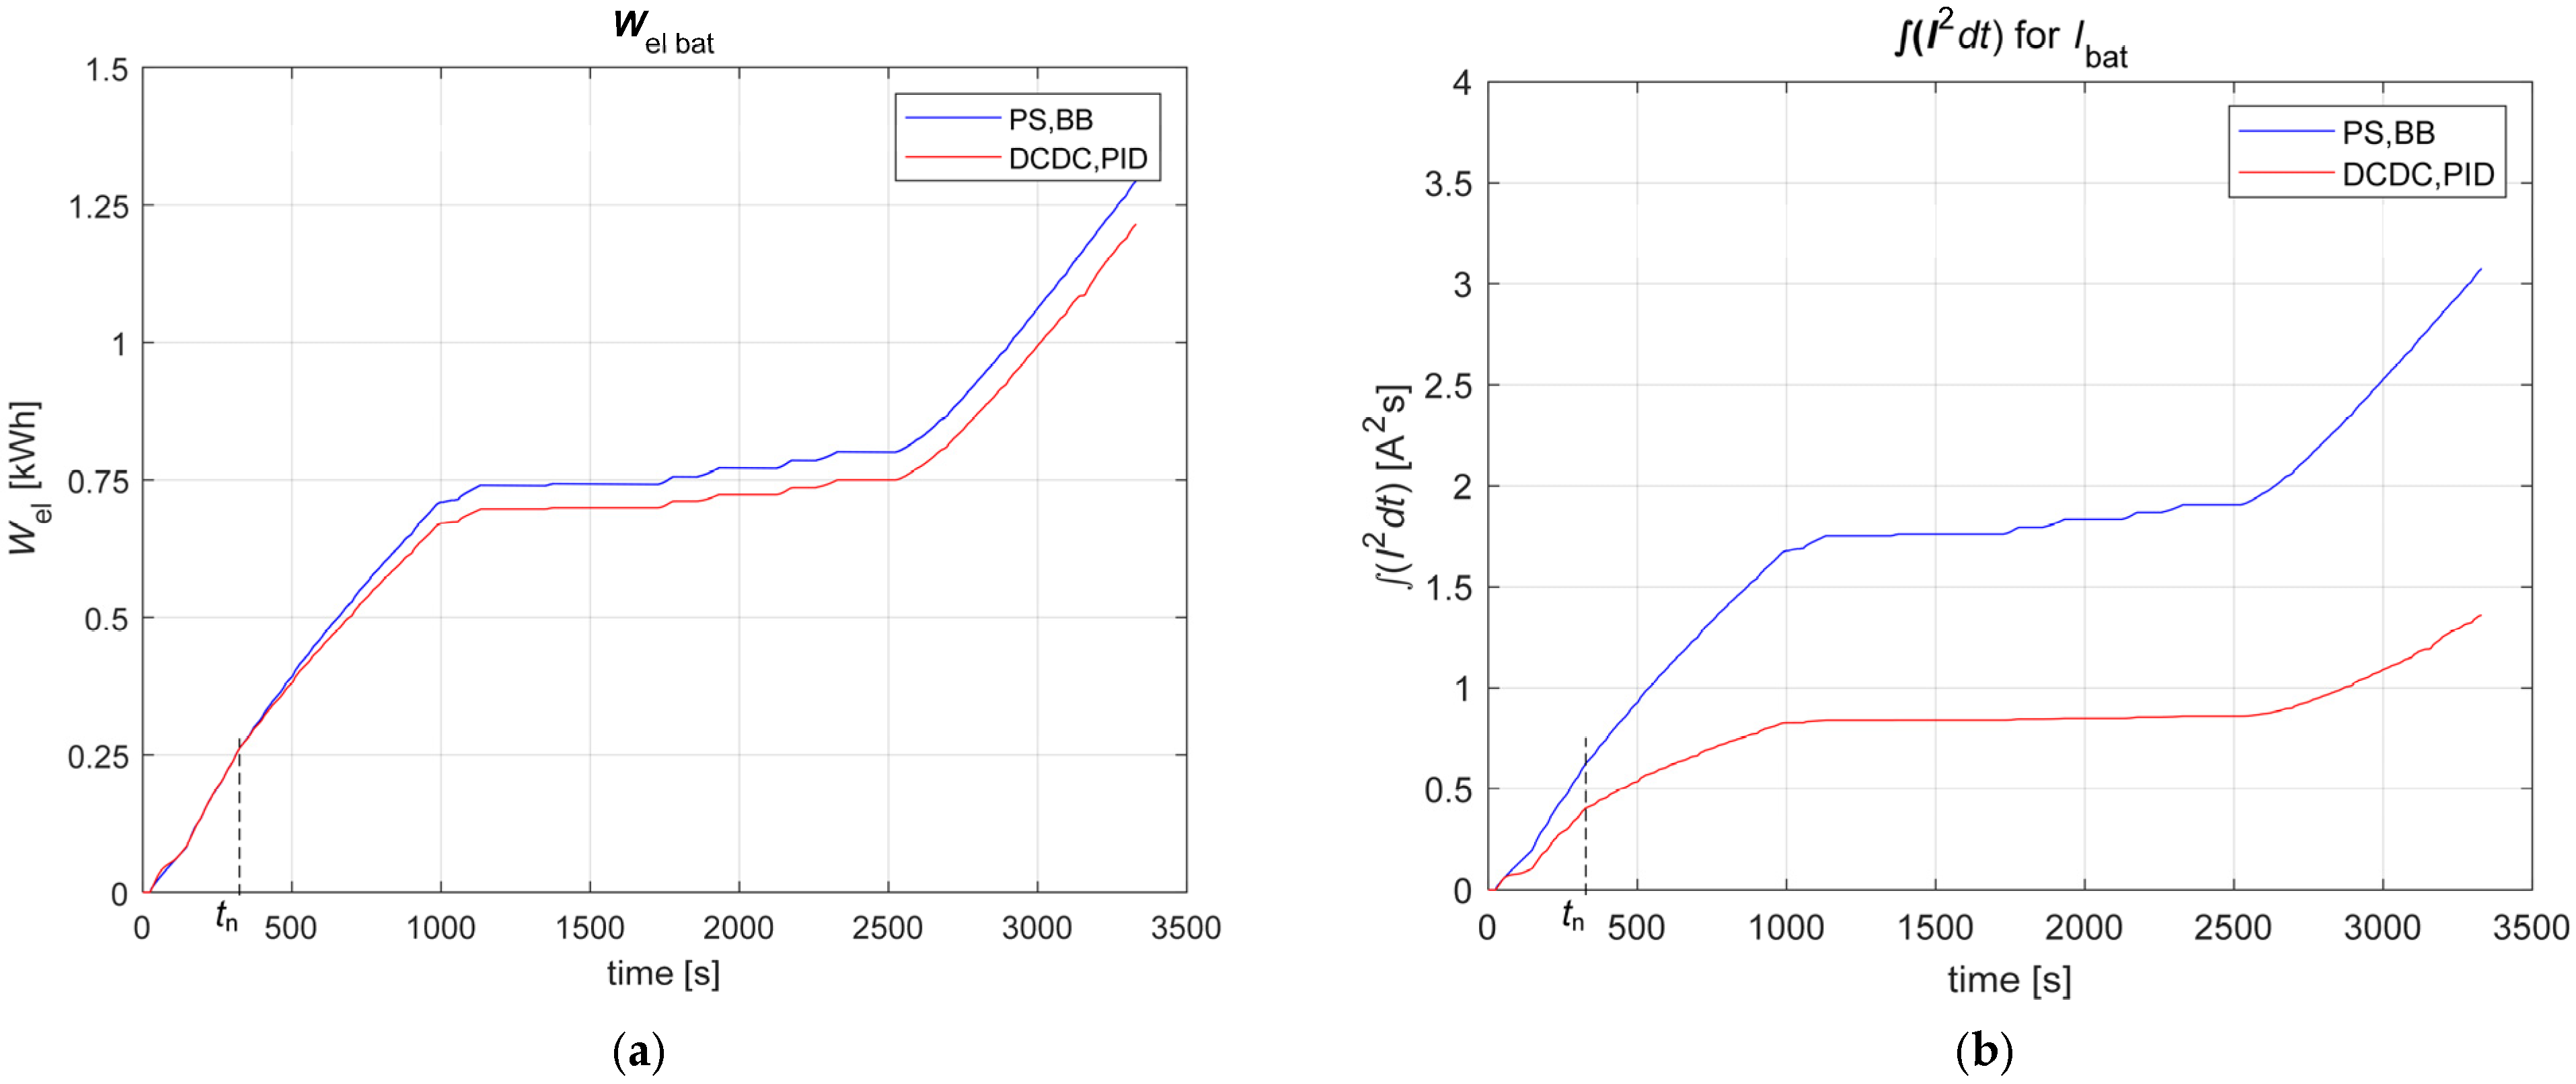
Primarily, the stress is reduced through a decrease in the average power flow from the battery via the DC/DC converter, which is not immediately apparent when comparing the power profiles in Figure 14. The difference becomes clearer when examining the cumulative energy flows supplied to the heater during both experiments. This is calculated by integrating the instantaneous power, defined as the product of the sampled current and the (assumed constant) battery voltage. The comparison of cumulative energies in Figure 15a highlights the previously described advantage within the specified time interval (from tn onwards). This effect is evident as the cumulative energy curves begin to diverge once the DC/DC converter operates below its nominal power. A more detailed understanding of the underlying mechanism is obtained by integrating the squared current over time (∫i2dt), a metric that directly correlates with the high crest factor of the current, leading to a disproportionate increase in losses associated with the battery, supply lines (Zcable), and increased stresses in intermediate conversion stages (Figure 15b). Thus, even though the cumulative energies in Figure 15a supplied by the battery appear nominally the same until tn (approximately 300 s), the ∫i2dt comparison in Figure 15b clearly demonstrates that BB subjects the system to disproportionately higher losses. Notably, these implications are more significant in the design of intermediate conversion stages, where semiconductor switches may operate under low utilization factors, increasing weight and volume, and thereby degrading their specific power-to-weight (W/kg) and power-to-volume (W/dm3) metrics. The motivation for introducing the proposed metric, based on cumulative energy and ∫i2dt rather than on the evaluation and comparison of average and RMS values, arises from the fact that the latter approach fails when dealing with discrete currents with a switching period that is not constant but varies dynamically. Under such conditions, the definitions of both average and RMS values, which rely on a well-defined period, become ambiguous. In contrast, ∫i2dt provides a much more accurate descriptor of the actual stress imposed on the system.

5.3. Onboard Distribution Network Quality Phenomena

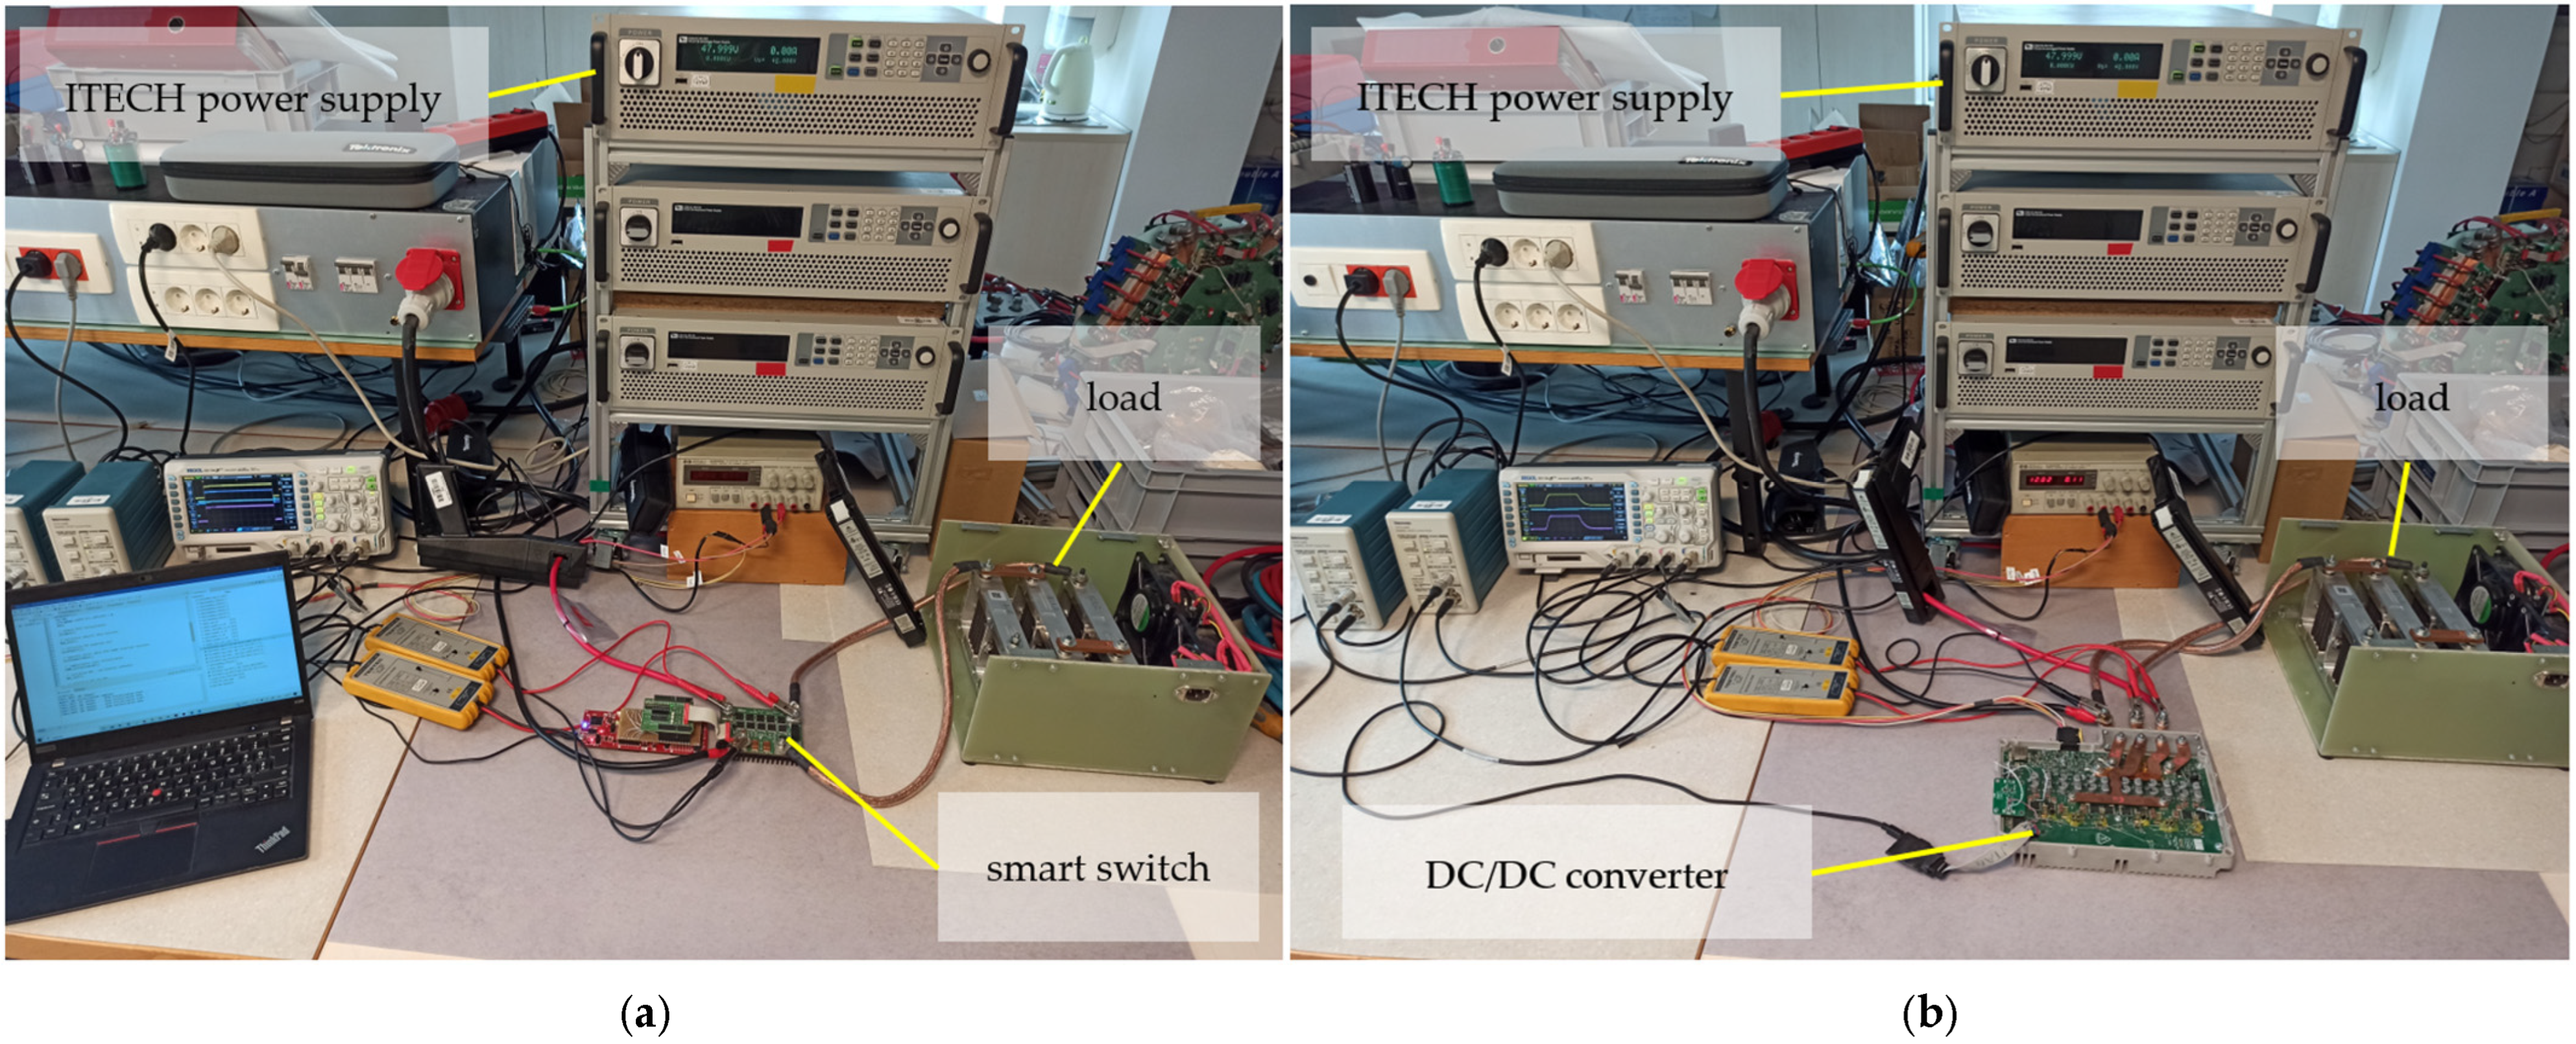
Power quality is essential when assessing the dynamic behaviour of power electronic systems connected to the same onboard distribution network. In this study, electrical measurements focus on transient phenomena resulting from different di/dt variations. The investigations were conducted in a controlled laboratory environment, as shown in Figure 16. The primary aim was to compare the performance of a conventional smart-switch approach (BB control) with the proposed DCDC. Consistent with previous emissions testing, the same laboratory power supply from ITECH was used in both cases solely as a laboratory replacement for the vehicle’s main battery.
Figure 17a shows the supply voltage ubat at the input terminals of the BB-controlled smart switch and its “output” voltage uheat, along with the load current iheat for a 10 ms pulse with a current magnitude of 104 A. A more detailed examination of switching events during turn-on (Figure 17b) and turn-off (Figure 17c) reveals pronounced ubat transients (from 48 V down to 28 V at switch turn-on and up to 78 V at switch turn-off) that can be observed at the input terminals of the smart-switch unit. These also exhibit oscillatory behaviour, indicating the excitation of parasitic inductances and capacitances inherent in the system. Such oscillations, if sustained, can adversely affect quality and EMC parameters. Over time, the present overvoltage can compromise the reliability of the switching unit and the connected heater isolation.
The same test was repeated for the DC/DC converter. Figure 18 shows the corresponding traces of key electrical quantities for a 10 ms step change in current reference from 0 A to 95 A for two current slopes: 60 A/ms (Figure 18a) and 30 A/ms (Figure 18b), respectively. As anticipated, ubat remains nearly unchanged (a 2.4 V difference was recorded) compared to the BB scenario, as the current transitions generate only a moderate voltage drop induced by the cable inductance, which is estimated at 7.9 μH (value obtained from the previous BB test).
The results demonstrate that the DC/DC converter offers significant advantages over the smart switch BB approach, including a notable reduction in peak power demand from the vehicle electrical distribution network and measurable improvements in voltage quality during dynamic operational scenarios. The results also highlight the converter’s beneficial interaction with the supply source, showcasing its potential to improve the overall reliability of all devices connected to the same distribution network. Furthermore, it eliminates the need to restrict the vehicle’s energy consumption or limit the operating capacity of these devices during periods of high demand, thereby supporting uninterrupted and efficient performance across the entire system.

6. Conclusions

In this paper, two power supplies and two control strategies intended for minimizing pollutant emissions through the EHC concept onboard the ICE vehicle were analyzed. The study showed that the required heating power for effective pollutant emissions reduction is substantial, particularly at cold engine start or during low-speed driving intervals with engine start–stop functionality. However, with the EHC, a several-fold reduction in CO and THC emissions is achieved. These preliminary results provided a solid foundation for defining key target requirements for a dedicated onboard battery-powered DC/DC converter.
As demonstrated in the final experimental section, the combination of smoother control, enabled by a PID controller and a dedicated switched-mode power converter, not only effectively reduces pollutant emissions through the EHC concept but also ensures a lighter cable harness due to significantly lower (and controllable) current (di/dt) and voltage (dv/dt) transients. Consequently, as highlighted in Section 4, this reduces the need for mitigation measures during the design of the distribution network and minimizes the requirements for protective or limiting components, such as snubber circuits and transient-voltage-suppression diodes. This observation underscores a critical consideration in the early stages of converter design and prototyping: the choice of input data used for analysis. Selecting representative or appropriately scaled input data is essential, as inaccurate assumptions can lead to significant misjudgements in component sizing, such as the selection of heatsinks, magnetic elements, and semiconductors. Misinterpreting power requirements based on superficial profile characteristics can result in under-designed components, risking performance issues and thermal overload, or over-designed components, leading to unnecessary increases in cost, size, and inefficiency. Thus, accurate differentiation between average and peak power demands not only contributes to robust converter design but also supports an optimized and cost-effective electrical distribution architecture.
In the presented case, the main drawback regarding the CC thermal response is the upstream type of electrical heater. Finding a more direct method of heating the CC core is therefore a key challenge for future work. Although the EHC concept yields promising results, the required electrical power places a significant load on the onboard electricity generation via the ICE-powered generator (alternator), thereby affecting overall system (fuel) efficiency. From the DC/DC converter’s perspective, the use of advanced GaN or SiC semiconductor devices [60], designed for higher switching frequencies, would allow for smaller passive components and thus reduce the converter’s cost and size (volume), which clearly supports the adoption of such elements already appearing in various automotive applications [61,62,63]. In general, the design phase of the dedicated power supply for the EHC would benefit greatly from suitable co-simulation models encompassing thermal (heat transfer), chemical (CC efficiency) and electrical (required power) aspects of the EHC concept, which could ultimately be an effective way to bridge or minimize the gap between ICE-based and green mobility.

Author Contributions

Conceptualization, M.P., A.R., M.N. and P.Z.; methodology, M.P., D.N.; software, M.N.; validation, M.P., P.Z., A.R., M.N. and J.G.; formal analysis, P.Z.; investigation, D.V.; resources, M.P., P.Z. and D.N.; data curation, A.R. and J.G.; writing—original draft preparation, M.P., P.Z. and D.N.; writing—review and editing, M.P., P.Z., A.R., M.N., D.V., D.N., V.A. and J.G.; visualization, M.P. and M.N.; supervision, D.N. and P.Z.; project administration, D.V., D.N. and V.A.; funding acquisition, D.V., D.N. and V.A. All authors have read and agreed to the published version of the manuscript.

Funding

This research was partially funded by Slovenian Research and Innovation Agency, grant number P2-0258 and L2-2619.

Institutional Review Board Statement

Not applicable.

Informed Consent Statement

Not applicable.

Data Availability Statement

The original contributions presented in this study are included in the article. Further inquiries can be directed to the corresponding author.

Conflicts of Interest

The author Jure Golob was employed by the company HIDRIA, BU Hidria Advancetec. The remaining authors declare that the research was conducted in the absence of any commercial or financial relationships that could be construed as a potential conflict of interest. Authors declare no conflicts of interest. The funders had no role in the design of the study; in the collection, analyses, or interpretation of data; in the writing of the manuscript; or in the decision to publish the results.

References

  1. Migration Data Portal. The Bigger Picture. Urbanization and Migration. Available online: https://www.migrationdataportal.org/themes/urbanisierung-und-migration (accessed on 26 October 2025).
  2. Eurostat. Urban-Rural Europe—Demographic Developments in Cities. Available online: https://ec.europa.eu/eurostat/statistics-explained/index.php?title=Urban-rural_Europe_-_demographic_developments_in_cities#Context (accessed on 22 October 2025).
  3. ACEA. New Car Registrations in 2024. Available online: https://www.acea.auto/pc-registrations/new-car-registrations-0-8-in-2024-battery-electric-13-6-market-share/ (accessed on 26 August 2025).
  4. Giménez-Nadal, J.I.; Molina, J.A.; Velilla, J. Trends in Commuting Time of European Workers: A Cross-Country Analysis. Transp. Policy 2022, 116, 327–342. [Google Scholar] [CrossRef]
  5. Armoogum, J.; Garcia, C.; Gopalapillai, Y.; Borgato, S.; Fiorello, D.; Maffii, S.; Mars, K.J.; Popovska, T.; Schlemmer, L.; Gayda, S.; et al. Study on New Mobility Patterns in European Cities, Task A: EU Wide Passenger Mobility Survey; IFSTTAR: Champs-sur-Marne, France, 2022; Available online: https://op.europa.eu/en/publication-detail/-/publication/adfc18f1-80e1-11ed-9887-01aa75ed71a1 (accessed on 17 April 2025).
  6. Li, K.; Xiao, B.; Wang, Y.; Jia, J.; Wu, X. Applications of Electric Heating Technology in Vehicle Exhaust Pollution Control. Processes 2024, 12, 298. [Google Scholar] [CrossRef]
  7. Dong, H.; Fu, J.; Zhao, Z.; Liu, Q.; Li, Y.; Liu, J. A Comparative Study on the Energy Flow of a Conventional Gasoline-Powered Vehicle and a New Dual Clutch Parallel-Series Plug-in Hybrid Electric Vehicle under NEDC. Energy Convers. Manag. 2020, 218, 113019. [Google Scholar] [CrossRef]
  8. Hamedi, M.R.; Doustdar, O.; Tsolakis, A.; Hartland, J. Energy-Efficient Heating Strategies of Diesel Oxidation Catalyst for Low Emissions Vehicles. Energy 2021, 230, 120819. [Google Scholar] [CrossRef]
  9. Benaitier, A.; Krainer, F.; Jakubek, S.; Hametner, C. Optimal Control of Aftertreatment Electric Heaters for Mild Hybrid Vehicles during Cold Start. In Proceedings of the 2022 IEEE Vehicle Power and Propulsion Conference (VPPC), Merced, CA, USA, 1–4 November 2022; pp. 1–6. [Google Scholar]
  10. Uralde, J.; Barambones, O.; Del Rio, A.; Calvo, I.; Artetxe, E. Rule-Based Operation Mode Control Strategy for the Energy Management of a Fuel Cell Electric Vehicle. Batteries 2024, 10, 214. [Google Scholar] [CrossRef]
  11. Kozina, A.; Vidović, T.; Radica, G.; Vučetić, A. A New Vehicle-Specific Power Model for the Estimation of Hybrid Vehicle Emissions. Energies 2023, 16, 8094. [Google Scholar] [CrossRef]
  12. Umezawa, Y.; Seto, H.; Imamura, T.; Namerikawa, T. Reducing NOx Emissions and Optimizing Fuel Economy by Controlling Torque and Catalyst Warm-up in Mild HEVs. In Proceedings of the 2022 13th Asian Control Conference (ASCC), Jeju, Republic of Korea, 4–7 May 2022; pp. 1914–1919. [Google Scholar]
  13. Gao, J.; Tian, G.; Sorniotti, A. On the Emission Reduction through the Application of an Electrically Heated Catalyst to a Diesel Vehicle. Energy Sci. Eng. 2019, 7, 2383–2397. [Google Scholar] [CrossRef]
  14. Zhu, T.; Wills, R.G.A.; Lot, R.; Kong, X.; Yan, X. Optimal Sizing and Sensitivity Analysis of a Battery-Supercapacitor Energy Storage System for Electric Vehicles. Energy 2021, 221, 119851. [Google Scholar] [CrossRef]
  15. Maus, W.; Brück, R.; Konieczny, R.; Scheeder, A. Electrically Heated Catalyst for Thermal Management in Modern Vehicle Applications. MTZ Worldw. 2010, 71, 34–39. [Google Scholar] [CrossRef]
  16. Gao, J.; Tian, G.; Sorniotti, A.; Karci, A.E.; Di Palo, R. Review of Thermal Management of Catalytic Converters to Decrease Engine Emissions during Cold Start and Warm Up. Appl. Therm. Eng. 2019, 147, 177–187. [Google Scholar] [CrossRef]
  17. Culbertson, D.; Khair, M.; Zhang, S.; Tan, J.; Spooler, J. The Study of Exhaust Heating to Improve SCR Cold Start Performance. SAE Int. J. Engines 2015, 8, 1187–1195. [Google Scholar] [CrossRef]
  18. Velmurugan, D.V.; McKelvey, T.; Olsson, J.-O. Data-Driven Near-Optimal On-Line Control for an Electrically Heated Catalyst-Equipped Gasoline Engine. SAE Int. J. Engines 2023, 16, 335–346. [Google Scholar] [CrossRef]
  19. Fricke, F.; Steinhuber, T.; Grußmann, E.; Rusche, U. Concept Studies for Electrically Heated Catalysts. MTZ Worldw. 2021, 82, 28–33. [Google Scholar] [CrossRef]
  20. Ning, J.; Yan, F. Temperature Control of Electrically Heated Catalyst for Cold-Start Emission Improvement. IFAC-PapersOnLine 2016, 49, 14–19. [Google Scholar] [CrossRef]
  21. Robles-Lorite, L.; Dorado-Vicente, R.; Torres-Jiménez, E.; Bombek, G.; Lešnik, L. Recent Advances in the Development of Automotive Catalytic Converters: A Systematic Review. Energies 2023, 16, 6425. [Google Scholar] [CrossRef]
  22. Getsoian, A.B.; Theis, J.R.; Lambert, C.K. Sensitivity of Three-Way Catalyst Light-Off Temperature to Air-Fuel Ratio. Emiss. Control Sci. Technol. 2018, 4, 136–142. [Google Scholar] [CrossRef]
  23. Mahadeven, G.; Sendilvelan, S. Temperature Analysis of Dynamic Catalytic Convertor System with Pre-Catalyst in a Multi Cylinder Spark Ignition Engine to Reduce Light-off Time. Int. J. Heat Technol. 2017, 35, 97–102. [Google Scholar] [CrossRef]
  24. Kritsanaviparkporn, E.; Baena-Moreno, F.M.; Reina, T.R. Catalytic Converters for Vehicle Exhaust: Fundamental Aspects and Technology Overview for Newcomers to the Field. Chemistry 2021, 3, 630–646. [Google Scholar] [CrossRef]
  25. Mahadevan, G.; Subramanian, S. Experimental Investigation of Cold Start Emission Using Dynamic Catalytic Converter with Pre-Catalyst and Hot Air Injector on a Multi Cylinder Spark Ignition Engine; SAE International: Warrendale, PA, USA, 2017. [Google Scholar] [CrossRef]
  26. Yang, L.; Franco, V.; Campestrini, A.; German, J.; Mock, P. NOx Control Technologies for Euro 6 Diesel Passenger Cars: Market Penetration and Experimental Performance Assessment; White paper; International Council on Clean Transportation: Brussels, Belgium, 20 September 2015. [Google Scholar]
  27. Hanel, F.-J.; Otto, E.; Brück, R. Electrically Heated Catalytic Converter (EHC) in the BMW ALPINA B12 5.7 Switch-Tronic. SAE Trans. 1996, 105, 228–236. [Google Scholar] [CrossRef]
  28. Zhang, Z.; Tian, J.; Li, J.; Cao, C.; Wang, S.; Lv, J.; Zheng, W.; Tan, D. The Development of Diesel Oxidation Catalysts and the Effect of Sulfur Dioxide on Catalysts of Metal-Based Diesel Oxidation Catalysts: A Review. Fuel Process. Technol. 2022, 233, 107317. [Google Scholar] [CrossRef]
  29. Tong, H.Y.; Hung, W.T. A Framework for Developing Driving Cycles with On-Road Driving Data. Transp. Rev. 2010, 30, 589–615. [Google Scholar] [CrossRef]
  30. Wang, Y.; Hao, C.; Ge, Y.; Hao, L.; Tan, J.; Wang, X.; Zhang, P.; Wang, Y.; Tian, W.; Lin, Z.; et al. Fuel Consumption and Emission Performance from Light-Duty Conventional/Hybrid-Electric Vehicles over Different Cycles and Real Driving Tests. Fuel 2020, 278, 118340. [Google Scholar] [CrossRef]
  31. Chen, H.; Song, Z.; Zhao, X.; Zhang, T.; Pei, P.; Liang, C. A Review of Durability Test Protocols of the Proton Exchange Membrane Fuel Cells for Vehicle. Appl. Energy 2018, 224, 289–299. [Google Scholar] [CrossRef]
  32. Liu, Z.; Liu, S.; Zheng, T. The Influence of NEDC and CATC Type Approval Test Procedure on the E-Range of Battery Electric Vehicles. Energy Rep. 2022, 8, 36–42. [Google Scholar] [CrossRef]
  33. Achour, H.; Olabi, A.G. Driving Cycle Developments and Their Impacts on Energy Consumption of Transportation. J. Clean. Prod. 2016, 112, 1778–1788. [Google Scholar] [CrossRef]
  34. André, M.; Joumard, R.; Vidon, R.; Tassel, P.; Perret, P. Real-World European Driving Cycles, for Measuring Pollutant Emissions from High- and Low-Powered Cars. Atmos. Environ. 2006, 40, 5944–5953. [Google Scholar] [CrossRef]
  35. UNECE.org. New European Driving Cycle (NEDC Driving Cycle Data). Available online: https://unece.org/fileadmin/DAM/trans/main/wp29/wp29regs/2015/R101r3e.pdf (accessed on 17 August 2025).
  36. UNECE.org. Worldwide Harmonised Light Vehicles Test Procedure (WLTP Driving Cycle Data). Available online: http://www.unece.org/fileadmin/DAM/trans/doc/2012/wp29grpe/WLTP-DHC-12-07e.xls (accessed on 17 August 2025).
  37. Pavlovic, J.; Marotta, A.; Ciuffo, B. CO2 Emissions and Energy Demands of Vehicles Tested under the NEDC and the New WLTP Type Approval Test Procedures. Appl. Energy 2016, 177, 661–670. [Google Scholar] [CrossRef]
  38. Dimaratos, A.; Tsokolis, D.; Fontaras, G.; Tsiakmakis, S.; Ciuffo, B.; Samaras, Z. Comparative Evaluation of the Effect of Various Technologies on Light-Duty Vehicle CO2 Emissions over NEDC and WLTP. Transp. Res. Procedia 2016, 14, 3169–3178. [Google Scholar] [CrossRef]
  39. Gong, M.; Chen, J.; Chen, J.; Zhao, X. Study on Discharge Characteristic Performance of New Energy Electric Vehicle Batteries in Teaching Experiments of Safety Simulation under Different Operating Conditions. Energies 2024, 17, 2845. [Google Scholar] [CrossRef]
  40. Jaworski, A.; Kuszewski, H.; Balawender, K.; Woś, P.; Lew, K.; Jaremcio, M. Assessment of CH4 Emissions in a Compressed Natural Gas-Adapted Engine in the Context of Changes in the Equivalence Ratio. Energies 2024, 17, 2095. [Google Scholar] [CrossRef]
  41. Serrano, L.; Santana, B.; Pires, N.; Correia, C. Performance, Emissions, and Efficiency of Biodiesel versus Hydrotreated Vegetable Oils (HVO), Considering Different Driving Cycles Sensitivity Analysis (NEDC and WLTP). Fuels 2021, 2, 448–470. [Google Scholar] [CrossRef]
  42. García, A.; Monsalve-Serrano, J.; Lago Sari, R.; Martinez-Boggio, S. Energy Assessment of an Electrically Heated Catalyst in a Hybrid RCCI Truck. Energy 2022, 238, 121681. [Google Scholar] [CrossRef]
  43. Zagar, U. Heating Device. 2024. Available online: https://data.epo.org/publication-server/rest/v1.2/patents/EP4455463NWA1/document.html (accessed on 17 April 2025).
  44. Ursic, P.; Kunilo, D. Exhaust Gas Purification Device And Method For Manufacturing The Same. 2022. Available online: https://data.epo.org/publication-server/rest/v1.0/publication-dates/20210210/patents/EP3772575NWA1/document.pdf (accessed on 17 April 2025).
  45. Crawford, R.; Douglas, J. Induction Heating Apparatus and Methods. 2018. Available online: https://patents.justia.com/patent/20180185789 (accessed on 17 April 2025).
  46. Deutschmann, B.; Winkler, G.; Kastner, P. Impact of Electromagnetic Interference on the Functional Safety of Smart Power Devices for Automotive Applications. e & i Elektrotech. Inf. 2018, 135, 352–359. [Google Scholar] [CrossRef]
  47. Bala, D.; Ulbing, A.; Pathak, S. Advantages of System Level Testing and Modelling for Automotive Smart Power Switches. In Proceedings of the 2023 International Conference on Electrical Drives and Power Electronics (EDPE), The High Tatras, Slovakia, 25–27 September 2023; pp. 1–7. [Google Scholar]
  48. Kozak, J.P.; Zhang, R.; Porter, M.; Song, Q.; Liu, J.; Wang, B.; Wang, R.; Saito, W.; Zhang, Y. Stability, Reliability, and Robustness of GaN Power Devices: A Review. IEEE Trans. Power Electron. 2023, 38, 8442–8471. [Google Scholar] [CrossRef]
  49. Ngwashi, D.K.; Phung, L.V. Recent Review on Failures in Silicon Carbide Power MOSFETs. Microelectron. Reliab. 2021, 123, 114169. [Google Scholar] [CrossRef]
  50. Wei, J.; Wei, Z.; Fu, H.; Cao, J.; Wu, T.; Sun, J.; Zhu, X.; Li, S.; Zhang, L.; Liu, S.; et al. Review on the Reliability Mechanisms of SiC Power MOSFETs: A Comparison Between Planar-Gate and Trench-Gate Structures. IEEE Trans. Power Electron. 2023, 38, 8990–9005. [Google Scholar] [CrossRef]
  51. Hosseinabadi, F.; Chakraborty, S.; Bhoi, S.K.; Prochart, G.; Hrvanovic, D.; Hegazy, O. A Comprehensive Overview of Reliability Assessment Strategies and Testing of Power Electronics Converters. IEEE Open J. Power Electron. 2024, 5, 473–512. [Google Scholar] [CrossRef]
  52. Kotb, R.; Chakraborty, S.; Tran, D.-D.; Abramushkina, E.; El Baghdadi, M.; Hegazy, O. Power Electronics Converters for Electric Vehicle Auxiliaries: State of the Art and Future Trends. Energies 2023, 16, 1753. [Google Scholar] [CrossRef]
  53. Duan, M.; Sun, D.; Duan, J.; Sun, L.; Liu, Y. Interleaved Modulation Scheme With Optimized Phase Shifting for Double-Switch Buck-Boost Converter. IEEE Access 2021, 9, 55422–55435. [Google Scholar] [CrossRef]
  54. Zhang, X.; Zhang, G.; Yu, S.S. Review of Control Techniques for Interleaved Buck Converters: Control Strategies, Efficiency Optimization and Phase Shedding. Chin. J. Electr. Eng. 2025, 11, 40–58. [Google Scholar] [CrossRef]
  55. Infieneon. 48 V Battery Switch Reference Design. Available online: https://www.infineon.com/gated/infineon-infineon-r-48v-batt-switch10-ug-2021-20-en-usermanual-en_9c607b40-33d8-45e9-b870-03ec73b42fc2 (accessed on 9 April 2025).
  56. Kumar, R.R.; Bharatiraja, C.; Udhayakumar, K.; Devakirubakaran, S.; Sekar, K.S.; Mihet-Popa, L. Advances in Batteries, Battery Modeling, Battery Management System, Battery Thermal Management, SOC, SOH, and Charge/Discharge Characteristics in EV Applications. IEEE Access 2023, 11, 105761–105809. [Google Scholar] [CrossRef]
  57. Zhu, T.; Tomlin, R.; Garcia, C.; Rawat, S.; Holland, T.; Offer, G.; Marinescu, M. Lithium-Ion Battery Model Parametrisation: BatPar an All-in-One Toolkit for Equivalent Circuit Models. J. Energy Storage 2024, 92, 112220. [Google Scholar] [CrossRef]
  58. Lucaferri, V.; Quercio, M.; Laudani, A.; Riganti Fulginei, F. A Review on Battery Model-Based and Data-Driven Methods for Battery Management Systems. Energies 2023, 16, 7807. [Google Scholar] [CrossRef]
  59. Tomasov, M.; Kajanova, M.; Bracinik, P.; Motyka, D. Overview of Battery Models for Sustainable Power and Transport Applications. Transp. Res. Procedia 2019, 40, 548–555. [Google Scholar] [CrossRef]
  60. Lavrič, H.; Zajec, P.; Drobnič, K.; Rihar, A.; Ambrožič, V.; Vončina, D.; Nemec, M. Challenges for Large-Scale Deployment of WBG in Power Electronics. Inf. MIDEM 2025, 55, 3–23. [Google Scholar] [CrossRef]
  61. Abart, C.; Berberich, K.; Hegazy, O.; Abdel-Monem, M.; Vanegas, O.; Lis, A. Wide Bandgap Semiconductors Enabling Highly Efficient Electrified Vehicles. Transp. Res. Procedia 2023, 72, 17–23. [Google Scholar] [CrossRef]
  62. Subhashini, T.; Kavitha, M.; Manikandan, T. Energy Efficient Wide Bandgap Semiconductor SiC Based Electric Vehicle and Their Applications. Z. Wirtsch. Fabr. 2025, 120, 626–632. [Google Scholar] [CrossRef]
  63. Abualnaeem, M.M.; Zulkifli, S.A.B.M.; Bin Yahaya, N.Z.; Soomro, H.A. Comparison of Power Loss in SiC-MOSFET and Si-IGBT Traction Inverter with Variable Switching Frequency for Electric Vehicle Application. In Proceedings of the 2024 IEEE Symposium on Industrial Electronics & Applications (ISIEA), Kuala Lumpur, Malaysia, 6–7 July 2024; IEEE: Kuala Lumpur, Malaysia, 2024; pp. 1–6. [Google Scholar]
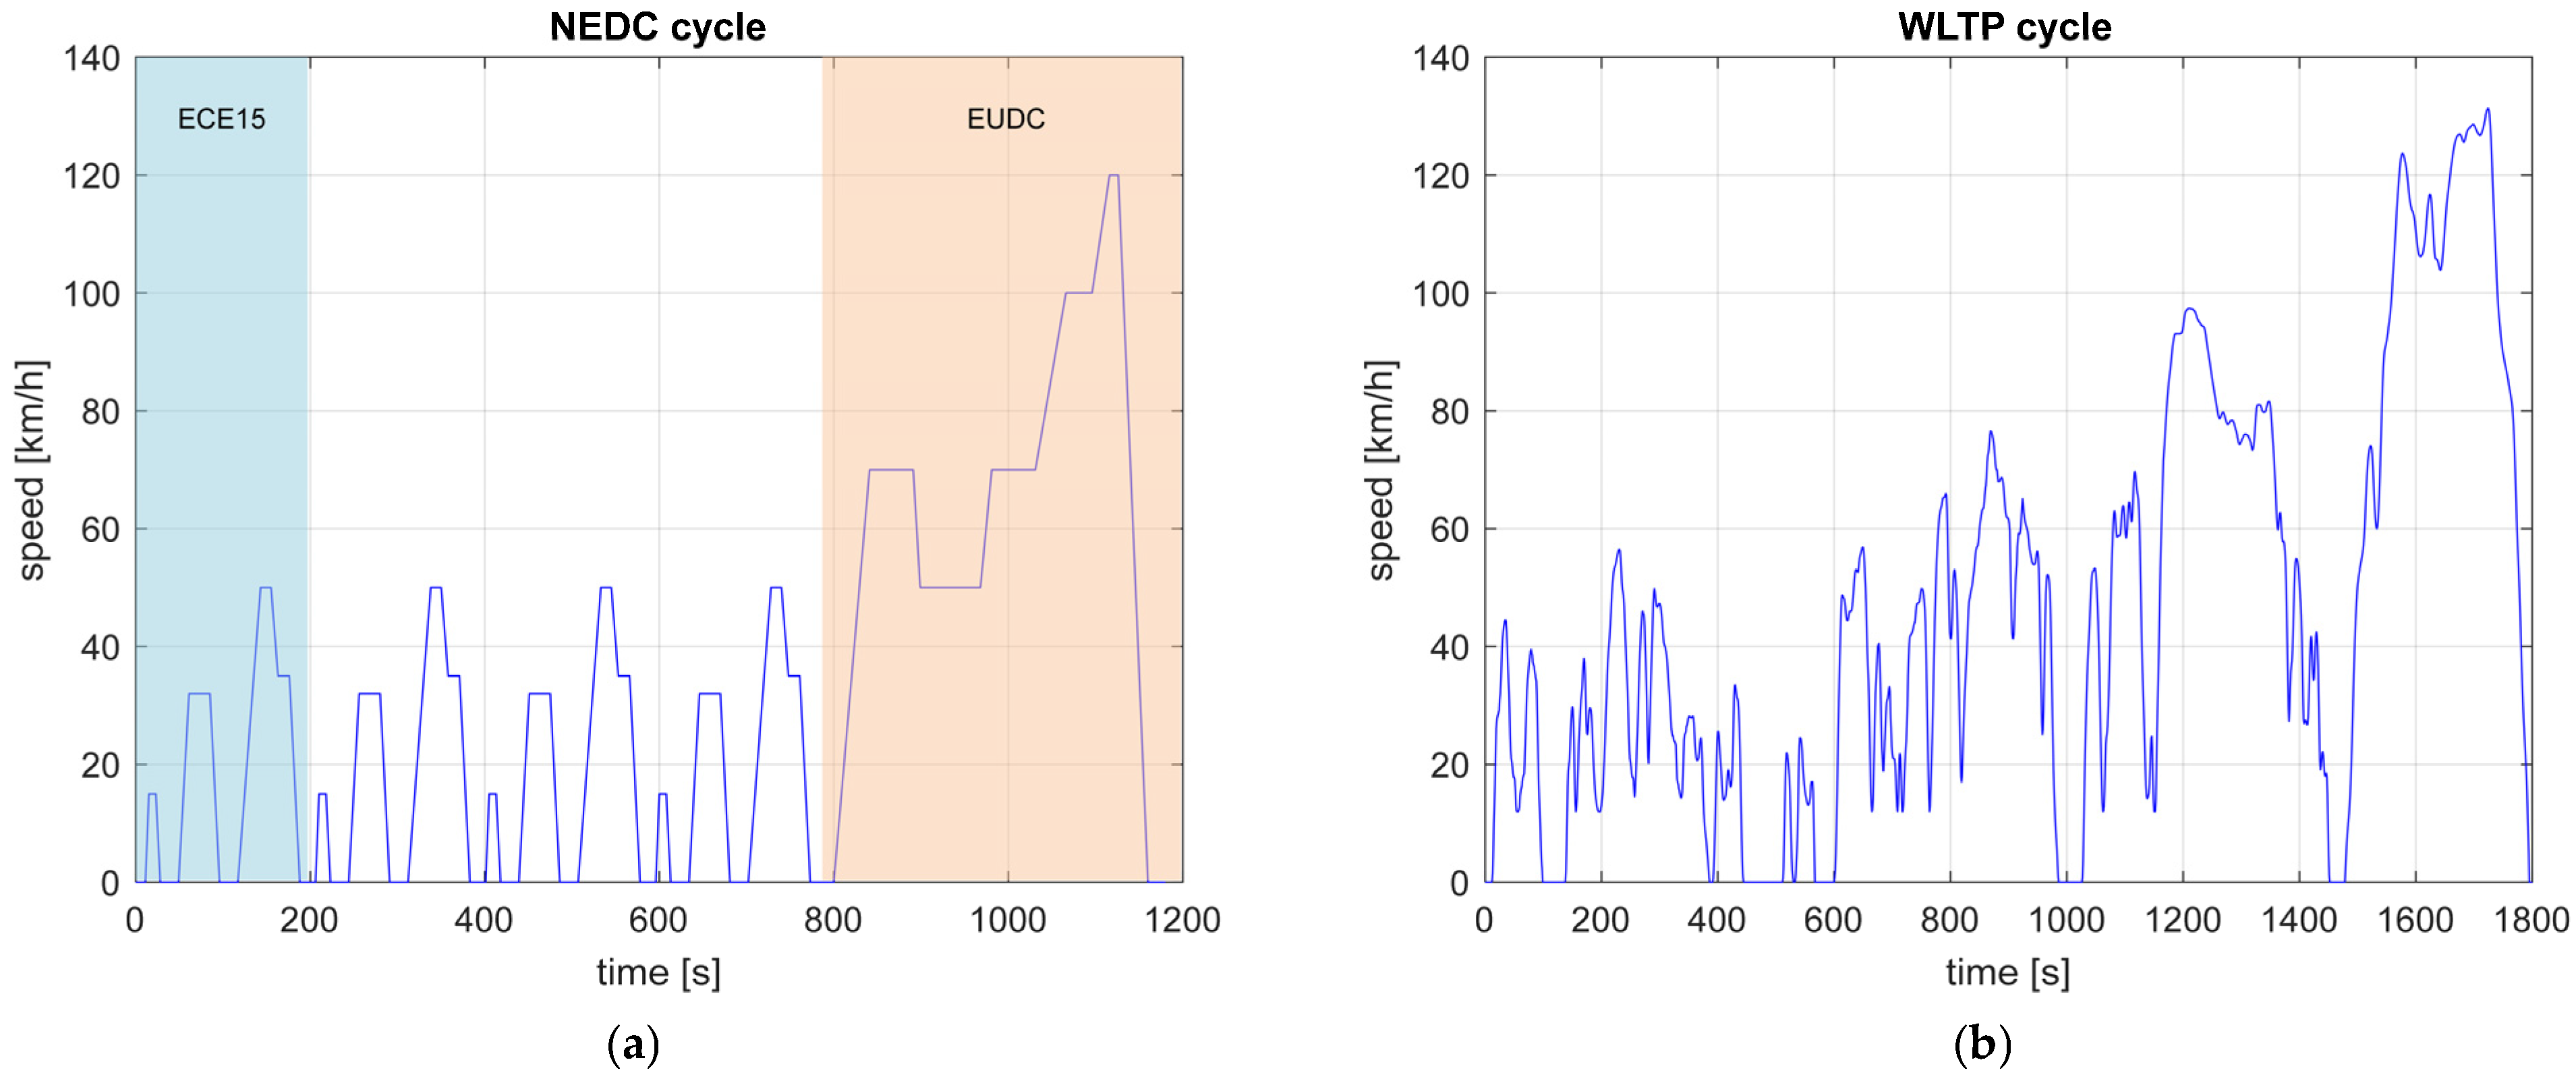
Figure 1. Speed profile comparison between: (a) the NEDC driving cycle [35] and (b) the WLTP driving cycle [36].
Applsci 15 12483 g001
Figure 2. The most common EHC arrangements: (a) upstream, (b) wrapped, (c) induction.
Applsci 15 12483 g002
Figure 3. A detailed view of the ICE segment featuring an installed EHC with a zoomed electric heater inset.
Applsci 15 12483 g003
Figure 4. ICE emission test arrangement with an Electrically Heated Catalytic Converter: (a) system schematic, (b) test setup layout showing the ICE segment with installed EHC, and (c) AVL measurement and control equipment.
Applsci 15 12483 g004
Figure 5. Results of emissions test with OEM-equipped CC (without EHC): (a) speed profile and representative temperatures; (b) CO and THC volumetric concentrations.
Applsci 15 12483 g005
Figure 6. Schematic of the EHC temperature control arrangement, showing the control configurations and supply scenarios tested during preliminary estimation with the programmable power supply.
Applsci 15 12483 g006
Figure 7. (a) Response of thermal and supply variables using BB-controlled EHC; (b) Volumetric concentrations of CO and THC with EHC (PS,BB) compared to disabled electric heating (OFF).
Applsci 15 12483 g007
Figure 8. (a) Response of thermal and supply variables using PID-controlled EHC; (b) Volumetric concentrations of CO and THC with EHC (PS,PID) compared to emissions with electric heating disabled (OFF).
Applsci 15 12483 g008
Figure 9. (a) Typical configuration of a smart switch with the most critical parasitic components of the distribution network; (b) Idealized current waveforms.
Applsci 15 12483 g009
Figure 10. (a) Configuration of a four-leg DC/DC converter with the most critical parasitic components of the distribution network; (b) Idealized current waveforms.
Applsci 15 12483 g010
Figure 11. A four-leg DC/DC converter (inductors are located on the bottom side of the PCB).
Applsci 15 12483 g011
Figure 12. Schematic of the EHC temperature control arrangement with a custom-made four-leg DC/DC converter.
Applsci 15 12483 g012
Figure 13. (a) Response of thermal and supply variables using a PID-controlled DC/DC converter; (b) Comparison of volumetric concentrations of CO and THC for two practical concepts of supplying EHC: a bang-bang-controlled (PS,BB) high-side switch and a PID-controlled DC/DC converter (DCDC,PID). The dotted line corresponds to the reference situation with the electric heater disabled (OFF).
Applsci 15 12483 g013
Figure 14. Power and current (sampled and averaged) at the power supply: (a) laboratory power supply with BB control (PS,BB); (b) controlled DC/DC converter (DCDC,PID).
Applsci 15 12483 g014
Figure 15. (a) Cumulative energy supplied by the battery and (b) ∫i2dt comparison for the entire duration of the PS,BB and DCDC,PID tests.
Applsci 15 12483 g015
Figure 16. Experimental setup for testing (a) a BB-controlled high-side smart switch from Infineon [55] and (b) a custom-made DC/DC converter.
Applsci 15 12483 g016
Figure 17. (a) Voltages and current for BB control behaviour (1 ms/div) with zoomed views of (b) switch turn-on (50 μs/div) and (c) turn-off (50 μs/div).
Applsci 15 12483 g017
Figure 18. DC/DC converter voltages (input voltage ubat and output voltage uheat) and current iheat (1 ms/div) for (a) a current slope of 60 A/ms and (b) a current slope of 30 A/ms.
Applsci 15 12483 g018
Table 1. Average cumulative CO and THC volumetric concentrations (Avg) in observed intervals for no-heating option (OFF) and with EHC using a laboratory power supply for bang-bang (PS,BB) and PID (PS,PID) control (defined later in Section 3.2.2), as well as concentration reductions (Red.) with EHC compared to no heating (OFF).
Intervals
1 (From 0 s to 340 s)2 (From 340 s to 950 s)3 (From 950 s to 2530 s)4 (From 2530 s to 3350 s)
PollutantControlAvg [ppm]Red. [%]Avg [ppm]Red. [%]Avg [ppm]Red. [%]Avg [ppm]Red. [%]
COOFF1424.18/833.25/17.69/280.18/
PS,BB199.0586.03.4499.61.0394.20.8599.7
PS,PID224.6384.22.9899.60.6196.51.6899.4
THCOFF165.17/94.46/9.62/32.25/
PS,BB32.3780.46.9492.72.8570.42.5192.2
PS,PID36.3178.06.5493.12.0378.91.6095.0
Table 2. Comparison of key parameters of bang-bang-controlled smart switch versus PID-controlled DC/DC converter.
ParametersBang-Bang Control with Smart SwitchPID Control with DC/DC Converter
output power qualitylow—larger ripplehigh—small voltage ripple with no steady-state error
steady-state errornonzero(practically) zero
current (di/dt) and voltage (dv/dt) transientshigh—large voltage and current stresslower—smoothed by inductor and capacitor filtering
EMI/conducted noiselowmoderate-high—noise concentrated at switching frequency and harmonics
converter costlow—few components (smart switch, capacitors, resistors)higher—switches, capacitors, inductors, etc.
converter weight and PCB arealowhigh
control algorithm complexitylowhigh—PID tuning, stability margins
Disclaimer/Publisher’s Note: The statements, opinions and data contained in all publications are solely those of the individual author(s) and contributor(s) and not of MDPI and/or the editor(s). MDPI and/or the editor(s) disclaim responsibility for any injury to people or property resulting from any ideas, methods, instructions or products referred to in the content.