Article

Cortical Tuber Types in Tuberous Sclerosis Complex: Need for New MRI-Based Classification System Incorporating Changes in Susceptibility Weighted Imaging

1
Neuroradiology Unit, Department of Neurosciences, Santobono-Pausilipon Children’s Hospital, AORN, 80129 Naples, Italy
2
Neurology Unit, Department of Neurosciences, Santobono-Pausilipon Children’s Hospital, AORN, 80129 Naples, Italy
3
Neurosurgery Unit, Department of Neurosciences, Santobono-Pausilipon Children’s Hospital, AORN, 80129 Naples, Italy
*
Author to whom correspondence should be addressed.
Appl. Sci. 2025, 15(23), 12486; https://doi.org/10.3390/app152312486
Submission received: 25 August 2025 / Revised: 16 November 2025 / Accepted: 21 November 2025 / Published: 25 November 2025
(This article belongs to the Special Issue MR-Based Neuroimaging)

Abstract

Purpose: This study proposes a novel magnetic resonance (MRI)-based classification of cortical tubers (CTs) in tuberous sclerosis complex (TSC) patients that incorporates intralesional calcifications. We evaluated prevalence, temporal evolution, and genotype correlation of intra-tuberal calcifications in pediatric TSC patients, emphasizing susceptibility-weighted imaging (SWI) for detection. Materials and Methods: We retrospectively analyzed MRI scans of 57 unrelated pediatric TSC patients followed between 2014 and 2024 at a tertiary care center. Inclusion criteria included longitudinal imaging on the same 1.5T scanner, with T1w, T2w/FLAIR, and SWI sequences. CTs were classified into four MRI-based categories (A–D), with calcified tubers subdivided into micro-calcified and macro-calcified. Descriptive statistics, binomial tests, and Chi-square analyses were performed. Results: Calcified CTs were more prevalent than cystic ones. At baseline MRI, 63% of patients had calcified tubers (19% of all CTs), increasing to 77% at follow-up MRI (24% of all CTs). Micro-calcifications predominated at baseline MRI evaluation, though a significant proportion progressed to macro-calcifications over time. Calcified CTs always progressed from lower-grade lesions. Cystic tubers were rare (<1%). Longitudinal analysis showed significant variation in CTs with inner calcification count (p = 0.0000023), but not in CTs with cystic components (p = 0.42072). No significant genotype–radiological phenotype association emerged. Conclusions: Intralesional calcifications in CTs are dynamic and detectable with SWI. The inclusion of calcification patterns in CT classification could offer insights that may prove useful for future prognostic and risk-stratification frameworks in pediatric TSC.

1. Introduction

Tuberous sclerosis complex (TSC) is a multisystem genetic disorder characterized by the development of dysplastic lesions and tumors in various organs—with almost invariable involvement of the central nervous system (CNS)—whose major manifestations include brain cortical tubers (CTs), white matter lesions (WML), radial migration lines (RML), sub-ependymal nodules (SEN), and sub-ependymal giant cell astrocytoma (SEGA) [1,2]. In particular, CTs are a central diagnostic feature of TSC, representing the most prominent neurological finding and occurring in more than 90% of patients [3]. The most recent update to the diagnostic criteria, published in 2021 by the International Tuberous Sclerosis Complex Consensus Group, reaffirmed and refined the role of neuroimaging in the diagnosis of TSC. Among the major criteria, cortical dysplasia—specifically CTs—are recognized as pathognomonic hallmarks of the disorder and contribute significantly to a definitive diagnosis when present alongside other clinical or genetic findings [4]; the decision is also supported by the fact that CTs are frequently associated with the early onset of epilepsy (frequently evolving into a drug-resistant form) and poorer neurodevelopmental outcomes [5,6,7,8]. These updated criteria emphasize the diagnostic value of identifying CTs, particularly in pediatric patients, reinforcing their role in guiding clinical practice; this link has prompted the inclusion of comprehensive brain magnetic resonance imaging (MRI) examination in TSC patients’ initial assessment and follow-up [4,6].
Etiologically, TSC can be caused by pathogenic variants in either the TSC1 or the TSC2 genes encoding for hamartin and tuberin, respectively, two proteins that form a heterodimeric structure involved in the inhibition of the mechanistic target of rapamycin (mTOR) complex; dysregulation of this pathway leads to abnormal cell growth and proliferation, promoting CNS lesion development. However, a subset of patients present with clinical features of the disease but no have identifiable pathogenic mutation in either the TSC1 or TSC2 genes and are therefore classified as having “no mutation identified” (NMI) status (i.e., due to low-level mosaicism, deep intronic mutations, regulatory gene alterations, large deletions/duplications, or epigenetic dysregulation, which may mimic TSC manifestations) [4]. Concerning genotype–phenotype correlation, TSC2 mutations are known to be associated with more severe CNS imaging findings compared to TSC1 mutations, including a higher CT burden; conversely, NMI patients usually show milder radiological and clinical features, in particular, lower tuber load, later-onset epilepsy, and less frequent TSC-associated neuropsychiatric disorders, although exceptions exist and phenotypic variability can be high [9,10,11].
Some evidence suggests that the overall tuber burden in TSC does not strictly correlate with the clinical phenotype, and that, in children, the utility of structural MRI for identifying epileptogenic CTs is limited [9,12,13,14,15,16,17,18]; this implies that more reliable biomarkers may exist to stratify pediatric patients according to the severity of clinical manifestations and long-term prognosis (i.e., CT signal and/or distribution, WML, and so on). In particular, calcifications within CTs (while not universally present) have recently been associated with a more severe neurological TSC phenotype; these calcified lesions may exhibit greater epileptogenic potential compared to non-calcified tubers. The presence of microscopic or macroscopic calcified components within CTs (occasionally accompanied by cystic degeneration and/or mild contrast enhancement) have been variably linked to increased epileptogenicity and have been proposed as contributing factors to seizure onset/severity [19,20,21,22]. CTs’ inner calcifications are usually considered stationary, with an isolated report of inner calcification progression over time in a single CT of an individual TSC patient [23]. Thus, considering its potential diagnostic relevance in TSC, imaging assessment should prioritize MRI study complemented by susceptibility-weighted imaging (SWI) acquisitions for CT evaluation, which is proven to be more sensitive to calcification detection than both computed tomography and conventional MRI sequences [24,25,26].
However, despite the potential clinical and radiological significance of calcified CTs, it is worth noting that the widely adopted MRI-based classification proposed by Gallagher et al. in 2010 [27] categorizes CTs into three types based solely on conventional sequence signal characteristics, entirely overlooking the presence and morphology of intralesional calcifications. Namely, the three categories are type A tuber (isointense on volumetric T1w images and subtly hyperintense on T2w images, with no mass effect on the surrounding tissue and no distortion of the gyral folding pattern, associated with milder phenotype), type B tuber (hypointense on volumetric T1w images and homogeneously hyperintense on T2w images, with no circumscribed borders, little mass effect, and minimally disruptive of the gyral pattern, associated with intermediate phenotype), and type C tuber (when hypointense on volumetric T1w images and homogeneously hyperintense on T2w images, with cystic-like central region, associated with more severe clinical manifestations).
With this background, the aim of the present study is to propose a new MRI-based classification of CTs in TSC patients that integrates the presence of inner calcifications. To the purpose, we analyzed the prevalence and temporal evolution of intra-tuberal calcifications in a representative cohort of pediatric patients diagnosed with TSC, who were consistently evaluated using SWI MRI acquisitions. We also assessed whether the presence or number of CT calcifications showed any correlation with the disease genotype.

2. Materials and Methods

2.1. Subjects and Imaging Selection Criteria

In this retrospective study, we examined demographical data and MRI scans of 108 TSC patients who were followed at the Neurology Unit of Santobono-Pausilipon Children’s Hospital in Naples between 2014 and 2024; TSC diagnosis in all patients was established in accordance with the diagnostic criteria and recommendations of the 2012 International Tuberous Sclerosis Complex Consensus Conference [28] and was subsequently reconfirmed based on the 2021 Updated International Tuberous Sclerosis Complex Diagnostic Criteria and Surveillance and Management Recommendations [4]. We only considered patients whose onset MRI and follow-up MRI examinations were performed in the Neuroradiology Unit of Santobono-Pausilipon Children’s Hospital on the same 1.5T MRI scanner (Ingenia Stream, Philips Medical Systems, The Netherlands). Patients aged > 16 years at diagnosis, patients with no available radiological or genetic data, and patients with incomplete MRI examinations or substantial image artifacts at MRI (i.e., motion artifacts, device-related artifacts, etc.) were excluded from the analysis. In case of patients who underwent surgical resection or Magnetic Resonance-guided Laser Interstitial Thermal Therapy (MRgLITT) of the epileptogenic CT(s) for drug-resistant epilepsy, we considered the pre-surgical/pre-MRgLITT MRI examination used for neurosurgical planning as last referral follow-up MRI. Concerning retrospective neuroimaging evaluation, the minimum requirements for MRI examination inclusion were presence of unenhanced volumetric T1w imaging (both with or without fat saturation), unenhanced T2w and/or FLAIR imaging (depending on patient’s age), and SWI sequence; contrast-enhanced T1-weighted imaging, despite not being used for study-related purposes, was frequently available as a critical method for detecting and characterizing subependymal giant cell astrocytomas and other enhancing lesions. Conversely additional acquisitions—such as other pulse sequences or advanced techniques (generally considered optional rather than essential)—were not routinely available as they usually do not alter diagnostic accuracy or clinical management in most pediatric TSC cases (their use is typically reserved for specific purposes such as research protocols or atypical scenarios). For the purpose of this study, we finally recruited 57 consecutive unrelated pediatric patients meeting TSC diagnostic criteria (M:F, 24:33, 42%:58%—TSC1:TSC2:NMI, 12:25:20, 21%:44%:35%); mean age at onset MRI was 4.9 ± 4.8 years, whereas mean age at last follow up MRI was 8.9 ± 5.3 years. Mean number of MRI examinations for each patient was 2.6 ± 3.5, while mean interval between the first and the last considered MRI examination was 4.0 ± 2.7 years. A summary of relevant demographical data is shown in Table 1. Overall, 24/57 patients (42%) presented with incomplete myelination at first MRI examination performed at diagnosis, and only 3/57 patients (5%) were aged < 2 years and had incomplete myelination at last follow-up MRI.

2.2. MRI Evaluation and Classification Model

Imaging findings were critically analyzed to define changes over time in CT number/signal by two experienced neuroradiologists in consensus, using unenhanced volumetric T1w and T2w/FLAIR images for CT assessment as well as for intra-tuberal cyst detection and SWI for calcification identification and classification.
As previously stated, the 2010 Gallagher et al. [27] study proposed a three-type MRI classification of CTs based solely on signal characteristics, but it did not account for intralesional calcifications, which are now recognized as a common, dynamic, and clinically relevant feature of tuber pathology [29]. Advances in susceptibility-based MRI techniques have since made the detection of micro- and macro-calcifications far more sensitive, revealing patterns not captured by the original framework [29]. Updating the classification to include calcified subtypes would therefore provide a more accurate representation of tuber heterogeneity and improve both diagnostic precision and clinical relevance.
In particular, CTs were newly classified according to the following MRI-based scheme, incorporating both the signal characteristics described in previous classification models and the additional features objectively detectable through SWI:
  • Tuber A (corresponding to former tuber A in the classification by Gallagher et al., 2010 [27]): isointense on volumetric T1-weighted images and subtly hyperintense on T2-weighted images, with no mass effect, no distortion of the gyral folding pattern, and no calcifications on SWI.
  • Tuber B (corresponding to former tuber B in the classification by Gallagher et al., 2010 [27]): hypointense on volumetric T1-weighted images and homogeneously hyperintense on T2-weighted images, with no well-defined borders, minimal mass effect, slight disruption of the gyral pattern, and no calcifications on SWI.
  • Tuber C: hypointense on volumetric T1-weighted images and homogeneously hyperintense on T2-weighted images with inner calcifications on SWI, further divided into the following:
    • Tuber C1: with subtle, non-confluent, pinpoint-like calcifications on SWI (micro-calcified, see Figure 1A)
    • Tuber C2: with large, confluent, linear or curvilinear calcifications on SWI (macro-calcified, see Figure 1B)
  • Tuber D: hypointense on volumetric T1-weighted images and homogeneously hyperintense on T2-weighted images with a central cystic area of vacuolization, regardless of the presence of associate calcification(s).

2.3. Statistical Analysis

Inter-rater reliability was evaluated using the Intraclass Correlation Coefficient (ICC), calculated through a two-way random-effects model with an absolute-agreement definition. The resulting ICCs were categorized according to standard benchmarks, whereby values < 0.5 indicate poor reliability, 0.5–0.75 moderate, 0.75–0.9 good, and >0.9 excellent agreement. Descriptive statistics were used to describe incidence, prevalence, and distribution of CT calcifications in our pediatric population. We used a one-sample binomial test to assess whether, during longitudinal MRI evaluation, the number of CT conversions (from non-calcified to calcified and from non-cystic to cystic) within the sample was significant. We finally adopted the Chi-square test of independence to assesses whether the distribution of the imaging feature differed across different TSC gene groups. Statistical analyses were performed using XLSTAT software, version 2019.2 (Addinsoft, Paris, France).

3. Results

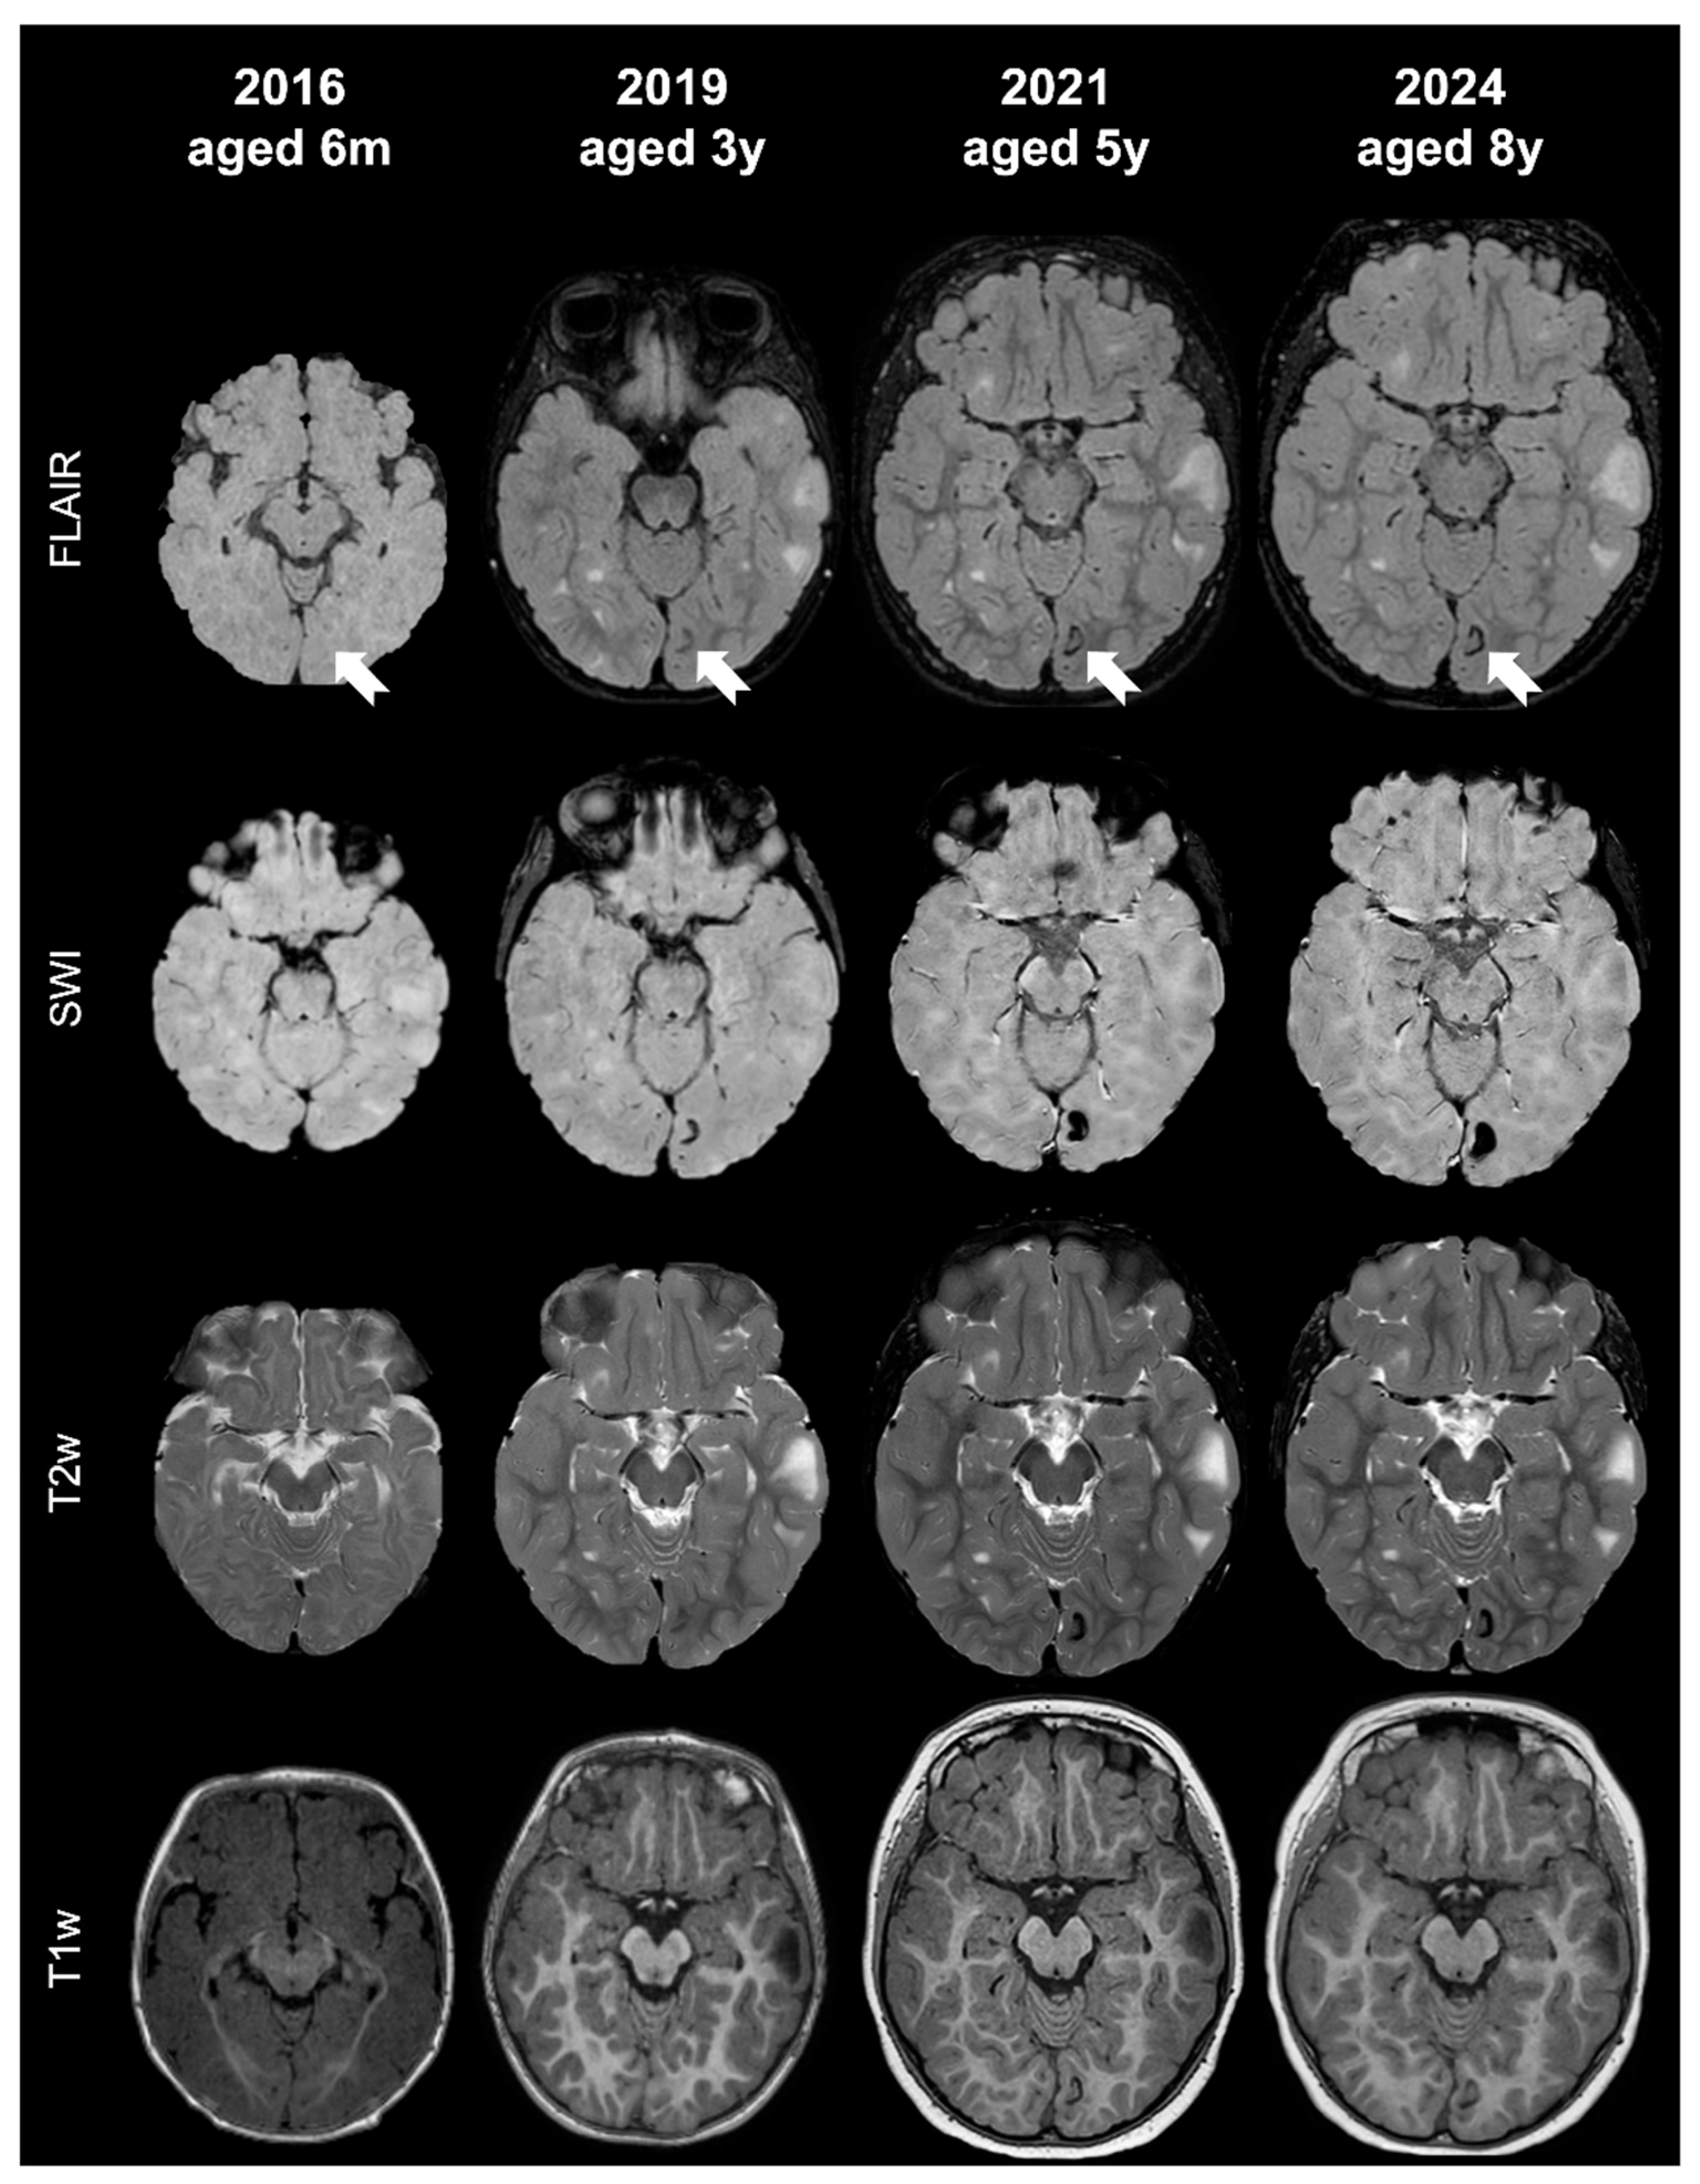
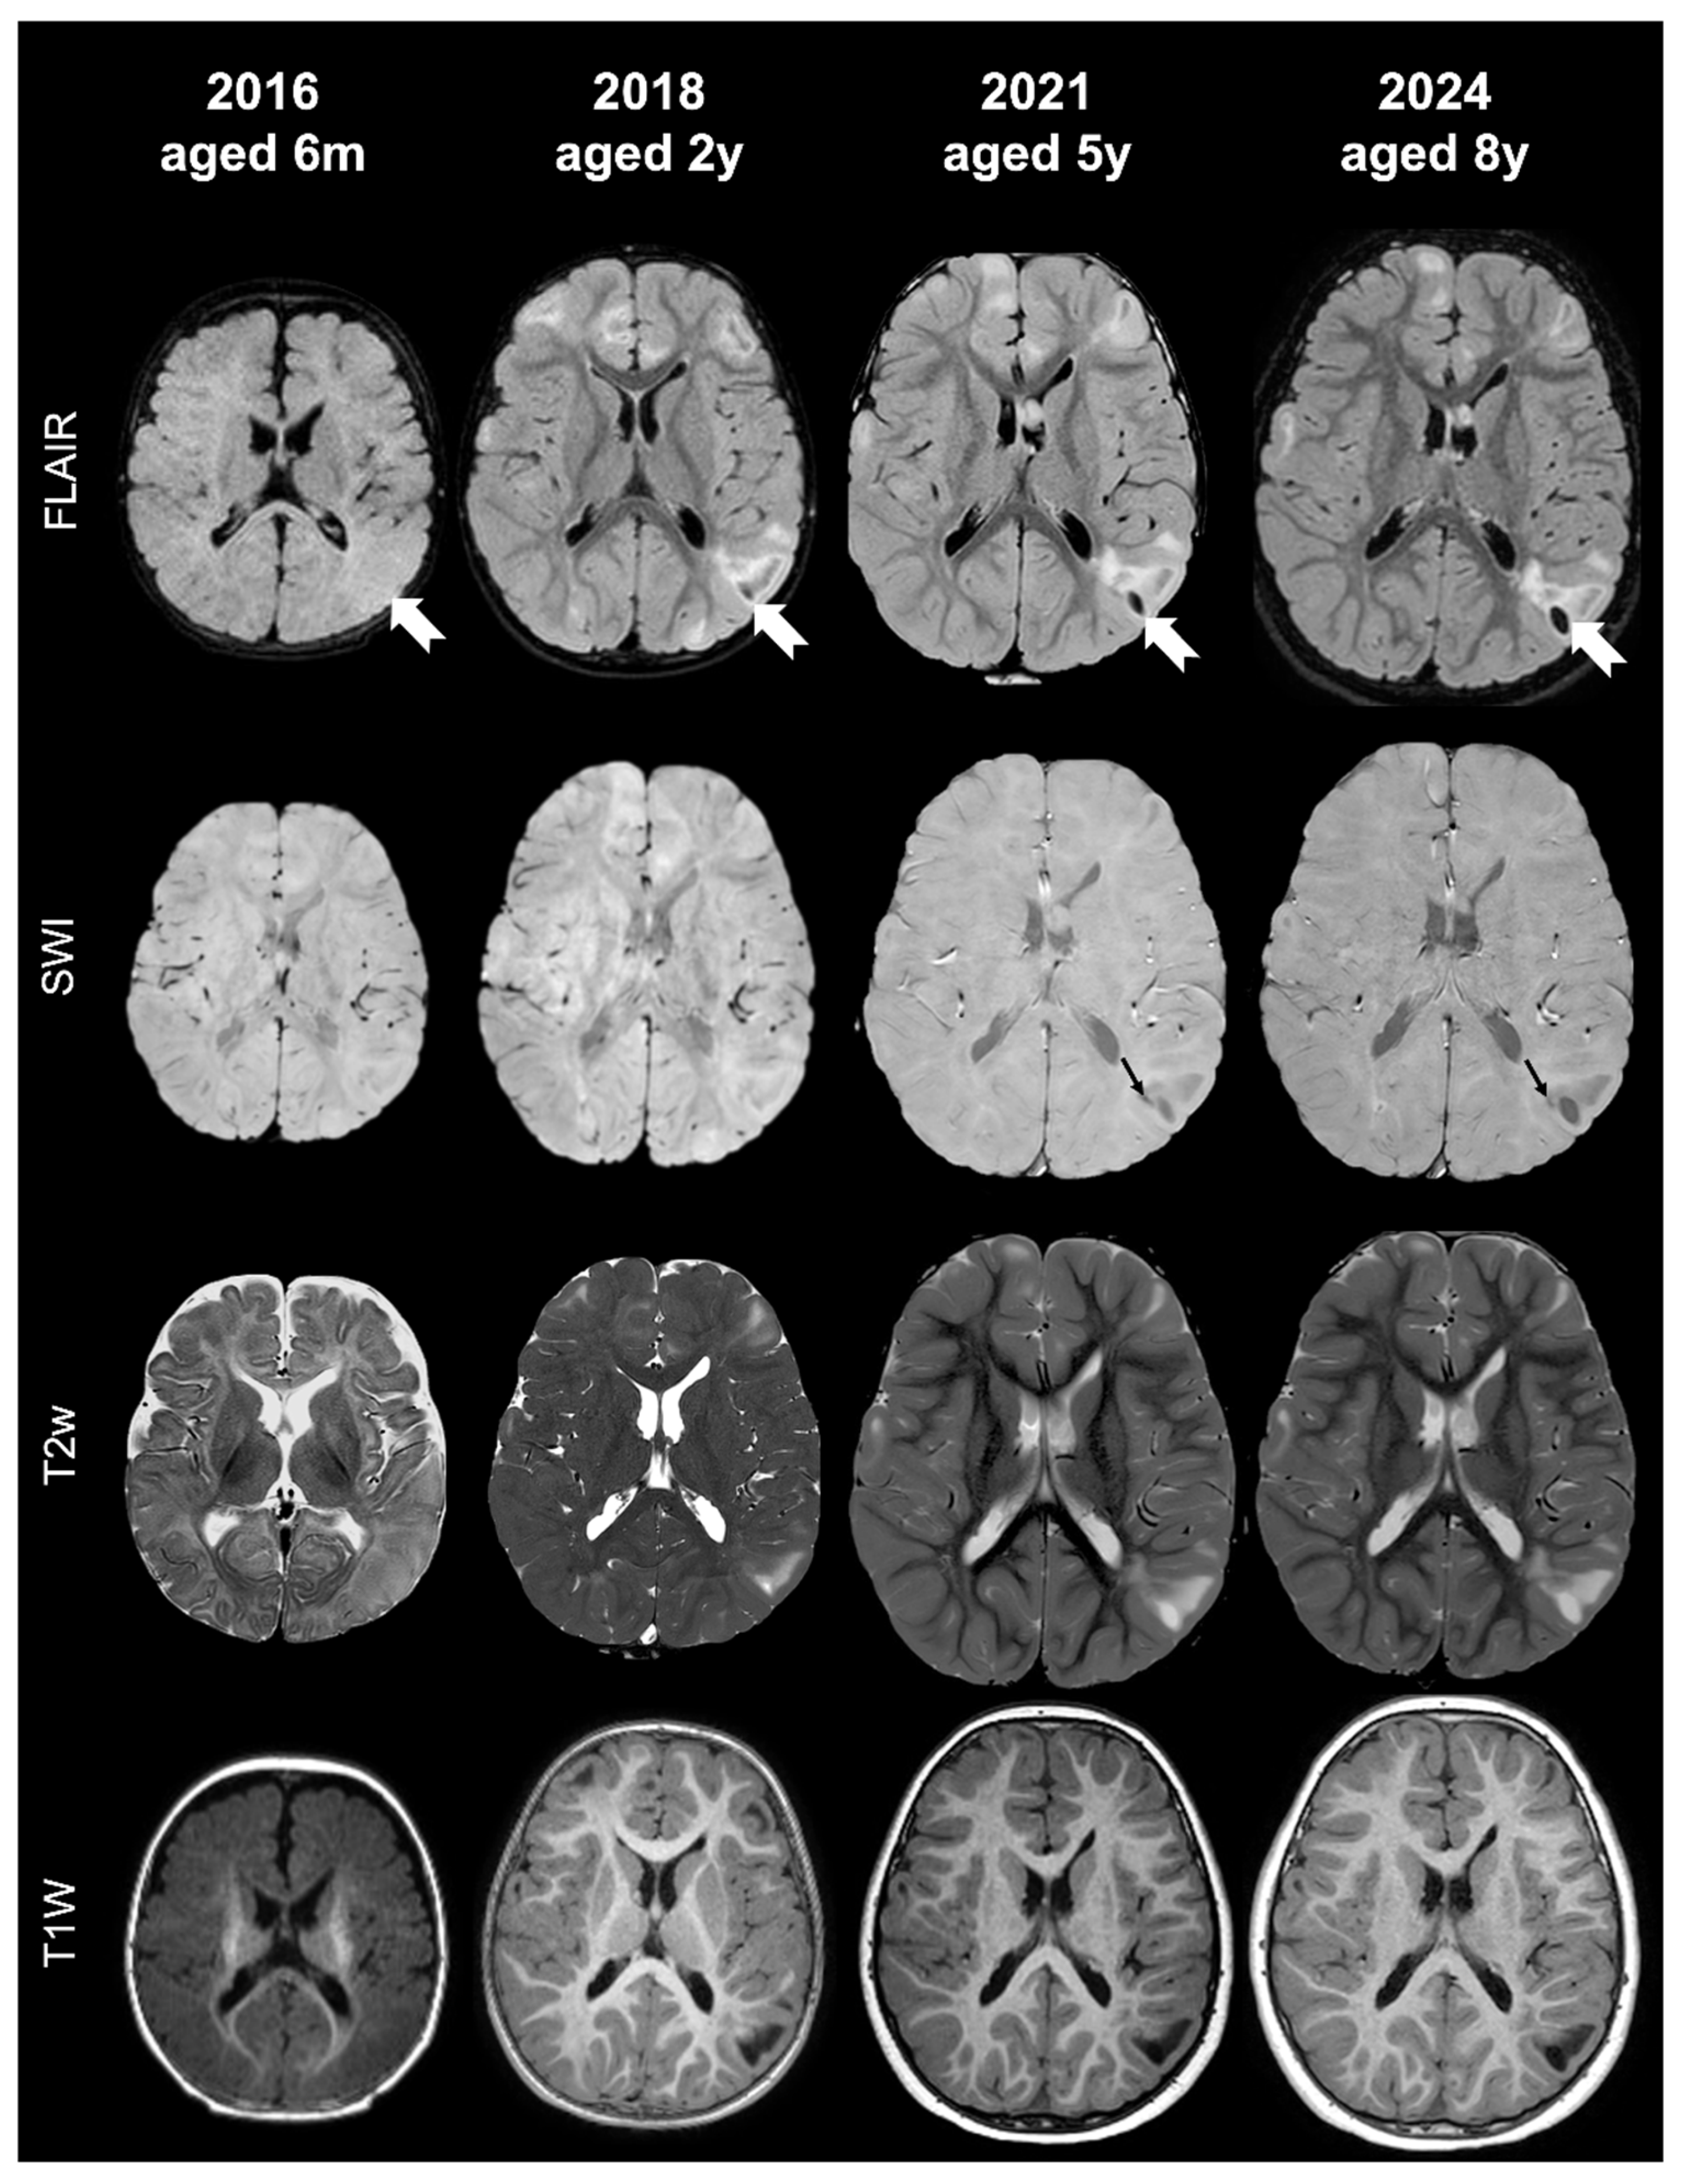
For lesion quantification, the two readers demonstrated excellent agreement, yielding an ICC of 0.91 (95% CI: 0.87–0.95). From a descriptive perspective, in our pediatric cohort, calcified CTs were markedly more common than cystic ones. At diagnosis, 36 of 57 patients (63%) demonstrated calcified tubers (type C), representing approximately 19% of all identified CTs (mean per patient: 3.1 ± 4.9 SD). Most calcifications were micro-calcified type C1 lesions (92%; mean per patient: 2.8 ± 4.8 SD), with macro-calcified type C2 lesions comprising only a small fraction of CTs (8%; mean per patient: 0.2 ± 0.8 SD). At the last MRI follow-up, the prevalence of calcified CTs increased to 44 of 57 patients (77%), accounting for about 24% of the total tuber count (mean per patient: 4.4 ± 6.3 SD). Over time, the proportion of type C1 tubers slightly decreased (87%; mean per patient: 3.9 ± 5.8 SD), whereas type C2 lesions increased modestly (13%; mean per patient: 0.6 ± 1.5 SD). Notably, the emergence of type C2 tubers was entirely attributable to the progression of type B and, particularly, type C1 lesions, while the increase in type C1 tubers derived from the transformation of type A and B tubers present at baseline, with only one newly detected type C1 lesion during follow-up. Cystic CTs (type D) were rare. At diagnosis, only two patients (3%) harbored such lesions, representing 0.3% of all CTs (mean per patient: 0.1 ± 0.3 SD). By the last follow-up, four patients (7%) displayed cystic tubers, still representing just 0.5% of the total count (mean per patient: 0.1 ± 0.4 SD). These lesions arose from type A or B tubers, with only three new cystic tubers identified in two patients—both of whom had a high overall lesion burden; one case exhibited subtle calcification adjacent to the area of cystic transformation. All type D tubers occurred in patients who also had type C lesions. An example of type C tuber progression over time is shown in Figure 2; an example of type D tuber progression over time is shown in Figure 3. Descriptive statistics are summarized in Table 2.
Inferential analyses supported these descriptive trends. A one-sample binomial test demonstrated that the proportion of patients showing variation in CT calcification count between timepoints (29.8%) was significantly greater than the negligible 5% variation assumed under the null hypothesis (p = 0.0000023, one-sided, α = 0.05); in contrast, variation in cyst count between timepoints (3.5%) did not differ significantly from the 5% null rate (p = 0.42072). Furthermore, a Chi-square test of independence found no statistically significant association between the presence of calcifications and the specific TSC gene mutation type (χ2 = 3.2287, p = 0.1990).

4. Discussion

According to the findings described, in this pediatric cohort, calcified CTs were markedly more prevalent than cystic lesions and demonstrated measurable progression over time, with a notable shift from micro- to macro-calcified patterns. Cystic transformation remained rare, occurring only in patients with a higher overall tuber burden and always in association with calcified lesions. Statistical analysis confirmed that variation in calcification count between timepoints was significantly greater than expected by chance, whereas cyst count changes were not. No significant association emerged between calcifications and TSC gene type, suggesting that lesion evolution may be driven more by structural factors than by genotype alone.
To date, emerging evidence indicates that in TSC patients with CNS involvement, intralesional calcifications within CTs are not merely incidental findings but may represent clinically and radiologically significant features, and pathological importance of intra-tuberal calcifications has increasingly gained attention. Historically, CTs’ classification frameworks [27] have largely overlooked calcific elements, focusing instead on dysplastic and cystic features. However, recent reports from the same authorial group described intra-tuberal calcifications in TSC as potentially linked to greater epileptogenicity [22] and documented progressive intra-tuberal calcification over several years in an individual young patient (later confirmed via histopathology as multiple calcified deposits within a surgically resected tuber) correlating with intractable seizures [23]. These observations challenge the assumption that CTs are static lesions and instead support the hypothesis that calcification may represent a dynamic evolving process, with possible implications for seizure severity and disease progression.
Moreover, the under-recognition of calcifications within CTs likely stems from reliance on conventional T1- and T2-weighted imaging, which often fails to sensitively depict susceptibility-related features [26]. Advanced sequences such as SWI and quantitative susceptibility mapping offer much greater sensitivity for detecting even subtle mineralization and alterations in local susceptibility; however, in TSC, few studies have begun to explore SWI or quantitative susceptibility imaging for revealing brain tissue injuries and local susceptibility variations due to demyelination induced by the presence of CTs, especially in the presence of WML and RML [24]. Yet, to our knowledge, no systematic imaging study has been conducted to characterize the presence of susceptibility variations due to intra-tuberal calcifications and their variation over time using consistent longitudinal protocols; in this light, our research, accordingly, constitutes one of the first systematic longitudinal MRI investigations evaluating these findings in CTs of a representative pediatric cohort using standardized imaging techniques.
From a pathophysiological perspective, the genesis of calcification within CTs remains unclear. It is not evident whether epileptic activity induces an inflammatory response that precipitates calcification, or whether calcification arises as a separate degenerative or developmental process that in turn promotes epileptogenicity. Notably, histopathological characterization of resected CTs—examining tubers and peri-tuberal cortex—revealed the frequent presence of firm, pale, and relatively avascular lesions, often containing calcifications in association with neuronal loss, gliosis, myelin loss, and inflammatory markers [30,31]. Whether these calcifications reflect degenerative changes, or a distinct pathway of pathogenesis remains to be elucidated. Moreover, recently it has been noticed that calcified CTs—characterized by inner calcifications coupled to inflammation, gliosis, and significant myelin loss—are notably more common in very young children [30], a finding that appears consistent with our experience. This suggests that early developmental timing of tuber formation may predispose patients to such pathological evolution, and that calcifications may reflect more severe developmental disruption and accelerated dystrophic progression even in the early stages of cerebral development [32].
Given the mounting evidence for the involvement of intra-tuberal calcifications in seizure severity and clinical outcome—especially in young patients—it becomes imperative to incorporate calcifications into the tuber classification scheme as a morphologically and functionally important element. The current system by Gallagher et al. (2010) [27] appears increasingly outdated, failing to account for susceptibility-based features that may impact prognosis and surgical planning. Integrating calcification into tuberal classification harbors the potential to enhance prognostic accuracy and treatment stratification; specifically, we propose augmenting the existing categories by including subtypes that differentiate calcified CTs (both micro- and macro-calcified) from purely dysplastic or cystic forms. The proposed classification is summarized below and outlined in Table 3:
  • Tuber A: isointense on volumetric T1-weighted images and subtly hyperintense on T2-weighted images, with no mass effect, no distortion of the gyral folding pattern, and no calcifications on SWI
  • Tuber B: hypointense on volumetric T1-weighted images and homogeneously hyperintense on T2-weighted images, with no well-defined borders, minimal mass effect, slight disruption of the gyral pattern, and no calcifications on SWI
  • Tuber C: hypointense on volumetric T1-weighted images and homogeneously hyperintense on T2-weighted images with inner calcifications on SWI, further divided into the following:
    • Tuber C1: with subtle, non-confluent, pinpoint-like calcifications on SWI (micro-calcified)
    • Tuber C2: with large, confluent, linear or curvilinear calcifications on SWI (macro-calcified)
  • Tuber D: hypointense on volumetric T1-weighted images and homogeneously hyperintense on T2-weighted images, with a central cystic area of vacuolization, regardless of associated calcification(s).
Our results suggest that calcifications often evolve progressively, with a gradual transition from non-calcified (A–B) to micro-calcified (C1) and, ultimately, to macro-calcified (C2) CTs. It is our opinion that the systematic adoption of SWI in routine pediatric neuroimaging for TSC can markedly improve the detection of fine calcific changes, also unveiling subtle calcific depositions that conventional MRI may miss. As such, including susceptibility imaging in standard MRI protocols for TSC patients, especially those with epilepsy, may yield critical diagnostic and prognostic insights.
This study presents several strengths, including a multi-reader evaluation approach for MRI examinations, which enhances diagnostic reliability and interobserver consistency. The single-center design, while potentially limiting generalizability, ensures homogeneity in imaging protocols and acquisition parameters, thus improving internal validity. Furthermore, the systematic application of an advanced susceptibility-based MRI technique—optimized for detecting magnetic susceptibility differences—enabled superior sensitivity to intraparenchymal calcifications and provided high-resolution spatial detail without resorting to the use of ionizing radiation. The relatively representative sample of pediatric patients with TSC, followed over time, adds further value by offering insights into early disease evolution. However, the study also faces important limitations. Its retrospective design inherently restricts causal inference and introduces potential selection bias. The absence of pathological confirmation and limited clinical correlation—particularly with other hallmark TSC manifestations such as SEN and SEGA—limits the broader interpretability of the findings. Additionally, epilepsy and RSPM characterization was suboptimal, and no dedicated analysis was performed considering the most recent genetic advances.
Finally, a key limitation of the present study is that it was conducted exclusively in a pediatric population, and therefore the findings cannot be directly extrapolated to adult patients with the same condition. The developing brain differs substantially from the mature brain in terms of myelination, cortical organization, and lesion visibility, which may influence both the TSC imaging appearance and the temporal evolution of structural abnormalities. Consequently, caution should be exercised when attempting to generalize these results to older age groups, as disease expression and neuroimaging correlates may follow different trajectories in adulthood. Therefore, looking ahead, continued longitudinal follow-up of this cohort is warranted to elucidate the natural history and progression of CT signal over time. Incorporating calcification patterns into CT classification may help inform future approaches to prognostic assessment and risk stratification in pediatric TSC; in this light, future studies should aim to correlate calcification burden with clinical phenotype and other CNS manifestations of TSC, thereby enhancing the understanding of their clinical significance. In particular, to resolve persistent uncertainties surrounding the progression of CT calcifications, further investigations are needed—ideally involving larger cohorts, extending to adult populations, or following the recruited patients over a longer time span, including adulthood—to provide a broader temporal perspective and validate the current findings.

5. Conclusions

Intralesional calcifications in cortical tubers represent a dynamic and previously underrecognized feature of TSC. Their occurrence likely reflects combined developmental, inflammatory, and seizure-related processes, particularly in early-onset disease. Susceptibility-weighted MRI now enables their sensitive detection and, incorporating these findings into refined classification systems, could offer insights that may prove useful for future prognostic and risk-stratification frameworks in pediatric TSC. This study, among the first longitudinal MRI analyses of calcific changes in tubers, highlights the need for updated morphological criteria and optimized imaging protocols to capture the full spectrum of TSC pathology.

Author Contributions

All authors make substantial contributions to conception and design, and/or acquisition of data, and/or analysis and interpretation of data according to ICMJE recommendations. All those who have made substantive contributions to the article have been named as authors. Conceptualization, C.R. (Camilla Russo) and S.C.; Methodology, C.R. (Camilla Russo) and S.C.; Software, D.C.; Validation, C.R. (Carmela Russo); Formal Analysis, C.R. (Camilla Russo) and S.C.; Investigation and Data Curation, M.F.D.L., S.G. and A.C.; Writing—Original Draft Preparation, C.R. (Camilla Russo) and S.C.; Writing—Review and Editing, G.C., A.V. and E.M.C.; Visualization, A.C., C.R. (Carmela Russo) and D.C.; Supervision, G.C., A.V. and E.M.C.; Project Administration, C.R. (Camilla Russo) and S.C. All authors have read and agreed to the published version of the manuscript.

Funding

This research received no external funding.

Institutional Review Board Statement

All procedures performed in studies involving human participants were in accordance with the ethical standards of the institution and with the 1964 Helsinki declaration and its later amendments or comparable ethical standards. Formal ethical approval was waived for this study, due to its non-experimental retrospective nature, with MRI images already acquired for clinical purposes and anonymized so that there was no possibility of direct or indirect patient identification. No additional information requiring new consent was collected. The study was conducted using exclusively radiographic images already acquired according to the traditional protocols of our institution.

Informed Consent Statement

Informed consent to brain imaging was initially obtained from all individual participants or their legal guardians; informed consent to study inclusion was waived since only retrospective anonymized data was analyzed.

Data Availability Statement

The data presented in this study are available on request from the corresponding author due to privacy and ethical reasons—minor patients.

Conflicts of Interest

The authors declare that there are no conflicts of interest regarding the publication of this paper.

Abbreviations

CNScentral nervous system
CTcortical tuber
ICCintraclass correlation coefficient
MRgLITTmagnetic resonance-guided laser interstitial thermal therapy
MRImagnetic resonance imaging
mTORmechanistic target of rapamycin complex
NMIno mutation identified
RMLradial migration line
SEGAsub-ependymal giant cell astrocytoma
SENsub-ependymal nodule
SWIsusceptibility-weighted imaging
TSCtuberous sclerosis complex
WMLwhite matter lesion

References

  1. Crino, P.B. mTOR Signaling in Epilepsy: Insights from Malformations of Cortical Development. Cold Spring Harb. Perspect. Med. 2015, 5, a022442. [Google Scholar] [CrossRef] [PubMed]
  2. Russo, C.; Nastro, A.; Cicala, D.; De Liso, M.; Covelli, E.M.; Cinalli, G. Neuroimaging in tuberous sclerosis complex. Child’s Nerv. Syst. 2020, 36, 2497–2509. [Google Scholar] [CrossRef] [PubMed]
  3. Umeoka, S.; Koyama, T.; Miki, Y.; Akai, M.; Tsutsui, K.; Togashi, K. Pictorial Review of Tuberous Sclerosis in Various Organs. RadioGraphics 2008, 28, e32. [Google Scholar] [CrossRef] [PubMed]
  4. Northrup, H.; Aronow, M.E.; Bebin, E.M.; Bissler, J.; Darling, T.N.; de Vries, P.J.; Frost, M.D.; Fuchs, Z.; Gosnell, E.S.; Gupta, N.; et al. Updated International Tuberous Sclerosis Complex Diagnostic Criteria and Surveillance and Management Recommendations. Pediatr. Neurol. 2021, 123, 50–66. [Google Scholar] [CrossRef]
  5. Moavero, R.; Kotulska, K.; Lagae, L.; Benvenuto, A.; Gialloreti, L.E.; Weschke, B.; Riney, K.; Feucht, M.; Krsek, P.; Nabbout, R.; et al. Is autism driven by epilepsy in infants with Tuberous Sclerosis Complex? Ann. Clin. Transl. Neurol. 2020, 7, 1371–1381. [Google Scholar] [CrossRef]
  6. Curatolo, P.; Moavero, R.; de Vries, P.J. Neurological and neuropsychiatric aspects of tuberous sclerosis complex. Lancet Neurol. 2015, 14, 733–745. [Google Scholar] [CrossRef]
  7. Cusmai, R.; Moavero, R.; Bombardieri, R.; Vigevano, F.; Curatolo, P. Long-term neurological outcome in children with early-onset epilepsy associated with tuberous sclerosis. Epilepsy Behav. 2011, 22, 735–739. [Google Scholar] [CrossRef]
  8. Curatolo, P.; Napolioni, V.; Moavero, R. Autism Spectrum Disorders in Tuberous Sclerosis: Pathogenetic Pathways and Implications for Treatment. J. Child. Neurol. 2010, 25, 873–880. [Google Scholar] [CrossRef]
  9. Pereira, C.C.d.S.; Dantas, F.D.G.; Baratela, W.A.d.R.; da Costa, F.A.; Lucato, L.T.; Kok, F. Tuberous sclerosis complex: Clinical, genetic and 7T-MRI neuroimaging findings. Brain Dev. 2025, 47, 104386. [Google Scholar] [CrossRef]
  10. Tsai, V.; Parker, W.E.; Orlova, K.A.; Baybis, M.; Chi, A.W.; Berg, B.D.; Birnbaum, J.F.; Estevez, J.; Okochi, K.; Sarnat, H.B.; et al. Fetal Brain mTOR Signaling Activation in Tuberous Sclerosis Complex. Cereb. Cortex 2014, 24, 315–327. [Google Scholar] [CrossRef]
  11. Dabora, S.L.; Jozwiak, S.; Franz, D.N.; Roberts, P.S.; Nieto, A.; Chung, J.; Choy, Y.-S.; Reeve, M.P.; Thiele, E.; Egelhoff, J.C.; et al. Mutational Analysis in a Cohort of 224 Tuberous Sclerosis Patients Indicates Increased Severity of TSC2, Compared with TSC1, Disease in Multiple Organs. Am. J. Hum. Genet. 2001, 68, 64–80. [Google Scholar] [CrossRef]
  12. Nijman, M.; Yang, E.; Jaimes, C.; Prohl, A.K.; Sahin, M.; Krueger, D.A.; Wu, J.Y.; Northrup, H.; Stone, S.S.; Madsen, J.R.; et al. Limited utility of structural MRI to identify the epileptogenic zone in young children with tuberous sclerosis. J. Neuroimaging 2022, 32, 991–1000. [Google Scholar] [CrossRef] [PubMed]
  13. Jeong, A.; Nakagawa, J.A.; Wong, M. Predictors of Drug-Resistant Epilepsy in Tuberous Sclerosis Complex. J. Child. Neurol. 2017, 32, 1092–1098. [Google Scholar] [CrossRef] [PubMed]
  14. Kaczorowska, M.; Jurkiewicz, E.; Domańska-Pakieła, D.; Syczewska, M.; Łojszczyk, B.; Chmielewski, D.; Kotulska, K.; Kuczyński, D.; Kmieć, T.; Dunin-Wąsowicz, D.; et al. Cerebral tuber count and its impact on mental outcome of patients with tuberous sclerosis complex. Epilepsia 2011, 52, 22–27. [Google Scholar] [CrossRef] [PubMed]
  15. Chu-Shore, C.J.; Major, P.; Camposano, S.; Muzykewicz, D.; Thiele, E.A. The natural history of epilepsy in tuberous sclerosis complex. Epilepsia 2010, 51, 1236–1241. [Google Scholar] [CrossRef]
  16. Moavero, R.; Napolitano, A.; Cusmai, R.; Vigevano, F.; Figà-Talamanca, L.; Calbi, G.; Curatolo, P.; Bernardi, B. White matter disruption is associated with persistent seizures in tuberous sclerosis complex. Epilepsy Behav. 2016, 60, 63–67. [Google Scholar] [CrossRef]
  17. Sahin, M.; Henske, E.P.; Manning, B.D.; Ess, K.C.; Bissler, J.J.; Klann, E.; Kwiatkowski, D.J.; Roberds, S.L.; Silva, A.J.; Hillaire-Clarke, C.S.; et al. Advances and Future Directions for Tuberous Sclerosis Complex Research: Recommendations from the 2015 Strategic Planning Conference. Pediatr. Neurol. 2016, 60, 1–12. [Google Scholar] [CrossRef]
  18. Jesmanas, S.; Norvainytė, K.; Gleiznienė, R.; Šimoliūnienė, R.; Endzinienė, M. Different MRI-defined tuber types in tuberous sclerosis complex: Quantitative evaluation and association with disease manifestations. Brain Dev. 2018, 40, 196–204. [Google Scholar] [CrossRef]
  19. Zhang, M.-N.; Zou, L.-P.; Wang, Y.-Y.; Pang, L.-Y.; Ma, S.-F.; Huang, L.-L.; Gao, Y.; Lu, Q.; Franz, D.N. Calcification in cerebral parenchyma affects pharmacoresistant epilepsy in tuberous sclerosis. Seizure 2018, 60, 86–90. [Google Scholar] [CrossRef]
  20. Hulshof, H.M.; Benova, B.; Krsek, P.; Kyncl, M.; Lequin, M.H.; Belohlavkova, A.; Jezdik, P.; Braun, K.P.J.; Jansen, F.E. The epileptogenic zone in children with tuberous sclerosis complex is characterized by prominent features of focal cortical dysplasia. Epilepsia Open 2021, 6, 663–671. [Google Scholar] [CrossRef]
  21. Holmes, G.L.; Stafstrom, C.E. Tuberous Sclerosis Complex and Epilepsy: Recent Developments and Future Challenges. Epilepsia 2007, 48, 617–630. [Google Scholar] [CrossRef]
  22. Gallagher, A.; Kovach, A.; Stemmer-Rachamimov, A.; Rosenberg, A.E.; Eskandar, E.; Thiele, E.A. Metaplastic bone in a cortical tuber of a young patient with tuberous sclerosis complex. Neurology 2011, 76, 1602–1604. [Google Scholar] [CrossRef]
  23. Gallagher, A.; Madan, N.; Stemmer-Rachamimov, A.; Thiele, E.A. Progressive calcified tuber in a young male with tuberous sclerosis complex. Dev. Med. Child. Neurol. 2010, 52, 1062–1065. [Google Scholar] [CrossRef]
  24. Zhang, L.; Ren, Z.; Wei, X. Investigation of quantitative susceptibility mapping (QSM) in diagnosis of tuberous sclerosis complex (TSC) and assessment of associated brain injuries at 1.5 Tesla. J. Clin. Transl. Res. 2020, 5, 102–108. [Google Scholar] [CrossRef] [PubMed]
  25. Xie, H.; Zhuang, H.; Guo, Y.; Sharma, R.D.; Zhang, Q.; Li, J.; Lu, S.; Xu, L.; Chan, Q.; Yoneda, T.; et al. The appearance of magnetic susceptibility objects in SWI phase depends on object size: Comparison with QSM and CT. Clin. Imaging 2022, 82, 67–72. [Google Scholar] [CrossRef] [PubMed]
  26. Tonduti, D.; Pichiecchio, A.; Uggetti, C.; Bova, S.M.; Orcesi, S.; Parazzini, C.; Chiapparini, L. How to look for intracranial calcification in children with neurological disorders: CT, MRI, or both of them? Neurol. Sci. 2022, 43, 2043–2050. [Google Scholar] [CrossRef] [PubMed]
  27. Gallagher, A.; Grant, E.P.; Madan, N.; Jarrett, D.Y.; Lyczkowski, D.A.; Thiele, E.A. MRI findings reveal three different types of tubers in patients with tuberous sclerosis complex. J. Neurol. 2010, 257, 1373–1381. [Google Scholar] [CrossRef]
  28. Northrup, H.; Krueger, D.A.; Roberds, S.; Smith, K.; Sampson, J.; Korf, B.; Kwiatkowski, D.J.; Mowat, D.; Nellist, M.; Povey, S.; et al. Tuberous Sclerosis Complex Diagnostic Criteria Update: Recommendations of the 2012 International Tuberous Sclerosis Complex Consensus Conference. Pediatr. Neurol. 2013, 49, 243–254. [Google Scholar] [CrossRef]
  29. Russo, C.; Coluccino, S.; De Leva, M.F.; Graziano, S.; Russo, C.; Mazio, F.; De Liso, M.; Cicala, D.; Nastro, A.; Palladino, F.; et al. Cortical Tubers’ Transformation in Pediatric Patients Diagnosed with Tuberous Sclerosis Complex: A Retrospective Longitudinal MRI Analysis. J. Clin. Med. 2025, 14, 7665. [Google Scholar] [CrossRef]
  30. Mühlebner, A.; Van Scheppingen, J.; Hulshof, H.M.; Scholl, T.; Iyer, A.M.; Anink, J.J.; Ouweland, A.M.W.V.D.; Nellist, M.D.; Jansen, F.E.; Spliet, W.G.M.; et al. Novel Histopathological Patterns in Cortical Tubers of Epilepsy Surgery Patients with Tuberous Sclerosis Complex. PLoS ONE 2016, 11, e0157396. [Google Scholar] [CrossRef]
  31. Ruppe, V.; Dilsiz, P.; Reiss, C.S.; Carlson, C.; Devinsky, O.; Zagzag, D.; Weiner, H.L.; Talos, D.M. Developmental brain abnormalities in tuberous sclerosis complex: A comparative tissue analysis of cortical tubers and perituberal cortex. Epilepsia 2014, 55, 539–550. [Google Scholar] [CrossRef]
  32. Crino, P.B. Molecular Pathogenesis of Tuber Formation in Tuberous Sclerosis Complex. J. Child. Neurol. 2004, 19, 716–725. [Google Scholar] [CrossRef]
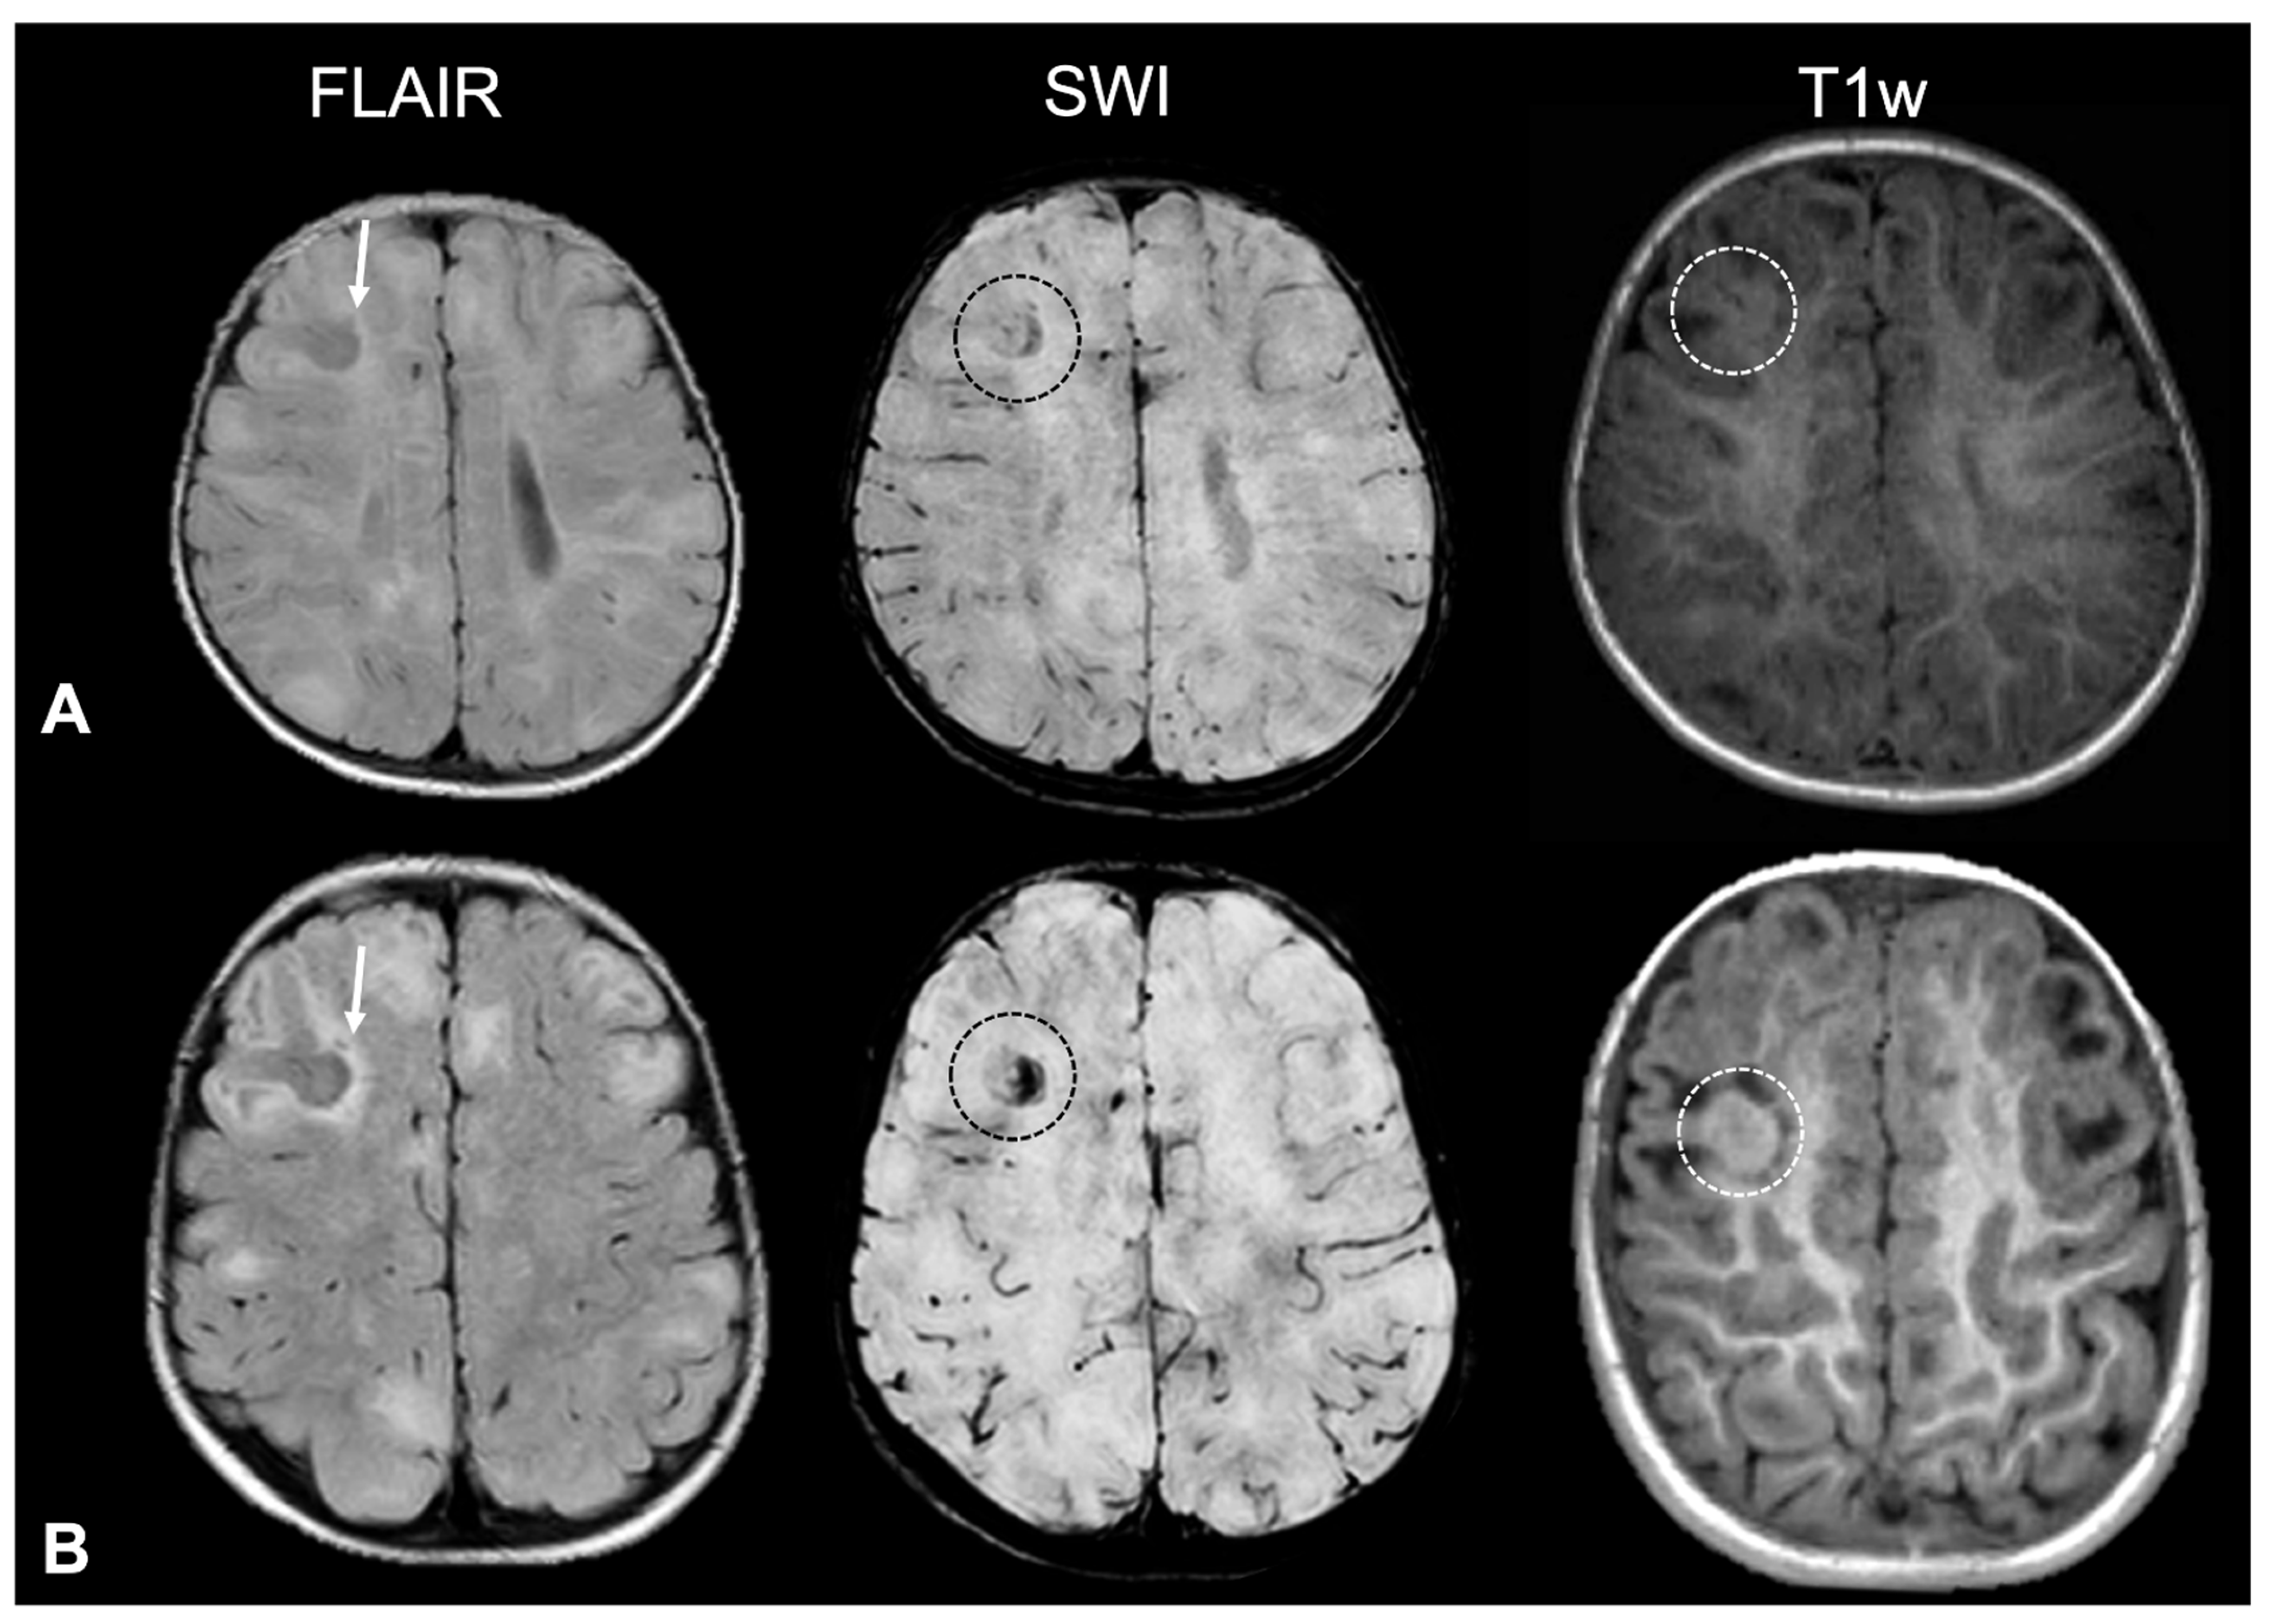
Figure 1. MRI findings of type C tuber in the same female TSC2 patient at two different timepoints (8 and 28 months old, respectively). (A) FLAIR, SWI, and T1w images showing a large right frontal cortical tuber with cortical thickening and blurring (white arrow); micro-calcified components (black dashed line) were also visible, corresponding to mixed area of hypo- and hyperintensity on T1w sequence (white dashed line). (B) At follow-up MRI, micro-calcifications progressed to a larger area of manifest low signal intensity due to macro-calcific components on SWI (black dashed line).
Applsci 15 12486 g001
Figure 2. Example of type C tuber MRI signal progression over time. Left occipital cortical tuber (white arrows) at four different timepoints (6 months, 3 years, 5 years, and 8 years, respectively) of a male TSC1 patient, progressing from non-calcified (type A, first column) to micro-calcified (type C1, second column) and then macro-calcified (type C2, third and fourth columns).
Applsci 15 12486 g002
Figure 3. Example of type D tuber MRI signal progression over time. Right parietal cortical tuber at four different timepoints (6 months, 2 years, 5 years, and 8 years, respectively) of the same male TSC1 patient as in Figure 2, which shows the appearance at the second timepoint of a small central cystic component (white arrows), clearly visible on T2w images, that increases in size over time; from the third and fourth timepoints, the cyst is associated with a faintly micro-calcified satellite component visible on SWI (black arrows).
Applsci 15 12486 g003
Table 1. Summary of relevant demographical data of included patients.
N%MEANSD
Age (years)First MRI--4.94.8
Last MRI--8.95.3
GenderOverall57100%--
Male2442%--
Female3358%--
MutationTSC11221%--
TSC22544%--
NMI2035%--
Time between first and last MRI (years)--4.02.7
Number of MRI examinations between first and last MRI--2.63.5
Legend: N = number; SD = standard deviation; MRI = magnetic resonance imaging; TSC = tuberous sclerosis complex; NMI = no mutation identified.
Table 2. Summary of the evolution of calcified (Type C) and cystic (Type D) cortical tubers (CTs) from diagnosis to last magnetic resonance imaging (MRI) follow-up.
Lesion TypeTimepointN (%)Proportion of Total CTs (%)Mean Number ± SD
Calcified CTs (Type C, total)At diagnosis36/57 (63%)19%3.1 ± 4.9
Last follow-up44/57 (77%)24%4.4 ± 6.3
Type C1
(micro-calcified)
At diagnosis92% of Type C2.8 ± 4.8
Last follow-up87% of Type C3.9 ± 5.8
Type C2
(macro-calcified)
At diagnosis8% of Type C0.2 ± 0.8
Last follow-up13% of Type C0.6 ± 1.5
Cystic CTs
(Type D)
At diagnosis2/57 (3%)0.3%0.1 ± 0.3
Last follow-up4/57 (7%)0.5%0.1 ± 0.4
Table 3. Proposed new MRI-based classification system for TSC-related CTs, incorporating changes in SWI.
Tuber TypeSignal on T1w SequencesSignal on T2w SequencesCalcification(s) on SWICystic Component(s)
Aisointensehyperintenseabsentabsent
Bhypointensehyperintenseabsentabsent
C1hypo/hyperintensehyperintensemicro-calcifiedabsent
C2hypo/hyperintensehyperintensemacro-calcifiedabsent
Dhypointensehyperintenseabsent/presentpresent
Legend: MRI = magnetic resonance imaging; TSC = tuberous sclerosis complex; CT(s) = cortical tuber(s); SWI = susceptibility-weighted imaging.
Disclaimer/Publisher’s Note: The statements, opinions and data contained in all publications are solely those of the individual author(s) and contributor(s) and not of MDPI and/or the editor(s). MDPI and/or the editor(s) disclaim responsibility for any injury to people or property resulting from any ideas, methods, instructions or products referred to in the content.