Article

An Ambiguity in Child Body Surface Area Measurement

by
Leszek Sławomir Litzbarski
1,
Grzegorz Redlarski
2,
Piotr Mateusz Tojza
2,
Zuzanna Cieślikowska
2 and
Mieszko Czapliński
3,4,*
1
Faculty of Applied Physics and Mathematics, Gdansk University of Technology, Narutowicza 11/12, 80-233 Gdansk, Poland
2
Faculty of Electrical and Control Engineering, Gdansk University of Technology, Narutowicza 11/12, 80-233 Gdansk, Poland
3
Faculty of Health Sciences, Medical University of Gdańsk, M. Skłodowskiej-Curie Street 3a, 80-210 Gdansk, Poland
4
University Clinical Centre in Gdansk, Medical University of Gdansk, Dębinki 7, 80-952 Gdansk, Poland
*
Author to whom correspondence should be addressed.
Appl. Sci. 2025, 15(23), 12454; https://doi.org/10.3390/app152312454
Submission received: 22 September 2025 / Revised: 8 November 2025 / Accepted: 19 November 2025 / Published: 24 November 2025

Featured Application

Body Surface Area is an important parameter in medicine, with numerous potential uses. While our work does not reveal any new applications of this parameter, or a new formula to calculate it, it sums up all existing formulae for determining BSA, compares them, shows the risks that are a result of applying the formulae and encourages further discussions and explorations of the topic, some of them already in the process of preparing for publication.

Abstract

Body Surface Area (BSA) and Total Body Surface Area (TBSA) are important indicators used in different domains of medicine, playing a crucial role in oncology, toxicology, and even transplantology or cardiology. Their main (although not sole) use in medicine is to dose medications according to the patient’s BSA/TBSA. Other fields where BSA is commonly employed include the treatment of burns—the fluid doses are according to Parkland’s rule, which is based on BSA estimation. Thus, a proper estimation of BSA value directly influences the patient’s chances of survival—one can easily imagine the consequences of not administering enough fluids in the critical phase of a burned patient’s management. In medical practice, even small deviations in the estimated BSA value may have a significant impact on the patient’s treatment process and, in extreme cases, lead to their death. This problem is particularly important in the treatment of children and adolescents. The aim of our article is to present the most popular formulae used to estimate the BSA value for children in the case of minors and to discuss discrepancies between them. In the case of a 4-week-old neonate, the smallest difference in maximum BSA calculation discrepancies amounts up to 0.22 m2, which corresponds to roughly 80% of the typical BSA value for this age group, while for 12-year-old patients this parameter is 0.15 m2, equalling about 11% of the standard BSA value for this age category. The maximum deviation between the patterns reaches 0.28 m2 for 4-week-olds and over 0.75 m2 for 12-year-old children. These notable discrepancies in BSA calculations highlight the necessity for more precise and dependable methods, particularly when dealing with paediatric patients.

1. Introduction

The therapeutic success of nearly all medical treatments depends on accurate drug dosing. In clinical practice, dosing is often based on measurable patient parameters such as body weight or body mass index (BMI). However, these indices are strongly influenced by physiological and pathological factors, including age, hydration status, and body composition, which may lead to inappropriate dose adjustments and compromised therapeutic outcomes [1,2]. For this reason, body surface area (BSA) has become a widely used parameter in medical diagnostics and therapy optimization, offering a more physiologically relevant measure of metabolic mass than body weight alone [3]. BSA is currently applied in numerous clinical areas, including the dosing of chemotherapeutic and antiviral drugs, assessment of renal and cardiac function, and calculation of burn surface area. However, despite its widespread use, there is still no universally accepted method for BSA estimation. Over the past century, dozens of empirical formulas have been proposed—beginning with Meeh’s weight-based equation in 1879 and followed by the height–weight model of Du Bois and Du Bois in 1916 [4]. Subsequent research introduced further refinements and population-specific adaptations, resulting in a large number of formulas that differ in structure, underlying datasets, and regression assumptions. As a result, the same anthropometric data can yield markedly different BSA values depending on the formula used, which may translate into clinically meaningful variations in drug dosing and other diagnostic or therapeutic decisions [5]. Errors in calculating BSA values can result in substantial dose errors that affect the quality of the patient’s treatment [6,7,8,9].
The recent literature continues to address these concerns. Flint, Bronson, Joe M. Das, and Carrie A. Hall (2025) [10] provided an extensive overview of body surface area estimation and its clinical applications, underscoring the persistent uncertainty surrounding formula selection. El Edelbi et al. (2021) [11] evaluated multiple regression-based equations for neonates and children, revealing substantial variability among paediatric formulas. Alvear-Vasquez et al. (2023) [12] further demonstrated that BSA correlates with developmental status, emphasizing the physiological importance of accurate estimation. Likewise, Piecuch et al. (2024) [13] compared 25 distinct BSA equations and confirmed that the discrepancies among methods remain significant, even in contemporary practice. Together, these studies underline the ongoing need for rigorous evaluation and potential standardization of BSA assessment methods. Children represent a particularly vulnerable group in this context. Paediatric patients exhibit dynamic changes in body proportions and composition, making adult-derived formulas unreliable when applied to younger populations. The lack of paediatric-specific validation and the diversity of available equations can therefore lead to significant dosing errors, posing potential risks in pharmacotherapy and clinical decision-making.
The aim of the present study is not to introduce a new BSA formula, but to systematically compare existing ones, demonstrate the magnitude of discrepancies among them, and highlight the potential medical consequences of these inconsistencies in paediatric populations. By drawing attention to these issues, we seek to raise awareness of the urgent need for the development of new, validated formulas capable of providing more accurate and consistent BSA estimations in children.

2. Current State of Knowledge

Interest in accurately estimating human Body Surface Area (BSA) dates back to the late 19th century. The earliest attempts, such as Meeh’s 1879 equation [14], relied solely on body weight, reflecting the limited anthropometric data available at the time. A major methodological breakthrough occurred in 1916 when Du Bois and Du Bois introduced their now-classic height–weight model [4]. Using physical measurements of bandaged subjects, they derived empirical coefficients through regression analysis, thereby creating one of the first formulae linking body size to physiological function. Since then, numerous researchers have sought to refine these approaches, leading to a proliferation of BSA equations differing in structure, underlying data, and target populations. Some studies focused on refining constants within the classical equations, while others developed new models incorporating additional anthropometric variables, such as age, body composition, or ethnic background [15,16,17,18]. The Boyd (1935) model [18] and later formulae by Fujimoto et al. (1968) [15] and Haycock et al. (1978) [19] exemplify this evolution toward population-specific adjustments and nonlinear relationships between height and weight. Mathematically, four primary structural types of BSA equations can be distinguished:
BSA = a 0 · H a 1 · W a 2
BSA = a 0 · W a 1 a 2 · W
BSA = a 0 · W + a 1 W + a 2
BSA = a 0 · W + a 1
where H means height, W is body weight, and a0, a1 and a2 are estimated parameters (generally long series of numbers). Despite their apparent simplicity, these formulas yield substantially different results because their coefficients were derived from small, often non-representative samples measured with varying techniques and instrumentation. The original Du Bois formula, for example, was developed from measurements of only nine subjects—eight adults and one child—limiting its applicability to diverse paediatric populations. Later formulae, though more data-driven, often used region- or age-specific datasets (e.g., Japanese infants, Indian children, or Western adults), which introduces systematic bias when applied outside those populations. This methodological diversity explains the discrepancies noted in clinical BSA estimation. Each formula is grounded in slightly different assumptions about human morphology and scaling laws. Variations in the exponents applied to height and weight reflect differing hypotheses about how surface area scales with mass and linear dimensions. Consequently, when formulas derived from one demographic or body-type distribution are applied to another—particularly to children, whose proportions change rapidly with growth—BSA estimates may diverge considerably. These differences, though numerically modest, can lead to clinically meaningful dosing errors in pharmacotherapy or fluid resuscitation.
A summary of the most widely used paediatric BSA equations is presented in Table 1, which lists representative formulas from Meeh (1879) [14] to Nwoye and Al-Shehri (2005) [20]. All rely on easily measurable anthropometric parameters such as H and W, ensuring practical usability in clinical settings. However, because they simplify complex three-dimensional body geometry into two-variable models, their results inherently depend on the chosen functional form and constants.
Understanding this diversity is essential for interpreting the results presented later in this paper. As highlighted by reviewers, insufficient methodological clarity regarding data sources, formula selection, and computational procedures can obscure the reproducibility of comparative studies. This section therefore establishes the conceptual foundation for our subsequent analysis: it demonstrates why different BSA formulas yield divergent estimates and clarifies the historical and mathematical reasons behind these inconsistencies. By situating our work within this historical and theoretical framework, we emphasize that discrepancies among BSA formulas are not random, but rather systematic consequences of differing empirical assumptions. Recognizing these origins is a necessary step toward the development of standardized, validated approaches for paediatric BSA estimation.

3. Methods and Applied Software

This study was designed as an in silico comparative analysis of the most frequently used formulas for estimating body surface area (BSA) in children. The aim was not to propose a new equation, but to demonstrate the extent of discrepancies between existing formulas and to emphasize their potential clinical implications, particularly in drug dosing.
Height and weight values were obtained from internationally recognized paediatric growth standards, including the World Health Organization (WHO) and Centers for Disease Control and Prevention (CDC) percentile charts, covering children aged 1–18 years [27]. For each age group, data from several percentile levels (3rd, 10th, 25th, 50th, 75th, 90th, and 97th) were used to reflect the variability typical of real paediatric populations. This standardized approach allowed us to compare formulas objectively, without the influence of empirical sampling biases. Twelve classical and contemporary BSA formulas were selected based on their widespread use in clinical practice and representation of different mathematical types, including weight-based power models [14], height–weight power models [4,19], logarithmic models [18], and linear regression approaches [15,24]. These equations were applied to identical anthropometric datasets, and the resulting BSA values were compared to evaluate the extent of formula-dependent variability.
All calculations were executed on a computer equipped with an Intel Core i7-3770 CPU (Santa Clara, CA, USA); the analysis was conducted using OriginPro 2020 software, which was also used to generate the figures. The Children BSA Calculator was designed employing Borland C++ Builder 6 software [6]. In our analysis, we did not apply formal statistical hypothesis testing to compare the results of different BSA formulas. This decision was intentional, as the discrepancies observed are not the result of random variation but stem directly from the inherent mathematical structures and assumptions of each formula. Therefore, hypothesis testing would not provide additional insight into the source of these differences. Instead, we employed descriptive statistical measures to illustrate and quantify the extent of variability across formulas. The standard deviation (σ) was calculated as
σ = 1 n   i = 1 n x i   x _ 2
where x is the BSA value for the i-th formula, and x _ is the mean BSA value. The relative standard deviation (RSD), expressed as a percentage, was calculated as
RSD   ( % ) = σ x _ × 100
The maximum discrepancy parameter (DSPmax), reflecting the largest observed difference between formulas, was calculated as
D S P m a x = m a x ( x i ) m i n ( x i )
These parameters allow for a meaningful description of the magnitude of discrepancies and their clinical implications, without relying on formal hypothesis testing. We believe this approach is more appropriate for the aims of this study, which are to emphasize the existence of clinically relevant divergences between formulas and to highlight the necessity of developing new, more reliable BSA equations.

4. Results

Figure 1 shows the result of the BSA calculations for a twelve-year-old child, employing the formulas from Table 1, which takes into account only height (Meeh, Rubner & Heubner, Boyd, Costeff, Vaughan & Litt, Current). These graphs show how the value of the BSA parameter changes depending on the body weight and height of a patient with a height ranging from 140 to 170 cm and a weight ranging from 30 to 70 kg (a typical range of parameters for this age group determined on the basis of centile growth chart). Whether introducing mass as an additional parameter to the BSA formulae improves their precision is shown in Figure 2.
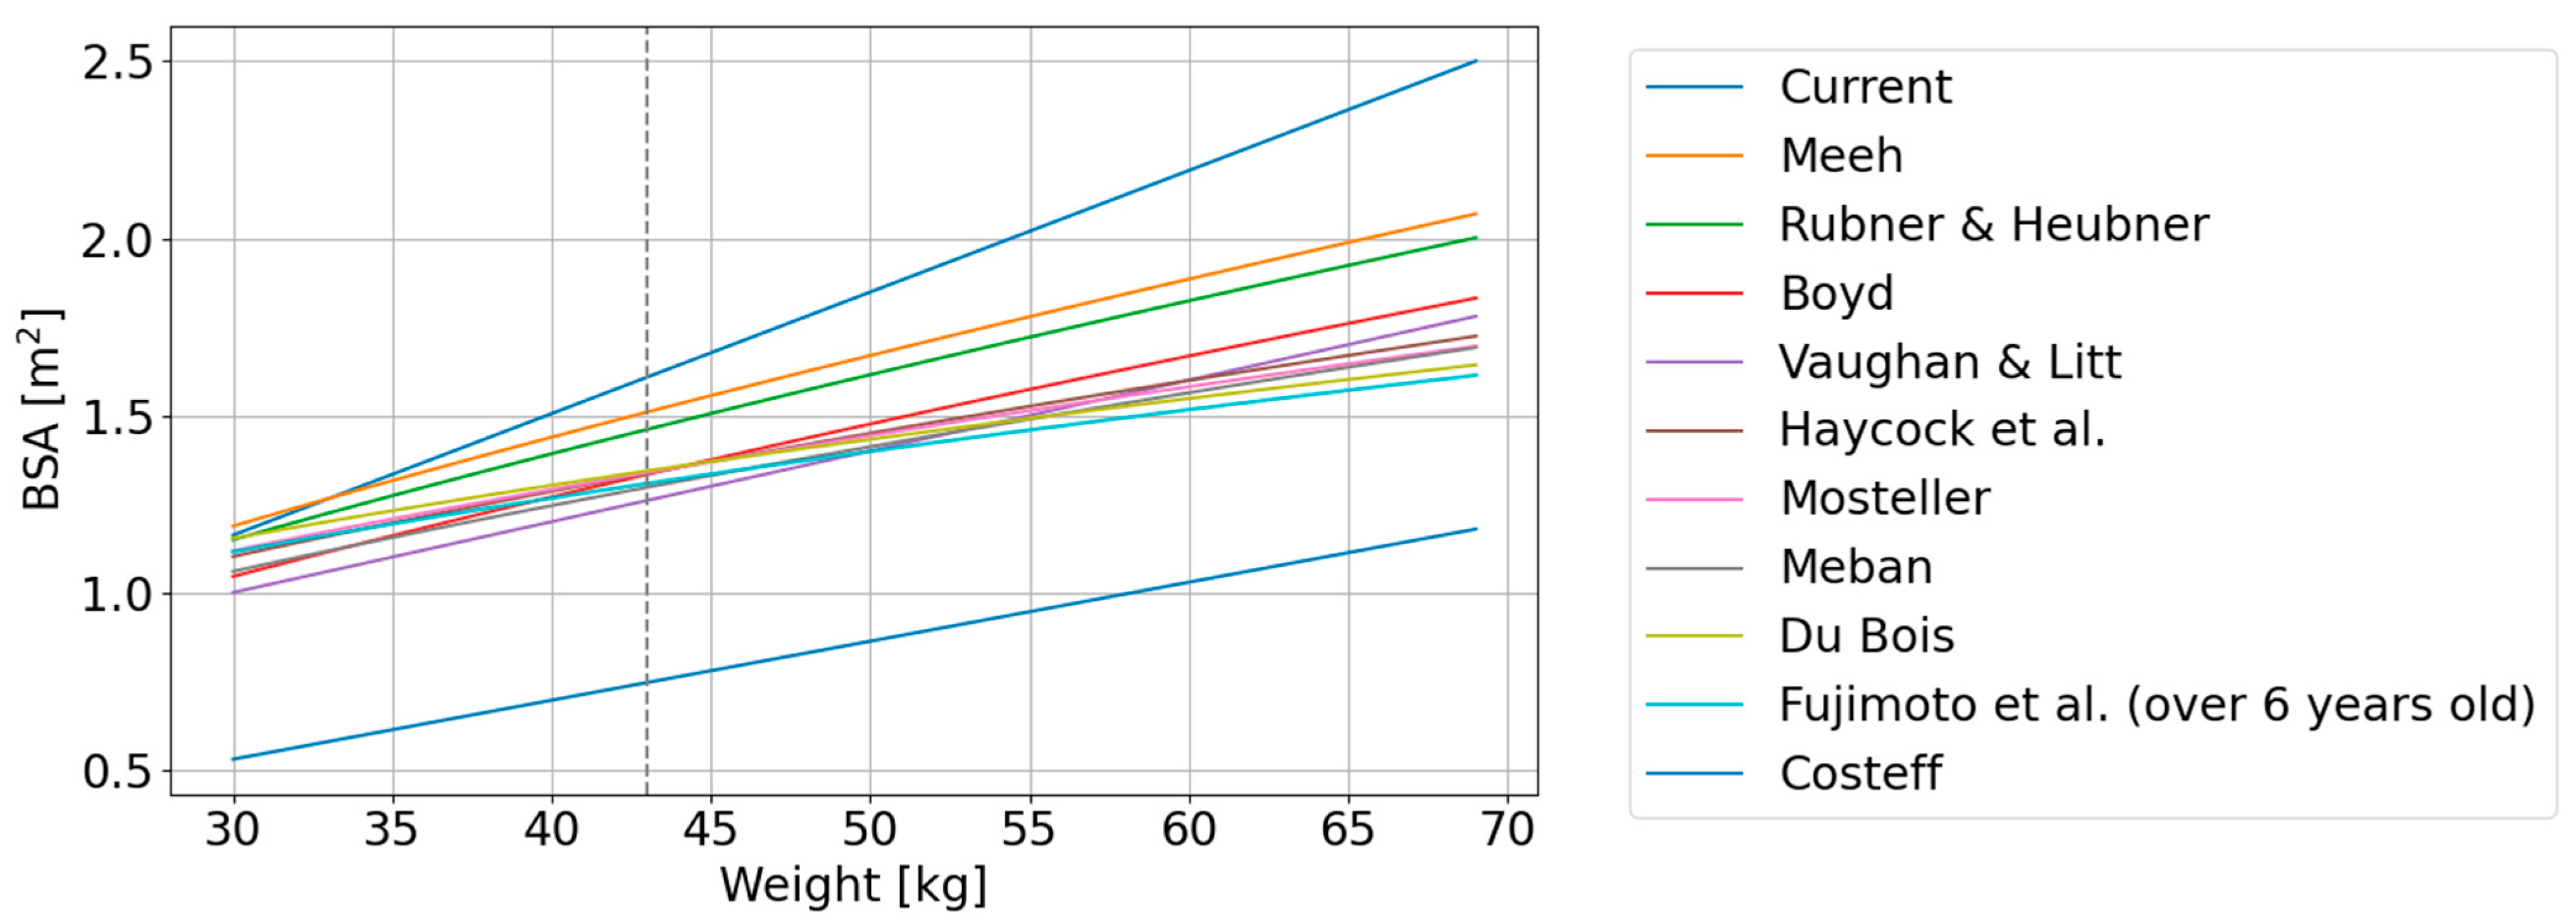
The expanded discussion of our 12-year-old patient serves to show in a concrete, particular example (and from a statistical point of view) the discrepancies caused by a choice of two totally different methods of BSA determination in a certain age group and the practical consequences this has for therapy. It is not possible to generalise this information, because the analysis of the curves in Figure 3 clearly shows that, for example, some methods will be cut off for a 12-year-old with 150 cm height and 30 kg weight (Rubner & Heubner vs. Vaughan & Litt), other ones for a 12-year-old with 150 cm height and 40 kg weight (Current vs. Vaughan & Litt), and yet other ones for the same child, but with 60 kg weight (Current vs. Banerjee & Bhattacharya). A similar situation will occur with a wide spectrum of parameters, including the age, height and body mass of the child.
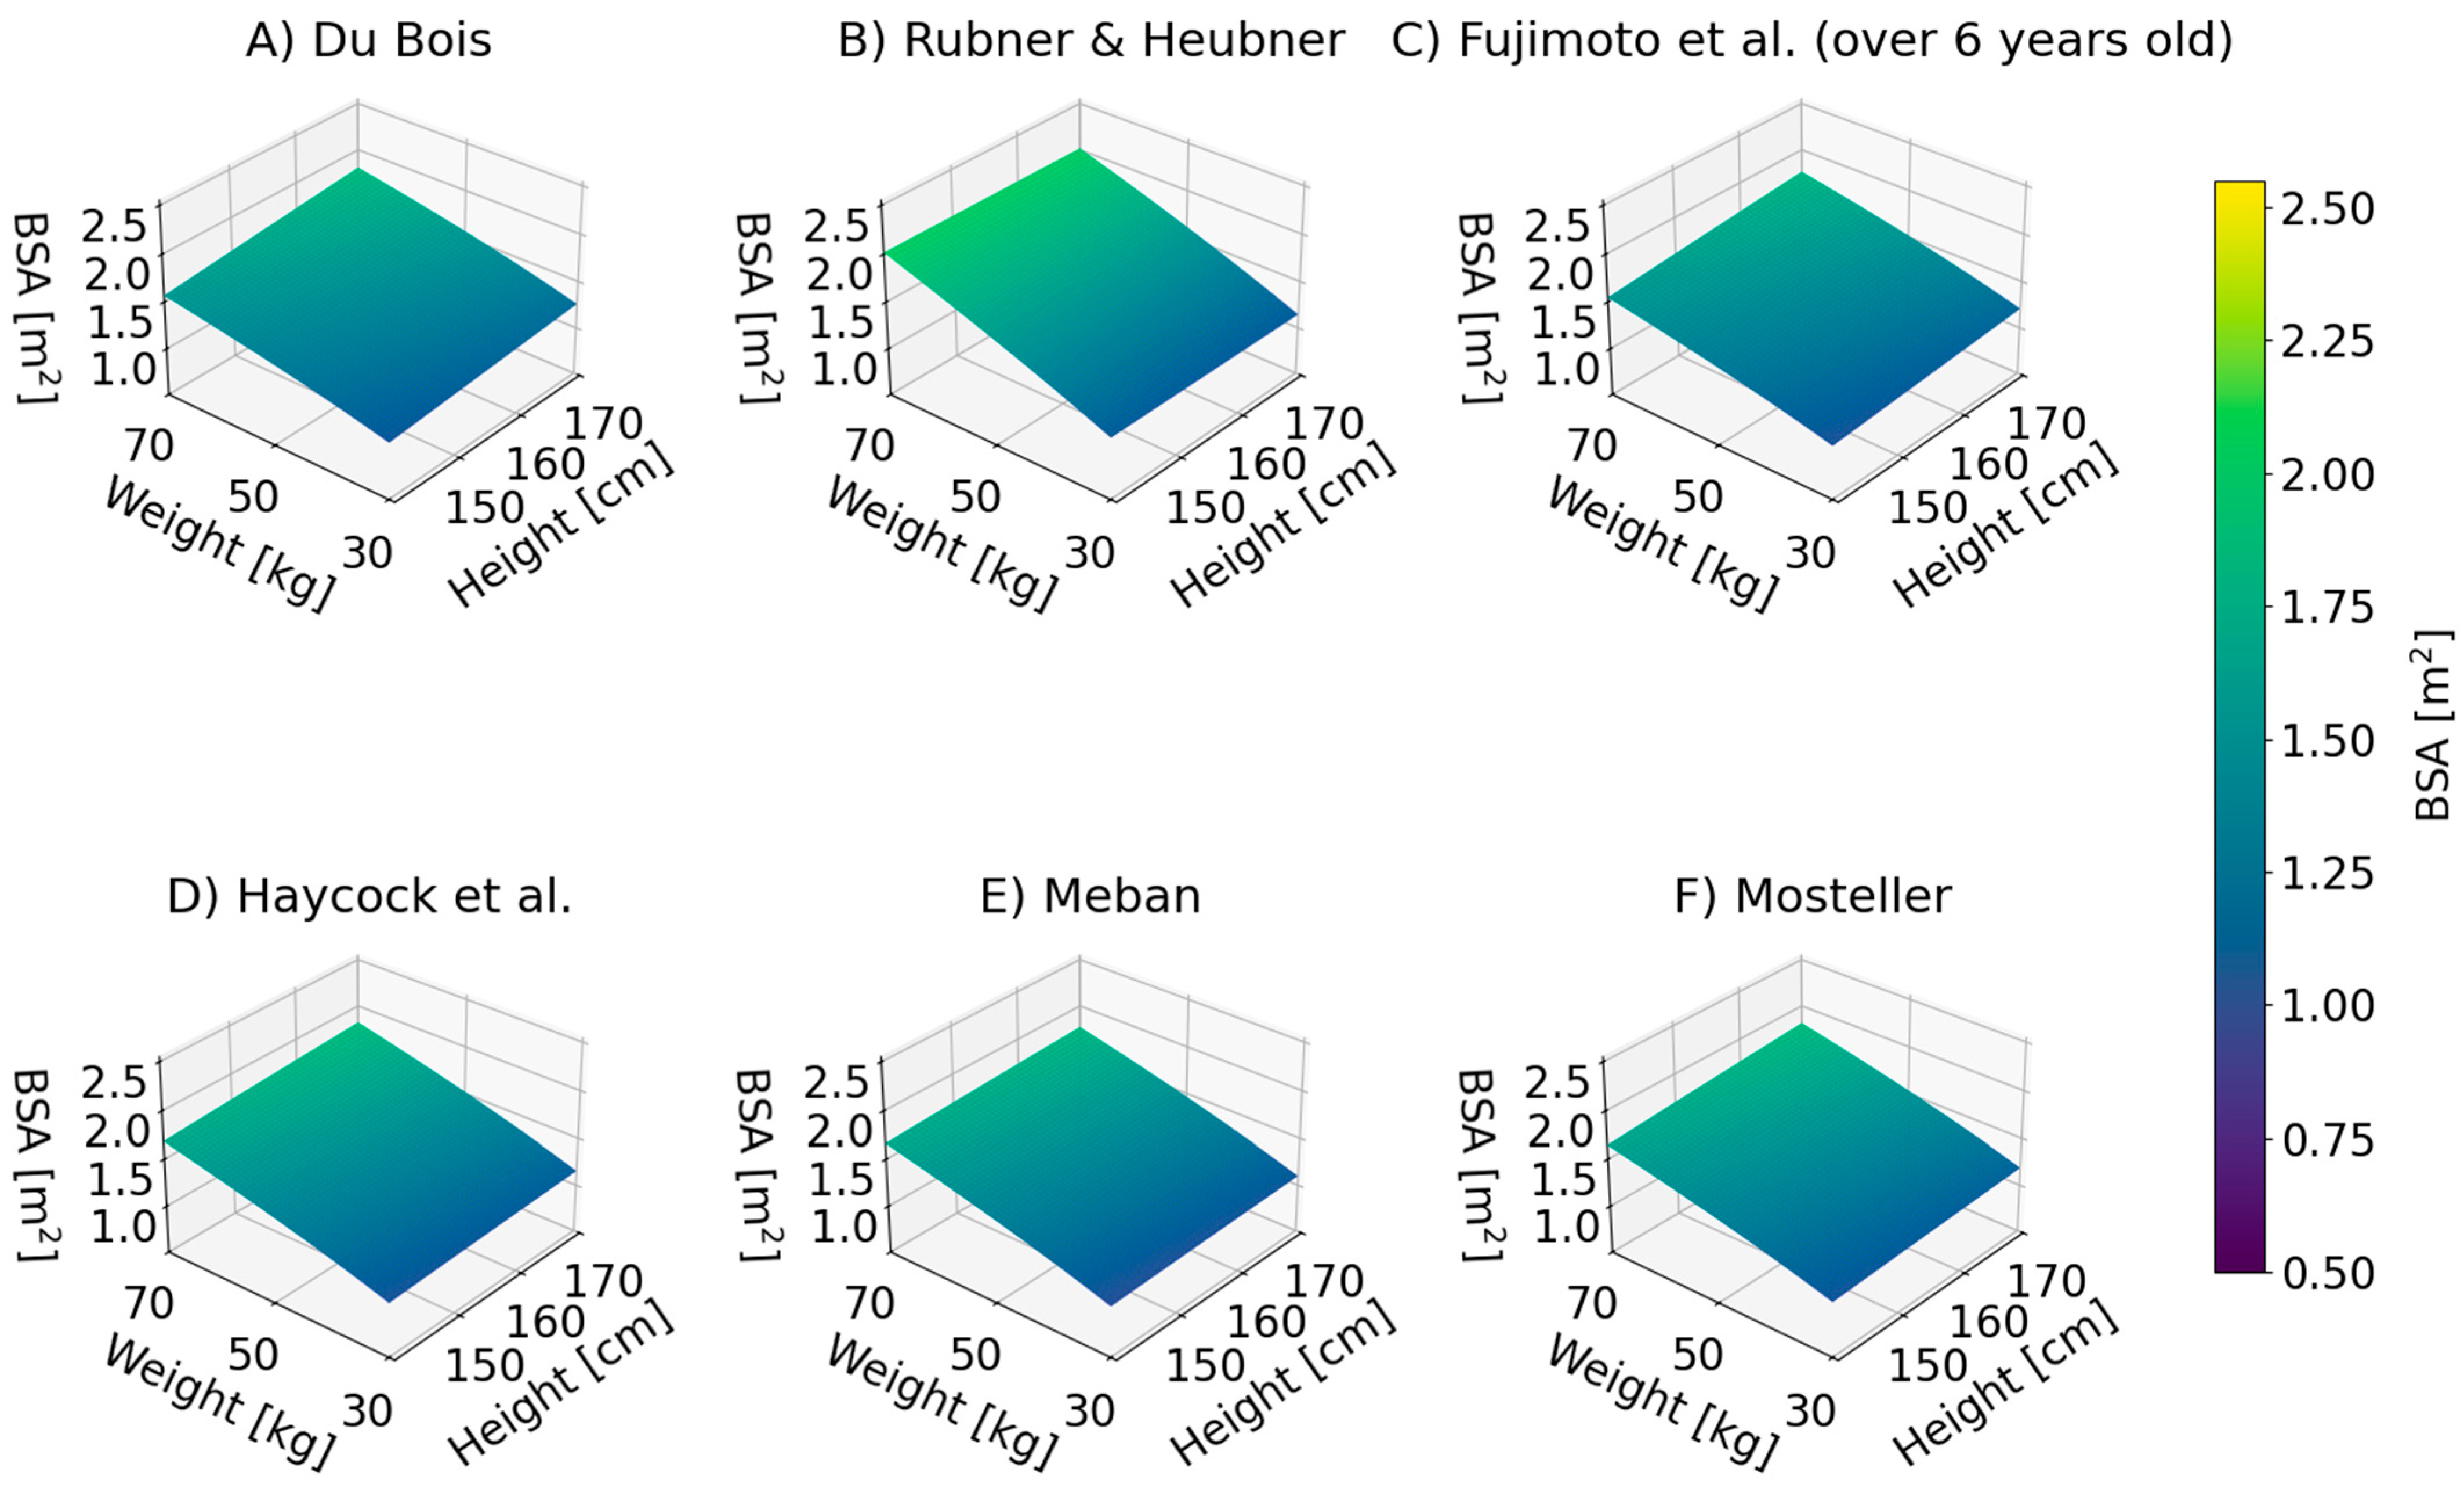
To facilitate comparison between individual charts, the BSA axis range is presented on the same scale. It is clearly visible that the choice of the equation to estimate this indicator has a significant impact on the obtained results. The greatest differences between formulas independent of the patient’s weight can be observed in the case of Costeff and Current formulas. Ignorance of these differences will inexorably lead to wrong medication dosages, which, as mentioned in the Introduction, may have tragic consequences, especially in the case of children.
In making an analysis, we want to stress that the key to reducing the dire consequences resulting from BSA value discrepancies lies not in the mean arithmetic value, but in the difference in BSA resulting from replacing one method with another. The direction of error (upwards or downwards) is also of importance. For example, let us consider a case of a 12-year-old child that has 150 cm height and 50 kg body weight. In this case, we chose the optimal method to determine BSA—assume it is the Rubner and Heubner method (BSA = 1.615 m2)—which we later swapped for another method, e.g., Fujimoto et al., (BSA = 1.398 m2). The error (change downwards by 0.217 m2) equals 0.217/1.615 ∗ 100%, that is, 13.4%. If we assumed that it is the method of Fujimoto et al. that should be optimal in the case of our patient, the error (change upwards by 0.217 m2) would be 0.217/1.398 ∗ 100%, that is, 15.5%, which compared to the previous scenario results in a more serious estimation error with all its clinical consequences.
Introducing mass as an additional parameter to the BSA formulae improves their precision, as shown in Figure 2. The dispersion of BSA values in the examined range (identical to the data in Figure 1 for formulae based on patients’ height and weight (Du Bois & Du Bois, Rubner & Heubner, Fujimoto et al., Haycock et al., Meban, Mosteller) is clearly smaller than in the case of equations using only their height. It is worth recalling here that the precision of the formulae used is not the same as their accuracy and does not necessarily mean that the results obtained are close to the actual BSA values. Based on the collected data, it can be concluded that the patient’s body weight has a significantly greater impact on BSA patterns than their height. This implies the need to verify the correctness of determining this parameter in the case of children with above-average body weight.
It is noteworthy that, in practice, the disproportion between the actual and the estimated value may be even greater, because the commonly used formulae are based only on simple anthropometric factors and do not take into account the diversity of the body structure of individual people. Currently, the most frequently used BSA equations are based on the results of experiments on a small group of patients with a standard body structure and do not take into account such situations as dwarfism, physical disabilities or non-standard proportions. This problem is particularly visible in the case of formulae developed for the needs of children’s diagnostics—the still-so-popular formula developed by the Du Bois brothers is based on the measurements of eight adults, and only one child (thus its applicability in paediatric population is highly dubious) [4].
The discrepancies between the BSA formulae from Table 1 (except those intended only for newborns) are shown in Figure 3, which shows the values of this parameter as a function of body weight for a 12-year-old female with a height of 150 cm. It can be observed that the current and Rubner’s & Heubner’s formulae yield results that differ significantly from the values calculated by other equations. In the case of the remaining formulae, the convergence of obtained values is greater; yet, as we move away from the average body weight of a 12-year-old child (marked on the chart with a dotted line), the differences between the estimates of the BSA parameter begin to increase. This applies to deviations in the patient’s body weight both upwards and downwards from the typical value; in the first case, a greater spread of BSA values can be observed. This trend is particularly disturbing in the context of the global trend of overweight and obesity among increasingly younger people—the more obese the population of paediatric patients is becoming, the higher the risk of mistaking dosages or miscalculating their body parameters [28,29,30].
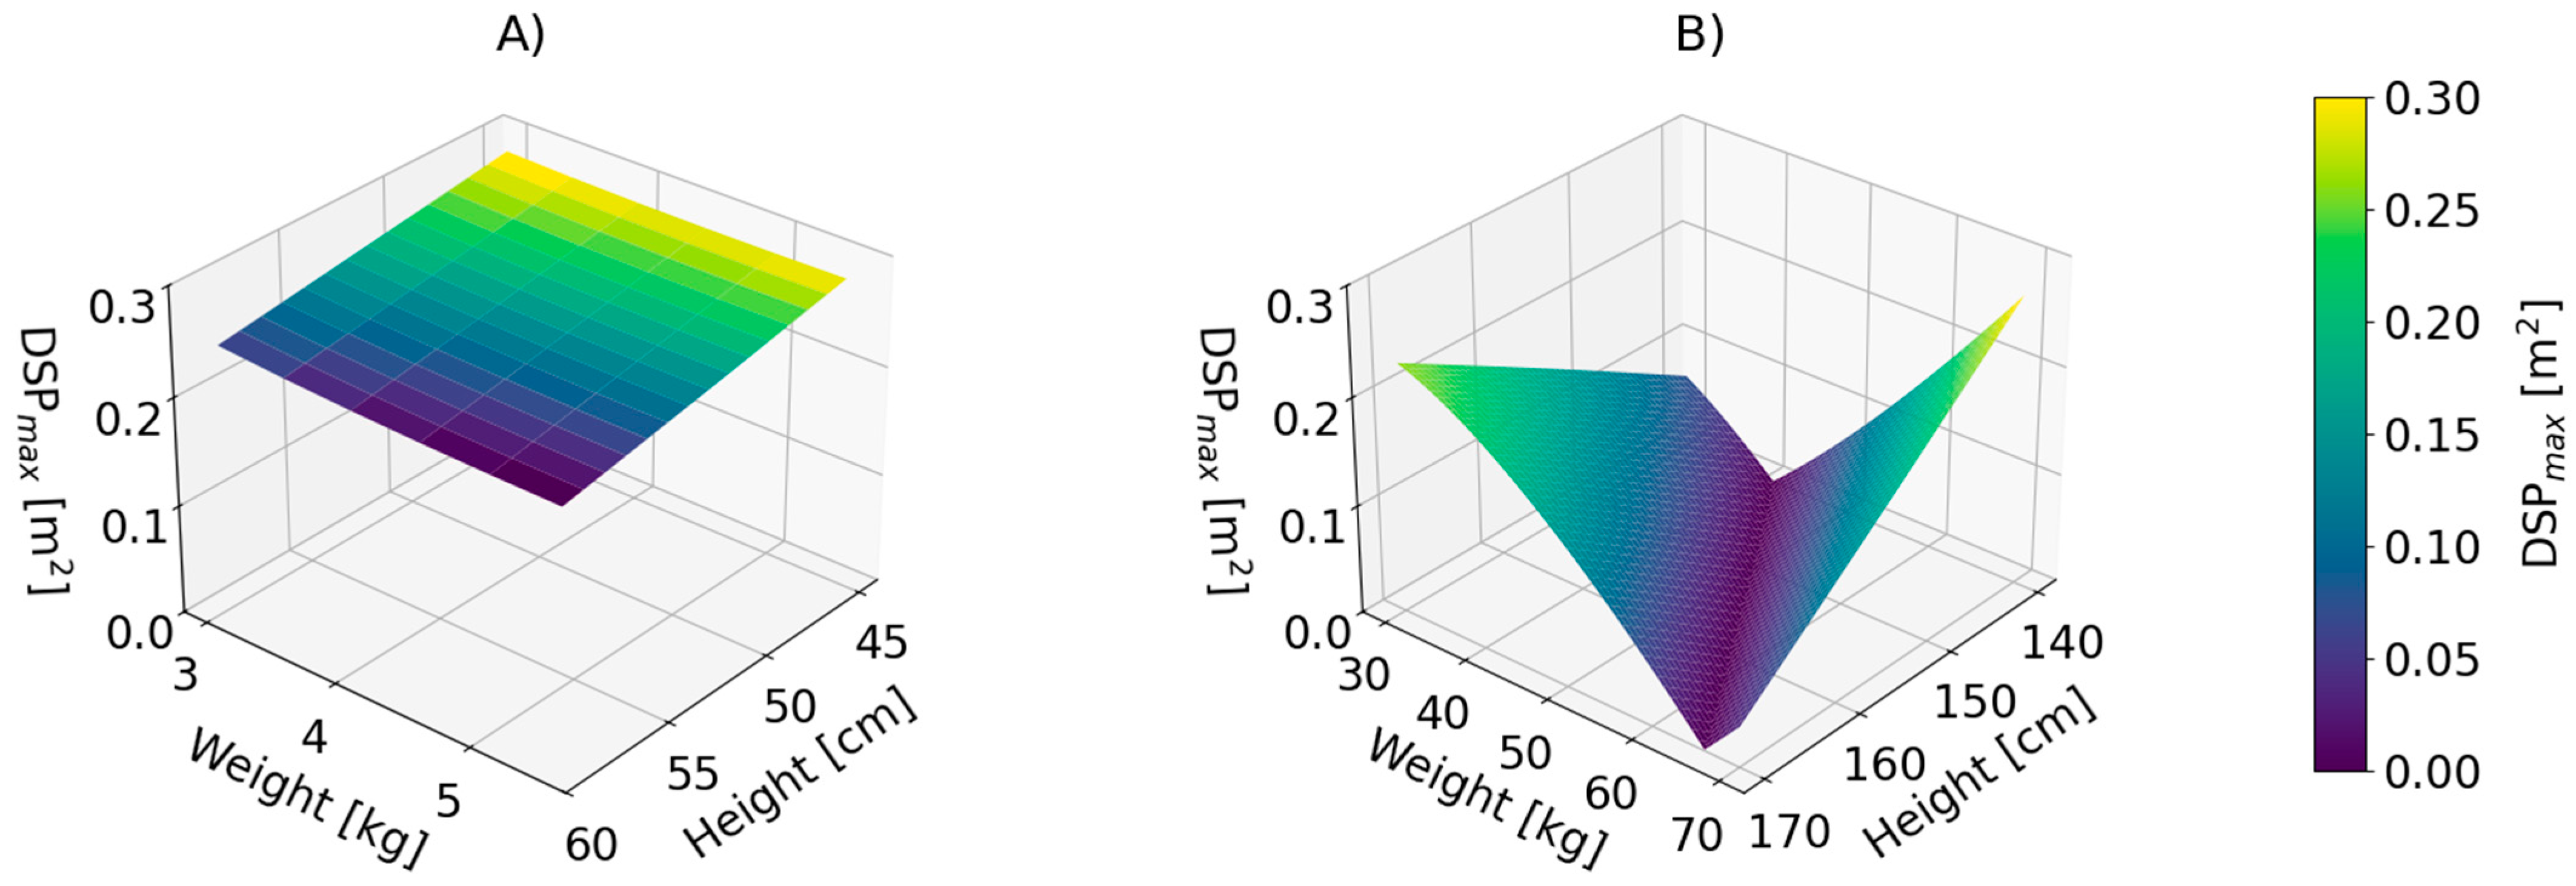
The maximum discrepancy parameter (DSPmax) can be defined as the difference in BSA estimates using the two most different formulae in a given age category. The greatest discrepancies in BSA values for 4-week-old infants were observed for the Banerjee & Bhattacharya and Vaughan & Litt formulas (Figure 4A), while for 12-year-olds the largest discrepancies were found for the Banerjee & Bhattacharya and Vaughan & Litt formulae (Figure 4B). For 4-week-old infants, the minimal DSPmax value in the BSA calculations was about 0.22 m2, which corresponds to approximately 80% of the average BSA value for females in this age group. The maximum discrepancies in BSA determination for this case reached 0.28 m2, which is over 100% of the typical value of this parameter. The observed disproportions increased as the patients’ height decreased and were, to some extent, dependent on their body weight. In contrast, for 12-year-old patients, the minimum of DSPmax recorded was 0.15 m2, representing less than 11% of the average BSA index for females in this age group. The maximum DSPmax value for a 12-year-old was 0.75 m2, which corresponds to approximately 54% of the average BSA. In this age group, the largest discrepancies were observed in case of overweight children, showing no dependence on the patient’s height. This phenomenon can be explained by the fact that in the case of 12-year-olds, the greatest discrepancies in determining BSA were observed for formulae that used only the patient’s body weight.
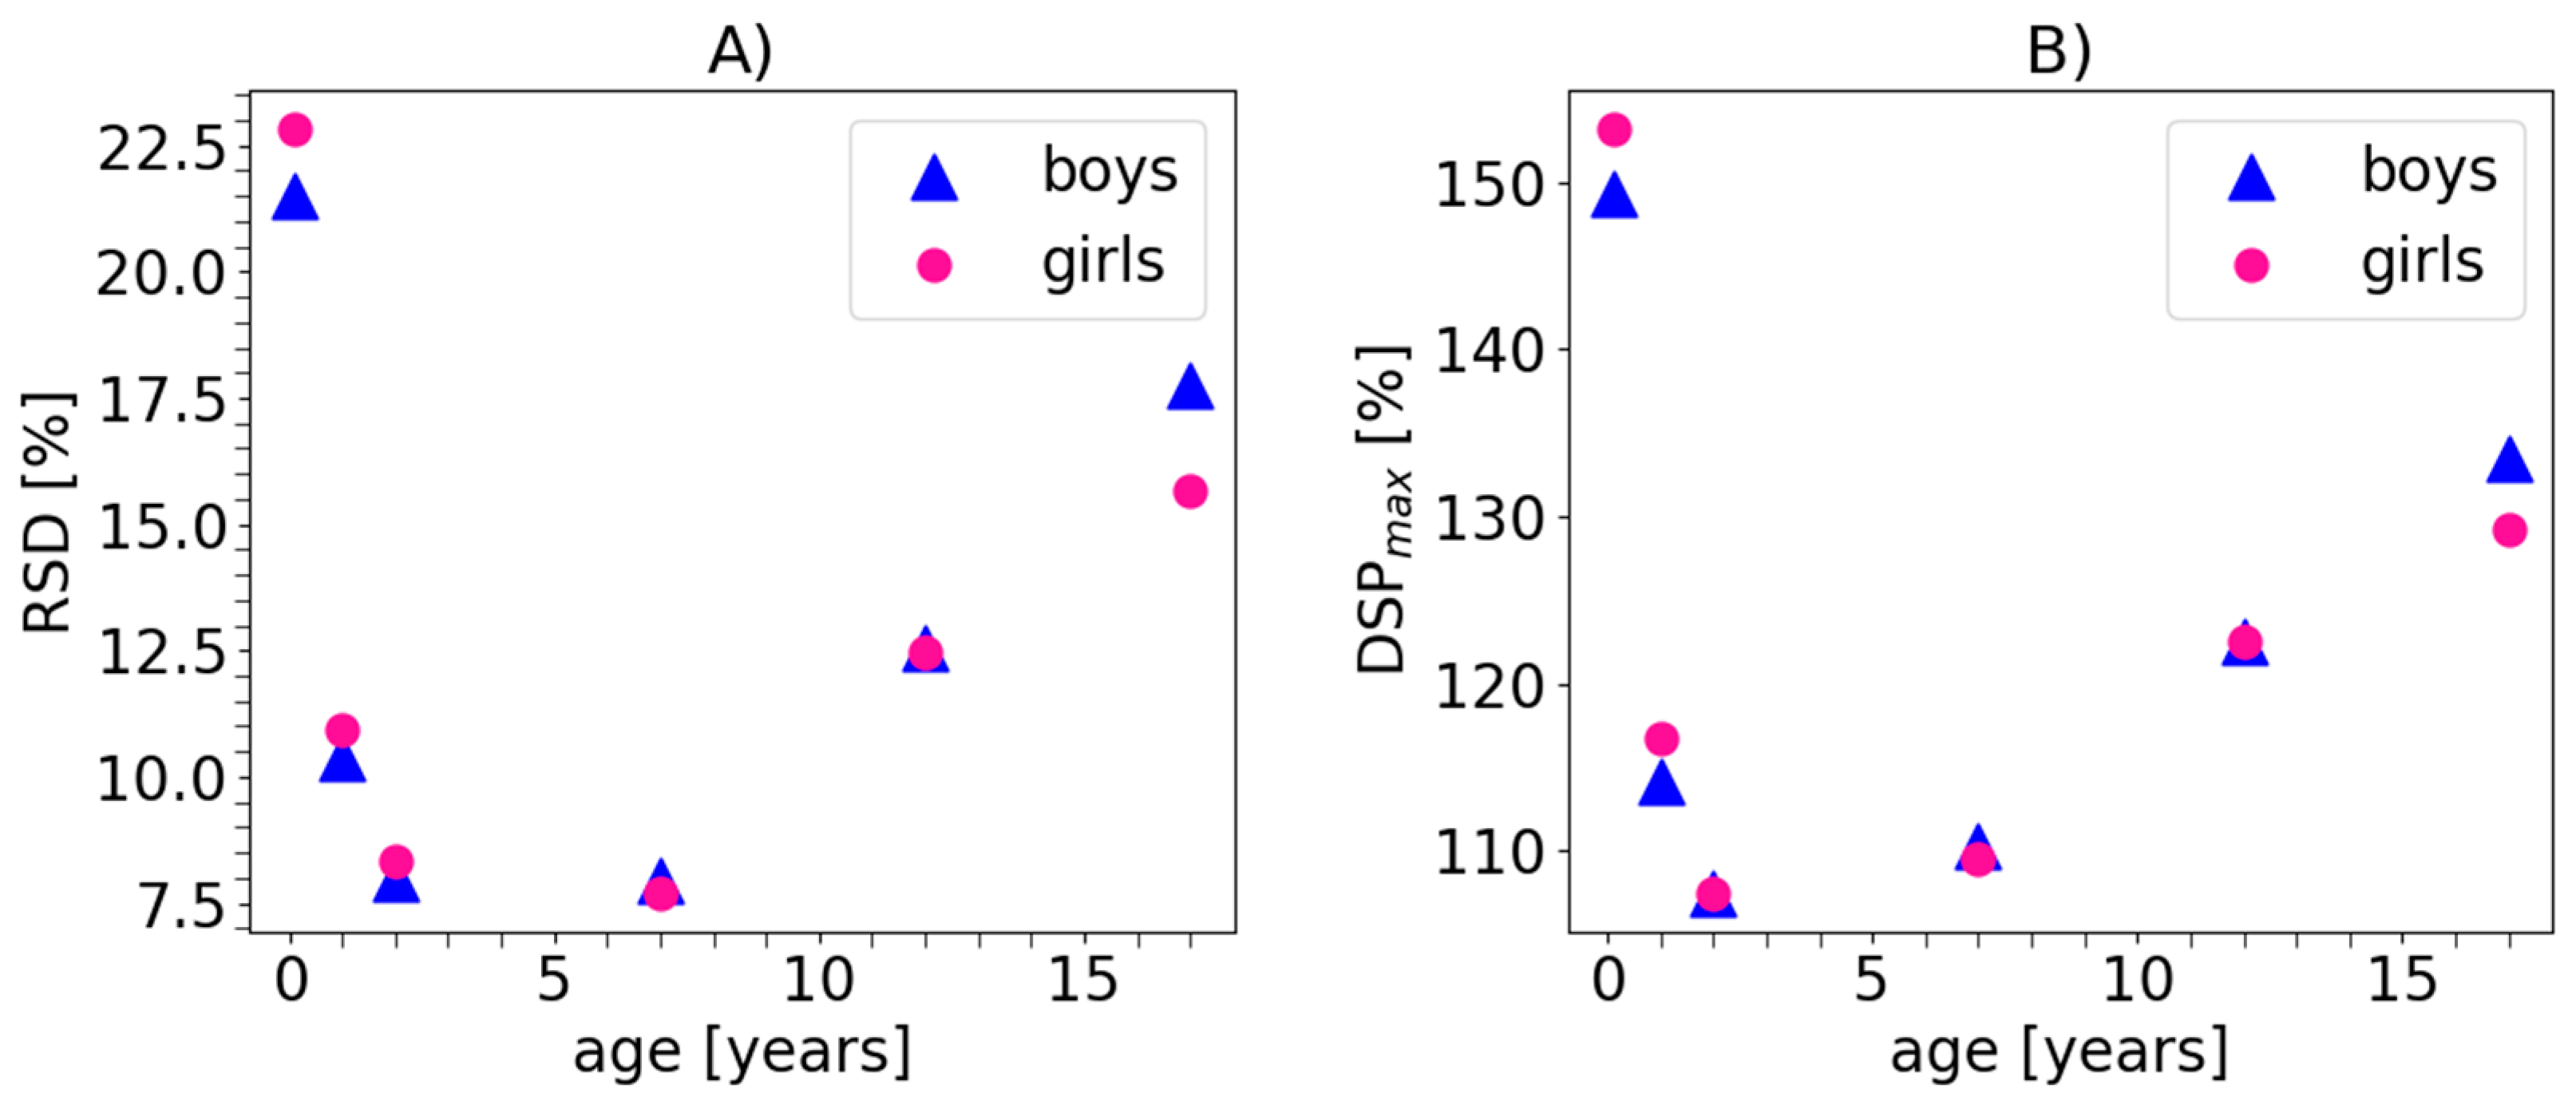
Detailed test results for children from the age groups of 4 weeks and 1, 2, 7, 12, and 17 years are presented in Table A1 (see Appendix A). For each age group, the BSA index was calculated using the appropriate formulas from Table 1, taking into account weight and height for individual percentiles from the growth chart. Then, a statistical analysis of the obtained data was performed, including the calculation of the average BSA value, standard deviation (σ), DSPmax, relative standard deviation (RSD) and relative DSPmax. The average value of the BSA index for a typical child in a given age category (50th percentile) ranged from 0.274 m2 to 1.663 m2 for girls in the age range from 4 weeks to 17 years and from 0.285 to 1.903 for boys in the same age range. Boys showed a higher average BSA value in most age categories than girls, but the opposite was observed in 12-year-olds. This phenomenon can be explained by the earlier onset of puberty in girls, which causes their higher average height and body weight in the mentioned age group. Due to large changes in the BSA parameter depending on the patient’s age, it is more convenient to use RSD and relative DSPmax for comparison purposes. Figure 5 shows the dependence of RSD and relative DSPmax on the patient’s age. In both cases, the obtained curves had a similar shape and did not differ significantly depending on the child’s gender.
It should also be mentioned that there was no correlation between the percentage deviation of each formula and the age of the patients. Equations that, in a given age category, were characterised by a small deviation from the average, could show significant differences in other groups. For this reason, it was not possible to indicate one formula that would be suitable for describing children of different ages. A potential solution to this problem may be the method proposed in the article [15], which involves selecting the appropriate formula depending on the patient’s age. Based on the collected data, it can be assumed that the analysed formulae are most precise for children aged 2 to 7, while the disproportions between the formulae used increase with age. What is particularly disturbing is that the greatest dispersion of estimated results was found in the case of the youngest children (under 1 year of age), which may translate into problems in the treatment of this especially sensitive age group of patients.
Figure 5 is a graphic illustration of the relation between children’ age and the discrepancies of BSA. At the moment of birth, they are the largest comparatively, because the body surface and body mass are very small; thus, even a small absolute change will result in big relative percentage change. After the neonatal period, the RSD% stays the same until adolescence, when due to puberty-related changes the physiognomical characteristics of both sexes begin to differ more from each other. Until puberty, the gender of the child does not seem to affect the BSA. It should also be mentioned that RSD and DSPmax are correlated in the examined age range.

5. Discussion

BSA plays a pivotal role in numerous medical therapeutic processes, such as cancer treatment [1,31,32,33], transplantation [34,35], toxicology [36], dermatology [37,38], the management of nephrotic syndrome [39], and burn treatment [40,41]. Additionally, it is an indicator related to skin water evaporation [42] and is valuable for assessing environmental occupational risks [43]. Several antiviral drugs (e.g., acyclovir), antimicrobials, and antifungals (like caspofungin) necessitate dosing regimens based on the patient’s body surface area. It is believed that medications accumulating in extracellular fluid should be dosed according to BSA, since it reflects the volume of extracellular fluid and of total body water more effectively than body weight. For this purpose, BSA calculators and nomograms are commonly employed [44].
It is obvious that the use of various formulae (in the case of children and adolescents, 14 different formulas are known) when calculating this parameter leads to discrepancies in the results obtained. In the studied cases, the minimum of DSPmax in BSA calculations was approximately 0.22 m2, equivalent to about 80% of the average BSA value for females in this age group. The maximum discrepancies in BSA determination in this case reached 0.28 m2, exceeding 100% of the typical value for this parameter. The observed disproportions increased as the patient’s height decreased and were, to some extent, dependent on their body weight. In contrast, for 12-year-old patients, the noted minimum of DSPmax was 0.15 m2, representing less than 11% of the average BSA index for females in this age group. The maximum DSPmax value for a 12-year-old was 0.75 m2, corresponding to approximately 54% of the average BSA. These results are even larger than an extremum noted previously for adults, of about 33% [5].
In order to better illustrate the described problem, a list of doses of drugs used in oncological therapy in children depending on the value of the BSA parameter was prepared (see Table 2). The calculations were made based on the example of a 12-year-old girl with a height of 154 cm and a weight of 42.8 kg, for various BSA values (MIN, AVG and MAX from Table A1). The drugs were grouped based on the disease entity and treatment regimen. The tumours selected are diseases that either occur only in children or are most common in this age group. The final column collects comments relating to additional clinical contexts in which the dosing regimen was applicable. The presented discrepancies between drug doses calculated using different formulae best illustrate the importance of the described issue and its impact on the effectiveness of the treatment process for cancer in children.
Inappropriate dosages of oncological cytostatic drugs can have dangerous consequences. All chemotherapeutic medications are known to have side-effects, some of them life threatening. A study by Miller et al. [55] enumerated the most popular error categories in paediatric chemotherapy administration and found that ¼ of them were related to misdosages. Of the drugs from Table 2, side effects are particularly dangerous in case of methotrexate (a risk of acute, life-threatening gastrointestinal bleeding in case of overdose), carboplatin (acute kidney failure), and cyclophosphamide (haemorrhagic cystitis). These phenomena are especially dangerous for underserved populations. While affluent countries can afford the huge costs of treatment of all side-effects (which can sometimes reach higher sums than treating the tumour itself—let us consider, e.g., a heart transplant because of cardiotoxic effects of doxorubicin, or lung transplants because of damaging action of bleomycin), many populations are excluded from such benefits due to lack of proper hospitals or properly qualified medical staff. Not every country can afford a programme of oncological therapy, and especially in the limited setting, dosages are of crucial importance—if we have sparse resources, care should be taken to distribute them as properly and efficiently as possible, avoiding overdosages (not only are overdosages dangerous, they are also inefficient).

6. Conclusions

The analysis we carried out did not allow for a clear choice of the best formula for determining BSA in children; moreover, it showed that the formulae used overlap only to a limited extent. For this reason, we propose either the improvement of existing BSA formulas or the development of a new one, based on a larger number of easily measurable anthropometric parameters. This is particularly important due to large differences in the body condition of individual people, sometimes additionally aggravated by certain disease lesions. An example of a disease causing a significant deviation in BSA value from the average is obesity [56], which affects an ever-increasing part of the population, including children and adolescents [29]. Improved formulae for calculating BSA for adults were proposed in the article [57]; it is nevertheless necessary to derive distinct equations for children. In order to better illustrate and at the same time attempt to solve the problem described in this article, we have developed a free BSA calculator [Supplementary Material] based on the formulae from Table 1. This software allows us to calculate BSA values using various methods and displays disproportions between them.
A limitation of the present study is that the results are derived from simulated calculations using existing BSA formulas, rather than from empirical measurements of children’s body surface area. While this approach enables a systematic comparison across multiple formulas and a broad range of anthropometric data, it does not directly validate the accuracy of these formulas against real-world measurements. Therefore, the discrepancies we describe reflect theoretical differences between equations rather than absolute deviations from actual BSA values. Nevertheless, this limitation does not undermine the overall objective of the manuscript, which was not to identify the single “best” formula, but rather to emphasise that the coexistence of numerous formulas yields substantially different results. These differences, in turn, may lead to inappropriate medical treatment if the variability is overlooked in clinical practice. Future studies incorporating large-scale empirical datasets and direct measurements will be essential to confirm and refine these findings, and ultimately to support the development of new, more reliable formulas for paediatric BSA assessment.

Supplementary Materials

The following supporting information can be downloaded at: https://www.mdpi.com/article/10.3390/app152312454/s1; The BSA Calculator software created by our team for the purpose of this study is accessible and downloadable as a supplementary material to this article.

Author Contributions

Conceptualization G.R., and L.S.L.; Data curation G.R. and L.S.L.; Formal analysis, Investigation G.R., L.S.L., and P.M.T.; Methodology G.R. and L.S.L.; Project administration L.S.L.; Resources, Software, Supervision G.R.; Validation, Visualization, Writing—original draft G.R., L.S.L., P.M.T., M.C. and Z.C.; Writing—review and editing G.R., L.S.L., P.M.T., M.C. and Z.C. All authors have read and agreed to the published version of the manuscript.

Funding

This research received no external funding.

Institutional Review Board Statement

Not applicable.

Informed Consent Statement

Not applicable.

Data Availability Statement

Basic data is provided within the manuscript. Other data are available for request. In order to obtain these data, contact leszek.litzbarski@pg.edu.pl.

Acknowledgments

The Authors would like to express their deepest gratitude towards Paweł Kowalski, PhD (Department of Electrical and Control Engineering, Gdansk University of Technology, Narutowicza 11/12, 80-233 Gdansk, Poland) for invaluable help with visual editing of figures in this work. Without Him, the figures wouldn’t be as clear and aesthetically pleasing.

Conflicts of Interest

The authors declare no conflicts of interest.

Abbreviations

The following abbreviations are used in this manuscript:
BSABody Surface Area
TBSATotal Body Surface Area
GFRGlomerular Filtration Rate
RSDRelative standard deviation
DSPmaxMaximal discrepancy parameter

Appendix A

Table A1. A summary of statistical data on the calculation of BSA using various formulae for children of different age groups.
AGEPERCENTILEWeight (kg)Height (cm)Average BSA (m2)σ (m2)DSPMAX (m2)RSD (%)Relative DSPMAX (%)
GirlsBoysGirlsBoysGirlsBoysGirlsBoysGirlsBoysGirlsBoysGirlsBoys
4 WEEKS33.13.449.750.70.2330.2430.0660.0650.3960.40328.4526.67169.82166.00
253.74.052.153.10.2580.2700.0640.0630.4100.41724.7123.24159.15154.75
504.14.453.454.40.2740.2850.0620.0610.4200.42722.8021.54153.40149.58
754.54.854.755.70.2890.3000.0610.0600.4290.43621.1620.08148.40145.04
975.35.657580.3190.3300.0590.0590.4470.45318.6217.79140.16137.48
1 year37.17.869.271.30.3920.4160.0510.0500.4910.50613.0912.06125.19121.61
258.29.072.374.10.4290.4550.0500.0490.5140.53111.5910.86119.80116.57
508.99.67475.70.4520.4750.0490.0490.5290.54310.9210.37116.94114.37
759.710.475.877.40.4780.5000.0490.0500.5450.55810.349.94114.04111.77
9711.311.878.980.20.5270.5420.0510.0510.5750.5869.699.49109.19108.11
2 years39.39.879.682.10.4710.4880.0460.0440.5400.5529.679.08114.79112.93
2510.811.383.585.80.5190.5360.0450.0440.5710.5828.678.25110.06108.57
5011.712.285.787.80.5470.5630.0450.0450.5890.6078.307.98107.64107.72
7512.713.187.989.90.5770.5910.0470.0460.6230.6378.067.79107.95107.93
9714.915.191.893.60.6410.6490.0520.0510.6930.7018.107.84108.12108.01
7 years317.818.61131150.7470.7700.0470.0490.7920.8146.266.39105.91105.68
2521.121.91201210.8400.8620.0580.0620.9020.9326.967.14107.38108.15
5023.524.41231250.9030.9270.0690.0730.9921.0267.657.89109.80110.60
7526.527.81271280.9801.0120.0840.0911.1031.1508.619.02112.57113.68
9734.737.61331341.1721.2360.1340.1541.3971.49911.4312.44119.19121.27
12 years330.029.71411391.0851.0740.0970.0961.2371.2258.938.95113.97114.05
2537.437.11491481.2631.2540.1390.1381.5061.49510.9910.98119.27119.22
5042.842.71541531.3851.3810.1730.1731.6991.69512.4812.51122.69122.74
7549.650.01581581.5311.5380.2190.2221.9381.95214.3014.45126.61126.90
9766.769.81671671.8721.9300.3480.3732.5282.63218.5719.33135.00136.40
17 years343.950.81541651.4071.5690.1810.2221.7371.98512.8514.17123.49126.50
2550.860.31611731.5601.7700.2260.2891.9822.31814.4916.30127.07130.96
5055.766.91651781.6631.9030.2600.3372.1532.54615.6417.73129.46133.81
7561.974.81691821.7892.0560.3060.3992.3682.81717.0819.39132.35136.99
9777.593.91761902.0882.4060.4290.5572.9003.46120.5323.14138.88143.82

References

  1. Ivy, S.P.; Beumer, J.H. Ovarian cancer survival and chemotherapy dosing, body mass index, and body surface area: Are we there yet? JAMA Oncol. 2015, 1, 732–733. [Google Scholar] [CrossRef]
  2. Zafrir, B.; Goren, Y.; Salman, N.; Amir, O. Comparison of body mass index and body surface area as outcome predictors in patients with systolic heart failure. Cardiol. J. 2015, 22, 375–381. [Google Scholar] [CrossRef]
  3. Adler, A.C.; Nathanson, B.H.; Raghunathan, K.; McGee, W.T. Misleading indexed hemodynamic parameters: The clinical importance of discordant BMI and BSA at extremes of weight. Crit. Care 2012, 16, 471. [Google Scholar] [CrossRef] [PubMed]
  4. Du Bois, D.; Du Bois, E.F. A formula to estimate the approximate surface area if height and weight be known. Arch. Intern. Med. 1916, 17, 863–871. [Google Scholar] [CrossRef]
  5. Redlarski, G.; Palkowski, A.; Krawczuk, M. Body surface area formulae: An alarming ambiguity. Sci. Rep. 2016, 6, 27966. [Google Scholar] [CrossRef]
  6. Ho, H.L.; Halim, A.S.; Sulaiman, W.A.W.; Fatimah, M.J. Estimation of Total Body Surface Area Burned: A Comparison Between Burn Unit and Referring Facilities. Ann. Burns Fire Disasters 2023, 36, 19–28. [Google Scholar] [PubMed] [PubMed Central]
  7. Thelwell, M.; Masters, N.; Appleyard, R.; Bullas, A.M. Advanced Body Measurement Techniques Can Complement Current Methods of Cytotoxic Chemotherapy Dose Prescription. Appl. Sci. 2024, 14, 834. [Google Scholar] [CrossRef]
  8. Wu, Q.; Zhou, Y.; Fan, X.; Ma, H.; Gu, W.; Sun, F. Evaluation of nine formulas for estimating the body surface area of children with hematological malignancies. Front. Pediatr. 2022, 10, 989049. [Google Scholar] [CrossRef] [PubMed] [PubMed Central]
  9. Russell, J.; Grimes, J.P.; Teferi, S.; Pruitt, Z.M.; Howe, J.L.; Adams, K.T.; Nicol, N.; Krevat, S.; Busog, D.; Ratwani, R.M.; et al. Pediatric Dose Calculation Issues and the Need for Human Factors–Informed Preventative Technology Optimizations. Patient Saf. 2022, 4, 48–61. [Google Scholar] [CrossRef]
  10. Flint, B.; Das, J.M.; Hall, C.A. Body Surface Area; StatPearls [Internet]; StatPearls Publishing: Treasure Island, FL, USA, 2025. [Google Scholar]
  11. El Edelbi, R.A.; Lindemalm, S.; Nydert, P.; Eksborg, S. Estimation of body surface area in neonates, infants, and children using body weight alone. Int. J. Pediatr. Adolesc. Med. 2021, 8, 221–228. [Google Scholar] [CrossRef]
  12. Alvear-Vasquez, F.; Vidal-Espinoza, R.; Gomez-Campos, R.; de Campos, L.F.C.C.; Lazari, E.; Guzmán-Luján, J.F.; Pablos-Monzó, A.; Cossio-Bolaños, M. Body surface area is a predictor of maturity status in school children and adolescents. BMC Pediatr. 2023, 23, 410. [Google Scholar] [CrossRef]
  13. Piecuch, M.; Chylak, M.; Górski, M.; Garbicz-Kata, J.; Szczyrba, A.; Buczkowska, M.; Malinowska-Borowska, J.; Nowak, J.U.; Niedziela, J.T.; Gąsior, M.; et al. Comparison of the Effectiveness of Body Surface Area Estimation Formulas in Predicting the Risk of Death in Patients with Heart Failure. J. Clin. Med. 2024, 13, 6625. [Google Scholar] [CrossRef] [PubMed]
  14. Von Meeh, K. Oberflächenmessungen des menschlichen Körpers. Z. Biol. 1879, 15, 425–458. [Google Scholar]
  15. Fujimoto, S.; Watanabe, T.; Sakamoto, A.; Yukawa, K.; Morimoto, K. Studies on the physical surface area of Japanese: Part 18 calculation formulas in three stages over all ages. Nippon Eiseigaku Zasshi 1968, 23, 443–450. [Google Scholar] [CrossRef]
  16. Lissauer, W. Über Oberflächenmessungen an Säuglingen und ihre Bedeutung für den Nahrungsbedarf. Jahrb. Kinderheilkd. Phys. Erzieh. Neue Folge 1903, 58, 392–411. [Google Scholar]
  17. Costeff, H. A simple empirical formula for calculating approximate surface area in children. Arch. Dis. Child. 1966, 41, 681–683. [Google Scholar] [CrossRef]
  18. Boyd, E. The Growth of the Surface Area of the Human Body; University Minnesota Press: Minneapolis, MN, USA, 1935. [Google Scholar]
  19. Haycock, G.B.; Schwartz, G.J.; Wisotsky, D.H. Geometric method for measuring body surface area: A height-weight formula validated in infants, children, and adults. J. Pediatr. 1978, 93, 62–66. [Google Scholar] [CrossRef] [PubMed]
  20. Nwoye, L.O.; Al-Shehri, M.A. The body surface area of Saudi newborns. J. Egypt. Public Health Assoc. 2005, 80, 153–168. [Google Scholar]
  21. Rubner, M.; Heubner, O. Die natürliche Ernährung eines Säuglings. Z. Biol. 1898, 36, 1–55. [Google Scholar]
  22. Banerjee, S.; Bhattacharya, A.K. Determination of body surface area in Indian Hindu children. J. Appl. Physiol. 1961, 16, 969–970. [Google Scholar] [CrossRef]
  23. Meban, C. The surface area and volume of the human fetus. J. Anat. 1983, 137, 271–278. [Google Scholar]
  24. Mosteller, R.D. Simplified calculation of body surface area. N. Engl. J. Med. 1987, 317, 1098. [Google Scholar]
  25. Vaughan, V.C., III; Litt, I.F. Developmental pediatrics: Assessment of growth and development. In Nelson Textbook of Pediatrics; Behrman, R.E., Vaughan, V.C., III, Eds.; WB Saunders: Philadelphia, PA, USA, 1987; pp. 24–33. [Google Scholar]
  26. Current, J.D. A linear equation for estimating the body surface area in infants and children. Internet J. Anesthesiol. 1998, 2, e9453. [Google Scholar] [CrossRef]
  27. The WHO Child Growth Standards. (n.d.). Available online: https://www.who.int/tools/child-growth-standards/standards (accessed on 8 November 2025).
  28. Singh, G.K.; Kogan, M.D.; Van Dyck, P.C. Changes in state-specific childhood obesity and overweight prevalence in the United States from 2003 to 2007. Arch. Pediatr. Adolesc. Med. 2010, 164, 598–607. [Google Scholar] [CrossRef]
  29. Wang, Y.; Lobstein, T. Worldwide trends in childhood overweight and obesity. Int. J. Pediatr. Obes. 2006, 1, 11–25. [Google Scholar] [CrossRef]
  30. Stamatakis, E.; Wardle, J.; Cole, T.J. Childhood obesity and overweight prevalence trends in England: Evidence for growing socioeconomic disparities. Int. J. Obes. 2010, 34, 41–47. [Google Scholar] [CrossRef] [PubMed]
  31. Gerina-Berzina, A.; Vikmanis, U.; Teibe, U.; Umbraško, S. Anthropometric measurements of the body composition of cancer patients determine the precise role of the body surface area and the calculation of the dose of chemotherapy. Pap. Anthropol. 2012, 21, 84–94. [Google Scholar] [CrossRef]
  32. Gurney, H. How to calculate the dose of chemotherapy. Br. J. Cancer 2002, 86, 1297–1302. [Google Scholar] [CrossRef] [PubMed]
  33. Chatelut, E.; White-Koning, M.L.; Mathijssen, R.H.; Puisset, F.; Baker, S.D.; Sparreboom, A. Dose banding as an alternative to body surface area-based dosing of chemotherapeutic agents. Br. J. Cancer 2012, 107, 1100–1106. [Google Scholar] [CrossRef] [PubMed]
  34. Fukazawa, K.; Nishida, S.; Shigematsu, A.; Levi, D.M.; Nishida, T.; Tzakis, A.G. Determination of the safe range of graft size mismatch using body surface area index in deceased liver transplantation. Transplant. Int. 2013, 26, 724–733. [Google Scholar] [CrossRef]
  35. Urata, K.; Kawasaki, S.; Matsunami, H.; Hashikura, Y.; Ikegami, T.; Ishizone, S.; Momose, Y.; Komiyama, A.; Makuuchi, M. Calculation of child and adult standard liver volume for liver transplantation. Hepatology 1995, 21, 1317–1321. [Google Scholar] [CrossRef]
  36. West, D.P.; Worobec, S.; Solomon, L.M. Pharmacology and toxicology of infant skin. J. Investig. Dermatol. 1981, 76, 147–150. [Google Scholar] [CrossRef]
  37. Iversen, L.; Lange, M.; Bissonette, R.; Carvalho, A.; van de Kerkhof, P.; Kirby, B.; Kleyn, C.; Lynde, C.; van der Walt, J.; Wu, J. Topical treatment of psoriasis: Questionnaire results on topical therapy accessibility and influence of body surface area on usage. J. Eur. Acad. Dermatol. Venereol. 2017, 31, 1188–1195. [Google Scholar] [CrossRef]
  38. Speeckaert, R.; van Geel, N.; Vermaelen, K.; van Hoecke, L.; Brochez, L.; Lambert, J. Comparison of methods to estimate the affected body surface area and the dosage of topical treatments in psoriasis and atopic dermatitis: The advantage of a picture-based tool. J. Eur. Acad. Dermatol. Venereol. 2019, 33, 1726–1732. [Google Scholar] [CrossRef]
  39. Saadeh, S.A.; Alhawiti, N.M.; El-Metwally, A.; Alamro, R.A.; Khalil, A. Weight or body surface area dosing of steroids in nephrotic syndrome: Is there an outcome difference? Pediatr. Nephrol. 2011, 26, 2167–2171. [Google Scholar] [CrossRef] [PubMed]
  40. Bayley, E.W.; Chung, Y.T.; O’Mara, M.S.; Walker, A.C.; Serghiou, M.A. Research priorities for burn nursing: Rehabilitation, discharge planning, and follow-up care. J. Burn Care Rehabil. 1992, 13, 471–476. [Google Scholar] [CrossRef] [PubMed]
  41. Parvizi, D.; Kamolz, L.P.; Giretzlehner, M.; Trop, M.; Lumenta, D.B. The potential impact of wrong TBSA estimations on fluid resuscitation in patients suffering from burns: Things to keep in mind. Burns 2014, 40, 241–245. [Google Scholar] [CrossRef]
  42. Mündlein, M.; Eberhardt, J.; Farkas, A.; Dörfler, M.; Ulmer, H.; Lothar, H. Comparison of transepidermal water loss (TEWL) measurements with two novel sensors based on different sensing principles. Sens. Actuators A Phys. 2008, 142, 67–72. [Google Scholar] [CrossRef]
  43. Tsai, P.-J.; Shieh, H.-Y.; Lee, W.-J.; Lai, S.-O. Health-risk assessment for workers exposed to polycyclic aromatic hydrocarbons (PAHs) in a carbon black manufacturing industry. Sci. Total Environ. 2001, 278, 137–150. [Google Scholar] [CrossRef]
  44. Udristioiu, A.; Nanu, M.; Nanu, C.; Udristioiu, I.; Popescu, F.; Galescu, L. Variability of biological parameters in blood samples between two consecutive schedules of hemodialysis. In Basic Nephrology and Acute Kidney Injury; InTech: Rijeka, Croatia, 2012; pp. 53–60. [Google Scholar]
  45. Starship Children’s Health. Wilms Tumour PI Wilms 1 Protocol. Available online: https://starship.org.nz/guidelines/wilms-tumour-pi-wilms-1-protocol/ (accessed on 15 March 2024).
  46. Wang, J.; Li, M.; Tang, J.; Jiang, S.; Wang, C. Current treatment for Wilms tumor: COG and SIOP standards. World J. Pediatr. Surg. 2019, 2, e000038. [Google Scholar] [CrossRef]
  47. Dix, D.B.; Seibel, N.L.; Chi, Y.-Y.; Khanna, G.; Gratias, E.; Anderson, J.R.; Mullen, E.A.; Geller, J.I.; Kalapurakal, J.A.; Paulino, A.C.; et al. Treatment of stage IV favorable histology Wilms tumor with lung metastases: A report from the Children’s Oncology Group AREN0533 study. J. Clin. Oncol. 2018, 36, JCO2017771931. [Google Scholar] [CrossRef]
  48. Ademola-Popoola, D.; Opocher, E.; Reddy, A. Contemporary management of retinoblastoma in the context of a low-resource country. Niger. Postgrad. Med. J. 2019, 26, 69–73. [Google Scholar] [CrossRef] [PubMed]
  49. Ancona Lezama, D.A.; Dalvin, L.A.; Shields, C.L. Modern treatment of retinoblastoma: A 2020 review. Indian J. Ophthalmol. 2020, 68, 2356–2365. [Google Scholar] [CrossRef]
  50. Whelan, J.S.; Burcombe, R.; Janinis, J.; Baldelli, A.M.; Cassoni, A.M. Interval compressed vincristine, doxorubicin, cyclophosphamide alternating with ifosfamide, etoposide in patients with advanced Ewing’s and other small round cell sarcomas. Clin. Sarcoma Res. 2012, 2, 12. [Google Scholar] [CrossRef]
  51. Imaya, M.; Muramatsu, H.; Narita, A.; Yamamori, A.; Wakamatsu, M.; Yoshida, T.; Miwata, S.; Narita, K.; Ichikawa, D.; Hamada, M.; et al. Combination chemotherapy consisting of irinotecan, etoposide, and carboplatin for refractory or relapsed neuroblastoma. Cancer Med. 2022, 11, 1956–1964. [Google Scholar] [CrossRef]
  52. Khan, S.; Ahmed, A.; Al-Salem, A.H.; Al-Zahrani, A.S.; Al-Hussein, K. Pediatric high-risk neuroblastoma with autologous stem cell transplant—20 years of experience. Int. J. Pediatr. Adolesc. Med. 2021, 8, 253–257. [Google Scholar] [CrossRef]
  53. Schmiegelow, K.; Nielsen, S.N.; Frandsen, T.L.; Nersting, J. Mercaptopurine/methotrexate maintenance therapy of childhood acute lymphoblastic leukemia: Clinical facts and fiction. J. Pediatr. Hematol. Oncol. 2014, 36, 503–517. [Google Scholar] [CrossRef] [PubMed]
  54. National Comprehensive Cancer Network. Acute Lymphoblastic Leukemia. Available online: https://www.nccn.org/guidelines/guidelines-detail?category=1&id=1410 (accessed on 8 November 2025).
  55. Rinke, M.L.; Shore, A.D.; Morlock, L.; Hicks, R.W.; Miller, M.R. Characteristics of pediatric chemotherapy medication errors in a national error reporting database. Cancer 2007, 110, 186–195. [Google Scholar] [CrossRef] [PubMed]
  56. Yosipovitch, G.; DeVore, A.; Dawn, A. Obesity and the skin: Skin physiology and skin manifestations of obesity. J. Am. Acad. Dermatol. 2007, 56, 901–916. [Google Scholar] [CrossRef]
  57. Redlarski, G.; Kozieł, S.; Krawczuk, M.; Siebert, J.; Tałałaj, M.; Pałkowski, A.; Tojza, P.; Cieślikowska, Z.; Litzbarski, L.S. An improvement of body surface area formulas using the 3D scanning technique. Int. J. Occup. Med. Environ. Health 2024, 37, 205–219. [Google Scholar] [CrossRef]
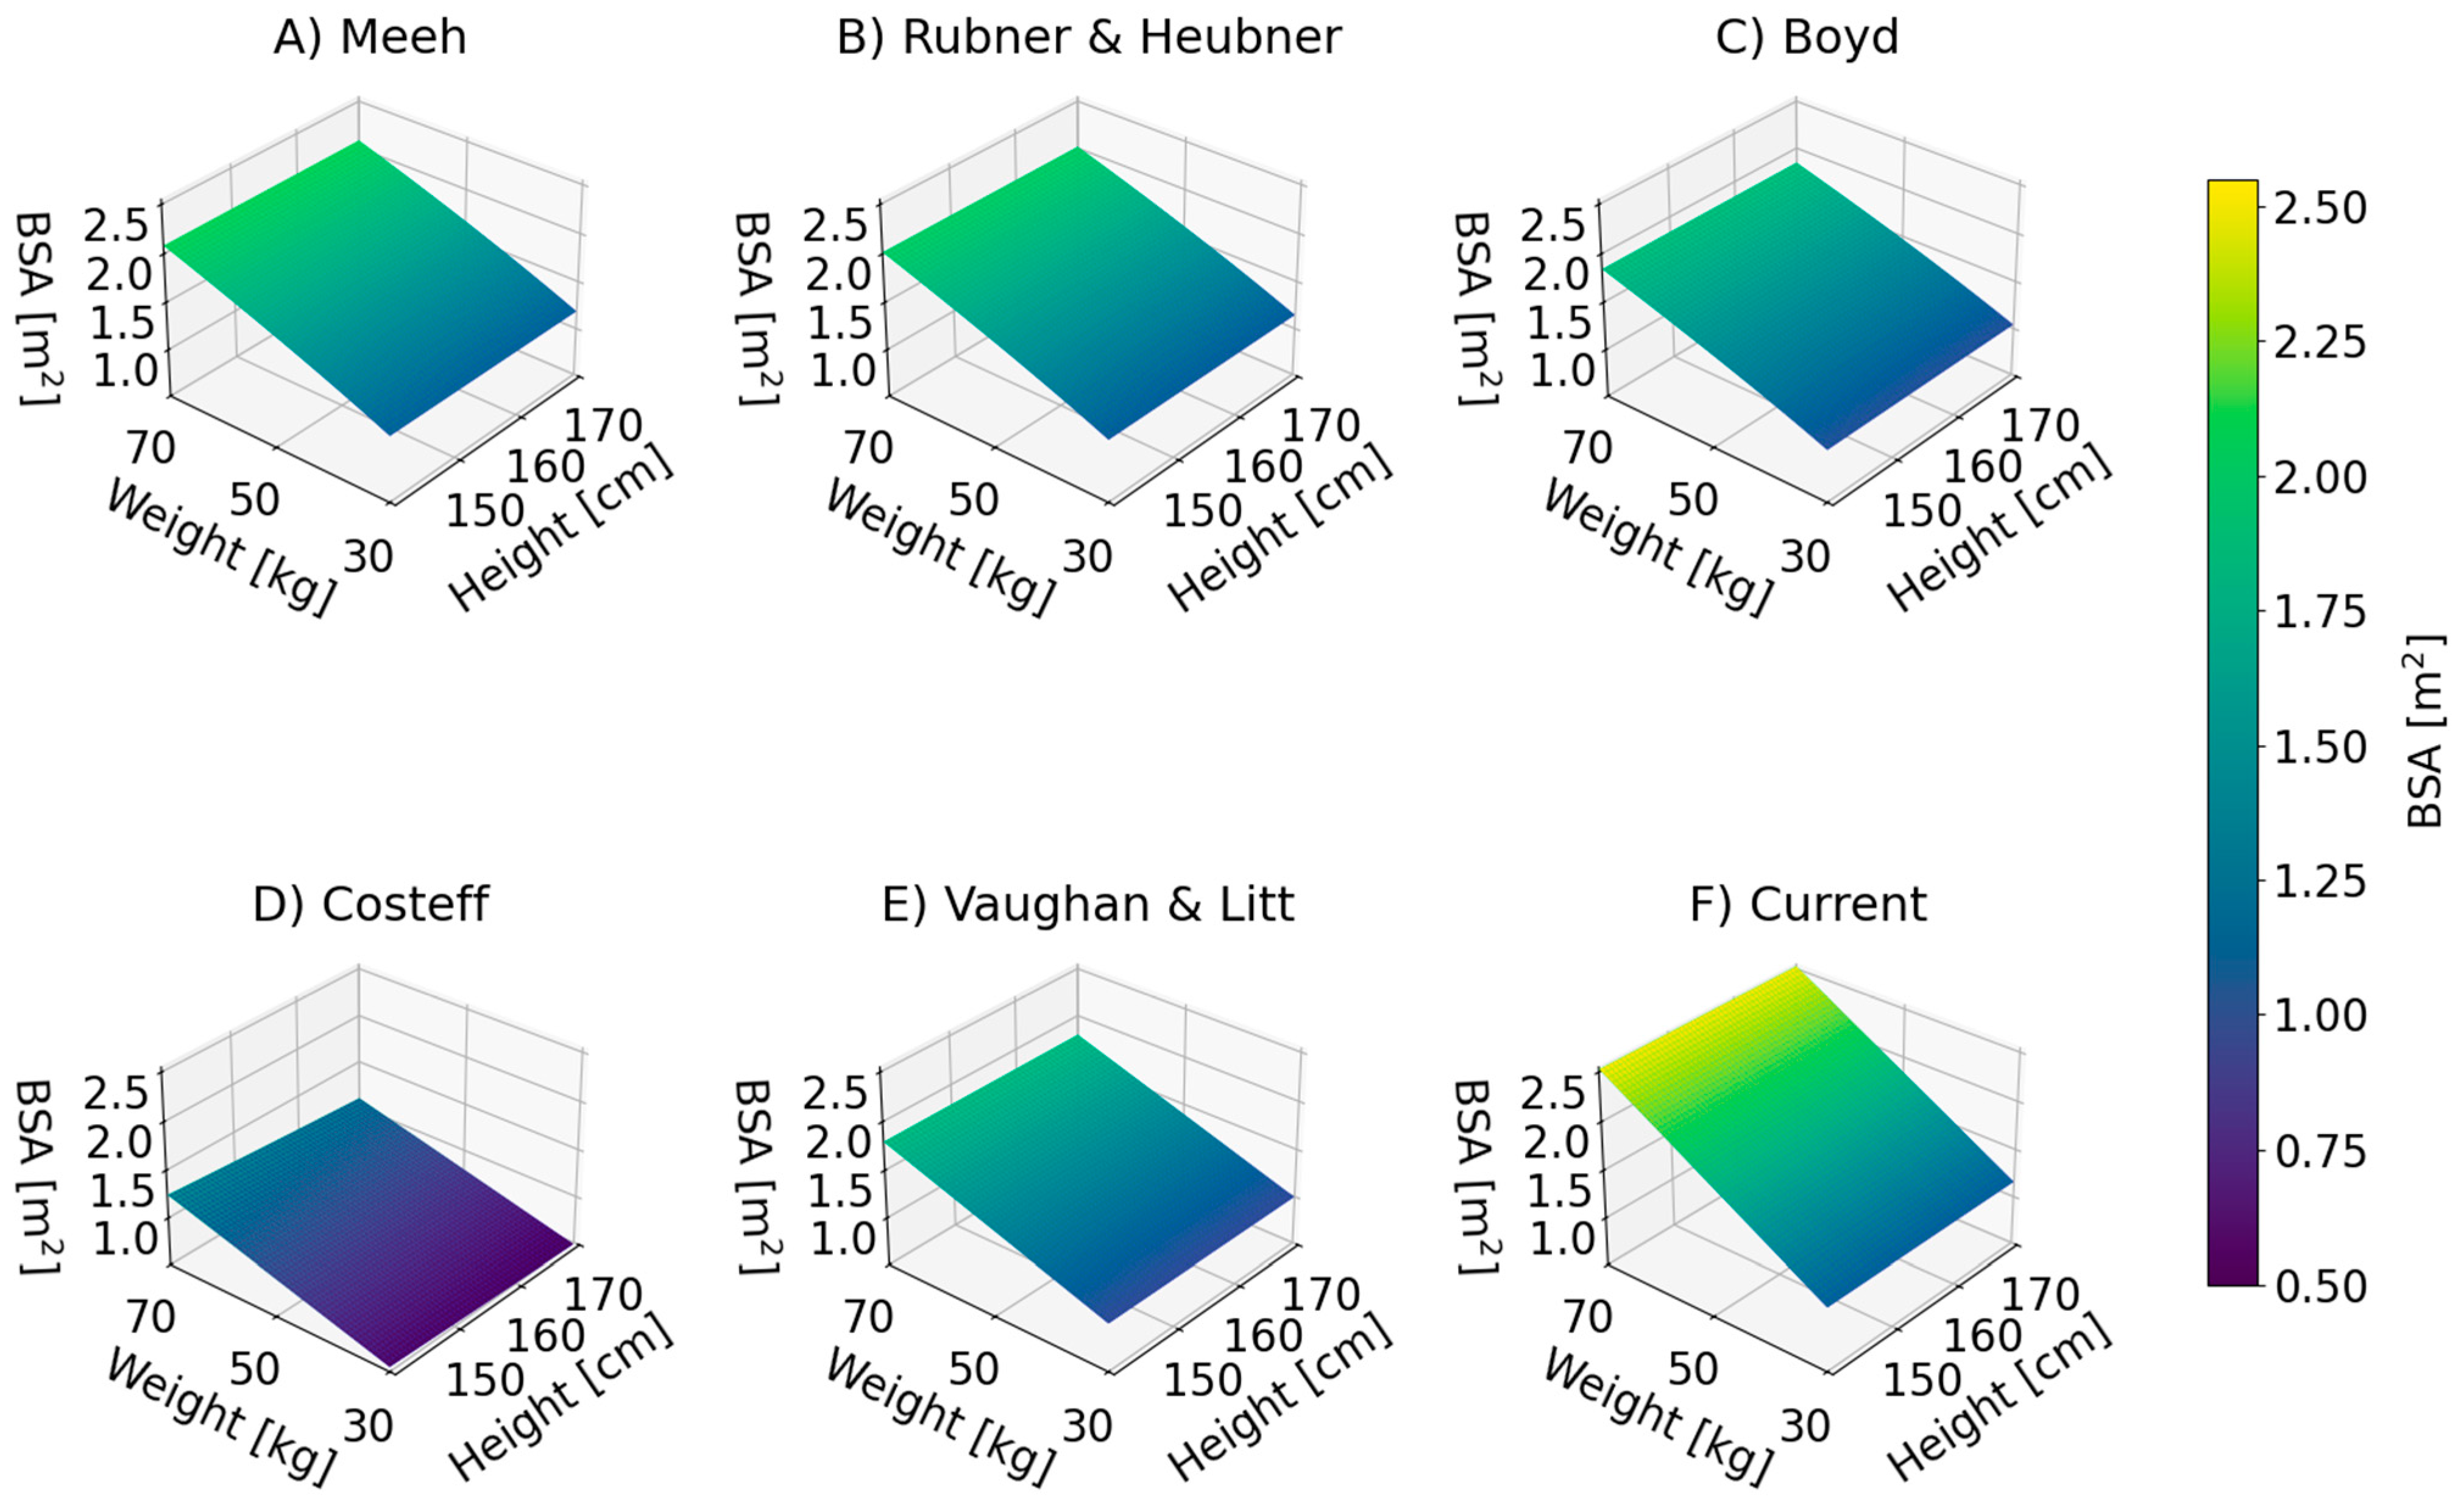
Figure 1. Examples of BSA surfaces for a 12-year-old child calculated by formulas taking into account only weight: (A) Meeh [14], (B) Rubner & Heubner [21], (C) Boyd [18], (D) Costeff [17], (E) Vaughan & Litt [25], (F) Current [26].
Applsci 15 12454 g001
Figure 2. Examples of BSA surfaces for a 12-year-old child calculated by formulae taking into account both weight and height: (A) Du Bois & Du Bois [4], (B) Rubner & Heubner [21], (C) Fujimoto et al. [15], (D) Haycock et al. [19], (E) Meban [23], (F) Mosteller [24].
Applsci 15 12454 g002
Figure 3. Comparison of the BSA change as a function of weight for a 12-year-old female with 150 cm height. The average weight (based on centile charts) for a 12-year-old girl is marked with a dotted line [4,14,15,17,18,19,21,23,24,25,26].
Applsci 15 12454 g003
Figure 4. Maximum discrepancy between the BSA values, represented by the extreme differences between two formulae: (A) for a 4-week-old, (B) for a 12-year-old.
Applsci 15 12454 g004
Figure 5. Dependence of statistical parameters on the age of patients: (A) RSD, (B) relative DSPmax.
Applsci 15 12454 g005
Table 1. A summary of detailed information on the most common methods of determining the body surface area (BSA) ratio for children. W indicates weight in kilograms, and H indicates height in centimetres.
No.AuthorsYearFormulaReference
1Meeh18790.123 × W2/3[14]
2Rubner & Heubner18980.119 × W2/3[21]
3Lissauer1903neonates: 0.103 × W2/3
toddlers: 0.1 × W2/3
[16]
4DuBois & DuBois19160.007184 × W0.425 × H0.725[4]
5Boyd19350.0004688 × (1000 × W) 0.8168−0.0154×log10(1000×W)[18]
6Banerjee & Bhattacharya19610.007 × W0.425 × H0.725[22]
7Costeff1966 4 × W + 7 W + 90 [17]
8Fujimoto et al.1968infants: 0.009568 × W0.473 × H0.655
1–5 years: 0.0381 × W0.423 × H0.362
over 6 years: 0.008883 × W0.444 × H0.663
[15]
9Haycock et al.19780.024265 × W0.5378 × H0.3964[19]
10Meban19830.00064954 × (1000 × W)0.562 × H0.32[23]
11Mosteller1987 W × H 3600 [24]
12Vaughan & Litt19870.02 × W +0.4[25]
13Current19980.03433 × W + 0.1321[26]
14Nwoye & AlShehri2005Neonates: 0.03614 × W0.529 × H0.294
Neonates (simplified): 0.042 × W + 0.074
[20]
Table 2. Discrepancies between dosage of oncological drugs in a 12-year-old girl with a height of 154 cm and a weight of 42.8 kg depending on the value of the BSA parameter.
DiseaseRegimenReferenceDrugTherapeutic Singular DosesDosageComments/Assumptions
MINAVGMAX
Wilms’ tumour
[45,46]
EE4A[45]vincristine1.5 mg/m21.884 mg2.078 mg2.4 mg
dactinomycin1.35 mg/m21.696 mg1.87 mg2.161 mg
DD4Avincristine1.5 mg/m21.884 mg2.078 mg2.4 mg
dactinomycin1.35 mg/m21.696 mg1.87 mg2.161 mg
doxorubicin40 mg/m250.24 mg55.4 mg64.04 mg
M[47]vincristine1.5 mg/m21.884 mg2.078 mg2.4 mgdosage of dactinomycin given in mg/kg
dactinomycin0.045 mg/kg1.935 mg
doxorubicin45 mg/m256.52 mg62.325 mg72.045 mg
cyclophosphamide440 mg/m2552.64 mg609.4 mg704.44 mg
etoposide100 mg/m2125.6 mg138.5 mg160.1 mg
RetinoblastomaVEC[48,49]vincristine1.5 mg/m21.884 mg2.078 mg2.4 mgunilateral, intraocular retinoblastoma
carboplatin560 mg/m2703.36 mg775.6 mg896.56 mg
etoposide100 mg/m2125.6 mg138.5 mg160.1 mg
Ewing sarcomaVDC-IE[50]vincristine1.4 mg/m21.758 mg1.939 mg2.241 mg
doxorubicin75 mg/m294.2 mg103.875 mg120.075 mg
cyclophosphamide1200 mg/m21507.2 mg1662 mg1921.2 mg
ifosfamide9 mg/m211.304 mg12.465 mg14.409 mg
etoposide500 mg/m2628 mg692.5 mg800.5 mg
NeuroblastomaIrEC[51]irinotecan100 mg/m2125.6 mg138.5 mg160.1 mg2nd line, proposed for relapse
etoposide100 mg/m2125.6 mg138.5 mg160.1 mg
carboplatin80 mg/m2100.48 mg110.8 mg128.08 mg
CEM[52]carboplatin800 mg/m21004.8 mg1108 mg1280.8 mgbone marrow conditioning before HSCT in high-risk neuroblastoma
etoposide500 mg/m2628 mg692.5 mg800.5 mg
melphalan70 mg/m287.92 mg96.95 mg112.07 mg
ALLEsPHALL + Berlin Frankfurt Munster[53]dexamethasone20 mg/m225.12 mg27.7 mg32.02 mgnot all drugs used simultaneously; not all of drugs used in all cycles
vincristine1.5 mg/m21.884 mg2.078 mg2.4 mg
methotrexate5000 mg/m26280 mg6925 mg8005 mg
cytarabine2000 mg/m22512 mg2770 mg3202 mg
L-asparaginase25.000 IU/m231400 IU34625 IU40025 IU
cyclophosphamide200 mg/m2251.2 mg277 mg320.2 mg
imatinib300 mg/m2376.8 mg415.5 mg480.3 mg
daunorubicin30 mg/m237.68 mg41.55 mg48.03 mg
ifosfamide800 mg/m21004.8 mg1108 mg1280.8 mg
MTX/6MP[54]methotrexate20 mg/m225.12 mg27.7 mg32.02 mgmaintenance regimen; different dosage variants
40 mg/m250.24 mg55.40 mg64.04 mg
6-mercaptopurine50 mg/m262.8 mg69.25 mg80.05 mg
75 mg/m294.2 mg103.875 mg120.075 mg
Note: The values in the table do not constitute a medical recommendation for the dosage of chemotherapeutics. The sole purpose is to document and visualise the dosage differences resulting from dose determination based on different (but dedicated for this purpose) BSA formulae. It is not recommended to rely on the above values in clinical practice.
Disclaimer/Publisher’s Note: The statements, opinions and data contained in all publications are solely those of the individual author(s) and contributor(s) and not of MDPI and/or the editor(s). MDPI and/or the editor(s) disclaim responsibility for any injury to people or property resulting from any ideas, methods, instructions or products referred to in the content.