


Abstract
Measuring solar irradiance helps maximize efficiency in photovoltaic power plants. Devices for detecting solar irradiance, such as pyranometers, are difficult to calibrate and extremely expensive. Given these limitations, they are rarely used in photovoltaic power plants. This study explores the feasibility of monitoring solar radiation using an FPGA and low-cost, ambient light and power sensors. The monitoring of irradiance and illuminance was graphed and stored in a software application. Unlike traditional monitoring systems, this approach directly measured the electrical power generated by the cell as a proxy for solar irradiance. To validate the accuracy of the system, the measurements obtained were compared with a professional reference pyranometer (INIFAP). Linear regression analysis showed a linear correlation (R2) of 0.8115 between the system measurements and the high-cost reference pyranometer. In addition, accuracy was quantified using the Root Mean Square Error (RMSE) of 21.68 W/m2. The regression slope showed an average photovoltaic conversion efficiency of 15.44% during the test period, validating the system as an accurate, linear, and reliable tool for monitoring irradiance.
1. Introduction
The measurement of solar radiation can be performed by applying different techniques, which are used in different areas of research such as human health, meteorology, and renewable energy, involving electricity generation and water heating systems [1]. For example, solar radiation sensors are used in solar greenhouse applications [2,3,4]. Measuring solar irradiance contributes to maximizing efficiency in photovoltaic (PV) power plants. Solar irradiance detection devices, such as pyranometers, are difficult to calibrate and are rarely used in PV power plants [5]. To try to solve these problems, indirect methods have been implemented to maximize efficiency and measurements of the current-voltage (I–V) curve of PV modules, as well as the estimation of solar irradiance using the Angstrom method, among other variants of the method [6,7].
Another alternative for the development of devices that measure solar irradiance can be a Field-Programmable Gate Array (FPGA). These devices allow for their Hardware (HW) to be configured, even dynamically, so they are usually used to perform highly complex processing tasks, which must have an adequate response in real time [8]. An FPGA allows HW to implement any peripheral or application-specific circuit and even allows one or several Central Processing Unit (CPU), all running in parallel. Therefore, it is a very versatile device, which allows for the implementation of very efficient and tailored digital electronic systems, compared to a classical CPU [9]. The advantages of FPGAs in terms of cost, size, and power consumption facilitate their use in different embedded system platforms [10,11]. Their evolution has led them to be used to reduce time and cost in the development of complex systems, as is the case of communications for satellites and spacecraft using high-speed protocols [12].
An FPGA is a HW device that is composed of programmable logic blocks (consisting of elements such as flip-flops and Look-Up Tables), plus I/O blocks for interaction with other devices. An FPGA also has programmable interconnects which connect the logic blocks, memory blocks for data storage, device-specific blocks designed for particular tasks, and I/O blocks. FPGAs are reconfigurable and can perform any logic and/or digital task, making them extremely versatile; their design and programming is carried out using HW description languages such as VHDL or Verilog [13]. Moreover, FPGAs allow HW/SW to perform a codesign of any system, for example, they have been used for High-Performance Computing (HPC) [14], glue logic [15], and interface developments [16,17].
In [5], Mancilla et al. present a solar irradiance sensor based on a Neural Network (NN) that was implemented in a low-cost embedded system controlled through an eight-bit PIC18F6627 microcontroller (MCU) (Chandler, AZ, USA) and a DS18B20 temperature sensor focused on tracking solar irradiance for the design of a PV power plant. Solar irradiance is a key parameter for tracking the Maximum Power Point (MPP) in PV power plants. This is because the operating point at which a photovoltaic array delivers its maximum power depends on both solar irradiance and cell temperature. In [5] these parameters were measured to calculate the MPP in order to obtain maximum efficiency, forcing the photovoltaic array to operate at that point. The operating point of the PV field was regulated by adjusting the duty cycle of the power converter connected to the output of the field, so different algorithms were developed for that purpose and performed the Maximum Power Point Tracker (MPPT) function, avoiding a direct measurement of the solar irradiance.
In [18], Hishikawa et al. lay out a method to measure the outdoor I-V curve from crystalline silicon PV modules to monitor solar irradiance, using a PV module irradiance sensor (PVMS,), with a sampling period of 0.2–0.5 s., and filtered the data affected by the spatial uniformity of irradiance; the reproducibility of circuit current (Isc)/irradiance G was measured with a PVMS (GPVMS) and maximum power (Pmax)/GPVMS was obtained with a relative standard deviation σ of 0.21–0.23% and 0.24–0.42%, respectively, even on partly sunny and cloudy days when the solar irradiance was unstable.
In [19], Achleitner et al. predicted solar irradiance, using a wireless sensor network, which consisted of a Gateway Time-Synchronizer (GTS) node and several Solar Irradiance Motes (SIMs). The GTS node consisted of a Crossbow MICAz connected to the sensor on a Nemsic MTS420/400CC board (San Jose, CA, USA). Control was provided by the low-power ATmega128L MCU (Chandler, AZ, USA) and wireless communication was provided by the Texas Instruments CC2420 radio (Dallas, TX, USA). The MICAz connected to an MTS420/400CC module containing a GPS receiver and other sensors via the 51-pin expansion connector. It was connected to a Raspberry Pi desktop computer (Pencoed, UK) via a serial connection. The sensor node had an 8-channel 12-bit analog-to-digital converter (ADC). The solar irradiance sensors were interfaced with the ADC inputs of the node.
The choice of an FPGA for this system is based on fundamental advantages for real-time instrumentation applications:
- True Parallelism: The FPGA architecture allows for true parallelism, unlike a microcontroller that executes tasks sequentially. Sensor reading and communication entities can operate simultaneously and independently. This ensures strict temporal determinism and eliminates latency (jitter) that could be introduced in a sequential system when handling multiple sensors.
- Scalability and Flexibility: The design is inherently scalable. If you wanted to expand a system to monitor multiple solar cells simultaneously (e.g., for mismatch or soiling studies), the FPGA architecture allows you to instantiate the necessary measurement entities in parallel. In contrast, in a microcontroller, this would create a processing bottleneck.
- Design Paradigm (HW vs. SW): Finally, this work proposes a hardware-embedded (HW) solution, where the signal processing logic is implemented directly in the programmable logic, offering a robust, high-speed solution that does not depend on a software cycle.
This paper presents a sensing system for measuring and monitoring solar radiation using low-cost sensors, implemented in a Spartan-3E FPGA using VHDL description. The system integrates the control and communication of a power sensor (INA260) (Dallas, TX, USA) and an illuminance sensor (TSL2591) (Premstaetten, Austria), whose measurements are compared with those obtained from a reference pyranometer, recording a coefficient of determination (R2) of 0.8115. The FPGA is responsible for controlling and configuring the sensors, as well as managing the I2C and UART communication protocols through finite state machines, allowing for stable, real-time operation. The processed data is displayed in an application that shows the measurements using graphs, facilitating the monitoring and analysis of solar radiation under different lighting conditions. This architecture takes advantage of the parallelism and temporal determinism capabilities of the FPGA to achieve an efficient, reconfigurable, and low-cost system.
This paper is structured as follows: Section 2 emphasizes previous related work. Section 3 describes the design materials and methods. Section 4 presents the experimental results of the implementation of the Solar Radiation Sensing and Measurement System on an FPGA, and finally, the conclusions are presented in Section 5.
2. Related Work
The irradiance sensor is the instrument that measures the incident solar energy per unit area, usually expressed as W/m2, it is essential to know the total incident solar energy at a given location and to analyze the performance of PV systems [7]. One of the main sources of non-polluting and free energy is and will continue to be, for many years to come, the Sun. Therefore, a cornerstone in research is to know how to take advantage of this energy [20]. To measure solar energy, there is a need for sensors to determine irradiance and these must be accurate [21]. The efficiency of solar cells depends directly on the characteristics of their operation; therefore, estimating the parameters of solar cells is a critical task [22]. The innovation and evolution of solar radiation and irradiance estimation has historically relied on expensive pyranometers [23]. The large amount of investment in research and development of PV technology is trying to make this technology affordable and economically feasible. Reducing the economic cost of PV modules has globalized their use in order to develop sustainable technologies [24]. There are manufacturers that have developed sensors to measure irradiance in PV applications. Of course, the cost of the sensors is determined by the design, the calibration procedure, and the characterization performed. In general, irradiance sensors are usually lightweight, flexible, and require little electrical power to operate, so that they can be installed under any conditions [7].
In different works, several irradiance sensors have been characterized with the objective of determining the accuracy ranges and possible deviations or errors in measures. For example, Driesse et al. in [25] characterize some irradiance sensors with the objective of determining their sensitivity, concluding that it influences the measure error in a systematic way. In addition, they state that the measures of reference PV cells can deviate due to the mismatch in their response spectra. Something similar was performed by Vignola et al. in [26], comparing pyranometers and reference PV cells, obtaining approximately ±10% deviation. They determined that the reference PV cells performed better in clear sky conditions, with the disadvantage that the deviation increases in cloudy sky conditions, all of this was in comparison with pyranometers. Similarly in recent times, in [27] Lorente et al. performed an evaluation of the accuracy of low-cost solar radiation measurement tools installed in several meteorological stations. In addition, they developed a calibration model based on sensor temperature, solar zenith angle, and clear sky index, with the aim of increasing accuracy.
Also, something that has been tried to be developed are functions, architectures, models or algorithms that require a minimum number of sensor inputs and increase the estimation accuracy [7]. In [28], Kohno et al. developed an architecture based on a PV module, measuring Direct Current (DC) voltage and current in a PV inverter, to try to reduce costs in the implementation, operation, and maintenance of PV power plants. In [29], Scolari et al. proposed to calculate the maximum power of a PV plant from the indirect estimation of irradiance. The analysis was performed based on DC voltage, current, and temperature measurements, in the cell, to develop a model of the PV array, and to try to demonstrate that a simple detection system can overcome pyranometer-based estimations. In [30], Cristaldi et al. used low-cost solar irradiance sensors and applied algebraic equations to determine the I-V relationship of a PV cell. In addition, they used a pyrometer in order to obtain the necessary parameters to implement an MPPT algorithm. Tan et al., in [31], estimated the solar irradiance with admissible accuracy by measuring the current of a PV module. Da Costa et al., in [20], estimated the irradiance by measuring current and voltage of a PV module, showing results by simulation, and determining that the prediction was apt.
Different MCUs combined with various electronic components and sensors for PVs implementations are also used in irradiance estimation [21]. For example, Mancilla et al., in [5], infer the irradiance by measurements on DC electronic devices and an NN implemented in an MCU. Performing real-time measurements to estimate the maximum PV generation was a key factor that allowed the realization of robust control systems capable of reach the safe operation of power distribution networks with PV plants [32,33]. An important factor in the development and evaluation of solar energy systems is to obtain accurate radiation measurements [21]. Li Vigni et al., in [34], performed real-time irradiance estimation through measurements on DC electronic devices, with the problem that the procedure required the devices to switch between three different phases (low load, short circuit, and open circuit); this procedure is not usual in commercial PV systems.
Solar irradiance estimation allows for optimal PV energy management. The problem is that current irradiance estimation devices are very expensive [35]. In contrast, there are low-cost and low-power consumption FPGAs, which have inherent advantages such as flexibility and parallel execution capability for real-time processing and high performance, which avoids bottlenecks generated in the execution by Software (SW) [36]. For example, Oliveri et al. in [35] presented two virtual irradiance sensors implemented in an FPGA, the results obtained were contrasted with those measured by an expensive commercial pyranometer, obtaining that they were relatively similar. The architecture implemented in the FPGA allowed the estimation of the irradiance in real time, obtaining information from several low-cost electronic devices located in the PV modules. The results were validated by comparing them with those from a renewable energy laboratory [35]. Compared to the analyzed publications, this work focuses on the portable description of a solar radiation estimation system for implementation on low-cost, low-power FPGAs using low-cost sensors. The novelty of this work lies in integrating the real-time acquisition, processing, and comparison of data from a power sensor (INA260) and an illuminance sensor (TSL2591) into a single device, correlated with a reference pyranometer, achieving an RMSE of 21.68 W/m2. The regression slope showed an average photovoltaic conversion efficiency of 15.44% during the test period.
3. Materials and Design Methodology
An FPGA was used in this work for several technical and performance reasons, primarily efficiency, cost, and performance criteria. FPGAs offer a low-cost solution with reduced energy consumption, making them ideal for continuous monitoring systems such as the one proposed. They also allow the implementation of a sensor acquisition and control system using parallel processing architectures, which improves efficiency by simultaneously executing configuration, control, and communication tasks. FPGAs execute multiple operations simultaneously, improving response speed and reducing latency in communication with other devices, which facilitates their use in monitoring applications. Likewise, the description using finite state machines (FSM) provides deterministic and stable control over communication protocols, such as I2C and UART, ensuring accurate synchronization in data transfer. These features make the FPGA an efficient and flexible alternative for environmental sensing applications, offering an adequate balance between performance, consumption, and cost.
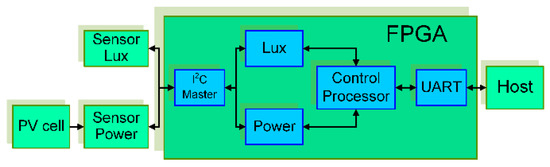
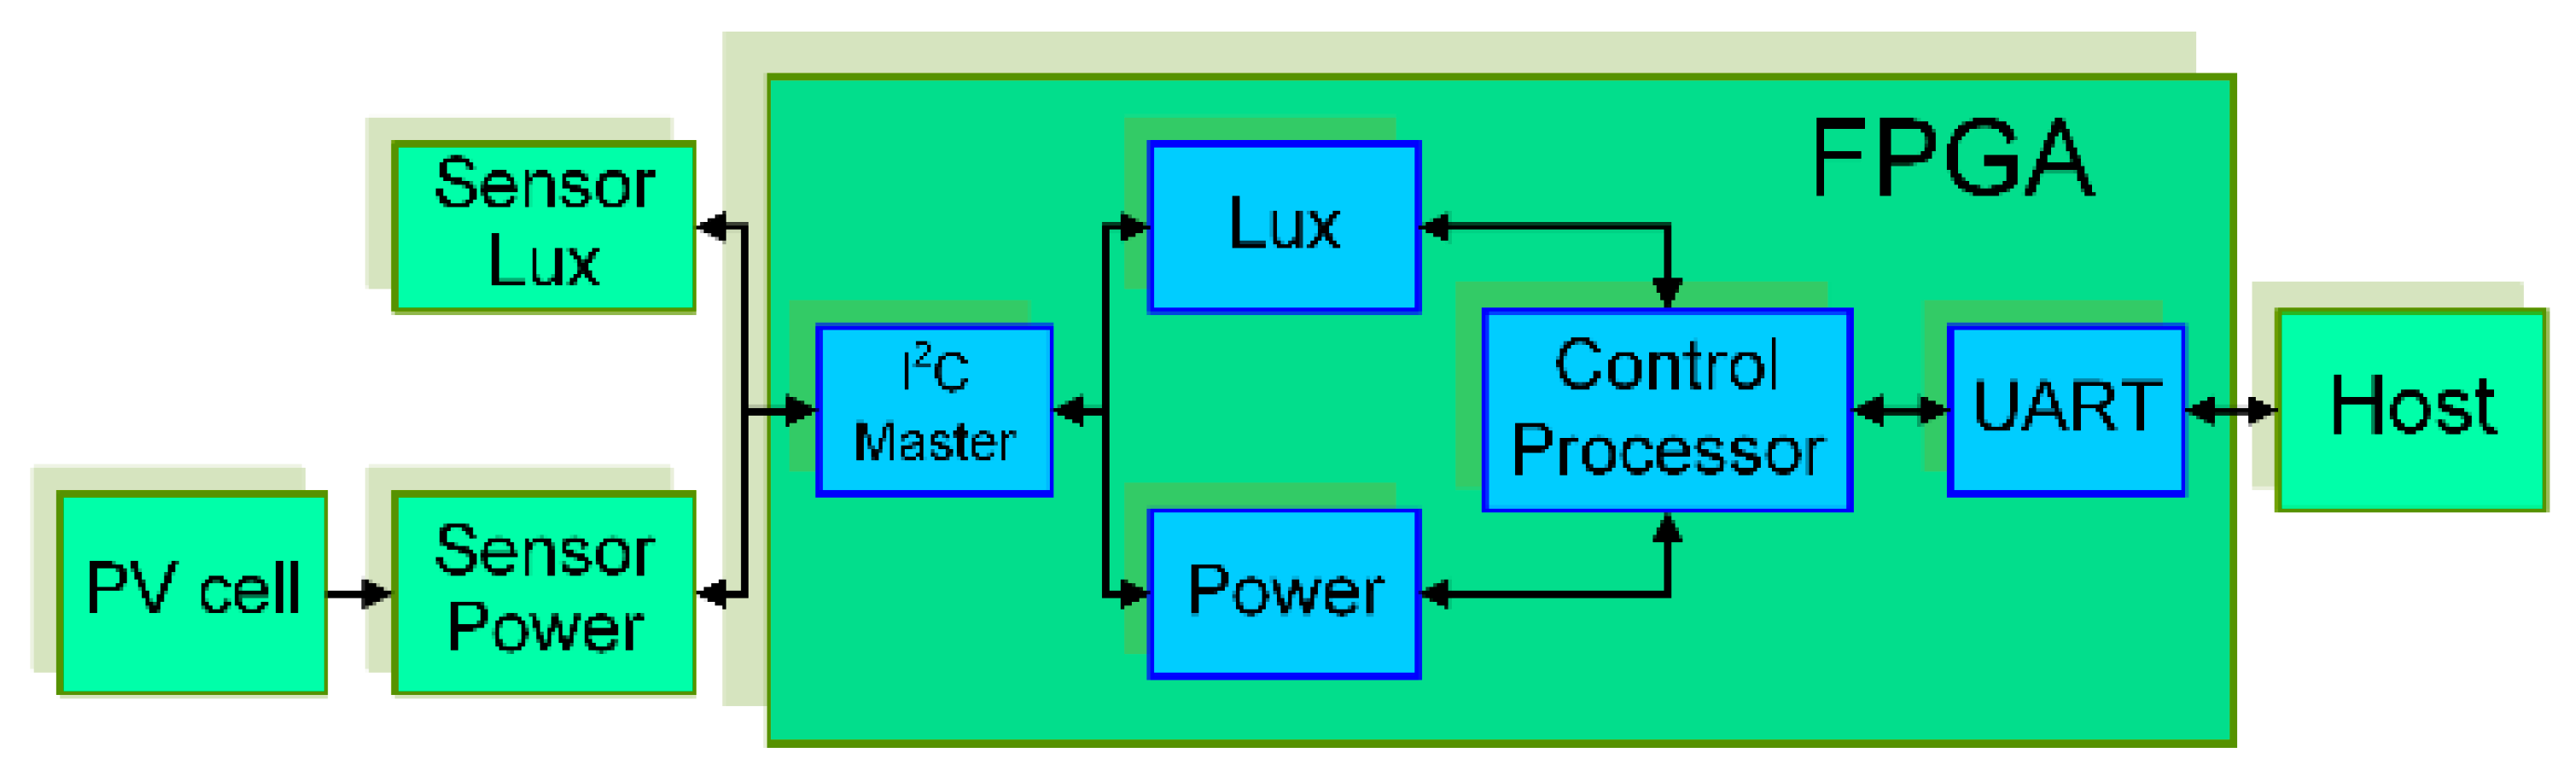
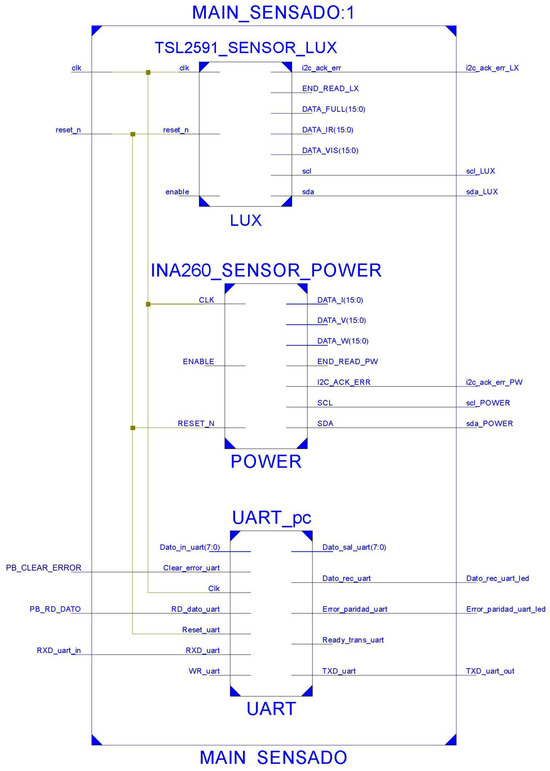
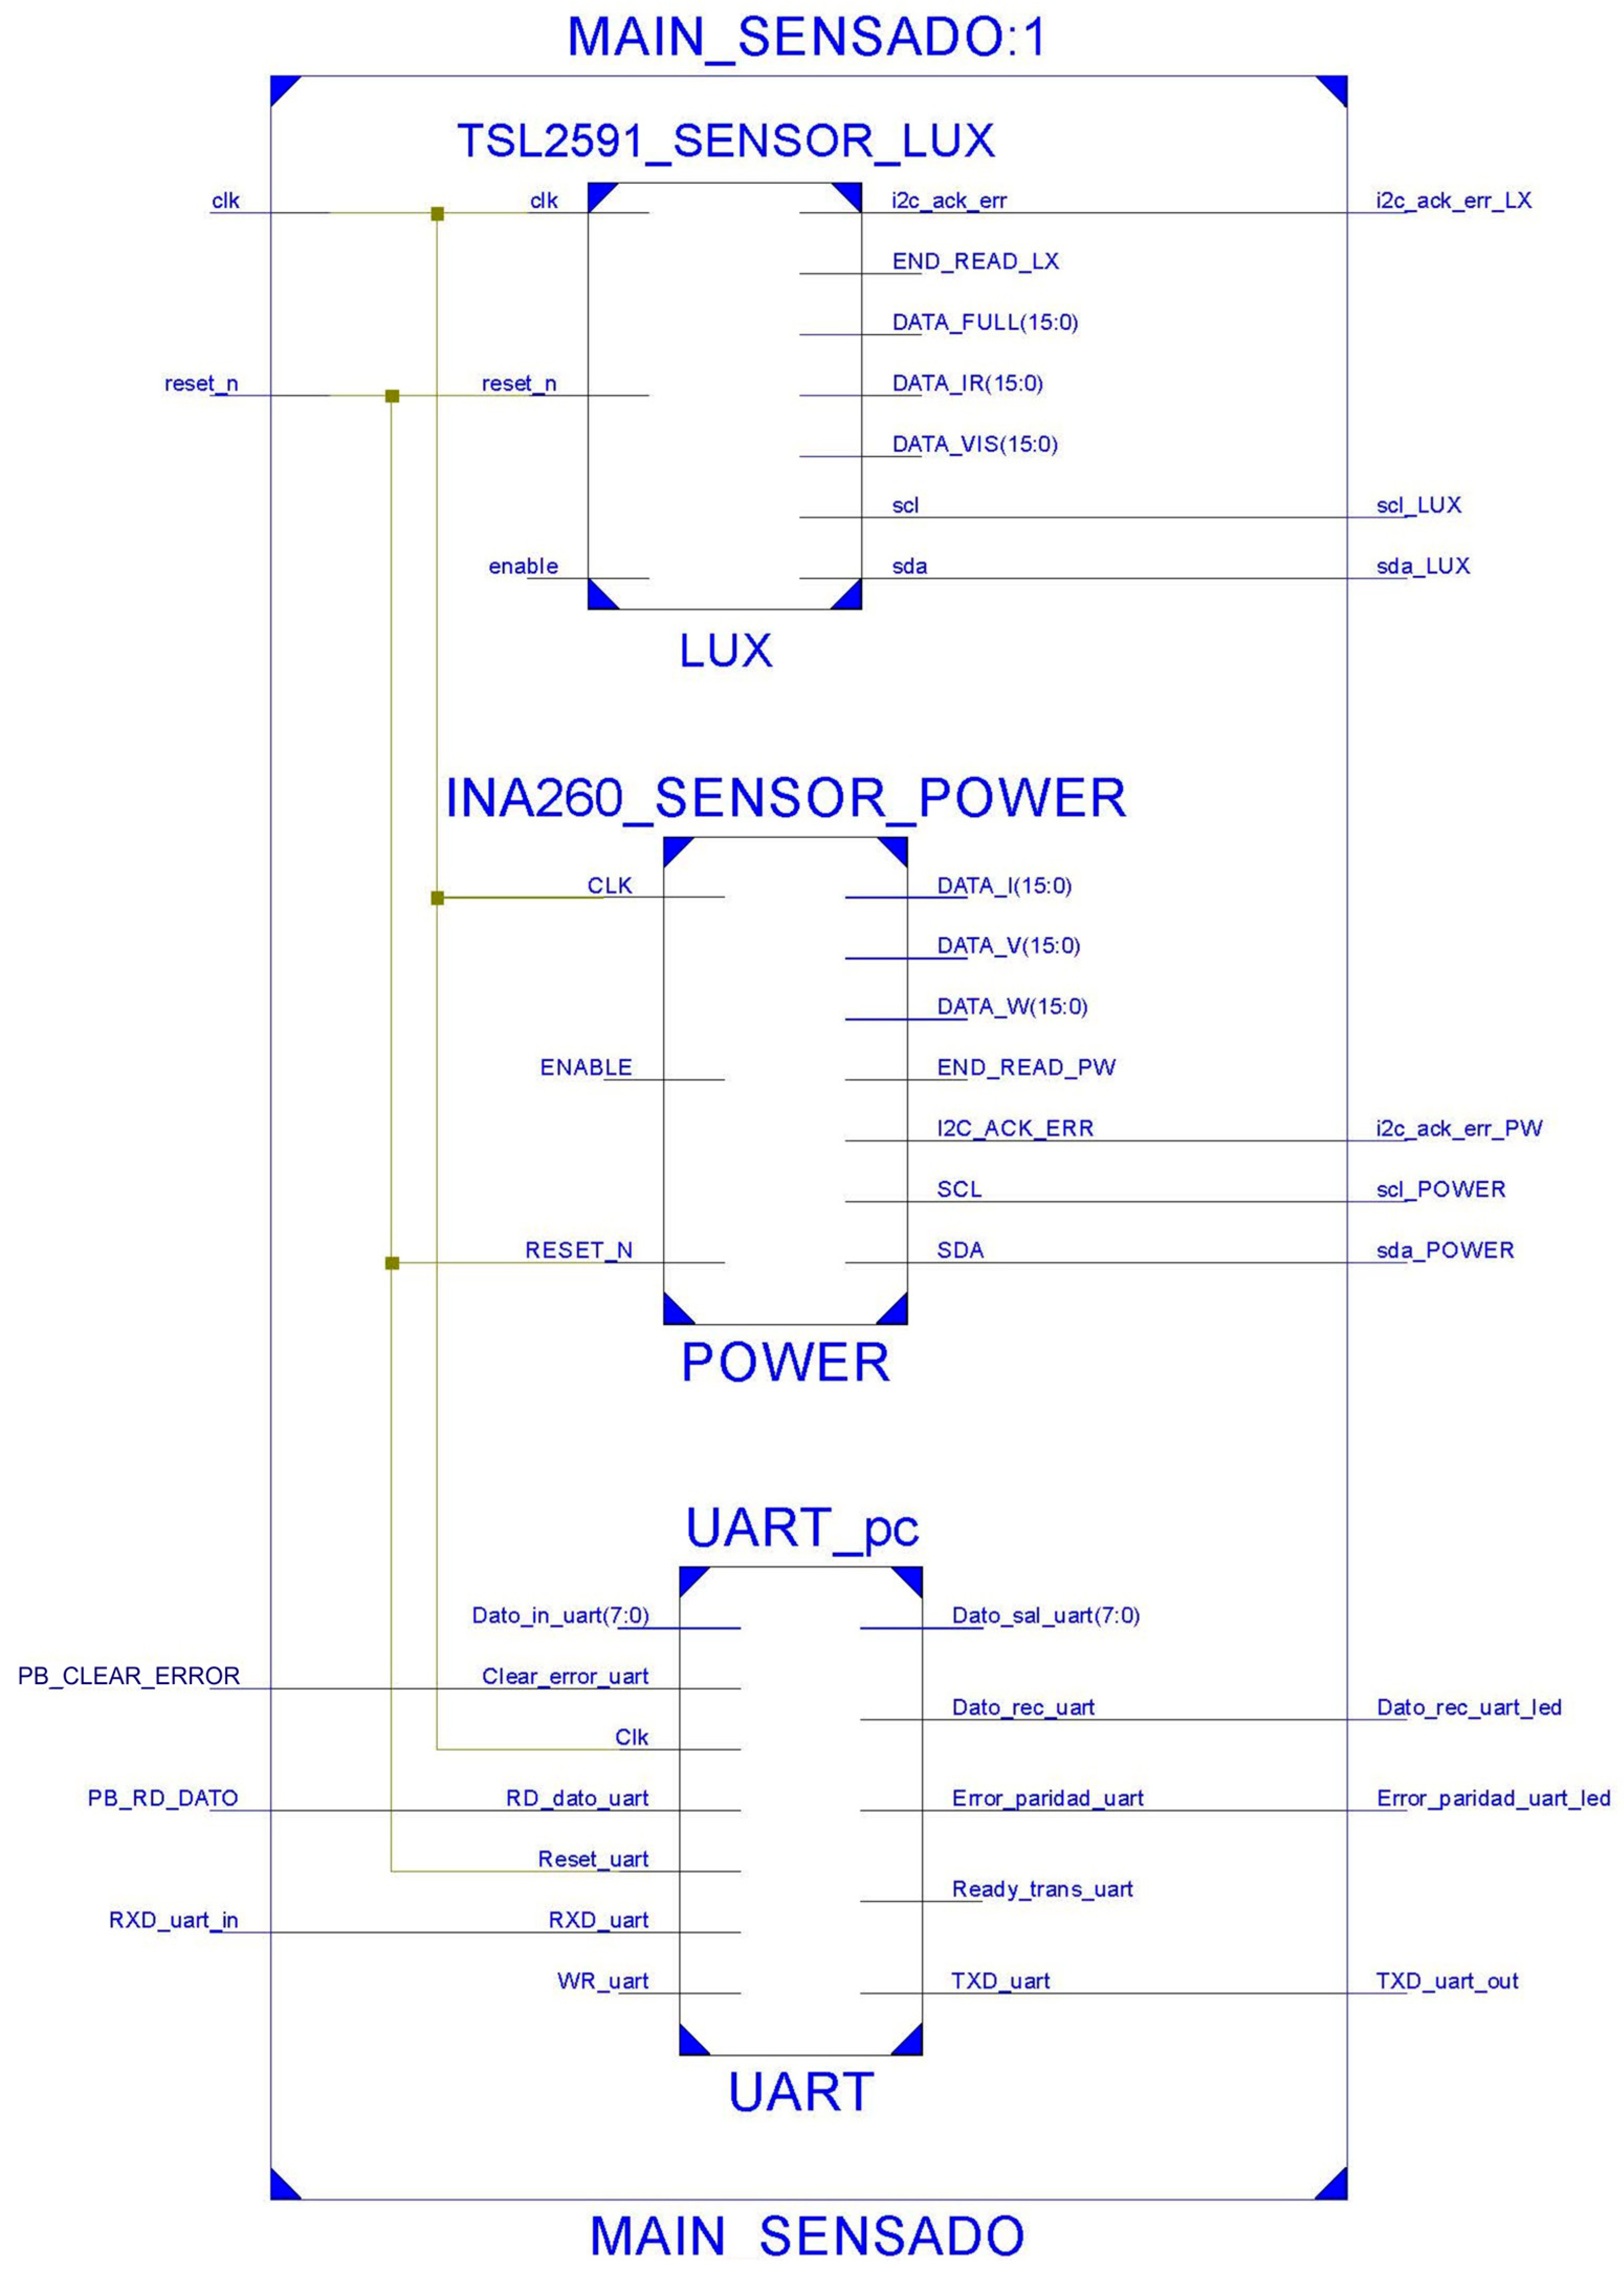
The design of the system to estimate solar radiation in FPGA-Based, was performed under the analysis and description of the Algorithmic State Machine (ASM) for each sensor and the control unit. In Figure 1 shows the block diagram of the connection between the sensors, the FPGA and the Host. On the left side there are three blocks representing the “Lux” sensor TSL2591, the “Power” sensor INA260 and the PV cell. In the central part is the FPGA block, which describes and implements the necessary entities for sensor communication, general control, and the Universal Asynchronous Receiver-Transmitter (UART) communications interface for easy connection to any device and/or peripheral. Finally, on the right side is the block that identifies the Host which executes the visual application. Figure 2 shows a schematic diagram of the system, which includes the modules responsible for communication and control of the sensors used in this work.
Figure 1.
Block diagram for the FPGA-based monitoring system.
Figure 2.
Schematic diagram of the FPGA-based solar radiation monitoring system.
3.1. Analysis
Regarding the data sampling rate, the system captures a sample every 3 s, taking into account that a sample consists of the sensing of six values: the three values obtained by the TSL2591 sensor and the three values obtained by the INA260 sensor. This speed is optimal to preserve the integrity of the data and to perform the communication with the Host correctly. For the Lux calculation, Equation (1) was used from the values captured by the TSL2591 sensor. Equation (1) was determined by the sensor manufacturer [37]. The conversion from Lux to W/m2 was performed using a unique conversion factor for the 555 nm band based on Equation (2).
A sampling rate of 3 s was established as an optimal balance between temporal resolution and system requirements. Although the sensors and FPGA are capable of faster rates, solar irradiance is a phenomenon that generally does not undergo significant changes on sub-second scales (except for the rapid passage of clouds).
Furthermore, this 3 s interval aligns with the conversion times of the sensors’ ADCs and the number of averages configured, ensuring that a stable, averaged sample was captured while avoiding bottlenecks in data transmission via UART to the host application.
The calculation of W/m2 was performed using Equation (3), from the data captured by the INA260 sensor, by multiplying 10,000 by the result of the division of the power value by the area of the PV cell. The conversion from W/m2 to Lux was performed based on Equation (2). The execution of the three equations necessary for the Lux calculation, the conversion of Lux to W/m2, and the calculation of W/m2 were performed at runtime of the visual application program, after the sensing.
To perform the configuration and communication between the sensors and the FPGA, the operation of the sensors was analyzed by reviewing their respective characteristics. It was detected that in both sensors the communication was performed through the inter-integrated circuit protocol (I2C), so it was necessary to develop and implement an ASM capable of controlling such communication for each sensor. The configuration of the sensors was performed by means of registers. The registers activated the sensor power on, controlled the transfer rate and frequency, gain, and other parameters.
The TSL2591 sensor had two photodiodes, “CH0” was the broad spectrum (visible plus infrared) and “CH1” was the infrared spectrum, they sensed using a technique called light integration to accurately measure the amount of light incident on the two photodiodes over a given period of time. The sensor accumulated the incident light and converted it into a proportional current. In addition, it also had two ADCs, which transform the light intensity into a digital output with 16-bit resolution, in order to convert the current to represent it as irradiance. The “CH0 Data” and “CH1 Data” registers stored the values coming from the ADCs for each channel through the control register (ALS Control). The two photodiodes allowed the extraction of visible light, which was obtained from the difference in the broad spectrum between the infrared spectrum, which was required for the operation of the PV panels.
The INA260 sensor had the “Current Register” and “Voltage Register” registers that were used to store the current and voltage values coming from the 16-bit ADC that was connected to these registers. In addition, it had an internal multiplier that took the values from the outputs of the “Current Register” and “Voltage Register” registers in order to obtain the power, and the resulting value was stored in the “Power Register” register. The INA260 sensor was connected in series with the resistive circuit that measured the power. The INA260 used a measurement principle based on integrated shunt resistor technology, which had a value of 2 mΩ that, in conjunction with the high-resolution ADC allowed measurements of 1.5 mA to be obtained for each voltage sample flowing through this resistor. With the ADC and the shunt resistor, the current value was obtained. PV cells were responsible for extracting the existing energy in solar radiation and converting it into electrical energy, this was the result of the transfer of energized electrons (by solar radiation incident on them) from the valence band to the conduction band, leaving a free energy state (called a gap) in the valence band [37]. The solar PV cell used in this work had dimensions of 138 × 160 mm, and was constructed of a monocrystalline material which had a high efficiency of solar energy transformation that was 17%, providing a power of 3 Watts, a current of 540 mA, a voltage of 5.5 V, and a maximum charging voltage of 6.4 V [38].
Table 1 shows the analysis of the TSL2591 and INA260 sensors, which obtain the illuminance and power values, respectively.
Table 1.
Comparison of the characteristics of the TSL2591 and INA260 sensors.
After determining the characteristics of the sensors and the solar PV cell, the control, configuration and communication system of the sensors was designed by describing the necessary entities for its implementation in the FPGA. In this work, the development of descriptive HW language for the I2C and UART entities was of utmost importance, given the need for communication between the sensors and the FPGA. This is because the FPGA configures and synchronizes the sensors, collects the sensed information, controls the sampling time, and sends the data to the GUI.
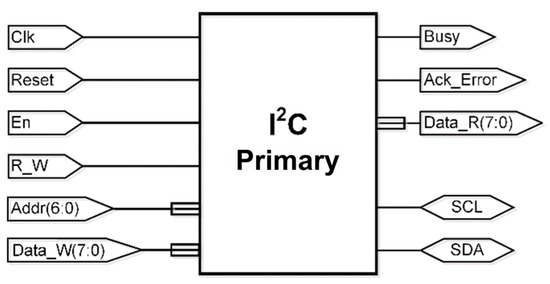
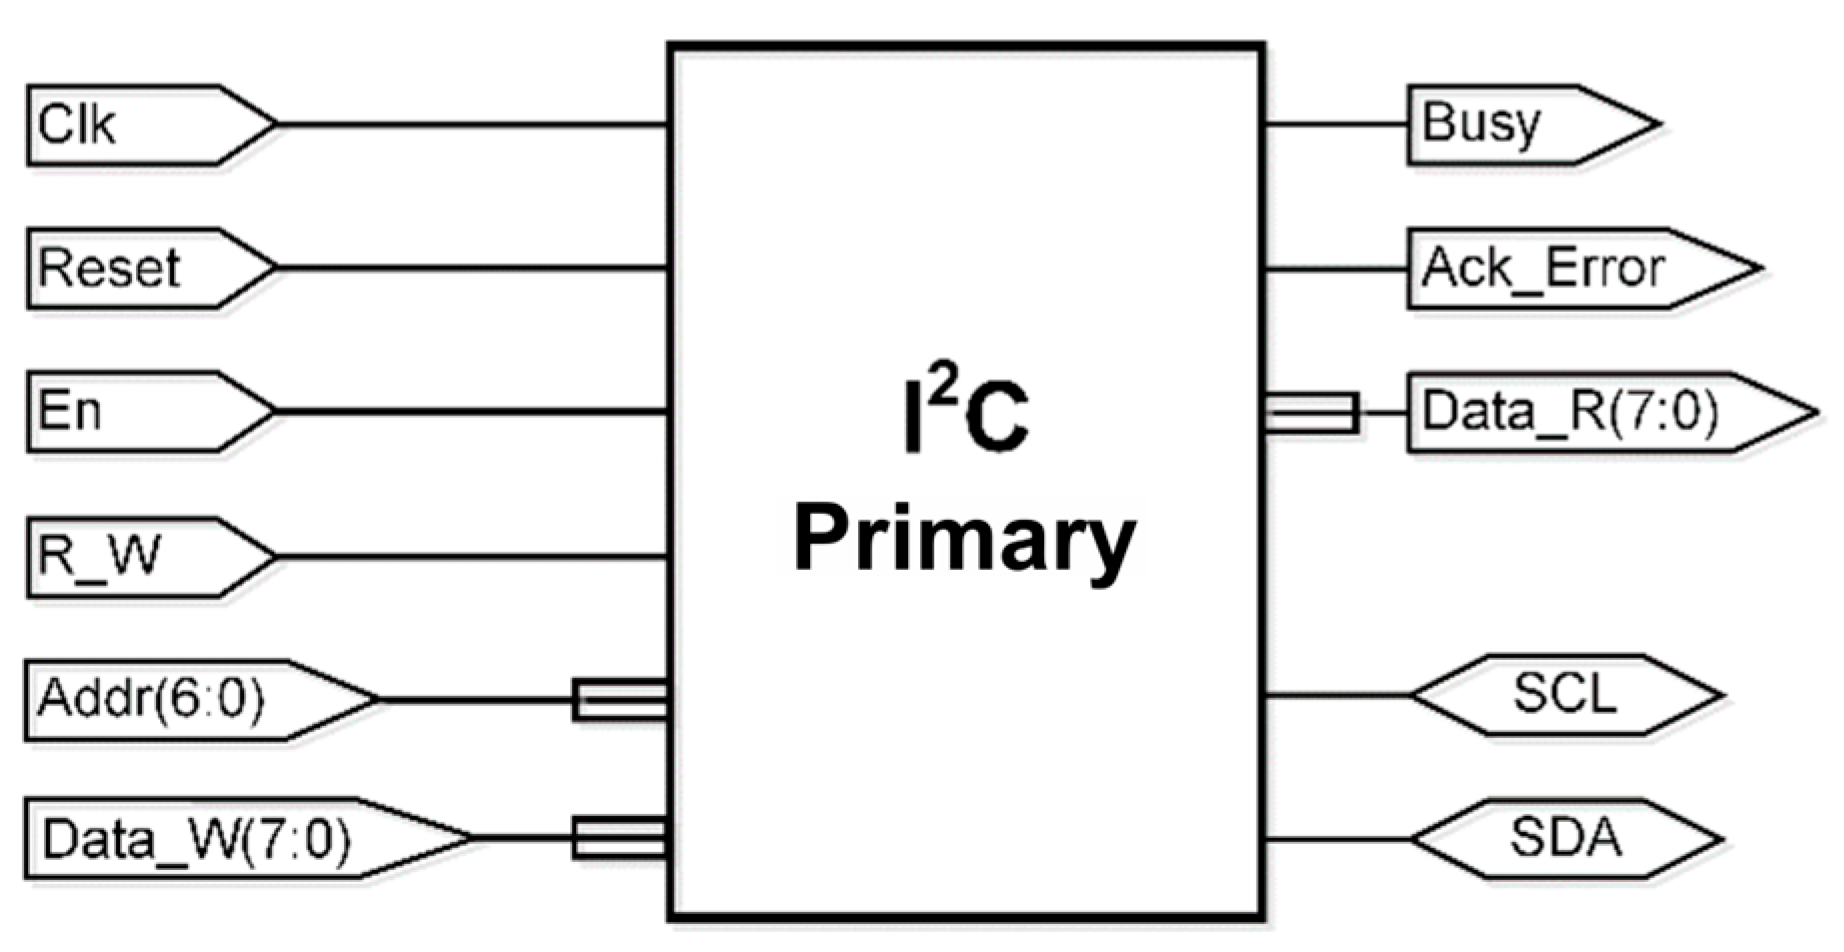
The communication of the FPGA with the sensors was performed through the I2C interface, for which an entity was designed to perform this function as a “primary” module, having the sensors as a “secondary” module. In Figure 3. the entity “I2C Primary” based on the IP published in [39] with the necessary adaptations to use it in this work and implement it in the FPGA.
Figure 3.
Entity “I2C Primary”.
The three-state buffer is an essential component in a bidirectional port configuration, which allows efficient utilization of a physical input/output (I/O) pin. In this configuration, the “dir” signal determines the direction of signal flow on the bidirectional pin. With the “dir” signal at ‘0’, the three-state buffer takes a high-impedance state, thus blocking the output signal. In this case, the pin becomes an input port and channels the input signal to the output signal. On the other hand, when the “dir” signal is ‘1’, the pin becomes an output port, routing the output signal to an external circuit. It is essential to note that, in order to achieve this bidirectional behavior, the port must be configured in the “inout” mode [40].
For the specific case of the Xilinx Spartan-3E device, it only has a three-state buffer in the I/O block (IOB) of a physical pin. This implies that only the I/O ports linked to the physical pins of an FPGA device can use the three-state buffer [40].
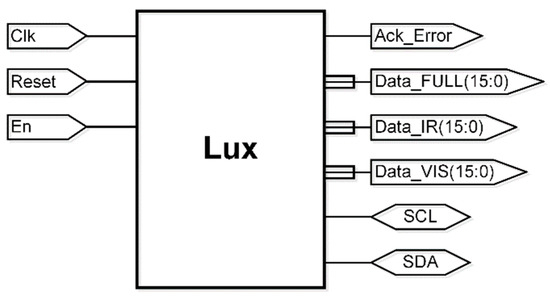
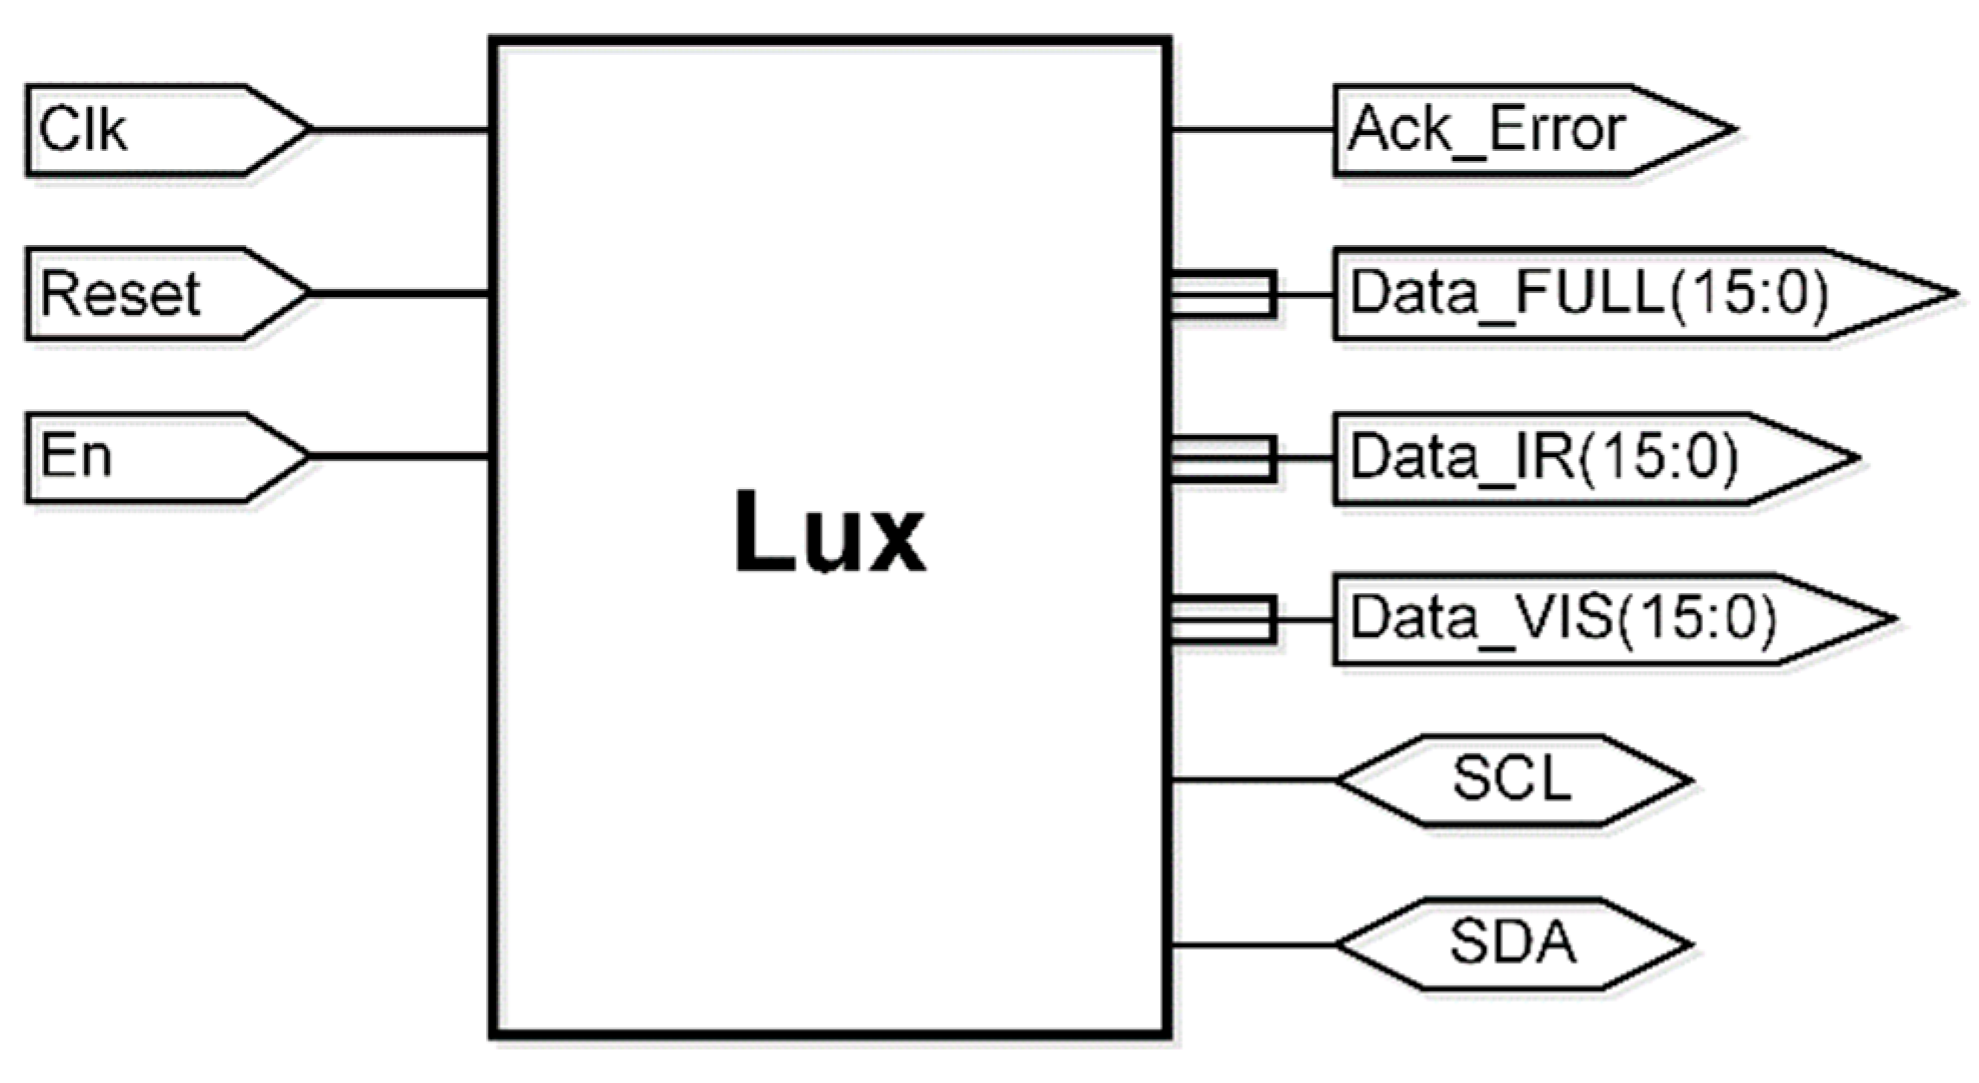
Figure 4 shows the entity in charge of controlling and configuring the TSL2591 sensor. The “Lux” entity configures the gain of the photodiodes and the sampling time of the sensor (called integration time), it has three inputs and five outputs.
Figure 4.
“Lux” entity.
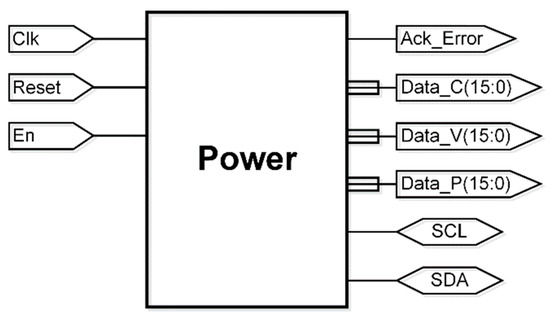
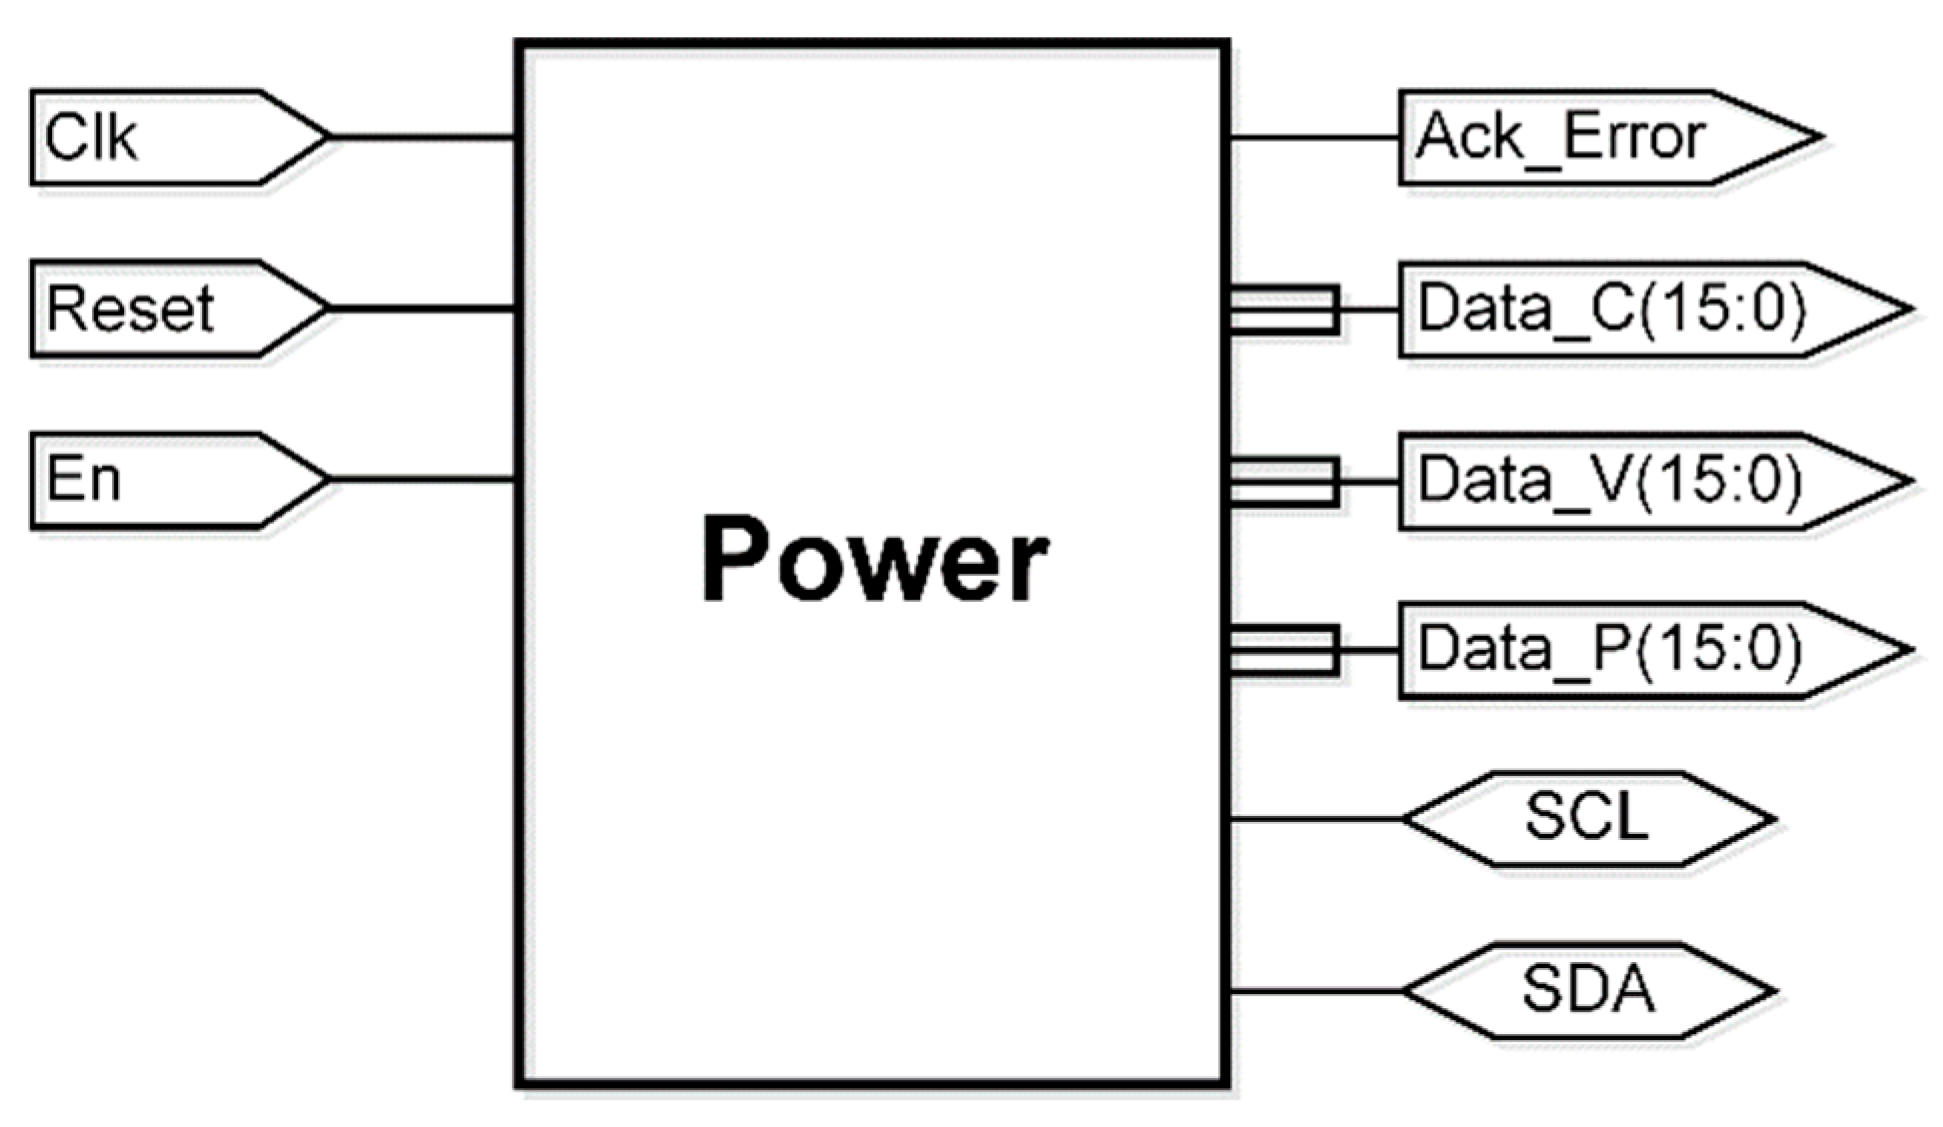
Figure 5 shows the entity that performs the configuration and control of the INA260 sensor. The “Power” entity configures the number of samples to be sensed, with which it generates an average for each current, voltage, and power value, in addition to configuring the ADC conversion times of the sensor. The entity has three inputs and six outputs.
Figure 5.
“Power” entity.
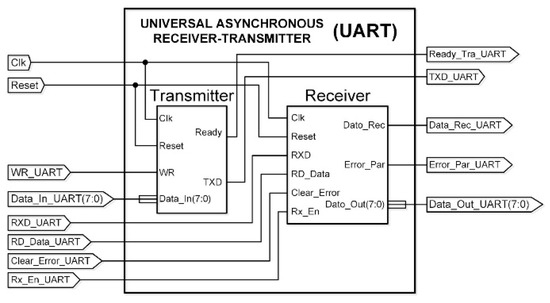
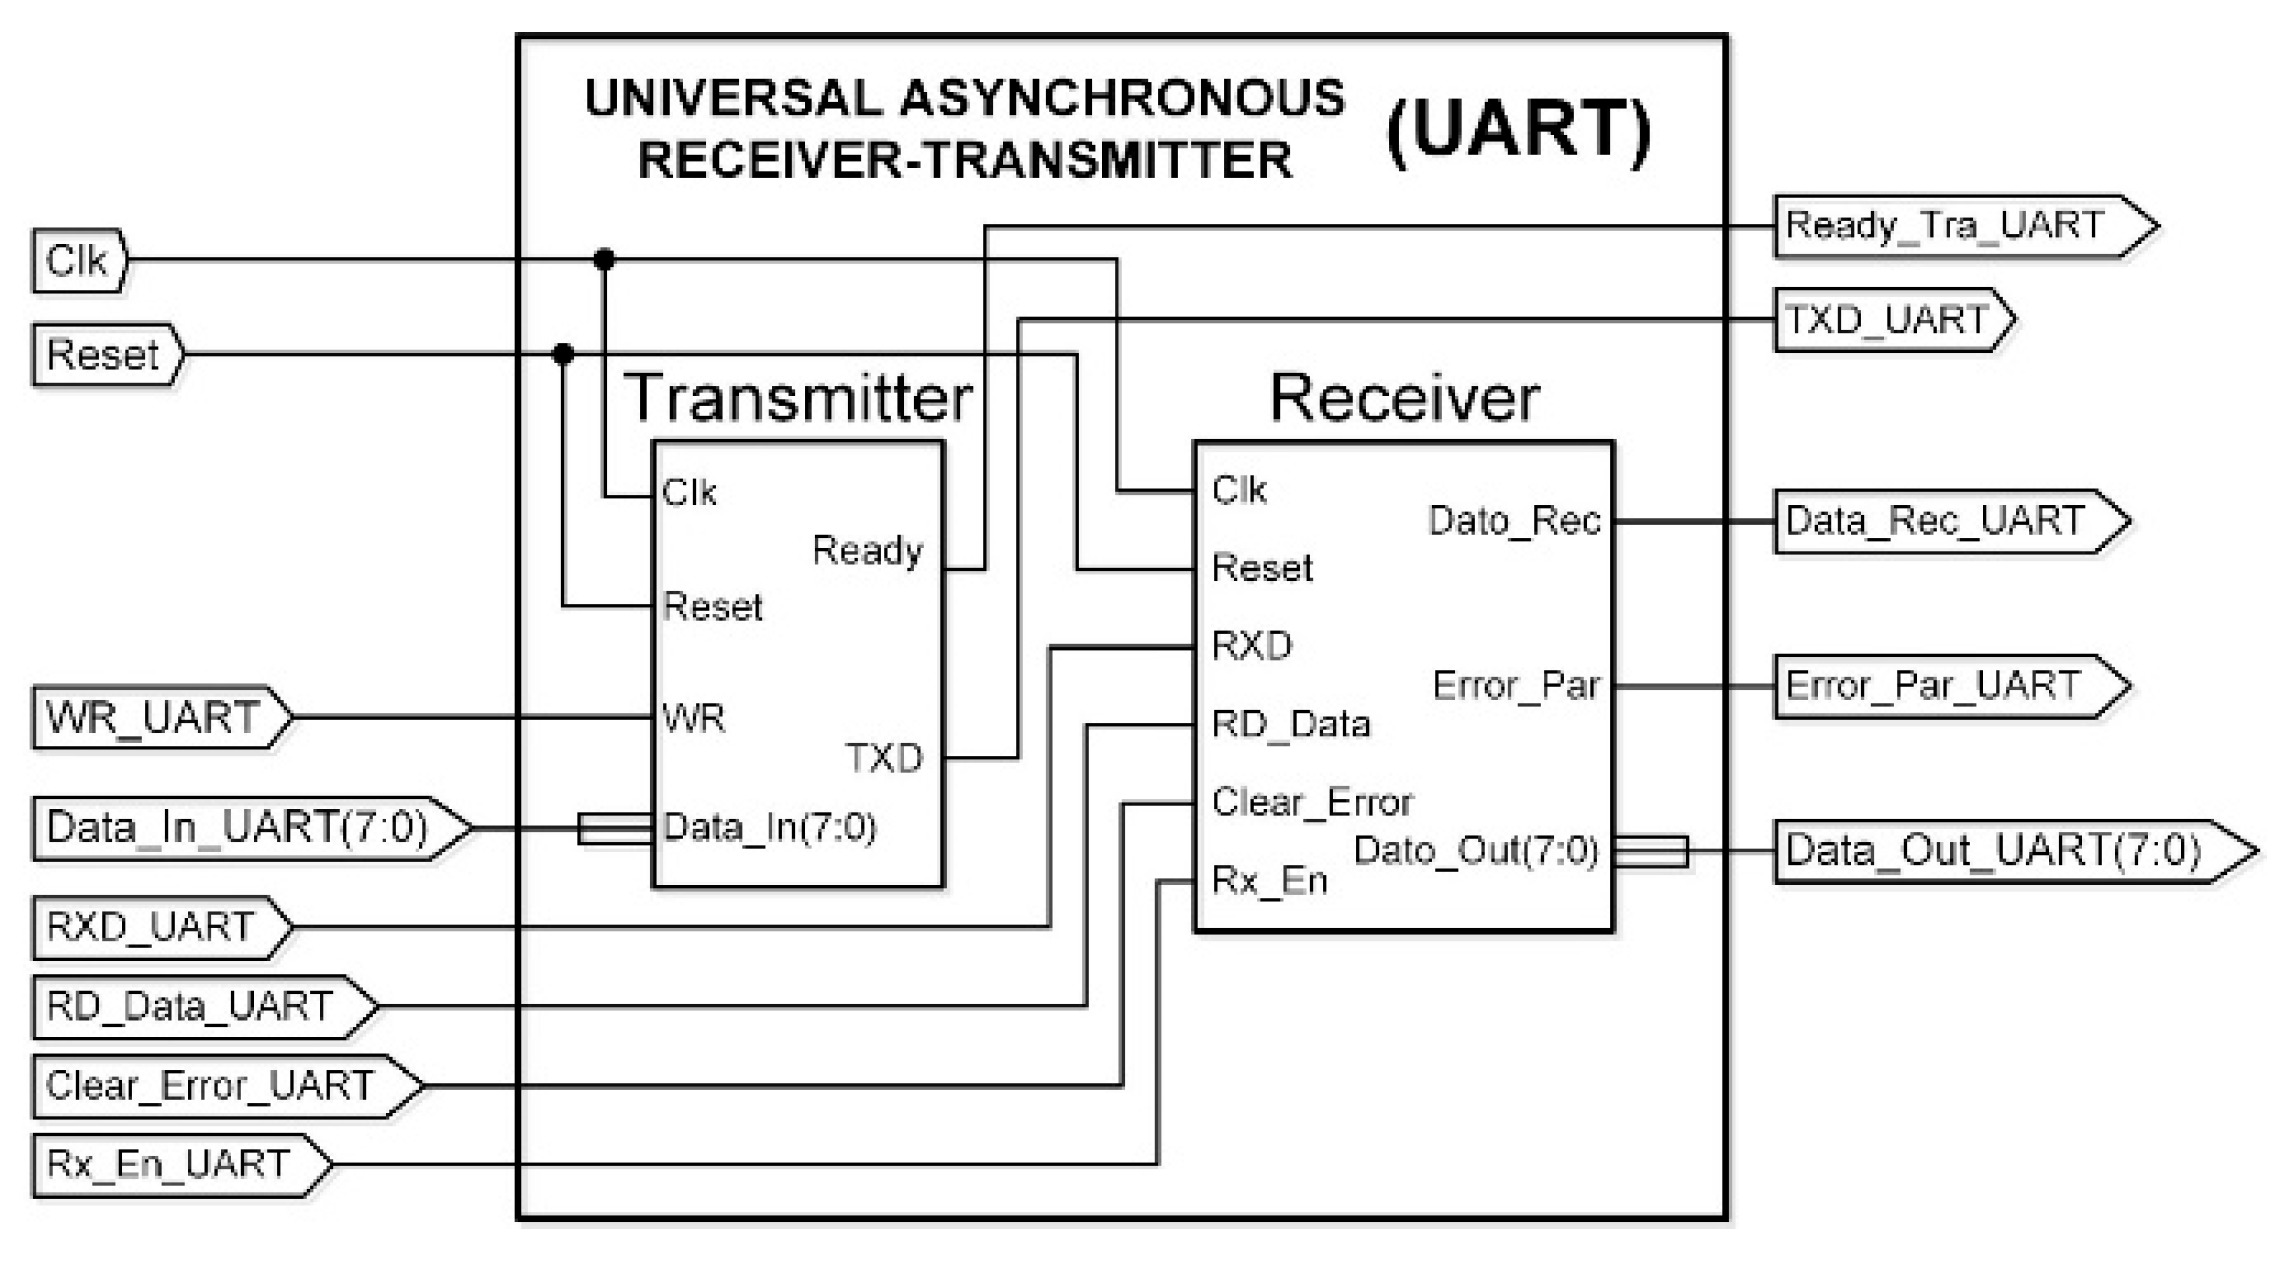
Figure 6 shows the entity that performs the communication between the “Control Processor” and the Host. The “UART” entity has two components, the Transmitter and the Receiver, based on what was developed by Ordaz et al. in [36].
Figure 6.
“UART” entity.
The “Lux” and “Power” sensors each have three values to be sensed. The values of the “Lux” sensor are: Full, IR, and Visible. The “Power” sensor values are: Current, Voltage, and Power. A visual application was developed to monitor these values. The descriptions of the entities required for the solar radiation estimation system are given below. The entity “I2C Primary” realizes the communication protocol I2C necessary for the communication of the sensors. The entities “Lux” and “Power” configure and control the sensors. The “UART” entity communicates the Host with the FPGA. The “Control Processor” entity controls the overall sensing process.
3.2. Description
In this section the descriptions of the entities required for the solar radiation estimation system are presented. The “I2C Primary” entity realizes the I2C communication protocol necessary for sensor communication. The “Lux” and “Power” entities configure and control the sensors. The “UART” entity communicates the Host with the FPGA. The “Control Processor” entity controls the overall sensing process.
3.2.1. I2C Primary
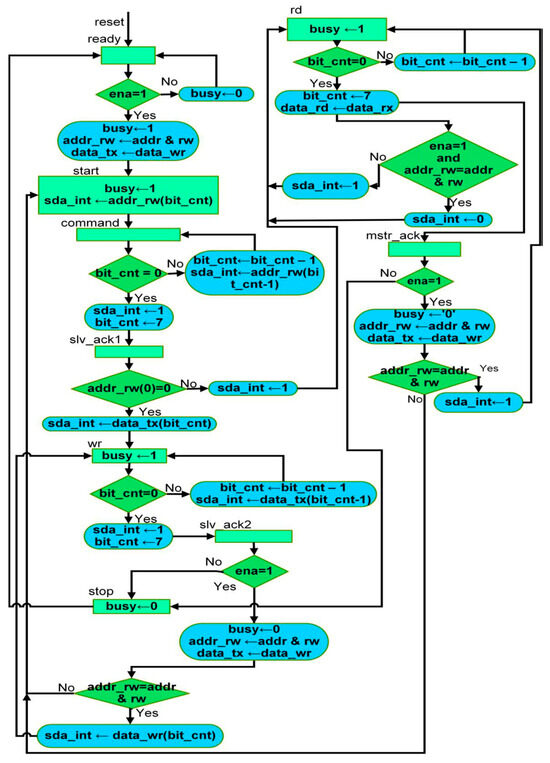
The Algorithmic State Machine (ASM) diagram of the “I2C Primary” is shown in Figure 7. In the “ready” state the enabling from the visual application is expected (ena = 1). In the “start” state, the start condition is generated. In the “command” state, the address and the R/W command are assigned to the I2C bus. The “slv_ack1” state captures and verifies the recognition of the secondary module and depending on what the R/W command is, it then proceeds to write (“wr” state) or read (“rd” state) data to the secondary module. If the primary module is writing, when finished, it captures and verifies the response coming from the secondary module ACK (“slv_ack2” status). If the primary module is reading, it generates a NACK (“mstr_ack” status). If at the end of the read, the “ena” signal remains high, the primary module immediately continues with another read or write. On the other hand, if the address of the secondary module is different than the primary module, it issues a repeat start (SR) according to the I2C protocol specification. Once the primary module finishes a read or write, if the “ena” signal is equal to zero, then the primary module generates the stop condition (stop state) and returns to the “ready” state.
Figure 7.
ASM “I2C Primary”.
3.2.2. Lux
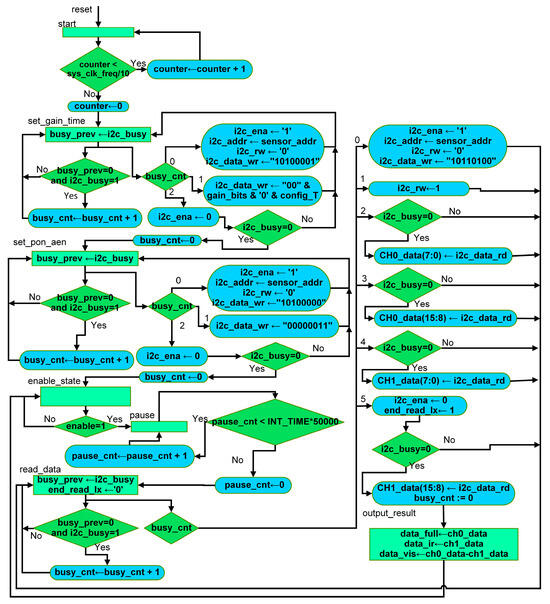
Figure 8 shows the ASM diagram that configures and controls the “Lux” sensor TSL2591. In the “start” state, the switch-on time is synchronized. In the “set_gain_time” state, the gain and integration time of the sensor are configured. In the “set_pon_aen” state, the sensor registers are activated. In the “enable_state” state it waits for the “enable” signal on high (which comes from the visual application) to start reading the sensor data continuously. In the “pause” state, the sampling time of the sensed data is synchronized. In the “read_data” state, the Full and IR data of the “CH0” and “CH1” channels are read, respectively. When the reading of the registers is finished, the “i2c_ena” signal is initialized with zero and the “output_result” state is reached, where the results are sent to the visual application. The counter register (busy_cnt) controls the process of writing to the sensor registers, indicating that a write operation will be performed and then passing the data (which, in the case of this sensor, represents the address of the configuration register and is set in a pointer to write the next byte to that register).
Figure 8.
ASM “Lux”.
3.2.3. Power
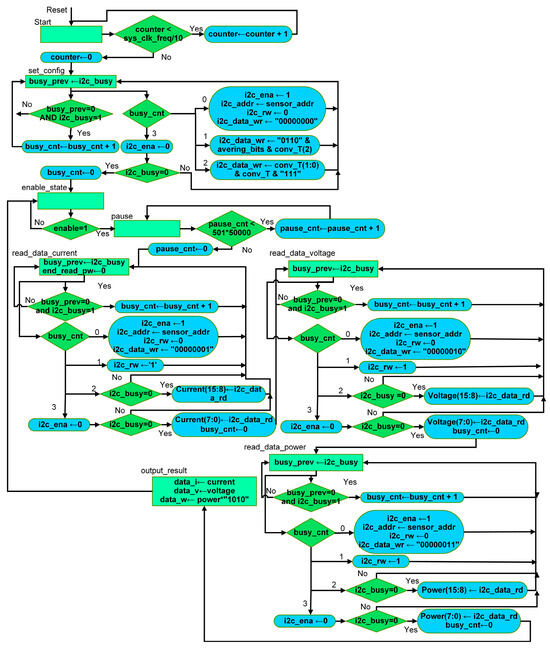
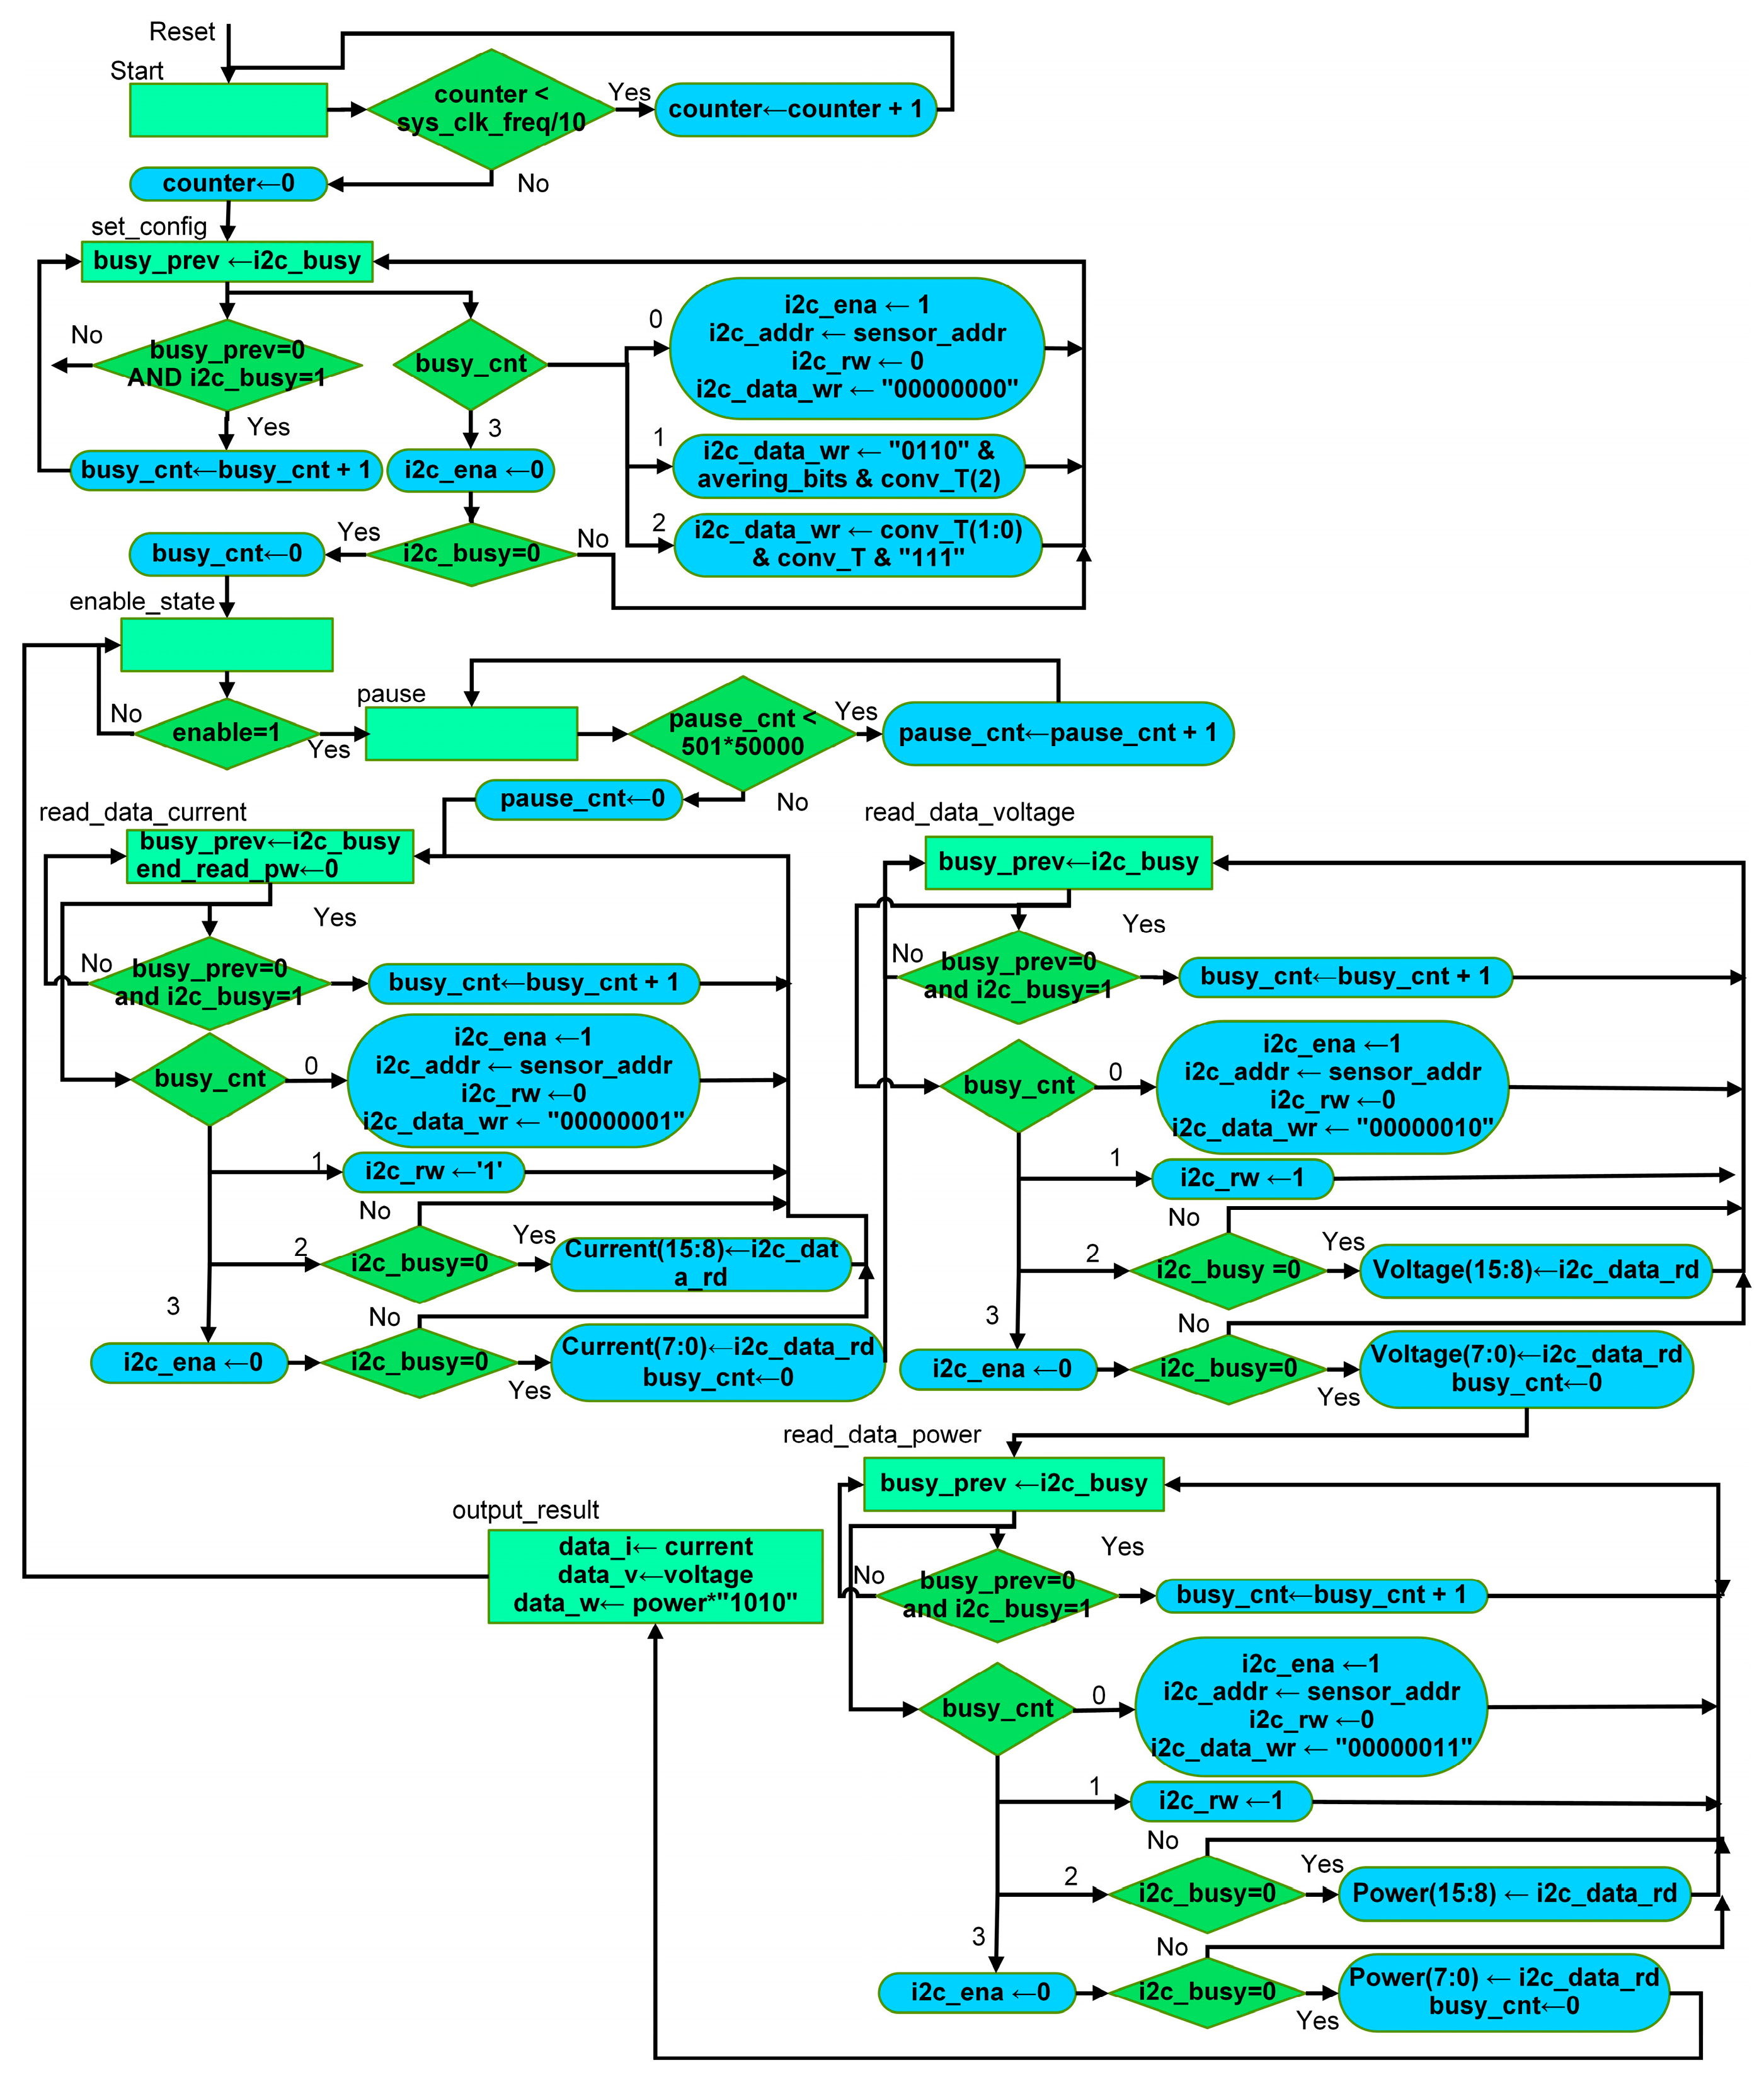
Figure 9 shows the ASM diagram that configures and controls the INA260 “Power” sensor. In the “start” state, the power-on time is synchronized. In the “set_config” state, the conversion times of the ADC that includes the sensor are configured, as well as the number of samples taken to obtain the average of each value (current, voltage, and power). The “enable_state” state waits for the “enable” signal on high (which comes from the visual application) to start reading the sensor data continuously. In the “pause” state the sampling time of the sensed data is synchronized; this depends on the ADC conversion time and the number of samples obtained. At the end of this synchronization, the current, voltage, and power are read. Being 16-bit registers, the reading is performed in two stages. Once the 16 bits are received, the “busy_cnt” counter and the “i2c_ena” signal are initialized to zero to generate the stop condition. After performing the three readings, the output_result is sent to the visual application. The counter register (busy_cnt) controls the process of writing to the sensor registers, indicating that a write operation will be performed and then passing the data (in this sensor, a write operation is performed to send the configuration parameters).
Figure 9.
ASM “Power”.
3.2.4. Universal Asynchronous Receiver-Transmitter (UART)
The purpose of the UART is to perform the communication between the “Control Processor” entity and the Host, by sending and receiving commands, for which two entities (a transmitter and a receiver) were described. The UART was described in such a way that any transmission speed can be configured. By default, it was set to 9600 bits per second (104 µs per bit). The characters to be transmitted are 11 bits in size. The transmission starts with the least significant bit. The design development and description of the UART was performed in detail in the work presented by Ordaz et al. in [36].
3.2.5. Control Processor
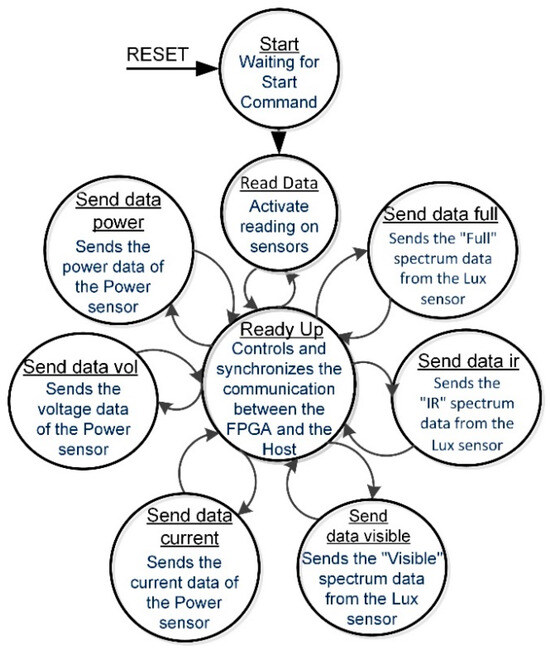
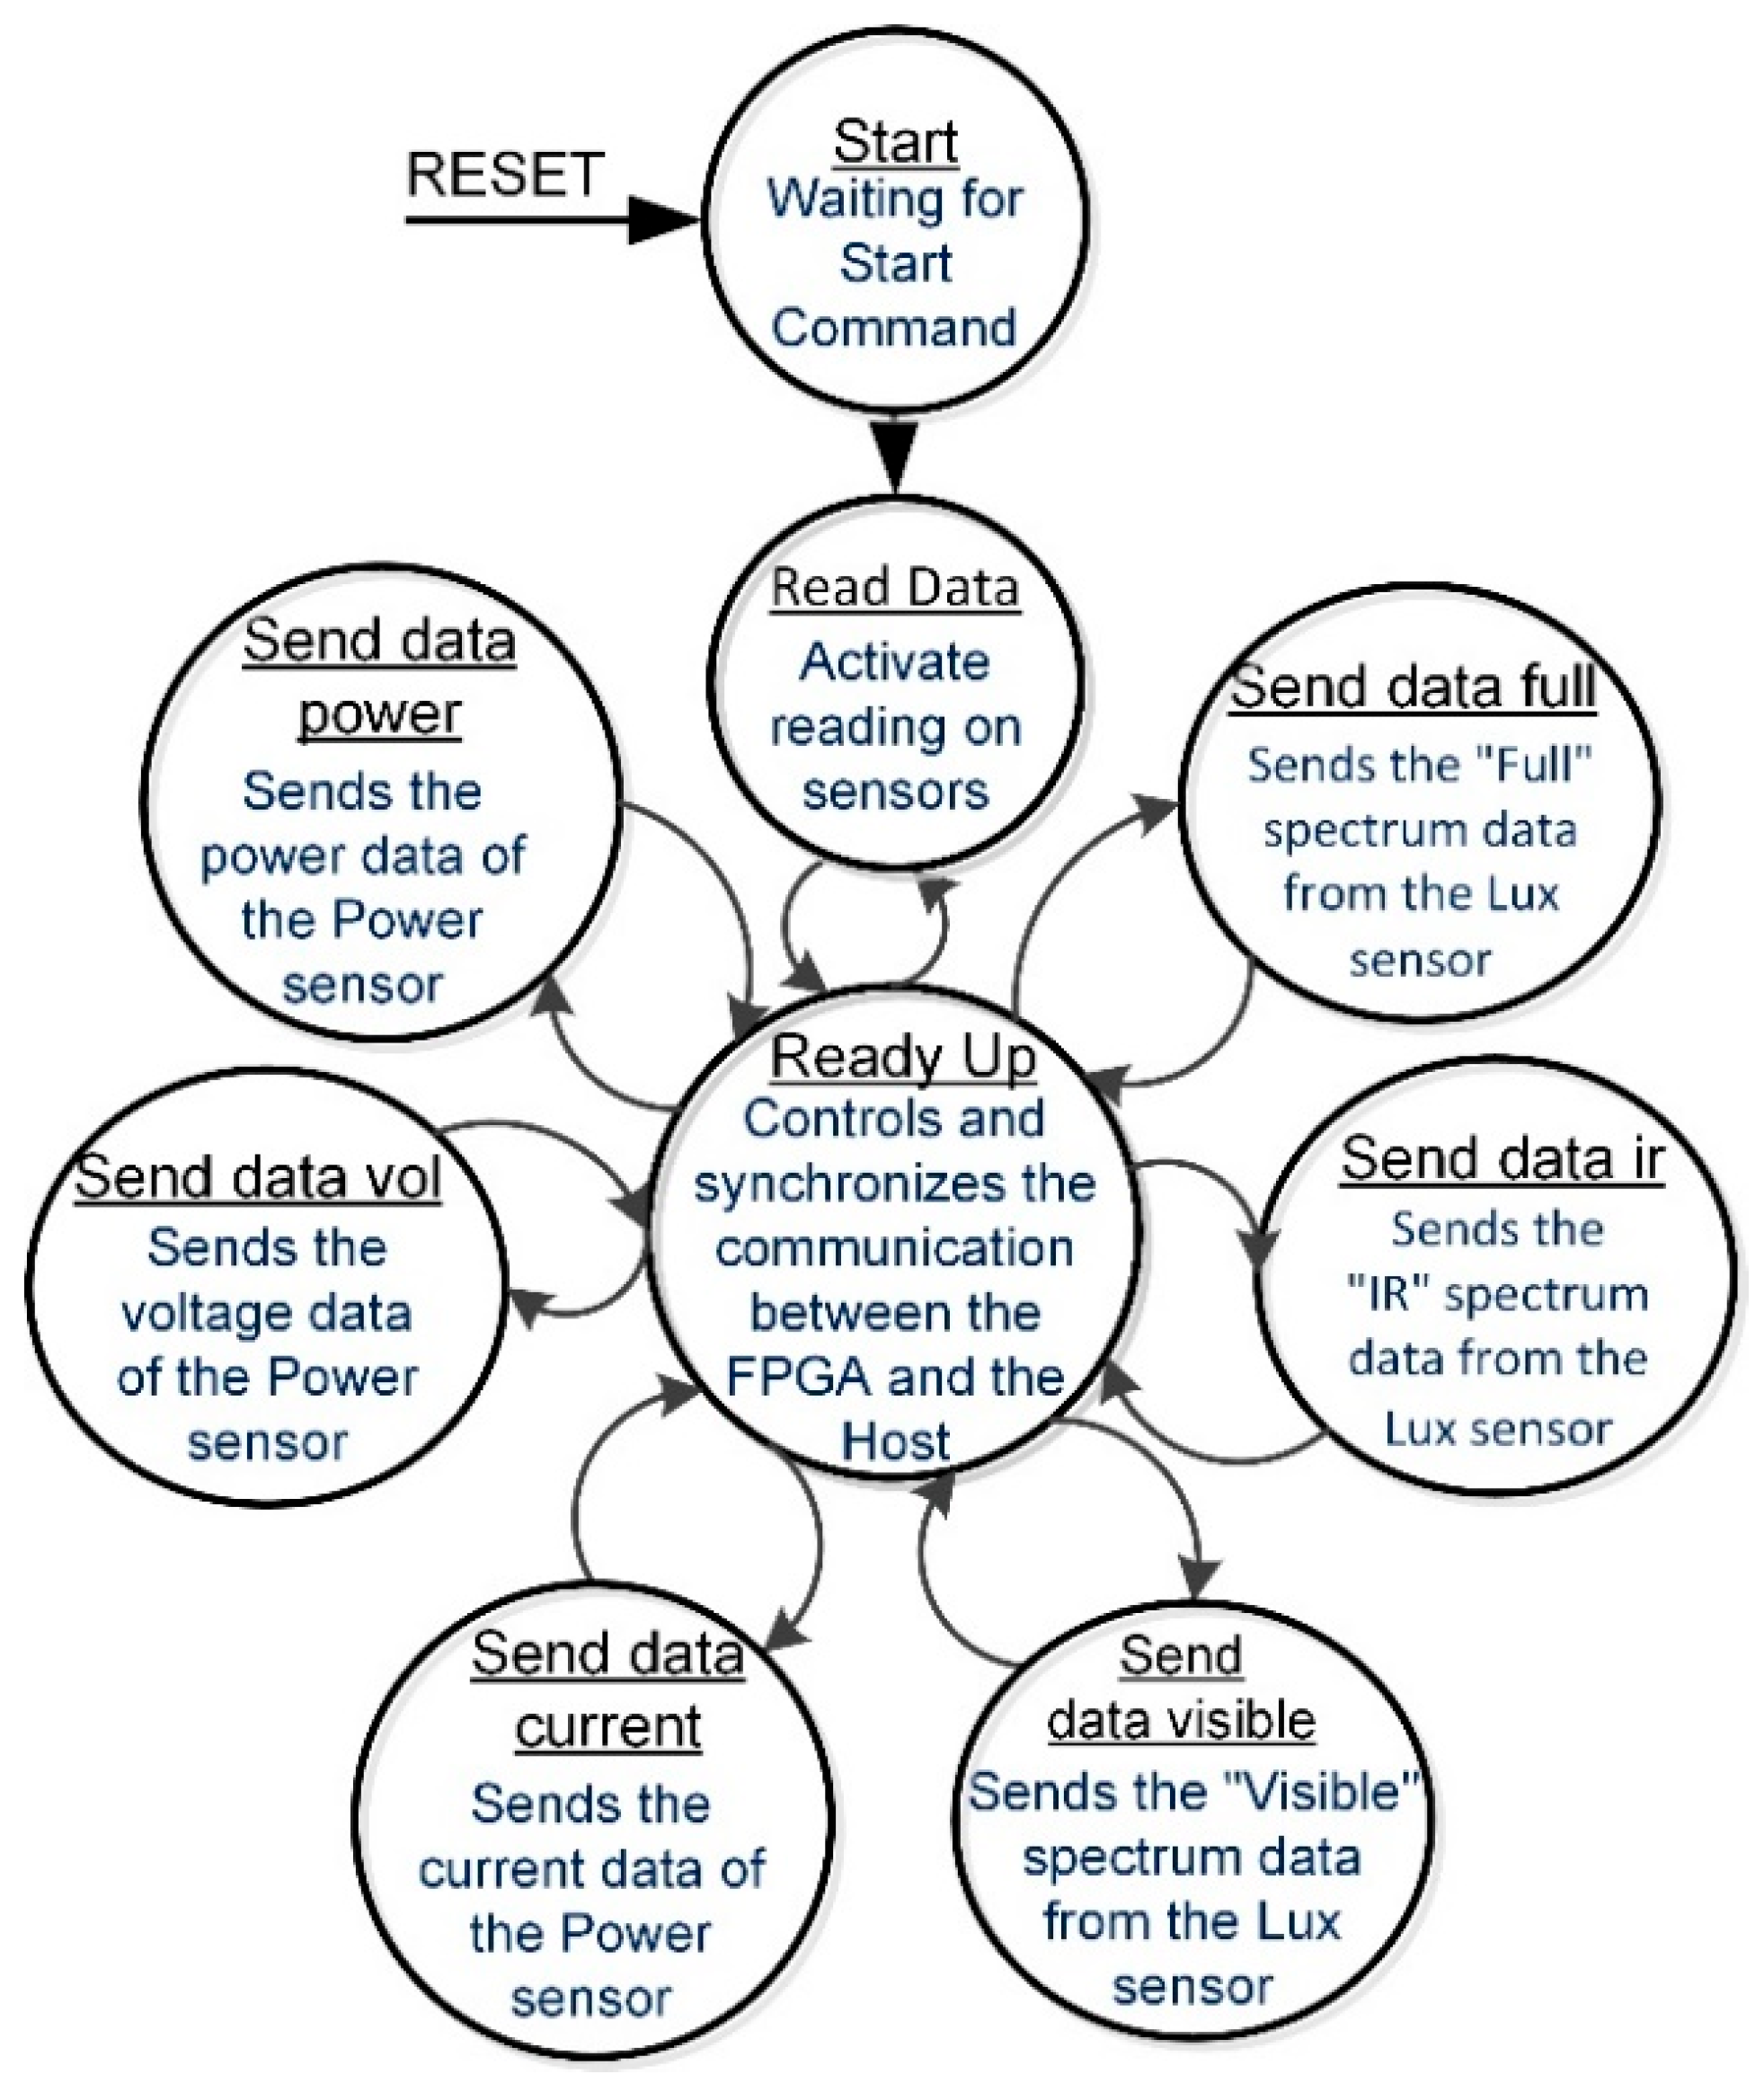
The “Control Processor” entity has the purpose of controlling, exchanging information and managing the operation between the entities executing the sensing and the UART entity. The “Control Processor” entity decodes the instructions and commands it receives from the Host and encodes the responses from the sensors that the sensors return to the Host. The description of the data path and the control unit of the “Control Processor” was performed by means of a Finite State Machine with Embedded Data Path (FSMD), whose simplified state diagram is shown in Figure 10.
Figure 10.
Simplified state diagram of the FSMD of the “Control Processor”.
In the “Start” state of the FSMD, all the auxiliary and output signals that control the sensors are initialized, and it waits for the start command received by the UART from the visual application. In the “Read_Data” state each sensor is activated to read the data, once the data is captured, the sensors notify with a flag to the “Control Processor” the end of the capture. In the “Ready_Up” state, the communication with the Host is controlled and synchronized, making the transitions to the six states that allow the data captured by the sensors to be sent to the UART. The execution of these six states is clockwise. The “send_data_full” state controls the sending of the Full data. The “send_data_ir” state controls the sending of IR data. The “send_data_vis” state controls the sending of Vis data. These three of the sensor “Lux” TSL2591. The “send_data_current” state controls the sending of current data. The “send_data_voltage” state controls the sending of voltage data. The “send_data_power” state controls the sending of the power data. These are the other three states of the INA260 “Power” sensor. The six states that send data to the UART divide the value of the sensed data into two 8-bit frames, since these are 16 bits wide. After one of the six states for sending the sensed data is executed, it returns to the “Ready_Up” state where the synchronization is performed and proceeds to execute the next state to send the next data (this is performed six times). The execution of the “Read_Data” state and the six sending states is continuous, since the “Read_Data” state also restarts the sensing process.
4. Results
This section presents the results obtained in this work, where a PV cell is used, which is connected directly to the positive terminal of the INA260 sensor, while an “ideal” load resistor is connected to the negative terminal, which, in turn, is connected to the sensor. The INA260 and TLS2591 sensors are connected to the FPGA and communicate via the I2C protocol. On the other hand, the FPGA is connected to the Host and communicates using the RS232 protocol via the UART.
4.1. System Monitoring
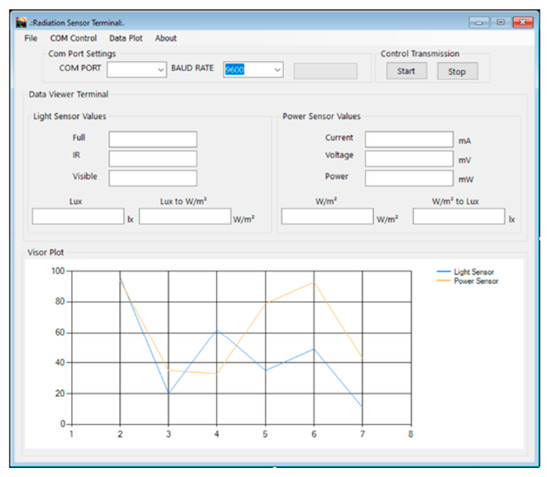
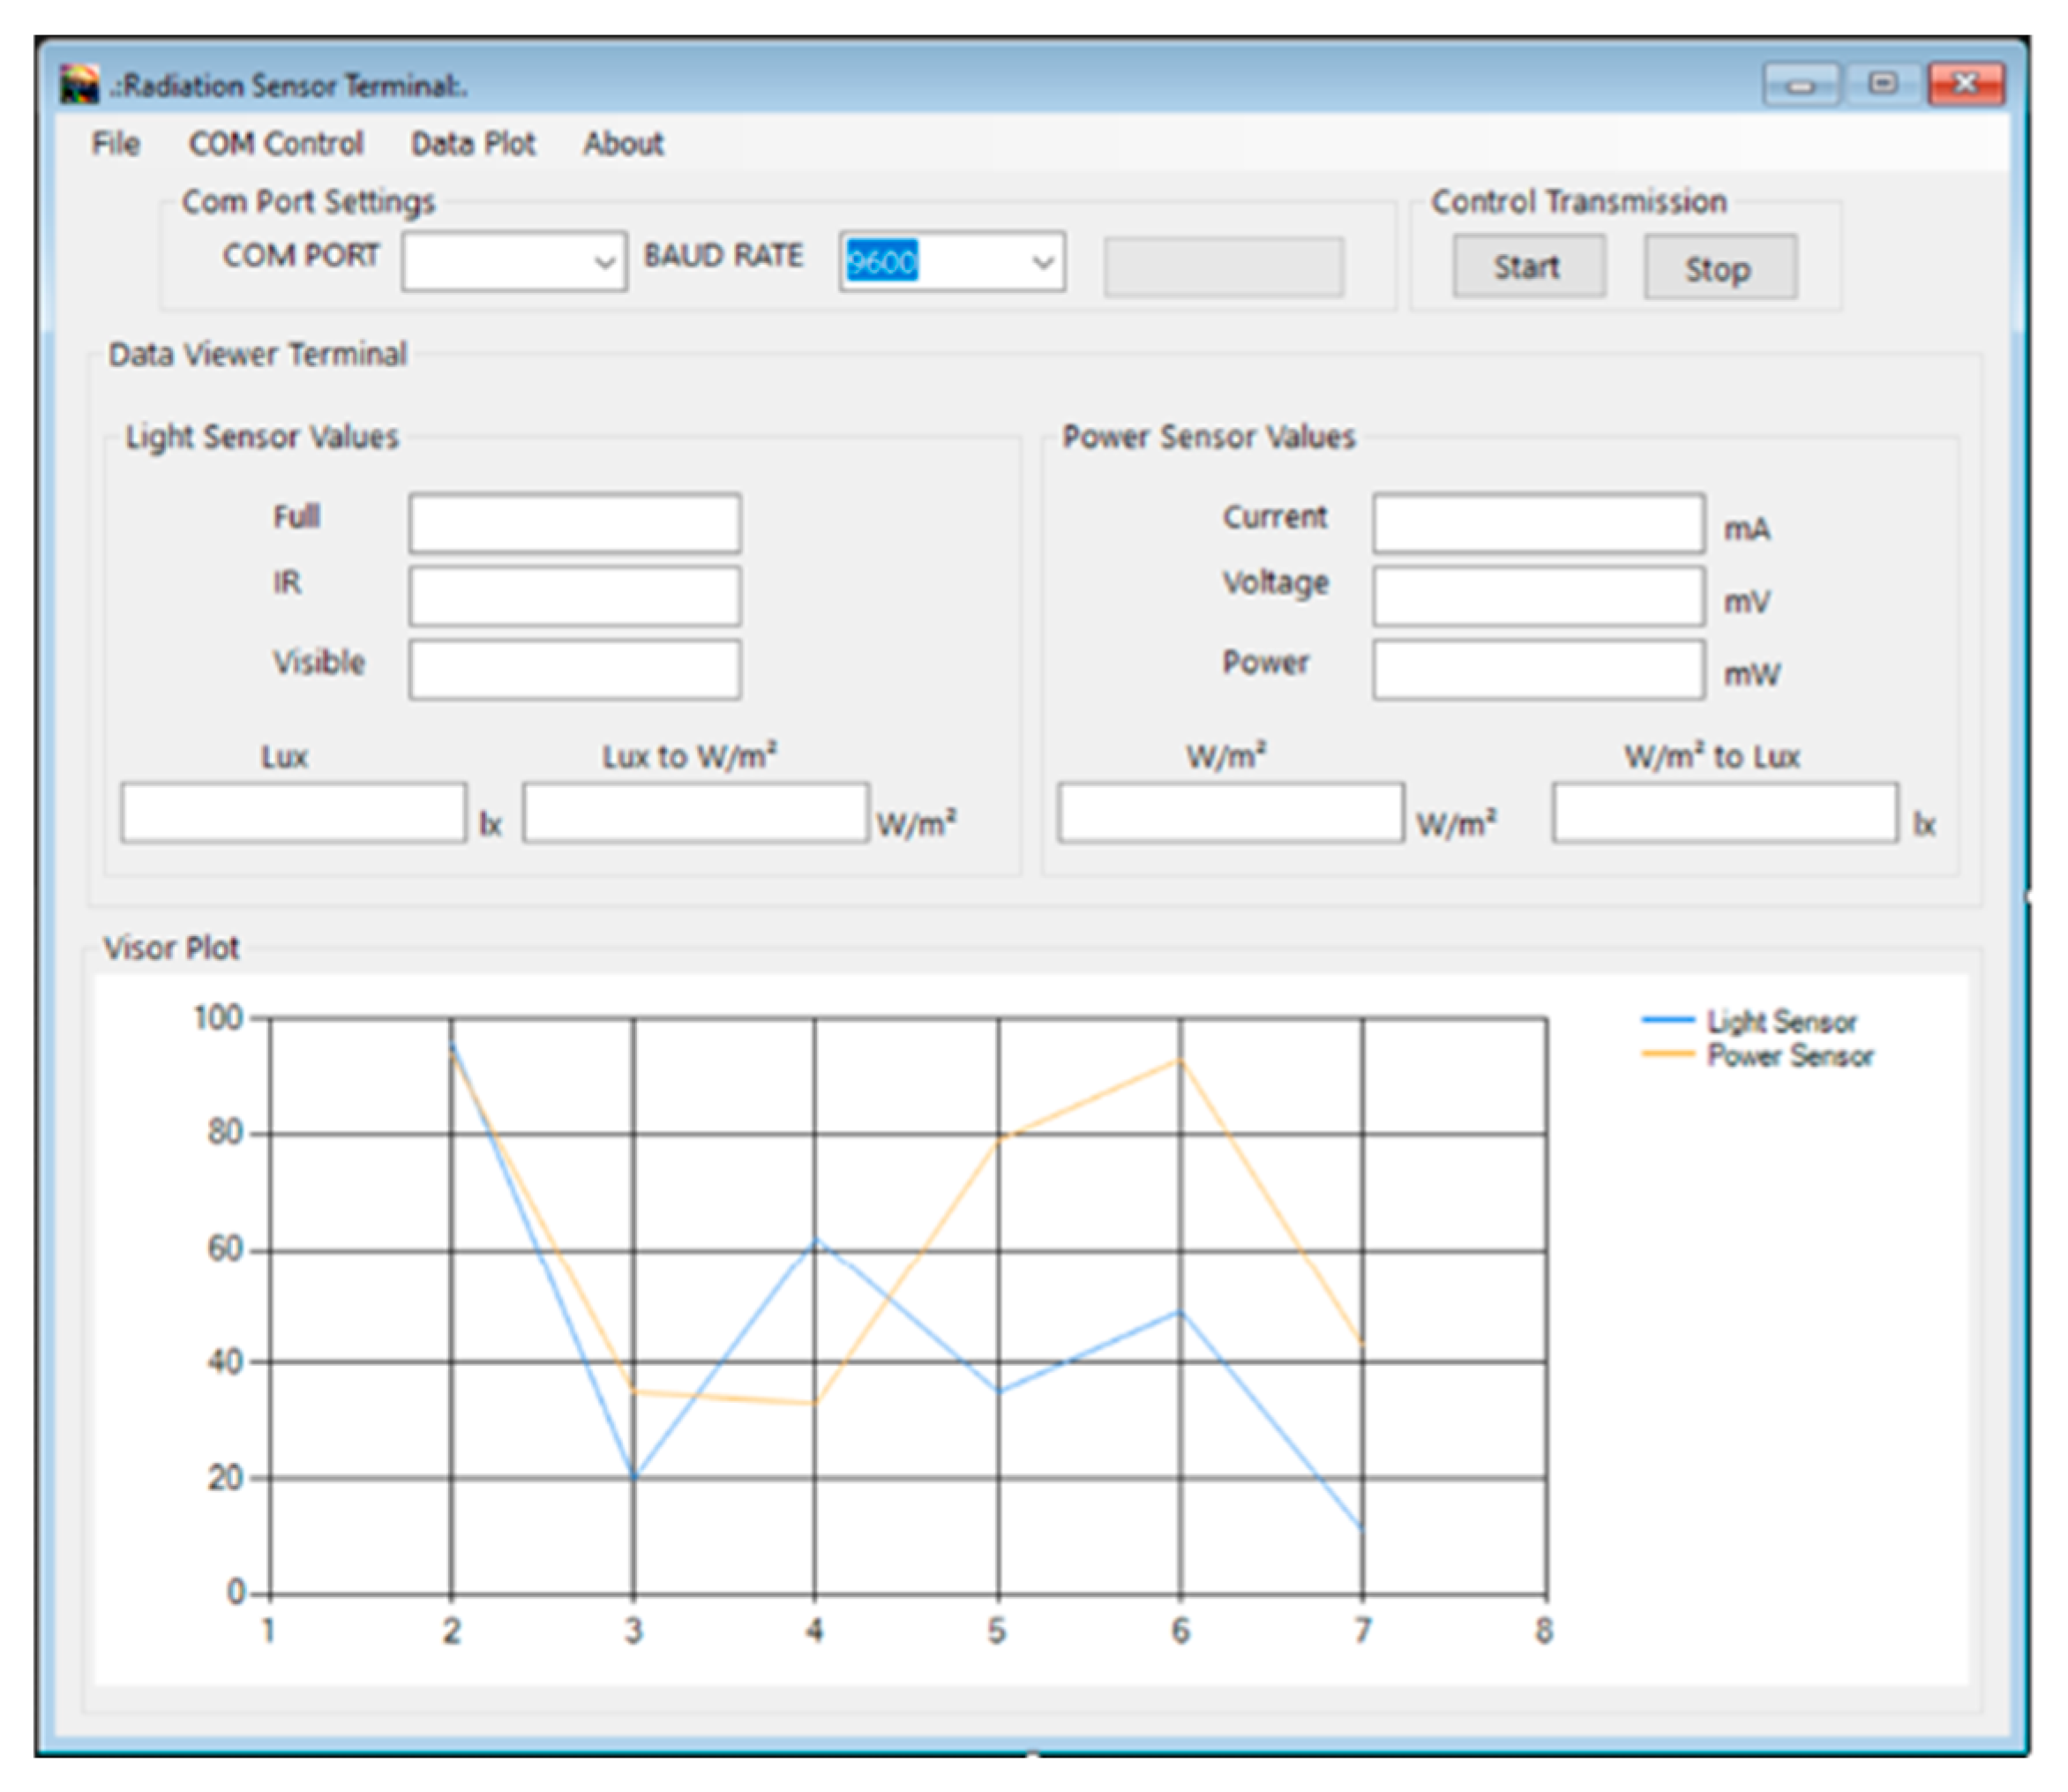
The visual application is shown in Figure 11. The graphical window of the visual application, which is called Windows Form, contains fields for displaying the data sensed by the system. The visual application performs and displays conversions to lux’s (lx) and W/m2.
Figure 11.
Visual application.
To send and receive the commands and the data sensed by the system, the serial port is used, which allows the system to connect to the Host through a USB to DB9 cable for communication.
4.2. PV Cell Calibration
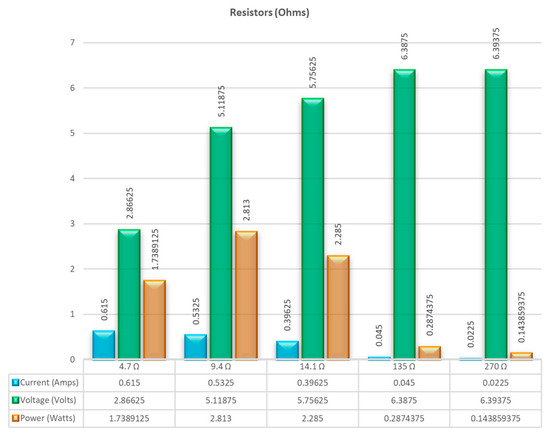
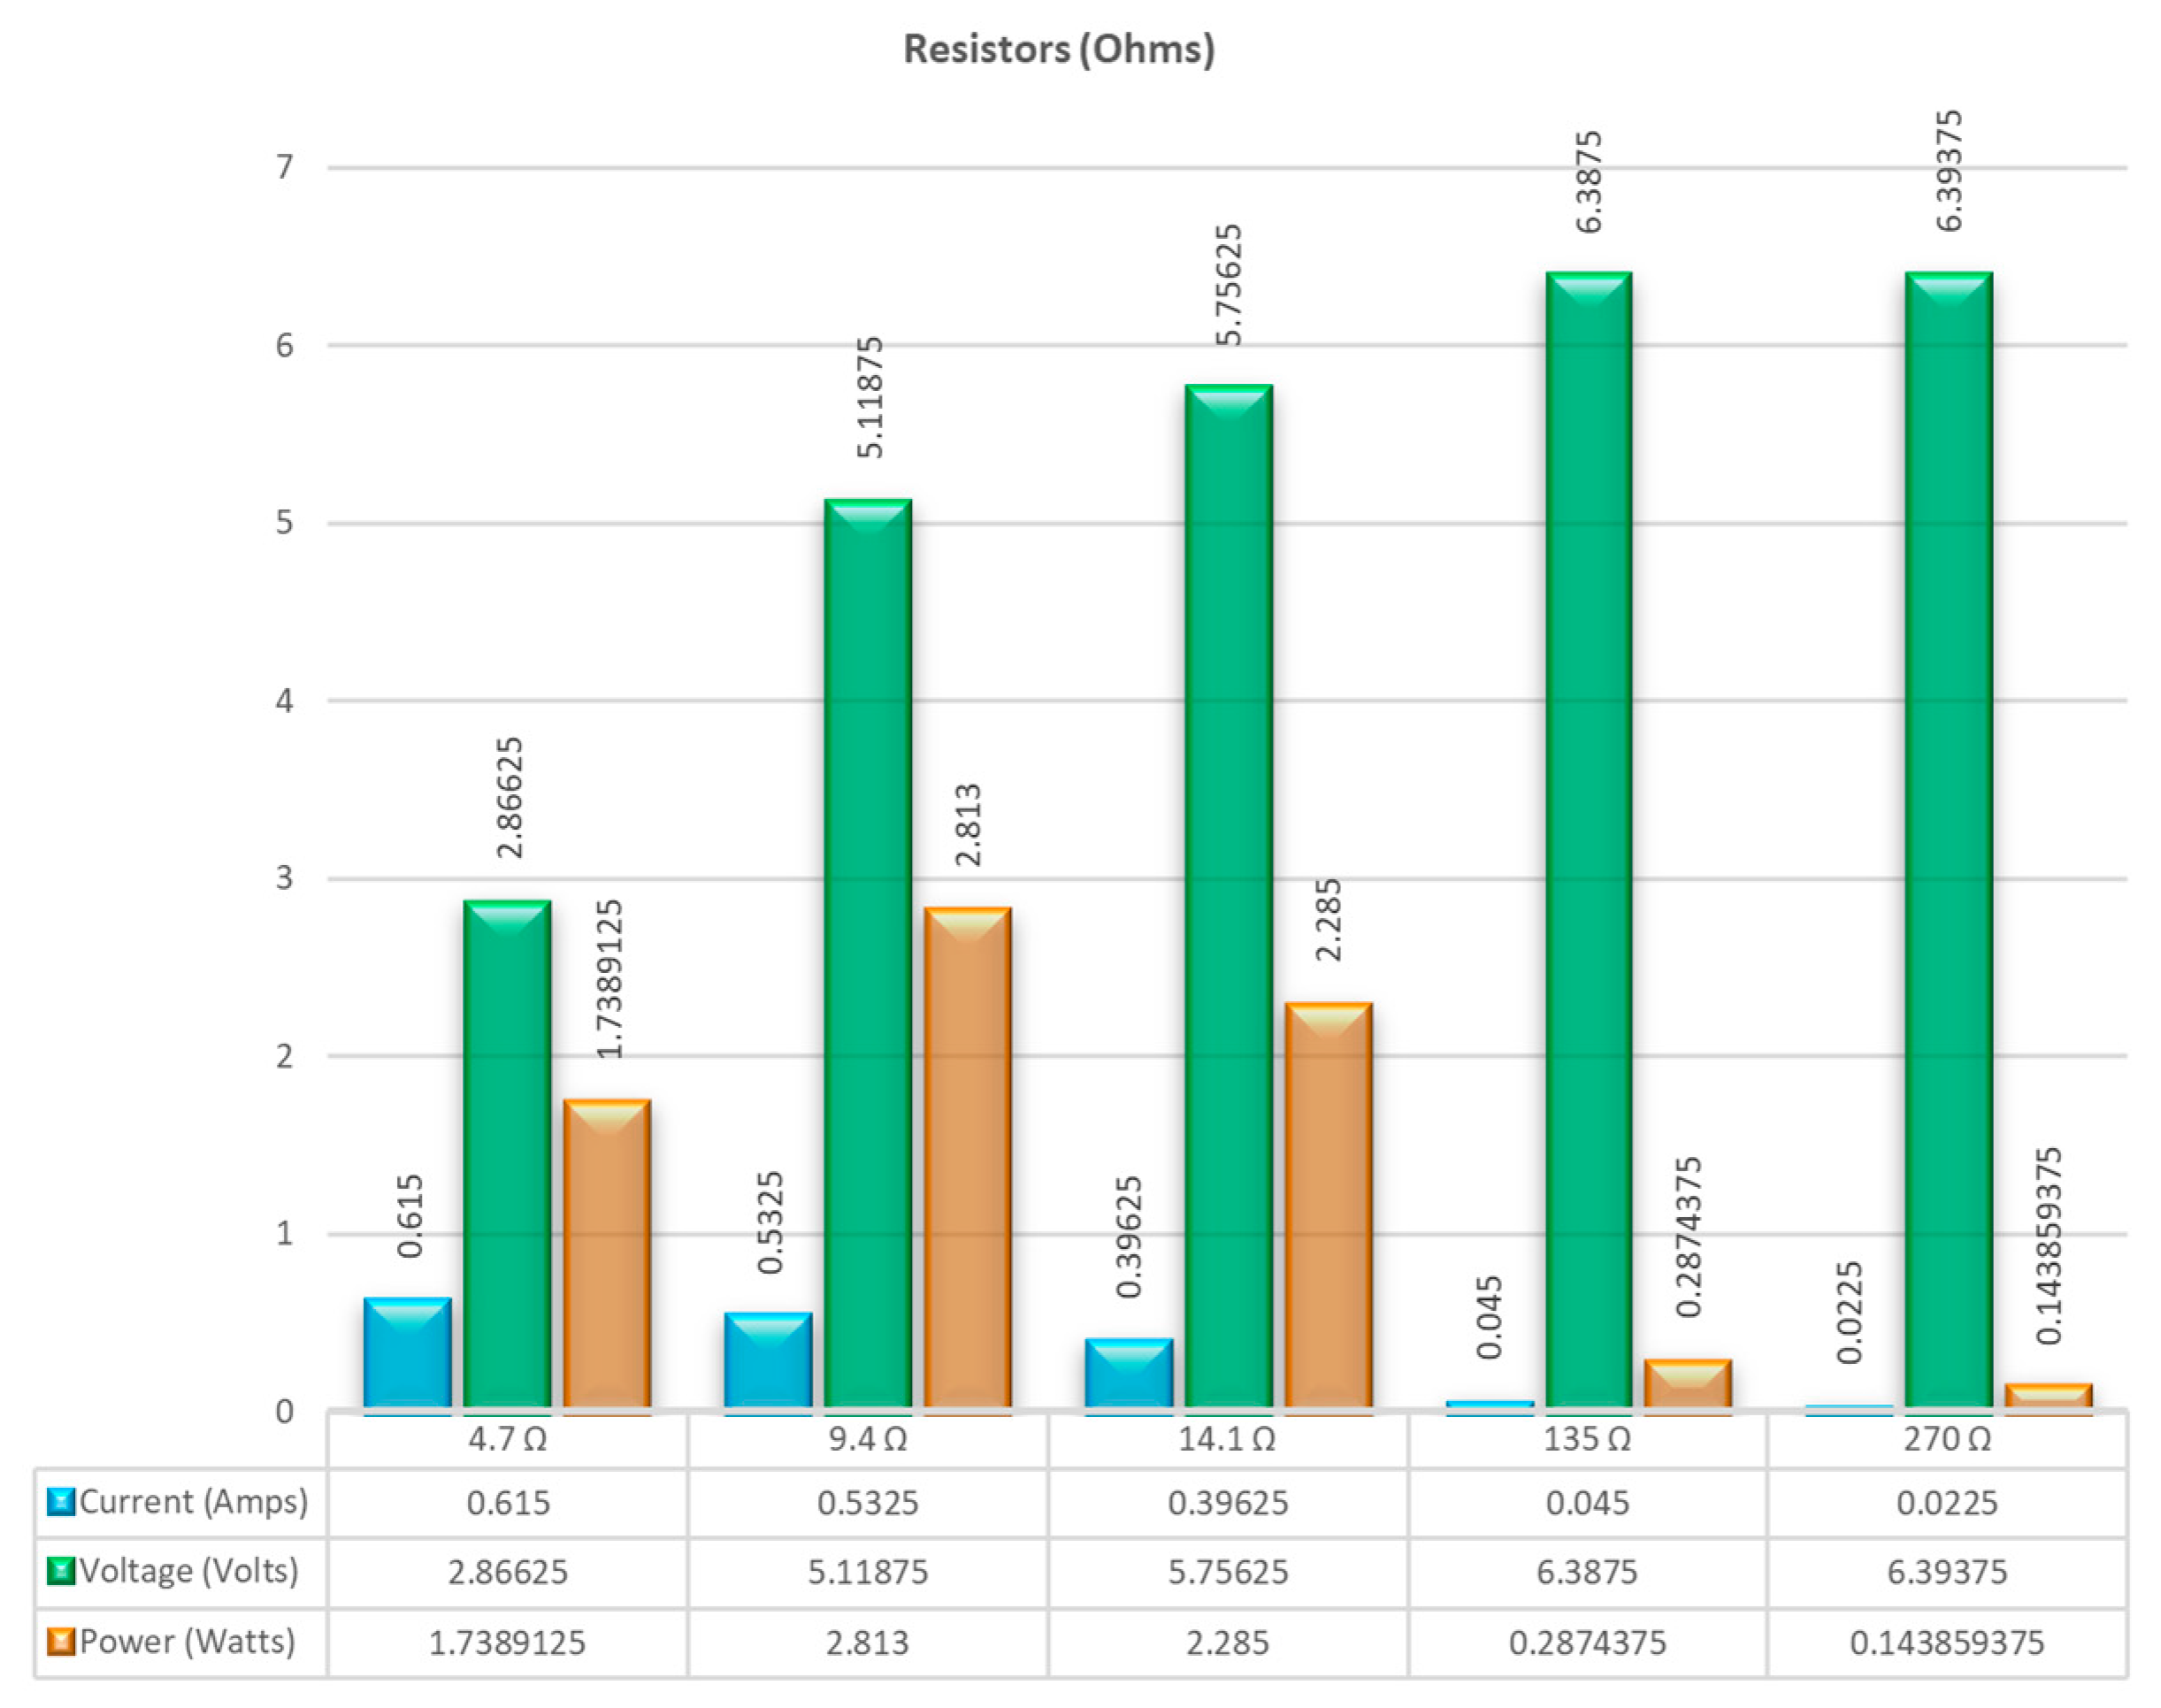
The solar cell obtains a maximum of 3 Watts at peak power, has an area of 220.8 cm2, and a 17% efficiency in energy transformation. In order to obtain the “ideal” resistance and to extract the maximum power that the cell provides, different load resistance values were tested. Figure 12 shows the results of the tests to obtain the “ideal” load resistance. Where the current, voltage, and power values can be seen for each resistance value tested, obtaining the maximum power point with a load resistance value of 9.4 Ω, achieving a cell calibration with current (532 mA) and voltage (5.1 V) values very close to the values (540 mA and 5.5 V) established by the manufacturer.
Figure 12.
Load resistance tests.
4.3. Capture of Sensed Values
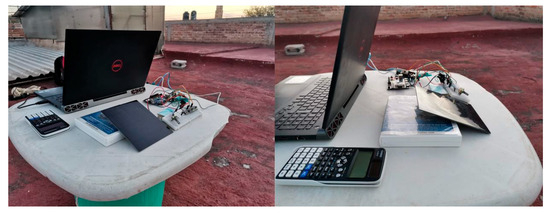
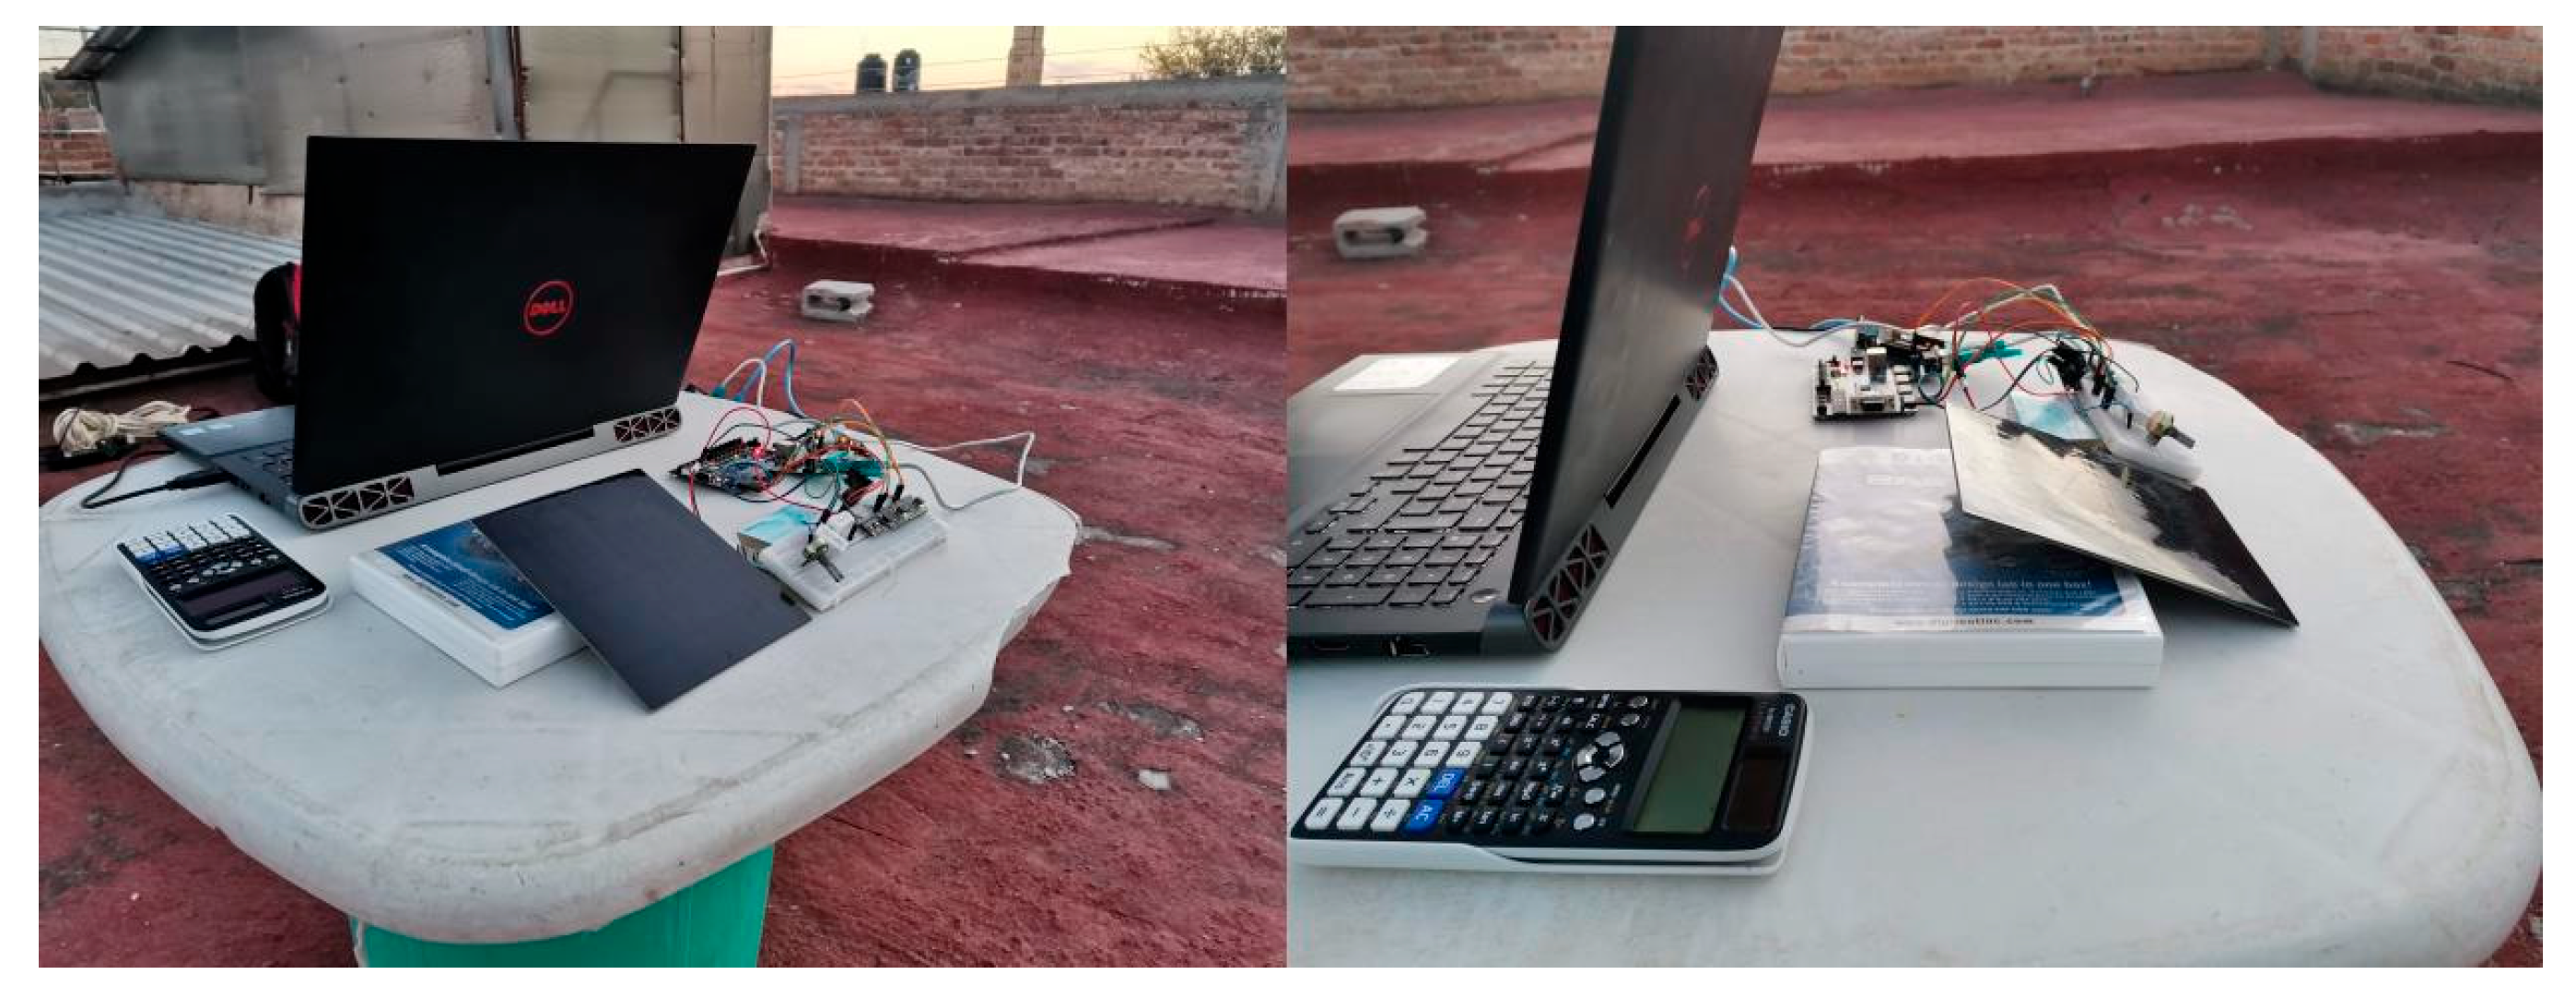
In Figure 13 the sensors, PV cell, FPGA and Host are shown. The sensors and the PV cell were placed with an inclination of 23 degrees and facing south, determined by the calculation of inclination that a PV panel should have for optimum performance [41] based on the season of the year and the latitude of the location where the samples are captured.
Figure 13.
FPGA-based solar radiation sensing and measurement system.
4.4. Interpretation of Results
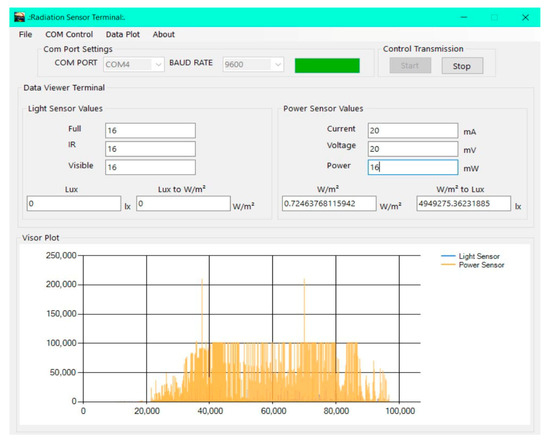
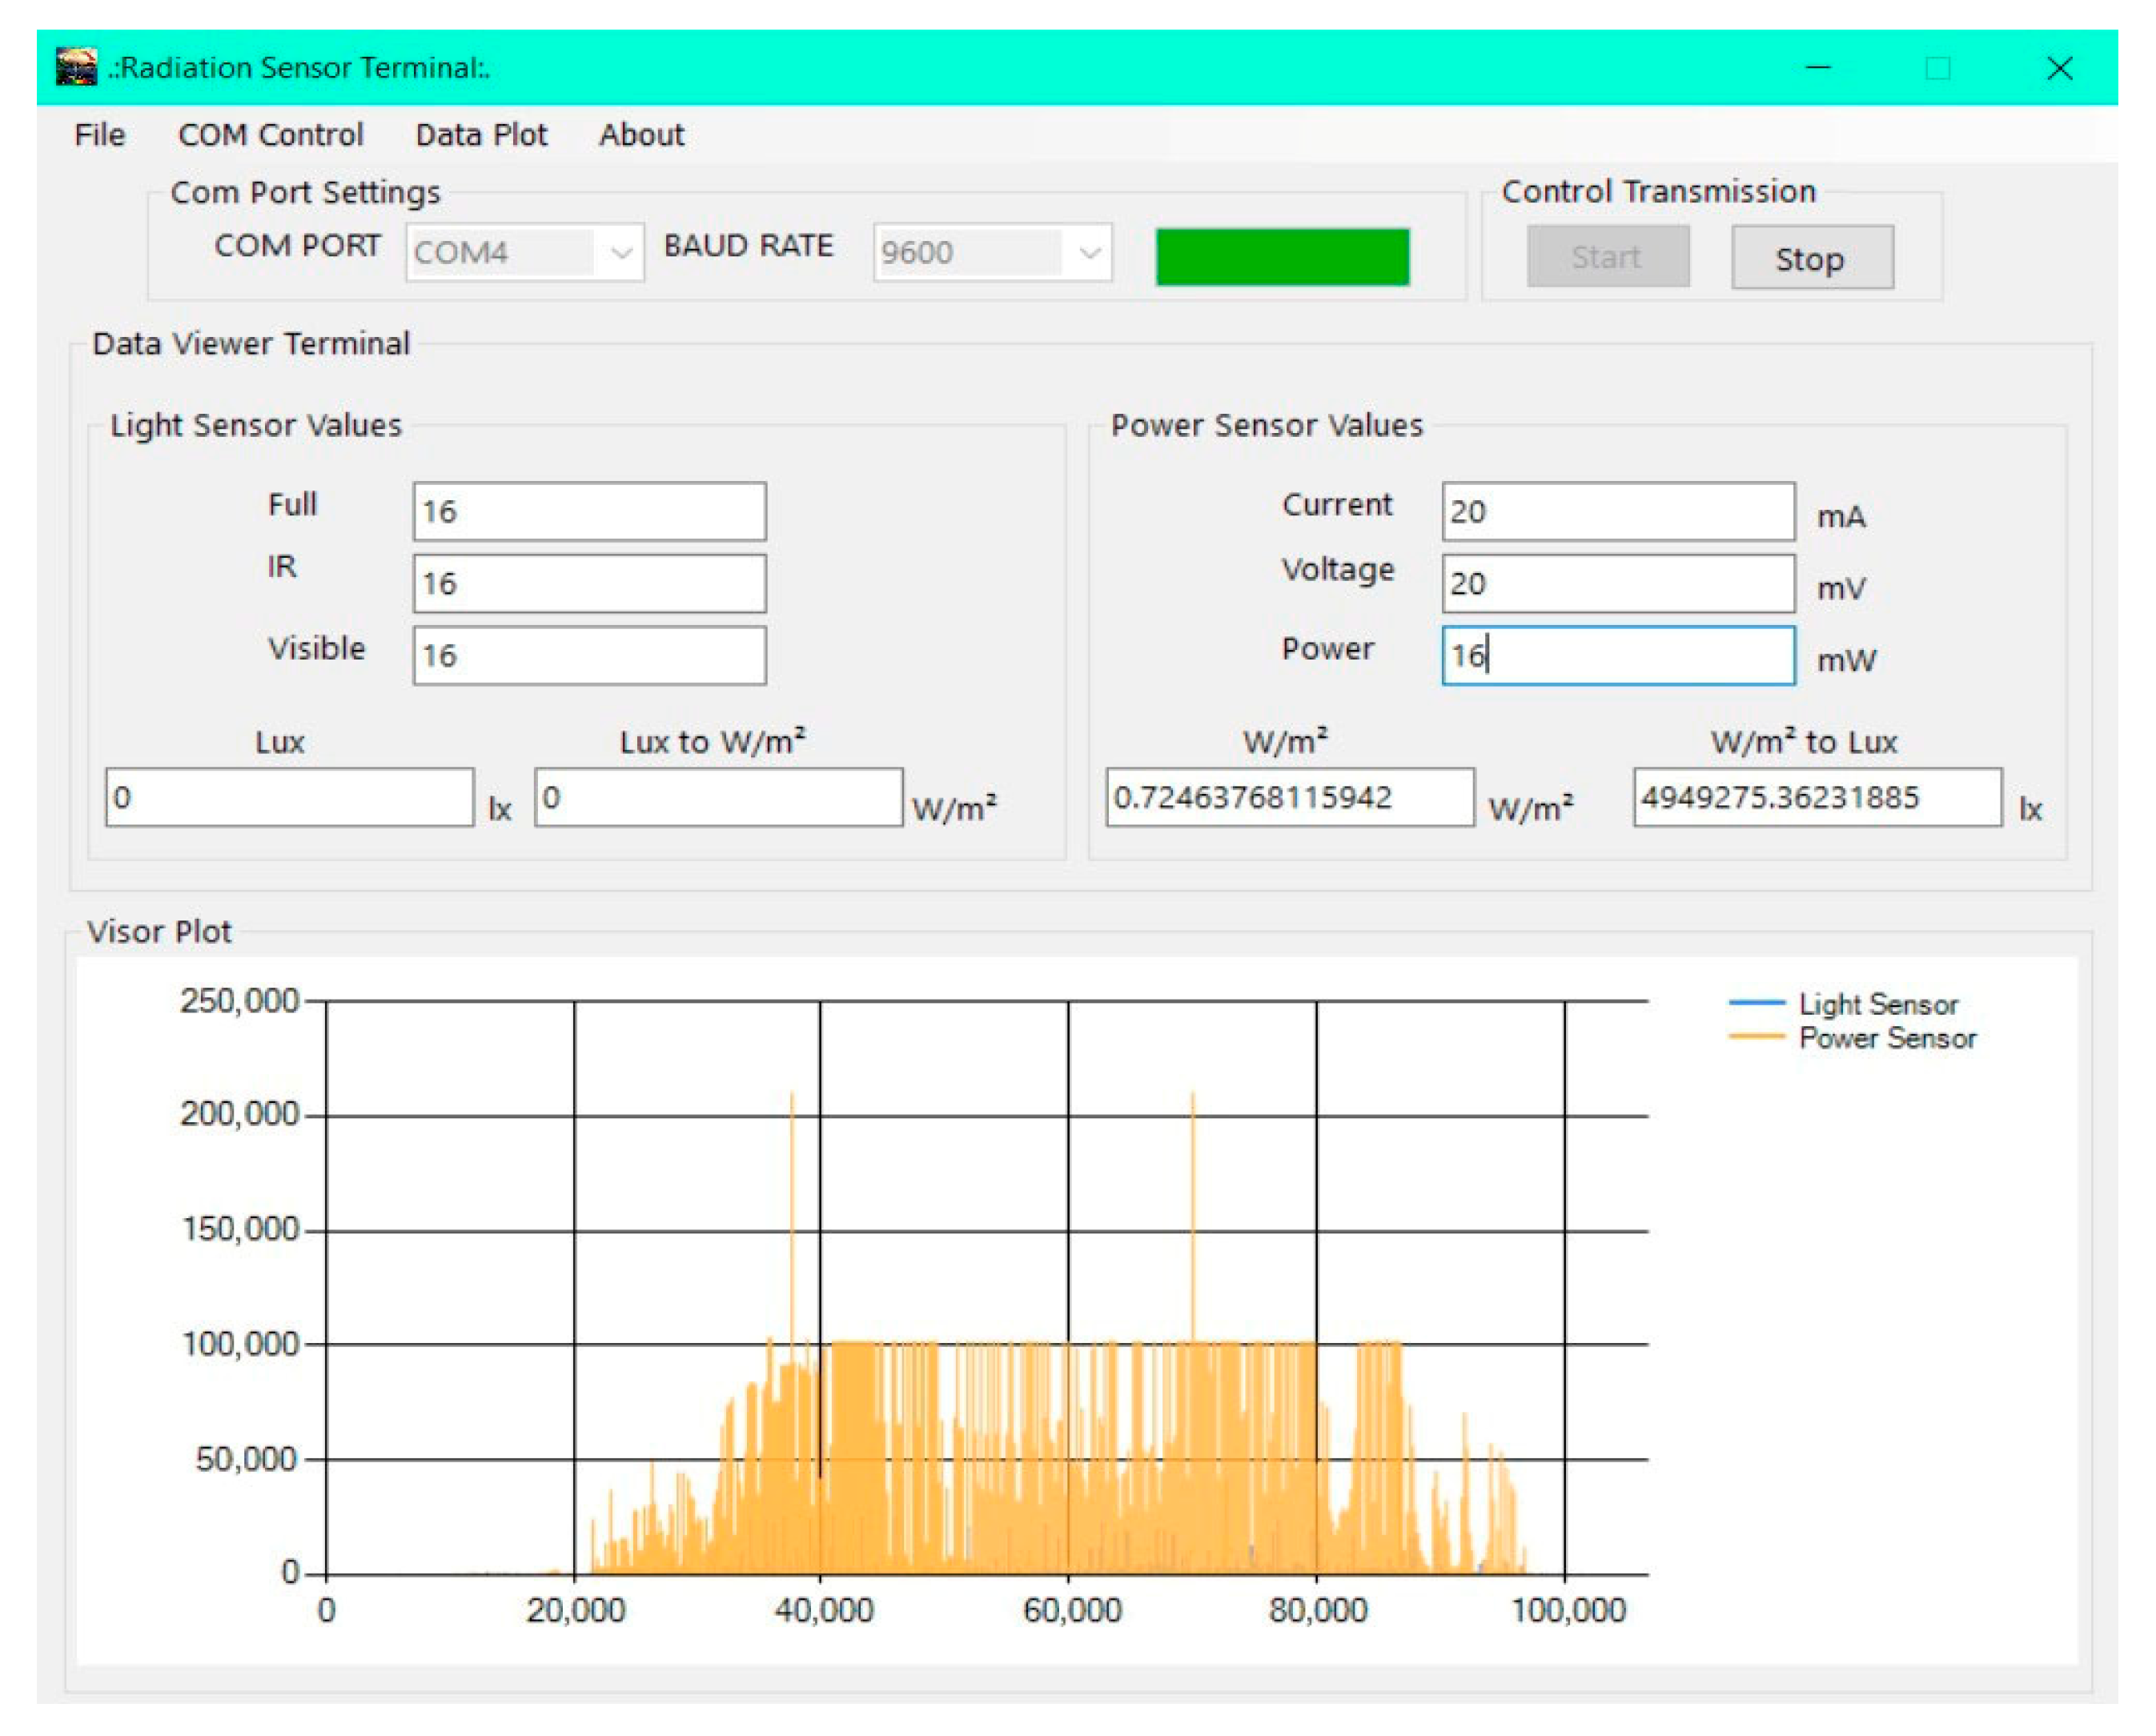
The interpretation of the captured values is of utmost importance, so it was performed in two different ways. The first way of interpreting the data is shown in Figure 14 where the visual application shows the six sensed values, as well as the respective calculated values, and a graph generated in real time with these data. In the graph, the X-axis represents the number of samples captured and the Y-axis represents the Lux values.
Figure 14.
Visual application of the FPGA-based sensing system.
The second way of interpreting the data is by using the values stored in the “.csv” file generated by the visual application, in order to make the graph correspond to the captured data. Taking into account that the X axis represents the instant of time in which the samples were captured, and depending on the parameter to be plotted, the Y axis represents the W/m2 of the INA260 sensor or the conversion from Lux to W/m2 of the “Lux” sensor TSL2591.
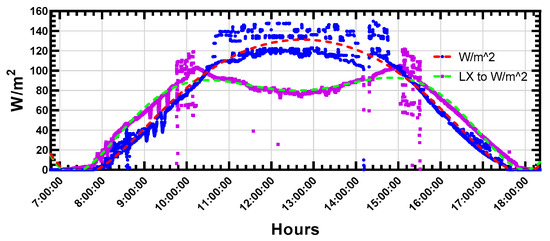
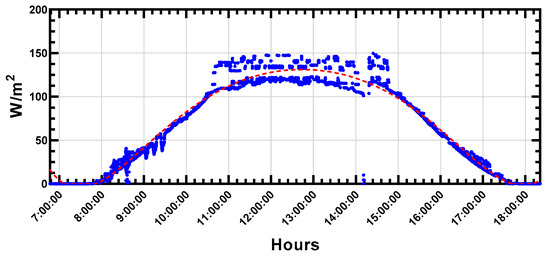
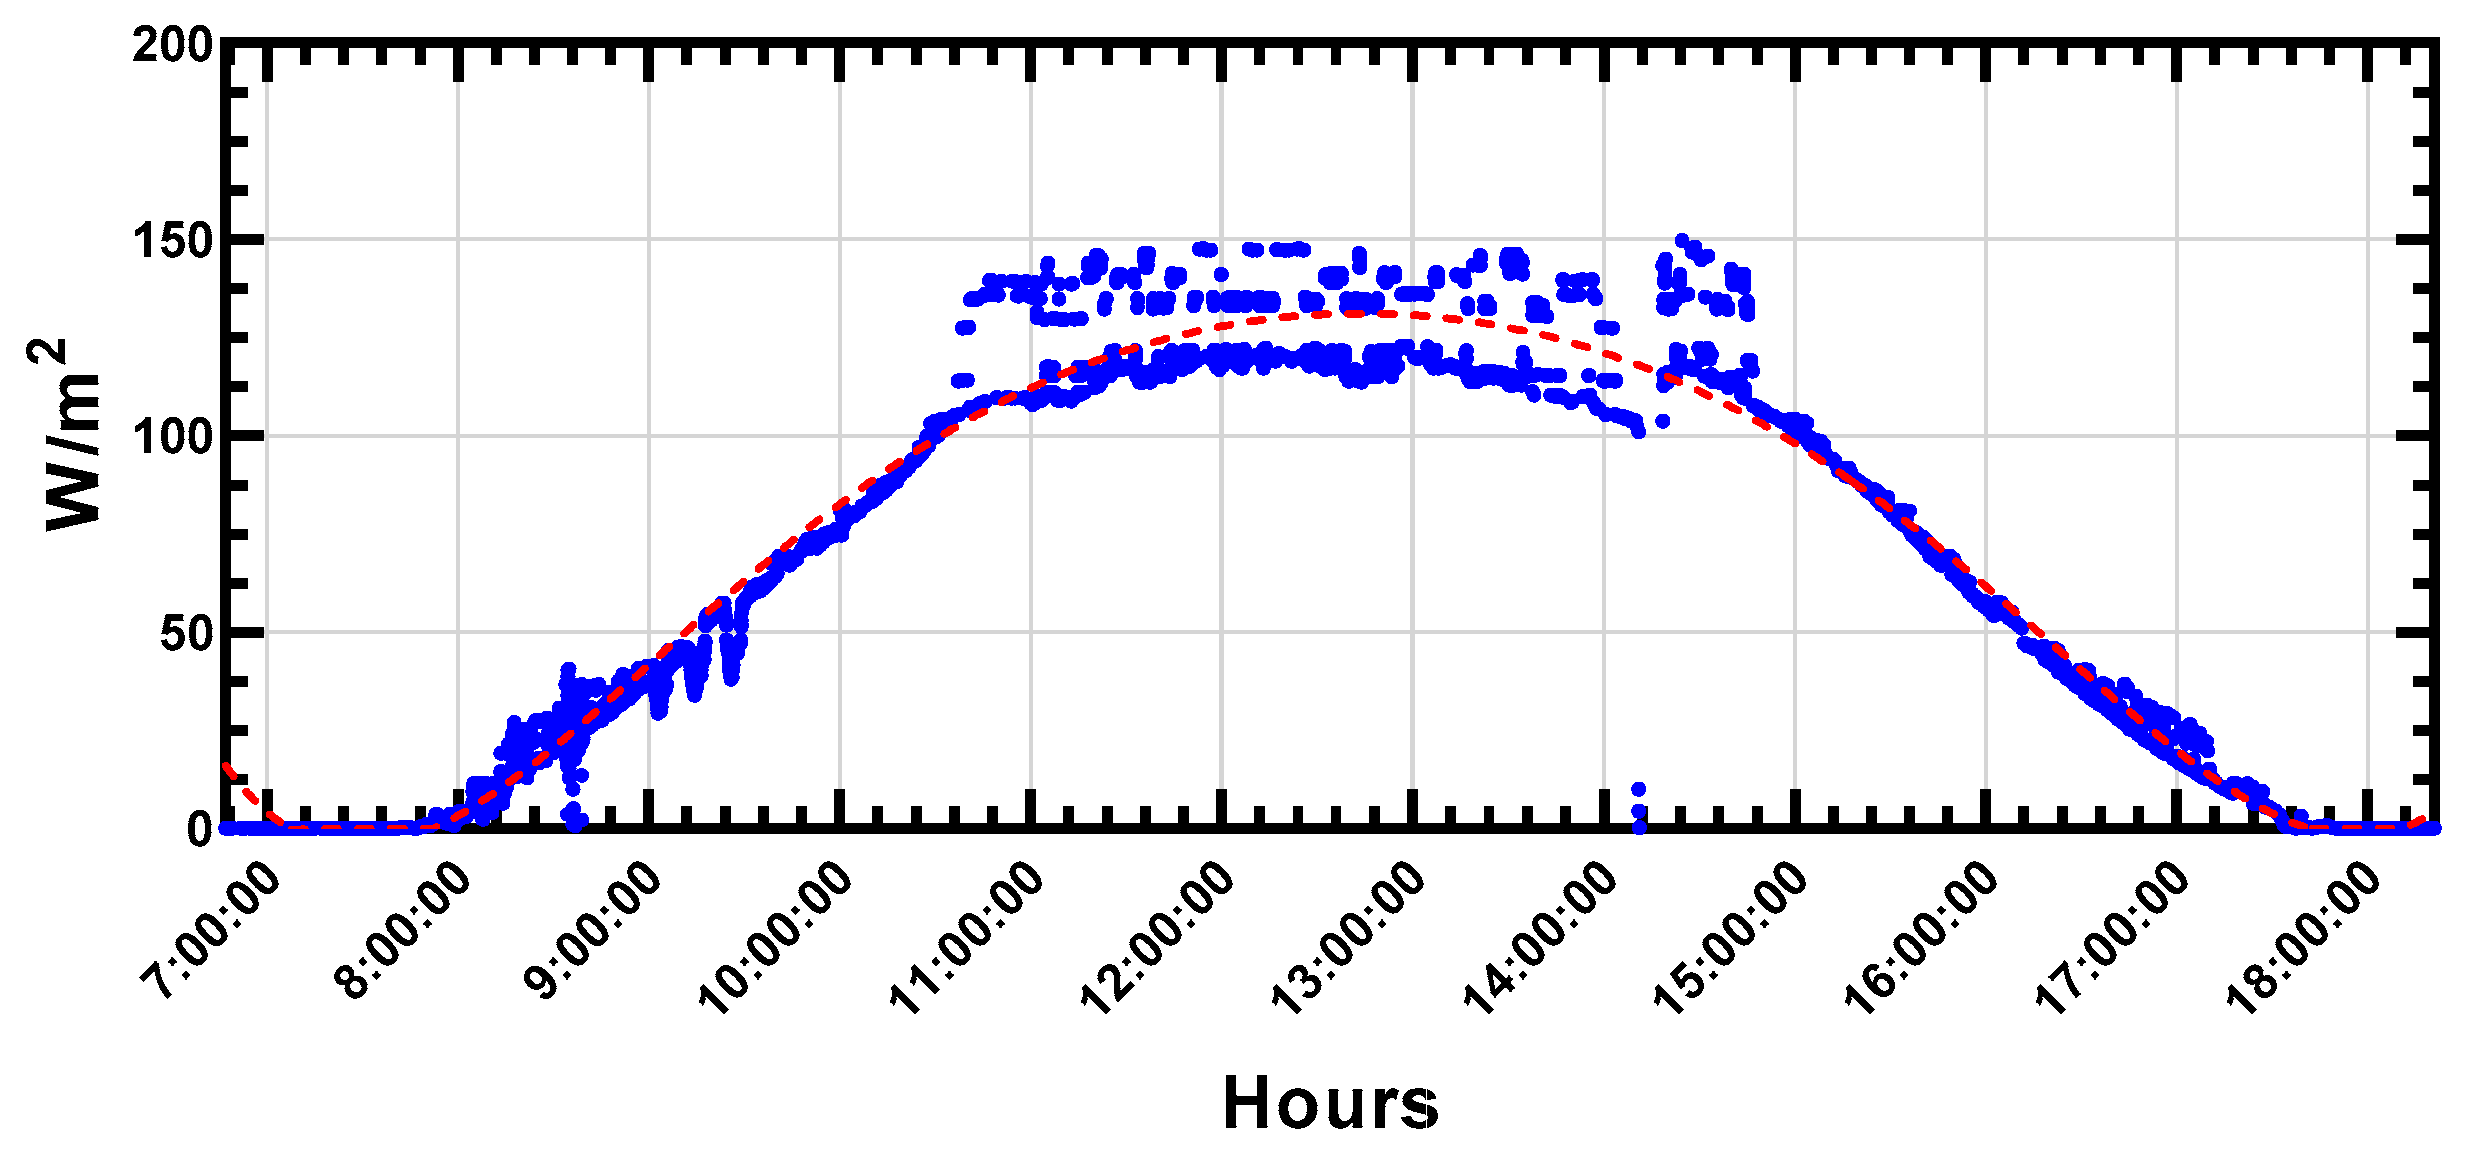
Figure 15 shows the behavior of solar radiation throughout the day. Taking into account the parameters of the “Lux” sensor (purple color) and the “Power” sensor (blue color).
Figure 15.
Interpolation in W/m2, estimated based on the FPGA, and polynomial function dash lines.
With respect to the “Lux” sensor, direct solar radiation was perceived with greater precision during periods of low solar radiation such as dawn and dusk, since the high resolution offered by the TSL2591 sensor in low light conditions was taken advantage of, thanks to the sensing of the photon’s incident on the sensor’s photodiodes. In relation to power, it was observed that, upon reaching the most energetic period of the day, the INA260 sensor and the PV cell as a whole perceived the global solar radiation with greater precision, by virtue of the area of the PV cell.
With the data captured by these sensors, a graph was generated in order to achieve a higher resolution and therefore obtain reliability and accuracy, in contrast to proprietary global radiation sensing systems that have a very high cost.
To perform methodological validation, it was essential to reconcile the different sampling rates between the FPGA system (3 s) and the INIFAP reference pyranometer (15 min). Direct comparison was not feasible; therefore, a temporal aggregation method was implemented.
The irradiance data measured by the FPGA system (calculated from Equation (3)) were grouped and averaged at 15 min intervals. This process generated a time series with data points that partially coincided with the pyranometer timestamps, allowing for direct and statistical comparison.
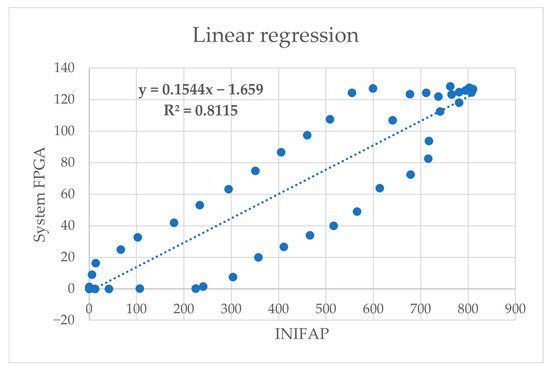
To quantify the performance of the system, a linear regression analysis was performed comparing the data generated by the FPGA system (dependent variable) against the pyranometer (independent variable). Figure 16 shows this correlation.
Figure 16.
Linear regression analysis comparing the average irradiance of the FPGA system (Y-axis) against the irradiance of the INIFAP pyranometer (X-axis).
The analysis yielded a coefficient of determination (R2) of 0.8115. This value, which is close to one, demonstrates a linear correlation. This validates that the electrical power generated by the photovoltaic cell, as measured by the system presented in this study, acted as a direct and reliable proxy for incident solar irradiance.
The trend line equation (y = 0.1544x − 1.659) derived from the regression is:
- The slope (0.1544) represents the actual average conversion efficiency (15.44%) of the photovoltaic cell during the measurement period, which is consistent with the manufacturer’s specifications (17%).
- The y-intercept (b ≈ −1.659), close to zero, indicates a low offset error in the system.
Finally, to quantify the accuracy of the system in physical units, the Root Mean Square Error (RMSE) was calculated between the pyranometer values and the values predicted by the regression model. An average RMSE value of 21.68 W/m2 was obtained between the system presented in this study and the reference pyranometer.
This RMSE value provides a substantial error metric, in contrast to a percentage comparison, quantifying the average magnitude of the system error in the units of interest (W/m2). These results validate the FPGA system as a low-cost, linear monitor for tracking solar irradiance.
It should be noted that the experimental tests presented in this paper were conducted primarily under clear sky conditions. Future validation of the system should include comprehensive testing under various weather conditions, such as cloudy skies, fog, or seasonal variations, to fully characterize the system’s performance in low irradiance or high diffuse component scenarios.
4.5. FPGA-Based Estimation Interpolation Compared to an Arduino-Implemented System
The solar radiation estimation obtained in real time based on the FPGA, was compared with the estimation obtained with another system developed and implemented in a platform containing an MCU “Arduino Uno”, in both cases the same configuration parameters, the same time instant, and the same conditions in the measurements were used.
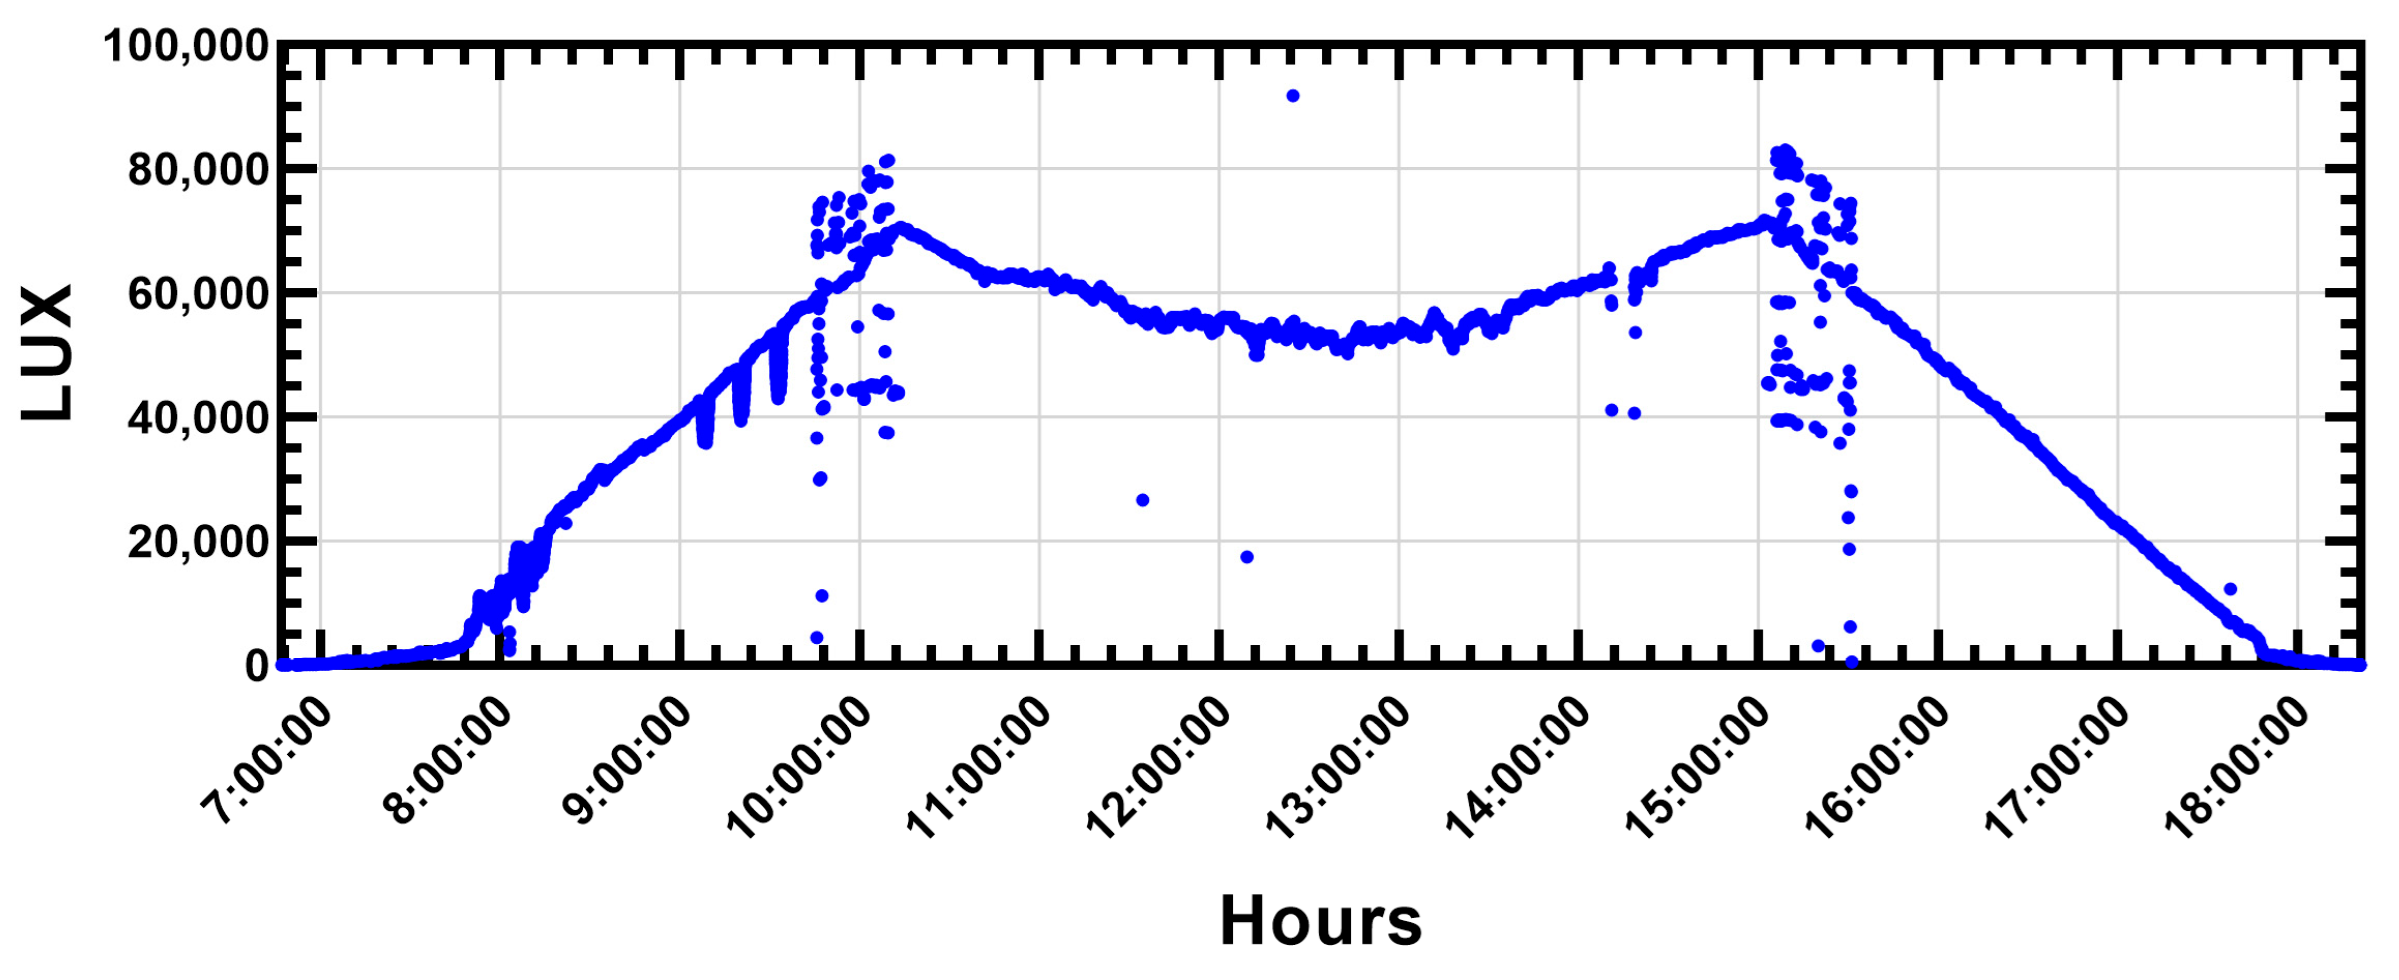
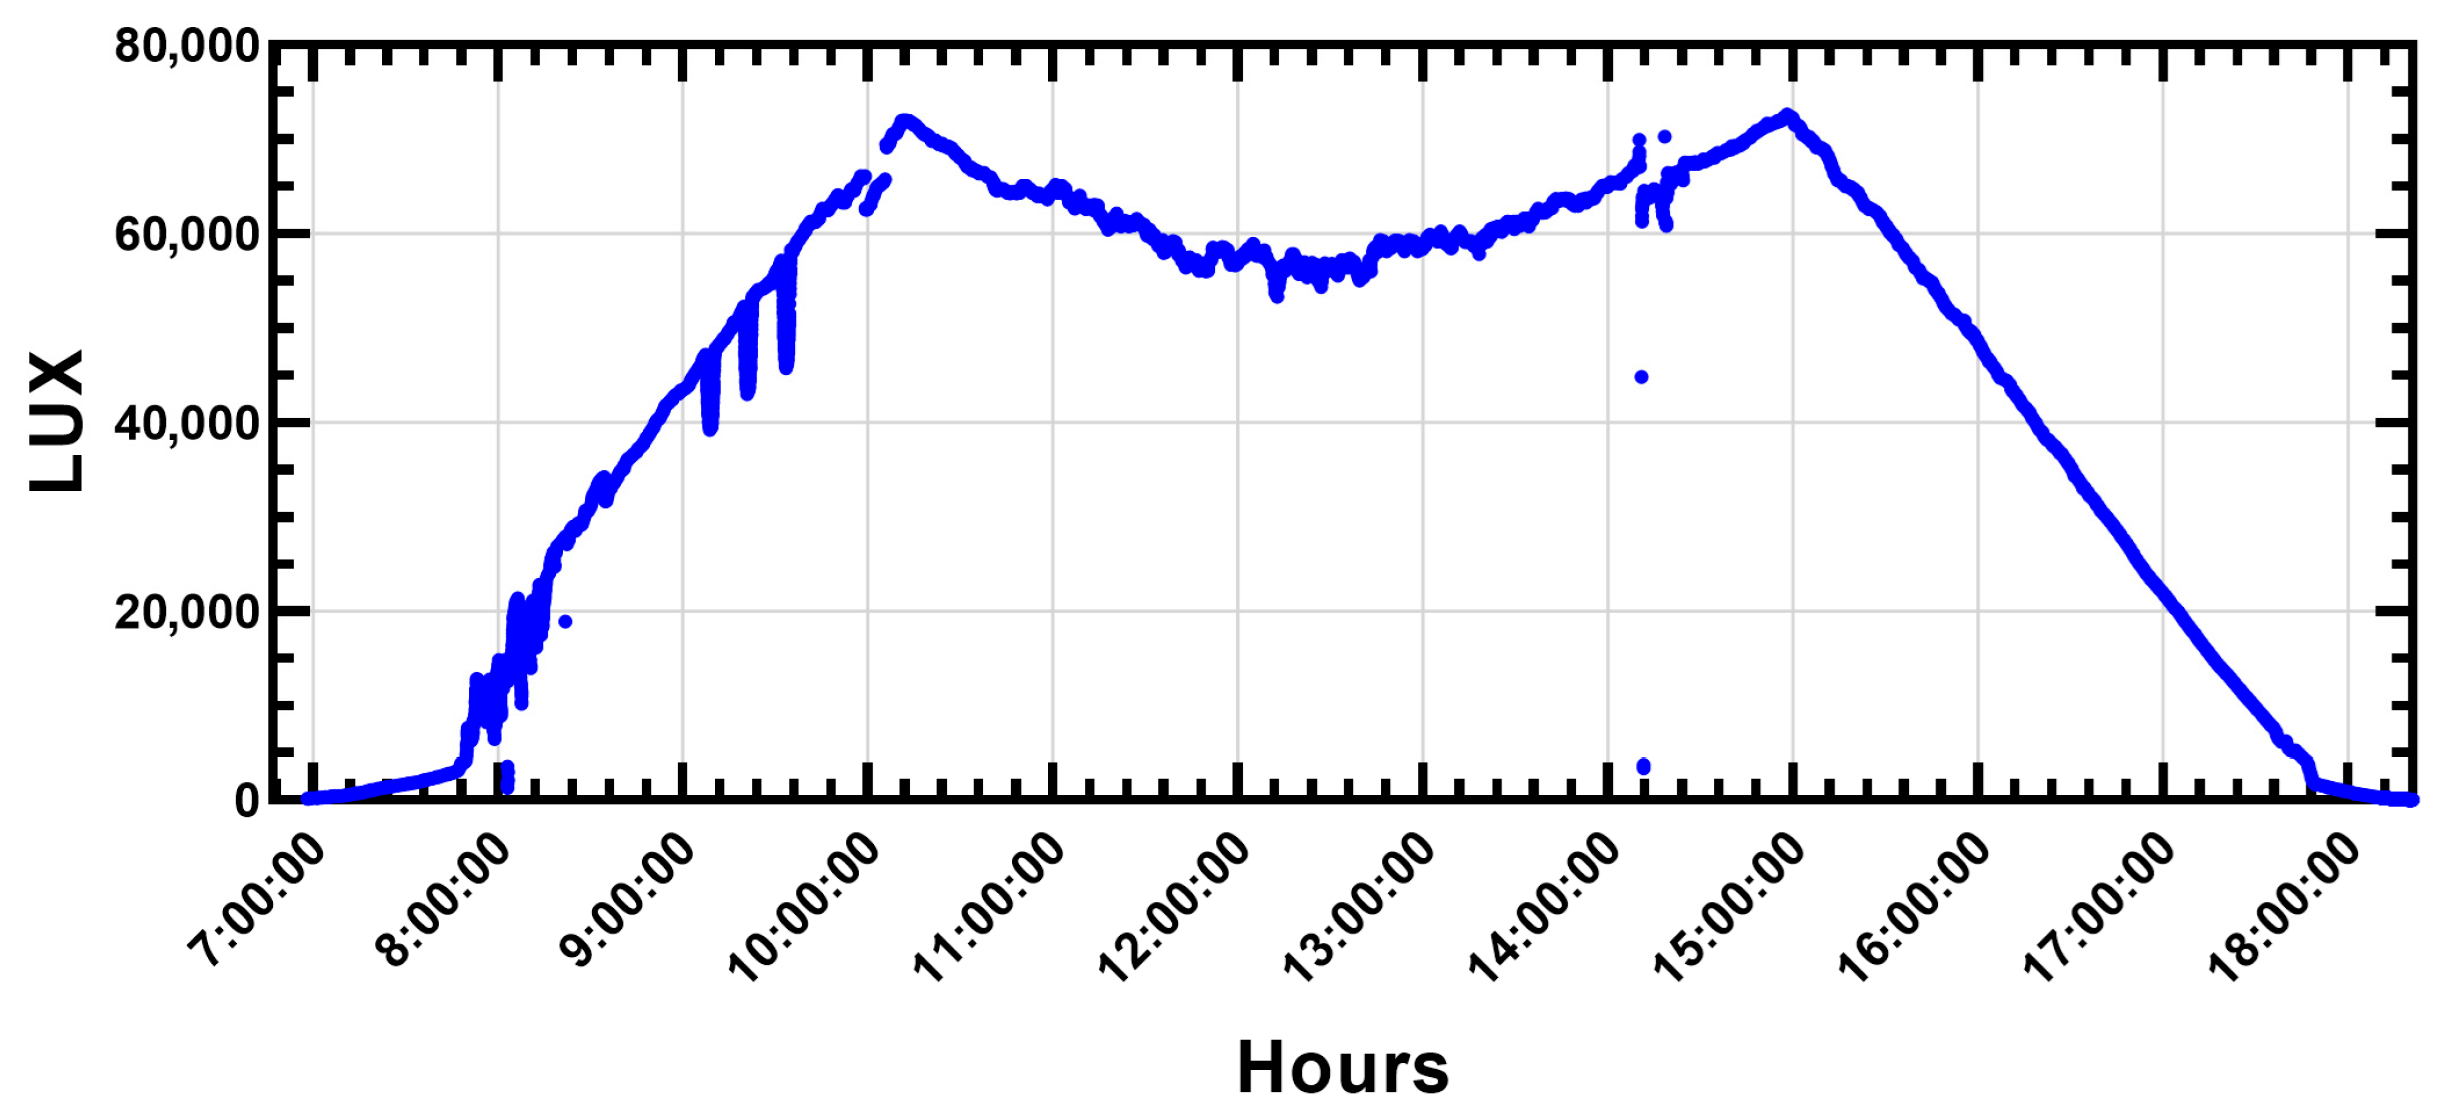
In Figure 17 the behavior of the solar radiation with respect to the “Lux” sensor implemented in the FPGA-based system is observed, and in Figure 18 the behavior of the solar radiation is observed with the Lux values now captured by the system implemented in the other platform. As can be seen, the estimates are very similar, which allowed us to verify the correct operation of both systems. The FPGA-based system offers the advantages of greater sensitivity, performing a real-time sampling, by which minimal changes in solar radiation are perceived throughout the day, as well as any disturbance in the environment, providing greater fidelity.
Figure 17.
Data captured based on the FPGA.
Figure 18.
Data captured based on the other platform.
4.6. Interpolation of FPGA-Based Estimation Compared with “INIFAP”
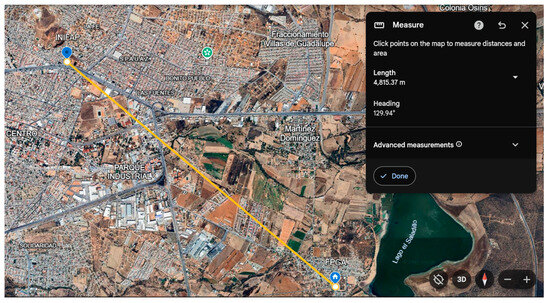
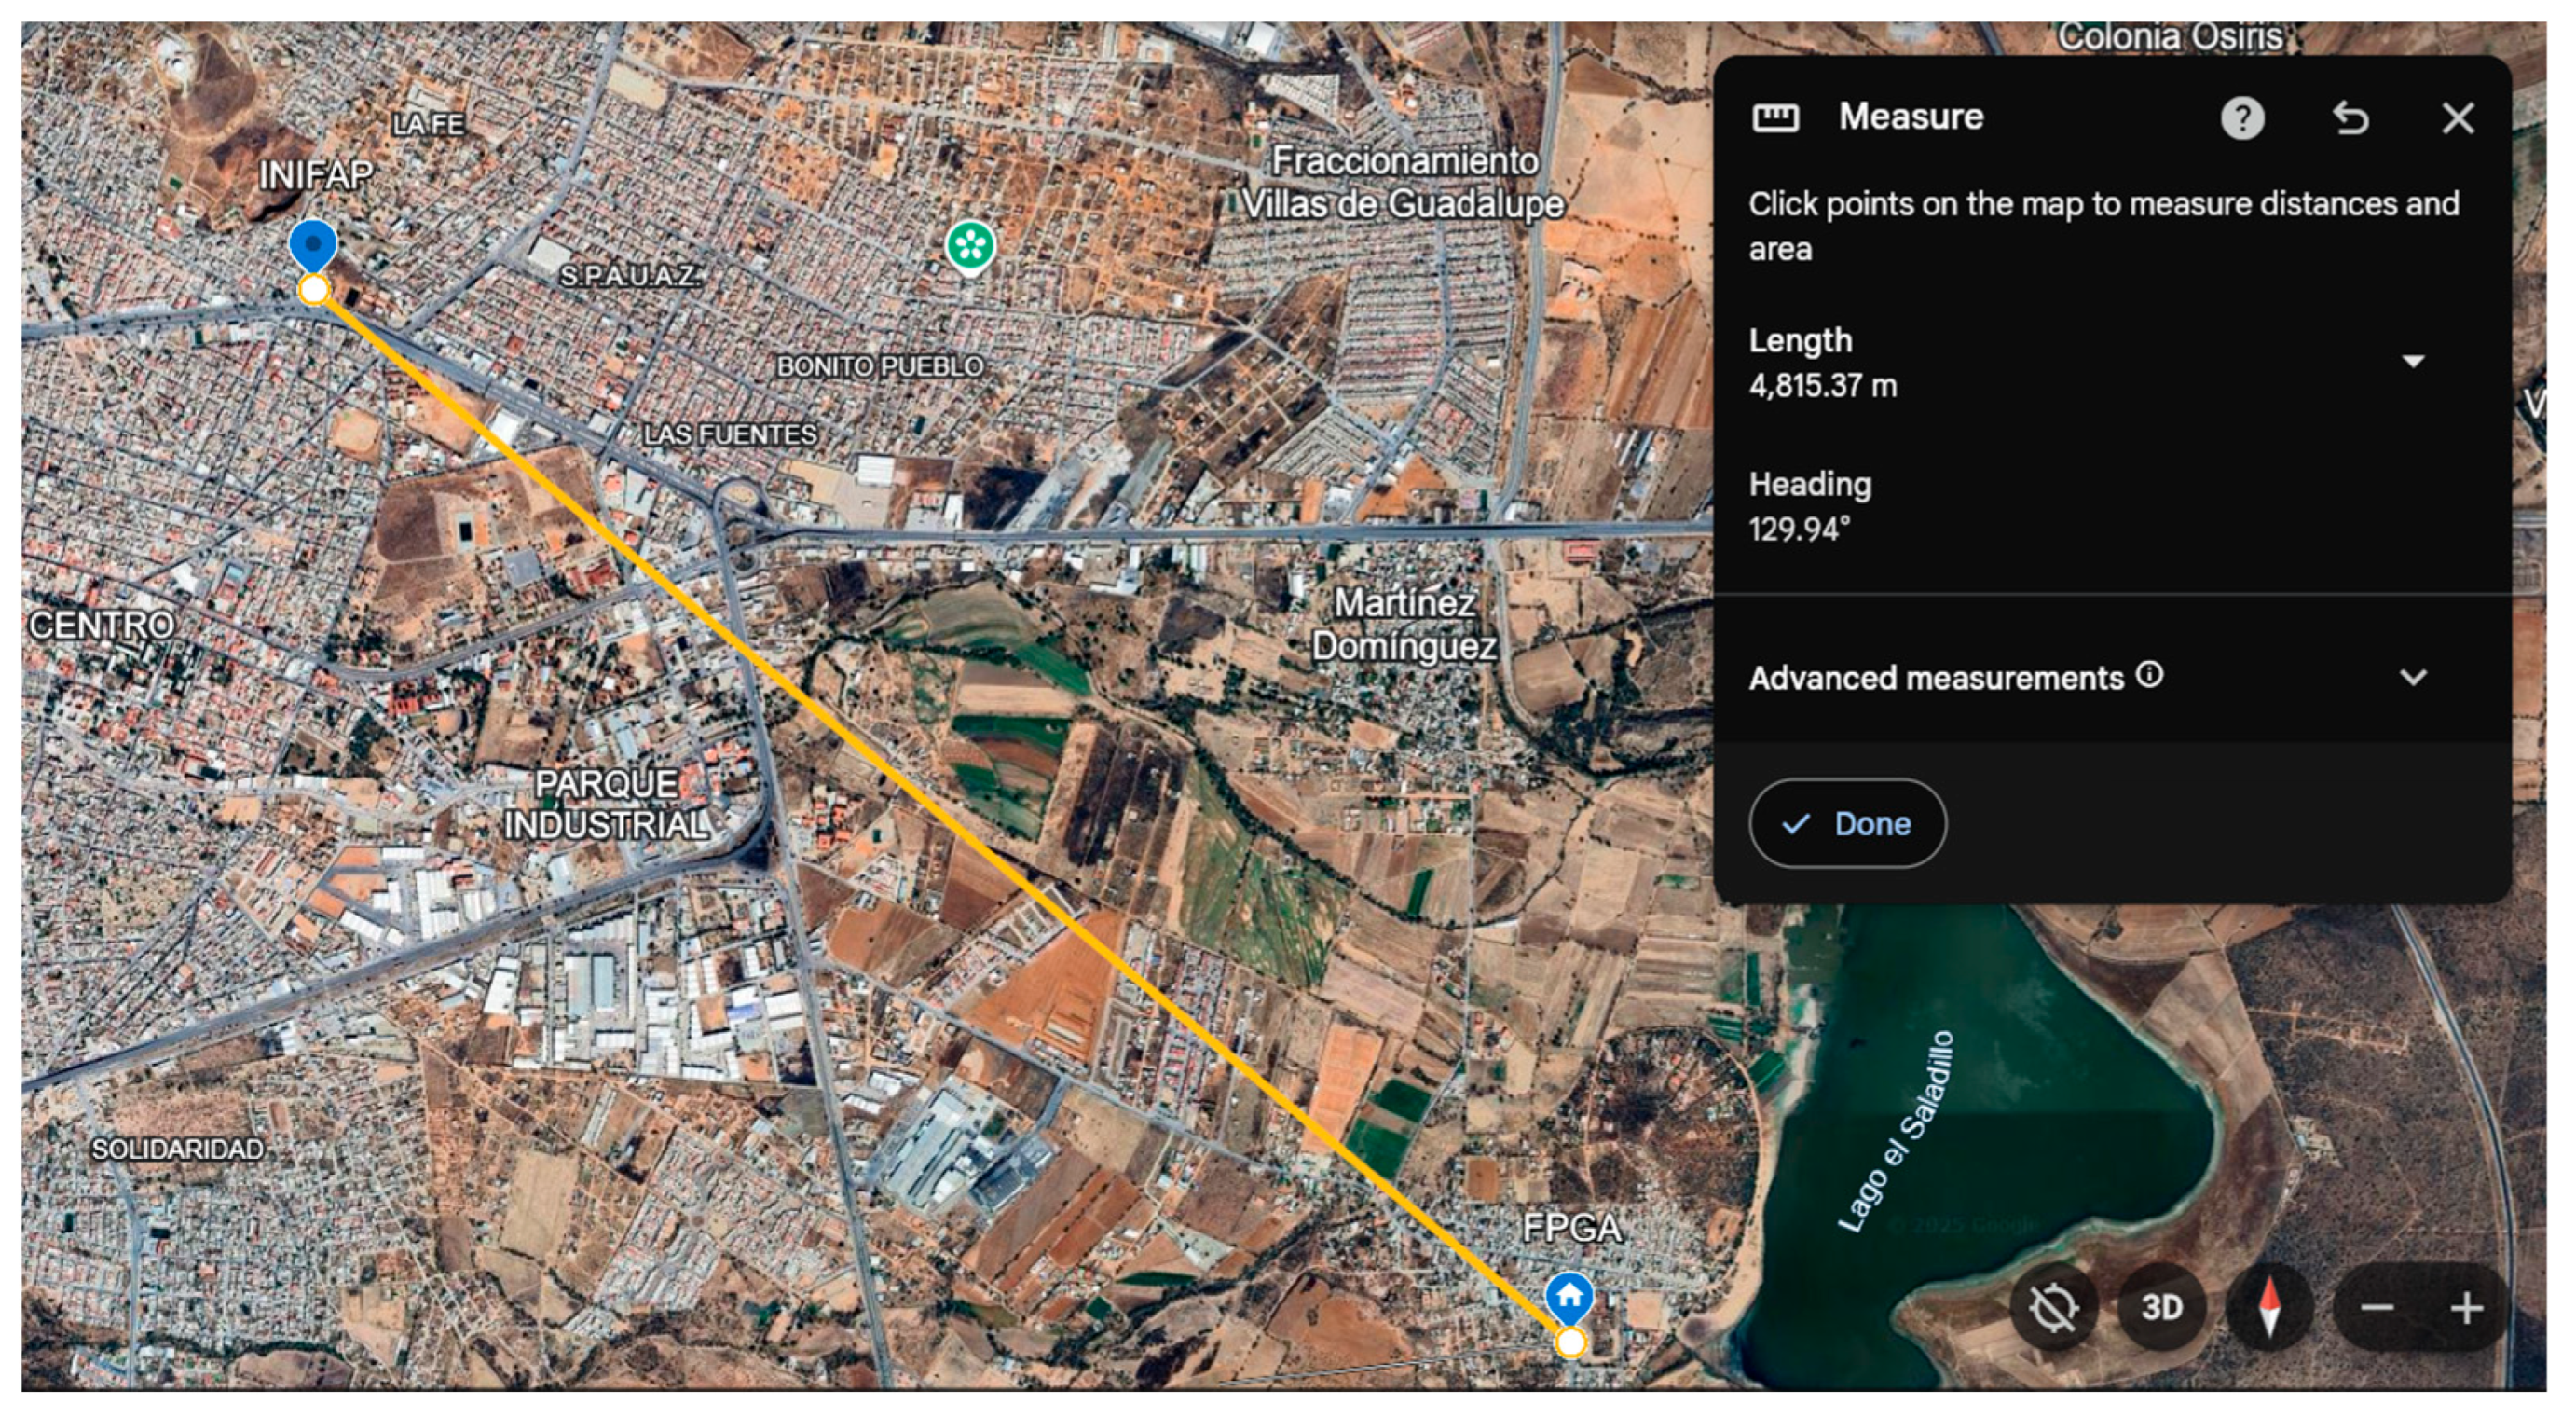
The estimation of the FPGA-based system was compared with the measurement of a meteorological station that measures solar radiation, which belongs to the National Institute of Forestry, Agriculture and Livestock Research (INIFAP) in the state of Zacatecas. The “INIFAP” station is located at longitude −102.5108234, latitude 22.7572833 and altitude 2290.6913548 masl. In contrast, the estimate obtained by the FPGA-based system was captured at longitude −102.4747504, latitude 22.729409 and altitude 2216.310519 masl [42]. Between the two locations where the results were captured, there is a distance of approximately 4.8 km [42], as can be seen in Figure 19.
Figure 19.
Distance between capture sites [42].
The “INIFAP” system for measuring solar radiation uses a pyranometer with a resolution of 99% in relation to the efficiency of the transformation of energy into solar radiation. The main purpose of the system is to measure the radiation that exists in one square meter. For example, if there were 1000 W of power in a square meter, the pyranometer would register a value of 990 W/m2. In Figure 20 a screenshot of the official “INIFAP” web site is shown.
Figure 20.
“INIFAP” Website.
It is important to mention that the maximum efficiency of commercial PV cells manufactured with monocrystalline silicon is 17%, such as the one used in this system. Although there are PV cells with efficiencies of up to 33%, these are used exclusively in very small satellites due to their high production costs.
The agroclimatic station of the INIFAP used as a reference for measuring solar irradiance is based on a commercial pyranometer, an instrument widely used in meteorological and environmental monitoring applications due to its high accuracy and stability. This device allows global irradiance values to be obtained by detecting solar radiation incident on a flat surface. Table 2 below shows the main technical characteristics of a commercial pyranometer used to compare the measurements of the proposed system.
Table 2.
Technical specifications of the DELTA OHM LP PYRA 03AV commercial pyranometer.
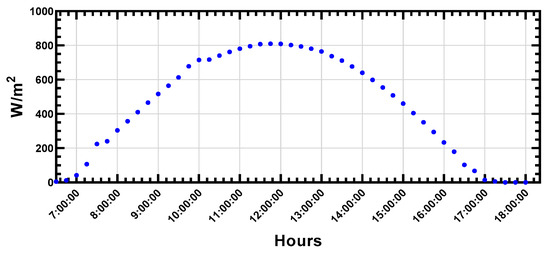
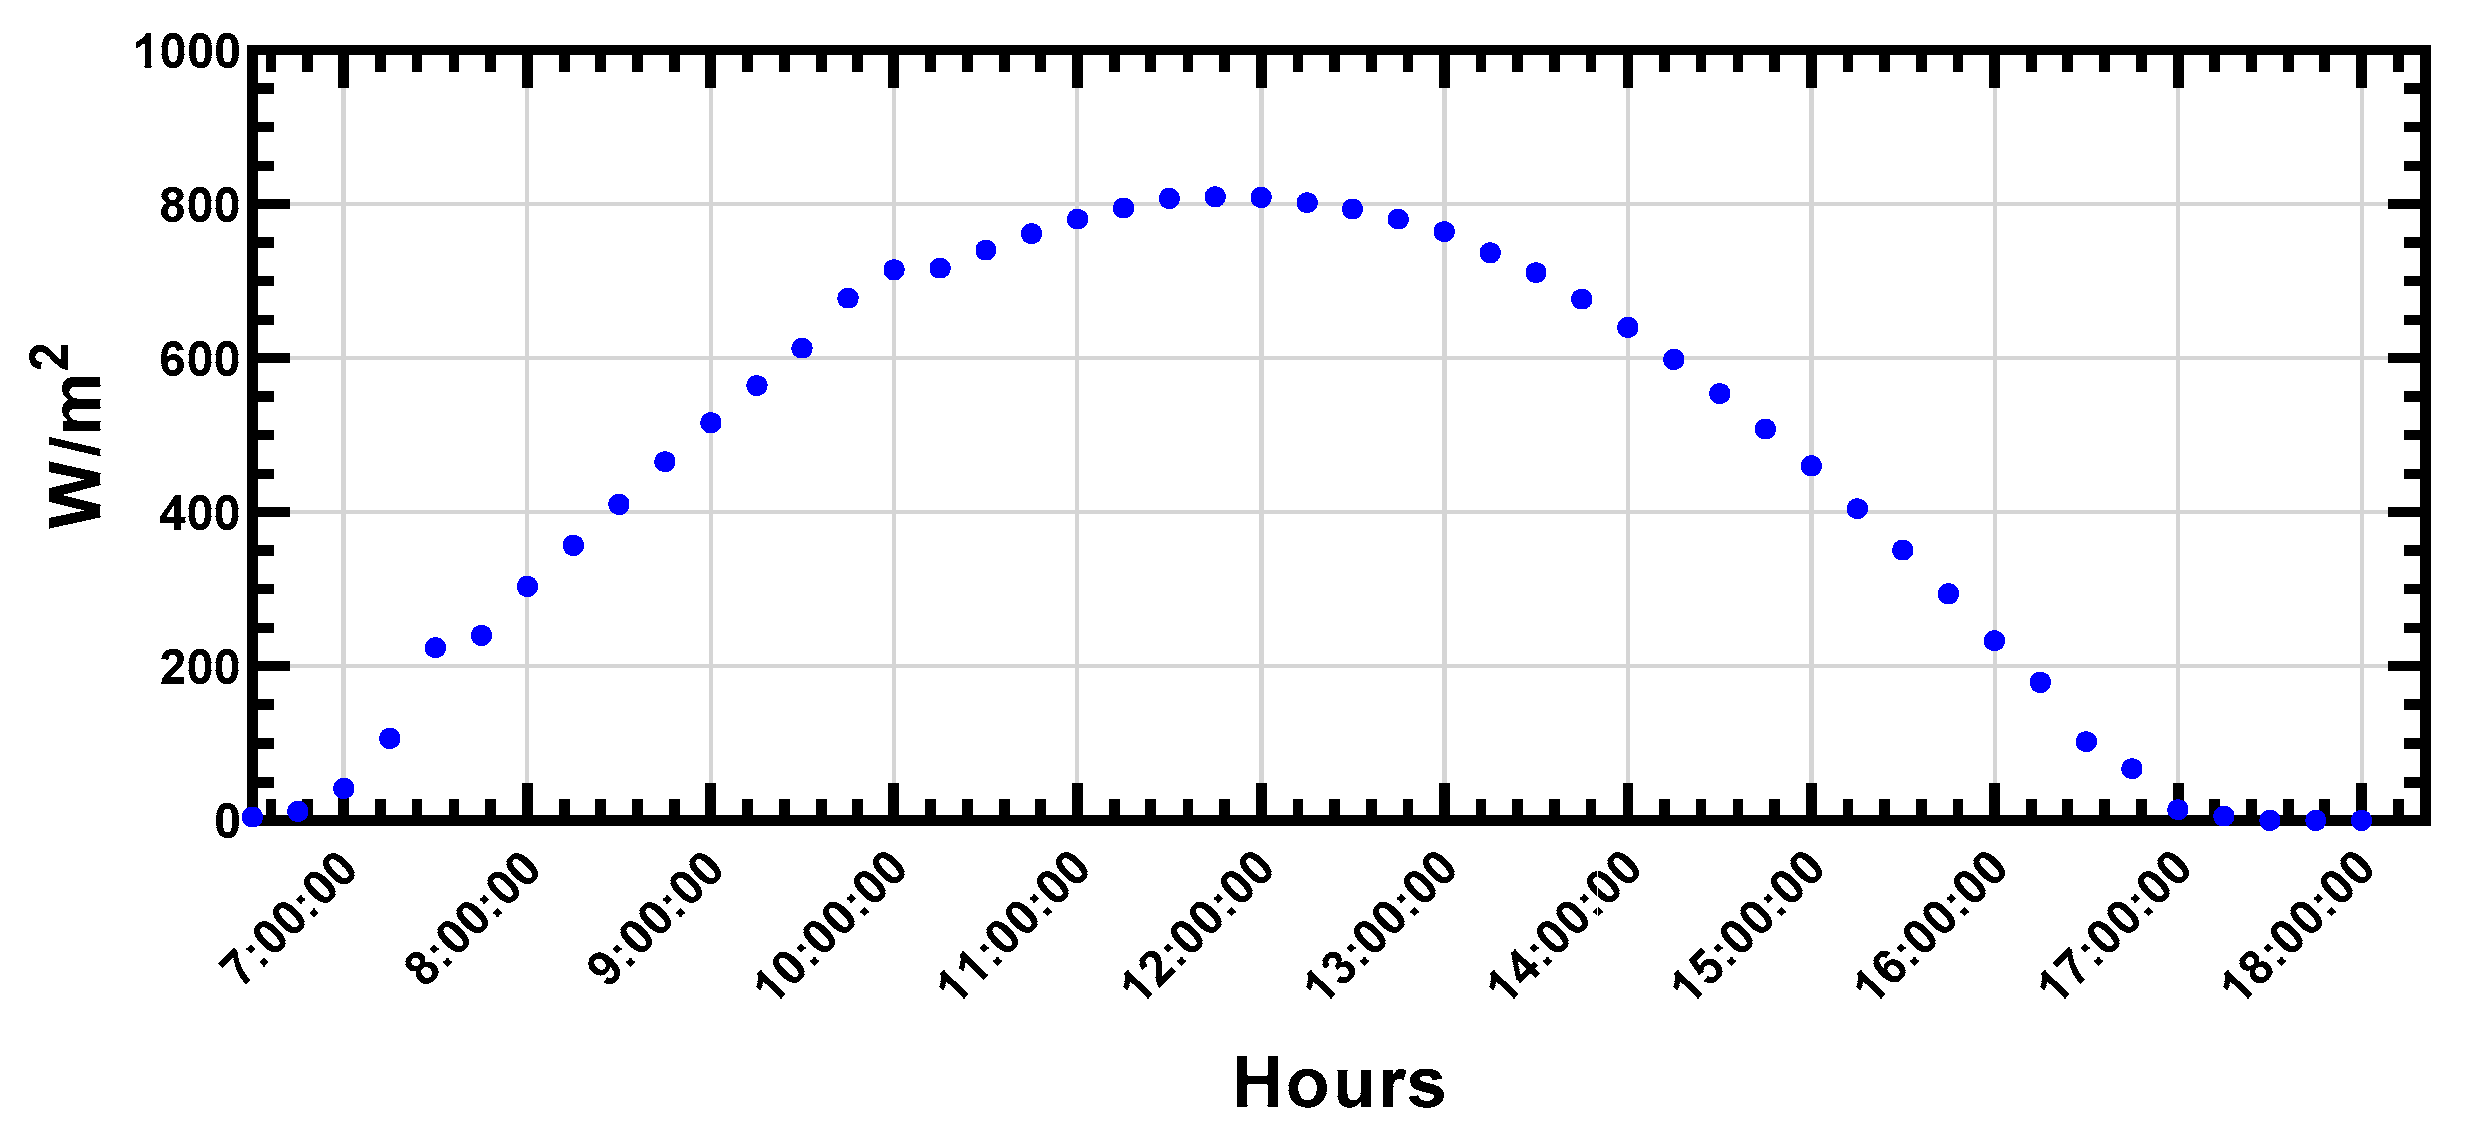
Figure 21 shows the data in W/m2 obtained from the “INIFAP” meteorological station, and in Figure 22 those captured by the solar radiation estimated by the FPGA-based system are shown. As can be seen, there is a clear similarity between both; however, the difference in scale is also noticeable, since the “INIFAP” system captures with a sampling time of 15 min, and presents the peak of solar radiation (also called Zenit) at 11:45 a.m. with a value of 810.1 W/m2. The FPGA based system obtained a value of 139.1092052 W/m2 at 11:44:32 a.m., being the closest point compared to the “INIFAP” one. Furthermore, the results of the graph show that there is a similarity with the dashed line representing the polynomial function.
Figure 21.
Solar radiation measured by “INIFAP”.
Figure 22.
Solar radiation estimated by the FPGA-based system, and polynomial function lines.
The similarity between the values of both systems is presented because, if the value of the pyranometer of the “INIFAP” were to be 100% of the solar radiation existing in a square meter, then when multiplied by the value of the efficiency of the PV cell used in the system based on the FPGA, a clear similarity would be observed between the value obtained by the system based on the FPGA (139.1092052 W/m2) and the value obtained from the “INIFAP” when multiplying by the PV cell efficiency factor (137.717 W/m2). The percentage difference between both systems is 1.01917461%, which was calculated with Equation (4), where it was determined that the “real value” was the one obtained by the “INIFAP” and the “measured value” was the one captured by the FPGA-based system.
The proposed design makes reduced use of the logical resources available in the FPGA, specifically Slice Flip-Flops, Look-Up Tables (LUTs), and global multiplexer buffers (BUFGMUX). This optimization reduces power consumption, lowers propagation latency, and improves system stability by minimizing internal critical paths. In addition, the low use of resources contributes to greater efficiency in hardware utilization, facilitating the integration of additional modules without requiring a higher-capacity FPGA. The reduced use of BUFGMUX also improves clock distribution and global synchronization, enhancing the reliability and real-time performance of the sensing system.
The FPGA is the component where the management functions for monitoring solar irradiance were carried out, as well as communication with the visual application. Solar irradiance monitoring was implemented in the Spartan-3E FPGA. It is a low-cost, low-power FPGA offering limited resources based on Slice Flip Flops, LUTs and BUFGMUX. Table 3 summarizes the logic.
Table 3.
Information of the FPGA Spartan-3E (Device XC3S100E).
5. Conclusions
The system involves the description and implementation of solar radiation sensing and measurement, embedded in HW, specifically in an FPGA, which allowed us to know in an effective and efficient way how the Lux and Power parameters operate in real time using low-cost and low-power consumption sensors.
In the development of the FPGA-Based system, it was found that the useful solar radiation for PV panels, which was found in the visible band belonging to the so-called solar spectrum and which allowed us to determine that the parameters which needed to be measured were the illuminance and irradiance, were the SI units Lux (lumen/meter2) and W/m2, respectively. Based on the above, a sensing and data-capture system that estimated solar irradiance using “Lux” and “Power” sensors was designed and described in HW descriptive language. A visual application was also developed with the objective of monitoring and interpreting the sensed data, as well as displaying and graphing them, and performing the communication between the FPGA-based system and the Host, allowing the control of the data capture. Taking into account that the communication was performed by means of a serial cable.
The solar radiation sensing and measurement system implemented in the FPGA could enable experts in PV power generation systems to estimate solar radiation levels in a given geographical location. Therefore, calculating the efficiency and performance in PV power generation systems, facilitating the planning and design of the same, which can help the environment by combating global warming, from the use of clean energy such as solar energy. The linear correlation obtained statistically validates the accuracy of the system. Instead of a percentage comparison, accuracy was quantified by obtaining a low RMSE. In addition, the regression slope analysis served as an experimental validation of the average conversion efficiency of the photovoltaic cell, which was consistent with the manufacturer’s specifications. It was recognized that this validation was performed under mostly clear sky conditions. The estimate obtained with the detection system implemented in the FPGA was similar to that obtained with a system that used a pyranometer.
In conclusion, the FPGA-based solar radiation sensing and measurement system, in addition to having a high resolution, also has a low cost, when compared to the cost of the pyranometer-based sensing system, since the pyranometer alone is approximately $1100 dollars, while the cost of the sensors and PV cell used in the FPGA-based system is only approximately $20 dollars. While the FPGA-based system is effective, the efficiency of current PV cells limits the scope of the system. It is important to comment that, other functions can be added to the current FPGA-based system, such as remote control and monitoring by implementing a radio frequency or a Wi-Fi module to send and receive data to a server; the data could be displayed on a Website, a mobile application or the visual application created for this system. There is also the possibility of adding an option that allows the system to take samples, consistently, at certain times.
Future work should include testing under variable weather conditions, such as cloudy skies or seasonal variations, to fully characterize the system’s performance. In conclusion, the proposed FPGA-based system is a viable, accurate, linear, and very low-cost solution for monitoring solar irradiance. It offers a reliable alternative to expensive pyranometers for applications in photovoltaic plants, agriculture, or environmental monitoring.
Author Contributions
Conceptualization, R.D.J.R.-M., O.O.O.-G. and S.I.-D.; methodology, O.O.O.-G., S.I.-D. and R.S.-A.; formal analysis, R.D.J.R.-M., S.I.-D. and V.I.R.-A.; investigation, O.O.O.-G., A.G.-D. and J.R.G.-R.; resources, R.S.-A., J.R.G.-R. and V.I.R.-A.; writing—original draft preparation, R.D.J.R.-M., O.O.O.-G. and J.R.G.-R.; writing—review and editing, R.D.J.R.-M., V.I.R.-A. and H.A.G.-O.; visualization, A.G.-D., R.S.-A. and H.A.G.-O.; supervision, O.O.O.-G. and H.A.G.-O.; project administration, R.D.J.R.-M., A.G.-D. and S.I.-D. All authors have read and agreed to the published version of the manuscript.
Funding
This research received no external funding.
Institutional Review Board Statement
Not applicable.
Informed Consent Statement
Not applicable.
Data Availability Statement
The original contributions presented in the study are included in the article, further inquiries can be directed to the corresponding author.
Conflicts of Interest
The authors declare no conflicts of interest.
Abbreviations
The following abbreviations are used in this manuscript:
| ADC | Analog to Digital Converter |
| AMS | Austria Mikro Systeme (ams-OSRAM) |
| ASM | Algorithmic State Machine |
| BAUD | Baud Rate (bits per second) |
| CH0 | Channel 0 |
| CH1 | Channel 1 |
| CLK | Clock |
| COM | Communication Port |
| CPU | Central Processing Unit |
| CSV | Comma-Separated Values |
| DB | Database (or connector type DB9) |
| DC | Direct Current |
| EN | Enable |
| FPGA | Field Programmable Gate Array |
| FSM | Finite State Machine |
| FSMD | Finite State Machine with Datapath |
| GPS | Global Positioning System |
| GPVMS | irradiance G measured with a PVMS |
| GTS | Gateway Time Synchronizer |
| GUI | Graphical User Interface |
| HW | Hardware |
| I | Current |
| I/O | Input/Output |
| I2C | Inter-Integrated Circuit |
| IEEE | Institute of Electrical and Electronics Engineers |
| INIFAP | Instituto Nacional de Investigaciones Forestales, Agrícolas y Pecuarias (in Spanish) |
| IP | Intellectual Property (core/module) |
| IR | Infrared |
| Isc | Circuit Current |
| ISE | Integrated Software Environment |
| Lux | Illuminance (lumens per square meter) |
| LX | Unit of measurement of illuminance |
| m.a.s.l | Stands for meters above sea level |
| mA | Milliampere |
| MCU | Microcontroller Unit |
| mm | Millimeter |
| MPP | Maximum Power Point |
| MPPT | Maximum Power Point Tracker |
| mΩ | Milli-ohm |
| nm | Nanometer |
| NN | Neural Network |
| PC | Personal Computer |
| PIN | Physical Input/Output Pin |
| Pmax | Maximum power |
| PV | Photovoltaic |
| PVMS | PV module irradiance sensor |
| RD | Read (control signal) |
| RESET | Reset to initial state |
| RS232 | Recommended Standard 232 (Serial Communication) |
| RXD | Receive Data |
| SIM | Solar Irradiance Mote |
| SIM | Solar Irradiance Motes |
| SW | Software |
| TI | Texas Instruments |
| TXD | Transmit Data |
| UART | Universal Asynchronous Receiver-Transmitter |
| URL | Uniform Resource Locator |
| USB | Universal Serial Bus |
| V | Volt |
| VHDL | VHSIC Hardware Description Language |
| W | Watt |
| W/m2 | Watt per square meter (irradiance unit) |
| WR | Write (control signal) |
References
- Sparvoli, M.; Onmori, R.K.; Jorge, F.; Gazziro, M.A. Indium oxynitride (InNO) radiation sensors calibration. IEEE Sens. J. 2017, 17, 2372–2376. [Google Scholar] [CrossRef] [Scilit]
- Ma, J.; Bi, Z.; Shi, Y.; Man, K.L.; Pan, X.; Wang, J. OL-SVR based soft-sensor for real-time estimation of solar irradiance. In Proceedings of the IEEE Asia Pacific Conference on Circuits and Systems (APCCAS), Jeju, Republic of Korea, 25–28 October 2016; pp. 448–451. [Google Scholar] [CrossRef] [Scilit]
- López-Lapeña, O.; Pallas-Areny, R. Solar energy radiation measurement with a low–power solar energy harvester. Comput. Electron. Agric. 2018, 151, 150–155. [Google Scholar] [CrossRef] [Scilit]
- Pieters, J.G.; Deltour, J.M. Modelling solar energy input in greenhouses. Sol. Energy 1999, 67, 119–130. [Google Scholar] [CrossRef] [Scilit]
- Mancilla-David, F.; Riganti-Fulginei, F.; Laudani, A.; Salvini, A. A neural network-based low-cost solar irradiance sensor. IEEE Trans. Instrum. Meas. 2013, 63, 583–591. [Google Scholar] [CrossRef] [Scilit]
- Aljaghoub, H.; Alashkar, A.; Alami, A.H.; Tawalbeh, M. Prediction of Weather Patterns Using Linear Angstrom Model. In Proceedings of the Advances in Science and Engineering Technology International Conferences (ASET), Dubai, United Arab Emirates, 21–24 February 2022; pp. 1–3. [Google Scholar] [CrossRef] [Scilit]
- Karki, S.; Ziar, H.; Korevaar, M.; Bergmans, T.; Mes, J.; Isabella, O. Performance evaluation of silicon-based irradiance sensors versus thermopile pyranometer. IEEE J. Photovolt. 2020, 11, 144–149. [Google Scholar] [CrossRef] [Scilit]
- Venieris, S.I.; Kouris, A.; Bouganis, C.-S. Toolflows for mapping convolutional neural networks on FPGAs: A survey and future directions. ACM Comput. Surv. 2018, 51, 1–39. [Google Scholar] [CrossRef] [Scilit]
- Leccese, F. Remote-Control System of High Efficiency and Intelligent Street Lighting Using a ZigBee Network of Devices and Sensors. IEEE Trans. Power Deliv. 2013, 28, 21–28. [Google Scholar] [CrossRef] [Scilit]
- Kuo, Y.-S.; Pannuto, P.; Schmid, T.; Dutta, P. Reconfiguring the software radio to improve power, price, and portability. In Proceedings of the 10th ACM Conference on Embedded Network Sensor Systems, Toronto, ON, Canada, 6 November 2012; pp. 267–280. [Google Scholar] [CrossRef] [Scilit]
- Szilvási, S.; Babják, B.; Völgyesi, P.; Lédeczi, A. Marmote SDR: Experimental platform for low-power wireless protocol stack research. J. Sens. Actuator Netw. 2013, 2, 631–652. [Google Scholar] [CrossRef] [Scilit]
- Dello Sterpaio, L.; Marino, A.; Nannipieri, P.; Dinelli, G.; Davalle, D.; Fanucci, L. A Complete EGSE Solution for the SpaceWire and SpaceFibre Protocol Based on the PXI Industry Standard. Sensors 2019, 19, 5013. [Google Scholar] [CrossRef] [Scilit]
- Hajji, B.; Mellit, A.; Bouselham, L. Introduction to Field Programmable Gate Arrays (FPGA). In A Practical Guide for Simulation and FPGA Implementation of Digital Design; Springer: Singapore, 2022; Volume 1, pp. 3–18. [Google Scholar] [CrossRef] [Scilit]
- Zodpe, H.; Sapkal, A. FPGA-Based High-Performance Computing Platform for Cryptanalysis of AES Algorithm. In Computing in Engineering and Technology; Springer: Singapore, 2020; Volume 1, pp. 637–646. [Google Scholar] [CrossRef] [Scilit]
- Hernández-Calvino, M.; Geninatti, S.R.; Benavides-Benítez, J.I. Developing an MMX extension for the MicroBlaze soft processor. In Proceedings of the 2008 International Conference on Reconfigurable Computing and FPGAs, Cancun, Mexico, 3–5 December 2008; pp. 91–96. [Google Scholar] [CrossRef] [Scilit]
- Li, Y.; Zhan, J.; Jiang, W.; Wu, J.; Zhu, J. An FPGA based Network Interface Card with Query Filter for Storage Nodes of Big Data Systems. In Proceedings of the 2020 25th Asia and South Pacific Design Automation Conference (ASP-DAC), Beijing, China, 13–16 March 2020; pp. 556–561. [Google Scholar] [CrossRef] [Scilit]
- Chen, H.; Zeng, Z. Design and Implementation of TSIP Interface Driver Based on FPGA. In Proceedings of the 2020 IEEE 4th Information Technology, Networking, Electronic and Automation Control Conference (ITNEC), Chongqing, China, 12–14 June 2020; pp. 2327–2330. [Google Scholar] [CrossRef] [Scilit]
- Hishikawa, Y.; Higa, M.; Takenouchi, T.; Ueda, Y.; Nishioka, K.; Kobayashi, T.; Minemoto, T.; Taniguchi, H.; Wakabayashi, H.; Yoshita, M. Improved precision of the outdoor performance measurements of photovoltaic modules by using the photovoltaic irradiance sensor. Sol. Energy 2020, 211, 82–89. [Google Scholar] [CrossRef] [Scilit]
- Achleitner, S.; Kamthe, A.; Liu, T.; Cerpa, A.E. SIPS: Solar irradiance prediction system. In Proceedings of the IPSN-14 Proceedings of the 13th International Symposium on Information Processing in Sensor Networks, Berlin, Germany, 15–17 April 2014; pp. 225–236. [Google Scholar] [CrossRef] [Scilit]
- da Costa, W.T.; Fardin, J.F.; Lauro de Vilhena, B.; Simonetti, D.S.L. Estimation of irradiance and temperature using photovoltaic modules. Sol. Energy 2014, 110, 132–138. [Google Scholar] [CrossRef] [Scilit]
- Ma, J.; Jiang, H.; Huang, K.; Bi, Z.; Man, K.L. Novel field-support vector regression-based soft sensor for accurate estimation of solar irradiance. IEEE Trans. Circuits Syst. I Regul. Pap. 2017, 64, 3183–3191. [Google Scholar] [CrossRef] [Scilit]
- Avalos, O.; Cuevas, E.; Valdivia-González, A.; Gálvez, J.; Hinojosa, S.; Zaldívar, D.; Oliva, D. A comparative study of evolutionary computation techniques for solar cells parameter estimation. Comput. Y Sist. 2019, 23, 231–256. [Google Scholar] [CrossRef] [Scilit]
- Gunasekaran, M.; Krishnasamy, V.; Selvam, S.; Almakhles, D.J.; Anglani, N. An Adaptive resistance perturbation based MPPT algorithm for Photovoltaic applications. IEEE Access 2020, 8, 196890–196901. [Google Scholar] [CrossRef] [Scilit]
- Grohe, A.; Knorz, A.; Alemán, M.; Harmel, C.; Glunz, S.W.; Preu, R.; Willeke, G.P. Fraunhofer-Institute-for-Solar-Energy-Systems. In Photovoltaics Report; Fraunhofer ISE: Freiburg, Germany, 2019; p. 490. [Google Scholar]
- Driesse, A.; Zaaiman, W.; Riley, D.; Taylor, N.; Stein, J.S. Indoor and outdoor evaluation of global irradiance sensors. In Proceedings of the 31st European Photovoltaic Solar Energy Conference, Hamburg, Germany, 14–18 September 2015; pp. 14–18. [Google Scholar]
- Vignola, F.; Peterson, J.; Chiu, C.-Y.; Dooraghi, M.; Sengupta, M.; Mavromatakis, F. Comparison of pyranometers and reference cells on fixed and one-axis tracking surfaces. In Proceedings of the ASES National Solar Conference Proceedings, Boulder, CO, USA, 8–11 August 2024. [Google Scholar] [CrossRef] [Scilit]
- Lorente, J.L.; Liu, X.; Morrow, D.J. Worldwide evaluation and correction of irradiance measurements from personal weather stations under all-sky conditions. Sol. Energy 2020, 207, 925–936. [Google Scholar] [CrossRef] [Scilit]
- Kohno, T.; Gokita, K.; Shitanishi, H.; Toyosaki, M.; Nakamura, T.; Morikawa, K.; Hatano, M. Fault-diagnosis architecture for large-scale photovoltaic power plants that does not require additional sensors. IEEE J. Photovolt. 2019, 9, 780–789. [Google Scholar] [CrossRef] [Scilit]
- Scolari, E.; Sossan, F.; Paolone, M. Photovoltaic-model-based solar irradiance estimators: Performance comparison and application to maximum power forecasting. IEEE Trans. Sustain. Energy 2017, 9, 35–44. [Google Scholar] [CrossRef] [Scilit]
- Cristaldi, L.; Faifer, M.; Rossi, M.; Toscani, S. An improved model-based maximum power point tracker for photovoltaic panels. IEEE Trans. Instrum. Meas. 2014, 63, 63–71. [Google Scholar] [CrossRef] [Scilit]
- Tan, R.H.; Tai, P.L.; Mok, V. Solar irradiance estimation based on photovoltaic module short circuit current measurement. In Proceedings of the 2013 IEEE International Conference on Smart Instrumentation, Measurement and Applications (ICSIMA), Kuala Lumpur, Malaysia, 25–27 November 2013; pp. 1–4. [Google Scholar] [CrossRef] [Scilit]
- Liu, Y.; Bebic, J.; Kroposki, B.; De Bedout, J.; Ren, W. Distribution system voltage performance analysis for high-penetration PV. In Proceedings of the 2008 IEEE Energy 2030 Conference, Atlanta, GA, USA, 17–18 November 2008; pp. 1–8. [Google Scholar] [CrossRef] [Scilit]
- Bernstein, A.; Reyes-Chamorro, L.; Le Boudec, J.-Y.; Paolone, M. A composable method for real-time control of active distribution networks with explicit power setpoints. Part I: Framework. Electr. Power Syst. Res. 2015, 125, 254–264. [Google Scholar] [CrossRef] [Scilit]
- Li Vigni, V.; La Manna, D.; Riva Sanseverino, E.; Di Dio, V.; Romano, P.; Di Buono, P.; Pinto, M.; Miceli, R.; Giaconia, C. Proof of concept of an irradiance estimation system for reconfigurable photovoltaic arrays. Energies 2015, 8, 6641–6657. [Google Scholar] [CrossRef] [Scilit]
- Oliveri, A.; Cassottana, L.; Laudani, A.; Fulginei, F.R.; Lozito, G.M.; Salvini, A.; Storace, M. Two FPGA-oriented high-speed irradiance virtual sensors for photovoltaic plants. IEEE Trans. Ind. Inform. 2017, 13, 157–165. [Google Scholar] [CrossRef] [Scilit]
- Ordaz-García, O.O.; Ortiz-López, M.; Quiles-Latorre, F.J.; Arceo-Olague, J.G.; Solís-Robles, R.; Bellido-Outeiriño, F.J. DALI Bridge FPGA-Based Implementation in a Wireless Sensor Node for IoT Street Lighting Applications. Electronics 2020, 9, 1803. [Google Scholar] [CrossRef] [Scilit]
- Ams-OSRAM-Group. Product Document-TSL2591—Light-to-Digital Converter. 2018; pp. 1–34. Available online: https://ams.com/documents/20143/36005/TSL2591_DS000338_6-00.pdf/090eb50d-bb18-5b45-4938-9b3672f86b80 (accessed on 4 January 2023).
- Texas-Instruments. INA260 Precision Digital Current and Power Monitor with Low-Drift, Precision Integrated Shunt. 2016; pp. 1–37. Available online: https://www.ti.com/lit/ds/symlink/ina260.pdf?HQS=dis-mous-null-mousermode-dsf-pf-null-wwe&ts=1618596812471&ref_url=https%253A%252F%252Fwww.mouser.mx%252F (accessed on 4 January 2023).
- Calderón, C.L.; Aguirre, J. Solar Cells as a Pedagogical Alternative in the Teaching of Electricity. Momento 2017, 55, 44–56. [Google Scholar] [CrossRef] [Scilit]
- Chu, P.P. FPGA Prototyping by VHDL Examples: Xilinx Spartan-3 Version; John Wiley & Sons: Hoboken, NJ, USA, 2011. [Google Scholar]
- Zhejiang-Dongshuo-New-Energy-Co. Ltd. Cómo Calcular el Ángulo Correcto Para Paneles Solares en Sistemas de Energía Solar. Conocimiento—DS New Energy. 2019; p. 1. Available online: https://www.dsisolar.com/info/how-to-figure-the-correct-angle-for-solar-pane-37641121.html (accessed on 23 January 2023).
- Google-Earth. 2025. Available online: https://earth.google.com/earth/d/1zEbwNyUT1hlqSBQZI74hIh3ZctqhwdjP?usp=sharing (accessed on 10 November 2025).



Disclaimer/Publisher’s Note: The statements, opinions and data contained in all publications are solely those of the individual author(s) and contributor(s) and not of MDPI and/or the editor(s). MDPI and/or the editor(s) disclaim responsibility for any injury to people or property resulting from any ideas, methods, instructions or products referred to in the content. |
© 2025 by the authors. Licensee MDPI, Basel, Switzerland. This article is an open access article distributed under the terms and conditions of the Creative Commons Attribution (CC BY) license (https://creativecommons.org/licenses/by/4.0/).