Abstract
The development of new tools to assist the system operator has been crucial in modern power systems due to the system complexity and operational challenges. Among these tools, the system’s load margin, which indicates the maximum load level allowed without instability occurring, stands out. The physical characteristics of the modern power system in the stability threshold condition and the abundant data from Phasor Measurement Units (PMUs) can be used by machine learning techniques to predict the load margins of power systems. This paper proposes a new Physics-Informed Neural Network for computing the precise value of the load margin of power systems equipped with PMUs adopting experimental and physical knowledge in the training process through three loss functions. A PMU allocation procedure is applied to reduce the number of PINN entries. Case studies applying the proposed PINN are performed on the IEEE 68-bus system, and comparative analyses are conducted with traditional Artificial Neural Networks (ANNs), Graph Neural Networks (GNNs) and Physics-Guided Neural Networks (PGNNs). Results show better Root Mean Square Error values for the proposed PINN compared to the ANN, GNN and PGNN for different numbers of PMUs allocated in the test system.
1. Introduction
In recent years, power system operations have become complex and challenging. Some causes of this situation are the massive integration of new energy sources with intermittent power generation such as wind and photovoltaic plants, the increase in temporary and permanent faults due to system expansion and sudden load changes in different regions of the system, among other causes [1,2,3]. Therefore, operation centers need to evaluate the power system in real time to ensure that the system operates safely in meeting demand and meeting performance requirements.
Advances in communication technologies and the need for data for the power system’s operation have promoted the development of Wide-Area Measurement Systems (WAMS), which, through a considerable number of Phasor Measurement Units (PMUs) allocated at some points of the generation, transmission and distribution systems, are capable of measuring three-phase voltages and currents with time synchronization and with high sampling rates [4]. These PMU data have aroused the interest of the scientific community and have been used to develop techniques that can assist the operation center in monitoring [5,6,7,8,9], controlling [10,11,12,13,14] and protecting [15,16,17] modern power systems, and the results achieved are promising.
In voltage stability studies, operation centers aim to, among other things, calculate the Voltage Stability Margin (VSM), which represents the maximum power transfer of the system for a given direction of load growth [18]. This index aims to calculate the maximum system load level that is allowed to safely ensure the stability of modern power systems. Over the decades, different techniques have been developed and improved to calculate the VSM, such as techniques based on continuation power flow [19,20], modal analysis [21] and Thevenin equivalents [22,23]. Unfortunately, the vast majority of these techniques cannot be applied in real time and only use concepts from static analysis (and power systems are dynamic systems). Furthermore, many model-based methods for calculating the VSM depend on a complete and detailed power system model, and this is not always possible. These methods also require reliable information about the entire system. VSM calculations using these methods are time-consuming and must be applied to each operating case of interest, making their real-time application difficult.
In recent years, the availability of PMU data and advances in machine learning techniques have sparked the interest of researchers and have been used in developing new techniques for calculating the VSM. Supervised machine learning techniques aim to obtain a model that best represents the relationship between the input and output data of an application based on a database of possible problem scenarios. The model obtained in this training stage is then used for scenarios not included in the training database, as actually occurs in the real world. Machine learning techniques are much faster at calculating output and can therefore be applied in real time. Artificial Neural Networks (ANNs) [24,25,26,27,28,29,30], Recurrent Neural Networks (RNN) [31], Graph Neural Networks (GNNs) [32], Deep Neural Networks (DNNs) [33], Decision Trees (DTs) [34,35], Long Short-Term Memory Networks [36], Random Forest [37], Convolutional Neural Networks [38] and Support Vector Machines (SVMs) [39] are some of the machine learning techniques that have been successfully applied in the calculation or monitoring of the VSM of power systems equipped with PMUs. Most of these methods only determine the VSM and do not assess whether the load level meets small-signal stability requirements, such as having well-damped oscillation modes.
A crucial aspect in the use of machine learning techniques is the construction of a database with all possible cases of the problem under study and in satisfactory quantities. The success of a machine learning technique depends on its ability to generalize to cases not considered in the training process. However, the vast majority of techniques based mainly on Neural Networks suffer from overfitting and difficulties in generalizing to cases not incorporated in the training and tuning stage of the Neural Networks. As a consequence, load margin predictions may be inadequate and impair the decision-making of the system operator.
A recently proposed and evaluated solution to this problem is the incorporation of physical knowledge of the nature of the problem into the training process of Neural Networks. Usually, these Neural Networks are called Physics-Informed Neural Networks (PINNs) [40], and these PINNs have been proposed in several research fields relating to modern power systems [41]. In [42], the authors propose a PINN for estimating the states of power systems equipped with PMUs by applying dynamic state estimation combined with Graph Neural Networks. The use of PINNs for nominal power flow and optimal power flow is also proposed, evaluated and discussed in [43,44,45,46]. The authors of [47] proposed to use PINNs for system identification in inverter-connected source-dominant systems. The use of PINNs for transient stability assessment in modern power systems was proposed and discussed in [48]. In [49], the authors aimed to apply Physics-Guided Neural Networks composed of two Neural Networks for load margin assessment in systems. The authors later developed new strategies for calculating the load margin [50,51]. Recent analyses also showed the potential application of PINNs in dynamic simulations, as assessed in [52,53]. The proposal to use PINNs to identify nonlinear systems was also discussed in [54]. The authors of [55] propose to use PINNs for correct prediction of spatio-temporal wind fields. In [56], the authors propose using PINNs and the Kalman filter algorithm for load identification in systems with high penetration of renewable sources. Thus, the potential for using a PINN in power systems is high in different applications. The results and conclusions provided by the authors show that the incorporation of physical knowledge of the problem in question, mainly in the loss function of the PINN training stage, promotes greater generalization of the PINN to cases not treated in the PINN training and design stage, allowing it to provide correct answers.
Thus, traditional VSM calculation techniques using machine learning tools can have their performance improved through the inclusion of knowledge of the power system in the stability threshold condition. Although the VSM is a widely used index, it only conducts a static analysis of the system and informs the load level limit where the static power flow analysis equations converge, which is typically associated with Saddle-Node Bifurcation (SNB) [57]. However, it is also important to evaluate the dynamic nature of power systems because they can lose small-signal angular stability due to the presence of eigenvalues with a zero real part, typically associated with the Hopf Bifurcation (HB) of dynamic systems [58]. Therefore, the load margin provided to the system operator and widely used must comply with the voltage stability and small-signal angular stability criteria. In [59], the authors propose a method capable of providing the load margin while simultaneously considering these stability requirements associated with SNB and HB. This method considers the dynamic characteristics of the system by evaluating the eigenvalues in the occurrence requirements of these bifurcations. Although it is an effective method, it presents convergence problems due to the dependence on good initial conditions. Furthermore, this method is based on a complete and detailed model of the system where the parameters must be reliable. Later, the authors proposed using heuristics such as the Crow Search Algorithm [60] and Particle Swarm Optimization [61], but the convergence of the cases and the convergence time were not considerably improved.
The work published so far is promising, but these methods present a set of limitations that justify future advances in load margin determination research. Most techniques only determine the VSM associated with voltage stability studies and do not determine the load margin associated with small-signal stability studies. Techniques based on system models require precise model information and information from all system buses, and this is not always possible. Machine learning-based methods require voltage data from all system buses with the installation of a PMU and present difficulties in generalization to cases different from those considered in the training stages. Furthermore, all methods increasingly require improvements to calculate the load margin with greater precision, as the calculation of power flow at maximum power transfer presents convergence difficulties in most cases using existing methods. The authors of [49] propose a Physics-Guided Neural Network (PGNN) to calculate the load margin, but the method requires the design of two Neural Networks and the loss functions require the calculation of the voltages and active and reactive power of all buses in the system, which is not feasible for large-scale power systems. Subsequently, the authors [50] improved the method in the process of obtaining the PGNN weights, but the feasibility problem in large-scale power systems still persists.
This paper proposes a Physics-Informed Neural Network (PINN) for calculating the load margin that simultaneously meets the voltage stability and small-signal angular stability requirements in modern power systems equipped with PMUs. Three loss functions were developed for the training process, one based on experimental knowledge and two based on physical knowledge. A procedure for selecting buses for PMU allocation and using voltage phasor data as PINN inputs is also presented. Case studies are evaluated and discussed for the IEEE 68-bus system for a set of scenarios. Thus, the main contributions of this research are as follows:
- A new PINN for calculating the load margin of power systems. This load margin considers voltage stability and small-signal angular stability thresholds.
- Three loss functions in the PINN training phase to improve the PINN’s ability to generalize to cases not considered in the training phase. One loss function is related to the experimental knowledge of the system, and two loss functions are associated with the physical knowledge of the system.
- A procedure based on a voltage stability index for selecting buses with PMUs. The number of PMUs is chosen by the user and can affect the performance and accuracy of the load margin. Case studies are provided for different values of the number of PMUs.
- Case studies conducted on the IEEE 68-bus system applying the proposed method to different loss function weights and different numbers of bus voltage measurements with a PMU installed.
- Comparative analyses of the proposed PINN and traditional Artificial Neural Networks (ANNs), Graph Neural Networks (GNNs) and Physics-Guided Neural Networks (PGNNs). These are performed and discussed in detail.
This article is structured as follows: Section 2 presents the mathematical formulation to obtain the load margin offline, meeting the small-signal stability and voltage stability requirements, Section 3 presents the proposed method for monitoring the load margin using data from PMUs, Section 4 describes the case studies carried out to evaluate the performance of the proposed method, Section 5 concludes the article with the main strengths and weaknesses of the proposed method evaluated in this article.
2. Load Margin Assessment Formulation
Before the design and effective application of a PINN, a database of operating cases and their respective load margins must be constructed. Power systems are dynamic systems composed of different components such as buses, transmission lines, asynchronous and synchronous generators, induction motors, transformers, loads, automatic voltage regulators, power system stabilizers, capacitor banks and batteries, among other equipment. All these components have mathematical formulations that describe their behavior during the operation of a power system and can be generically represented by Equations (1) and (2). The complete differential algebraic model of the IEEE 68-bus system used in this research as a test system is detailed in the IEEE Technical Report [62].
where x consists of the vector of state variables, z consists of the vector of algebraic variables and consists of the maximum charge level.
The method proposed in [59] was applied to obtain this set of cases for the database. The method available in [59] formulates a set of equations that satisfy the conditions for the occurrence of SNB and HB, and the solution of these equations provides precisely the load margin of power systems as a variable . The vector of variables of this formulation is given by
where x consists of the vector of state variables, z consists of the vector of algebraic variables, consists of the maximum charge level, and consist of the real part of the eigenvector, and consist of the imaginary part of the eigenvector and consists of the imaginary part of the eigenvalue.
The first set of equations that make up the formulation is composed of the equations that govern the power flow of the nonlinear power system given by
The linearization of the differential–algebraic equations allows us to obtain the Jacobian matrix of the power system and evaluate the eigenvalues and eigenvectors in the SNB and HB conditions. The system in the HB condition presents a purely imaginary eigenvalue and the eigenvalue equation for the matrix is given by
The system in the SNB condition presents a purely zero eigenvalue and the eigenvalue equation for the matrix is given by
Two additional equations, Equations (10) and (11), associated with the normalization of the eigenvectors were incorporated into the system in order to obtain a determined system of equations and variables:
The resolution of system (4)–(11) allows the vector of variables (3) to be obtained and can be achieved either by Newton’s method [59] or by metaheuristics [60,61]. Although this is a promising method, it presents convergence problems if the initial conditions are not close to the solution. Furthermore, the method requires a complete and detailed knowledge of the differential–algebraic model of the system. There are difficulties in applying this method in real time or in applications with a fast response. Thus, a technique based on a PINN is proposed and presented in the next section.
3. Proposed Method
The proposed method aims to determine the precise value of the load margin of systems equipped with PMUs that meets the voltage stability and small-signal stability requirements. Thus, the proposed method aims to determine the mu variable of the model described in Section 2. Neural Networks are machine learning techniques capable of calculating the load margin from a balanced database. However, Neural Networks may present a low generalization capacity for the problem under study if atypical scenarios are not considered in the database. Traditionally, Neural Networks seek to find a map that relates the input data to the output data through a supervised machine learning technique. Thus, no physical aspect of the problem under analysis is evaluated during the training process of traditional Neural Networks.
The proposed method aims to incorporate physical aspects of power system operation into the Neural Network training process by formulating new loss functions. These new Neural Networks are called a PINN because they incorporate physical aspects into the training process. The architecture of the PINN developed and evaluated in this work is shown in Figure 1. The input measurement vector is composed of the voltage phasors provided by PMUs of some selected buses of the power system and can be formulated as
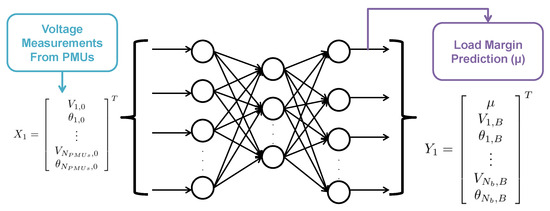
Figure 1.
PINN architecture.
The PINN output is composed of the load margin, the design objective and the voltage phasors of the system buses at the stability threshold condition, i.e., the voltage levels at the maximum power transfer that meets the voltage stability and small-signal stability requirements. This output vector can be formulated as
The first loss function consists of minimizing the estimated output with the real output of the system available in the database. This first loss function is traditionally used by Neural Networks in supervised machine learning and does not involve physical aspects of the system. This first loss function can be formulated as
Two loss functions ( and ) are incorporated in this PINN training process and involve the calculation of physical phenomena of power system operation. The second loss function depends on the voltage phasor measurements estimated by the PINN and is formulated as the following vector :
From the estimated measurements of in (15), the reactive and active powers injected into the buses are calculated using the following formulas, which describe the power flow:
Thus, these calculated measures form the following output vector :
The database presents the true reactive and active power measurements at the stability threshold, and these calculated reactive and active power measurements of the vector can be compared and minimized by the following loss function:
Thus, the minimization of the loss function aims to ensure compliance with the equations that govern the power flow of a power system, a physical aspect of the operation of this system.
The third loss function () involves first calculating the following line voltage stability index [63] from the calculated voltage phasor measurements available in vector :
where the index is calculated if there is a connection between k and m.
The closer this index is to 0, the closer the system is to stability. The closer this index is to 1, the closer the system is to instability [63]. Since we are working with the vector , which presents the voltage phasors of the system at the stability threshold, many of the values of these indices may present values close to 1. Again, the values of these calculated indices can be compared with the true values and thus minimize the following third loss function :
Thus, the three loss functions must be minimized in the PINN training process, and the global loss function consists of the weighting of these three loss functions as described below:
Weights , and must be chosen carefully for a successful PINN design. The higher the value of weight , the more experimental knowledge must be considered during the PINN training process. The higher the value of weights and , the more physical knowledge must be considered during the PINN training process.
It is important to emphasize that the loss function composed of three components in (22) differs from traditional machine learning techniques such as Artificial Neural Networks. Traditional techniques such as ANNs usually use the loss function in (14). The incorporation of the loss functions and associated with the physical characteristics of a power system is what makes PINNs interesting and better for estimation of the load margin of systems equipped with PMUs.
The PINN training stage uses the Levenberg–Marquardt method [64,65] to obtain the weights until the maximum epoch limit is reached. The Levenberg–Marquardt method is a traditional method for determining the weights of Neural Networks, and, over the years, this method has been improved [64,65]. The training and testing process of the PINN was carried out in MATLAB version 2024a [66], where the Levenberg–Marquardt method is available to run. More information about this method can be found in [64,65] and in MATLAB [66]. The number of neurons in the input layer is composed of twice the number of PMUs in the system and the hidden layer is composed of the number of PMUs in the system.
3.1. Procedure for Selecting Buses with PMUs
The proposed PINN uses phasor voltage measurements from some of the system’s buses. A power system can have many buses, and having a PMU allocated to each bus is not feasible. Furthermore, the greater the number of PINN inputs, the greater the number of PINN weights that must be determined, which can complicate the design and convergence of the method. Thus, there are benefits to working with a reduced number of PMU data points, and a PMU allocation method was applied. In plotting the PV curve to determine maximum power transfer, there are system buses that exhibit a steep voltage drop, which is useful for monitoring voltage as the system load increases. In some studies, these buses with steep voltage drops are called critical buses. It is worth noting that the number of PMUs selected to send their data to the PINN input affects the PINN’s performance in estimating the system load margin. The greater the number of PMUs, the more reliable the load margin estimate will be, but the PINN design may require more processing time and have difficulties with convergence and generalization. The smaller the number of PMUs, the less reliable the load margin estimate will be, but the PINN design may require less processing time and converge more easily during PINN training. The step-by-step algorithm is detailed below.
- Step 1:
- Define the system’s operating scenarios and determine the load margin.
- Step 2:
- Define the number of buses to have a PMU .
- Step 3:
- Calculate the voltage drop across all system buses between the base case and the maximum power transfer case for all operating scenarios.
- Step 4:
- List the buses in descending order of voltage drops.
- Step 5:
- Select the buses with the greatest voltage drop.
In Step 1 of this algorithm, operators must define the typical operating points of the system, considering variations in load, generation and network topology. Each of these operating points will have its own load margins that must be calculated. Based on the knowledge of the number of buses in the system, the operator must also define in Step 2 the number of PMUs installed in the system whose measurements will be inputs to the PINN designed in the next section. The choice of the number of PMUs is important because a high number can increase the number of design variables for the PINN and make it difficult to determine its parameters, while a low number can hinder the observability of the system and result in a PINN that has difficulties in generalization and inadequate load margin calculations. Based on the voltage measurements at each operating point at its nominal power level and at the power level in the case of maximum power transfer, Steps 3 and 4 determine the voltage drops and order the buses in descending order based on the voltage level difference between the base case and the maximum power transfer case. Finally, Step 5 selects the first buses from this list to have their voltage measurements used as input for the PINN.
3.2. Step-by-Step Algorithm to Determine the PINN
The design method must determine the weights of the PINN architecture (shown in Figure 1) that minimize three loss functions. The flowchart of the proposed method is described in Figure 2 and the design algorithm is described below.
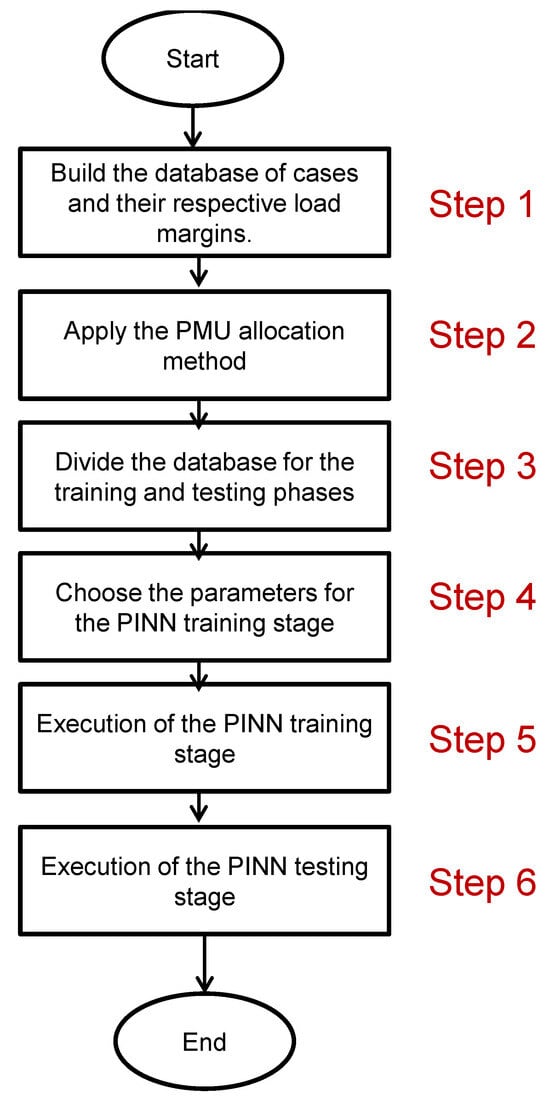
Figure 2.
Flowchart of the proposed method.
- Step 1:
- Define the system’s operating scenarios and determine the load margin.
- Step 2:
- Apply the PMU allocation method from Section 3.1.
- Step 3:
- Divide the database in a balanced way for the training and testing phases of the proposed PINN.
- Step 4:
- Choose the parameters for the PINN training stage, such as the number of epochs, the weights of the three loss functions, the number of neurons in the hidden layer and the activation function.
- Step 5:
- Execution of the PINN training stage for a maximum number of epochs .
- Step 6:
- Execution of the PINN testing stage and evaluation of the results through appropriate indices such as the Root Mean Square Error (RMSE).
Thus, the proposed method for calculating the load margin differs from the methods proposed by the scientific community and already published in the literature. The PINN proposed for calculating the load margin has its weights determined in a training process with three loss functions. Two loss functions consider physical knowledge of the system associated with voltage stability, and one loss function considers experimental knowledge of the system. Furthermore, a procedure for selecting the buses to obtain PMUs is presented, and this procedure uses a voltage stability index that has already been applied to the system’s operating scenario database.
4. Case Studies and Discussion
The PINN proposed in this paper was evaluated on an IEEE 68-bus system through case studies. This test system has 68 buses, 16 generators, 64 transmission lines and 5 areas, and the nominal case of this system is available in [67]. The complete differential algebraic model of the IEEE 68-bus system used in this research as a test system is detailed in the IEEE Technical Report [62]. From this nominal operating case, 2000 new operating points were obtained by varying the load levels of each load bus between 0 and 20%. The load margin of each of the 2000 operating points was obtained by applying the method described in [59] and assuming the load growth direction as all the system loads growing at the same rate. Figure 3 shows a histogram of the load margins of the database cases. The load margin of the cases vary between 1.0044% and 19.9701%, and the histogram proves a uniformity of load margins. From this database, 70% of the cases were applied for PINN training and 30% of the cases were applied for PINN testing. A comparative analysis was made with traditional Artificial Neural Networks considering weights and . Another machine learning technique called Graph Neural Networks (GNNs) [32] was evaluated comparatively in this research. It is worth noting that the method described in [32] only calculates the VSM associated with the voltage stability threshold. The method [32] does not calculate the load margin associated with the small-signal stability threshold. Furthermore, the Physics-Guided Neural Network (PGNN) developed by the authors of [49] was also applied, evaluated and discussed in this research. The authors’ PGNN [49] requires the reliable determination of the weights of two Neural Networks and needs the voltage and active and reactive power measurements of all buses in the system. The training of the authors’ PGNN [49] applies only two loss functions with equal weights.
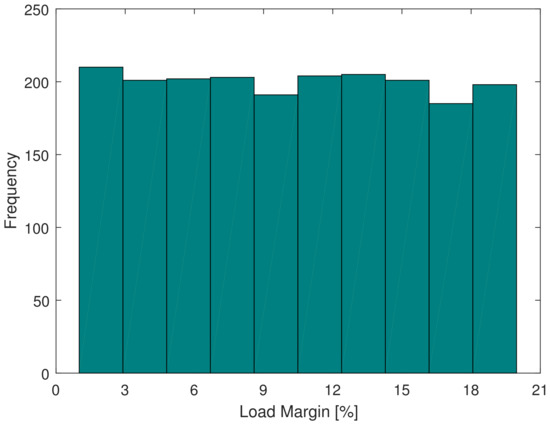
Figure 3.
Load margin distribution histogram from the database.
In order to evaluate the benefits of integrating physical knowledge into the Neural Network training process, five different cases choosing the weights , and in (22) were evaluated:
- , and : values for a traditional loss function in the training stage of a Neural Network considering only experimental knowledge and disregarding physical knowledge.
- , and : the PINN training process considers experimental knowledge and physical knowledge related to the power flow in the loss function.
- , and : the PINN training process considers experimental knowledge and physical knowledge related to power flow and the voltage stability index in the loss function.
- , and : the PINN training process considers experimental knowledge and physical knowledge, but physical knowledge is considered with a greater proportion in the loss function.
- , and : this case has a greater proportion of physical knowledge than experimentation compared to the previous case.
PINN training was carried out in a supervised manner for a maximum number of epochs equal to 2000 . In addition, 15 buses were chosen to have a PMU installed whose voltage measurements would be inputs of the PINN designed . The 15 buses among the 68 available buses with the highest voltage drops verified in the database were selected for PMU allocation according to the algorithm in Section 3.1. Noise in voltage measurements is very common even in modern meters such as PMUs, and, therefore, an error with a standard deviation of 1%, respecting a Gaussian distribution, was considered in the voltage data collected by the PMUs. The PINN training stage was performed for these different weights, and Table 1 details the RMSE results for these different weights for load margin values , voltage magnitude measurements , voltage angle measurements , active power , reactive power and voltage stability index values . Table 2 presents the RMSE results obtained during GNN training [32]. Table 3 presents the RMSE results obtained during PGNN training [49]. These results provide the following evaluations:

Table 1.
Results of the training stage of the proposed PINN.
Table 2.
Results of the training stage of the GNN [32].
Table 3.
Results of the training stage of the PGNN [49].
- The highest RMSE errors were achieved for the cases , and , where PINN training considers only experimental knowledge and does not consider physical knowledge. There are especially high errors for the (·) index and the active () and reactive () powers because these quantities are not used in the PINN supervised training process (because and ).
- The second weight selection case, , and , shows that considering the loss function relative to experimental knowledge ( in (14)) and a single loss function relative to physical knowledge ( in (19)) reduces the RMSE values compared to the first weight selection case. However, it is not the best case because the third loss function, , is disregarded () and the VSLI shows a high RMSE value ().
- The third case of weight selection, , and , shows that equal weights for the three loss functions can substantially reduce the RMSE values and the achieved error value for the load margin .
- The fifth weighting case (, and ) shows that RMSE values are higher than the fourth case (, and ) for all variables. Thus, considering a larger proportion of physics knowledge without appropriate study can hinder the PINN training process and hinder PINN generalization.
- The fourth case of choosing weights shows there is an optimal choice of weights that provides the lowest RMSE values, especially for the load margin .
- The RMSE value for the GNN () is significantly higher compared to that of the proposed PINN. This is mainly because the GNN fails to calculate the load margin considering the small-signal stability threshold. The GNN proposed by the authors [32] is able to calculate the load margin considering only the voltage stability threshold.
- The RMSE results of the PGNN training () designed by the technique in [49] are better than those of the ANN () and GNN (). However, this RMSE value is higher than the RMSE values achieved by the PINN proposed in this article. Thus, the presence of three loss functions in the PINN training stage is more beneficial than the presence of two loss functions in the PGNN training stage.
The PINNs designed for each of the five weight choices were evaluated in the testing phase for cases not used in the PINN training phase. Table 4 presents the RMSE values achieved to obtain the system’s load margin . Table 5 presents the RMSE values achieved by the GNN [32]. Table 6 presents the RMSE values achieved by the PGNN [49]. These results provide the following assessments:
Table 4.
Results of the testing stage of the proposed PINN.
Table 5.
Results of the testing stage of the GNN [32].
Table 6.
Results of the testing stage of the PGNN [49].
- The RMSE values are similar to those obtained during the training phase, indicating that the database split for the PINN’s training and testing was effective and well-balanced.
- The highest RMSE value was found for the case considering only physical knowledge () and disregarding physical knowledge (, ).
- The best RMSE value () was achieved for , , , demonstrating that considering physical knowledge associated with loss functions is beneficial for the PINN project and gives greater accuracy in estimating the load margin of power systems.
- The case , , had a higher RMSE value than the case , , (). This proves that weights , and should be chosen carefully.
- The low RMSE results also show that measurements from only 15 PMUs in the system are sufficient for a good PINN design.
- Again, the RMSE values for the GNN () were significantly higher compared to that of the proposed PINN. This is mainly because the GNN failed to calculate the load margin considering the small-signal stability threshold and had difficulty generalizing to cases other than the training phase.
- The RMSE value from the PGNN test phase () was lower than the values achieved by the ANN () and GNN (). However, this RMSE value for the PGNN was higher than the RMSE values for the PINN proposed in this research.
A second performance analysis of the proposed new PINN was conducted. The results presented so far considered only 15 PMUs in the system, and we will now evaluate how different PMU values can contribute to or hinder PINN performance. Five cases were evaluated: , , , and . Table 7 details the RMSE results in the PINN testing phase for the different weights , , and the different PMU numbers. Table 8 presents the GNN results for different numbers of allocated PMUs. Table 9 presents the PGNN results for different numbers of allocated PMUs. These RMSE results for these different scenarios allow the following conclusions:
Table 7.
Results of the testing phase of the PINN for different PMU quantities in the system.
Table 8.
Results of the testing phase of the GNN for different PMU quantities in the system.
Table 9.
Results of the testing phase of the PGNN for different PMU quantities in the system.
- In all five cases of , and weights, the lowest RMSE values were achieved when the system had only 15 PMUs selected for the PINN.
- A smaller number of PMUs, such as the case with 10 PMUs, resulted in an increase in RMSE compared to the case with 15 PMUs for all weighting cases of the PINN. Therefore, very low numbers of PMUs may be insufficient for adequate PINN design.
- Increasing the number of selected PMUs to 20, 25 and 30 gradually increased the RMSE values for all five different weight cases for the PINN. Thus, too many PMU measurements can complicate PINN design and hinder proper load margin estimation.
- There is an optimal selection of the number of PMUs capable of providing the lowest RMSE value. Thus, 15 PMUs are sufficient for the PINN designed in this research to adequately estimate load margins.
- In the case of the GNN, the best RMSE value was for 20 PMUs. The other cases showed higher RMSE values. Even so, all GNN cases showed high RMSE values compared to the PINN for the same number of PMUs.
- In the case of the PGNN, the best RMSE value from the PGNN testing phase was for 15 PMUs. All RMSE values for the different numbers of PMUs were still higher than the RMSE values achieved by the PINN proposed in this research.
5. Conclusions
This paper proposed a Physics-Informed Neural Network for calculating the load margin that simultaneously meets the voltage stability and small-signal angular stability requirements in modern power systems equipped with PMUs. Three loss functions were used during the PINN training process, one loss function associated with experimental knowledge and two loss functions associated with physical knowledge of the operation of a power system. Furthermore, a procedure was presented to select the buses for PMU allocation and to have their phasor measurements as input to the PINN.
The results obtained proved that the use of two loss functions with physical knowledge provided a more generalized Neural Network capable of providing more correct load margins, as demonstrated by the RMSE index. Comparative analyses showed that ANNs, GNNs and PGNNs had difficulty finding adequate load margins in the case studies of this research. The PGNN technique performed better than ANNs and GNNs in the training and testing phases. The different weights for the three loss functions of the PINN training stage and the results obtained prove that the choice of these weights was fundamental for the optimal design of the PINN. Furthermore, the selective use of the voltage phasor measurements of some buses of the system was sufficient for the calculation of the load margin by the PINN.
The proposed PINN was promising, but some difficulties were encountered that affected the accurate estimation of the load margin, such as the manual definition of the PINN topology, the manual selection of the number of PMUs, the balanced separation of the database for the PINN training and testing stages and the need to work with reliable PMU data from the system.
Future research will evaluate how different directions of load growth affect the proposed method. Preventive control strategies will be developed to increase the load margin calculated by the proposed method. Furthermore, new PMU allocation strategies will be evaluated in the future, and potential PMU data failures as cyberattacks may also be assessed.
Funding
This study was financed by the São Paulo Research Foundation (FAPESP) under grant 2015/24245-8 and the Coordenação de Aperfeiçoamento de Pessoal de Nível Superior-Brasil (CAPES)-Finance Code 001.
Data Availability Statement
Data are contained within the article.
Conflicts of Interest
The funders had no role in the design of the study; in the collection, analyses or interpretation of data; in the writing of the manuscript; or in the decision to publish the results.
Abbreviations
The following abbreviations are used in this manuscript:
| ANN | Artificial Neural Network |
| GNN | Graph Neural Network |
| HB | Hopf Bifurcation |
| LM | Load Margin |
| PGNN | Physics-Guided Neural Network |
| PINN | Physics-Informed Neural Network |
| PMU | Phasor Measurement Unit |
| RMSE | Root Mean Square Error |
| SNB | Saddle-Node Bifurcation |
| VSM | Voltage Stability Margin |
References
- Bhusal, N.; Abdelmalak, M.; Kamruzzaman, M.; Benidris, M. Power System Resilience: Current Practices, Challenges, and Future Directions. IEEE Access 2020, 8, 18064–18086. [Google Scholar] [CrossRef]
- Impram, S.; Varbak Nese, S.; Oral, B. Challenges of renewable energy penetration on power system flexibility: A survey. Energy Strategy Rev. 2020, 31, 100539. [Google Scholar] [CrossRef]
- Shah, R.; Mithulananthan, N.; Bansal, R.C.; Ramachandaramurthy, V.K. A review of key power system stability challenges for large-scale PV integration. Renew. Sustain. Energy Rev. 2015, 41, 1423–1436. [Google Scholar] [CrossRef]
- Dileep, G. A survey on smart grid technologies and applications. Renew. Energy 2020, 146, 2589–2625. [Google Scholar] [CrossRef]
- Gao, J.; Xu, H.; Yang, Y.; Niu, H.; Liang, J.; Dong, H. A Multi-Mode Recognition Method for Broadband Oscillation Based on Compressed Sensing and EEMD. Appl. Sci. 2024, 14, 11484. [Google Scholar] [CrossRef]
- Muftić Dedović, M.; Mujezinović, A.; Dautbašić, N.; Alihodžić, A.; Memić, A.; Avdaković, S. Estimation of Power System Inertia with the Integration of Converter-Interfaced Generation via MEMD during a Large Disturbance. Appl. Sci. 2024, 14, 681. [Google Scholar] [CrossRef]
- Radhoush, S.; Vannoy, T.; Liyanage, K.; Whitaker, B.M.; Nehrir, H. Distribution System State Estimation Using Hybrid Traditional and Advanced Measurements for Grid Modernization. Appl. Sci. 2023, 13, 6938. [Google Scholar] [CrossRef]
- Dasgupta, S.; Paramasivam, M.; Vaidya, U.; Ajjarapu, V. Real-Time Monitoring of Short-Term Voltage Stability Using PMU Data. IEEE Trans. Power Syst. 2013, 28, 3702–3711. [Google Scholar] [CrossRef]
- Su, H.Y.; Liu, C.W. Estimating the Voltage Stability Margin Using PMU Measurements. IEEE Trans. Power Syst. 2016, 31, 3221–3229. [Google Scholar] [CrossRef]
- Adhikari, P.M.; Vanfretti, L.; Chang, H.; Kar, K. Real-Time Control of a Battery Energy Storage System Using a Reconfigurable Synchrophasor-Based Control System. Energies 2023, 16, 6909. [Google Scholar] [CrossRef]
- Wang, Z.; Sadiq, R.; Gan, D. A Reduced-Order Robust Wide-Area Damping Control for Wind-PV-Thermal-Bundled Power System Considering Operational Uncertainties and Communication Resilience. IEEE Access 2024, 12, 36841–36852. [Google Scholar] [CrossRef]
- Kumar, R.; Mohanty, S.R.; Verma, M. A robust damping control for battery energy storage integrated power systems to mitigate inter-area oscillations. Int. J. Electr. Power Energy Syst. 2024, 157, 109885. [Google Scholar] [CrossRef]
- Ippolito, M.G.; Musca, R. A novel wide-area control for general application to inverter-based resources in power systems. Int. J. Electr. Power Energy Syst. 2024, 160, 110086. [Google Scholar] [CrossRef]
- Pierrou, G.; Lai, H.; Hug, G.; Wang, X. A Decentralized Wide-Area Voltage Control Scheme for Coordinated Secondary Voltage Regulation Using PMUs. IEEE Trans. Power Syst. 2024, 39, 7153–7165. [Google Scholar] [CrossRef]
- Shazdeh, S.; Golpîra, H.; Bevrani, H. A PMU-based back-up protection scheme for fault detection considering uncertainties. Int. J. Electr. Power Energy Syst. 2023, 145, 108592. [Google Scholar] [CrossRef]
- Jegarluei, M.R.; Aristidou, P.; Azizi, S. Wide-Area backup protection against asymmetrical faults in the presence of renewable energy sources. Int. J. Electr. Power Energy Syst. 2023, 144, 108528. [Google Scholar] [CrossRef]
- Fose, N.; Krishnamurthy, S.; Moodley, P. Improved Control Technique for Enhancing Power System Stability in Out-of-Step Conditions. Energies 2024, 17, 4086. [Google Scholar] [CrossRef]
- Cutsem, T.; Vournas, C. Voltage Stability of Electric Power Systems; Springer: New York, NY, USA, 1998. [Google Scholar] [CrossRef]
- Ajjarapu, V.; Christy, C. The continuation power flow: A tool for steady state voltage stability analysis. IEEE Trans. Power Syst. 1992, 7, 416–423. [Google Scholar] [CrossRef]
- Chiang, H.D.; Flueck, A.J.; Shah, K.S.; Balu, N. CPFLOW: A practical tool for tracing power system steady-state stationary behavior due to load and generation variations. IEEE Trans. Power Syst. 1995, 10, 623–634. [Google Scholar] [CrossRef]
- Bento, M.E.C.; Ramos, R.A. An approach for monitoring and updating the load margin of power systems in dynamic security assessment. Electr. Power Syst. Res. 2021, 198, 107365. [Google Scholar] [CrossRef]
- Chandra, A.; Pradhan, A.K. Online voltage stability and load margin assessment using wide area measurements. Int. J. Electr. Power Energy Syst. 2019, 108, 392–401. [Google Scholar] [CrossRef]
- Pourbagher, R.; Derakhshandeh, S.Y.; Golshan, M.E.H. A novel method for online voltage stability assessment based on PMU measurements and Thevenin equivalent. IET Gener. Transm. Distrib. 2022, 16, 1780–1794. [Google Scholar] [CrossRef]
- Bento, M.E.C. Load Margin Assessment of Power Systems Using Artificial Neural Network and Genetic Algorithms. IFAC-PapersOnLine 2022, 55, 944–948. [Google Scholar] [CrossRef]
- El-Keib, A.A.; Ma, X. Application of artificial neural networks in voltage stability assessment. IEEE Trans. Power Syst. 1995, 10, 1890–1896. [Google Scholar] [CrossRef]
- Bento, M.E.C. A method for monitoring the load margin of power systems under load growth variations. Sustain. Energy, Grids Netw. 2022, 30, 100677. [Google Scholar] [CrossRef]
- Anthony, K.; Arunachalam, V. Application of cascaded neural network for prediction of voltage stability margin in a solar and wind integrated power system. Eng. Appl. Artif. Intell. 2024, 138, 109368. [Google Scholar] [CrossRef]
- Samy, A.K.; Venkadesan, A. Evaluation of Voltage Stability Margin in a Power System using an Artificial Neural Network. In Proceedings of the 2022 IEEE 10th Power India International Conference (PIICON), Delhi, India, 25–27 November 2022; pp. 1–6. [Google Scholar] [CrossRef]
- Shahir, F.M.; Shirazi, P.S. Monitoring of Voltage Stability Margin by Artificial Neural Network. In Proceedings of the 2020 IEEE-HYDCON, Hyderabad, India, 11–12 September 2020; pp. 1–4. [Google Scholar] [CrossRef]
- Dinavahi, V.R.; Srivastava, S.C. ANN based voltage stability margin prediction. In Proceedings of the 2001 Power Engineering Society Summer Meeting. Conference Proceedings (Cat. No.01CH37262), Vancouver, BC, Canada, 15–19 July 2001; Volume 2, pp. 1275–1280. [Google Scholar] [CrossRef]
- Bento, M.E.C. Load Margin Assessment of Power Systems using Recurrent Neural Network and Greylag Goose Optimization. IFAC-PapersOnLine 2024, 58, 656–661. [Google Scholar] [CrossRef]
- Guddanti, K.P.; Weng, Y.; Marot, A.; Donnot, B.; Panciatici, P. Graph Neural Networks for Voltage Stability Margins with Topology Flexibilities. IEEE Open Access J. Power Energy 2023, 10, 73–85. [Google Scholar] [CrossRef]
- Bai, X.; Tan, J.; Ma, S.; Liu, D. Online estimation of voltage stability margin via deep neural network with consideration of the local structures in power grid. Int. Trans. Electr. Energy Syst. 2020, 30, 1–11. [Google Scholar] [CrossRef]
- Meng, X.; Zhang, P.; Xu, Y.; Xie, H. Construction of decision tree based on C4.5 algorithm for online voltage stability assessment. Int. J. Electr. Power Energy Syst. 2020, 118, 105793. [Google Scholar] [CrossRef]
- Li, W.; Zhang, P.; Su, S.; Meng, X.; Ding, C.; Wang, Y. Comparison of Decision Tree Attribute Selection Methods for Static Voltage Stability Margin Assessment. In Proceedings of the 2018 IEEE 2nd International Electrical and Energy Conference (CIEEC), Beijing, China, 4–6 November 2018; pp. 201–206. [Google Scholar] [CrossRef]
- Liu, T.; Gu, X.; Li, S.; Bai, Y.; Wang, T.; Yang, X. Static voltage stability margin prediction considering new energy uncertainty based on graph attention networks and long short-term memory networks. IET Renew. Power Gener. 2023, 17, 2290–2301. [Google Scholar] [CrossRef]
- Fang, H.; Xu, R.; Zhu, X.; Zhao, K.; Zhang, P.; Ren, C.; Li, Q.; Xu, Y. Knowledge Acquisition of Online Static Voltage Stability Margin Assessment Based on Random Forest Algorithm. In Proceedings of the 2019 IEEE 3rd International Electrical and Energy Conference (CIEEC), Beijing, China, 7–9 September 2019; pp. 445–450. [Google Scholar] [CrossRef]
- Li, S.; Ajjarapu, V. Real-time monitoring of long-term voltage stability via convolutional neural network. In Proceedings of the 2017 IEEE Power & Energy Society General Meeting, Chicago, IL, USA, 16–20 July 2017. [Google Scholar] [CrossRef]
- Sajan, K.S.; Kumar, V.; Tyagi, B. Genetic algorithm based support vector machine for on-line voltage stability monitoring. Int. J. Electr. Power Energy Syst. 2015, 73, 200–208. [Google Scholar] [CrossRef]
- Misyris, G.S.; Venzke, A.; Chatzivasileiadis, S. Physics-Informed Neural Networks for Power Systems. In Proceedings of the 2020 IEEE Power & Energy Society General Meeting (PESGM), Montreal, QC, Canada, 2–6 August 2020; pp. 1–5. [Google Scholar] [CrossRef]
- Huang, B.; Wang, J. Applications of Physics-Informed Neural Networks in Power Systems—A Review. IEEE Trans. Power Syst. 2023, 38, 572–588. [Google Scholar] [CrossRef]
- Ngo, Q.H.; Nguyen, B.L.; Vu, T.V.; Zhang, J.; Ngo, T. Physics-informed graphical neural network for power system state estimation. Appl. Energy 2024, 358, 122602. [Google Scholar] [CrossRef]
- Nellikkath, R.; Chatzivasileiadis, S. Physics-Informed Neural Networks for AC Optimal Power Flow. Electr. Power Syst. Res. 2022, 212, 108412. [Google Scholar] [CrossRef]
- Lopez-Garcia, T.B.; Domínguez-Navarro, J.A. Optimal Power Flow With Physics-Informed Typed Graph Neural Networks. IEEE Trans. Power Syst. 2025, 40, 381–393. [Google Scholar] [CrossRef]
- Jalving, J.; Eydenberg, M.; Blakely, L.; Castillo, A.; Kilwein, Z.; Skolfield, J.K.; Boukouvala, F.; Laird, C. Physics-informed machine learning with optimization-based guarantees: Applications to AC power flow. Int. J. Electr. Power Energy Syst. 2024, 157, 109741. [Google Scholar] [CrossRef]
- Zhang, J.; Peng, R.; Lu, C.; Wu, C. Computationally efficient data synthesis for AC-OPF: Integrating Physics-Informed Neural Network solvers and active learning. Appl. Energy 2025, 378, 124714. [Google Scholar] [CrossRef]
- Stock, S.; Babazadeh, D.; Becker, C.; Chatzivasileiadis, S. Bayesian Physics-informed Neural Networks for system identification of inverter-dominated power systems. Electr. Power Syst. Res. 2024, 235, 110860. [Google Scholar] [CrossRef]
- Nellikkath, R.; Murzakhanov, I.; Chatzivasileiadis, S.; Venzke, A.; Bakhshizadeh, M.K. Physics-informed neural networks for phase locked loop transient stability assessment. Electr. Power Syst. Res. 2024, 236, 110790. [Google Scholar] [CrossRef]
- Bento, M.E.C. Physics-Guided Neural Network for Load Margin Assessment of Power Systems. IEEE Trans. Power Syst. 2024, 39, 564–575. [Google Scholar] [CrossRef]
- Bento, M.E.C. Load Margin Assessment of Power Systems Using Physics-Informed Neural Network with Optimized Parameters. Energies 2024, 17, 1562. [Google Scholar] [CrossRef]
- Bento, M.E.C. Physics-Informed Neural Network for Load Margin Assessment of Power Systems with Optimal Phasor Measurement Unit Placement. Electricity 2024, 5, 785–803. [Google Scholar] [CrossRef]
- Stiasny, J.; Chatzivasileiadis, S. Physics-informed neural networks for time-domain simulations: Accuracy, computational cost, and flexibility. Electr. Power Syst. Res. 2023, 224, 109748. [Google Scholar] [CrossRef]
- Stiasny, J.; Zhang, B.; Chatzivasileiadis, S. PINNSim: A simulator for power system dynamics based on Physics-Informed Neural Networks. Electr. Power Syst. Res. 2024, 235, 110796. [Google Scholar] [CrossRef]
- Stiasny, J.; Misyris, G.S.; Chatzivasileiadis, S. Physics-Informed Neural Networks for Non-linear System Identification for Power System Dynamics. In Proceedings of the 2021 IEEE Madrid PowerTech, Madrid, Spain, 8 June–2 July 2021; pp. 1–6. [Google Scholar] [CrossRef]
- Li, S.; Li, X.; Jiang, Y.; Yang, Q.; Lin, M.; Peng, L.; Yu, J. A novel frequency-domain physics-informed neural network for accurate prediction of 3D spatio-temporal wind fields in wind turbine applications. Appl. Energy 2025, 386, 125526. [Google Scholar] [CrossRef]
- Liu, Y.; Wang, L.; Ng, B.F. A hybrid model-data-driven framework for inverse load identification of interval structures based on physics-informed neural network and improved Kalman filter algorithm. Appl. Energy 2024, 359, 122740. [Google Scholar] [CrossRef]
- Ajjarapu, V. Computational Techniques for Voltage Stability Assessment and Control; Springer: New York, NY, USA, 2007. [Google Scholar] [CrossRef]
- Rogers, G.; Elliott, R.T.; Trudnowski, D.J.; Wilches-Bernal, F.; Osipov, D.; Chow, J.H. Power System Oscillations: An Introduction to Oscillation Analysis and Control; Springer Nature: Cham, Switzerland, 2025. [Google Scholar] [CrossRef]
- Bento, M.E.C.; Ramos, R.A. A Method for Dynamic Security Assessment of Power Systems with Simultaneous Consideration of Hopf and Saddle-Node Bifurcations. In Proceedings of the 2018 IEEE Power & Energy Society General Meeting (PESGM), Portland, OR, USA, 5–10 August 2018; pp. 1–5. [Google Scholar] [CrossRef]
- Bento, M.E.C. Computing the Load Margin of Power Systems Using Crow Search Algorithm. IFAC-PapersOnLine 2022, 55, 271–275. [Google Scholar] [CrossRef]
- Bento, M.E.C.; Ramos, R.A. Computing the Load Margin of Power Systems Using Particle Swarm Optimization. In Proceedings of the 2021 IEEE Texas Power and Energy Conference (TPEC), College Station, TX, USA, 2–5 February 2021; pp. 1–5. [Google Scholar] [CrossRef]
- Canizares, C.; Fernandes, T.; Geraldi, E.; Gerin-Lajoie, L.; Gibbard, M.; Hiskens, I.; Kersulis, J.; Kuiava, R.; Lima, L.; DeMarco, F.; et al. Benchmark Systems for Small-Signal Stability Analysis and Control. Power & Energy Society Technical Report PES-TR18. 2015, pp. 1–390. Available online: https://resourcecenter.ieee-pes.org/publications/technical-reports/pestr18 (accessed on 1 August 2025).
- Rahman, T.K.A.; Jasmon, G.B. A new technique for voltage stability analysis in a power system and improved loadflow algorithm for distribution network. In Proceedings of the 1995 International Conference on Energy Management and Power Delivery EMPD ’95, Singapore, 21–23 November 1995; Volume 2, pp. 714–719. [Google Scholar] [CrossRef]
- Hagan, M.T.; Menhaj, M.B. Training feedforward networks with the Marquardt algorithm. IEEE Trans. Neural Netw. 1994, 5, 989–993. [Google Scholar] [CrossRef]
- Parisi, R.; Di Claudio, E.D.; Orlandi, G.; Rao, B.D. A generalized learning paradigm exploiting the structure of feedforward neural networks. IEEE Trans. Neural Netw. 1996, 7, 1450–1460. [Google Scholar] [CrossRef]
- MATLAB. Mathworks Inc. 2024. Available online: https://www.mathworks.com/products/matlab.html (accessed on 1 August 2025).
- Canizares, C.; Fernandes, T.; Geraldi, E.; Gerin-Lajoie, L.; Gibbard, M.; Hiskens, I.; Kersulis, J.; Kuiava, R.; Lima, L.; DeMarco, F.; et al. Benchmark Models for the Analysis and Control of Small-Signal Oscillatory Dynamics in Power Systems. IEEE Trans. Power Syst. 2017, 32, 715–722. [Google Scholar] [CrossRef]
Disclaimer/Publisher’s Note: The statements, opinions and data contained in all publications are solely those of the individual author(s) and contributor(s) and not of MDPI and/or the editor(s). MDPI and/or the editor(s) disclaim responsibility for any injury to people or property resulting from any ideas, methods, instructions or products referred to in the content. |
© 2025 by the author. Licensee MDPI, Basel, Switzerland. This article is an open access article distributed under the terms and conditions of the Creative Commons Attribution (CC BY) license (https://creativecommons.org/licenses/by/4.0/).