1. Introduction
High sandbody-to-mud ratio reservoirs with low connectivity exhibit reduced reservoir continuity due to the presence of laterally extensive, continuous mudstone interlayers between sand bodies. Although these mudstone interlayers are typically very thin, they possess strong lateral continuity, effectively compartmentalizing the sand bodies and forming multiple disconnected reservoir units. Despite their overall low connectivity, such reservoirs offer certain advantages for development. Owing to the significant barrier effect of the mudstone layers on fluid flow, these reservoirs demonstrate favorable compartmentalization performance during staged fracturing and pressure-controlled development, thereby enhancing injection–production efficiency and improving water control. In addition, the dispersed nature of the reservoir units reduces the risk of rapid breakthrough through a single high-permeability channel, offering better controllability and resource utilization potential. Therefore, accurately modeling the spatial architecture of such reservoirs is crucial for achieving fine-scale development and improving recovery efficiency. However, research on modeling these structurally complex reservoirs remains limited, and related simulation methodologies require further advancement. As early as 1965, G. Matheron introduced the concept of the variogram to characterize the spatial structure of regionalized variables, laying the theoretical foundation for two-point geostatistics. This approach uses the variogram to quantify spatial variation between pairs of points and has become a primary tool in early geological modeling. However, its inherent limitation lies in capturing only two-point statistical relationships, making it inadequate for representing complex, nonlinear, and geometrically intricate reservoir structures. To address this limitation, researchers proposed the multiple-point statistics (MPS) method [
1], which extracts higher-order spatial relationships by scanning training images with a defined template. This enables the modeling of complex geological patterns beyond the scope of traditional methods. Notably, MPS can provide geologically realistic models even when limited conditioning data are available, thus overcoming the structural expression constraints of conventional variogram-based approaches.
With the advancement of geostatistics, a variety of modeling approaches have been proposed, including those based on geological processes, geological surfaces, and target-based constraints [
2,
3,
4,
5]. These methods have, to some extent, improved the geological realism and structural representation capability of reservoir models. However, compared with multiple-point statistics (MPS), they typically require a deeper understanding of the reservoir architecture and involve more complex modeling procedures.
Despite its advantages, the MPS method encounters significant challenges when applied to high sandbody-to-mud ratio reservoirs with low connectivity. Studies have shown that when the training image has a relatively simple structure, the connectivity of MPS-generated models can closely match that of the training image. However, when the training image contains complex geometric features, MPS tend to produce models with much higher connectivity than the original image [
6]. This issue is particularly pronounced when mudstone interlayers exhibit complex spatial distributions—MPS simulations often fail to preserve the continuity of these features, leading to deficiencies in both geometric realism and geological consistency.
Therefore, there is an urgent need for a modeling approach that maintains the ease of use of MPS while addressing its limitations in reproducing reservoir connectivity under high sandbody-to-mud ratio conditions.
In recent years, with the rapid development of deep learning, neural network methods have been increasingly introduced in various fields. For example, convolutional neural networks (CNNs) have been used for sentence classification [
7] and ultra-deep CNNs for large-scale image recognition [
8]. Particularly, the advent of Generative Adversarial Networks (GANs) [
9] has attracted significant attention due to their unique generative capabilities [
10]. GANs employ adversarial training between a generator and a discriminator to learn complex data distributions, enabling the generation of high-quality images or models.
Following the pioneering work of Laloy et al. [
11], several studies further extended GAN-based approaches to improve geological realism under complex sedimentary structures. Song Suihong et al. [
12], building on Karras et al. [
13,
14], introduced Progressive GANs for hierarchical facies modeling, achieving improved multi-resolution representation and stratigraphic continuity. Chen Mei et al. [
15] subsequently employed Self-Attention GANs (SAGANs) [
16] to capture long-range spatial dependencies, while Chen Qiyu et al. [
17] combined a Laplacian pyramid with self-attention to enhance multi-scale feature learning.
Although these methods improved the visual continuity and realism of generated facies, they share a common limitation: strong dependence on large training datasets. Under limited-data conditions, these GAN-based models tend to overfit the available samples, leading to repetitive patterns, biased connectivity, and reduced geological diversity. Moreover, the training of attention mechanisms in SAGAN-based models often requires thousands of image patches to achieve stable convergence, making them impractical for small geological datasets. Therefore, despite their methodological advances, existing GAN and SAGAN frameworks still struggle to generalize structural variability when only a few or a single training image is available.
To address this limitation, Shaham et al. [
18] proposed SinGAN, a GAN framework trained on a single image. SinGAN performs coarse-to-fine, multi-scale layer-wise training using only one image and can generate diverse results with strong capabilities in structure extraction and local texture learning. Its multi-scale pyramid architecture is particularly advantageous for capturing complex stratification, mudstone interlayers, and irregular boundaries in geological models, making it well-suited for modeling non-stationary and complex reservoirs. Compared to traditional GANs, SinGAN can generate multiple structurally similar yet detail-varied models under limited training data conditions, exhibiting strong generative power and diversity. In this study, a high sandbody-to-mud ratio three-dimensional geological model characterized by thick sand bodies interbedded with thin mudstone layers was selected as the training image. The two-dimensional SinGAN framework was improved and extended to enable three-dimensional generation. Additionally, a self-attention mechanism was incorporated into SinGAN to enhance the model’s ability to represent key features such as mudstone interlayers, facilitating automated modeling of low-connectivity reservoirs with high sandbody-to-mud ratios.
The second section of this paper details the principles and methodologies of generative adversarial networks, single-image generative networks (SinGANs), and the self-attention mechanism. The third section presents empirical testing of the model, comparing simulation results and connectivity performance between MPS and SA-SinGANs. The fourth section provides a summary and discussion of the research findings and modeling workflow.
2. Materials and Methods
2.1. Generative Adversarial Networks
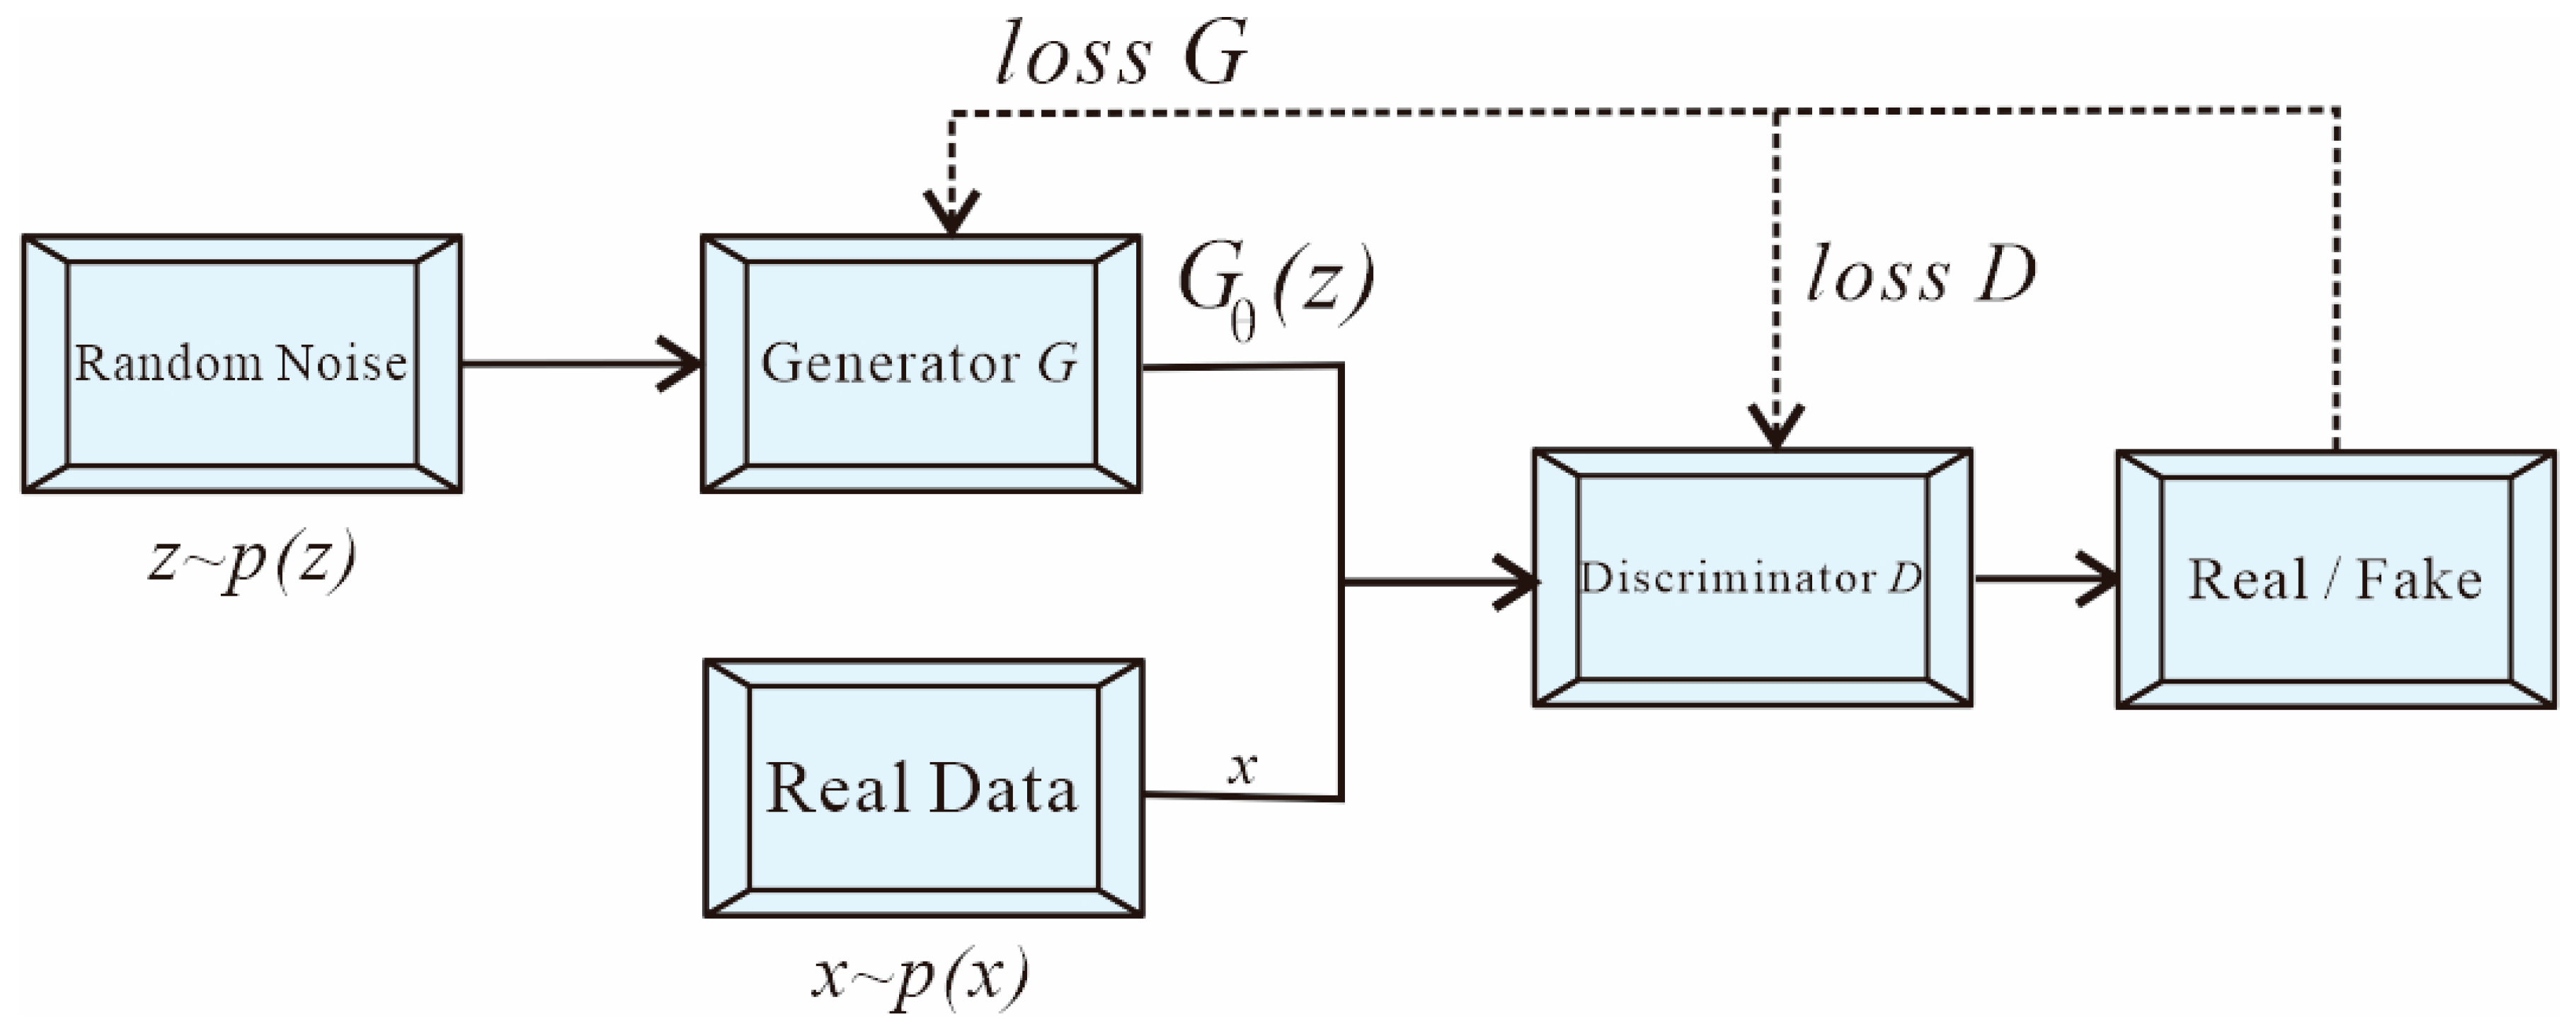
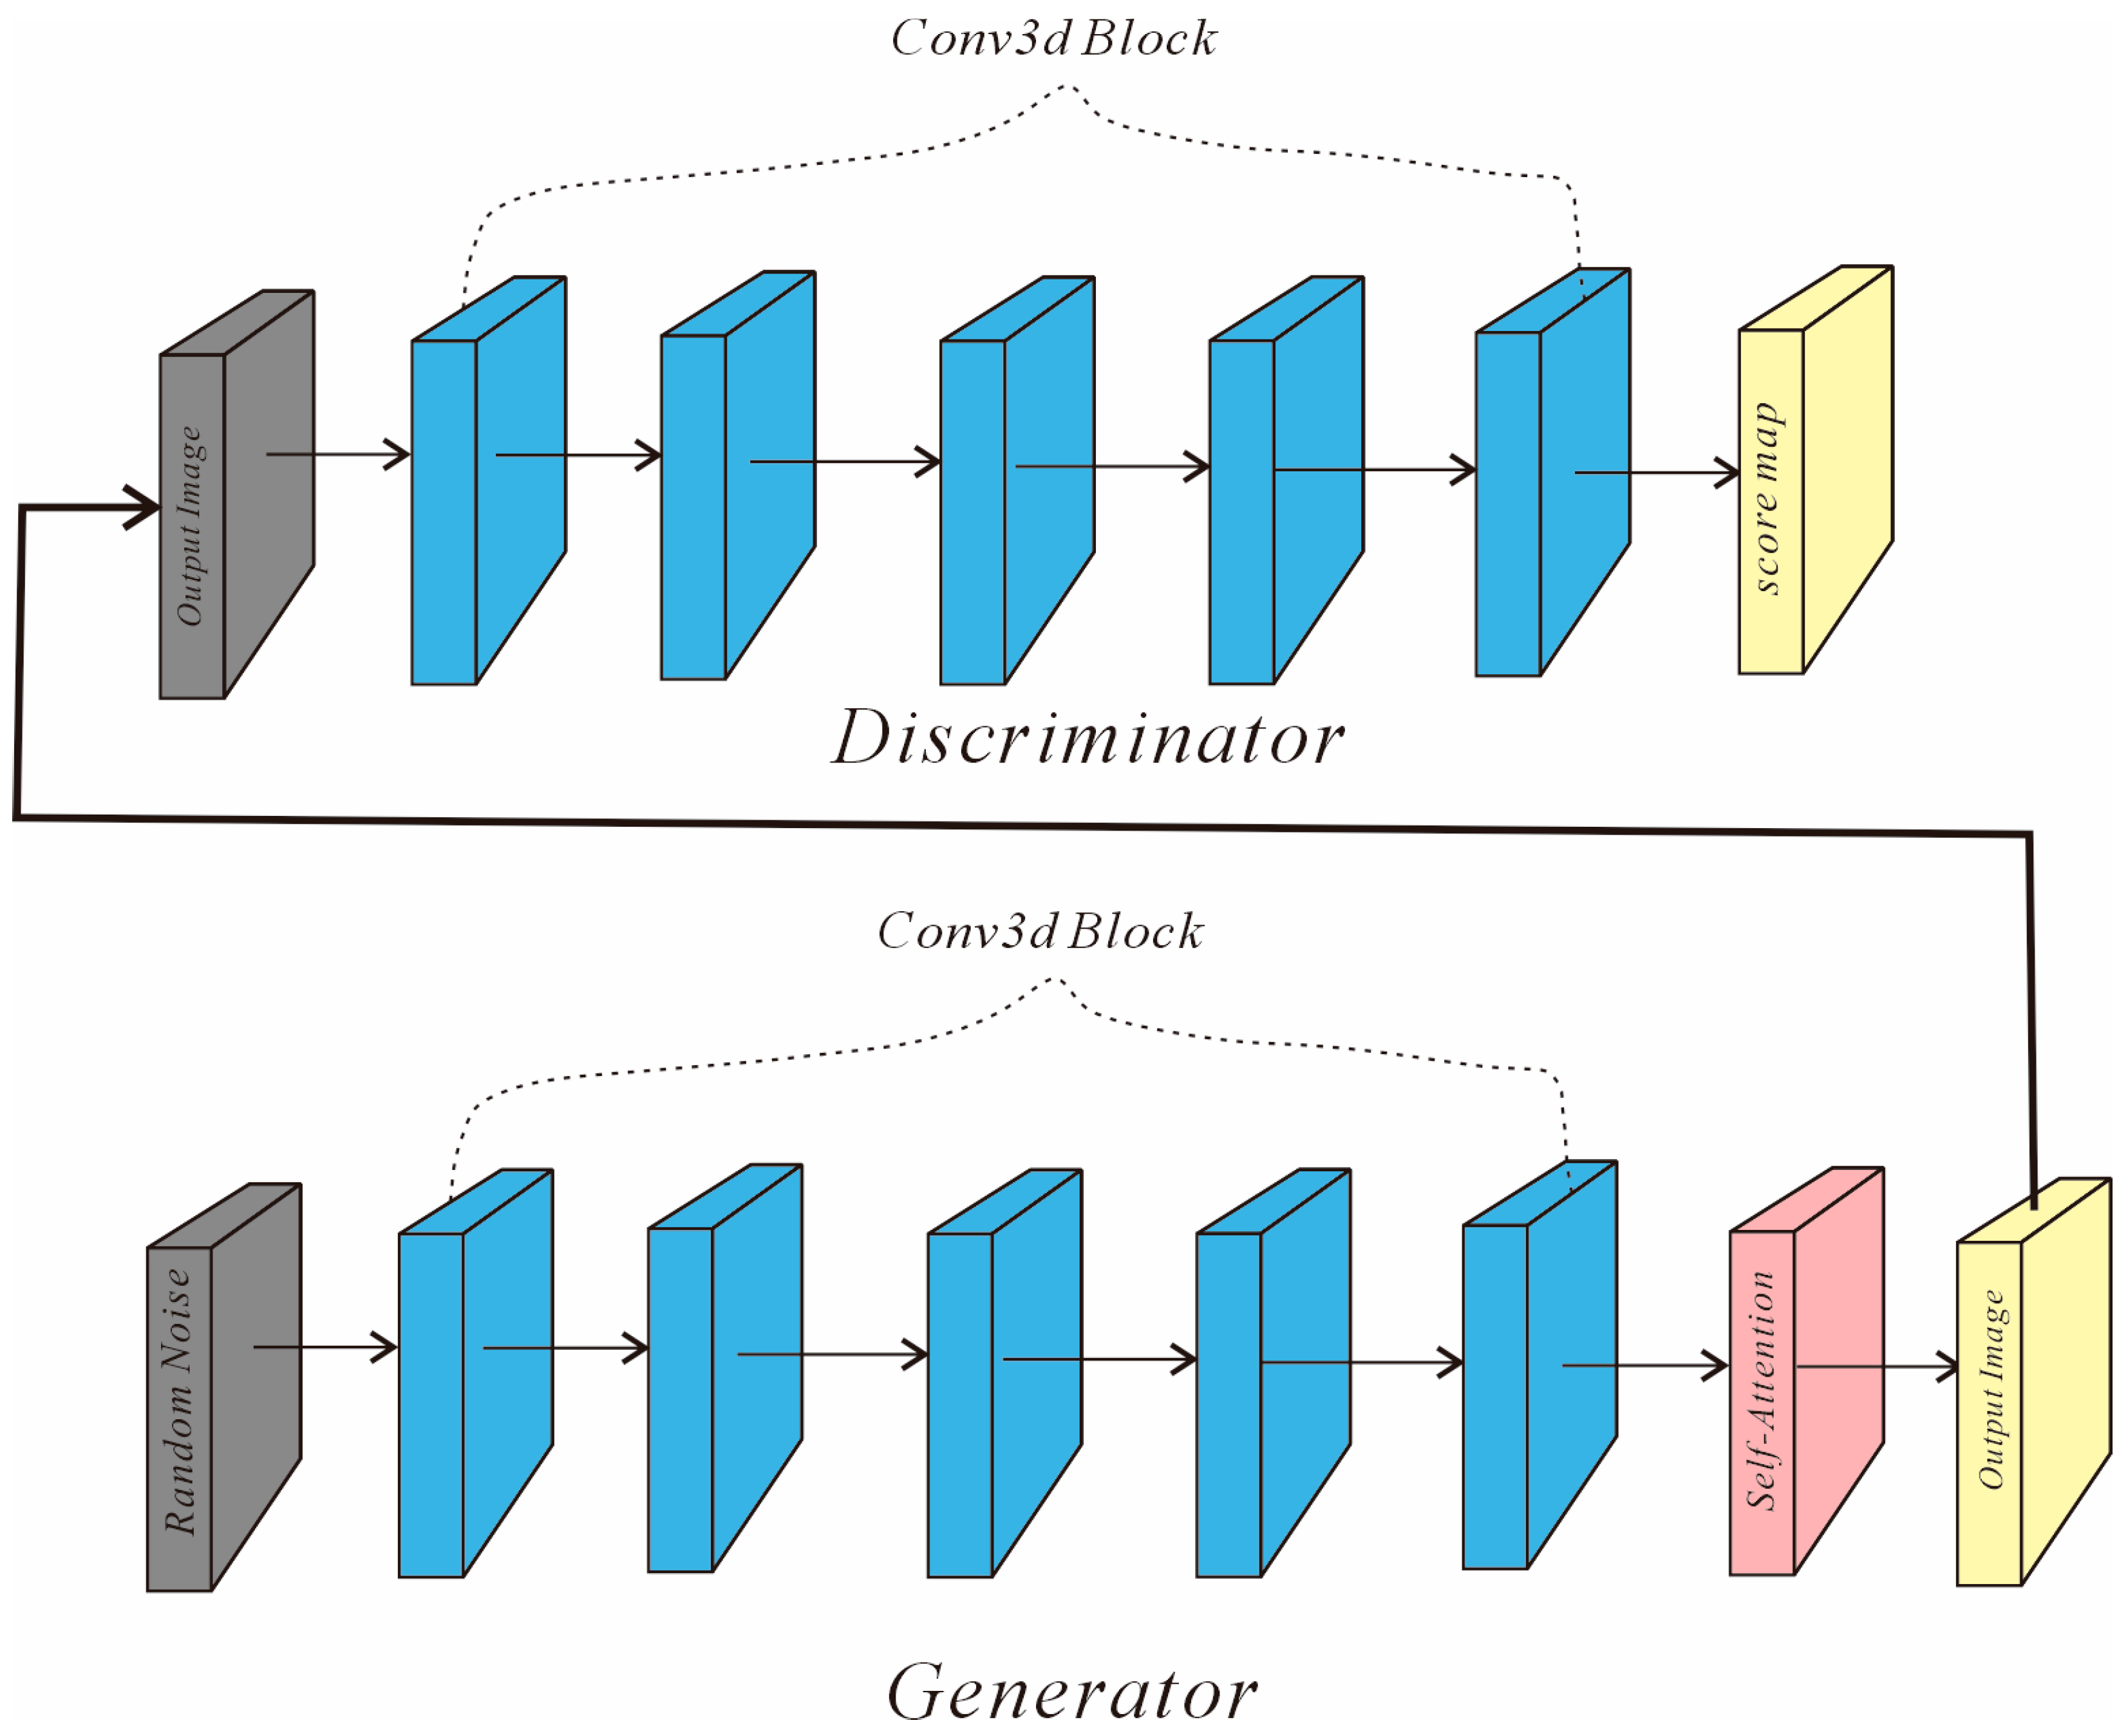
Generative Adversarial Networks (GANs) are an important class of generative models in deep learning. GANs consist of two models that learn and compete with each other, enabling the generation of data similar to the training set, such as images, audio, and text. The two components of a GAN are the generator and the discriminator. The generator takes random noise as input and produces new samples, while the discriminator receives samples generated by the generator and distinguishes them by assigning scores to both generated and real samples.
The objective of the generator is to optimize its model so that the generated samples closely resemble real data. Conversely, the discriminator aims to distinguish between real data samples and those produced by the generator. The generator feeds its outputs to the discriminator for evaluation, and the discriminator’s feedback is used to improve the generator. This adversarial process continues until a dynamic equilibrium is reached, where the generator produces samples that are sufficiently realistic that the discriminator’s ability to differentiate generated samples from real ones approaches random guessing, with scores close to 0.5.
The training of both models is controlled by loss functions, which are optimized iteratively to balance the generator and discriminator. The loss functions of the generator and discriminator are defined as follows (Equation (1)):
Here,
represents the expected value of the distribution function.
represents the distribution of this actual sample,
is defined in a low-dimensional noise distribution, By mapping parameter
through the
function to the high-dimensional data space, we obtain
. The computational process and structure of the generative adversarial network are shown in
Figure 1:
2.2. The Core Architecture of SinGAN
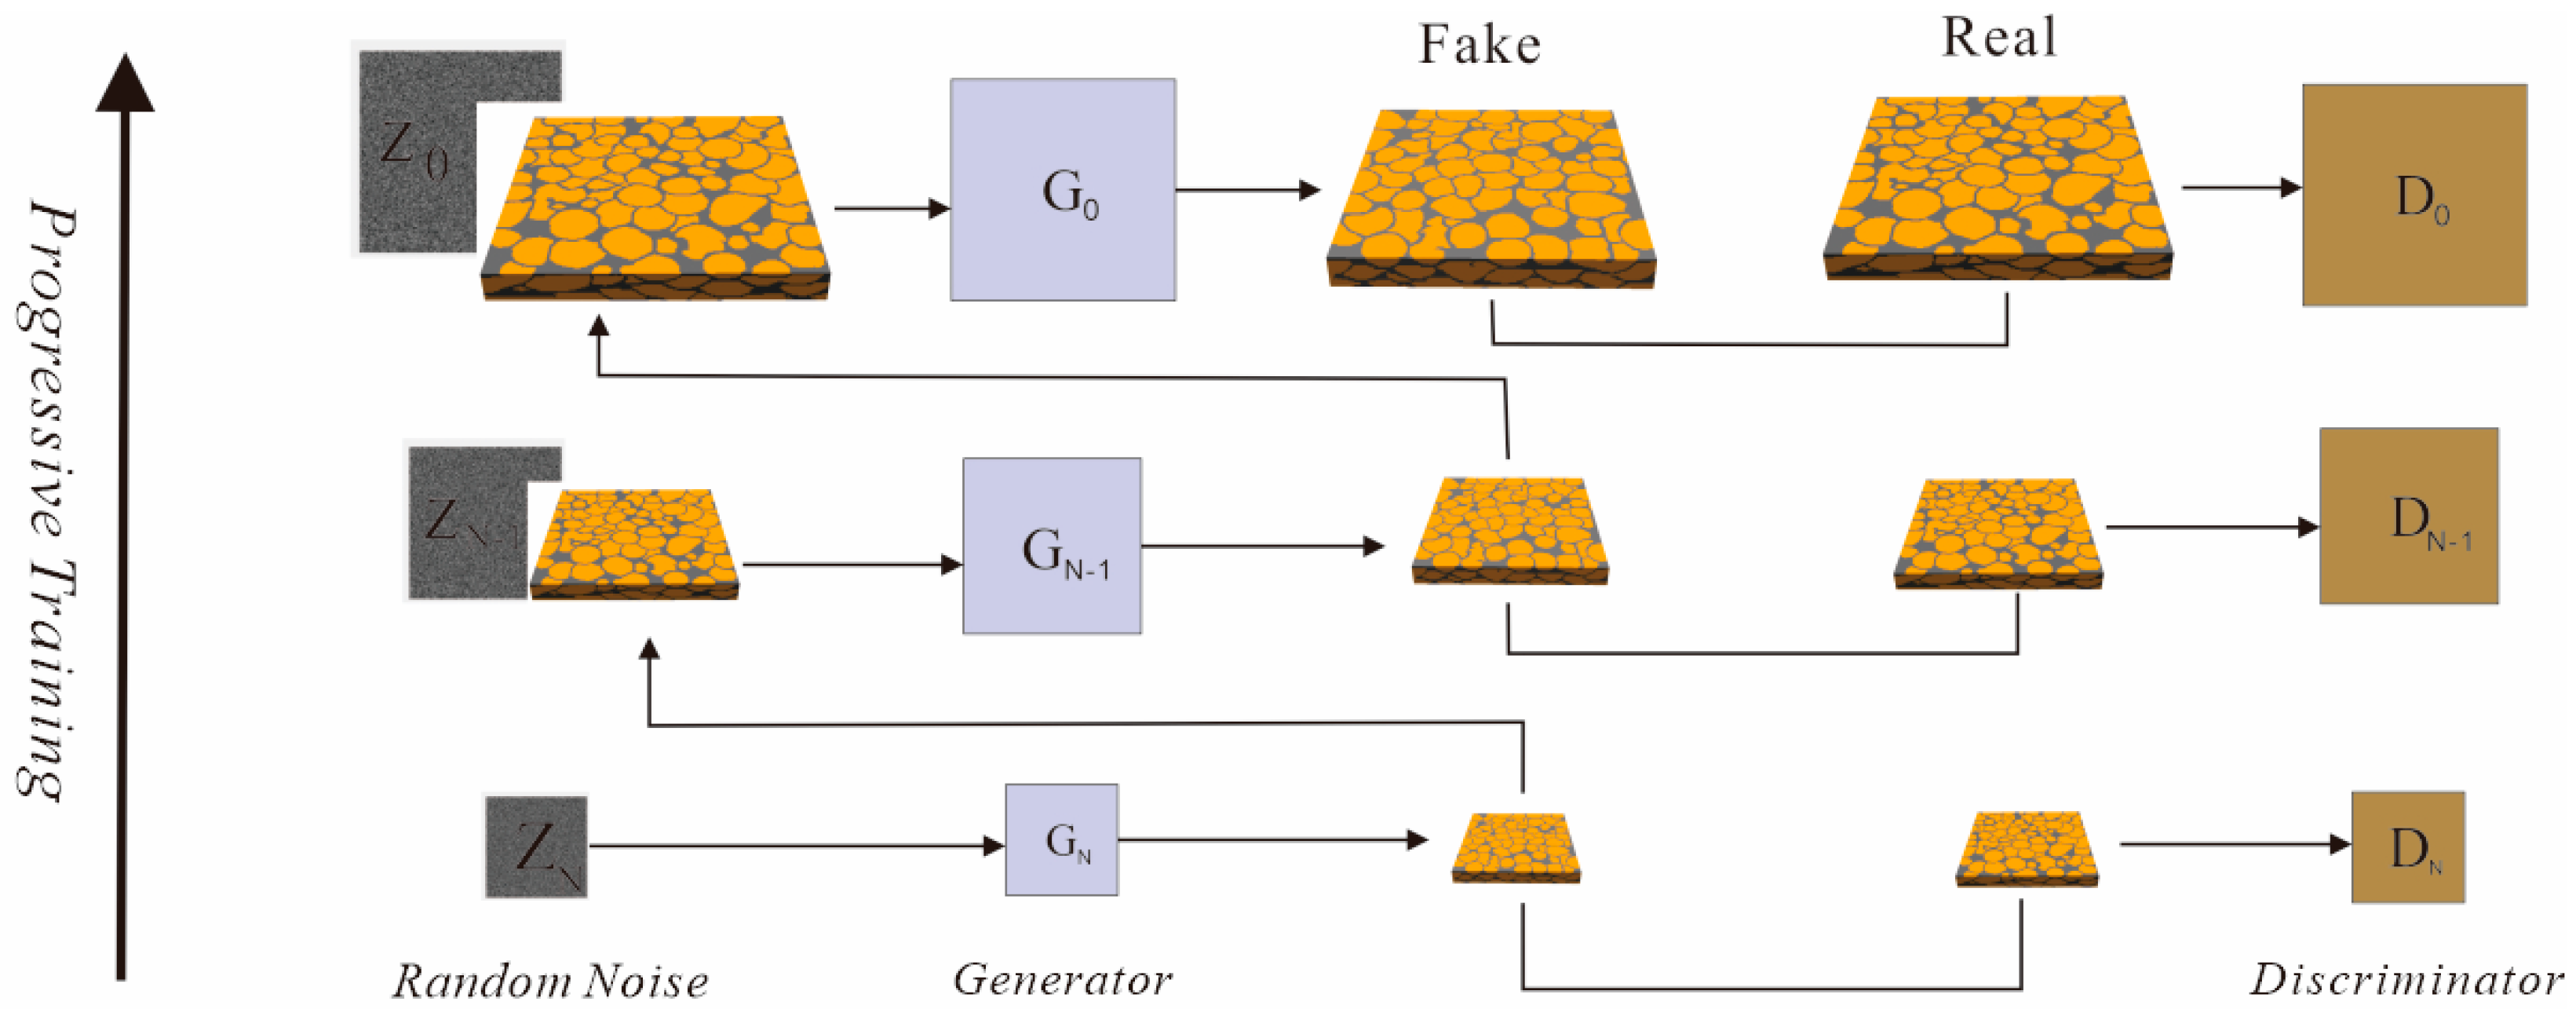
The multi-scale pyramid forms the core architectural component of the SinGAN framework. This hierarchical structure enables the progressive generation of 3D geological models from low to high resolution, allowing the network to capture both global structures and fine-scale details at different levels. Through this design, SinGAN performs generation and discrimination sequentially across multiple scales, ensuring consistent feature learning at every resolution.
Each layer (or scale) in the pyramid corresponds to a specific spatial resolution, ranging from the lowest (coarsest) at the bottom to the highest (finest) at the top.
The total number of pyramid levels, denoted as
, is determined according to the size of the training sample and the desired level of detail. Each level
has its own generator
and discriminator
. The resolution of the
-th level is defined as
,which is obtained by progressively downsampling the original model
using a fixed scale factor rrr (typically between 0.7 and 0.8):
This coarse-to-fine structure allows each scale to focus on different spatial characteristics: lower levels learn global morphology and connectivity, while higher levels refine local texture and small-scale facies transitions.
At the coarsest level , the generator receives only Gaussian noise as input to produce a rough global structure.
For subsequent levels
, the input is composed of the upsampled output from the previous level,
, combined with additional noise
:
where
is a noise scaling parameter that controls the degree of randomness introduced at each level. This noise transfer mechanism allows the model to introduce controlled stochasticity while maintaining structural consistency across scales.
During progressive training, the generator and discriminator pairs are trained sequentially from the coarsest to the finest resolution. At each level, the model learns the mapping between the noise input and the reference pattern at the corresponding resolution. Once convergence is achieved at the current scale, its weights are frozen, and the network proceeds to the next finer level. The upsampling operator ensures smooth transition between scales by resizing both the generated samples and reference images according to the same scale factor .
As illustrated in
Figure 2, the complete pyramid structure can be represented as a generator hierarchy
and a discriminator hierarchy
. This progressive, coarse-to-fine training strategy enables the model to first capture the global geometry of the reservoir (e.g., channel orientation and connectivity) and then refine fine-scale geological textures such as interbedded mudstone layers and facies transitions, ultimately yielding high-resolution, geologically realistic results.
2.3. Self-Attention Mechanism
The attention mechanism refers to the process of focusing on key information among a large amount of data, effectively identifying and prioritizing the most relevant components. Originally introduced by Bahdanau et al. [
19], the attention mechanism was applied in neural machine translation models, enabling the model to dynamically attend to different parts of the input sentence during translation. This allowed the model to emphasize relevant information instead of relying solely on a fixed-size context vector.
Specifically, the attention mechanism assigns a weight to each word in the input sequence, allowing the model to concentrate on those words that are more relevant to the translation at a given time step. Building upon this concept, Vaswani et al. [
20] proposed the self-attention mechanism, which captures global dependencies by computing the similarity between each position in the input sequence and all other positions. Unlike traditional attention mechanisms that require manually added weights, self-attention automatically calculates the attention weights, significantly improving both parallelization and the model’s capacity to handle long sequences.
The mathematical formulation of the self-attention mechanism is as follows:
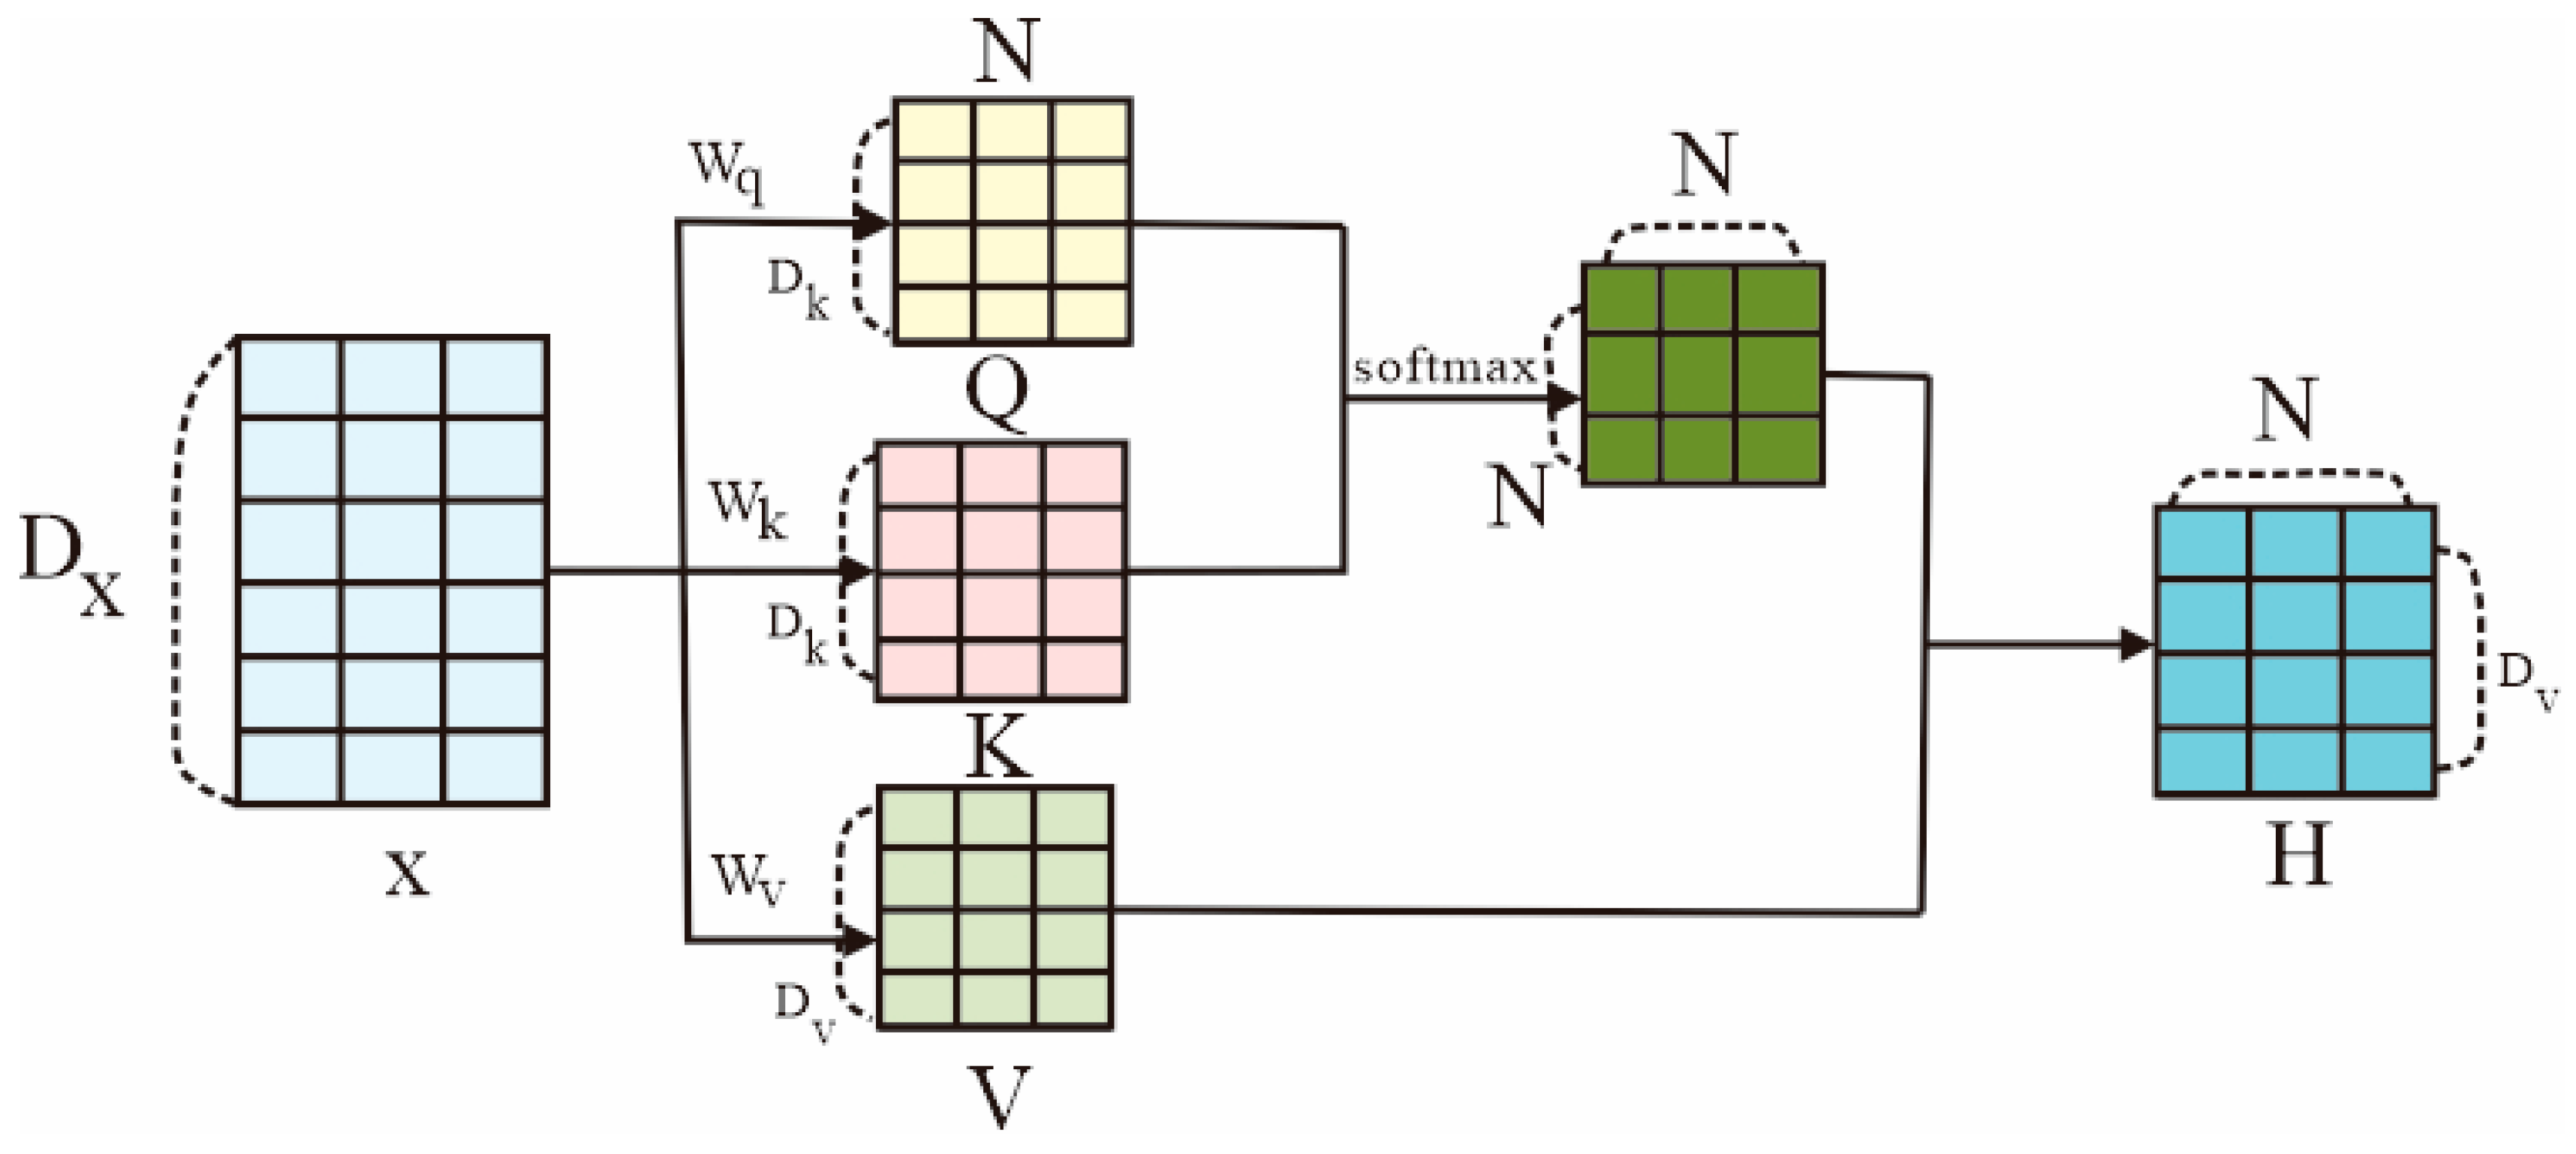
In this formulation, represent the input sequence projected into three distinct subspaces using learnable matrices , corresponding to the query, key, and value representations, respectively. The term is a scaling factor introduced to prevent the dot-product values from becoming excessively large, which could otherwise lead to vanishing gradients during training.
After computing the dot product to measure the similarity between the query and key vectors (i.e., between elements within the sequence), a normalization function—typically the Softmax function—is applied to the resulting scores. This produces a set of attention weights that determine the importance of each element in the sequence relative to others. Specifically, the input feature map is projected into three components: Query, Key, and Value. The dot-product similarity between the Query and Key is computed and normalized using a Softmax function to produce attention weights, which are then used to aggregate the Value vectors. The output is combined with the original feature map via residual connections, thereby enhancing the network’s sensitivity to semantically important regions (
Figure 3).
To capture horizontal long-range dependencies in 3D facies models while keeping memory and computation costs manageable, we implement a lightweight attention module that operates on the XY plane of each depth slice independently. Given an input tensor
, for each depth
we extract the 2D slice
, downsample it by a factor of 4 in each spatial dimension, and compute Query, Key and Value by
convolutions:
Specifically,
is the downsampled slice, and the query/key channel dimension is reduced to
for efficiency. After reshaping to matrices
and
(with
), the attention map is computed by scaled dot-product and softmax:
The attended representation is
, reshaped and upsampled back to the original slice size and fused via a residual connection:
where
is a learnable scalar initialized to zero. Processing is done slice by slice, so only one
attention matrix is resident in memory at a time, which keeps peak memory usage feasible (e.g., for
the downsampled
, so the attention matrix size is ≈ 6.25 M entries
25 MB in float32 for
). We use single-head attention and channel reduction (C→C/8) rather than multi-head or windowed attention to balance representational capacity and GPU memory constraints. This design preserves lateral continuity while remaining tractable on a single GTX-3060-class GPU. The manufacturer is NVIDIA, located in Santa Clara, CA, USA.
To further improve numerical stability and convergence speed during training, Batch Normalization layers are applied after each convolutional layer. These layers normalize the feature maps within each mini batch, mitigating activation distribution shifts and reducing the risk of vanishing gradients, thereby improving the trainability of deep networks and enhancing generalization.
Moreover, to strengthen the model’s nonlinear representation capability, an activation function is applied to the normalized feature maps within each convolutional block. In this study, LeakyReLU is primarily used as the nonlinear activation function. Unlike ReLU, LeakyReLU allows a small portion of negative input values to pass through, effectively alleviating the “dead neuron” issue that can arise in early training stages and supporting the capture of more complex geological textures. The final output layer of each sub-generator uses the Tanh activation function, while the discriminator’s final output layer does not use any activation function, directly producing the discrimination score.
2.4. Design of a Single-Image GAN for Modeling High-Sand-Content Reservoirs
In this study, a three-dimensional single-image generative adversarial network architecture incorporating a self-attention mechanism is proposed. The network is optimized through the selection of appropriate loss functions and a stage-wise training strategy. The resulting model is capable of generating reservoir realizations characterized by high sandbody-to-mud ratios and low connectivity.
2.5. Training Image and Network Architecture
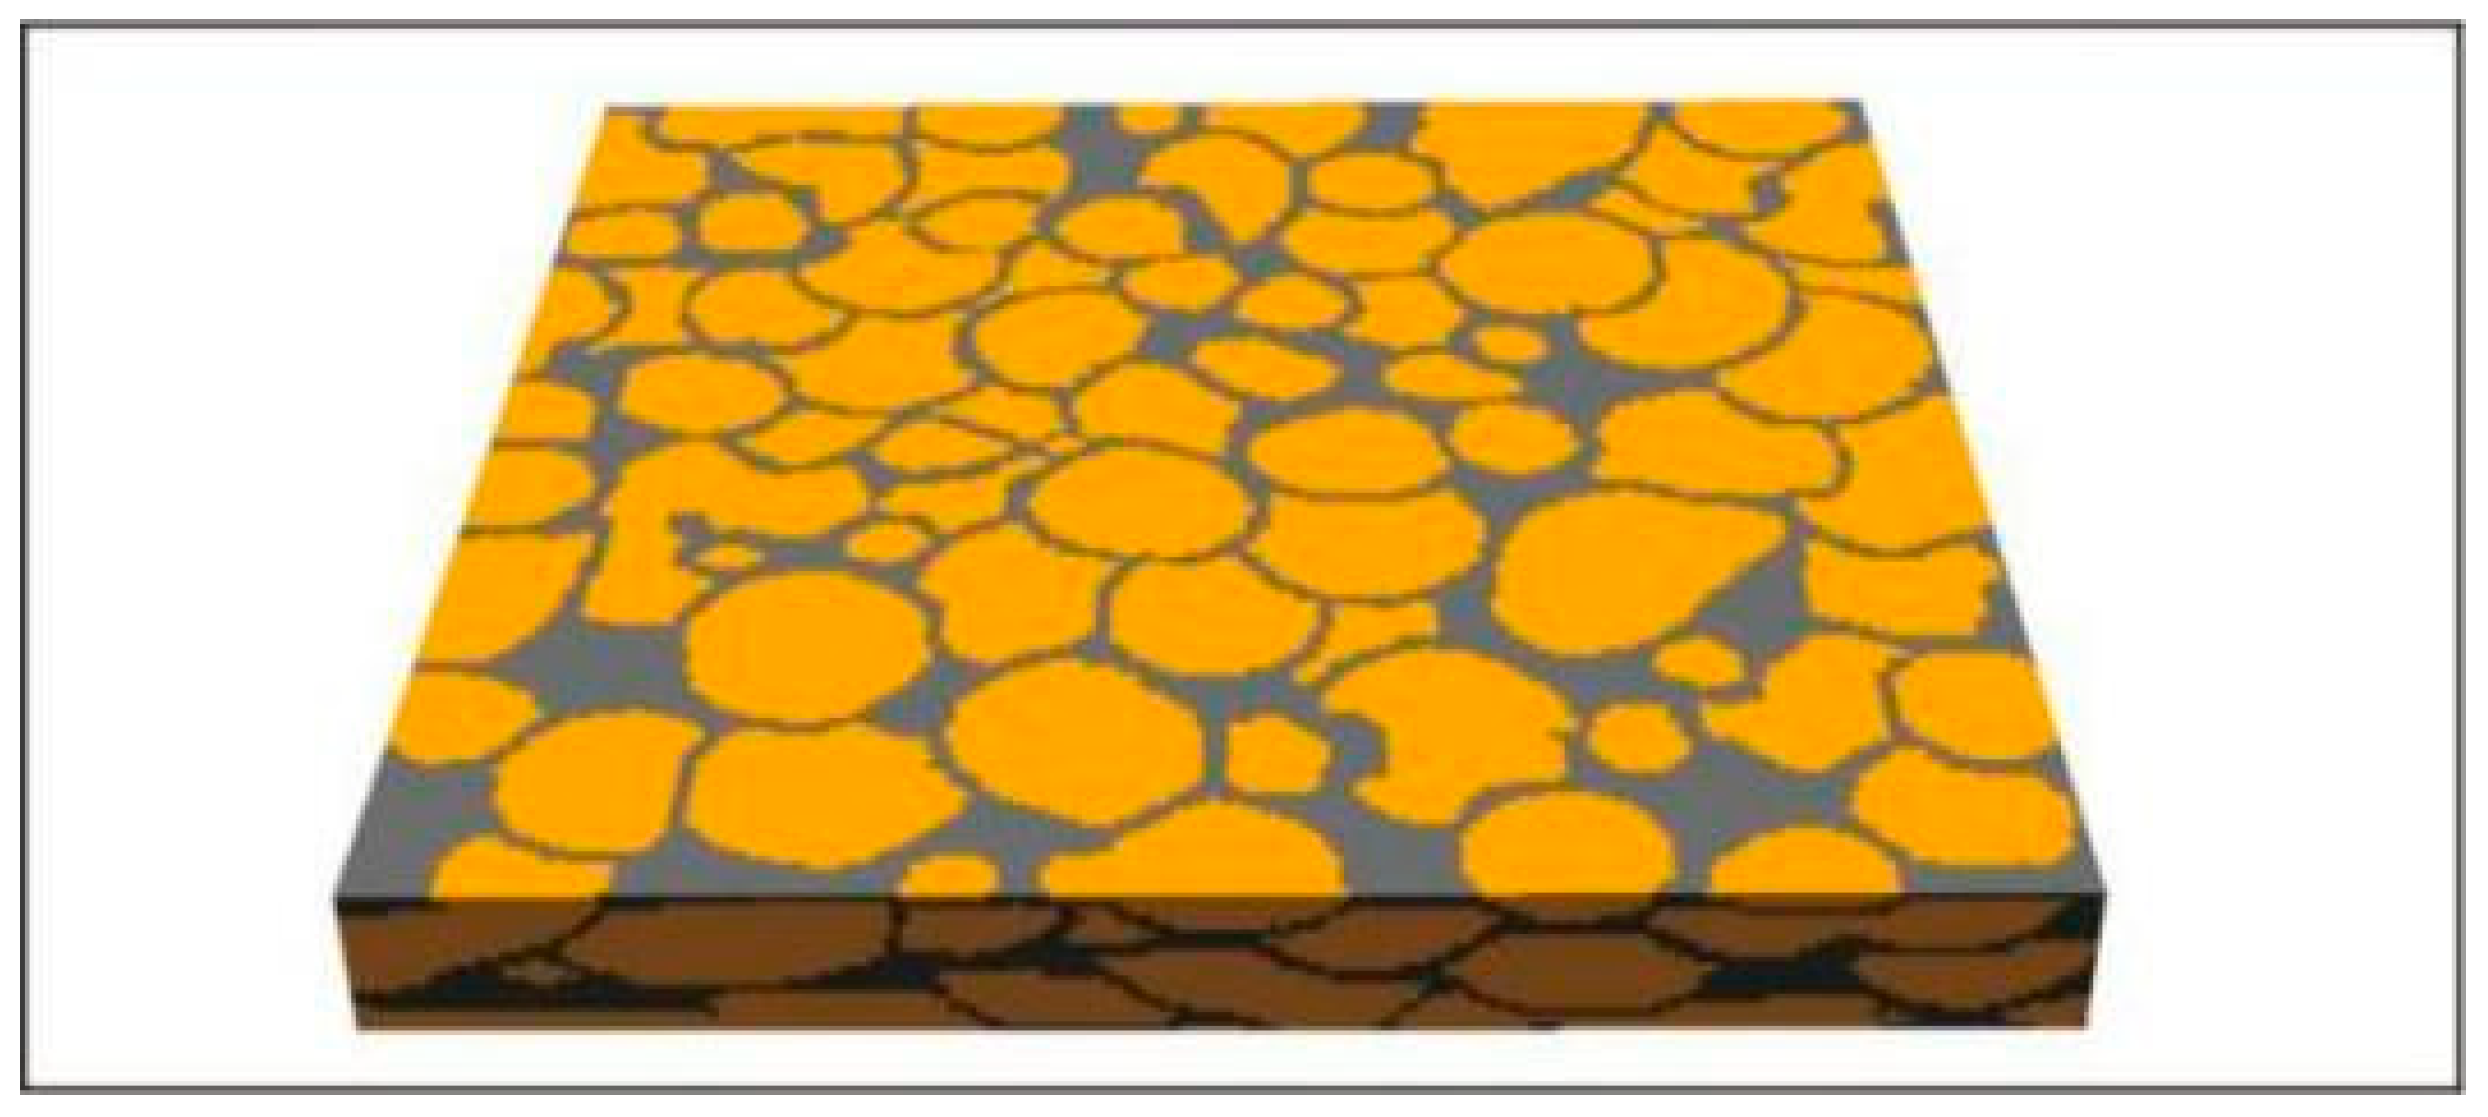
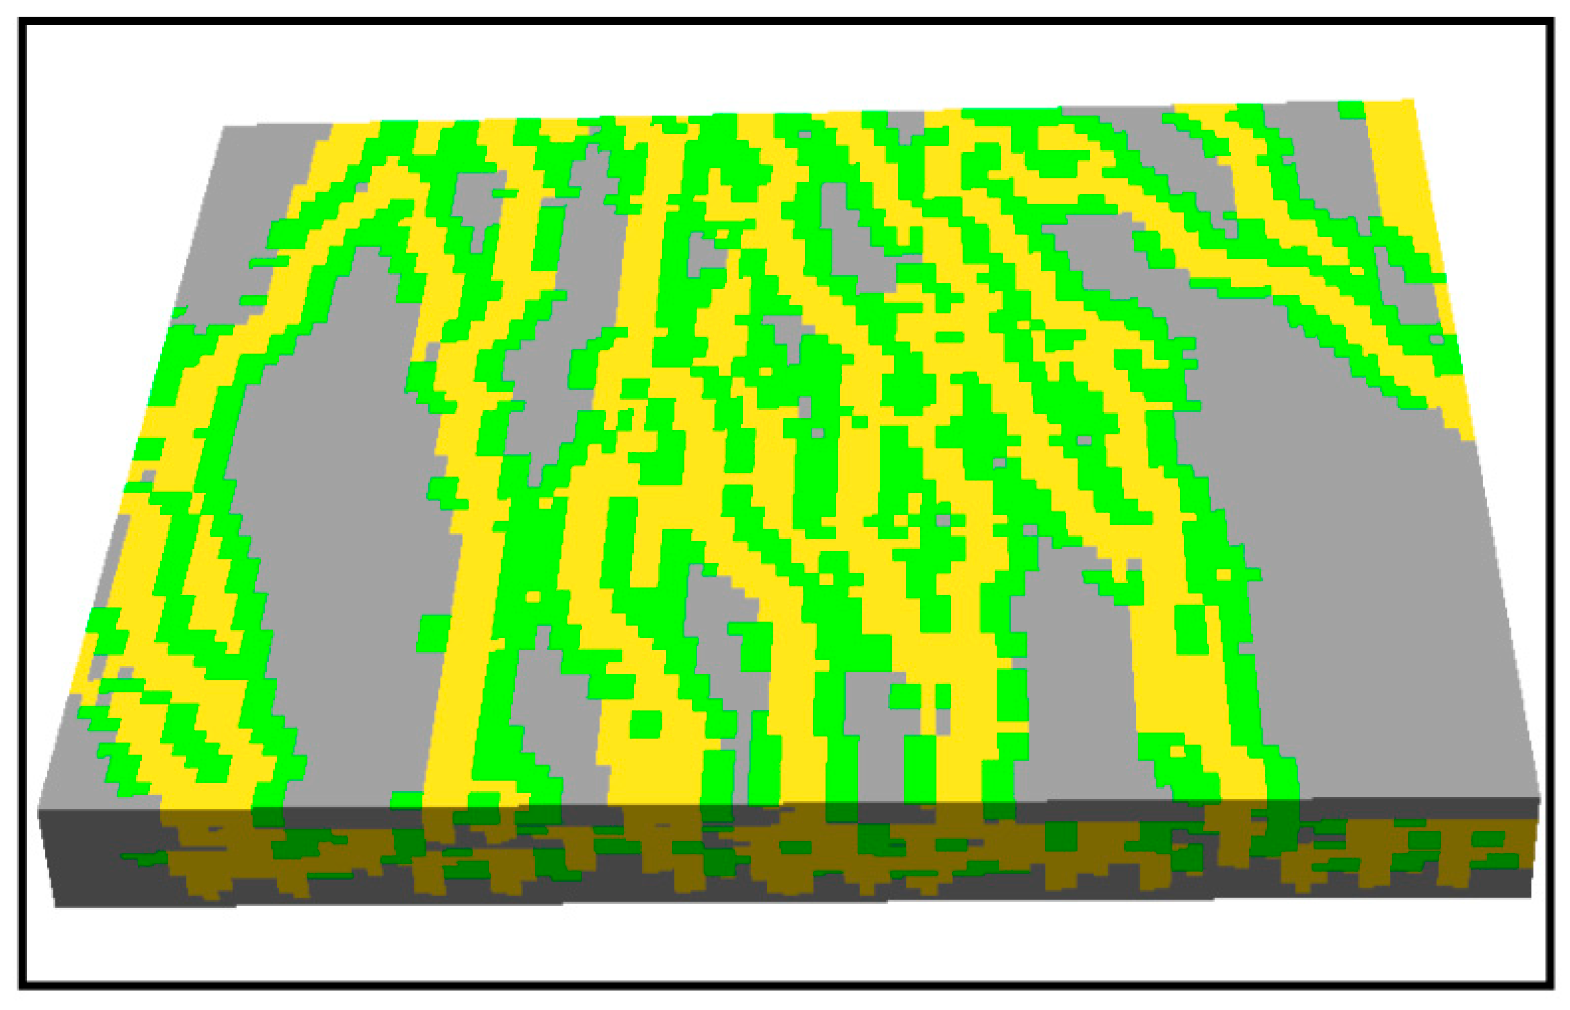
The training image is a three-dimensional geological model with dimensions of 200 × 200 × 20, constructed with reference to the high sandbody-to-mud ratio, low-connectivity model described in Walsh et al. [
6]. The model has a sand-body proportion of approximately 70% (
Figure 4). Due to the presence of thin mudstone interlayers that separate some of the stacked sand bodies, the overall connectivity of the model remains low. This model is used as the input training image for the single-image generative adversarial network.
The generator in this study adopts a progressive generation strategy, composed of multiple cascaded sub-generator modules with identical architectures, as shown in
Table 1. The initial input is a 3D random noise volume with dimensions of 47 × 47 × 4, which is first passed through the initial sub-generator to produce a low-resolution image. Each sub-generator contains five consecutive 3 × 3 × 3 3D convolutional layers. The first four layers use 16 convolutional kernels followed by LeakyReLU activation functions to enhance nonlinear modeling capability and mitigate vanishing gradients.
Meanwhile, to improve the modeling accuracy of key geological structures (such as sandbody boundaries and interbedded mudstones), a three-dimensional self-attention mechanism (SelfAttention3D) was introduced after the convolutional modules of the two intermediate sub-generators, in order to enhance the model’s ability to capture both local and global spatial dependencies.
At the final layer of each sub-generator, a single-channel convolution is applied, followed by a Tanh activation function, to generate a 3D image with dimensions of 4 × 47 × 47. The output is then upsampled via 3D linear interpolation and concatenated with new random noise as the input for the next stage. Each subsequent sub-generator shares the same structure and continues to extract and reconstruct features at higher resolutions. The attention mechanism is applied to the three intermediate-resolution sub-generators to enhance structural coherence and feature recognition across different scales while conserving computational resources. Through this progressive architecture, the model can iteratively refine image details, ultimately producing a high-resolution 3D reservoir model with dimensions of 200 × 200 × 20 (
Figure 5).
The discriminator adopts a convolutional neural network architecture symmetrical to that of the generator and consists of multiple sub-discriminators corresponding to the number of sub-generators, with identical structures as shown in
Table 1. Each sub-discriminator comprises five 3 × 3 × 3 3D convolutional layers, combined with LeakyReLU activation functions and BatchNorm normalization layers to progressively extract discriminative features. Unlike the generator, no attention mechanism is introduced in the discriminator in order to maintain architectural simplicity and computational efficiency. This design improves training stability and ensures that the discriminator focuses on capturing local texture and structural differences in the generated images. Each sub-discriminator outputs a single-channel feature map to evaluate the realism of the generated results at different resolutions.
2.6. Network Parameters
In this study, to ensure stable training and improve the balance between the generator and discriminator, the Zero-Centered Gradient Penalty (ZERO-GP) strategy proposed by Roth et al. [
21] was adopted in this study. Unlike the traditional Wasserstein GAN with gradient penalty (WGAN-GP) that enforces the gradient norm to be approximately one, ZERO-GP regularizes the discriminator by minimizing the deviation of the gradient norm from zero, which effectively prevents gradient explosion and mode collapse. This approach encourages smoother discriminator behavior and yields more stable convergence in limited-data scenarios.
The overall adversarial objective of SA-SinGAN can be formulated as follows:
where
and
denote the generator and discriminator, respectively,
is the distribution of real samples,
is the noise prior, and
controls the strength of the gradient penalty term. The third term represents the ZERO-GP regularization, penalizing large gradient norms near real and generated data distributions.
The discriminator loss is expressed as:
And the generator loss as:
where
and
represent intermediate feature maps of the discriminator used in feature matching loss, and
is the corresponding weighting factor.
In this study, the weights were empirically set as follows:
These hyperparameters were determined through sensitivity testing to ensure convergence stability and improved generative diversity.
Compared to WGAN-GP and LSGAN regularizations, ZERO-GP demonstrated better numerical stability and faster convergence in our experiments, consistent with previous findings in Roth et al. [
21] and Mescheder et al. [
22], where zero-centered gradient penalties led to improved training robustness, especially in data-limited scenarios such as geological facies modeling.
The specific training parameters are summarized in
Table 2. During training, both the discriminator and generator are optimized synchronously with the same learning rate of 0.0005. This learning rate was selected based on preliminary experiments, which indicated that higher values (e.g., 0.001) caused unstable training and mode collapse, while lower values (e.g., 0.0001) led to very slow convergence. Similar learning rates have also been widely used in prior GAN studies in geoscience applications, providing a balance between training stability and convergence efficiency. The number of training iterations is set to 10,000, with an update frequency of 1:1 between the discriminator and generator. The ZERO-GP method enforces the Lipschitz continuity constraint on the discriminator through a zero-centered gradient penalty, which stabilizes training more effectively compared to conventional gradient penalty approaches.
A zero-centered gradient penalty term is introduced into the discriminator loss function, forcing the gradient norm between the real and generated data distributions to approach 1, thereby preventing mode collapse and gradient vanishing issues. The generator loss consists of adversarial loss (weight = 1) and feature matching loss (weight = 100), while the discriminator loss includes real data discrimination loss (weight = 1), generated data discrimination loss (weight = 1), and the zero-centered gradient penalty term (weight = 10). Experimental results demonstrate that this parameter configuration ensures training stability while significantly improving the quality and diversity of generated samples.
3. Result
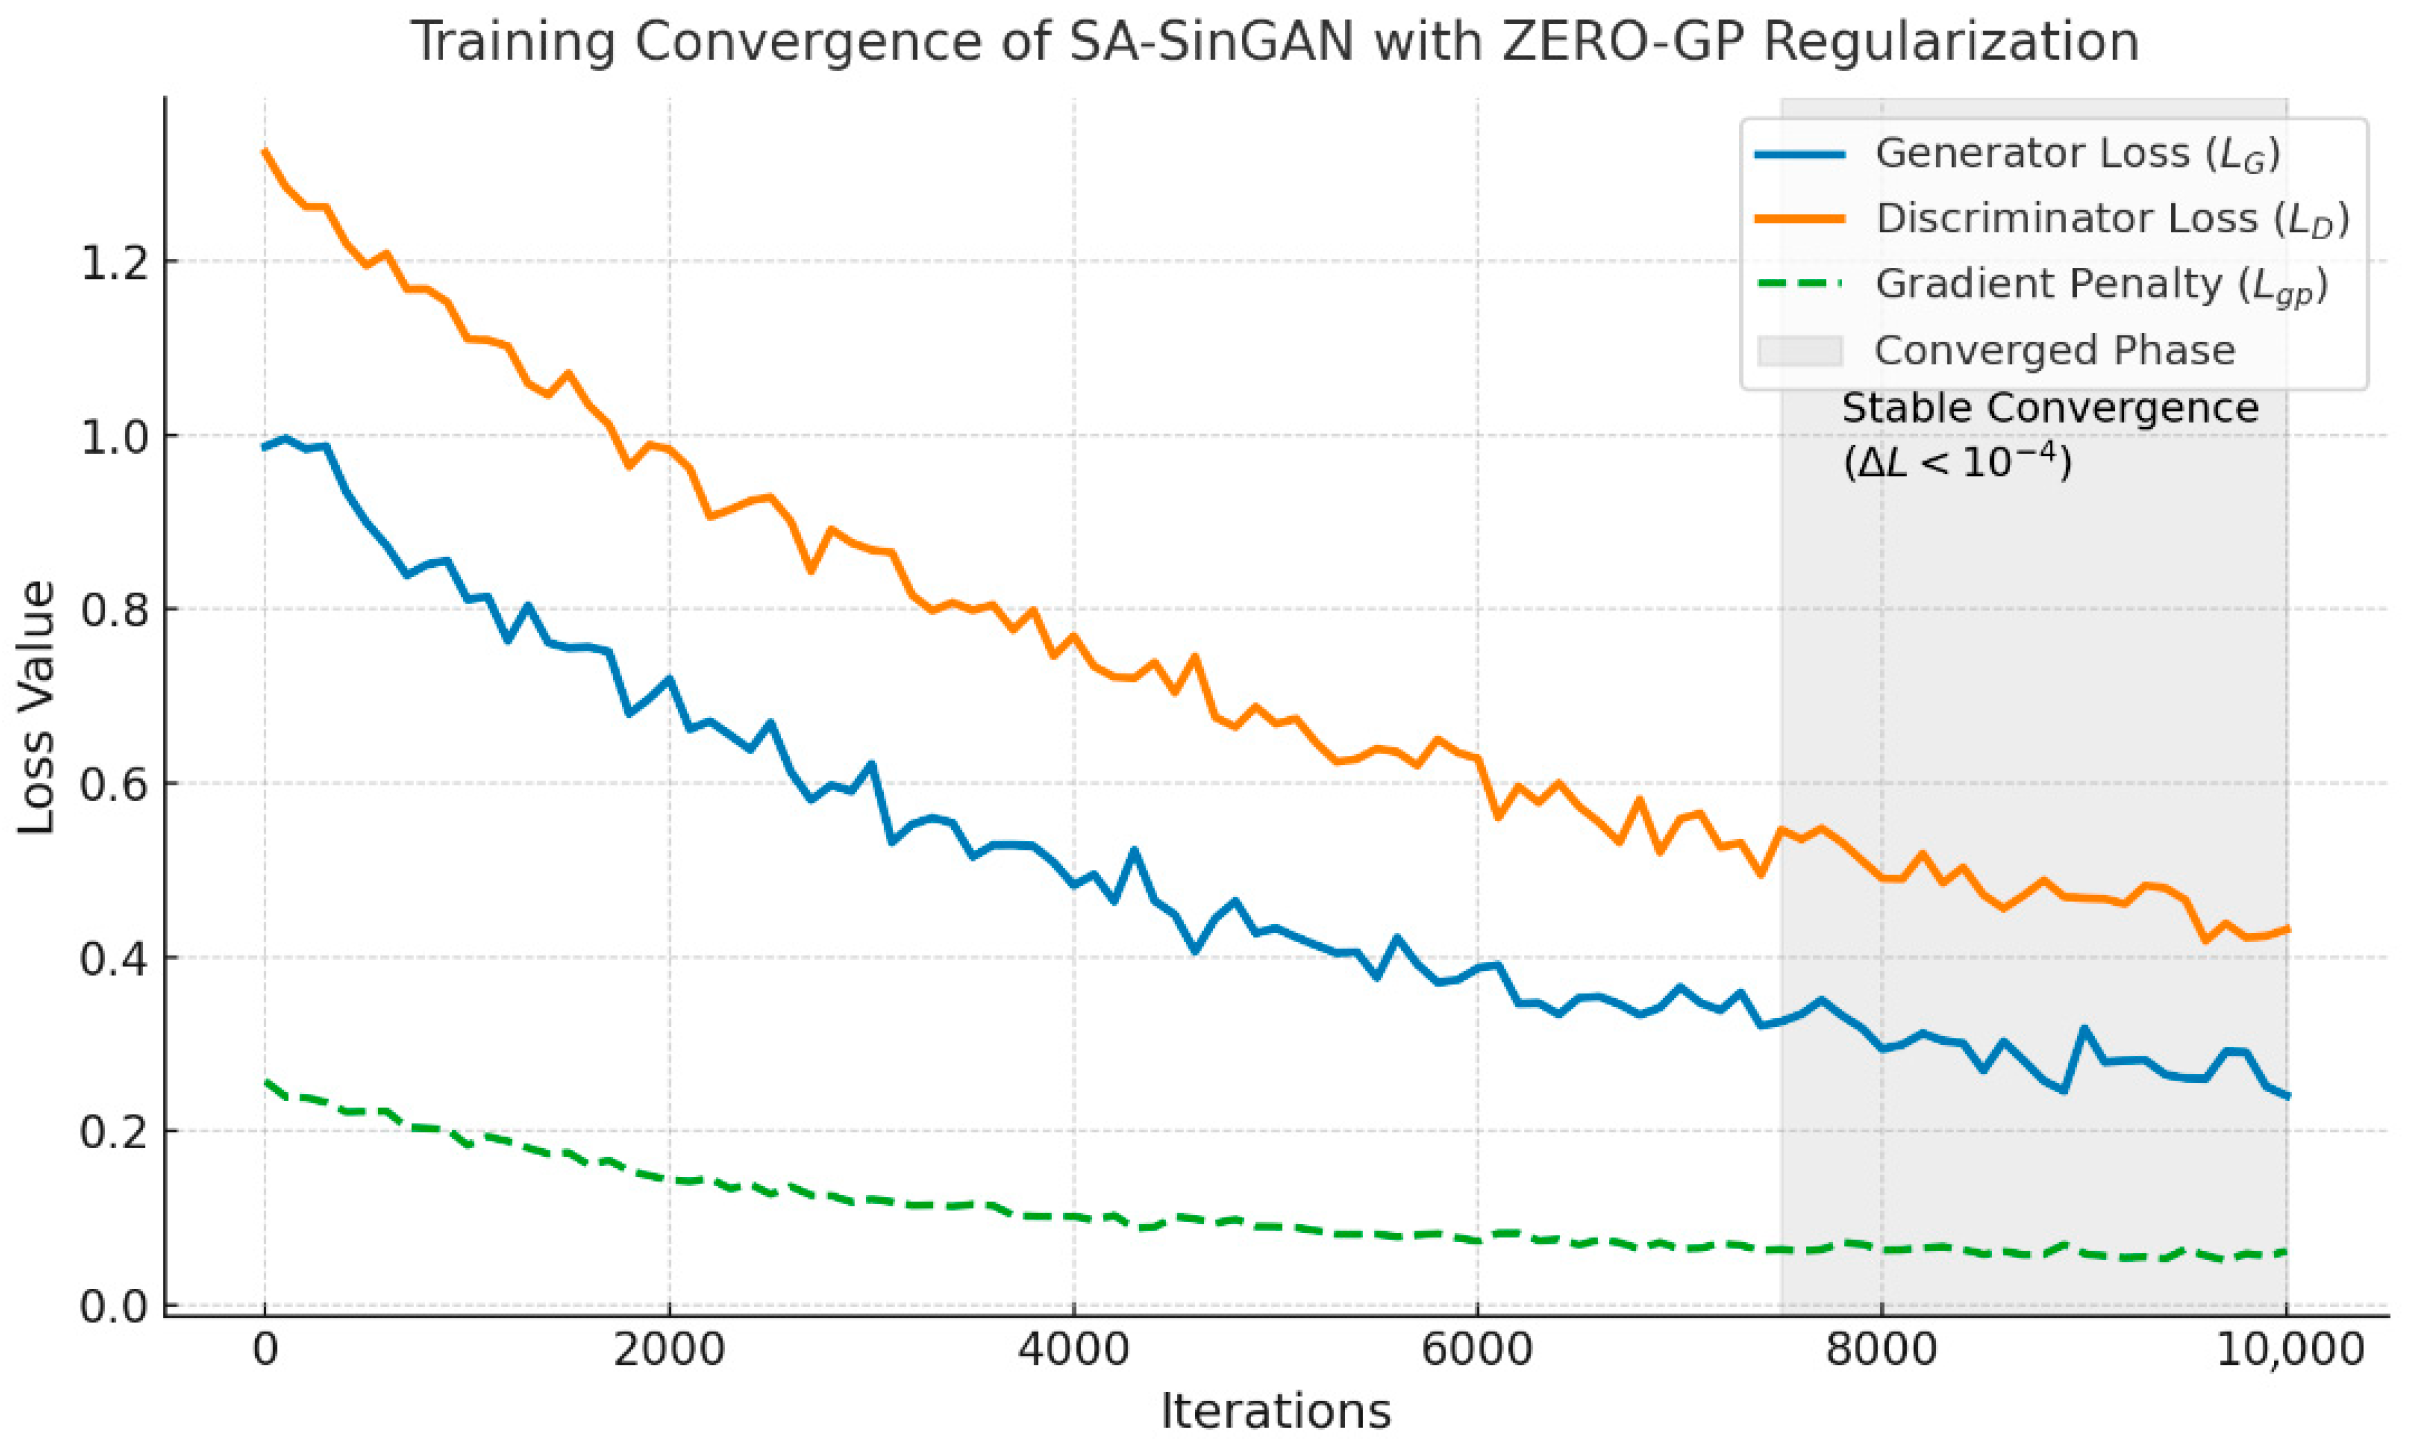
The proposed SA-SinGAN framework was implemented using the PyTorch2.1.1+cu118 deep-learning platform. All experiments were conducted on a workstation equipped with an NVIDIA GeForce RTX 3060 GPU (12 GB memory). To ensure strict reproducibility, the pseudorandom number generators in Python3.10.9, NumPy1.26.4, and PyTorch were all initialized with a fixed random seed (42). Using a fixed seed guarantees that stochastic processes—including weight initialization, noise sampling, and data shuffling—produce identical outcomes across repeated runs, which is essential for ensuring the reliability and replicability of the presented results. Each scale of the multi-scale pyramid was trained for a maximum of 10,000 iterations. Rather than relying on subjective visual inspection, a quantitative convergence criterion was employed to determine when training at a given scale should terminate. Convergence was declared when the relative change in the loss function satisfied the following condition:
for at least 500 consecutive iterations. In this expression,
represents the loss value at iteration
,
denotes the loss 500 iterations earlier, the numerator measures the recent variation in loss, the denominator normalizes the change to avoid numerical instability when the absolute loss becomes small, and the threshold
ensures that only negligible loss changes are interpreted as convergence. This criterion provides an objective and stable assessment of convergence under ZERO-GP–regularized adversarial training. The full trajectories of the generator loss, discriminator loss, and gradient-penalty term are presented in
Figure 6, clearly illustrating smooth and stable convergence behavior across all pyramid scales.
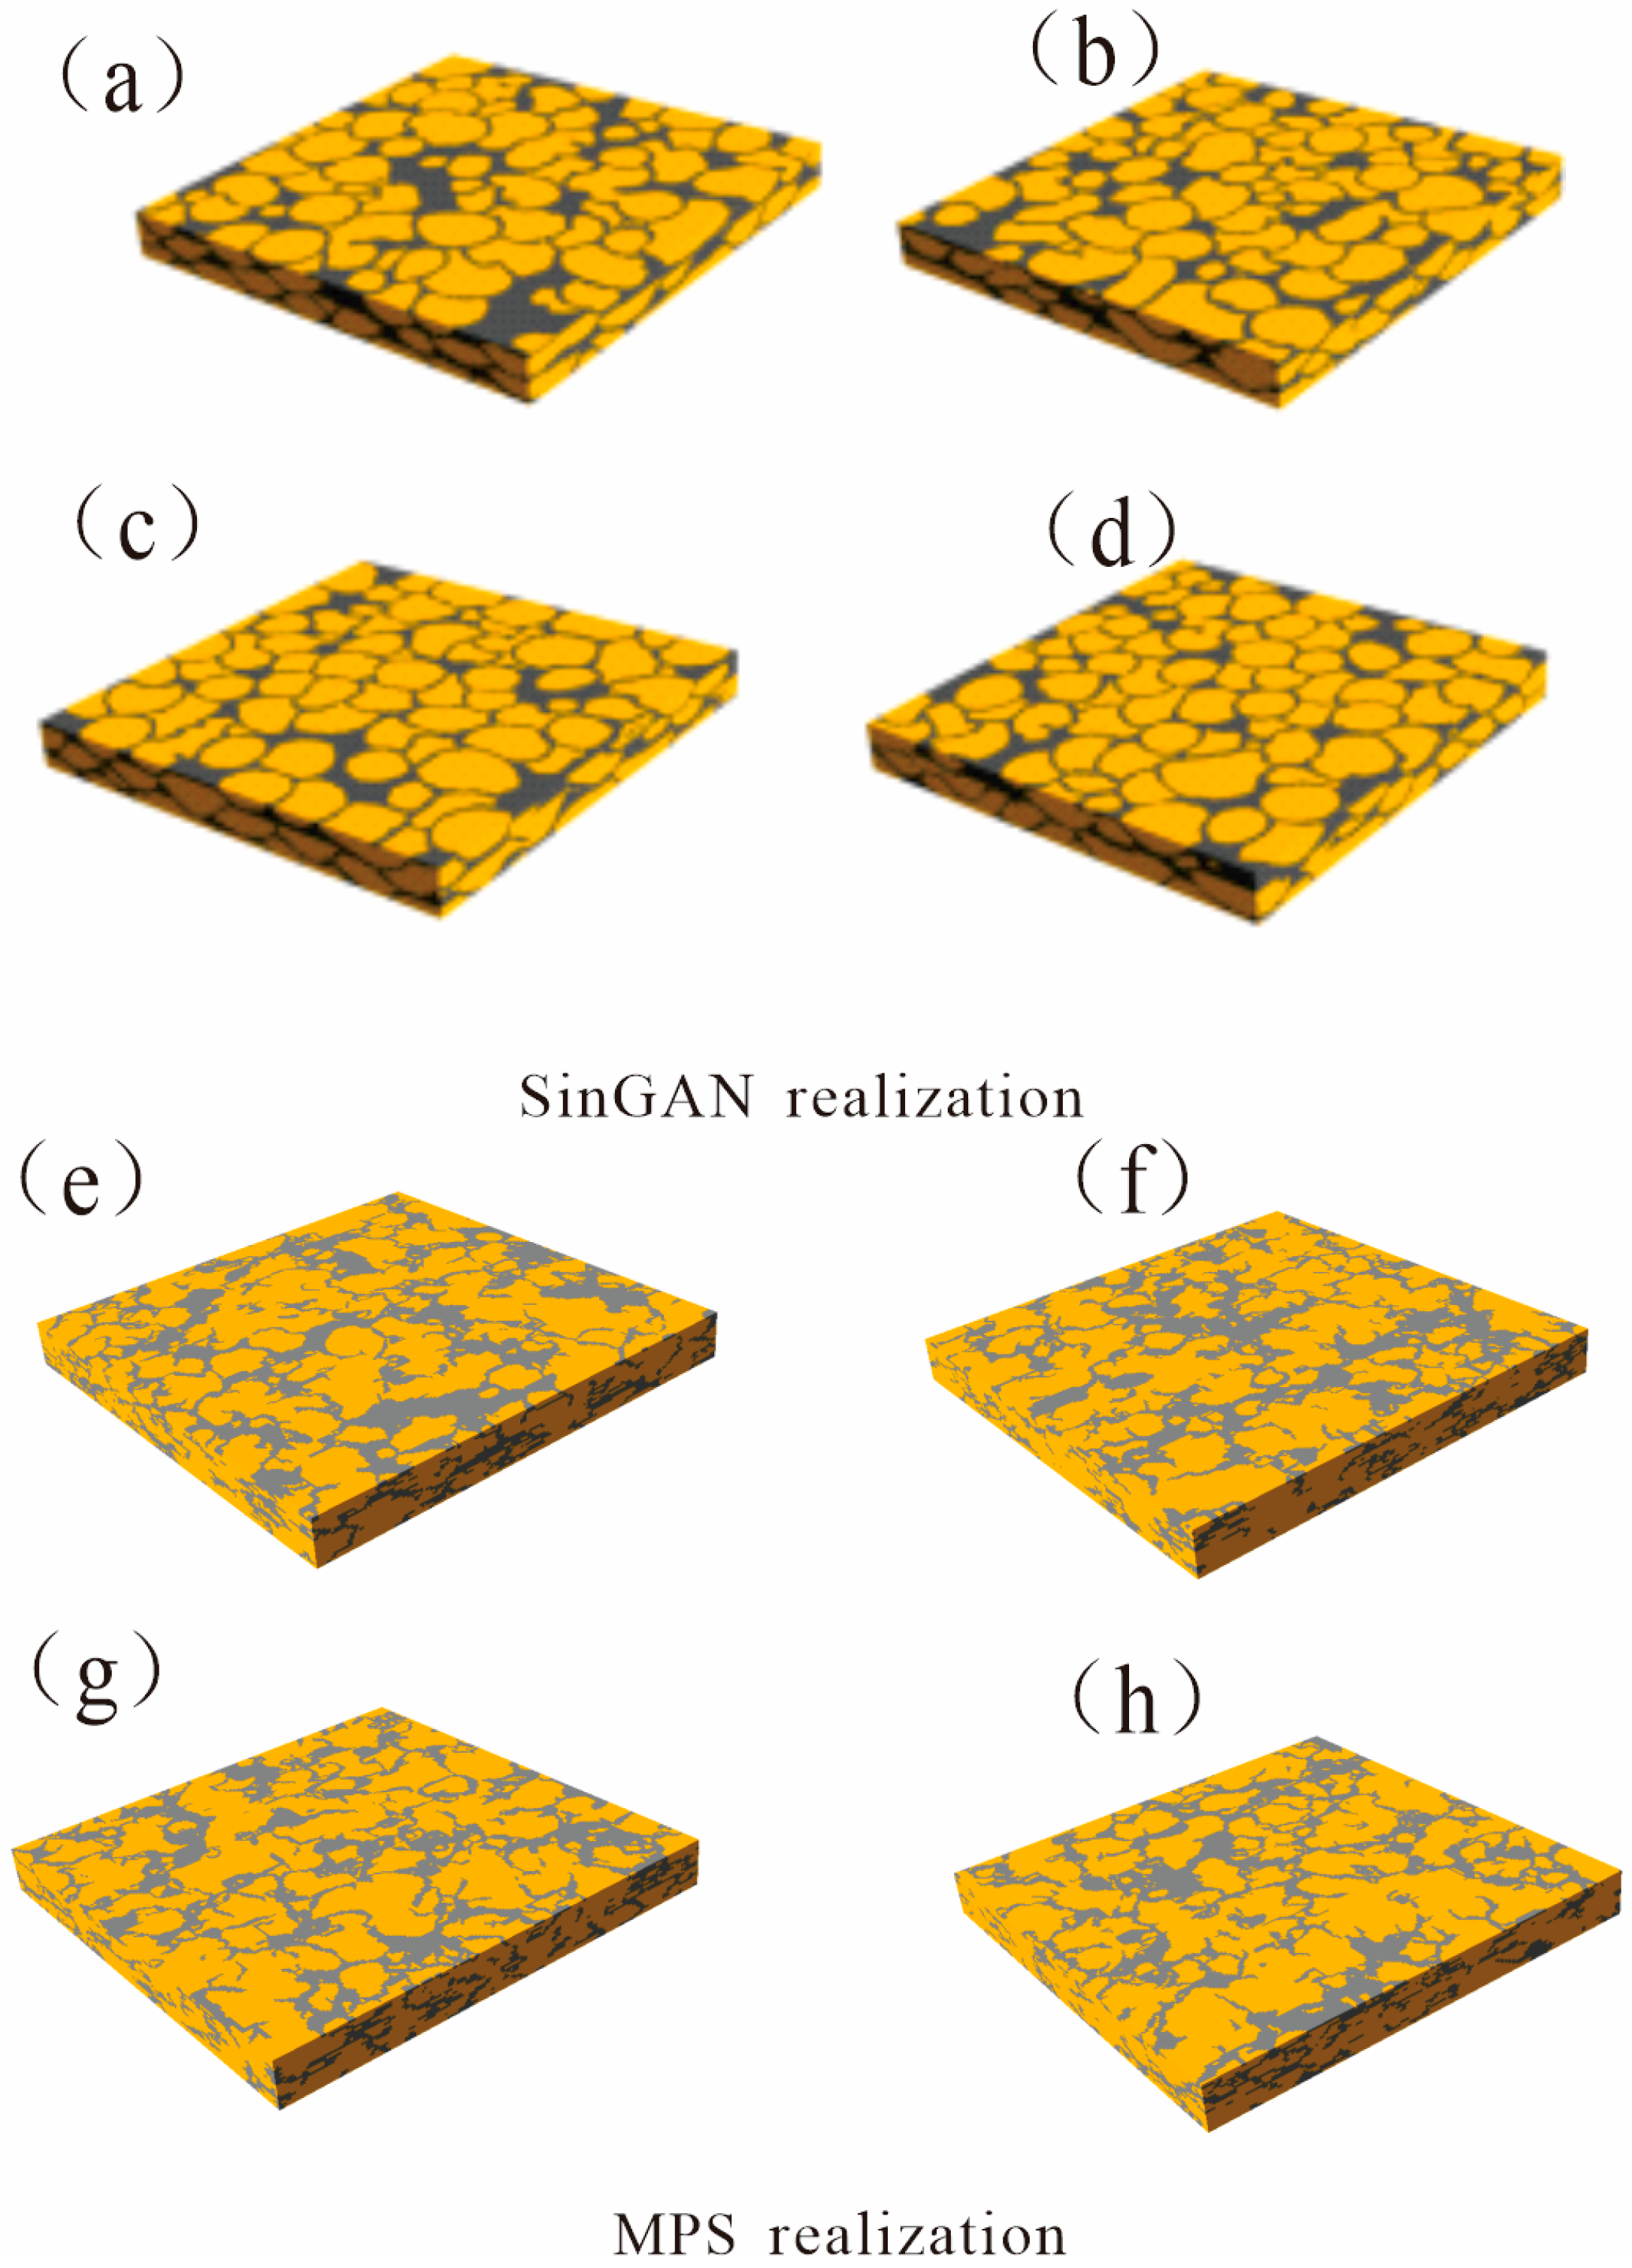
Upon completion of the training process, the final SA-SinGAN model was used to generate 30 three-dimensional geological facies realizations with dimensions of 200 × 200 × 20. To ensure reproducibility of the generated realizations, a fixed set of noise tensors was used for all inference procedures. For comparison, an additional 30 realizations of identical size were produced using a conventional Multiple-Point Statistics (MPS) algorithm. Representative samples from both methods were randomly selected for qualitative morphological comparison, followed by quantitative evaluation using similarity and connectivity metrics.
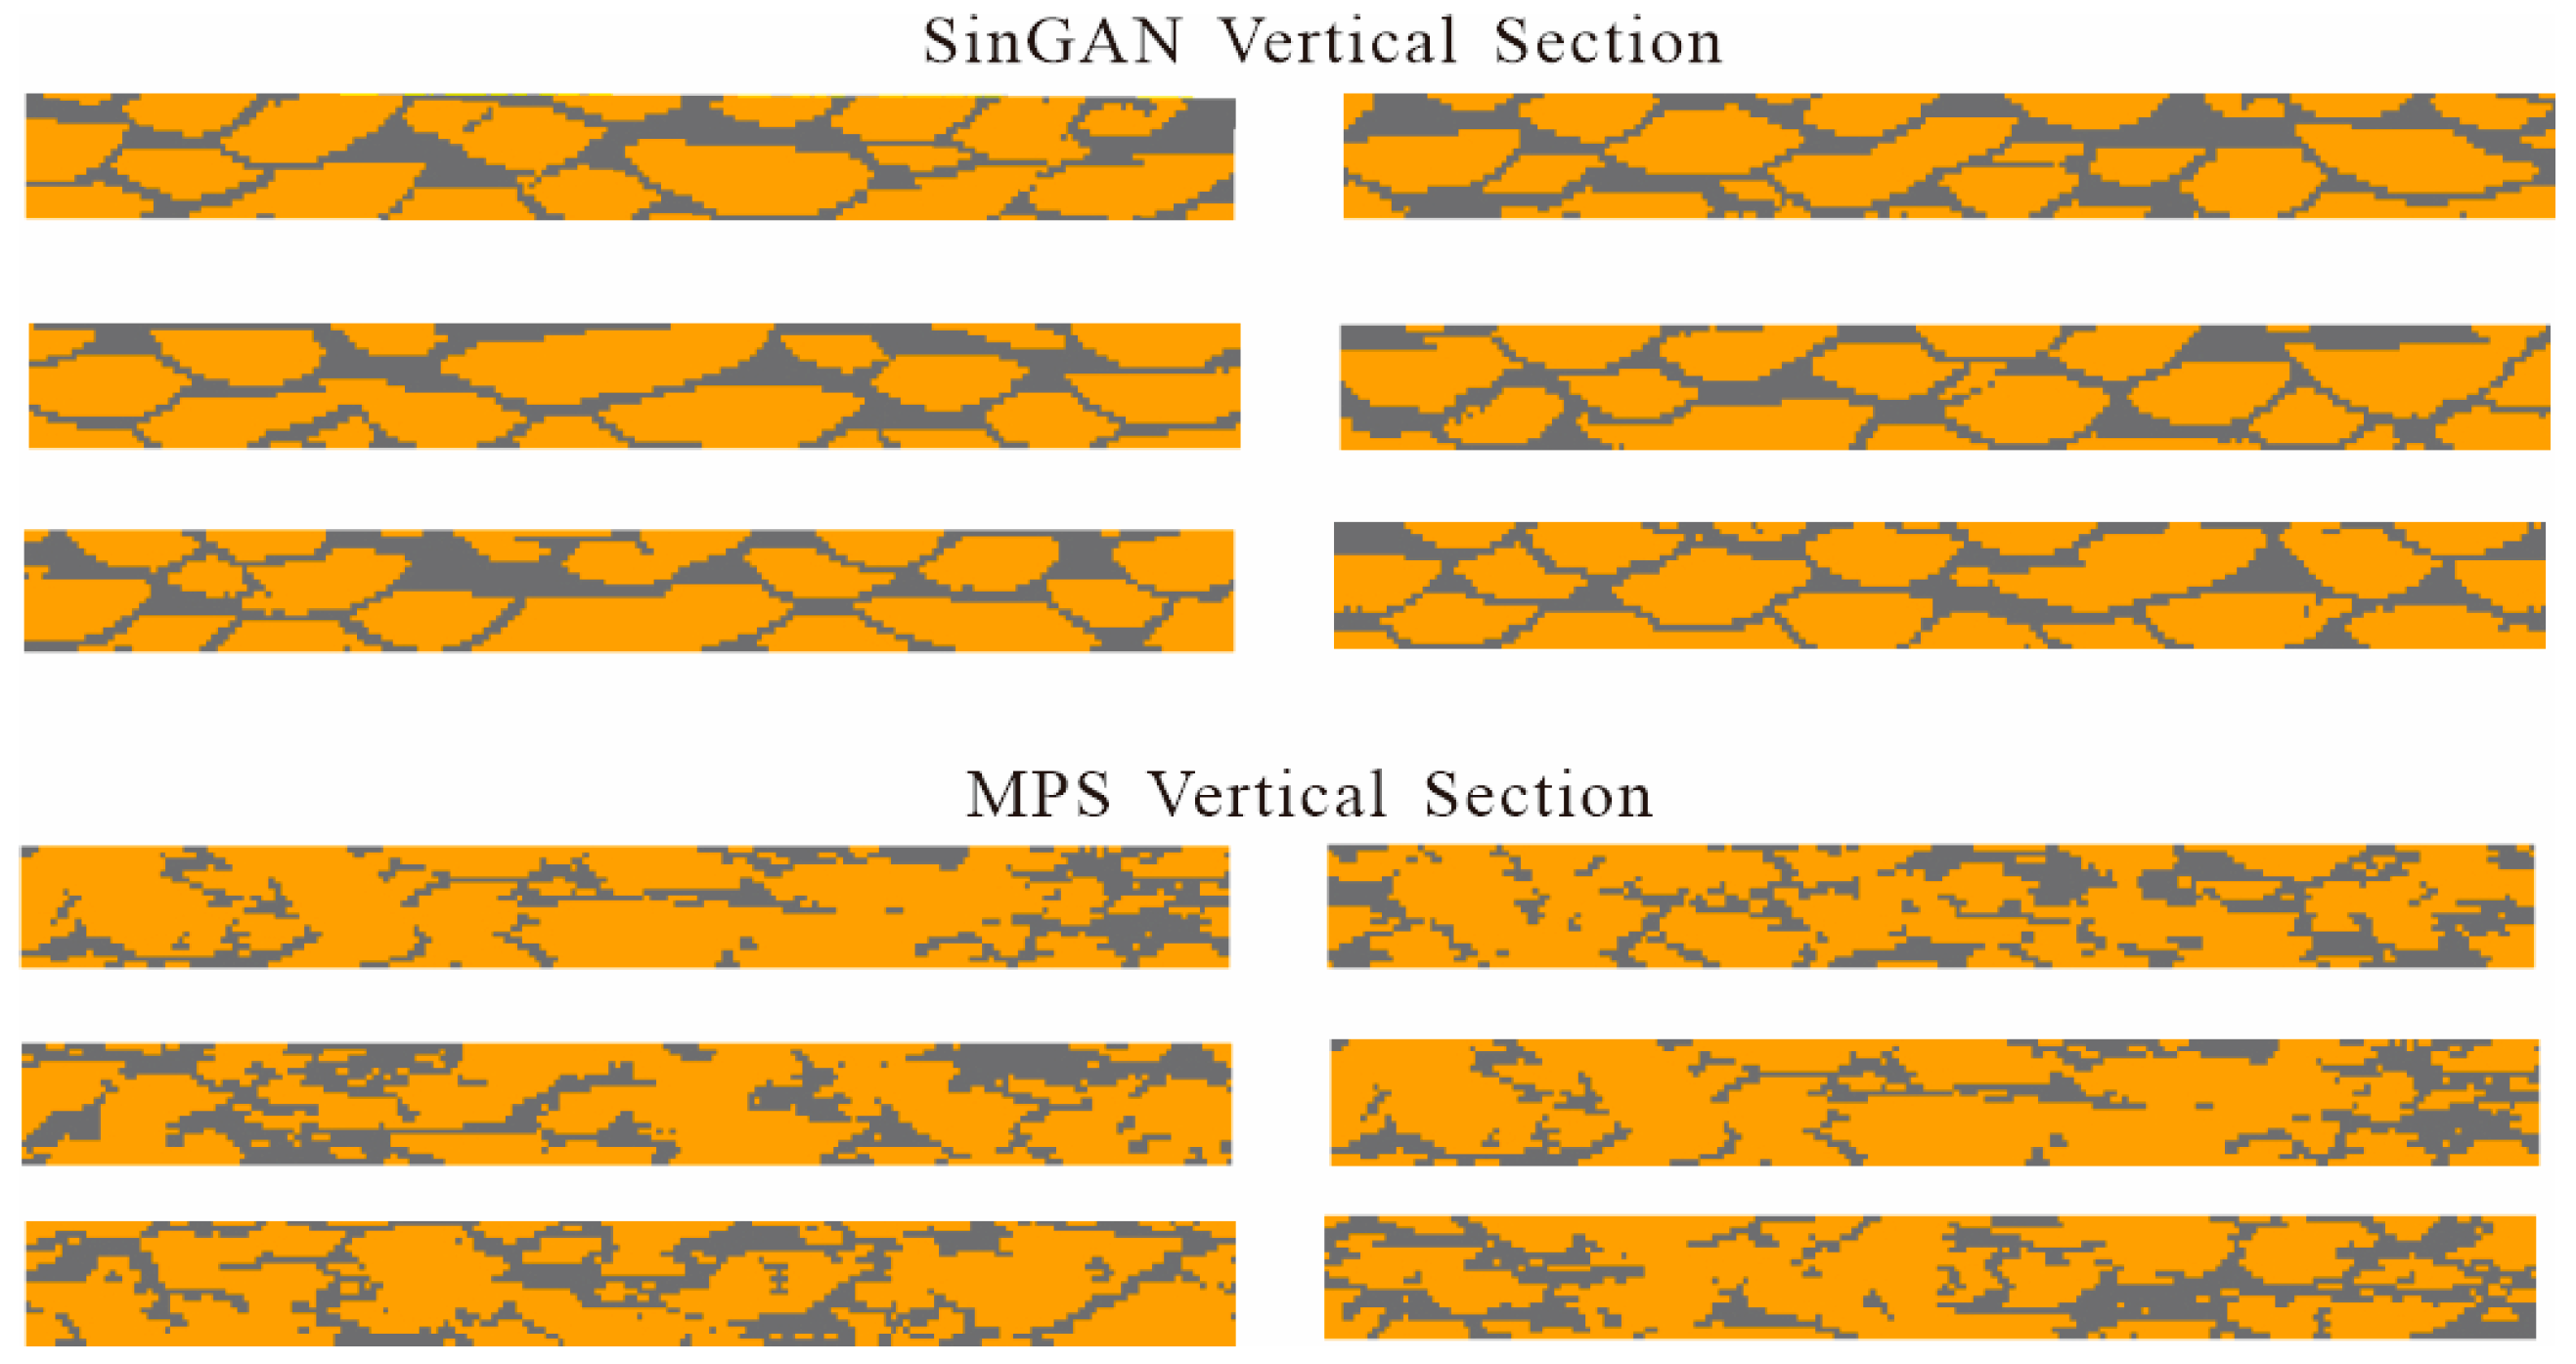
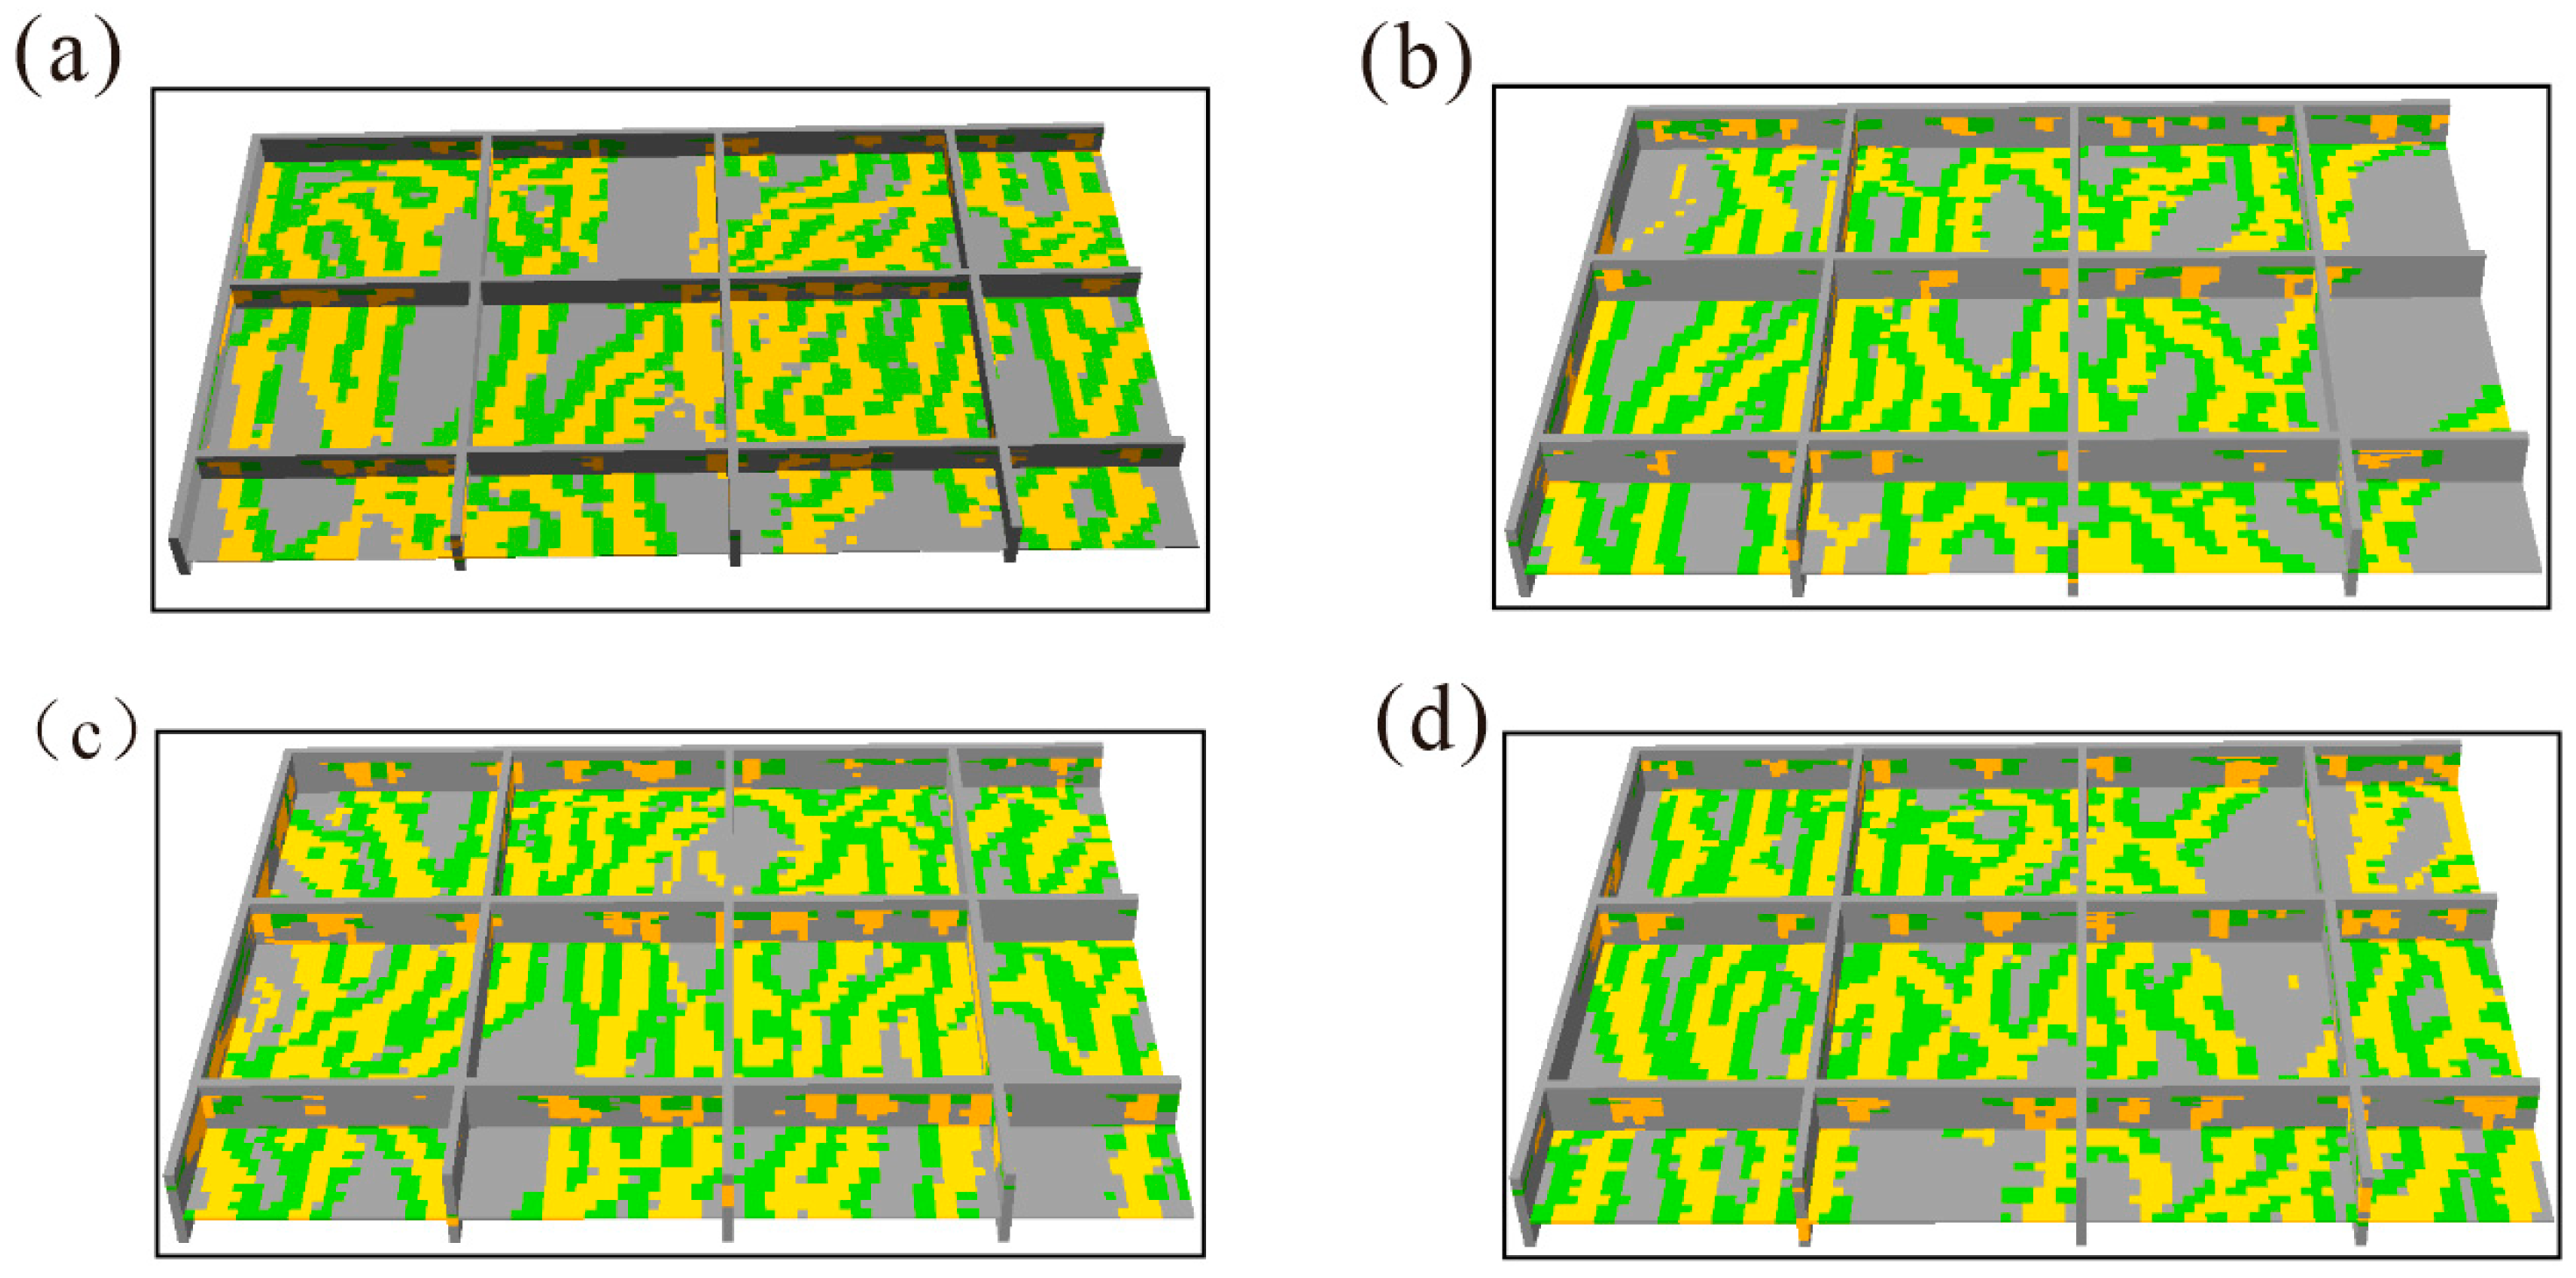
Figure 7 presents a comparison between the images generated by the two methods. It can be observed that the images generated using SA-SinGAN successfully reproduce the complex geological structures in the horizontal plane similar to the training image, and exhibit vertically consistent sandbody stacking patterns and continuous mudstone interlayers. In contrast, the models generated by the MPS algorithm fail to effectively reproduce the stacking of sandbodies and the continuity of thin mudstone interlayers. As shown in
Figure 8, the MPS-generated models lack structural continuity in the vertical direction compared to the reference model, resulting in evident structural discontinuities. Moreover, as illustrated in
Figure 9, a comparison of the internal structures of the generated models indicates that SA-SinGAN outperforms MPS in simulating internal geological features.
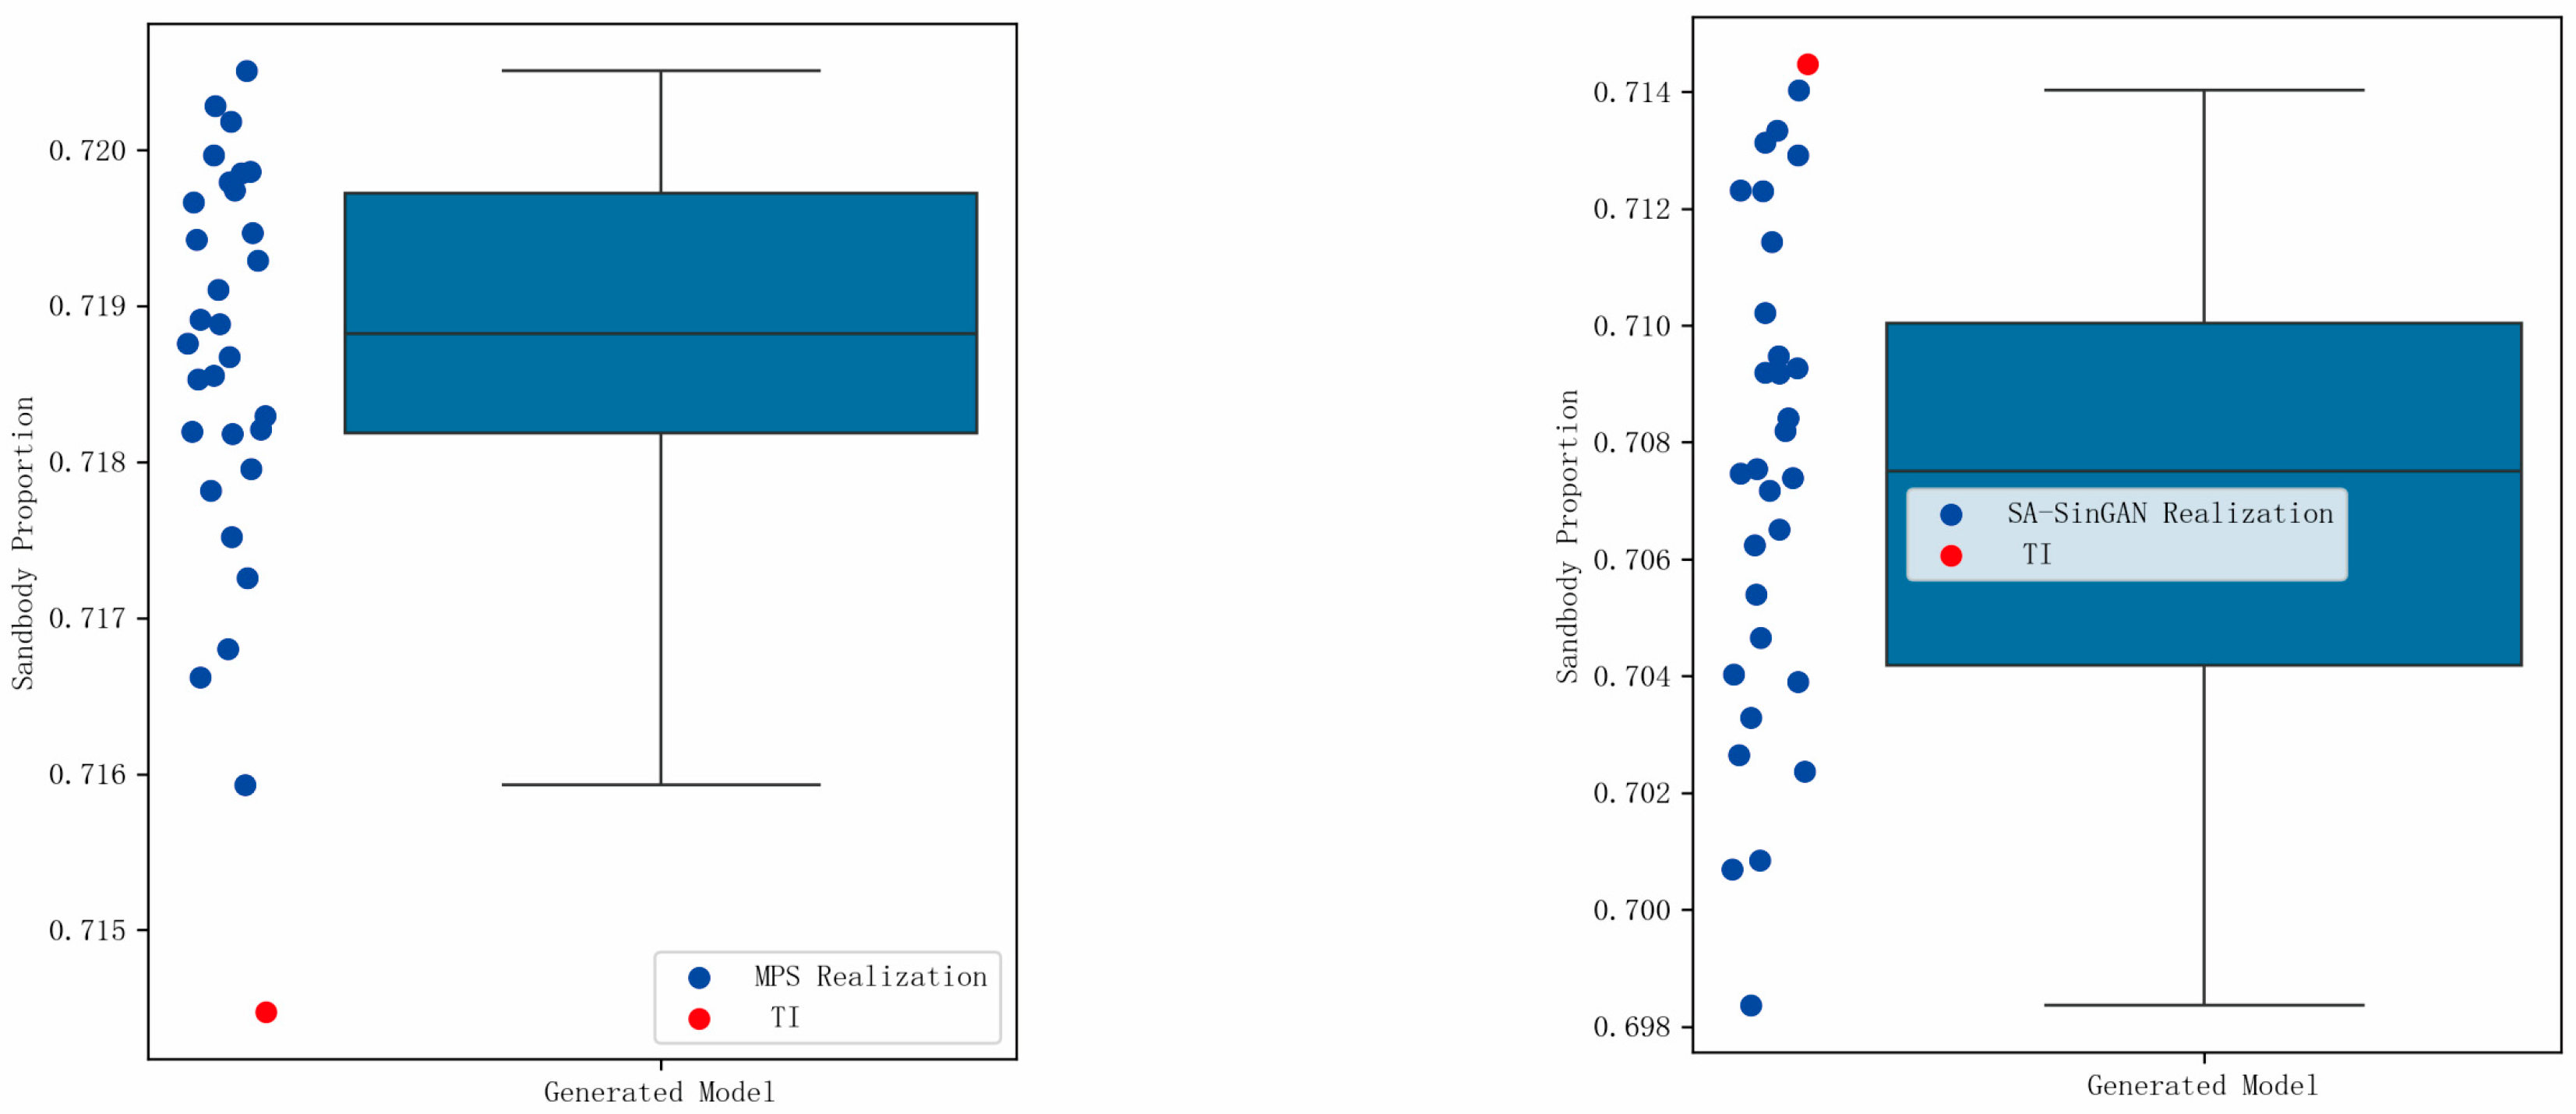
In addition, the sandbody proportions of the geological models generated by both methods were calculated, and boxplots were plotted accordingly. As shown in
Figure 10, there is little difference (
Table 3) between the SA-SinGAN and MPS methods in terms of simulating sandbody proportion, and both methods are capable of effectively reproducing the high sandbody proportion characteristic.
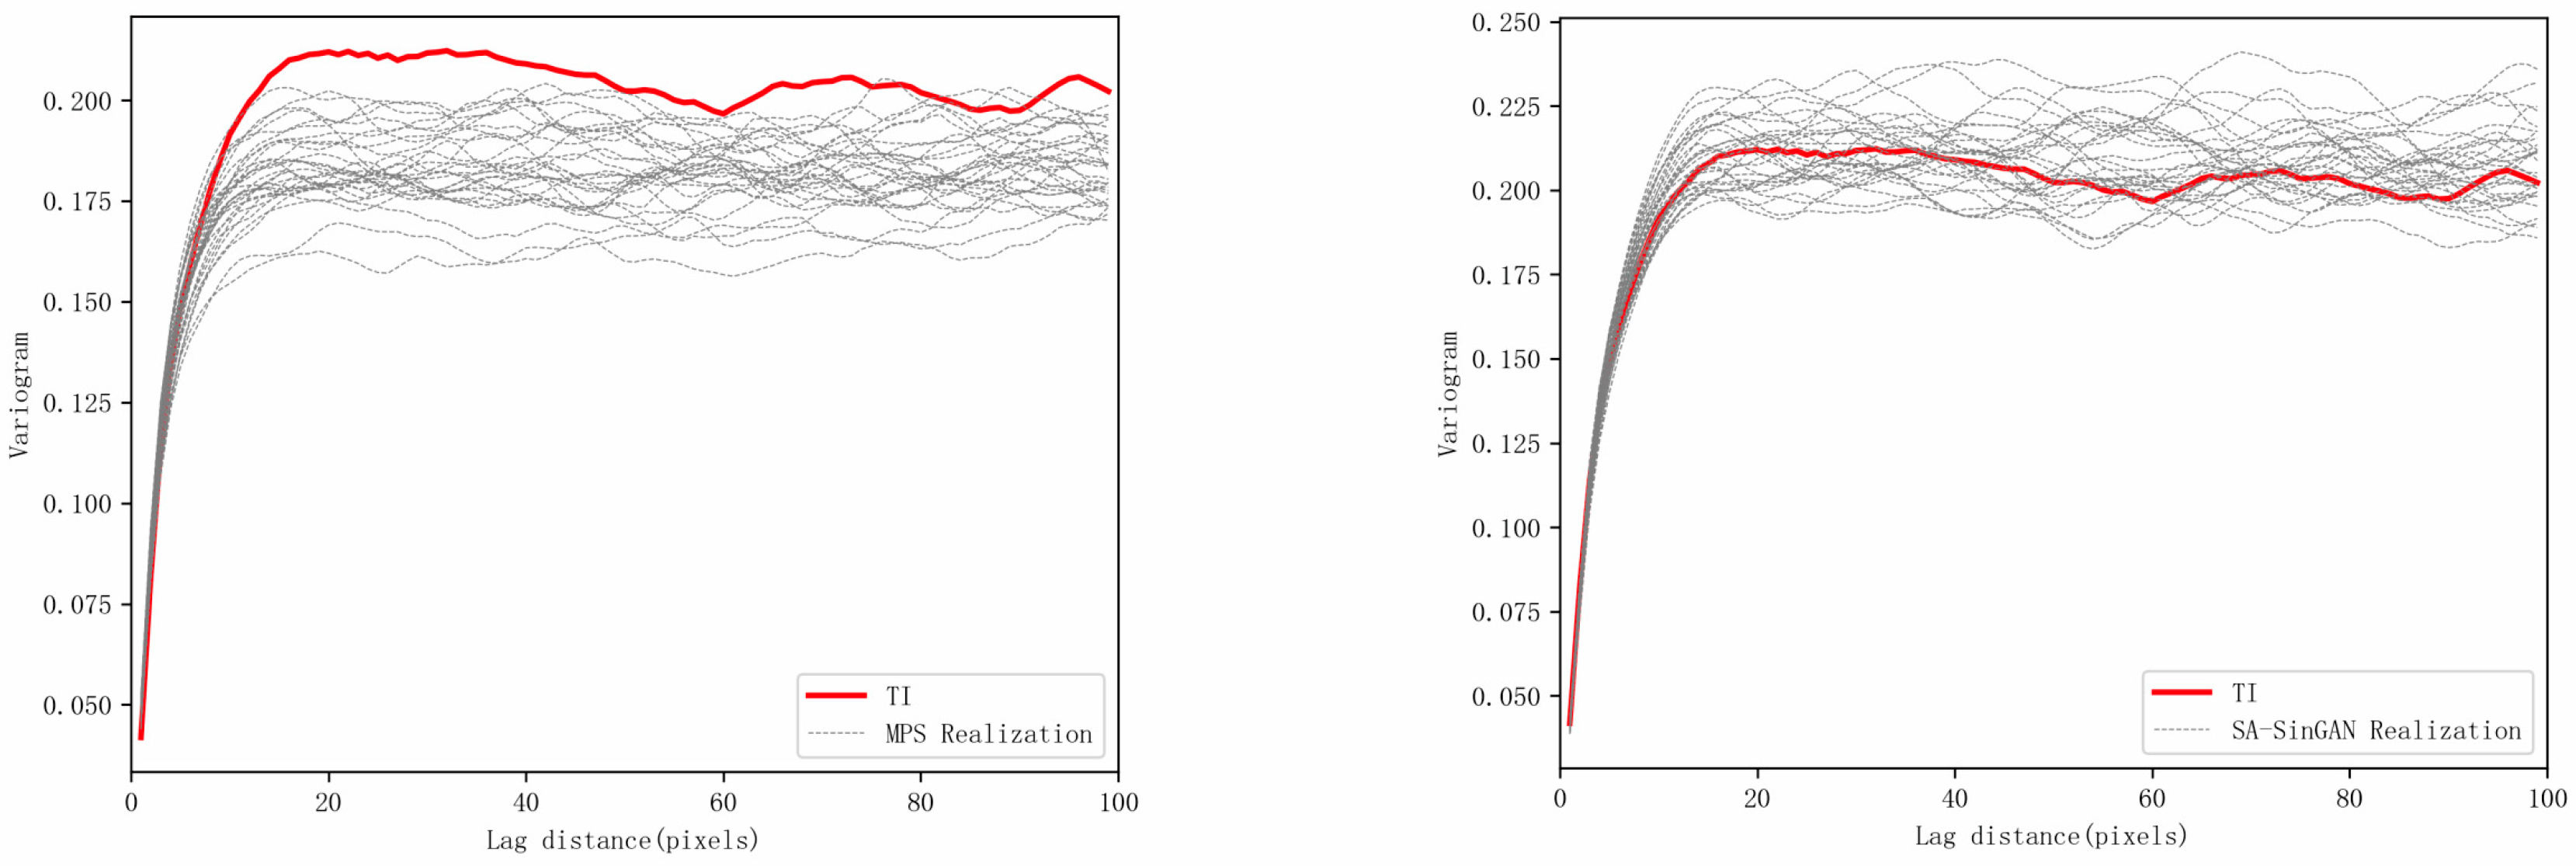
The variogram can be used to reflect spatial variations in the geological structure of reservoir models, where the range indicates the extent of spatial autocorrelation and continuity of the regional variable. Variograms were calculated for the training image and the geological models generated by the two methods (
Figure 11). The results show that the variogram of the SA-SinGAN generated model closely resembles that of the training image in shape. In contrast, the variogram values of the MPS generated model are generally lower than those of the training image, indicating a lower similarity in spatial structure.
The connectivity function represents the probability that two points within a given lag distance belong to the same connected body. Theoretically, a rapid decrease in connectivity at short lag distances indicates a complex geological structure with fewer connected bodies. In this study, the connectivity functions of the training image and the models generated by the two methods were calculated (
Figure 12). The results show that the connectivity trend of the SA-SinGAN generated models is generally consistent with that of the training image, indicating a structural resemblance and similar connectivity. In contrast, the MPS generated models fail to effectively reproduce this structural characteristic.
After comparing the geological models generated by the MPS and SA-SinGAN methods, a quantitative evaluation was performed using three metrics: the Fréchet Inception Distance (FID), the average NTG error, and the average connectivity error, based on thirty realizations produced by each method (
Table 3). Among these metrics, the FID was adopted to quantitatively assess the similarity between the generated geological models and the reference training image. It measures the statistical distance between feature distributions extracted by a pretrained Inception network from both real and generated samples. A lower FID value indicates that the generated data distribution is closer to that of the reference, thus representing higher realism and structural consistency. This metric has been widely applied in generative model evaluation and is particularly suitable for comparing the global structural and textural similarity of geological facies models.
To evaluate the generalizability of the SA-SinGAN model, training was performed on an edge-type channel geological model, generating multiple realizations.
Figure 13 shows the training image of the edge-type channel, with dimensions of 96 × 64 × 32, created using the target-based method.
Figure 14 presents the corresponding realizations generated by SA-SinGAN.
