Article

Research on Ultrasonic Guided Wave Damage Detection in Internally Corroded Pipes with Curved Random Surfaces

1
Key Laboratory of Building Collapse Mechanism and Disaster Prevention, China Earthquake Administration, Sanhe 065201, China
2
School of Civil Engineering, Institute of Disaster Prevention, Sanhe 065201, China
*
Author to whom correspondence should be addressed.
Appl. Sci. 2025, 15(23), 12372; https://doi.org/10.3390/app152312372
Submission received: 28 September 2025 / Revised: 8 November 2025 / Accepted: 19 November 2025 / Published: 21 November 2025
(This article belongs to the Section Applied Physics General)

Abstract

To accurately simulate the progression of pipeline corrosion, this paper proposes a three-dimensional corrosion modeling method for curved random surfaces based on spatial frequency composition. It applies this method to the inner surface of layered pipelines to emulate both the morphological characteristics and the evolution of internal corrosion. Combined with ultrasonic guided wave technology, the approach enables quantitative assessment of internal corrosion in layered pipelines. First, trigonometric series expansion and nonlinear polynomial superposition are used to characterize the roughness and curvature of the corroded surface, respectively, establishing a mathematical model capable of accurately representing complex corrosion morphologies. Next, a COMSOL–ABAQUS co-modeling approach is employed to build a finite element model of a three-layer composite pipeline consisting of a steel pipe, an insulating layer, and an anti-corrosion layer, with curved random-surface corrosion on the inner surface of the steel pipe. Finally, a wavelet packet decomposition algorithm is applied to extract features from the guided wave echo signals, creating a damage index matrix to correlate the corrosion area with the damage index quantitatively. The results show that the damage index increases steadily with the corrosion area, confirming the effectiveness of the proposed method. This study provides an alternative technical approach for high-fidelity modeling and precise assessment of pipeline corrosion detection.

1. Introduction

Pipeline transportation, as a key component of modern energy systems, holds vital strategic importance in conveying conventional energy media (e.g., oil, gas, hydrogen, methanol, liquid ammonia) and specialized substances (e.g., carbon dioxide and mineral slurries). Its advantages include environmental friendliness, high efficiency, and safety reliability [1]. However, corrosion during operation presents a serious threat to the long-term safety of pipelines. Studies have shown that the onset and spread of pipeline corrosion exhibit significant spatiotemporal randomness, mainly due to material heterogeneity, changing environmental conditions, and mechano-chemical interactions [2,3,4], which complicates corrosion detection and assessment. Based on field tests and statistical analysis, Beben et al. [5] reported that the backfill soil surrounding corrugated steel structures can exhibit resistivity as low as 30 Ω·m with alkaline pH values (8.1–9.3), indicating a high corrosion risk environment, particularly pronounced in road sections where de-icing salts are applied. These findings provide important references for understanding pipeline corrosion behavior in complex soil environments.
In the field of pipeline corrosion inspection, ultrasonic guided wave technology has emerged as a preferred method for long-distance pipeline health monitoring due to its unique capabilities for large-scale coverage, high efficiency, and global damage identification [6,7]. Through systematic investigation, Demma et al. [8] confirmed that a well-defined quantitative relationship exists between the reflection coefficient of guided waves in pipelines and defect dimensions, establishing a theoretical foundation for the quantitative assessment of corrosion defects. This technique has also been successfully applied in civil engineering contexts, particularly for corrosion monitoring in reinforced concrete structures, where research demonstrates that characteristic parameters such as the first wave peak of guided waves can effectively characterize the corrosion evolution process in steel reinforcement [9]. In recent years, advancements in guided wave tomography have further promoted the visualization and quantitative assessment of corrosion defects. For instance, Rao et al. [10] developed a guided wave tomography system based on full-waveform inversion, which utilizes a piezoelectric sensor array to achieve high-precision, online reconstruction of corrosion thickness in plate structures. The reconstruction results showed strong agreement with predictions from Faraday’s law and laser measurement values, confirming the effectiveness of this technology for quantitative corrosion monitoring. However, due to the typically random and non-Gaussian characteristics of actual pipeline corrosion morphology, the practical application of this technique still faces challenges such as multi-mode propagation, dispersion effects, and the diversity of corrosion morphology. These factors lead to complex time–frequency characteristics in the defect echo signals. To improve the accuracy of corrosion quantification, several innovative approaches have been developed. For instance, Fang et al. proposed a 3D point cloud segmentation method based on random spatial-frequency surface transformations for detecting corrosion defects in concrete drainage pipes [11], while Wang Xiaojuan et al. employed the W-M fractal function to construct random surface models that mimic realistic corrosion morphology, simulating defects of varying severity by adjusting fractal dimensions and scale factors [12]. Of particular note, Mu et al. [13] developed a numerical method capable of accurately simulating non-Gaussian characteristic surfaces by combining the Fast Fourier Transform with the Johnson transformation system, thereby providing a novel approach for the realistic modeling of corrosion morphology. These random surface modeling techniques provide a more realistic simulation of pipeline corrosion, serving as a critical foundation for ultrasonic guided wave inspection simulations [14]. Additionally, to address the limitations of traditional analytical methods in defect quantification, the wavelet packet decomposition algorithm—known for its multi-scale signal analysis capability—has been widely adopted to extract guided wave echo features, offering a new pathway for quantitative corrosion evaluation [15].
In the field of pipeline integrity assessment, both domestic and international standard systems (such as GB/T 6461, ISO 10289, and ASME B31.8S [16,17,18]) have established systematic corrosion grade evaluation systems. These standards explicitly require a quantitative rating based on the geometric dimensions of corrosion defects to provide a normative basis for repair decisions. The corrosion area investigated in this study falls within the 0.2–0.5% range, which is classified as Grade 7 corrosion according to the standards, necessitating inclusion in the monitoring plan but not immediate repair.
In recent years, with continuously increasing pipeline safety requirements, research focus has expanded from traditional inspection methods to the entire process of integrity management, particularly in areas such as emergency response, maintenance case analysis, and optimization of preventive measures. Studies have shown that establishing a comprehensive integrity management system can significantly reduce the incidence of pipeline incidents [19]. In terms of protection technology, industrial pipelines, especially buried or subsea pipelines, widely adopt a “pipe-in-pipe” composite structure comprising a steel pipe, a polyurethane insulation layer, and a high-density polyethylene outer jacket. This system synergistically achieves three major objectives: thermal insulation, corrosion protection, and long service life. However, composite coatings are susceptible to mechanical damage and aging degradation during service, and their damage mechanisms and effects on stress distribution have become a hotspot in modern research. Recent studies indicate that coating damage can significantly alter the stress concentration on the pipe surface, accelerating the local corrosion process. Moreover, in their study on the seismic performance of soil-steel composite bridges, Maleska and Beben [20] demonstrated that boundary conditions significantly influence structural dynamic responses. This conclusion provides valuable insights for investigating boundary effects in pipeline composite structures.
When pipelines face emergencies or risks such as medium leakage or operational interruption, existing corrosion detection and assessment methods exhibit significant shortcomings in emergency response. Current approaches primarily rely on the static analysis of corrosion morphology. They require obtaining geometric parameters of the defect area, followed by multi-parameter coupled modeling that incorporates material properties, structural characteristics, and operational conditions to predict the ultimate internal pressure and residual strength of the corroded pipeline. This technical route has the following limitations: the detection range is limited, making it difficult to achieve rapid screening of long-distance pipelines; the environmental requirements are stringent, often necessitating the removal of coatings or pipeline cleaning; the detection cycle is long, with high labor and equipment costs, making it difficult to respond promptly to sudden corrosion risks.
To address these challenges, a novel method was proposed based on spatial-frequency-composed random surface modeling with curvature parameters for high-fidelity parametric characterization of internal pipeline corrosion morphology. A finite element model of a three-layer composite pipeline (steel pipe, insulation layer, and anti-corrosion layer) was developed using a coupled COMSOL 6.2-ABAQUS 2022 commercial software framework. Wavelet packet decomposition was employed to extract guided wave echo signal features, construct a damage index matrix, and establish a quantitative relationship between corrosion area and the damage index. This study aims to develop a high-fidelity modeling and precise evaluation framework for internal corrosion detection in layered pipelines, contributing to enhanced pipeline operational safety.

2. Modeling Method for Random Surfaces with Curvature

A methodology centered on random surface segmentation incorporating curvature was formulated to address the problem of accurately characterizing and modeling internal corrosion damage in pipelines. This methodology facilitated the construction of a representative and accurate model of internal corrosion. For high-precision damage assessment, this corrosion model was subsequently incorporated with an ultrasonic guided wave detection technique. To resolve the challenge of representing the actual corrosion morphology during the data preprocessing phase, a rough surface model with curvature was developed. This was achieved by constructing a surface height function derived from a combination of spatial frequency resolution, a spectral index, and a stochastic function, which yielded a quantifiable parametric model for the ensuing internal corrosion analysis.

2.1. Surface Height Function

The proposed modeling method was based on a combination of spatial frequency resolution, random amplitude, and polynomial functions to characterize the surface roughness and spatial curvature of corrosion, respectively. This approach enabled the accurate characterization of corrosion surface data and the reconstruction of realistic curvature consistent with the pipeline. In principle, the innovation of this method was reflected in two complementary mathematical characterization strategies: First, a combination of trigonometric functions was constructed based on Fourier series expansion to characterize the multi-scale rough features of the corroded surface. Second, a second-order polynomial function was introduced to achieve nonlinear superposition, thereby accurately constructing the macroscopic curvature of the corrosion. This dual modeling mechanism, through the organic integration of frequency domain analysis and geometric modeling, achieved multi-scale, high-fidelity numerical reconstruction of rough surfaces containing curvature.
In terms of pipeline corrosion characterization, the method demonstrated significant advantages:
1. It applied to complex corrosion morphologies such as pitting, uniform corrosion, or a mixture of both.
2. Many corroded surfaces with realistic statistical properties could be rapidly generated by adjusting only a small number of parameters.
3. The generated surface data could be directly used for the validation of non-destructive testing methods, such as ultrasonic guided waves, in pipeline scenarios.
4. It was compatible with mainstream finite element software such as COMSOL and ABAQUS, facilitating direct import for structural integrity analysis.
This method provided an efficient and reliable technical means for characterizing pipeline corrosion morphology, accurately representing the object and carrier in pipeline corrosion detection.
The expression for the constructed three-dimensional rough geometric surface with curvature is given as follows:
Z x , y = A m = U U n = U U g m , n h m , n cos 2 π m x + n y + φ m , n + B x 2 + C y 2
In the formula, Z(x, y) represents the height fluctuation of the random surface, with units in meters. U represents the spatial frequency resolution, which was used to determine the level of detail of the random surface. A larger value of U provided more spatial cutoff points. x and y represent the positional coordinates on the surface, with units in meters. The variables m and n denote the spatial frequencies in the x and y directions, respectively, with units in meters. The parameter A was the scaling factor, which determined the overall height of the surface fluctuations. It is measured in meters and has a value range of 0.01 to 0.1. A schematic diagram of the scaling factor transformation is shown in Figure 1.
The function g(m,n) was a random function that followed a standard normal distribution, which was used to simulate the randomness of surface roughness. The properties of the standard normal distribution thus ensured that the randomly generated amplitudes possessed the self-similarity observed in natural patterns. The specific formula is given as follows:
g m , n = 2 π δ 1 δ 2 1 ρ 2 1 exp 1 2 1 ρ 2 m μ 1 2 δ 1 2 2 ρ m μ 1 n μ 2 δ 1 δ 2 + n μ 2 2 δ 2 2
In the formula, μ1 and δ1 represented the expectation and variance of m, respectively; μ2 and δ2 represented the expectation and variance of n, respectively. The symbol ρ denoted the correlation coefficient between mm and n, which satisfied −1 ≤ ρ ≤ 1. When ρ = 0, m and n were independent. When ρ > 0, a positive correlation was indicated (n tended to increase as m increased), whereas when ρ < 0, a negative correlation was indicated (n tended to decrease as m increased). In this study, the assumption that mm and n were independent was adopted.
The function h(m,n) was a frequency decay function used to simulate the attenuation of high-frequency roughness, given by the following formula:
h m , n = 1 ( m 2 + n 2 ) β 3
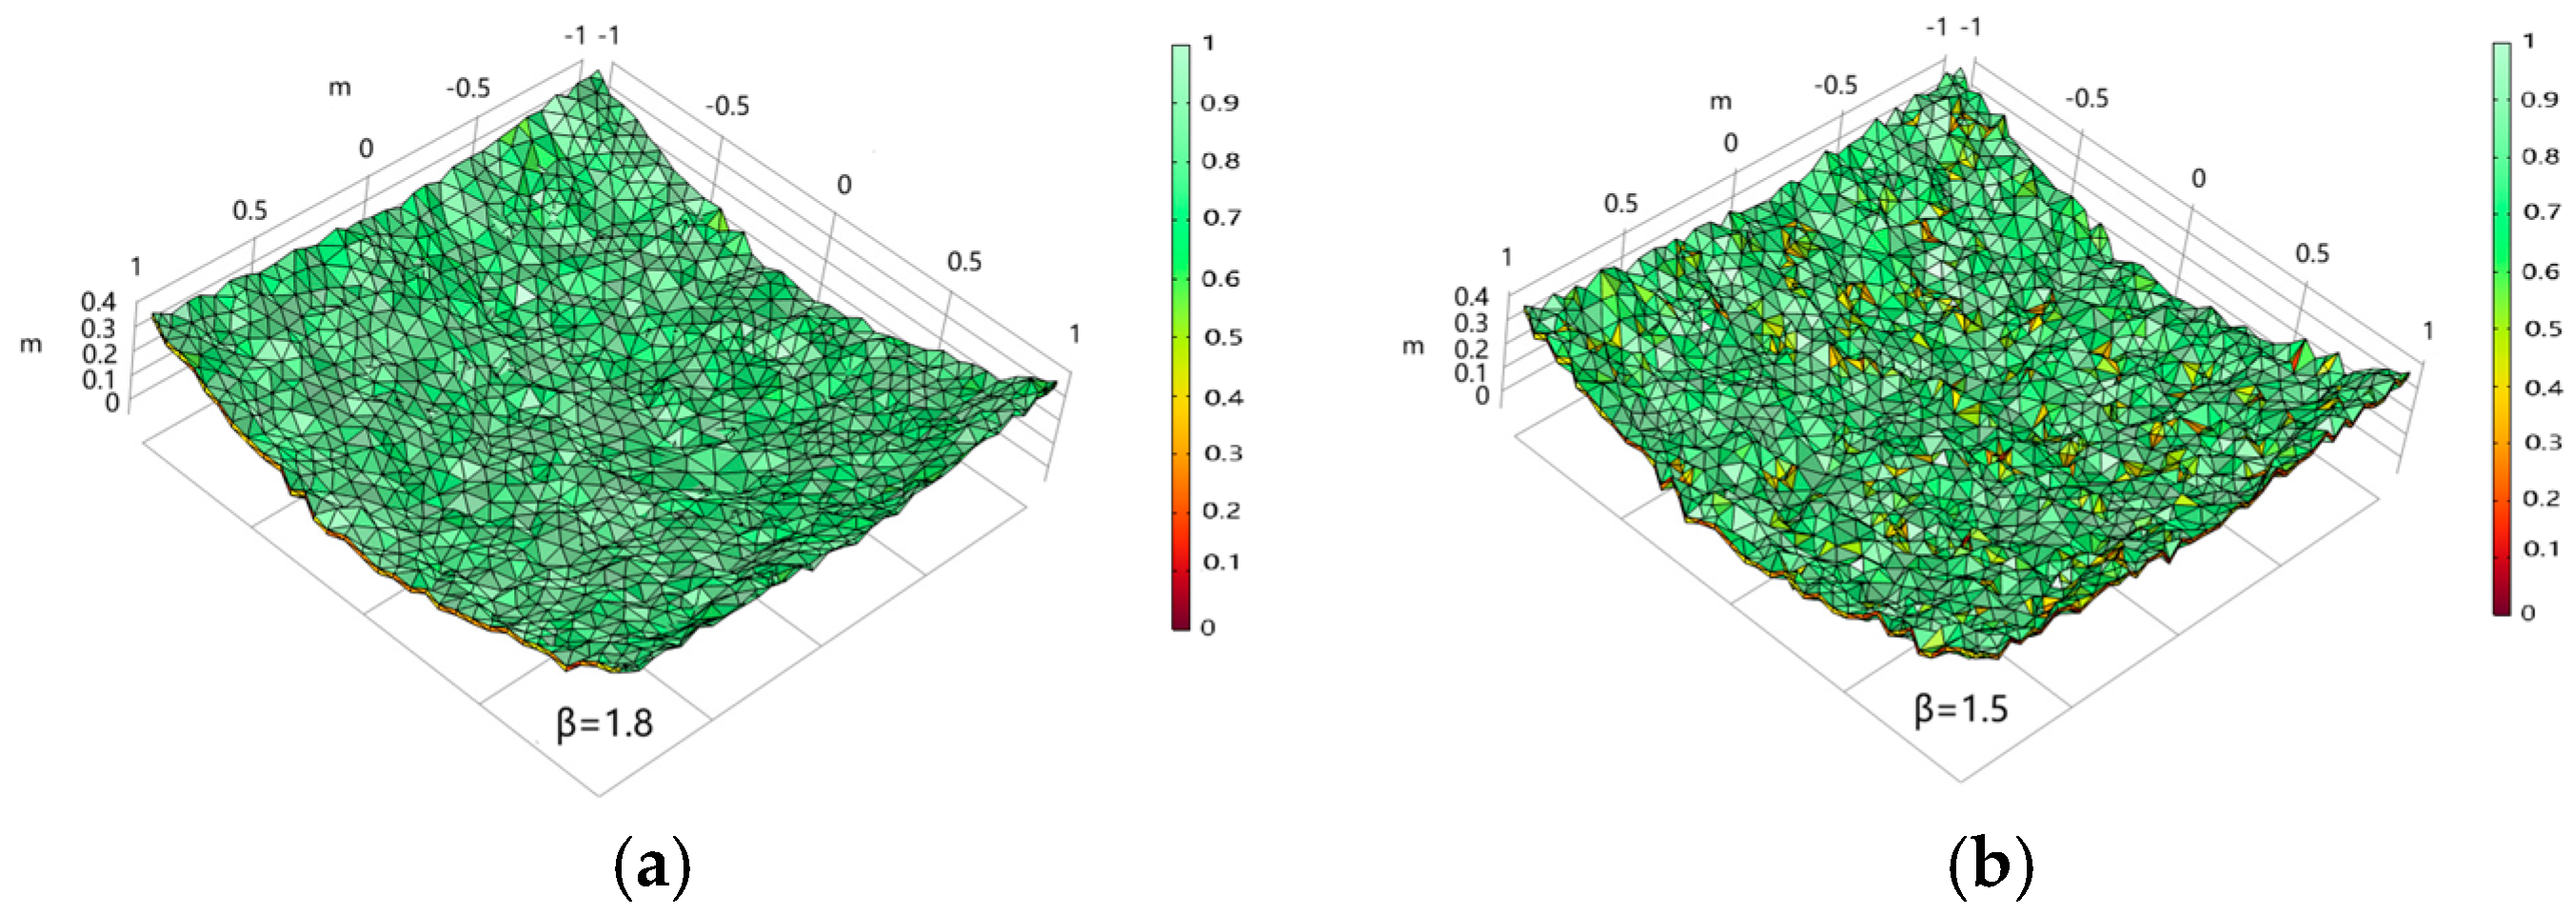
In the formula, β was the spectral index, which was used to control the decay rate of high-frequency roughness. A larger value of β resulted in a faster attenuation of high-frequency components, thus generating a smoother surface. Conversely, a smaller value of β preserved more high-frequency components, resulting in a rougher surface. The value of β was constrained within the range of 0.5 ≤ β ≤ 3.5. A schematic diagram illustrating the transformation of the spectral index is shown in Figure 2.
The phase angle φ(m,n) was represented by a random function that followed a uniform distribution over the interval [−π,π], as given by the following formula:
φ m , n = 1 2 π 2 , π < m < π , π < n < π 0 ,                     else                                    
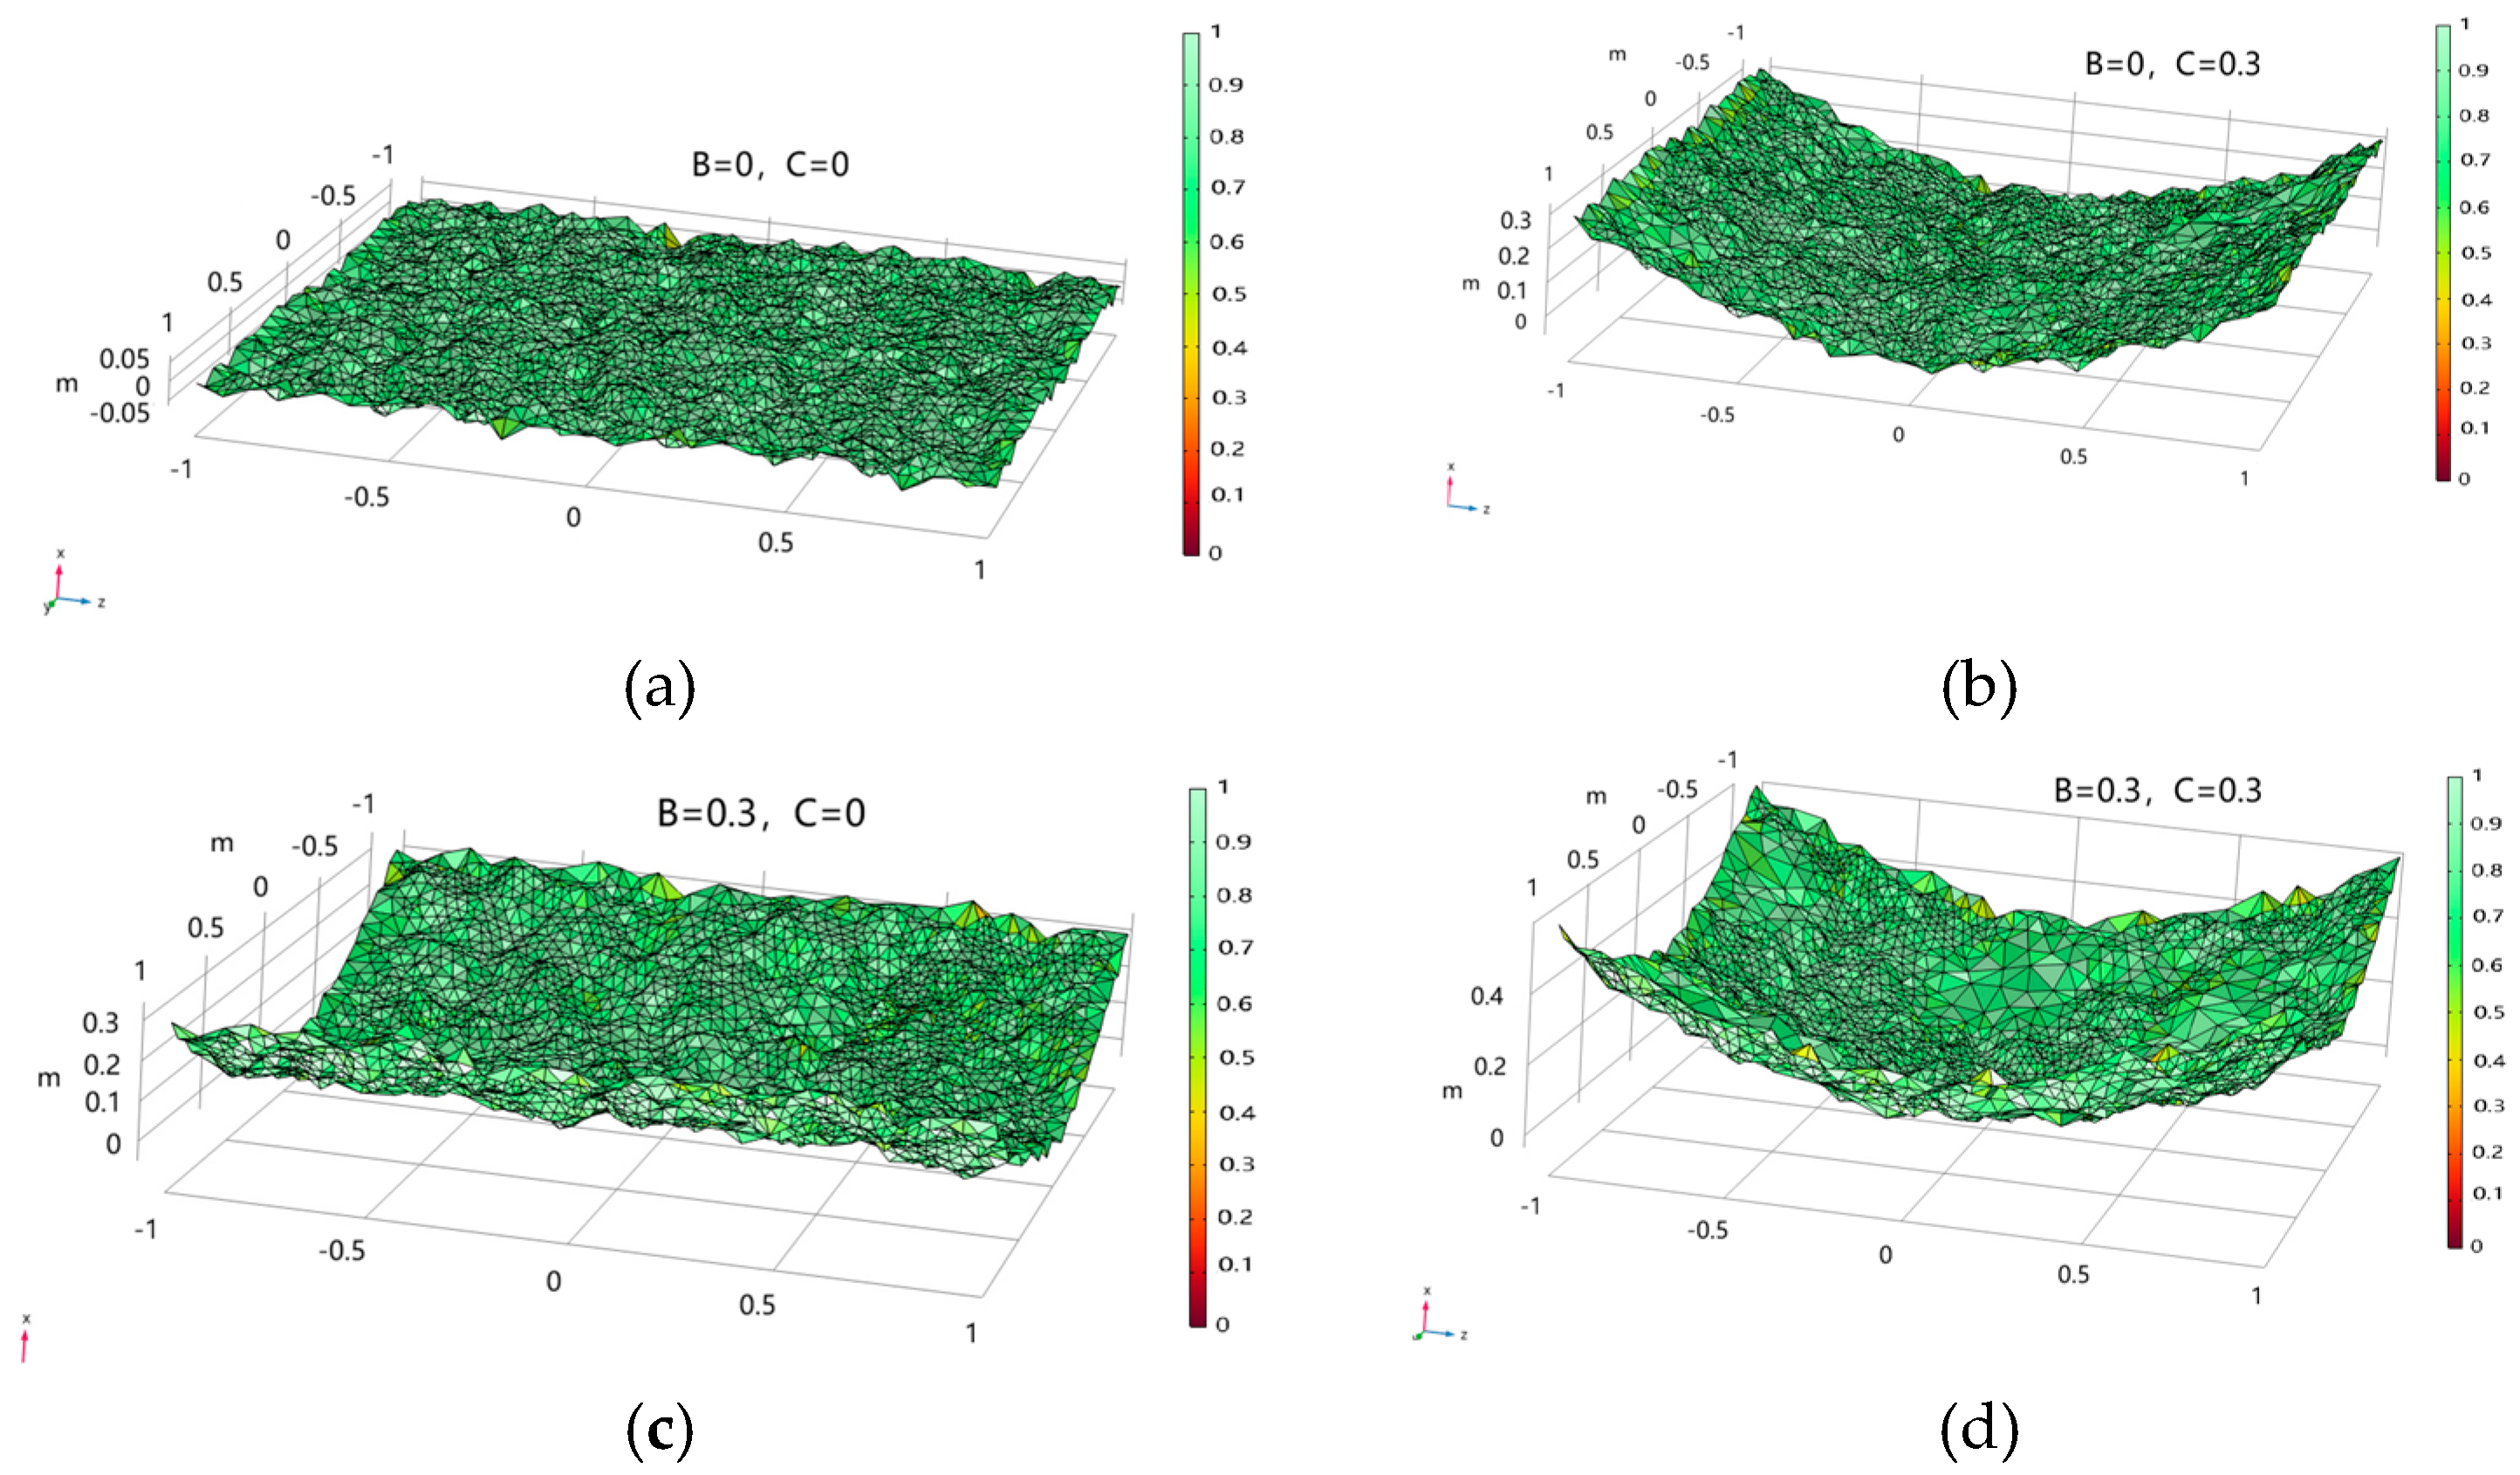
The global curvature characteristics of the random surface were described by the second-order polynomial function Bx2 + Cy2, where B and C were the global curvature control parameters, representing the curvature emphasis factors in the x and y directions, respectively; these were also referred to as curvature factors, with units of 1/m. Variation in the value of B primarily affected the curvature characteristics along the x-axis, while variation in the value of C primarily influenced those along the y-axis. The index 2 in the quadratic terms was used to describe the non-linear curvature characteristics of the surface variation. The surface morphology under different combinations of parameters B and C is schematically illustrated in Figure 3, which clearly presents the characteristics of the macroscopic surface curvature for various curvature factor combinations.

2.2. Root Mean Square Roughness, Sq

Based on the requirement for quantitative characterization of surface morphology, this paper adopts the root mean square roughness, Sq, after mean removal as the evaluation index for surface roughness. This metric eliminates the average height of the surface, and its mathematical expression is defined as:
S q = 1 M · N i = 1 M j = 1 N Z x i , y i 1 M · N i = 1 M j = 1 N Z x i , y i 2
Here, Sq is the average value of all points on the entire surface. M and N represent the number of sampling points in the x and y directions, respectively, which in this study is set to 200. Z(xi, yi) is the height value at the surface point (xᵢ, yⱼ).
Under the condition of keeping parameters U, A, B, and C unchanged, the values of the scaling factor A and the spectral exponent β are proportionally increased. The root mean square roughness, Sq, is then calculated, and the min-max normalization method is applied to map the original data to the interval [0, 1]. The calculation formula is as follows:
X n o r m = X X m i n X m a x X m i n
where X is the original value, and Xmin and Xmax are the minimum and maximum values within the data column, respectively.
The resulting root mean square roughness, Sq, and the normalized Sq are presented in Table 1.
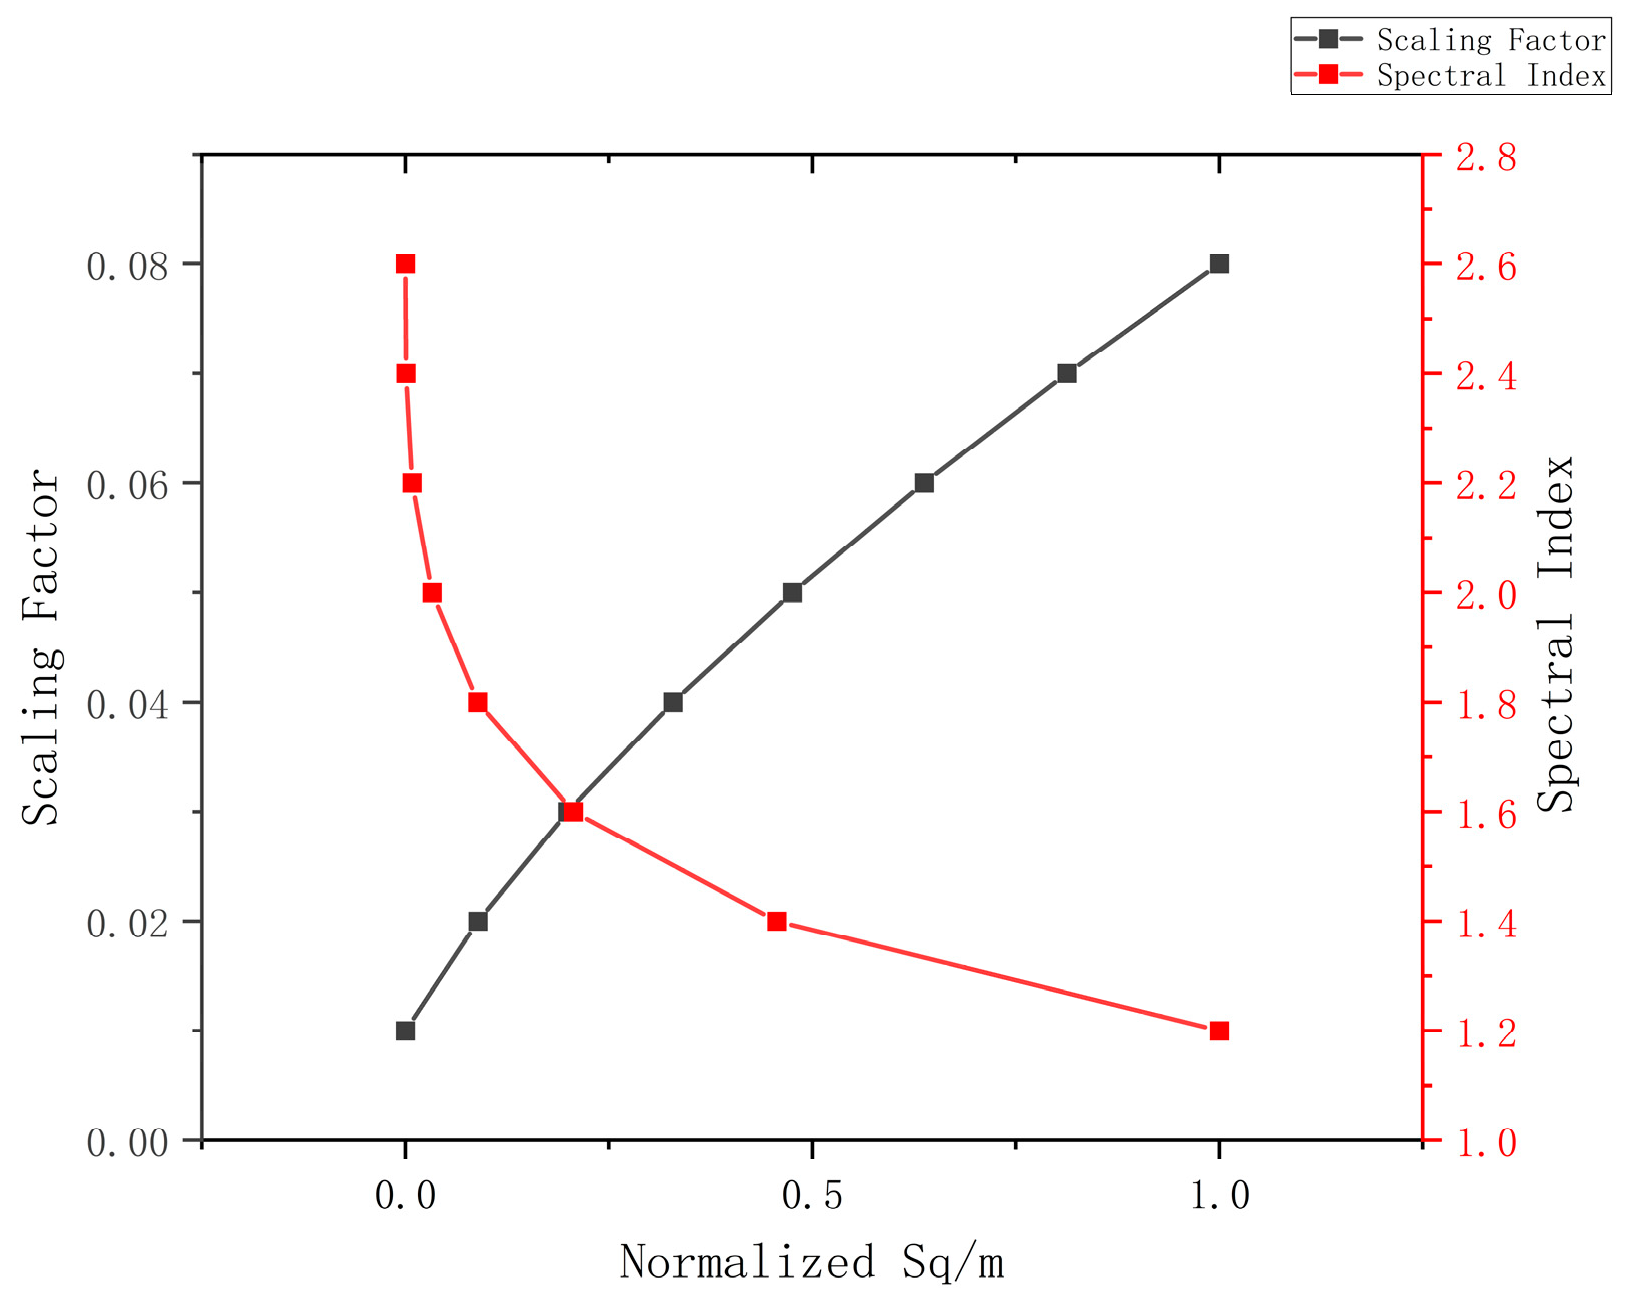
The results indicated that the root mean square roughness, Sq, increased with the scaling factor (approaching a linear trend). This means that as the scaling factor increases, the wave height increases, leading to a greater roughness of the random surface. In contrast, Sq decreases with an increase in the spectral exponent (exhibiting an inverse proportional relationship). This is because a smaller spectral exponent retains high-frequency components, which increases the roughness of the random surface. After normalization, the resulting roughness curves are shown in Figure 4, which clearly demonstrates a near-linear increasing trend for the scaling factor and a non-linear decreasing characteristic for the spectral index.

3. Finite Element Model of Layered Pipelines with Internal Corrosion

3.1. Detection Method Based on Ultrasonic Guided Waves

In the application of advanced non-destructive testing techniques, the ultrasonic guided wave testing method has demonstrated significant advantages due to its unique wave-defect interaction mechanism. When ultrasonic guided waves were employed to inspect internal corrosion defects in pipelines, the obtained reflected signals contained rich defect characteristic information, which could be categorized into two dimensions: time-domain features (such as the arrival time and amplitude of reflected waves) and frequency-domain features (such as spectral components and mode conversion characteristics). Through the analysis of these multi-dimensional signal features, qualitative identification and quantitative assessment of corrosion defects could be achieved [21].
From the perspective of wave theory, the interaction process between guided waves and pipeline defects exhibits complex multi-mode conversion phenomena. When an incident single guided wave mode (e.g., the L(0,2) mode) interacts with a defect, its energy is redistributed, exciting multiple characteristic modes. This mode conversion process possesses two important feature correlations: on one hand, the energy distribution ratio of the newly generated modes has a clear correspondence with the geometric morphology of the defect; on the other hand, the total energy level of the converted modes shows a significant correlation with the dimensional parameters of the defect [22]. These characteristic relationships provide a theoretical foundation for establishing a quantitative evaluation model for corrosion defects based on multi-modal signal analysis.

3.2. Characteristics of Corrosion Morphology Inside Pipelines

The formation of internal pipeline corrosion morphology is a complex process involving multi-physics field coupling, with its characteristics primarily influenced by the corrosion mechanism, hydrodynamic properties, and material microstructure. Depending on the corrosive medium, internal pipeline corrosion can be classified into typical types such as H2S corrosion, CO2 corrosion, and SO2 corrosion [23]. Although the corrosion mechanisms differ, the morphology generally exhibits two macroscopic characteristics: progressive material loss and non-uniform wall thinning [24].
Due to the spatial heterogeneity of the electrochemical corrosion process, the internal pipeline surface often displays pitted depressions (pitting corrosion), sheet-like thinning (uniform corrosion), or a mixed morphology where both coexist. Pitting pits typically vary in depth and are randomly distributed, whereas uniform corrosion leads to an overall reduction in wall thickness but an increase in surface roughness [25]. Furthermore, under the coupled effects of fluid erosion and stress concentration, the corrosion morphology may also exhibit directional grooves, ulcer-like bulges (e.g., due to microbial corrosion), and other characteristic features [26].
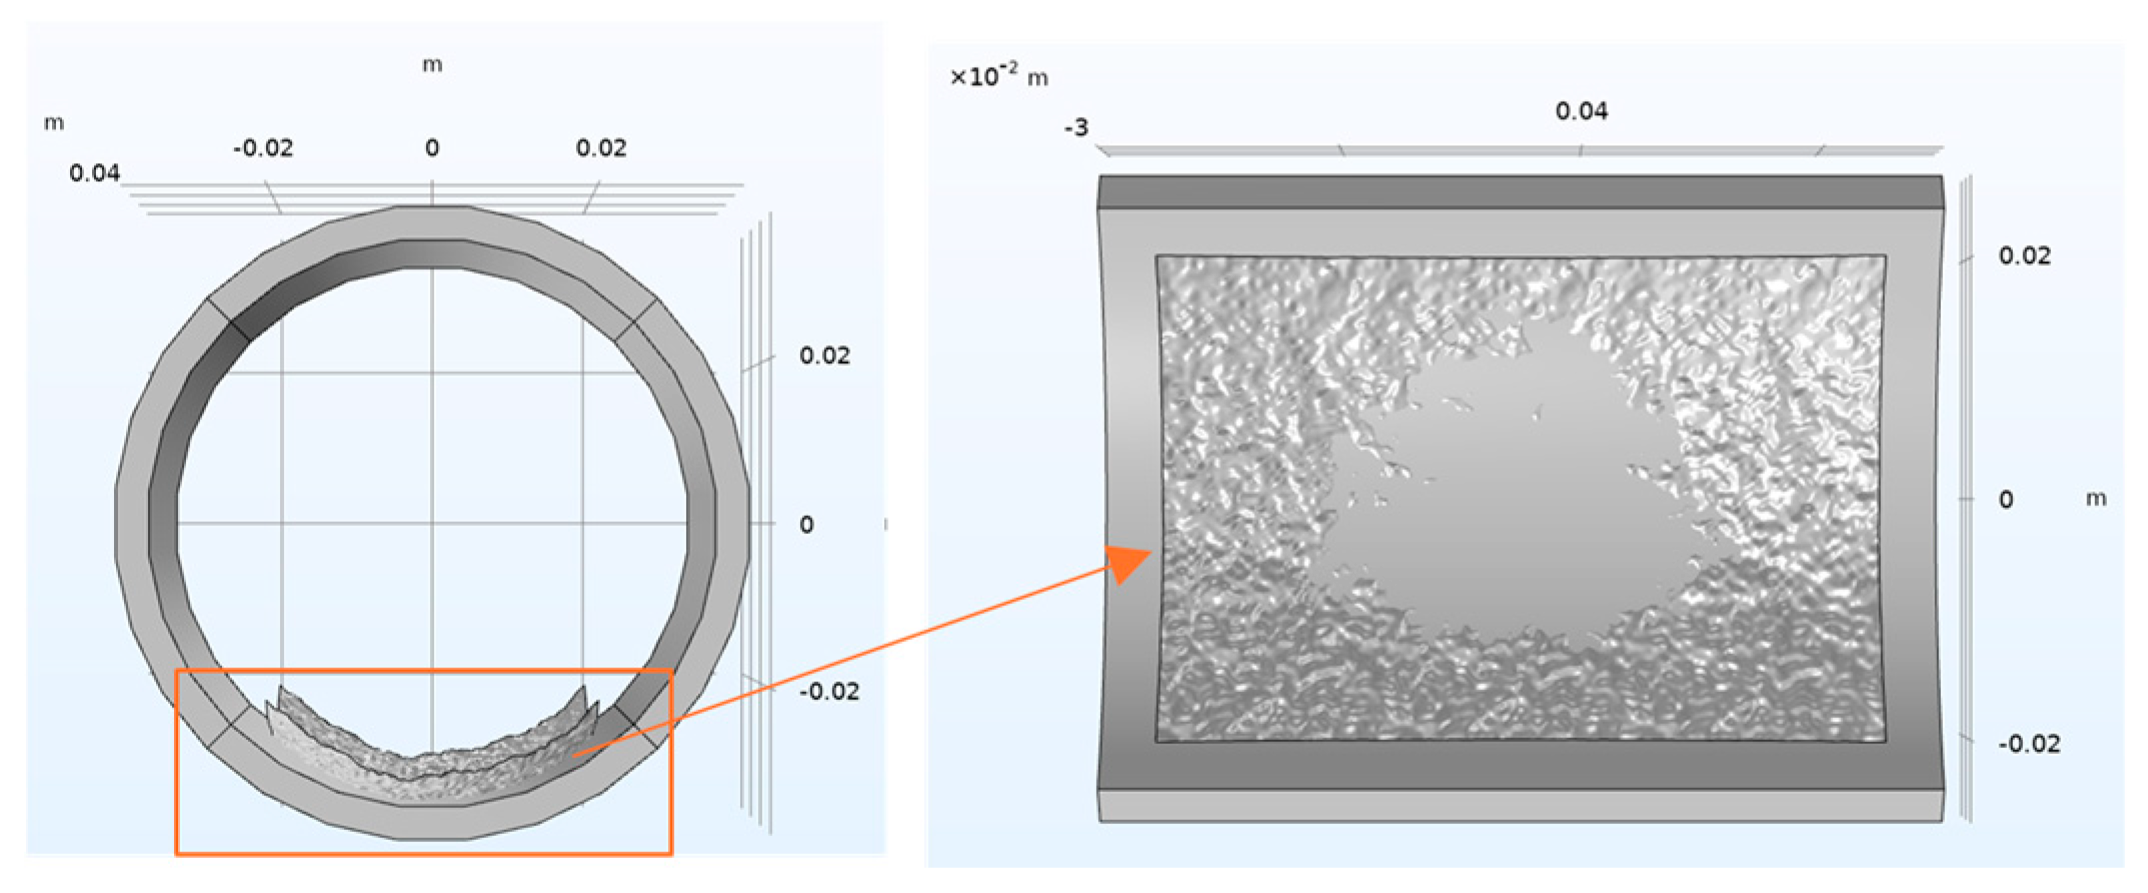
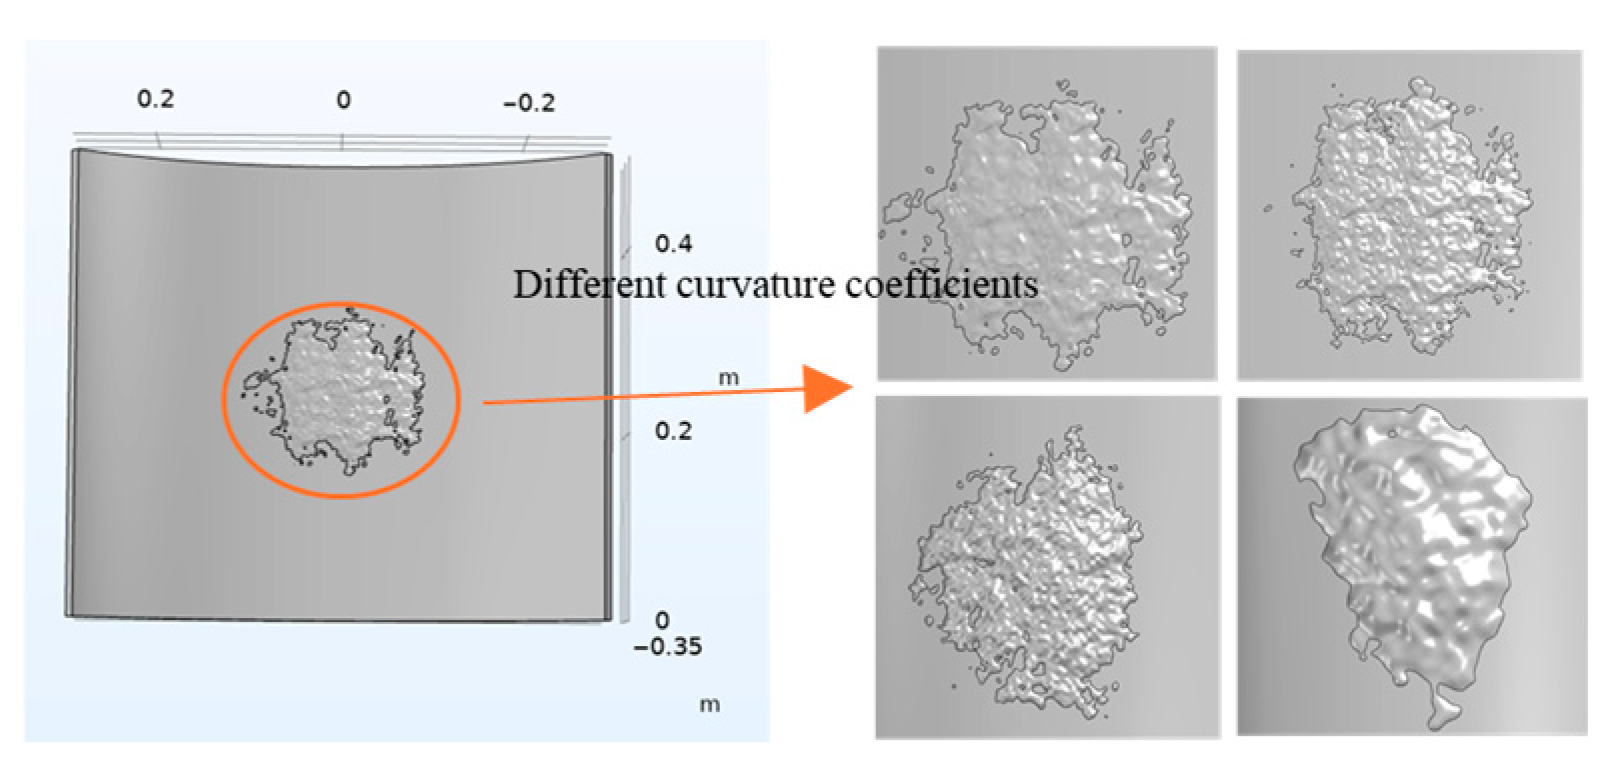
Within the COMSOL simulation platform, a parametric surface method can be utilized to establish a random rough surface model. By employing domain segmentation techniques, the random surface can be flexibly constructed on different geometric substrates such as hexahedra, cones, or spheres. In this study, the random surface was segmented onto the internal pipeline surface to form the internal corrosion morphology. Different curvature factors were adjusted to generate varied random surfaces for segmentation with the pipeline’s inner wall. Figure 5 demonstrates the application of this method, showing the generated surface conformally mapped onto the pipeline’s internal wall.
Based on the adjustable geometric parameters of the pipeline, a method for generating random surfaces was developed. Through optimization of the curvature factors, matching with the pipeline’s inner wall was achieved, thereby enabling the construction of a high-fidelity internal corrosion morphology model, as illustrated in Figure 6. It is noteworthy that when all other parameters remained unchanged, consistency in the stochastically generated surfaces across multiple iterations was ensured by setting a fixed seed for the Gaussian random function.

3.3. Application of the Combined Modeling Method of COMSOL and ABAQUS

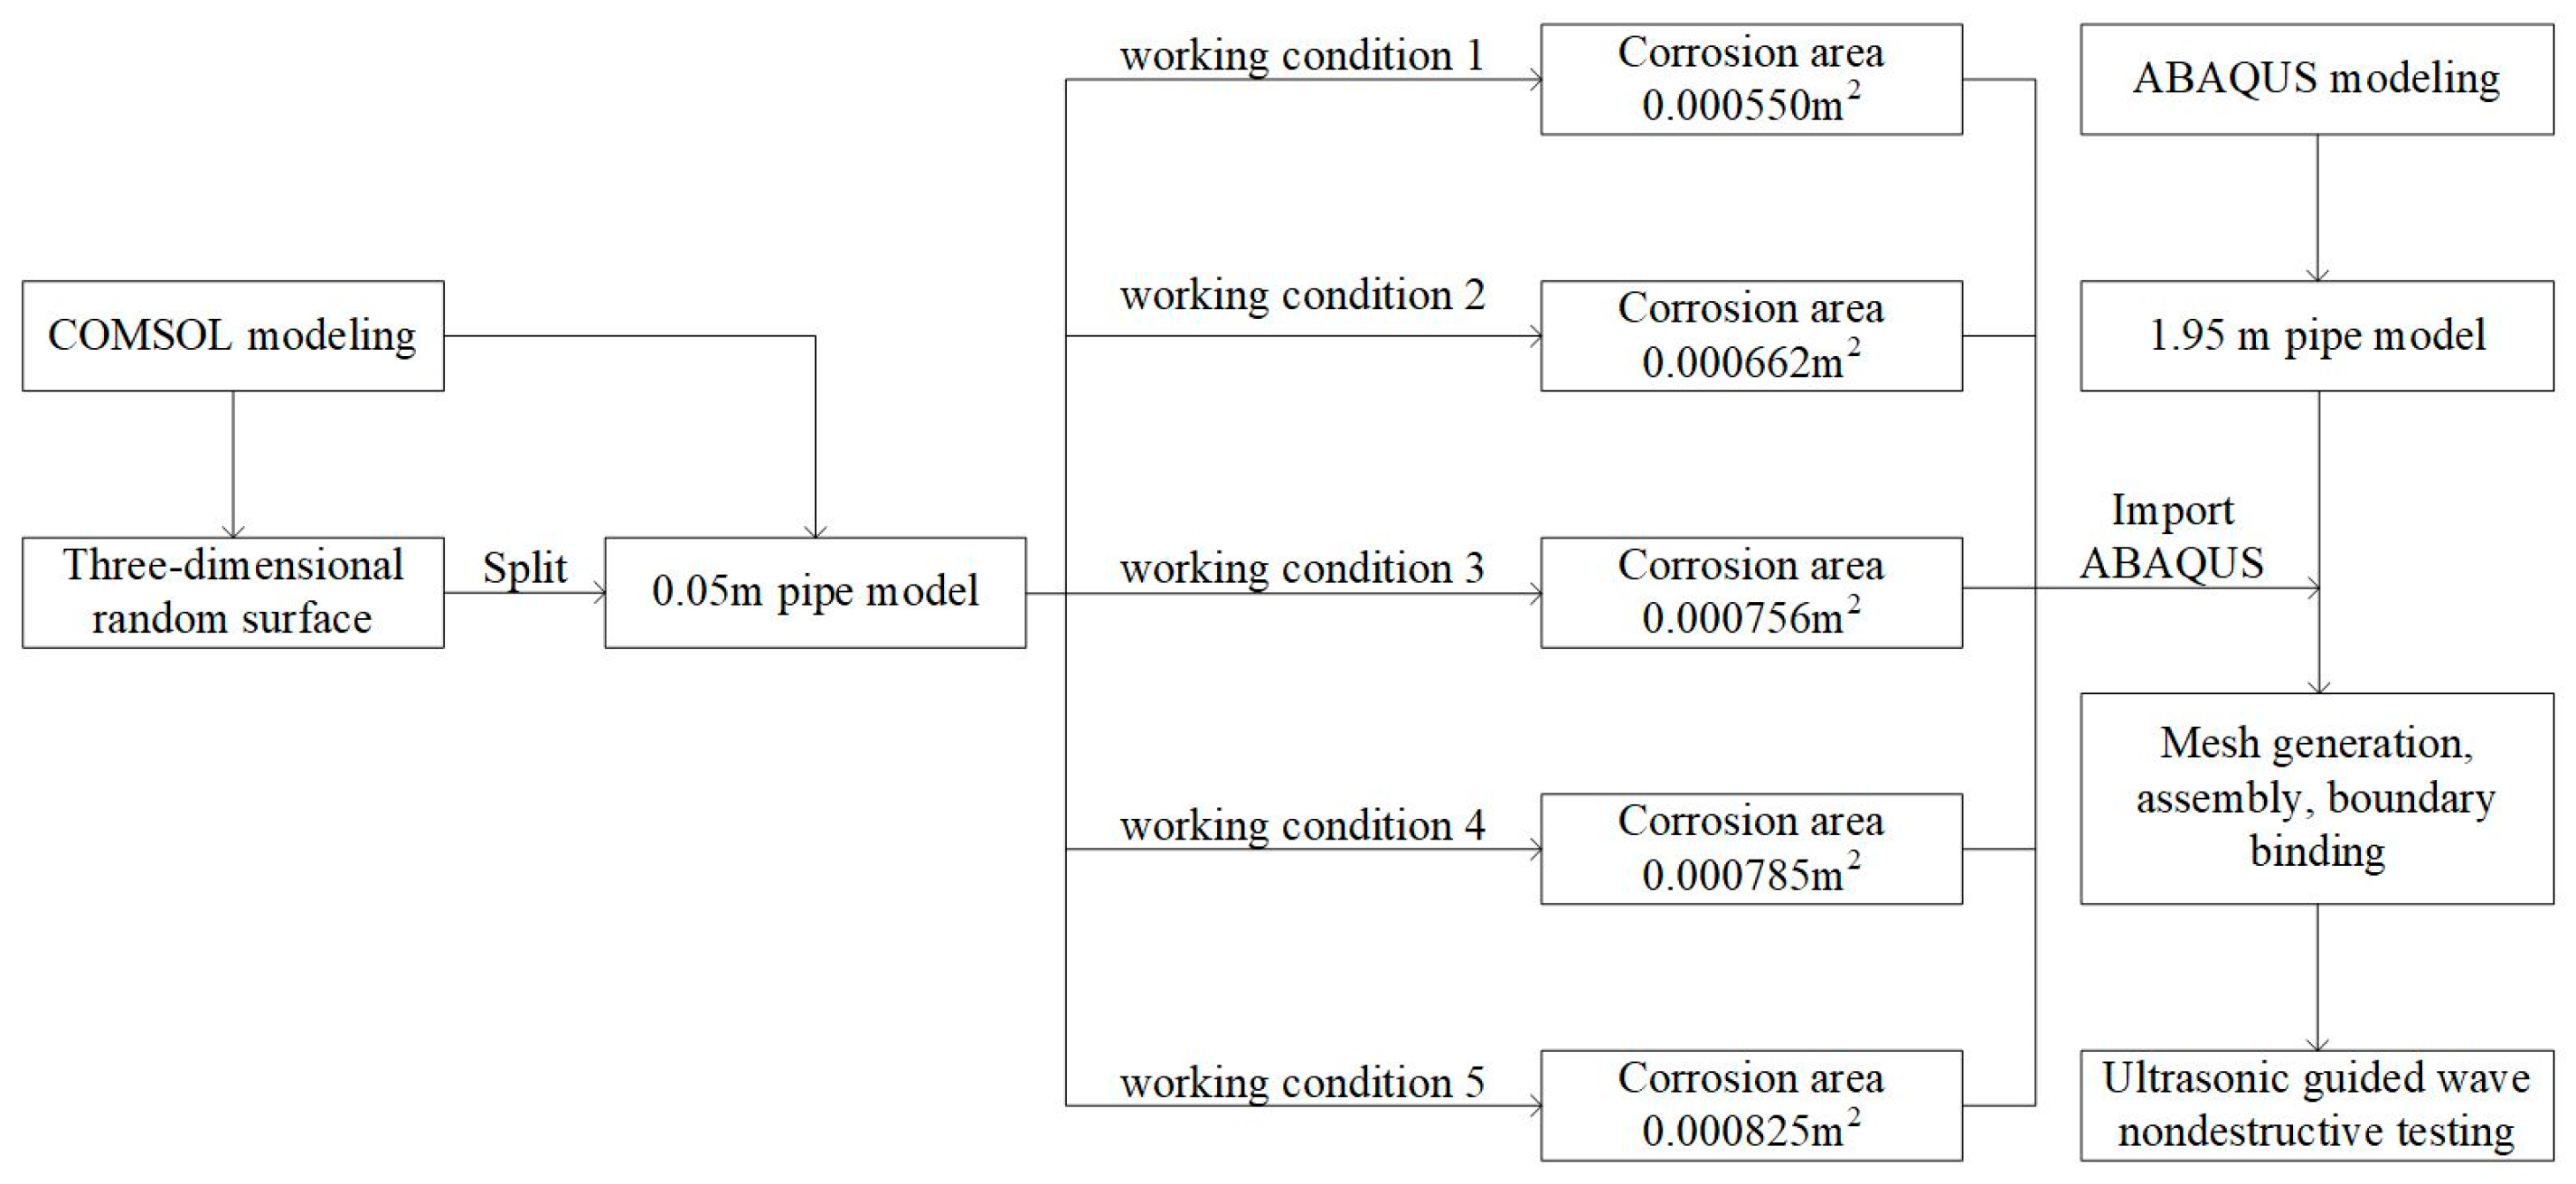
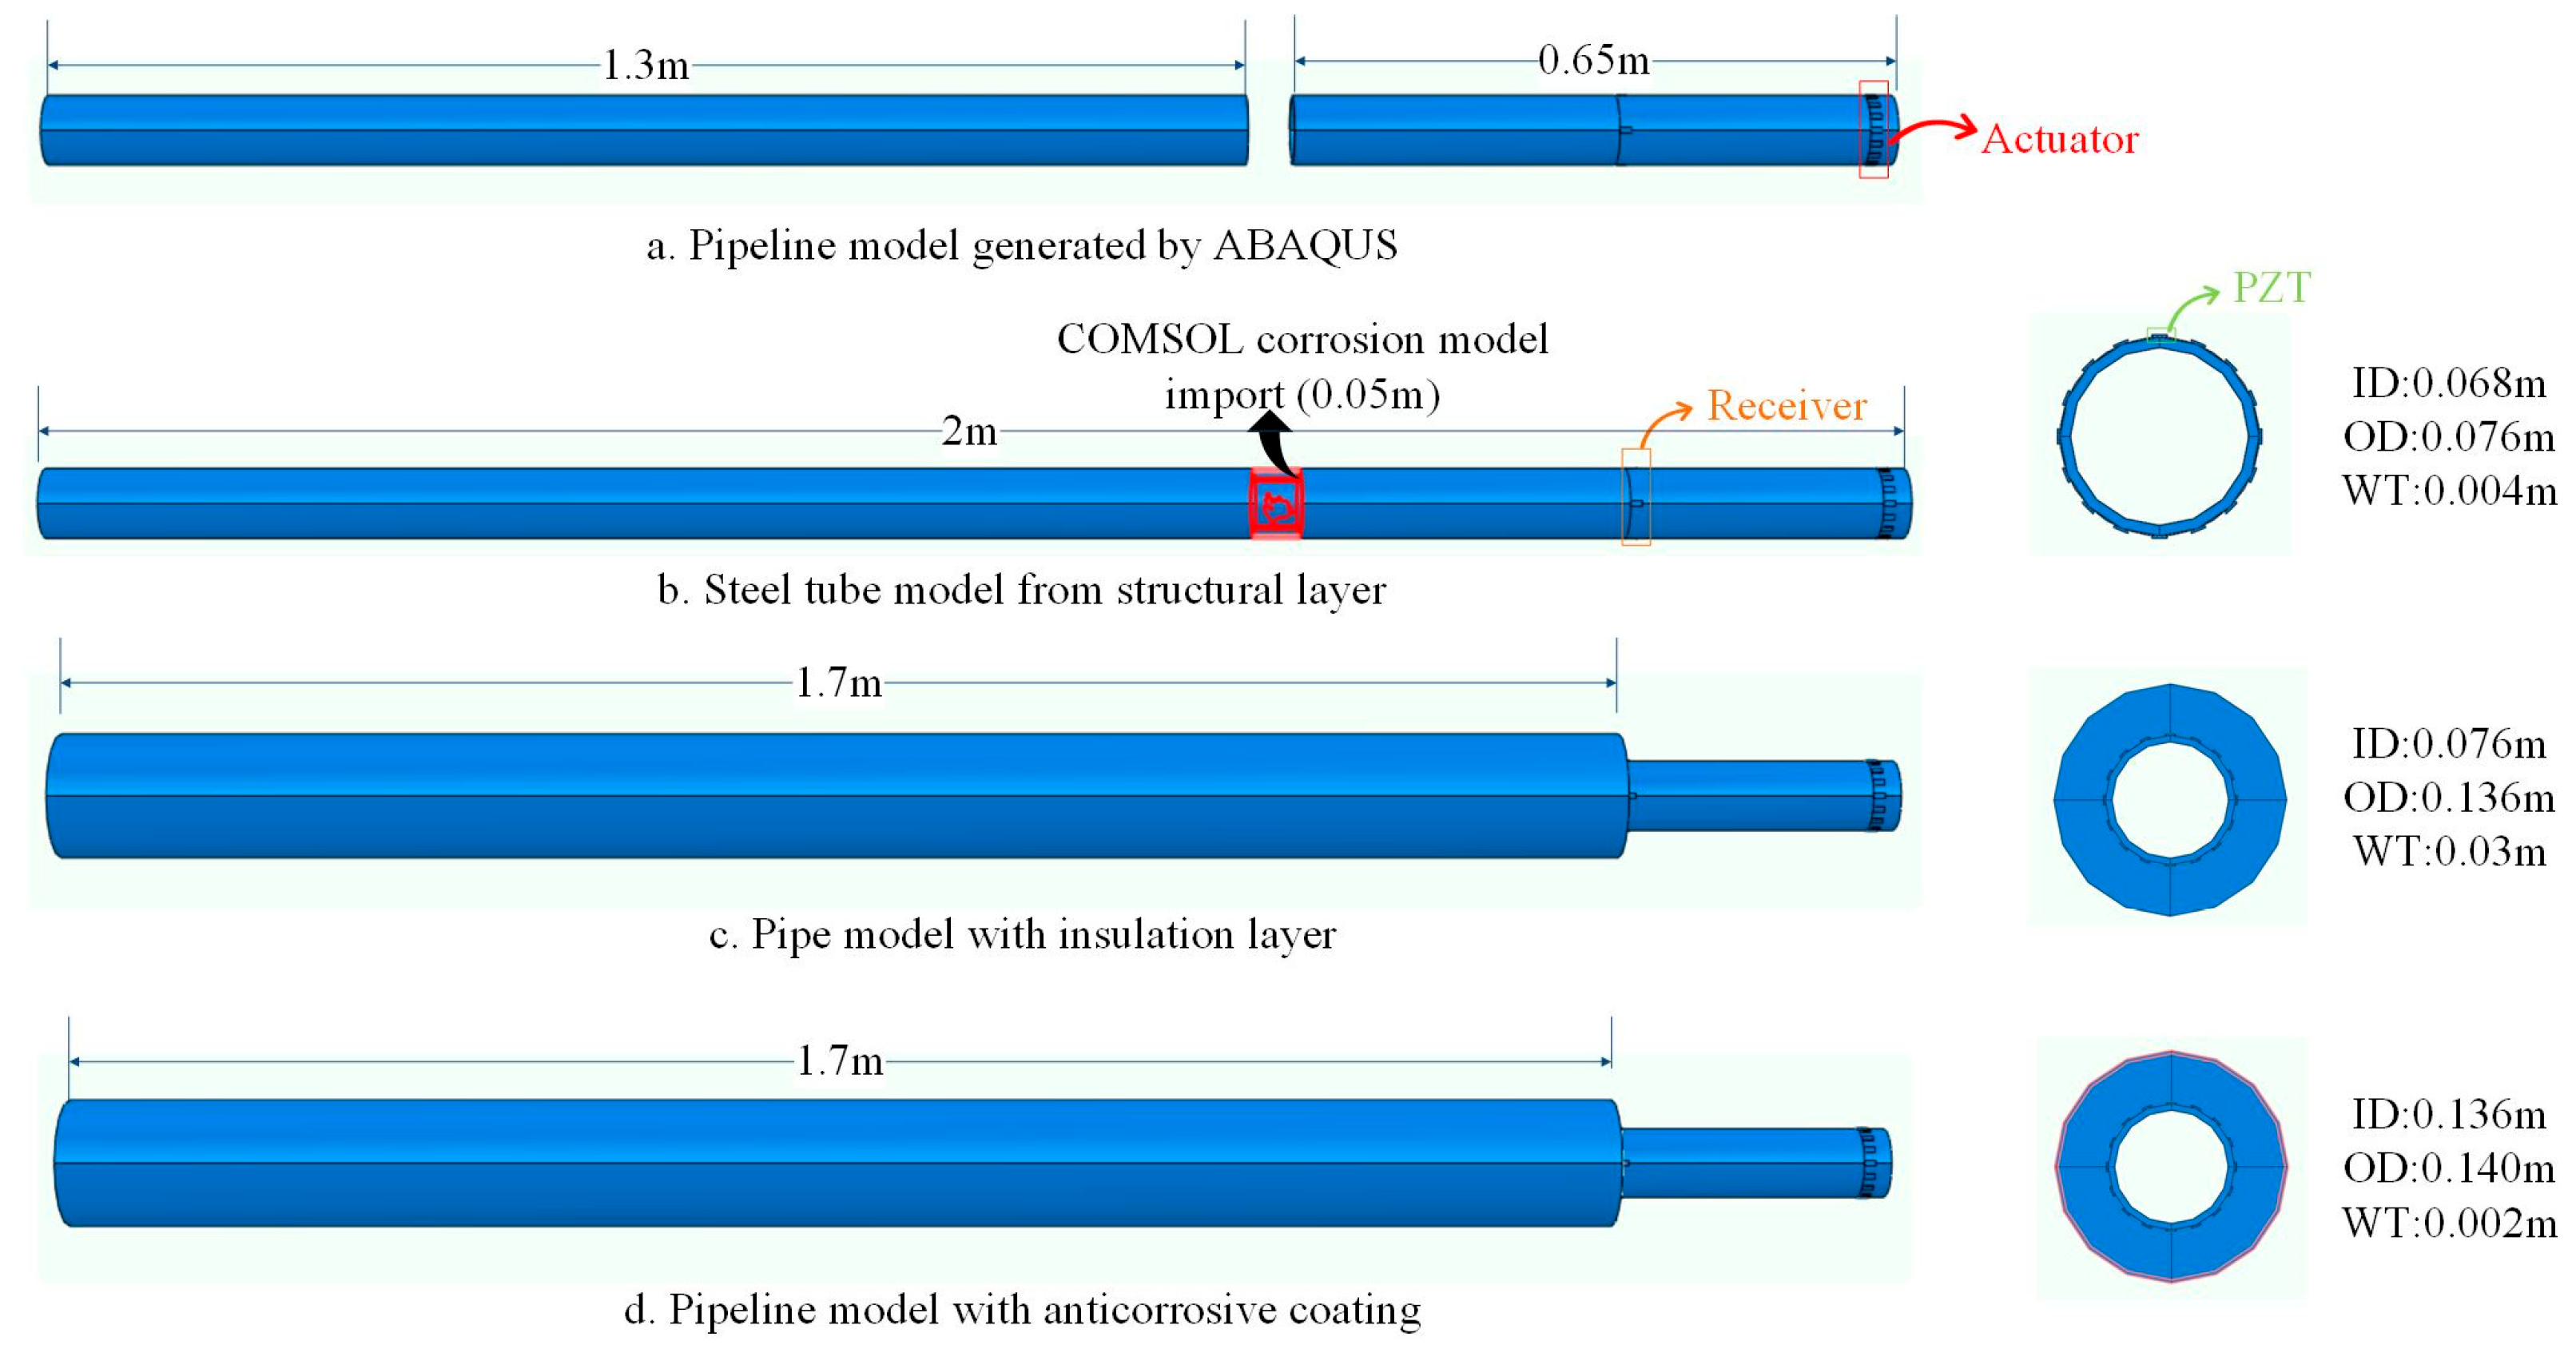
In this study, the COMSOL simulation platform was employed to establish a pipeline geometric model containing internal corrosion defects, and the model was subsequently imported into the ABAQUS software for subsequent finite element analysis. The specific procedure included: first, a finite element model of a layered pipeline with a 0.05 m axial gap in the middle was created in ABAQUS, incorporating actuator and receiver elements. Then, a corresponding 0.05 m pipeline model was developed using the COMSOL simulation platform and imported into ABAQUS to complete mesh generation for the corrosion region, assembly of the pipeline system, and application of boundary conditions, thereby constructing a complete finite element model of internal corrosion defects in a layered pipeline. This modeling approach enabled accurate characterization of corrosion morphology features, providing a reliable foundation for subsequent detection of corrosion echoes using ultrasonic guided waves in corroded pipelines. The detailed workflow for the steel pipe (structural layer) is illustrated in Figure 7.

3.3.1. Establish a Finite Element Model for Internal Corrosion of Random Surfaces with Curvature

In this study, the COMSOL simulation platform was employed to establish the geometric model of internal pipeline corrosion morphology. The modeling procedure for the corrosion morphology was consistent with the description in Section 2.2. By adjusting the curvature factors, an internally corroded pipeline surface morphology with engineering authenticity was generated. Based on this method, a series of finite element models for internal pipeline corrosion was developed, specifically including five 0.05 m-long pipeline finite element models with different corrosion areas. The relevant geometric data are presented in Table 2.
Figure 8 illustrates the three-dimensional morphological characteristics of the corresponding internal pipeline corrosion defects, clearly demonstrating the variation in corrosion area under the control of different factors, along with their corresponding surface morphological differences.

3.3.2. Establish a Finite Element Model of Layered Pipelines and Piezoelectric Elements

To simplify the computational model, idealized treatments were applied to both the material constitutive relations and the sensor coupling conditions:
First, the pipe material was assumed to be purely elastic, neglecting its mechanical behavior in the plastic stage. While this assumption is reasonable within the scope of elastic analysis for guided wave propagation, its capability to accurately simulate wave propagation and energy attenuation may be limited in regions with corrosion where plastic deformation has already occurred.
Second, an idealized “tie” constraint was used to bond the ceramic piezoelectric patch to the pipe surface, simulating a perfect coupling condition with zero thickness and no signal loss. However, in practical inspections, an adhesive layer (such as epoxy resin) is typically present between the sensor and the pipe, which introduces effects like signal amplitude attenuation and central frequency shift. Consequently, the echo signals obtained from the simulation may appear more favorable than those measured in actual experiments.
The finite element model of the layered pipeline established in this study adopted a three-layer composite structure, which consisted, from the inside to the outside, of a steel pipe (structural layer), rigid polyurethane foam (insulation layer), and high-density polyethylene (anti-corrosion layer). The mechanical property parameters for each layer material are detailed in Table 3. During the model construction process, the steel pipe structural layer was divided into two segments with lengths of 0.65 m and 1.3 m, respectively. A 0.05 m gap was reserved between the two segments to embed the corrosion defect model generated by COMSOL.
The table shows the material properties, including inner diameter, outer diameter, wall thickness, density, elastic modulus, Poisson’s ratio, and pipe length.
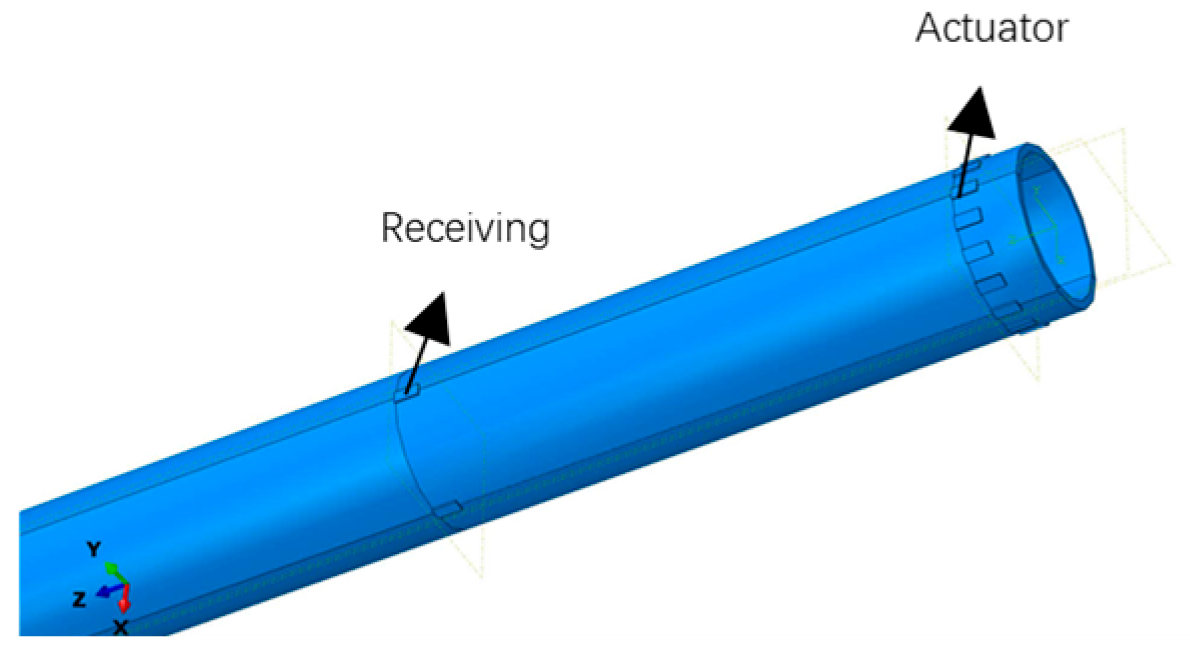
Piezoelectric elements were assembled on the surface of the steel pipe (structural layer) to form the actuator and receiver. The material used for these piezoelectric elements was piezoelectric ceramic PZT-5A, which exhibits excellent piezoelectric properties. The specific dimensions of each piezoelectric element were 0.012 m × 0.006 m × 0.001 m. To effectively excite the desired L-mode guided waves while suppressing the generation of T-mode and F-mode guided waves during the simulation, 16 piezoelectric elements were selected to constitute the actuator. Additionally, the receiver consisted of 4 piezoelectric elements. The center-symmetric coupling design of the actuator was located 0.03 m from the near end of the steel pipe (structural layer) wall, while the coupling position of the receiver was set at 0.3 m from the near end of the steel pipe (structural layer) wall. The specific arrangement of the piezoelectric elements on the outer wall of the steel pipe (structural layer) in the layered pipeline is shown in Figure 9.
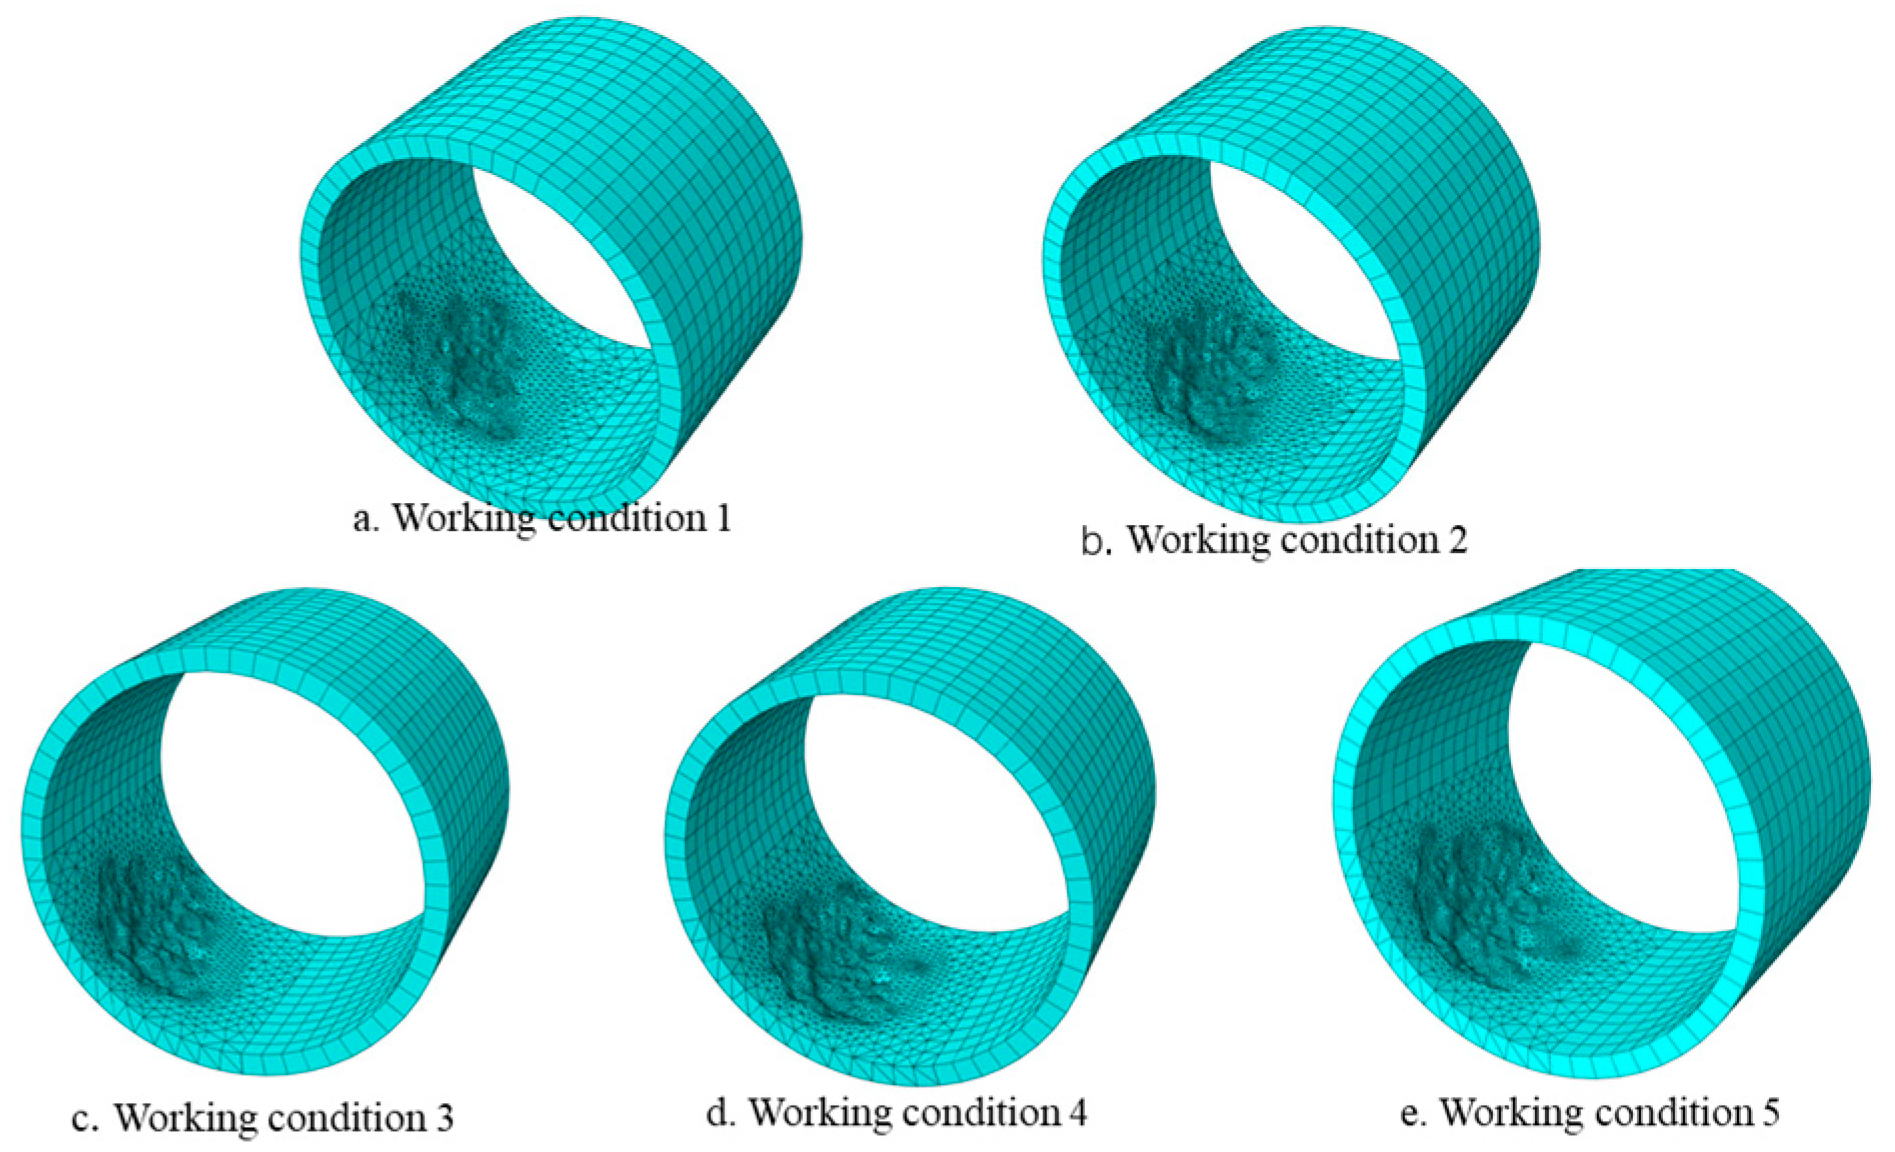
Based on the pipeline finite element models with five corrosion conditions established in Section 3.3.1 Establish a finite element model for internal corrosion of random surfaces with curvature. The preprocessing work was completed after importing the geometric models into the ABAQUS 2022 software. First, the material properties were defined using the steel pipe material parameters shown in Table 2. Subsequently, a differentiated meshing strategy was adopted: the undamaged areas were discretized using eight-node linear reduced-integration hexahedral elements (C3D8R), while the corrosion areas were meshed with ten-node quadratic tetrahedral elements (C3D10). The mesh size was uniformly controlled at 0.004 m to ensure a balance between computational accuracy and efficiency. The final mesh morphology is shown in Figure 10.
A complete finite element model of the layered corroded pipeline was constructed by sequentially embedding the five working-condition corrosion models into the reserved 0.05 m gap area of the three-layer composite pipeline structure. A “tie” constraint was applied to achieve a seamless connection between the corrosion area and the 0.65 m/1.3 m pipes at both ends. The same method was used to bind the insulation layer and the anti-corrosion layer, ultimately establishing a complete three-layer composite pipeline structure with internal corrosion defect characteristics. This provided a high-fidelity finite element model for the simulation of ultrasonic guided wave detection. The specific model establishment process is shown in Figure 11.
In the established finite element model, the group velocity dispersion curves for the L-mode in the three-layer composite pipe were plotted using MATLABR2023a, as shown in Figure 12. The results indicate that the L(03) mode exhibits weak dispersion effects around 75 kHz, demonstrating favorable waveform stability and propagation characteristics, making it suitable as the detection mode. Based on this, a narrowband sinusoidal signal modulated by a five-cycle Hanning window was employed as the excitation signal. The L(03) mode ultrasonic guided wave was excited at the actuator end with a central frequency of 75 kHz for damage identification in the layered pipe. This excitation method effectively suppressed waveform distortion caused by dispersion, resulting in high-quality guided wave response signals. This provided a reliable data foundation for the subsequent construction of a damage index matrix based on wavelet packet energy analysis, thereby enabling quantitative assessment of structural damage.

4. Research on Damage Detection of Layered Pipelines with Internal Corrosion

4.1. Wavelet Packet Decomposition Method

In recent years, significant progress has been made in the research of guided wave signal processing and damage quantification methods, with various advanced signal analysis techniques being successfully applied in this field, including wavelet analysis, spectral analysis, response spectrum analysis, and neural network theory. Among these, wavelet analysis has demonstrated unique technical advantages in guided wave signal processing due to its excellent time–frequency localization characteristics [27,28,29].
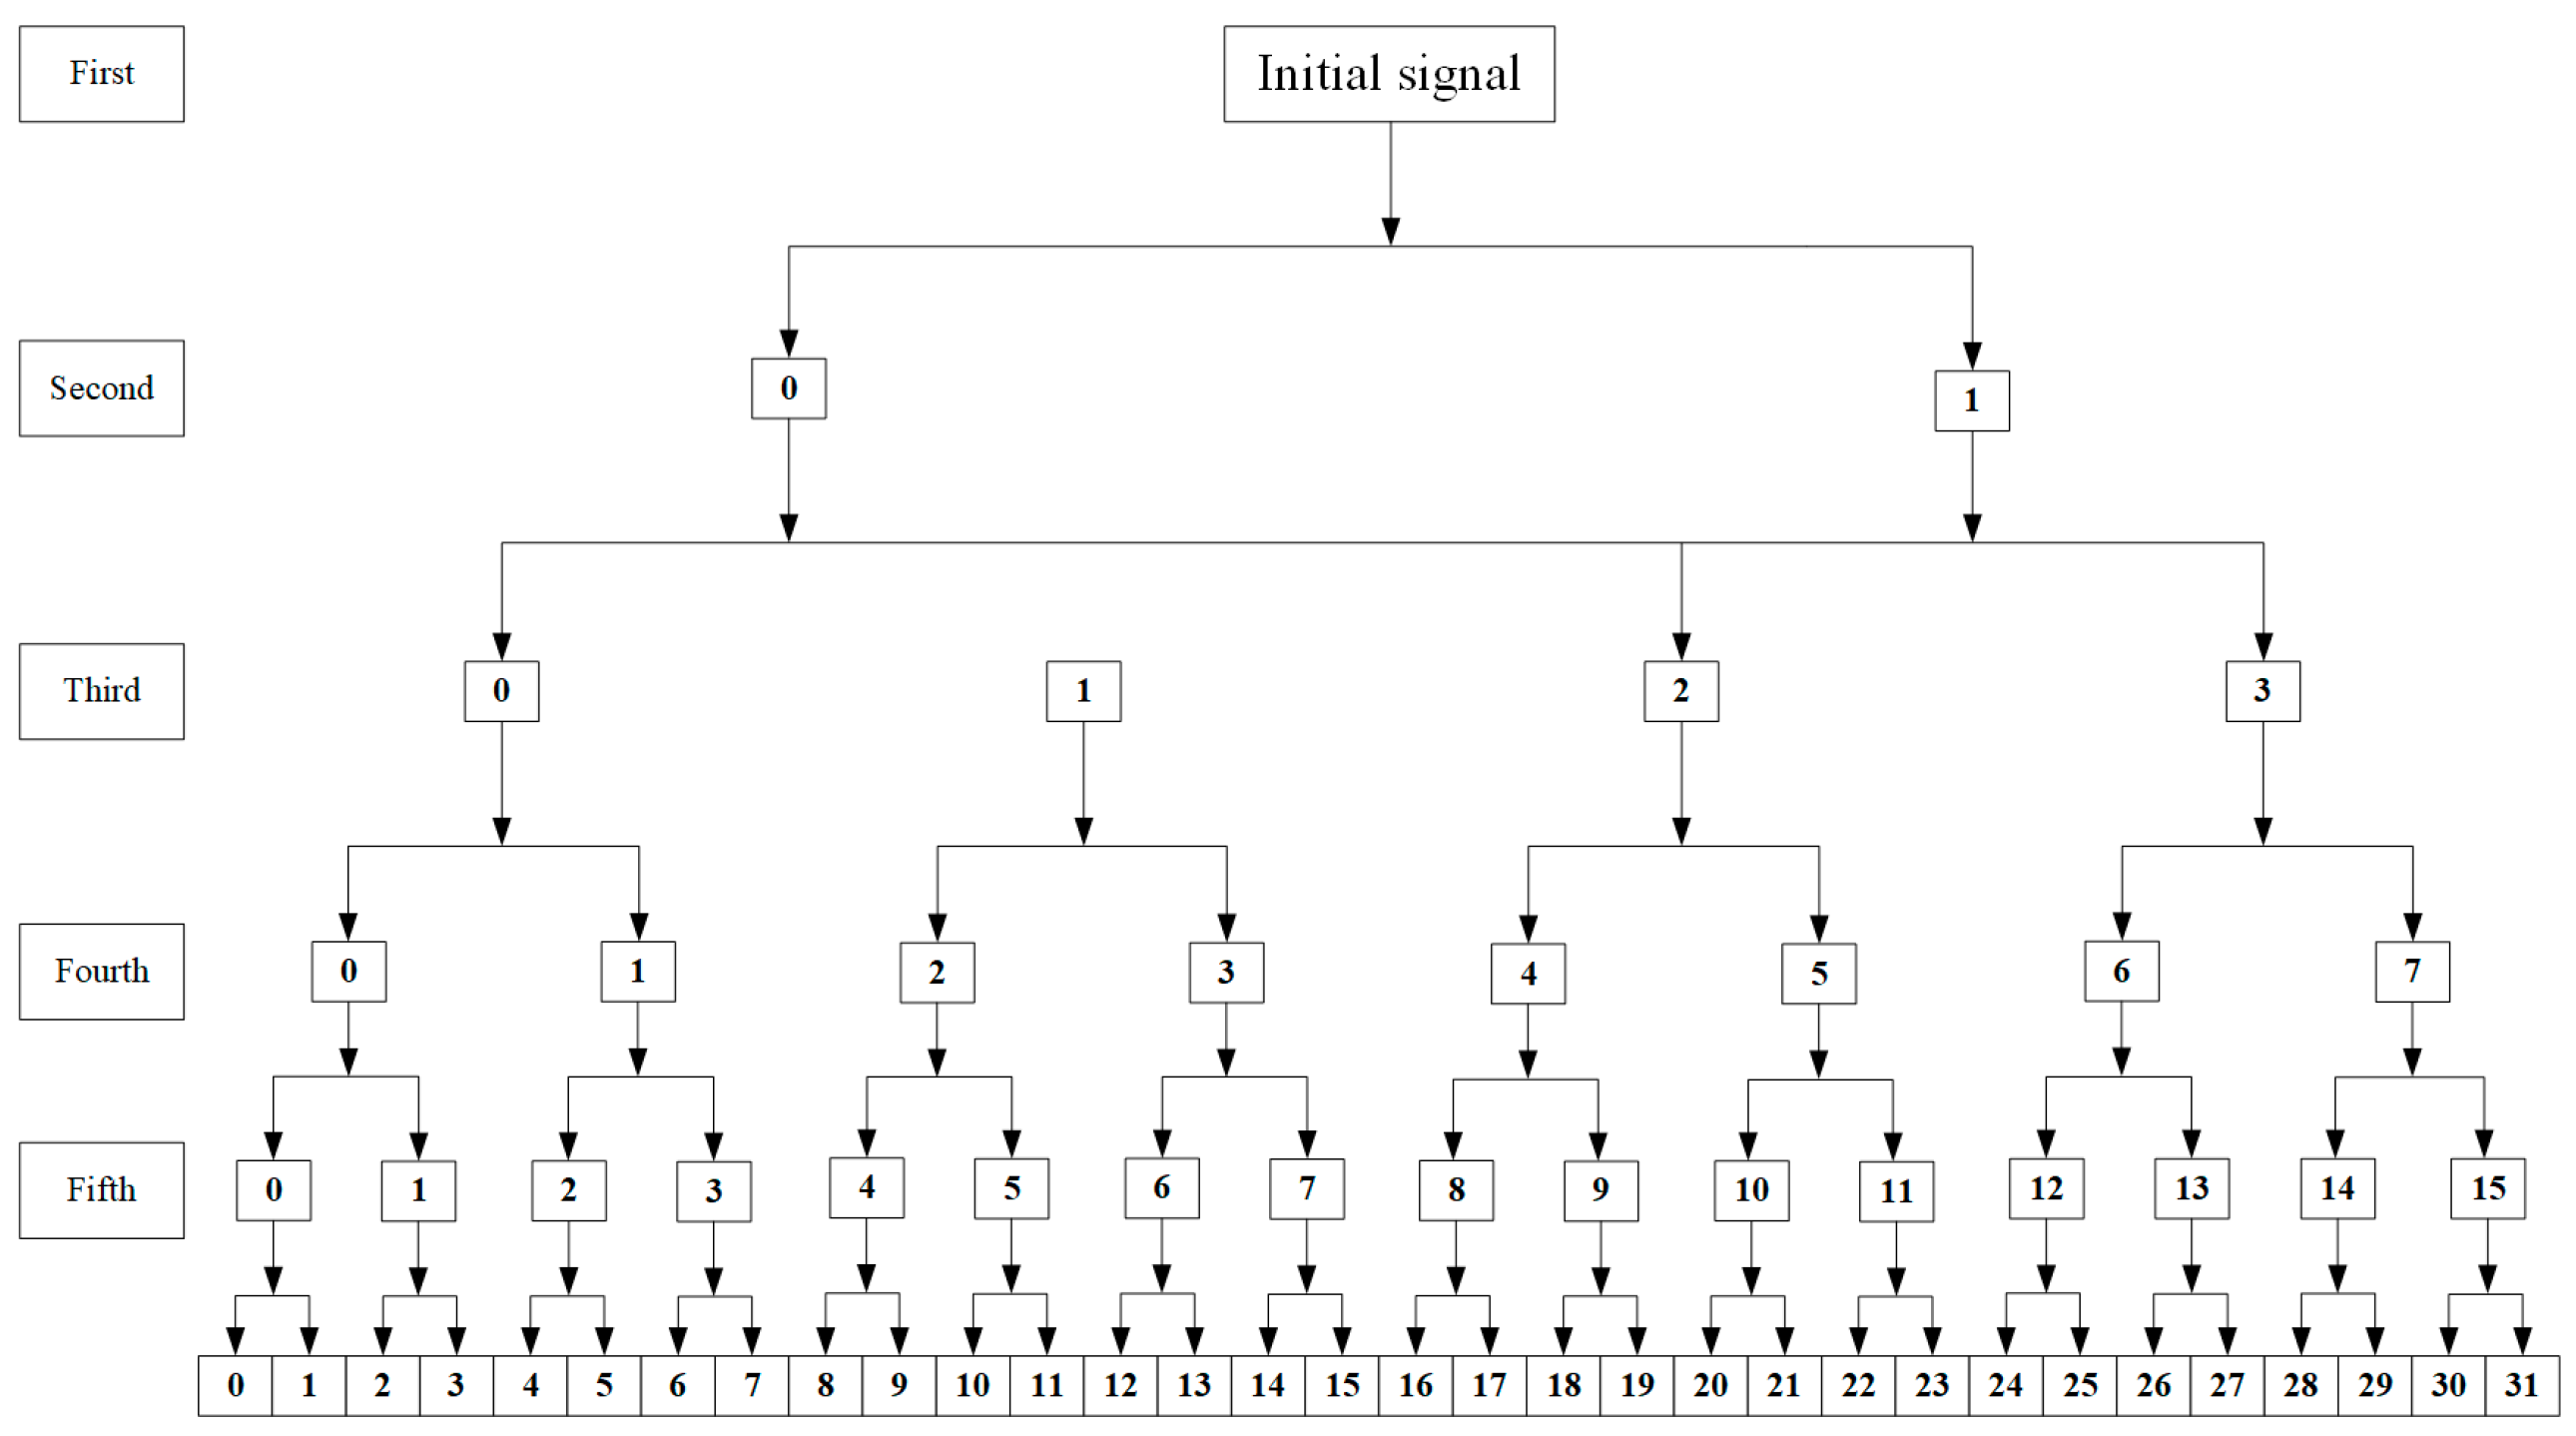
As an improved method over traditional wavelet decomposition, wavelet packet decomposition effectively overcomes the inherent limitations of the discrete wavelet transform, namely insufficient high-frequency resolution and restricted low-frequency resolution, by simultaneously decomposing both low-frequency and high-frequency components. This method employs a layer-by-layer decomposition of the approximation and detail components from the previous level, generating new second-level approximation and detail components, thereby achieving precise full-band time–frequency domain analysis of the signal. It enables the detection of narrowband frequency-domain features within relatively short time windows [30].
In this study, a fifth-order Daubechies wavelet (db5) was adopted as the mother wavelet, and a five-layer wavelet packet decomposition algorithm was implemented to perform multi-scale analysis of the ultrasonic guided wave signals. The excited L(0,3) mode ultrasonic guided wave is a sinusoidal signal modulated by a five-cycle Hanning window. The selection of the 5th-order wavelet is primarily based on its waveform, which closely matches the wave packet morphology of the L(0,3) mode, thereby facilitating concentrated signal energy during decomposition. Simultaneously, its 5th-order vanishing moment effectively suppresses smooth components in the signal, enabling sensitive detection of singularity features—such as reflections and scattering—induced by corrosion defects. This choice achieves an optimal balance between feature extraction accuracy and computational efficiency [31]. Through the 5-level decomposition, the entire frequency band is divided into 32 sub-bands of equal width, each with a bandwidth of approximately 7.8 kHz. This bandwidth is sufficient to effectively separate the main energy components of the guided wave signal centered at 75 kHz, while allowing detailed observation of energy migration between adjacent sub-bands caused by minor dispersion and mode conversion due to damage.
The complete tree structure of this five-layer wavelet packet decomposition is illustrated in Figure 13.

4.2. Damage Index Matrix

The damage index matrix, as a crucial evaluation metric in the field of damage detection, is a novel damage characteristic parameter proposed within the theoretical framework of wavelet packet multi-scale decomposition. The construction process of this matrix is described as follows:
First, the collected sensor signals were subjected to multi-scale analysis using the wavelet packet decomposition algorithm. Through five-level wavelet packet decomposition, the original time-domain signal was accurately decomposed into 2n mutually orthogonal signal subsets, each of which can be expressed as Xj,m:
X j = X j , 1 , X j , 2 , , X j , m ,           j = 1,2 , , 2 n
Secondly, energy feature extraction was performed on each signal subset. The energy feature Ej of the m-th sub-band was defined as:
E j = k = 1 k = m X j , k 2
where m is the number of sampling points, and Xj,k represents the k-th sampling value of the energy feature for the m-th sub-band.
Finally, the Damage Index Matrix RMSD was constructed by comparing the relative changes in the energy of each sub-band between the healthy and damaged states of the structure:
R M S D = i = 1 i = N y i x i 2 i = 1 i = N x i 2
where i is the time index corresponding to different measurements; E0,j is the energy of the j-th signal subset in the healthy state of the structure; and Ei,j is the energy of the j-th signal subset at the i-th time index in the damaged state of the structure.

4.3. Research on Damage Detection of Different Corrosion Areas

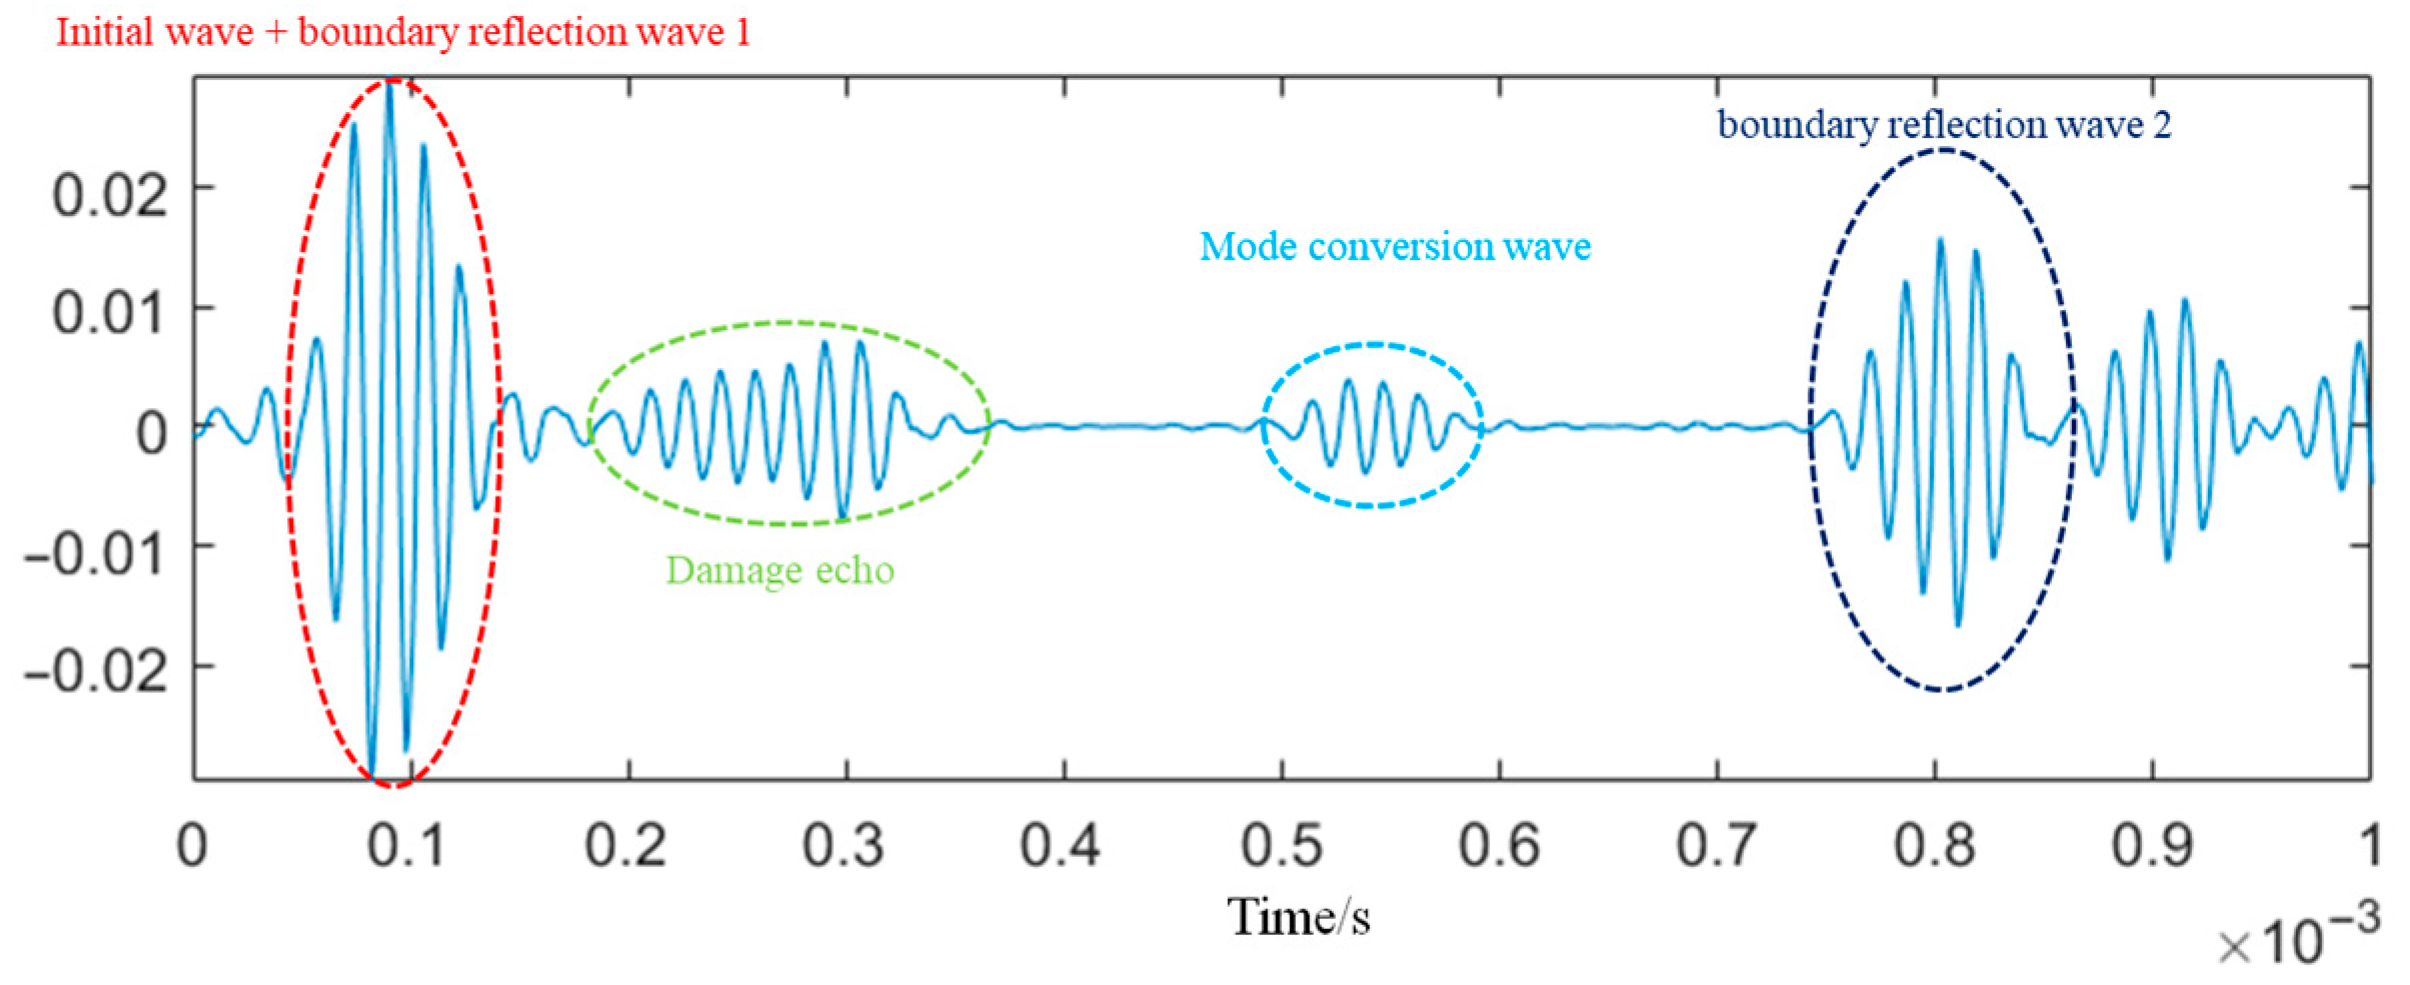
In the finite element model established in Section 3.3, “Application of the combined modeling method of COMSOL and ABAQUS”, the time-domain response signals of piezoelectric guided waves were successfully extracted at the receiver location, and the corresponding time-domain diagrams of piezoelectric signals were plotted. Based on the propagation mechanism of guided waves in the layered pipeline structure, the wave packets in the time-domain diagram for Working Condition 4 were identified. Figure 14 clearly illustrates the characteristic time-domain waveform containing the damage echo signal.
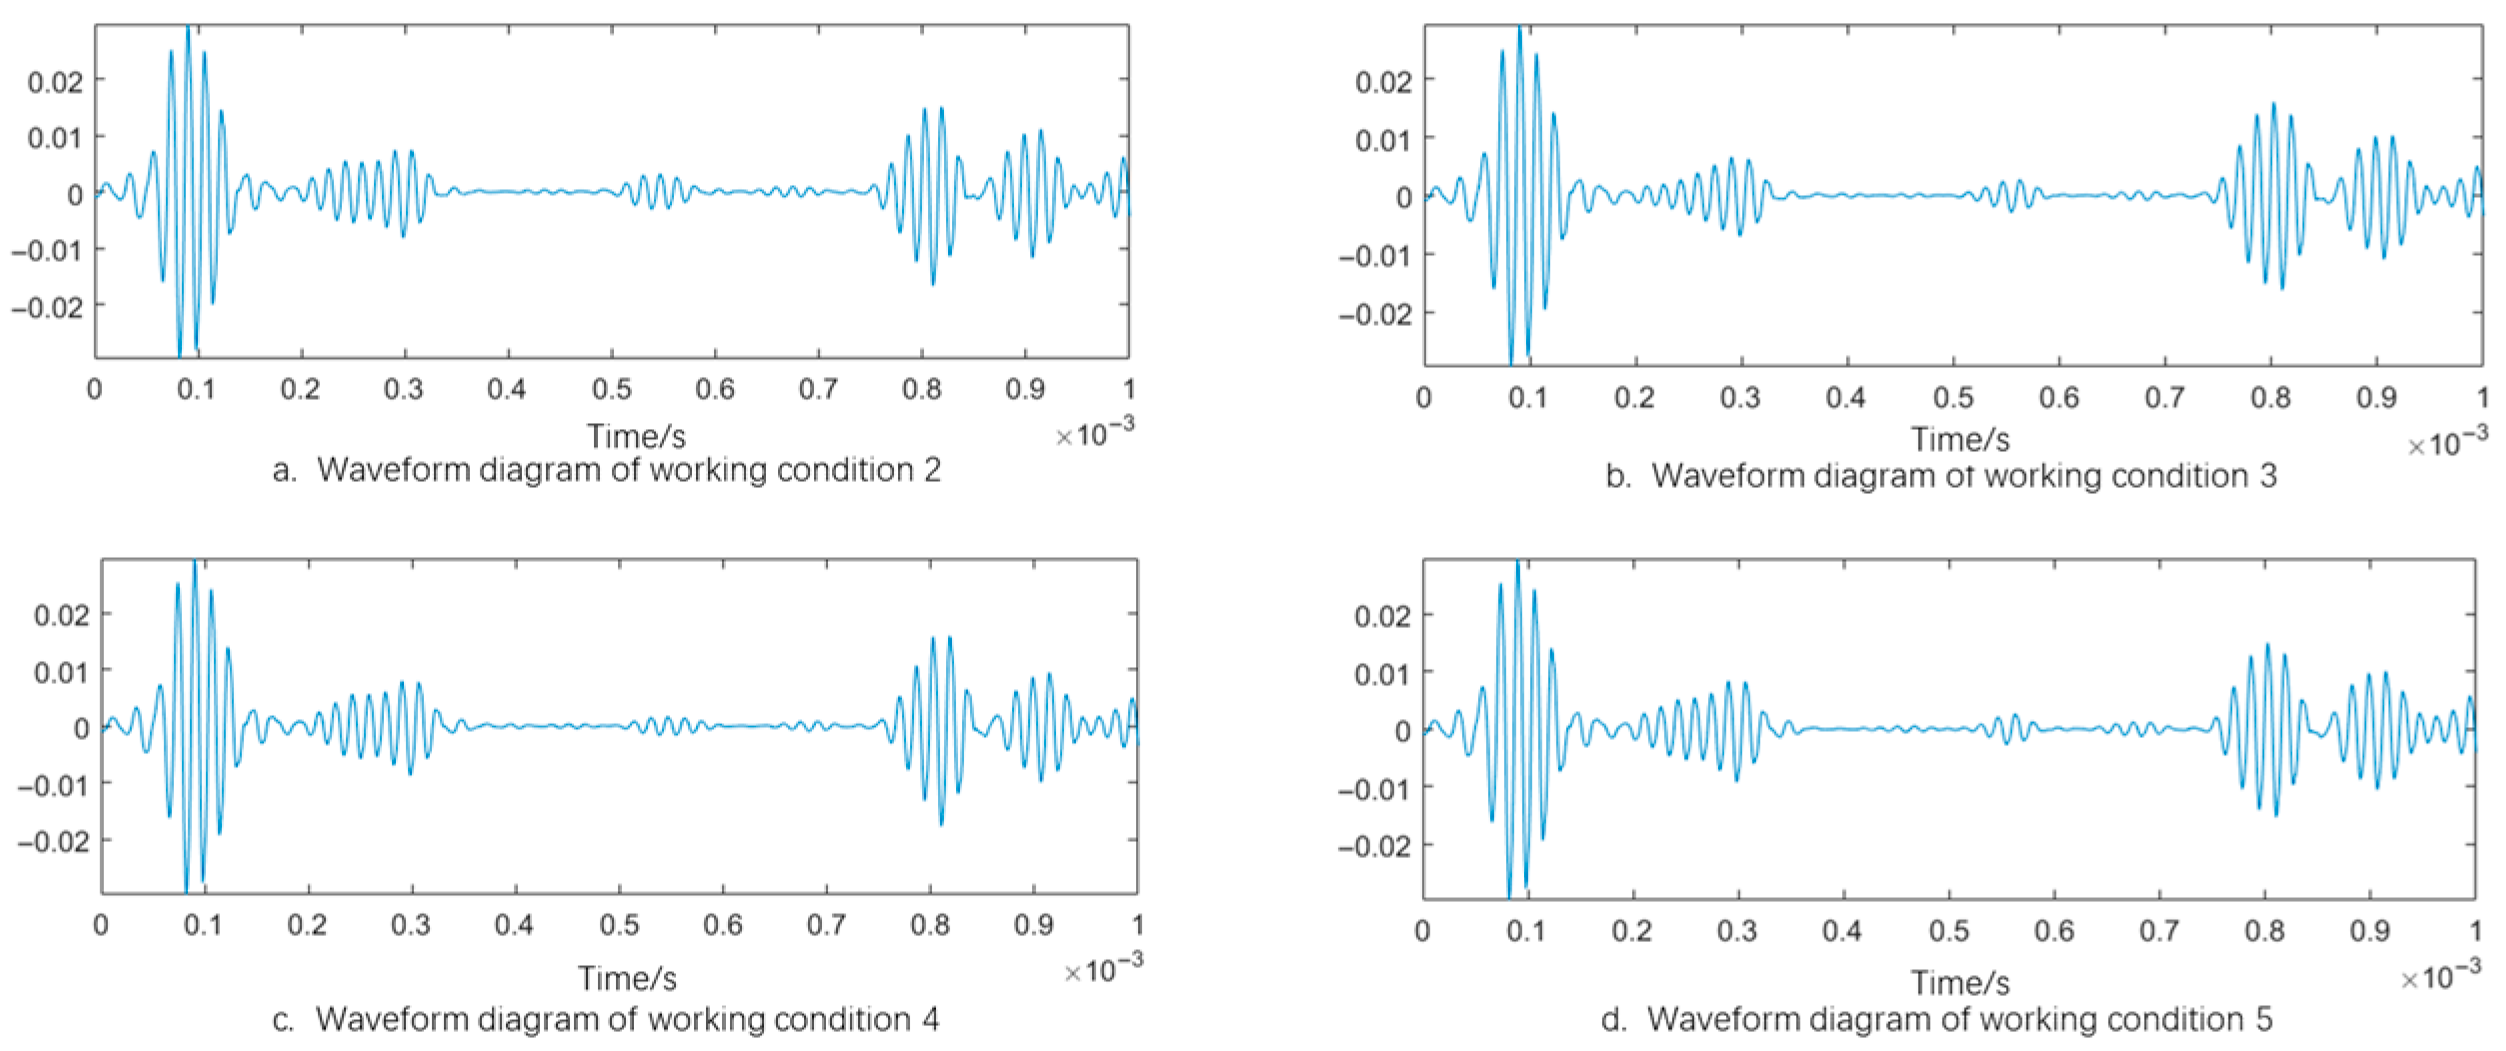
Through five-level wavelet packet decomposition applied to the piezoelectric signals from the five working conditions, the signal energy of each node subset was obtained. Detailed analysis revealed that the decomposed piezoelectric guided wave signal, which was divided into 32 nodes, exhibited maximum energy in the subset at Node 3, indicating its higher representativeness. Consequently, the waveform diagrams at Node 3 were analyzed for working conditions with damage at the same location but with different damage areas (Working Conditions 2, 3, 4, and 5). The nodal waveform diagrams are shown in Figure 15.

5. Analysis and Discussion

5.1. Effectiveness Analysis of Curved Random Surface Simulation for Internal Corrosion

Regarding the modeling methodology, the curved random surface modeling approach based on spatial frequency components and polynomial superposition, as proposed in this paper, demonstrates significant advantages in terms of time efficiency and technical implementation. Compared to methods utilizing the W-M fractal function, this approach eliminates the need for intensive point sampling and the development of complex mesh generation code, thereby substantially reducing the time cost and technical barriers associated with pipeline corrosion modeling.

5.2. Results and Analysis of Internal Corrosion Damage Detection in Pipelines

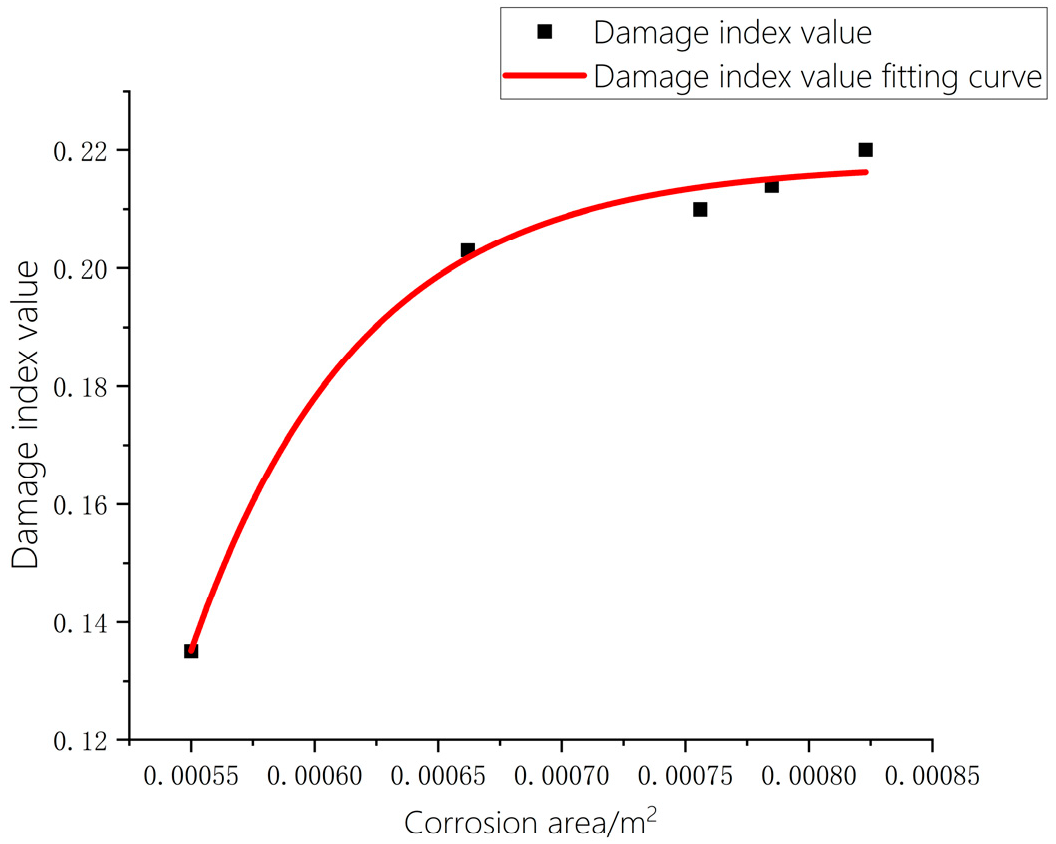
In terms of result analysis, by analyzing guided wave signals under different damage area conditions, a quantitative correspondence was established between the damage index (RMSD) and the corrosion area. A comparative analysis was performed on the time-domain waveforms of Node 3 extracted for working conditions with the same damage location but different damage areas (Working Conditions 1–5). Based on the Damage Index Matrix (RMSD) method, the damage index values for Working Conditions 1–5 were calculated, as shown in Table 4 below.
As can be seen from Table 4, the damage index value increased with the increase in damage area. This occurred because the wave packet amplitude gradually decreased as the damage area expanded, resulting in the energy of the subset at Node 3 for the damaged conditions always being lower than that of the healthy state. To study the relationship between the damage index value and the damage area, the damage indices from Working Conditions 1–5 were used to form a scatter plot, with the damage area as the x-axis and the damage index value as the y-axis. To further investigate the specific relationship between the damage index value and the damage area, the obtained damage index values were subjected to nonlinear fitting, resulting in a fitted curve for the damage index as a function of the damage area. The functional expression is given by y = −255.331 × exp(−x/6.845 × 10−5) + 0.218. The scatter plot of the damage index and the fitted curve is shown in Figure 16. The fitted curve indicates that the damage index value exhibited a nonlinear increasing trend with the increase in damage area. This trend effectively circumvents the complex non-monotonic relationships (specifically, the phenomenon where the damage index initially decreases and then increases with the expansion of the corrosion area) that may arise from idealized assumptions in classical corrosion models, thereby aligning more closely with actual evolution patterns. This response mechanism exhibits intrinsic similarities with the phenomenon observed by Maleska and Beben in their analysis of boundary conditions for soil-steel composite bridges, where “the influence of stiffness variation on structural response is nonlinear.” Their research demonstrated that excessive boundary stiffness can induce unfavorable response concentrations. By analogy, in the present study, the increase in corrosion area can be regarded as a continuous weakening of local structural “stiffness,” while the system’s dynamic response (damage index) similarly exhibits nonlinear saturation characteristics. This reveals the universally present nonlinear relationship between structural state parameters and system responses across different engineering structures (bridges and pipelines) and different physical processes (seismic response and wave propagation).
In terms of damage assessment, this study successfully established a monotonically increasing functional relationship between the damage index (RMSD) and the corrosion area, identifying a nonlinear positive correlation between them. This phenomenon can be explained from the perspective of wave energy: when the corrosion area is small, the guided wave energy scattering effect is significant, leading to a rapid increase in the damage index; as the area continues to expand, energy attenuation gradually approaches saturation, resulting in a corresponding slowdown in the growth rate of the damage index.

6. Conclusions

This study systematically investigated a random surface modeling method based on curvature, utilizing spatial frequency composition, and its application in detecting internal corrosion in layered pipelines. Certain theoretical achievements were obtained, enabling the accurate representation of the corrosion process and morphology. The created model served as both the object and the carrier for damage detection. The main conclusions are summarized as follows:
1. A method combining trigonometric series expansion for characterizing roughness and a binomial function for characterizing curvature was established. This approach effectively generated a random surface model with curvature and self-similarity, enabling a more realistic representation of internal pipeline corrosion morphology that closely approximates actual corrosion forms.
2. The combined COMSOL-ABAQUS modeling methodology successfully simulated the corrosion development process and established a high-fidelity corrosion model. This approach overcame the limitations of using a single software package and significantly improved modeling efficiency.
3. Based on the damage index values, a fitted curve relating the damage index to varying damage areas was derived. The research found a positive correlation between the damage area and the damage index, verifying the feasibility of the internal corrosion modeling. This provides reliable data to support the quantitative assessment of damage in layered pipelines.
The method proposed in this study offers a novel technical pathway for pipeline corrosion detection, significantly enhancing the accuracy and efficiency of damage assessment. Future work will focus on the following research directions: (1) expanding the model’s applicability under complex operating conditions. Develop a fluid-structure multi-physics coupled model to analyze the modulation mechanisms of complex service conditions—such as the flow of internal media (e.g., oil, gas, slurry), internal pressure fluctuations, temperature gradients, and residual stresses—acting in concert with corrosion defects, on the propagation characteristics and signal features of ultrasonic guided waves; and (2) conducting large-scale engineering validation. The research findings hold significant engineering application value for ensuring the safe operation of pipelines. Conduct ultrasonic guided wave detection experiments on pipe sections with prefabricated artificial defects and real electrochemical corrosion defects in a controlled laboratory environment. By comparing experimental data with simulation results, meticulously calibrate and validate the model’s accuracy, particularly the quantitative relationship between the damage index and corrosion morphology parameters (e.g., depth, volume). Establish a comprehensive correlation database linking “corrosion morphology parameters—guided wave signal features—damage index” based on extensive experimental and field data. Utilize data-driven methods, such as machine learning, to deeply explore the underlying patterns. The goal is to formulate a standardized testing and assessment guideline that can be integrated into existing pipeline integrity management systems.

Author Contributions

Conceptualization, Y.L. and Q.L.; methodology, Y.L.; software, Q.L.; validation, Y.L., Q.L. and F.H.; formal analysis, Q.L.; investigation, Q.L.; resources, Y.L.; data curation, F.H.; writing—original draft preparation, Q.L.; writing—review and editing, Y.L.; visualization, F.H.; supervision, Y.L.; project administration, F.H.; funding acquisition, Y.L. All authors have read and agreed to the published version of the manuscript.

Funding

Hebei Technology Innovation Center for Multi-Hazard Resilience and Emergency. Handling of Engineering Structures under Grant No. FZ246205.

Data Availability Statement

The original contributions presented in this study are included in the article material. Further inquiries can be directed to the corresponding author(s).

Conflicts of Interest

The authors declare no conflicts of interest.

Abbreviations

The following abbreviations are used in this manuscript:
IDInner diameter
ODOuter diameter
WTWall thickness
ρDensity
EElastic modulus
νPoisson’s ratio
LPipe length

References

  1. Meng, F. The Pipeline Industry is Accelerating the Transition from a Single Means of Transport to a Multi Type Energy Hub. 2025. Available online: https://www.cinn.cn/yw/2025/04-09/qkNaWbvD.html (accessed on 29 June 2025).
  2. Valor, A.; Caleyo, F.; Alfonso, L.; Rivas, D.; Hallen, J.M. Stochastic modeling of pitting corrosion: A new model for initiation and growth of multiple corrosion pits. Corros. Sci. 2007, 49, 559–579. [Google Scholar] [CrossRef]
  3. Caleyo, F.; Velázquez, J.C.; Valor, A.; Hallen, J.M. Markov chain modelling of pitting corrosion in underground pipelines. Corros. Sci. 2009, 51, 2197–2207. [Google Scholar] [CrossRef]
  4. Valor, A.; Caleyo, F.; Rivas, D.; Hallen, J.M. Stochastic approach to pitting-corrosion-extreme modelling in low-carbon steel. Corros. Sci. 2010, 52, 910–915. [Google Scholar] [CrossRef]
  5. Beben, D. Backfill Corrosivity around Corrugated Steel Plate Culverts. J. Perform. Constr. Facil. 2015, 29, 04014159. [Google Scholar] [CrossRef]
  6. Sun, Z.; Du, H. Estimation of the dispersion curves of pipe guided waves by field measurement. Mech. Syst. Signal Process. 2020, 140, 106693. [Google Scholar] [CrossRef]
  7. Pang, G.; Wang, N.; Fang, H.; Liu, H.; Huang, F. Study of Damage Quantification of Concrete Drainage Pipes Based on Point Cloud Segmentation and Reconstruction. Buildings 2022, 12, 213. [Google Scholar] [CrossRef]
  8. Demma, A.; Cawey, P.; Lowe, M.; Roosenbrand, A.; Pavlakovic, B. The reflection of guided waves from notches in pipes: A guide for interpreting corrosion measurements. NDT E Int. 2004, 37, 167–180. [Google Scholar] [CrossRef]
  9. Li, D.; Zhang, S.; Yang, W.; Zhang, W. Corrosion Monitoring and Evaluation of Reinforced Concrete Structures Utilizing the Ultrasonic Guided Wave Technique. Int. J. Distrib. Sens. Netw. 2014, 10, 827130. [Google Scholar] [CrossRef]
  10. Rao, J.; Ratassepp, M.; Lisevych, D.; Hamzah Caffoor, M.; Fan, Z. On-Line Corrosion Monitoring of Plate Structures Based on Guided Wave Tomography Using Piezoelectric Sensors. Sensors 2017, 17, 2882. [Google Scholar] [CrossRef]
  11. Wang, N.; Qiao, L.; Fang, H.; Pang, G.; Du, X.; Zhai, K.; Di, D.; Duan, Y. Corrosion segmentation method of concrete drainage pipes based on point transformer. Measurement 2024, 234, 114893. [Google Scholar] [CrossRef]
  12. Wang, X.; Yang, F.; Wang, C.; Zhao, K.; Zheng, Y. Pipeline corrosion modeling and simulation for guided-waves-based inspection. Chin. J. Sci. Instrum. 2023, 44, 71–80. [Google Scholar] [CrossRef]
  13. Mu, X.; Sun, Q.; Xu, J.; Chai, Z.; Sun, W.; Zhao, B. Feasibility Analysis of the Replacement of the Actual Machining Surface by a 3D Numerical Simulation Rough Surface. Int. J. Mech. Sci. 2018, 150, 135–144. [Google Scholar] [CrossRef]
  14. Li, X.; Lan, X.; Li, Z.; Guo, L. Discussion on the Present Situation and Development of Corrosion Detection Technology in Oil and Gas Pipelines. Constr. Des. Proj. 2019, 8, 183–184. [Google Scholar] [CrossRef]
  15. Xiao, R.; Hu, Q.; Li, J. Leak detection of gas pipelines using acoustic signals based on wavelet transform and Support Vector Machine. Measurement 2019, 146, 479–489. [Google Scholar] [CrossRef]
  16. GB/T 6461-2002; Metallic and Other Inorganic Coatings—Rating of Test Specimens and Manufactured Articles Subjected to Corrosion Tests. Standards Press of China: Beijing, China, 2002.
  17. ISO 10289:1999; Methods for Corrosion Testing of Metallic and Other Inorganic Coatings on Metallic Substrates—Rating of Test Specimens and Manufactured Articles Subjected to Corrosion Tests. ISO Copyright Office: Geneva, Switzerland, 1999.
  18. ASME B31.8S-2022; Managing System Integrity of Gas Pipelines. ASME: New York, NY, USA, 2022.
  19. Chen, G.; Yang, D.; Wang, Y.; Wang, T. Pipeline Corrosion Monitoring Method Based on Frequency Tracking Method. Chin. J. Sens. Actuators 2023, 36, 1148–1152. [Google Scholar] [CrossRef]
  20. Maleska, T.; Beben, D. Behaviour of Soil–Steel Composite Bridges under Strong Seismic Excitation with Various Boundary Conditions. Materials 2023, 16, 650. [Google Scholar] [CrossRef] [PubMed]
  21. Yan, S.; Zhang, B.; Song, G.; Lin, J. PZT-Based Ultrasonic Guided Wave Frequency Dispersion Characteristics of Tubular Structures for Different Interfacial Boundaries. Sensors 2018, 18, 4111. [Google Scholar] [CrossRef]
  22. Wang, X.; Zhao, K.; Zheng, Y. Characteristics of symmetric mode conversion of longitudinal guided—Wave modes in pipeline. Chin. J. Sci. Instrum. 2020, 41, 151–160. [Google Scholar] [CrossRef]
  23. Wasim, M.; Djukic, M. External corrosion of oil and gas pipelines: A review of failure mechanisms and predictive preventions. J. Nat. Gas Sci. Eng. 2022, 100, 104467. [Google Scholar] [CrossRef]
  24. Popov, B.N. Chapter 1—Evaluation of Corrosion. In Corrosion Engineering, 2nd ed.; Elsevier: Amsterdam, The Netherlands, 2025; pp. 1–29. ISBN 9780443220111. [Google Scholar] [CrossRef]
  25. Javaherdashti, R. Microbiologically Influenced Corrosion—An Engineering Insight. Br. Corros. J. 2008, 29, 181–182. [Google Scholar] [CrossRef]
  26. Revie, R.W.; Uhlig, H.H. Corrosion and Corrosion Control: An Introduction to Corrosion Science and Engineering, 4th ed.; John Wiley & Sons: Hoboken, NJ, USA, 2008. [Google Scholar]
  27. Zajam, S.; Joshi, T.; Bhattacharya, B. Application of wavelet analysis and machine learning on vibration data from gas pipelines for structural health monitoring. Procedia Struct. Integr. 2019, 14, 712–719. [Google Scholar] [CrossRef]
  28. Shaik, N.B.; Pedapati, S.R.; Taqvi, S.A.A.; Othman, A.R.; Dzubir, F.A.A. A Feed-Forward Back Propagation Neural Network Approach to Predict the Life Condition of Crude Oil Pipeline. Processes 2020, 8, 661. [Google Scholar] [CrossRef]
  29. Li, S.; Wen, Y.; Li, P.; Yang, J.; Dong, X.; Mu, Y. Leak location in gas pipelines using cross-time–frequency spectrum of leakage-induced acoustic vibrations. J. Sound Vib. 2014, 333, 3889–3903. [Google Scholar] [CrossRef]
  30. Wang, X.; Qu, L.; Li, Y. Finite element simulation for damage identification of layered pipe structures based on damage index matrix. Earthq. Eng. Eng. Dyn. 2023, 43, 189–197. [Google Scholar] [CrossRef]
  31. Mallat, S. Chapter 7—Wavelet Bases. In A Wavelet Tour of Signal Processing; Academic Press: Cambridge, MA, USA, 2009; pp. 263–376. [Google Scholar]
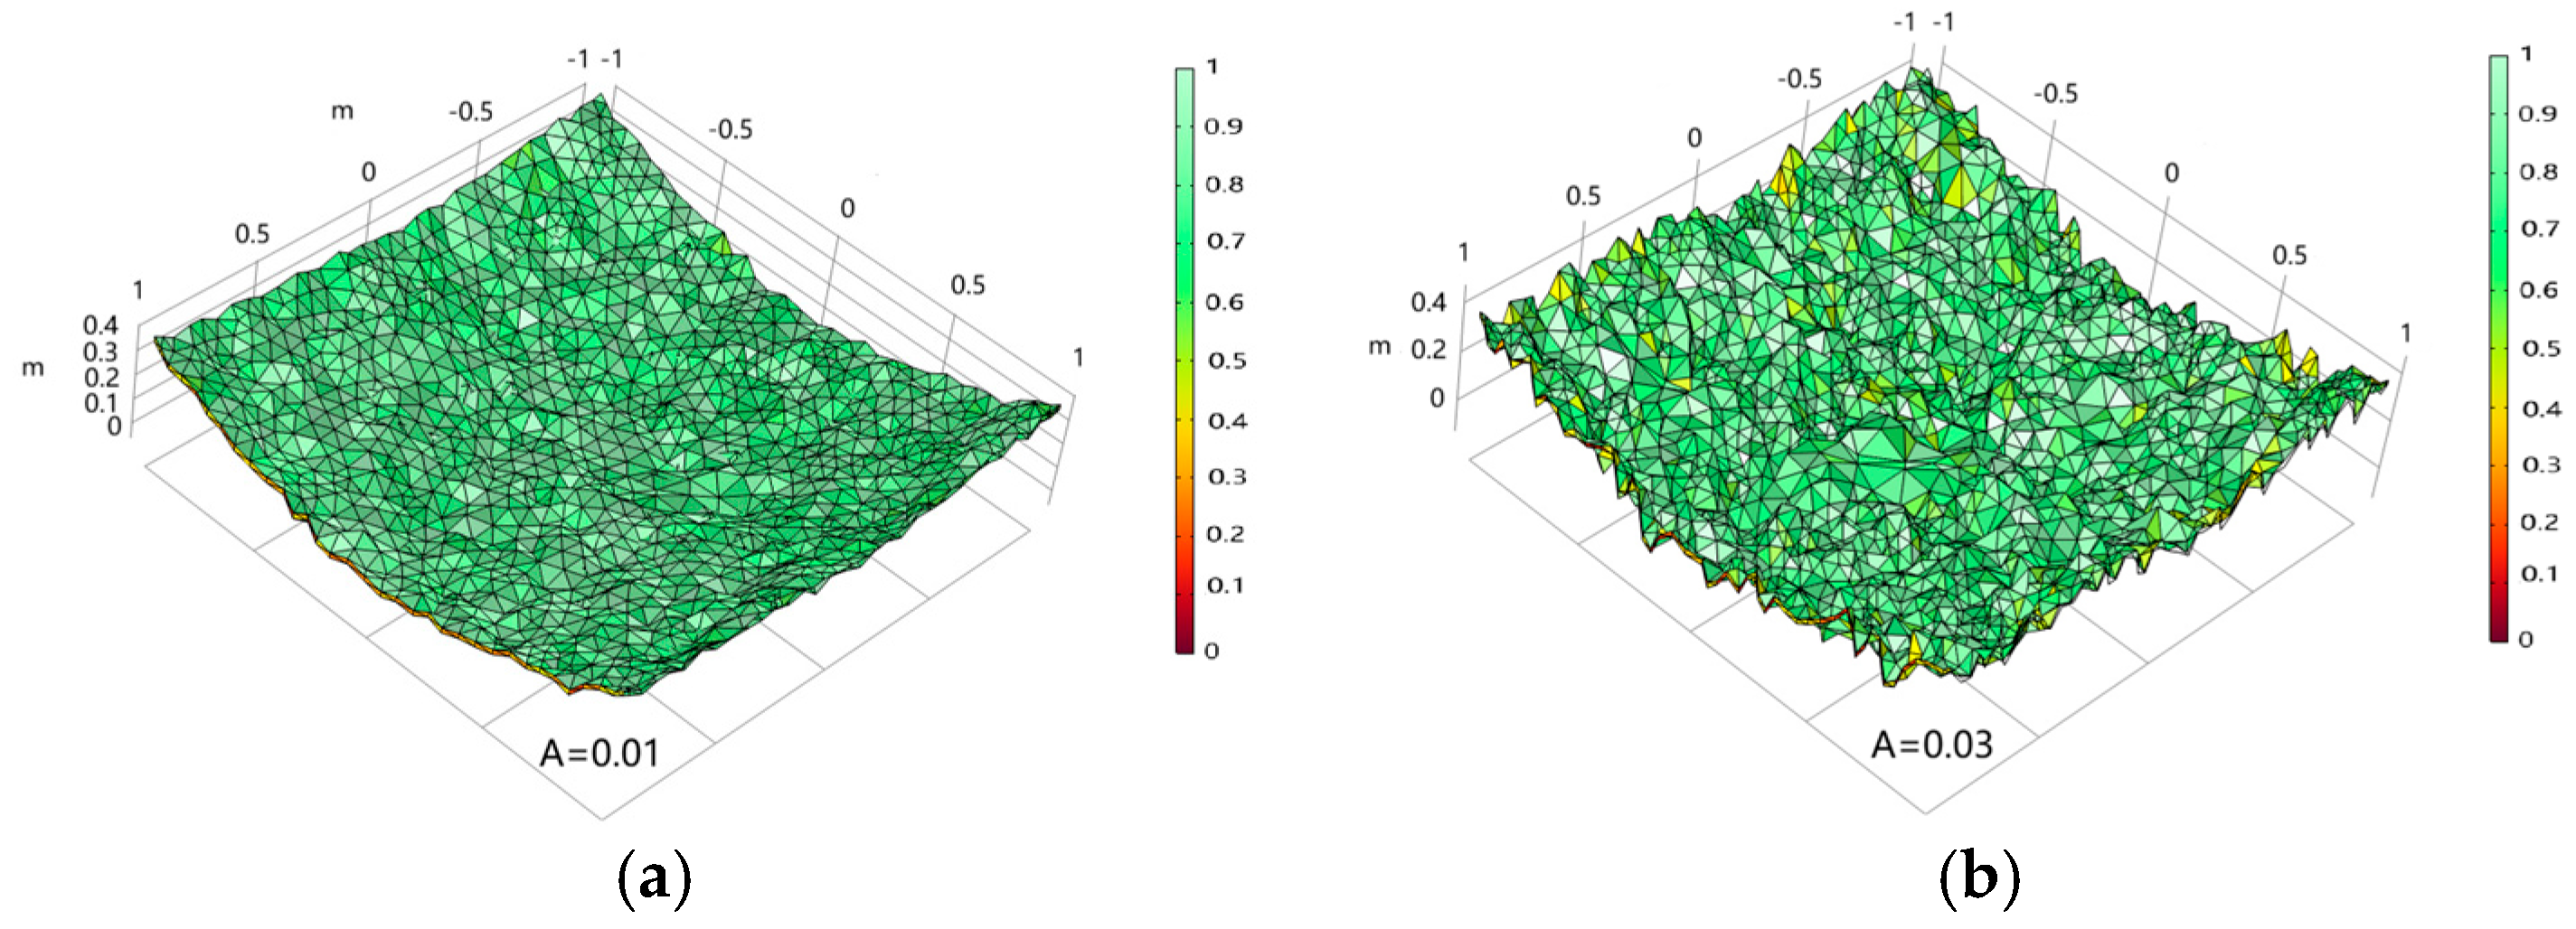
Figure 1. Schematic Diagram of the Scaling Factor Transformation. (a) Shows a scaling factor of 0.01; (b) Shows a scaling factor of 0.03.
Applsci 15 12372 g001
Figure 2. Schematic diagram of the spectral indexical transformation. (a) Shows a spectral index of 1.8; (b) Shows a spectral index of 1.5.
Applsci 15 12372 g002
Figure 3. Schematic diagram of features corresponding to curvature factor transformation. (a) The curvature factors were set to B = 0 and C = 0; (b) The curvature factors were set to B = 0 and C = 0.3; (c) The curvature factors were set to B = 0.3 and C = 0; (d) The curvature factors were set to B = 0.3 and C = 0.3.
Applsci 15 12372 g003
Figure 4. Parameter variation trend chart.
Applsci 15 12372 g004
Figure 5. Schematic diagram of random surface fitting with a pipeline.
Applsci 15 12372 g005
Figure 6. Schematic diagram of corrosion morphology inside the pipeline.
Applsci 15 12372 g006
Figure 7. Specific flowchart for modeling layered corrosion pipelines.
Applsci 15 12372 g007
Figure 8. Schematic diagram of different corrosion area models. (a) Pipeline and random surface segmentation map; (b) Corrosion area 550 × 10−7 m2; (c) Corrosion area 662 × 10−7 m2; (d) Corrosion area 756 × 10−7 m2; (e) Corrosion area 785 × 10−7 m2; (f) Corrosion area 825 × 10−7 m2.
Applsci 15 12372 g008
Figure 9. Schematic diagram of a piezoelectric element.
Applsci 15 12372 g009
Figure 10. Grid division diagram under different working conditions.
Applsci 15 12372 g010
Figure 11. Schematic diagram of the layered pipeline corrosion model establishment.
Applsci 15 12372 g011
Figure 12. Dispersion curve of L mode for three-layer composite pipe.
Applsci 15 12372 g012
Figure 13. Complete tree view of wavelet packet decomposition.
Applsci 15 12372 g013
Figure 14. Waveform of the damage echo signal.
Applsci 15 12372 g014
Figure 15. Waveform diagram of the third node under different working conditions.
Applsci 15 12372 g015
Figure 16. Damage index value fitting curve.
Applsci 15 12372 g016
Table 1. Parameter change trend table.
Scaling FactorSq/mNormalized
Sq/m
Spectral IndexSq/mNormalized
Sq/m
0.010.13486601.20.1361661
0.020.1384870.0892771.40.1354590.456572
0.030.1429610.1995861.60.1351340.206764
0.040.1482110.3290271.80.1349810.089162
0.050.1541570.4756282.00.1349080.033052
0.060.1607220.6374172.20.1348760.008455
0.070.1678330.8128032.40.1348660.000768
0.080.17542512.60.1348650
Table 2. Operating conditions of different Corrosion area models.
Working Condition NumberPipe Length/mPipe Wall Thickness/mCorrosion Area/m2Depth of Corrosion/m
Working condition 10.050.040.0005500.003
Working condition 20.050.040.0006620.003
Working condition 30.050.040.0007560.003
Working condition 40.050.040.0007850.003
Working condition 50.050.040.0008250.003
Table 3. Material Properties.
Structure TypeID/mOD/mWT/mρ/kg·m−3E/PaνL/m
Material Properties
Steel pipe0.0680.0760.00478502.10 × 10110.322
Polyurethane rigid foams0.0760.1360.03807.80 × 1080.251.7
High-density polyethylene0.1360.140.0029465.52 × 1080.41.7
Table 4. Damage index value.
Working Condition NumberCorrosion Area/mDamage Index Value
10.0005500.135
20.0006620.203
30.0007560.21
40.0007850.214
50.0008230.22
Disclaimer/Publisher’s Note: The statements, opinions and data contained in all publications are solely those of the individual author(s) and contributor(s) and not of MDPI and/or the editor(s). MDPI and/or the editor(s) disclaim responsibility for any injury to people or property resulting from any ideas, methods, instructions or products referred to in the content.