Article

Strength and Strain Properties of Coal Sludge

Department of Geomechanics, Civil Engineering and Geotechnics, Faculty of Civil Engineering and Resource Management, AGH University of Krakow, 30-059 Krakow, Poland
Appl. Sci. 2025, 15(23), 12360; https://doi.org/10.3390/app152312360
Submission received: 6 October 2025 / Revised: 18 November 2025 / Accepted: 19 November 2025 / Published: 21 November 2025

Abstract

Coal sludge, a fine-grained by-product of hard coal benefit, comprises a mixture of coal particles and mineral and organic matter. Generated during sedimentation and dewatering processes in preparation plants, it is typically recovered as a semi-solid filter cake. The material has potential applications in energy production and, with appropriate processing and stabilization, could be utilized in geotechnical facilities. The strength properties defined by the internal friction angle and cohesion, as well as the deformation properties expressed by compressibility, are among the most important mechanical characteristics of soil. This article presents tests of coal sludge, for which the internal friction angle, cohesion, and oedometric primary and secondary moduli were determined. The material was prepared at its optimum moisture content and maximum dry density prior to testing. In the direct shear test, using a shear box of 6 × 6 cm, each sample was consolidated for 24 h under the applied vertical stress, under which it was subsequently sheared. The shear rate was constant at 0.01 mm/min, and the test was conducted up to 10% horizontal deformation. The vertical stresses applied ranged from 50 to 200 kPa. In the oedometer test, samples were prepared to fit the dimensions of the oedometer ring, and each subsequent load stage was applied after 24 h. The range of vertical stresses in this test was from 12.5 to 400 kPa. The results of the direct shear test (φ = 24°, c = 28 kPa) are similar to the strength parameters typically obtained for medium-cohesive soils, such as sandy silt (φ = 22°, c = 25 kPa. The results of the compressibility tests (0.89 MPa < M0 < 6.35 MPa) correspond to values characteristic of organic soils, for example, organic silts (0.5 MPa < M0 < 5 MPa). Moreover, analysis of the consolidation curves showed that up to a vertical stress of 100 kPa, coal sludge does not exhibit rheological behavior. The obtained results indicate that coal sludge, when compacted up to its optimum moisture content and to an adequate dry density, can be effectively utilized for geotechnical applications, such as the construction of isolation barriers, as a component of geotechnical mixtures, or as a sealing material for the reclamation of post-mining areas.

1. Introduction

Coal sludge (CS) is generated during the enrichment of hard coal through the washing of coal fines [1], as well as during the treatment of underground water in surface settling ponds [2]. Its properties and characteristics are determined by the inherent qualities of the coal itself, including petrographic and chemical composition, type of macerals present, sulfur and ash content, and amount of clay minerals, pyrite, quartz, and calorific value. During processing, the coal is crushed, ground, and concentrated in heavy liquids, sedimentation tanks, and flotation machines. Soft and porous coal is easy to grind, whereas hard and compact coal is more resistant. The ease of grinding is quantified by the Hardgrove Grindability Index (HGI), which depends on moisture content, ash content, degree of metamorphism, petrographic and mineral composition, and the degree of carbon oxidation [3]. Coal with a high HGI produces a large amount of fine particles (<0.063 mm) during grinding, resulting in more coal sludge. The processing technology used also affects the proportion of combustible and mineral components in coal sludge. Sludge directed to flotation may have a higher combustible carbon content compared to sludge from settling tanks, which tends to contain more mineral particles [4,5]. Additionally, factors such as the method and duration of coal sludge storage, variable moisture content affecting calorific value, and the presence of mineral impurities (ash and sulfur) contribute to its heterogeneous nature.
Coal sludge is a fine-grained material in which particles smaller than 0.063 mm constitute over 60% of the granulometric composition. It is characterized by a high content of organic matter (approximately 50%), ash (30–70%), and sulfates (0.4–1.8%) [6,7]. In addition to combustible carbon particles, coal sludge contains mineral components, mainly clays and silts, as well as quartz, feldspar, pyrite, siderite, calcite, and other accessory minerals [5,6,7,8]. Coal sludge exhibits high moisture content (20–50%), a density of 1.1–1.5 g/cm3, and low permeability [2,8]. Due to its calorific value, ranging from 4 to 25 MJ/kg [4], the primary use of coal sludge is currently as a low-energy fuel in boilers [9]. Other notable applications include the following: as an ingredient in wastewater slurries for backfilling underground mine workings [10]; as a component in ecological mixtures for the reclamation of land degraded by industry [11]; for biological reclamation [2]; as a raw material for building ceramics [12,13]; and for capping and remediation of municipal landfills [14]. Despite these uses, very large quantities of coal sludge continue to accumulate in settling ponds; according to a 2011 inventory, approximately 12 million tons of coal sludge were deposited in such facilities [15].
Coal sludge is a material composed of nearly 50% organic matter [14], which is why its primary area of utilization has traditionally been the energy sector. The organic content of coal waste is most commonly determined using high-temperature methods, such as loss on ignition (LOI) according to standard [16], conducted at temperatures exceeding 800 °C. This method is fast and indicative; however, it is not highly precise, as it also accounts for the decomposition of certain minerals, such as carbonates and clay minerals. A result of approximately 50% organic content obtained using method [16] was reported, among others, in [17]. When the organic content of coal sludge is determined using the 30% hydrogen peroxide oxidation method, as described in [16], the measured value is typically below 5% [18]. According to [19], such a result classifies the material as low-organic.
The main drawback of using coal sludge in the energy sector lies in its composition, specifically the high content of mineral components. However, it should be noted that this mineral fraction provides an opportunity for coal sludge to be utilized in geotechnical applications. An increase in the mineral content makes the properties of coal sludge more similar to those of natural fine-grained soils. As a result, both bulk and specific densities increase, since mineral components have higher densities than organic substances, while porosity and natural moisture content decrease, leading to a lower water absorption capacity. In a material structure dominated by mineral particles, the stiffness of the soil skeleton and its strength both increase. Furthermore, the presence of fine clay and silt fractions hinders water flow through the organic matrix, thereby reducing the permeability of the material [20].
In recent years, an increasing number of publications have addressed various aspects of coal sludges, including their strength [21,22,23], dynamic properties-particularly liquefaction resistance [24]-as well as compressibility and creep behavior in settling lagoons [8,25,26]. Other studies have focused on in situ tests [27,28], deformations [29], the properties of organic materials or mixtures containing such materials [30], permeability [31,32], and the potential use of coal sludge for sealing applications in civil engineering structures [31].
This last application, in particular, appears to offer considerable potential for the practical use of coal sludge. Studies of the permeability coefficient of coal sludge have reported values on the order of 10−9 m/s [31,33], indicating that this material exhibits very low water permeability. These findings confirm the suitability of coal sludge from hard coal mining for use in sealing engineering structures.
According to widely accepted classifications, materials used in insulation layers should have a filtration coefficient of k < 10−9 m/s [34,35,36]. Similar requirements apply to mineral insulation barriers, where k < 1 × 10⁻⁹ m/s [37,38,39,40]. Natural soils with low permeability include cohesive clays with a high clay fraction, which, when well compacted, often occur in river valleys and glacial basins (k = 10−8–10−9 m/s) [41], clays such as Pliocene or varved clays (k = 10−9–10−11 m/s) [42] and silty clays (k = 10−7–10−9 m/s) [43].
Coal sludge can be utilized as a component of engineered mixtures by combining it with natural soils (e.g., clays or sands) or with materials such as fly ash and other industrial by-products. These composite materials can be applied in land reclamation, embankment construction, and terrain leveling works. The formation of such mixtures not only enables the beneficial utilization of industrial waste but also contributes to the reduction in disposal volumes and the enhancement of geotechnical performance parameters [44].
In applications involving untreated coal sludge, mechanical dewatering and subsequent compaction are required to obtain satisfactory strength and stiffness characteristics. For composite mixtures, the proportioning of constituent materials must be carefully optimized to achieve the desired engineering performance. Comprehensive laboratory testing should be conducted to determine compaction behavior, optimum moisture content, strength parameters, and deformation characteristics under various loading conditions.
In addition to geotechnical characterization, detailed chemical and environmental assessments—including the determination of total sulfur, pyrite, and heavy metal contents—are essential to evaluate potential environmental risks associated with the use of coal sludge. Literature reports indicate that, although the technical feasibility of such applications has been demonstrated, further investigations are required to assess the mechanical properties, long-term stability, and in situ performance of coal sludge-based materials. In [33], the necessity for additional strength testing is emphasized, together with extended geotechnical studies such as the determination of consistency limits and shear strength parameters, which are critical for establishing the final suitability of coal sludge for engineering applications.
Determining the values of strength parameters, such as the internal friction angle and cohesion, as well as deformation parameters, including the primary and secondary compressibility moduli, enables a better understanding of the properties that determine the potential applicability of this material in geotechnical engineering, particularly for sealing structures. These parameters constitute the basis for the design of anti-filtration systems and for assessing the potential use of coal sludge as a construction material. Reliable determination of these characteristics ensures the safety of earthworks and minimizes the risk of undesirable phenomena such as liquefaction or loss of embankment stability. Despite their heterogeneity and high moisture content, coal sludges exhibit distinct strength and deformation behaviors which, after appropriate preparation and compaction, can make them suitable for certain geotechnical applications.
Although numerous studies have been devoted to coal sludge, a clearly defined classification system for this material has not yet been established. Existing research results are seldom presented in a comprehensive manner that encompasses the physical, chemical, strength, and deformation characteristics of coal sludge. In many cases, individual parameters are investigated in isolation, without an integrated analysis of the interrelations among the various physical and mechanical properties.
Given the heterogeneous nature of coal sludge, it is crucial to provide a detailed description of the sample preparation procedures employed prior to testing. However, such information is often presented only briefly or is entirely omitted in published works.
The findings presented in this study do not aim to completely bridge the existing knowledge gap regarding the lack of standardized data on the mechanical properties of coal sludge compared with other industrial by-products. Nevertheless, the research provides relevant and systematically obtained data that contribute to this area of knowledge. The paper investigates the interdependence between mineral composition, moisture content, and organic matter fraction, and their influence on the strength and deformation parameters of coal sludge. Furthermore, an attempt has been made to determine the stress threshold beyond which the rheological properties of coal sludge exert a significant influence on the aforementioned mechanical characteristics of the material.

2. Materials and Methods

2.1. Material Characteristic

The material used for testing was pure coal sludge (without any admixtures), a by-product of hard coal processing. The coal sludge was obtained as a result of dewatering a water suspension containing fine coal particles and clay minerals in filter presses, originating from coal enrichment processes carried out in separators (settling tanks, cyclones, and concentration tables).
The material was sourced from a mining plant located in the Upper Silesia region of Poland and represents the final product of the sludge thickening process performed in a filter press. In order to limit the impact of the variability of coal sludge properties related to the quality of the extracted coal, the test material was collected from a single batch in the form of a filter cake with a moisture content of 30–35%, obtained after the slurry dewatering and thickening process.
The granulometric composition of the coal sludge (CS) is analogous to that of silt (siCl) [11,33] (the same coal sludge was investigated in [33]) and consistent with the results reported in [5], where approximately 60–80% of particles were smaller than 0.5 mm.
In [45], the variability in the chemical composition of coal waste across several countries was presented. According to this compilation, SiO2 and Al2O3 are the dominant chemical components, with contents ranging from 38 to 67% and 8–30% for Spain, 19–67% and 15–27% for Great Britain, and 35–60% and 17–28% for Poland, respectively. The chemical composition of CS (Table 1) is dominated by SiO2 (33.5%) and Al2O3 (21%), which falls within the ranges specified in [45]. The presence of these components significantly influences the geotechnical properties of the material, providing insights into its mineralogical composition and geological origin. A SiO2 content of 33.5% indicates that CS behaves as a cohesive soil (clayey or silty), containing clay minerals and metal oxides, and exhibits low permeability. The weathering index (Ruxton Index), defined as the SiO2/Al2O3 ratio, is 1.6 for CS, which is also characteristic of cohesive, clayey soils rich in aluminosilicate minerals.
SEM analysis, as reported in [17], revealed sharp-edged, opaque coal fragments ranging from 0.01 to 0.5 mm, along with a few spore remains, whose total volume did not exceed 40% of the sample. Particles smaller than 0.1 mm predominate in CS, and chaotically dispersed quartz and feldspar grains (≤0.05 mm) can also be distinguished within the sample matrix. All components are embedded in an abundant, very finely grained clayey matrix.
The phase composition of CS, determined by XRD analysis in [17], consists primarily of clay minerals, including kaolinite, illite, chlorite, and mixed-layer minerals (smectite-illite). Additionally, quartz, micas, minor feldspar, pyrite, halite, and carbon are present in the samples. The physical parameters of CS are summarized in Table 2.

2.2. Research Methodology

2.2.1. Strength Parameters Determination

Sample preparation
To prepare the coal sludge samples, the test material was first dried at 105 °C to remove its moisture content. The dried material was then rehydrated by adding an amount of water corresponding, by weight, to the optimum moisture content of the sample. The optimum moisture content used in the tests was 27.80%, and the maximum dry density was 1.458 g/cm3 (bulk density 1.86 g/cm3), values adopted from [31], where the same material was investigated. The material was mixed with water until a homogeneous mass was obtained.
Subsequently, the material was compacted in several layers within the direct shear apparatus box to achieve a compaction level close to that determined during the optimum moisture content test. Conducting tests under optimal moisture conditions allows for the most representative determination of mechanical properties, as all samples have consistent moisture content and bulk density, and the degree of pore water saturation is similar. Additionally, under these conditions, the soil achieves its highest density, resulting in maximum bearing capacity. Increasing the moisture content above the optimum level reduces sample density due to decreased interparticle shear forces caused by excess water molecules, which in turn lowers the material’s strength.
Consolidation of sample
Each sample placed in the direct shear apparatus was consolidated by applying a vertical stress corresponding to the normal stress at which the sample would subsequently be sheared. During consolidation, the samples were protected from moisture loss. Vertical deformations were measured using sensors installed perpendicular to the cap of the direct shear box. The preliminary criterion for ending consolidation was that the consolidation rate stabilized at less than 0.001 within 5 h, or that the consolidation time reached 24 h. To ensure sufficient consolidation, even if the condition Δεh < 0.001 mm was achieved within 5 h, the shear test was started only after 24 h of consolidation.
The described consolidation procedure follows PN-88/B-04481 [16] and is commonly applied to organic and anthropogenic soils. No separate standardized procedures exist for waste materials such as coal sludge. The physical properties of coal sludge, including its chemical composition and notably its SiO2 content, indicate that it behaves as a cohesive material; therefore, it is tested according to procedures for cohesive soils.
The purpose of sample consolidation is to achieve stress equilibrium by allowing excess pore water pressure to dissipate and stabilizing the soil structure, so that soil particles arrange according to the applied load and vertical deformations are eliminated. Insufficient consolidation results in loads being transferred through the pore water rather than the soil skeleton, leading to lower measured shear strength.
Shear strength test
Determination of the strength parameters (internal friction angle φ and cohesion c) using a direct shear apparatus involves measuring the limiting shear force under a known normal load, which varies for successive test specimens. During the test, the specimen fails along a predetermined shear plane, whose surface area is limited by the dimensions of the box. Testing was conducted in accordance with PN-88/B-04481 [16], using a 6 × 6 cm shear box. The shear rate was set at 0.01 mm/min, and the normal stress range applied was 50–200 kPa.
The vertical stresses applied to the sample were intended to simulate the loads that the material would experience under field conditions. In natural soils, the normal stress also reflects the weight of the overlying soil layers. Standard [16] recommends that the range of normal stress values should be as wide as possible, e.g., 50–400 kPa. Since coal sludge is not expected to be placed at depths greater than 10 m, the normal stresses selected for this test series were 50, 100, 150, and 200 kPa.
Horizontal strain and shear force readings were recorded every 30 seconds. The maximum shear stress within the strain range ε ≤ 10% was taken as the shear strength of the material. Immediately after the test, once the apparatus was switched off and the specimen relieved of load, its moisture content was determined. A total of 11 samples were tested, divided into three series corresponding to the different vertical loads. The tests were conducted in three series with the following vertical loads:
Series 1: 50, 100, 150, and 200 kPa
Series 2: 50, 100, 150, and 200 kPa
Series 3: 100, 150, and 200 kPa

2.2.2. Strain Parameters Determination

Sample preparation
The purpose of the test was to determine the relationship between the change in sample height and the applied load, based on which the oedometric moduli of compressibility (M0–primary modulus, and M–recompression modulus) are determined. The determination of oedometric moduli is performed on samples with intact structure (NNS) when designing foundations on weak natural soils, and on artificially compacted samples when assessing the compressibility of soils in embankments [46]. Test specimens are prepared using a special cutting ring (Figure 1).
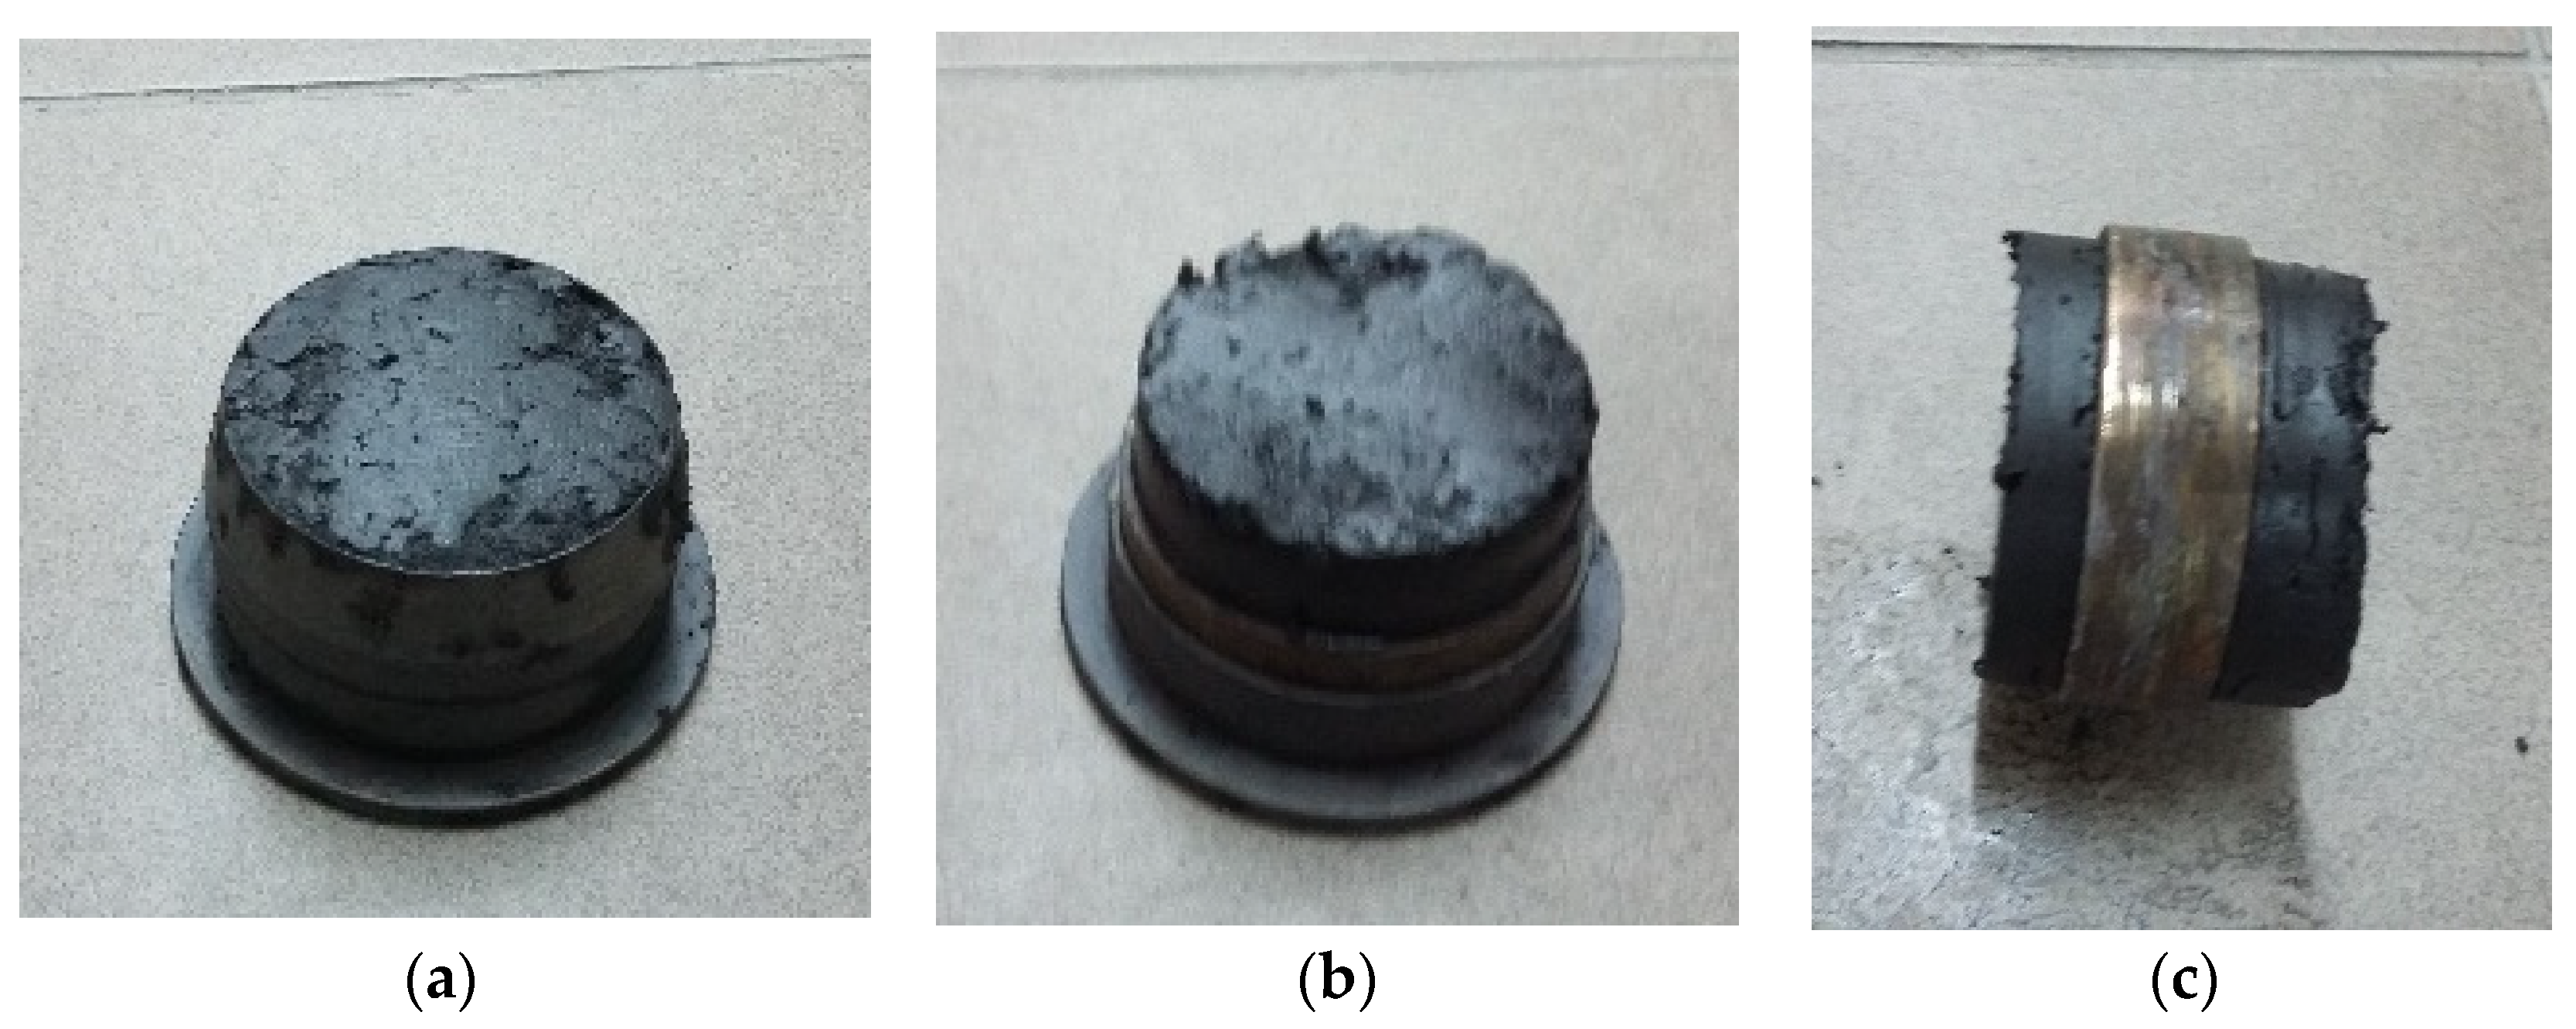
To standardize the density of the tested coal sludge, the material was adjusted to its optimal moisture content (wopt = 27.80%) and compacted in a Proctor apparatus (bulk density 1.86 g/cm3, corresponding to a maximum dry density of 1.458 g/cm3). Samples for the oedometer tests were prepared using a bipartite cutting ring from the appropriately compacted material (Figure 2a,b). Once the test specimen was extracted (Figure 2c), it was trimmed to the ring dimensions and placed in the oedometer. Three specimens, each 65 mm in diameter and 20 mm in height, were prepared for testing.
The sample dimensions were chosen in accordance with the requirements for oedometer testing specified in the standard [16]. The height and diameter of the specimen must be representative of the tested material. If the sample is too small, accurate settlement measurement may be compromised due to the influence of the ring walls (increased sample stiffness caused by restricted lateral deformation and friction against the ring) or local heterogeneities (e.g., oversized grains). This can lead to overestimation of stiffness and underestimation of settlement. Conversely, a larger sample size better represents actual conditions and reduces wall effects, although it may pose challenges in achieving uniform settlement throughout the specimen.
The dimensions of the coal sludge samples were selected based on their granulometric composition, which classifies the material as fine-grained silty clay (siCl). According to the standard [18], the chosen ring dimensions are appropriate for this material type.
Oedometer test
The compressibility test was conducted in an oedometer equipped with a mechanical, gravity-based loading system. The compressibility moduli were determined according to Method I described in PN-88/B-04481 [16], which involves gradual loading or unloading of the specimen, with each successive loading step being twice as high as the previous one (or half as high during unloading).
The specimen was loaded in the following steps: 12.5 kPa, 25 kPa, 50 kPa, 100 kPa, 200 kPa, and 400 kPa. At each loading step, vertical deformations were recorded at the following time intervals: 1, 2, 5, 15, 30 min, and 1, 2, 4, 19, 24, and 48 h. Load increments were applied only after the sample height had stabilized, with the stabilization time assumed to be 48 h. Consolidation curves for each loading step, as well as compression and relaxation diagrams, were prepared for all tested materials and mixtures.
The test was performed in three series. A complete loading cycle included:
Primary loading–6 load steps: 12.5, 25, 50, 100, 200, and 400 kPa
Unloading–5 load steps: 200, 100, 50, 25, and 12.5 kPa
Secondary loading–5 load steps: 25, 50, 100, 200, and 400 kPa

3. Results

3.1. Internal Friction Angle and Cohesion Determination

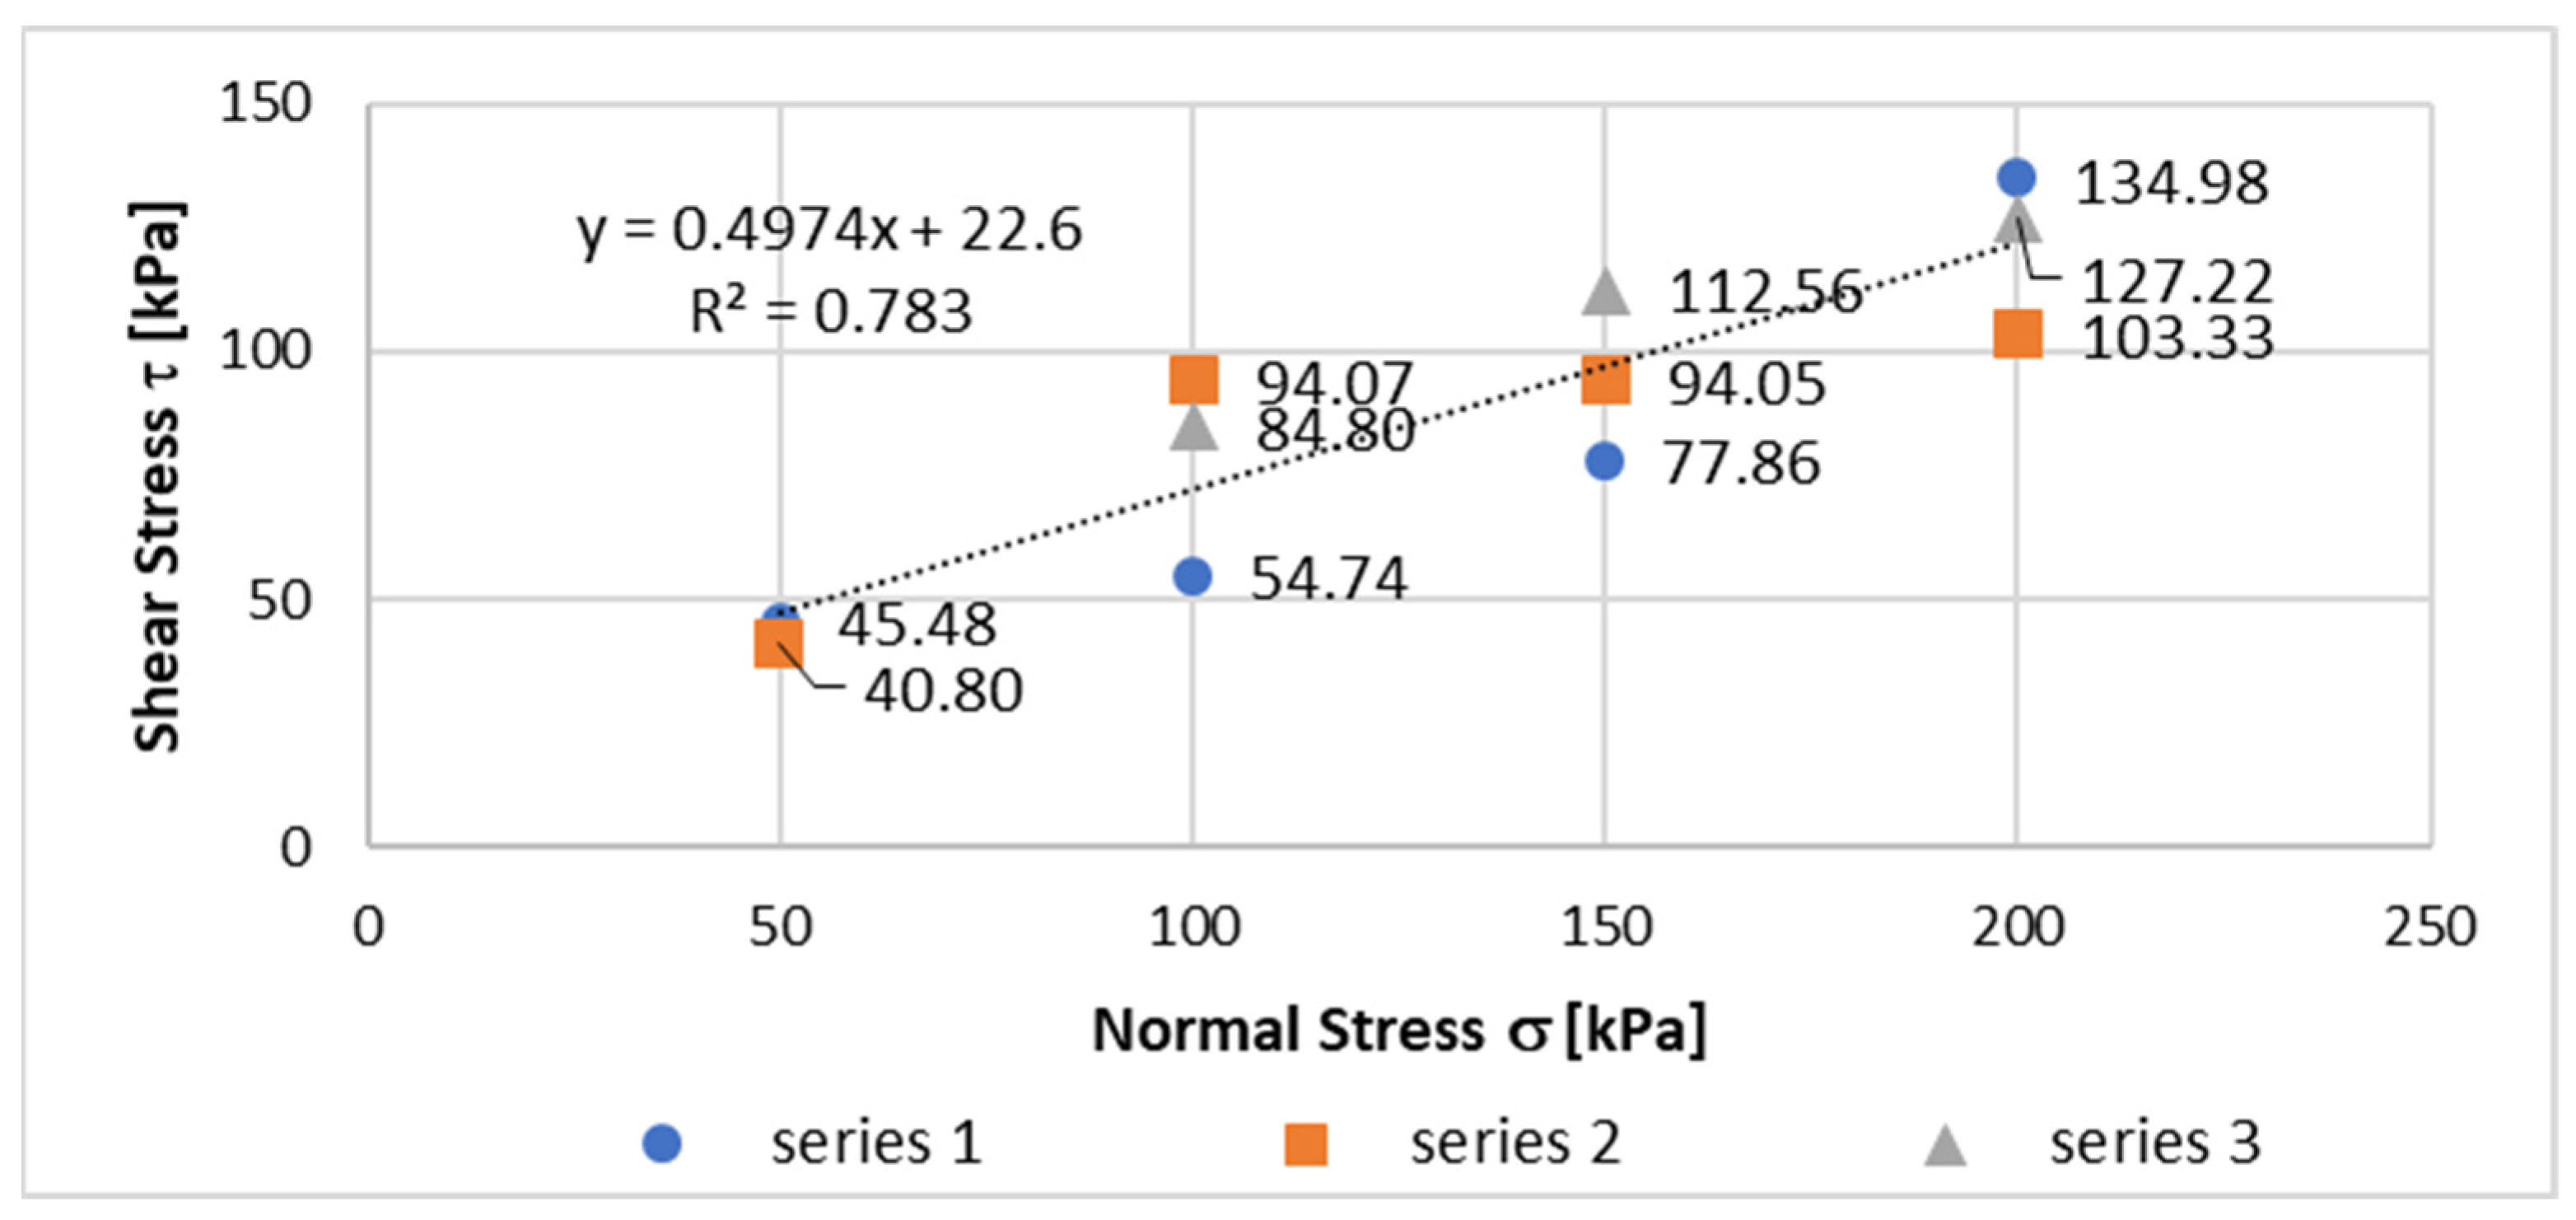
The coal sludge (CS) tests in a direct shear apparatus were conducted in three series, with a total of 11 samples tested. The shear tests were performed at a rate of 0.01 mm/min, and the average testing time per sample was 10–12 h. The results of the direct shear tests are summarized in Table 3, and the shear stress–strain diagram, τ(σ), is presented in Figure 3.
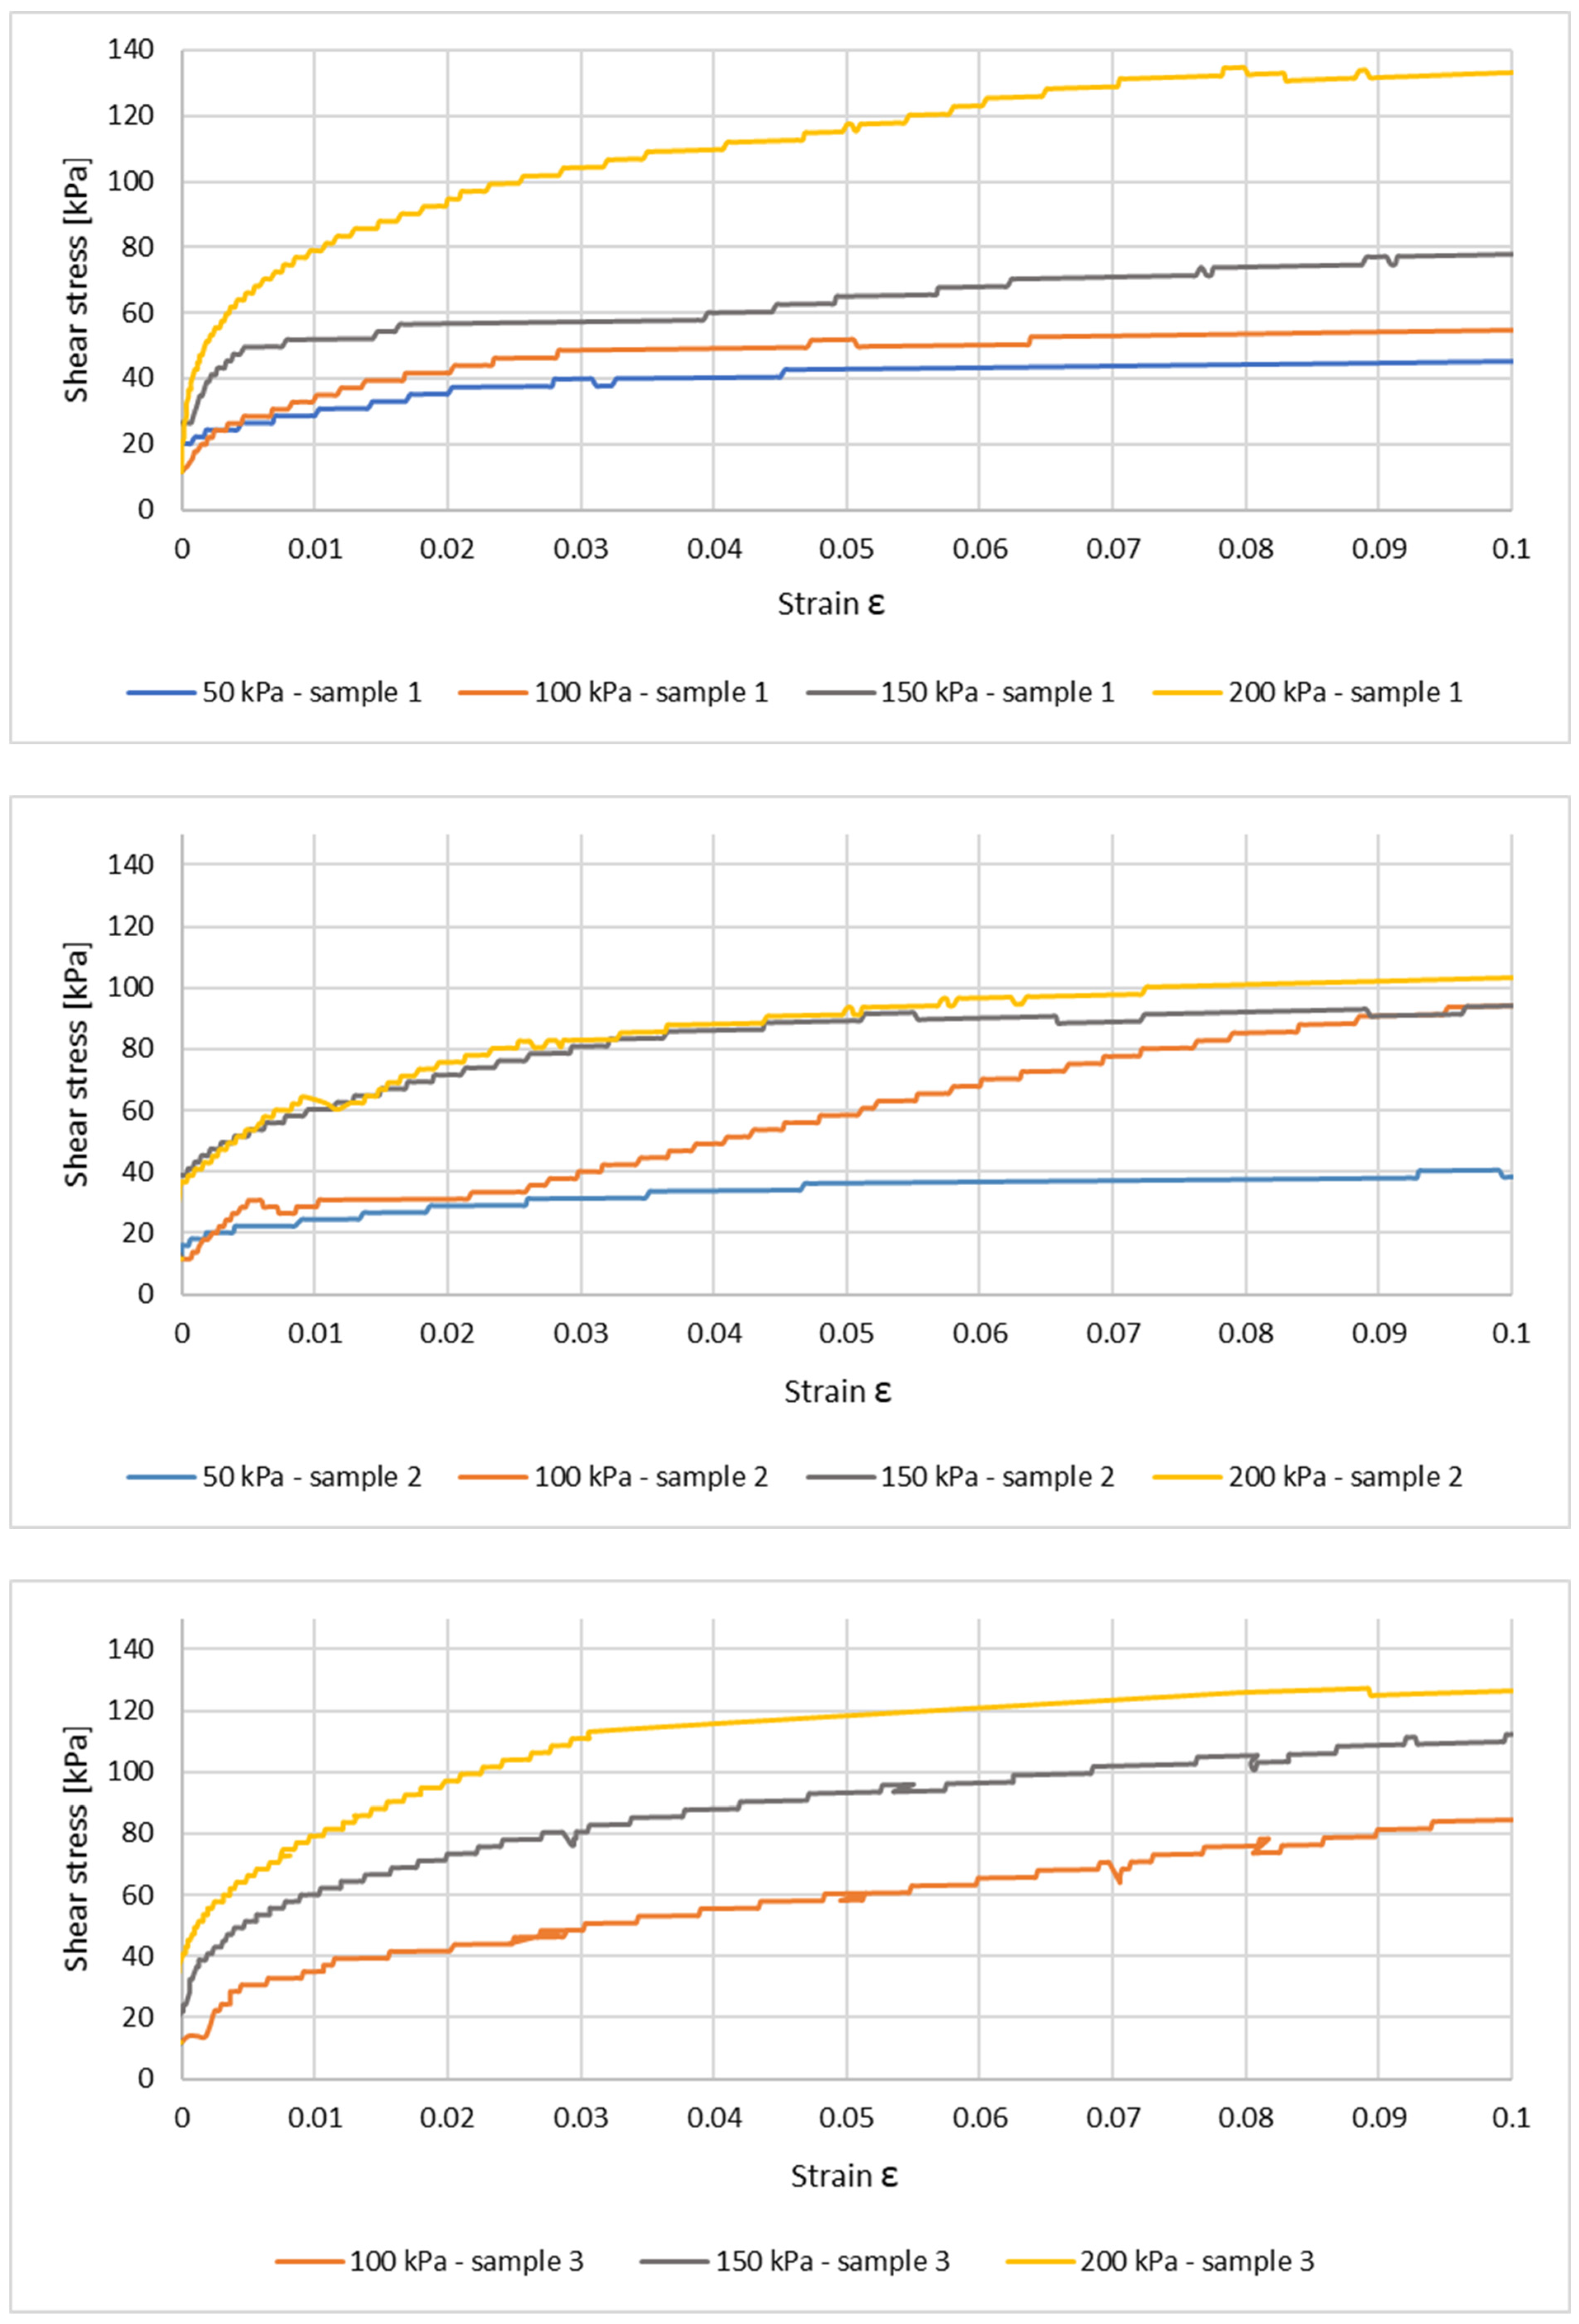
In each series of tests, an increase in shear stress causing deformation of the specimen was observed at higher values of vertical stress, confirming the correctness of the measurements (Figure 4). Moreover, the higher the applied vertical stress, the greater the shearing force required from the machine piston to induce horizontal deformation of the specimen (moving the carriage in which the specimen is placed). In Figure 4, this is evident at the points where specimen deformation begins (points with zero deformation but shear stress values greater than zero).
The shape of the stress–strain curves indicates that the failure process is gradual. The τ(ε) curve does not reach a maximum within the strain range up to 10%, and no clear failure is observed. A distinct peak strength, after which strain softening would occur, was not reached. In the initial phase of the test, particles are connected by cohesive forces and partially by capillary forces. After overcoming the initial shear resistance, the shear force increases almost linearly. Shear stresses are distributed throughout the entire volume of the sample. Initially, the resulting deformations are elastic, and the soil’s continuous structure is preserved, with interparticle bonds only being stretched.
As shear forces increase, the nature of the deformations becomes plastic, causing local cracks in the central part of the sample. In the tested samples, no stabilized failure zone was formed. The test was carried out up to a horizontal strain of 10%, and according to [16], the value corresponding to 10% strain was taken as the maximum shear stress.
The average increase in shear stress at a vertical stress of 50 kPa was 43.14 kPa, with a coefficient of variation of 5.42%. In tests conducted at a vertical stress of 100 kPa, the average shear stress increased to 77.87 kPa (with a coefficient of variation of 21.56%). In further tests at vertical stresses of 150 kPa and 200 kPa, the average shear stress increased to 94.82 kPa and 121.84 kPa, respectively, with coefficients of variation of 14.95% and 11.05%. This analysis indicates that the stress–strain curves presented in Figure 4 show a clear correlation between the increase in shear stress and the corresponding increase in vertical stress. Furthermore, the coefficients of variation do not exceed 25%, which, according to [47,48,49], indicates low variability of the results. The maximum shear stress values obtained in individual tests, along with the corresponding statistical measures, are summarized in Table 4.
Analysis of the individual graphs presented in Figure 4 shows that sample failure generally occurs as a result of shear band formation, with the exception of the CS sample tested in series 2 at a normal stress of 100 kPa. The shape of the stress–strain curve for this sample indicates slippage in the strain range of 0.005–0.027. It is possible that as a result of this slippage, particles and larger grains changed their positions and became interlocked, leading to the significant increase in tangential stresses observed later in the test.
Furthermore, in series 2, very similar critical shear stress values were obtained for specimens with different applied vertical stresses, σn = 100 kPa and σn = 150 kPa, respectively (Figure 3). Such results could be due to the specimen sheared at σn = 100 kPa being much stronger than the others, or the specimen sheared at σn = 150 kPa being much weaker. Analysis of the stress-dependence diagram τ(σ) shown in Figure 3, and the shape of the curve for the sample with σn = 100 kPa (based on the trend of the tangential stress values obtained), suggests that the first situation is more likely: the specimen sheared at σn = 100 kPa was indeed stronger.
Despite maintaining consistency in the sample preparation method (same compaction, moisture content, sample size, as well as test duration and rate), the cohesion values obtained in individual test series show considerable variation. The calculated coefficient of variation, with a standard deviation of 12.41 kPa, was 58.73%, which, according to the classification in [47,48,49], indicates strong variability of this parameter (Table 5). In the case of the internal friction angle, the coefficient of variation was 16.73%, indicating low variability of this parameter within the individual series.

3.2. Primary and Recompression Modulus of Compressibility Determination

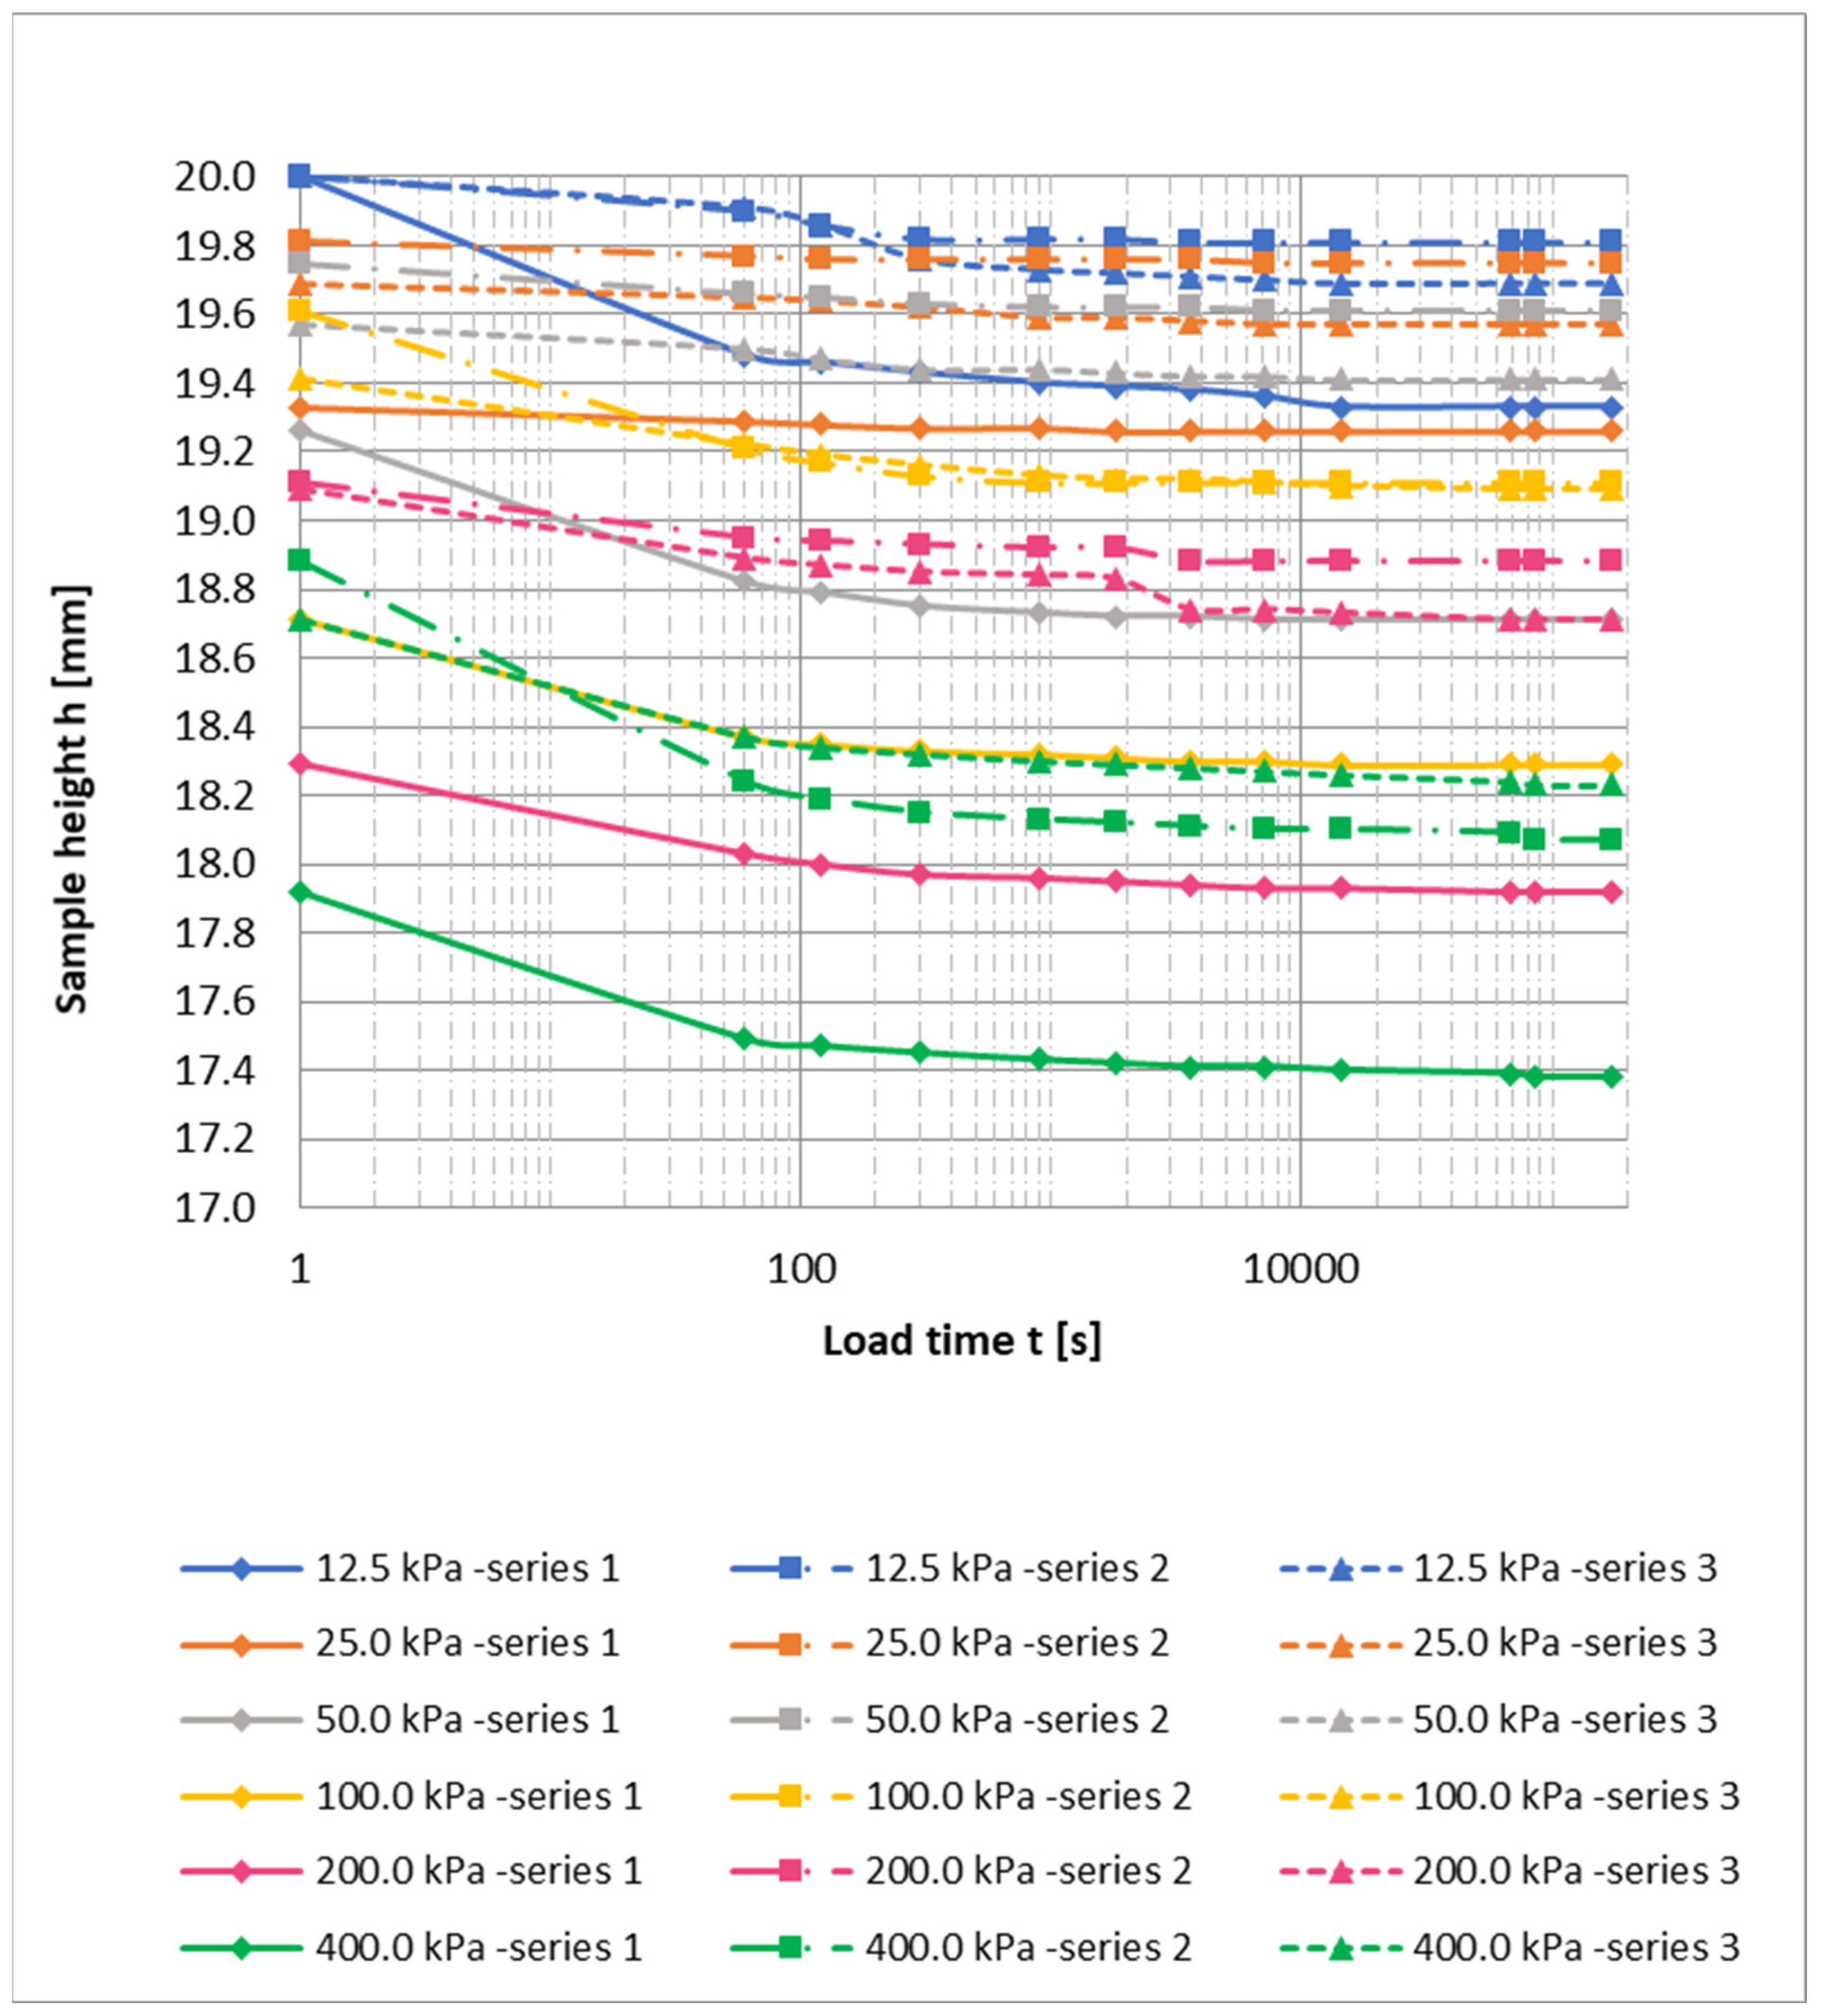
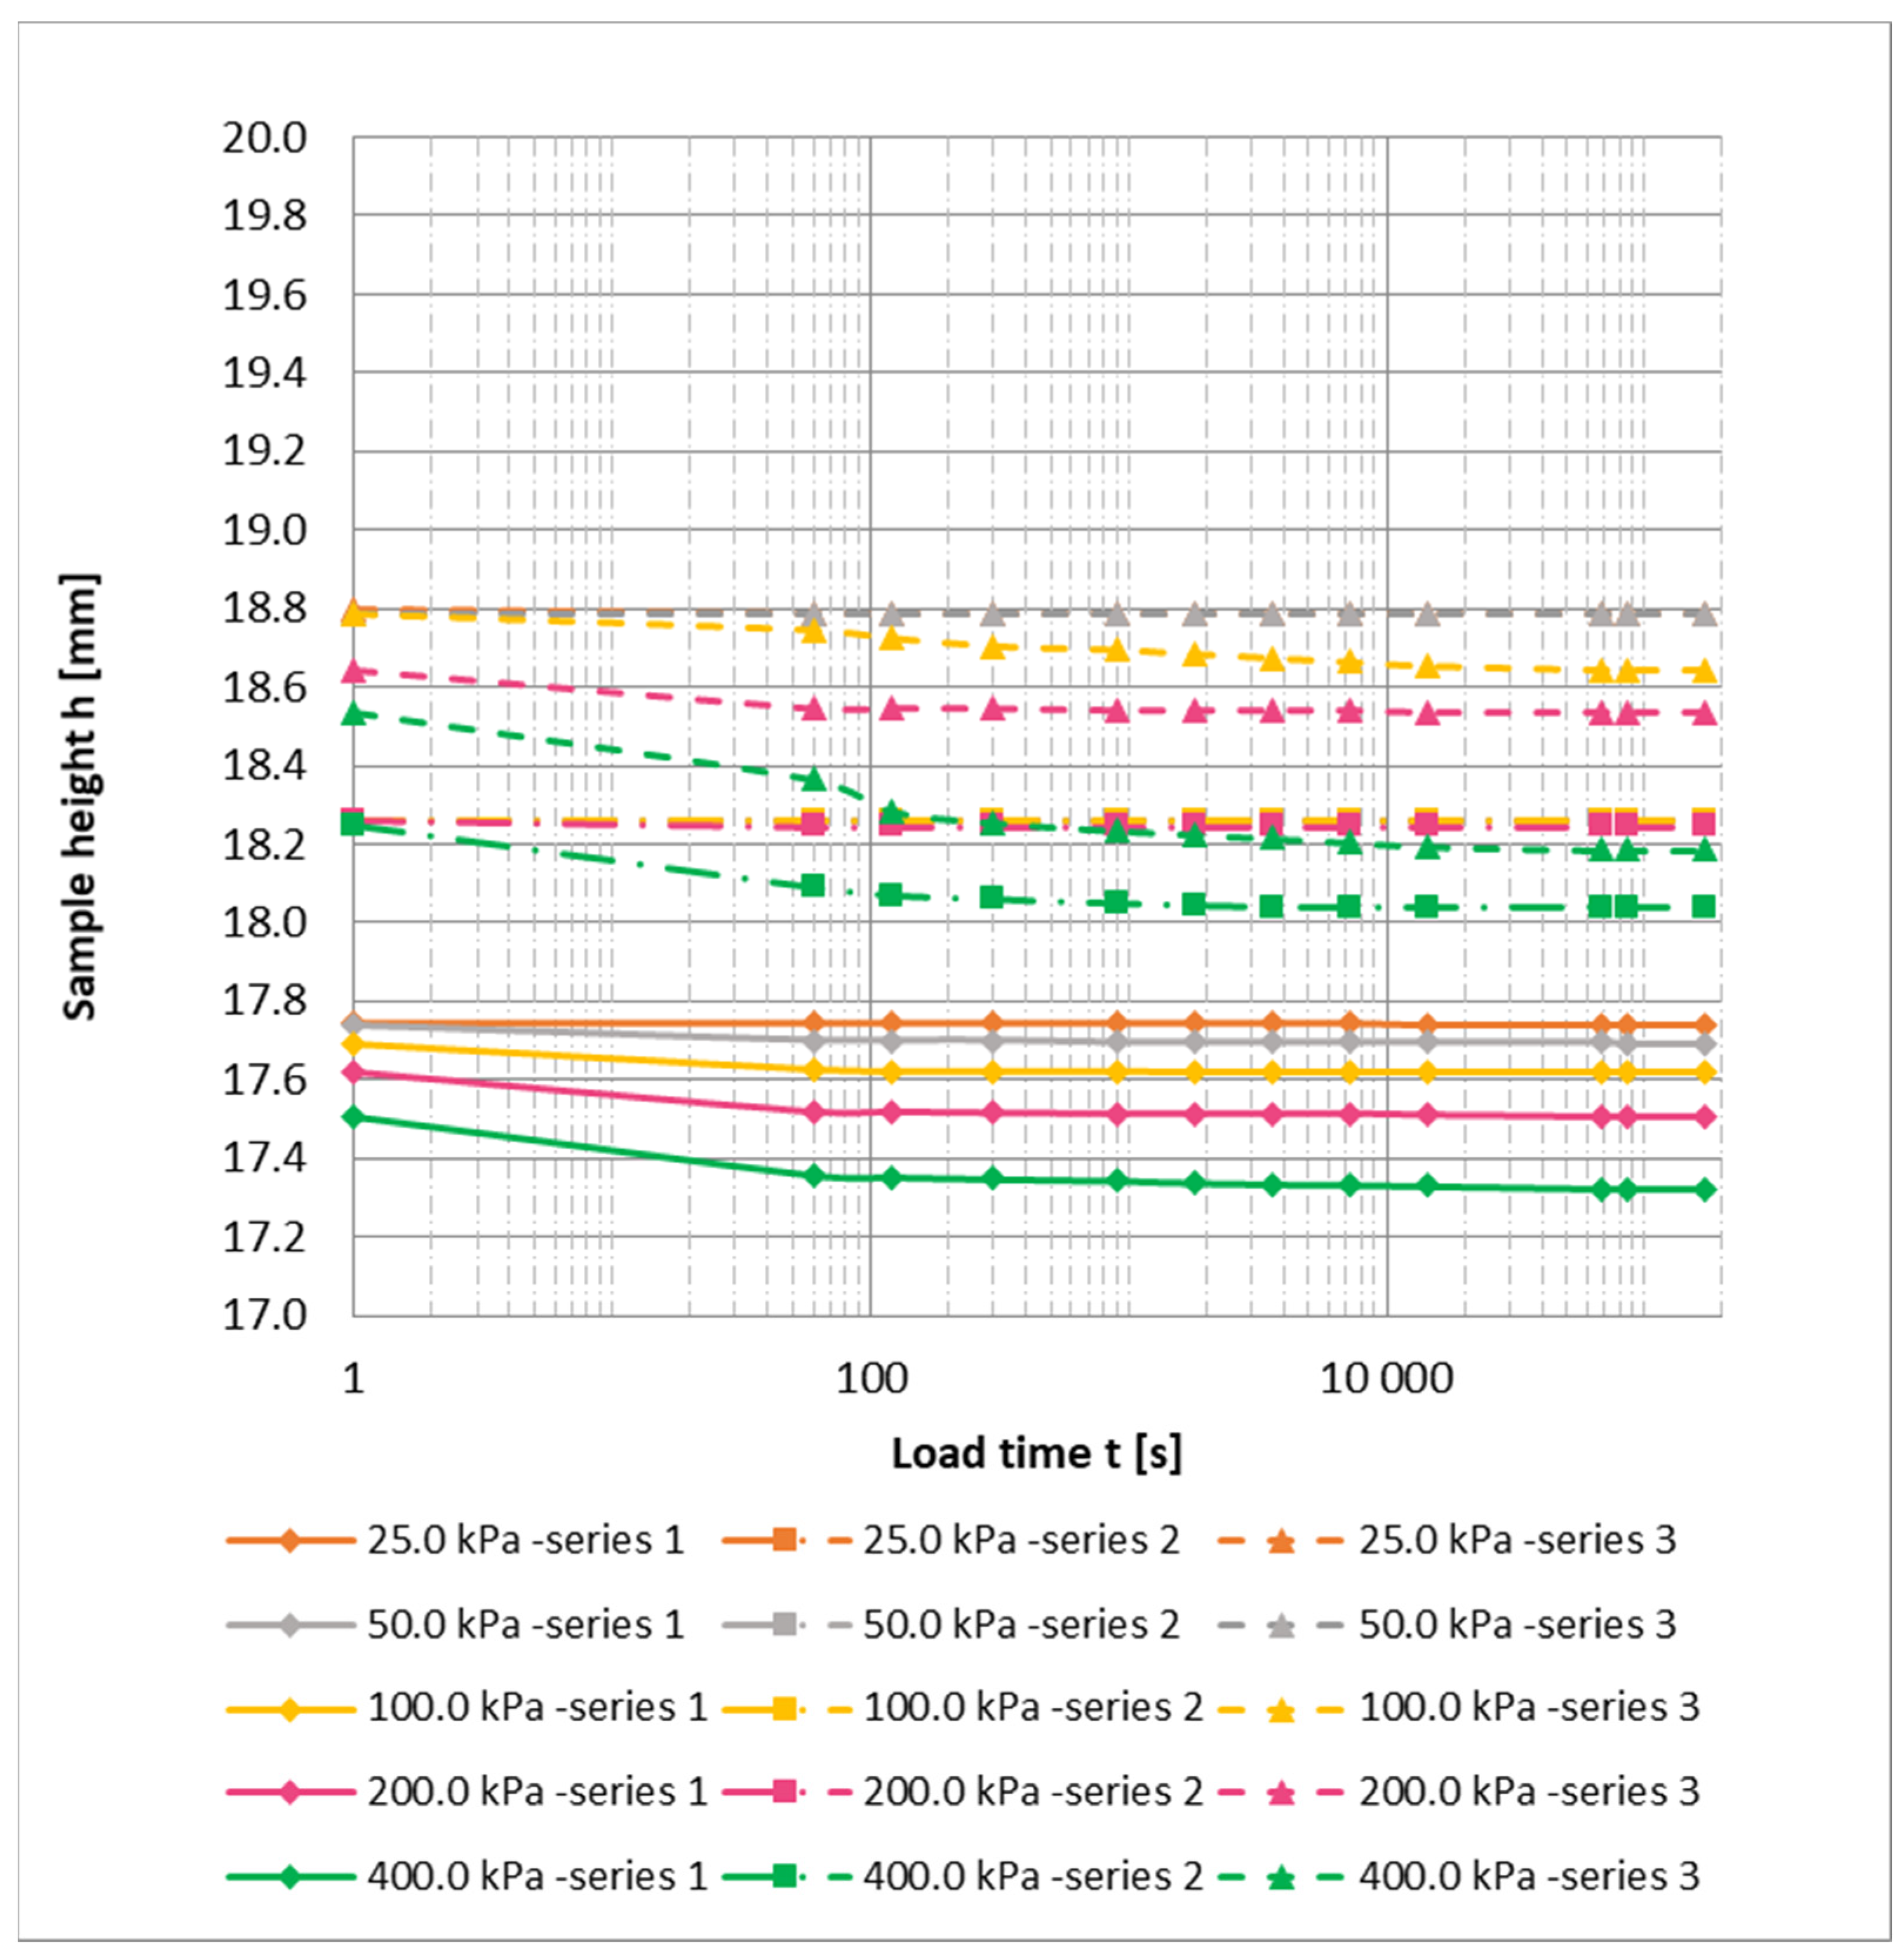
Compressibility testing of the coal sludge was carried out simultaneously on three samples. The shape of the consolidation curves differs significantly from those derived from theoretical considerations presented in [50,51]. A distinct change in the shape of the curves was observed at successive loading stages (Figure 5). Despite identical sample preparation procedures and identical loading thresholds, differences in settlement behavior were evident.
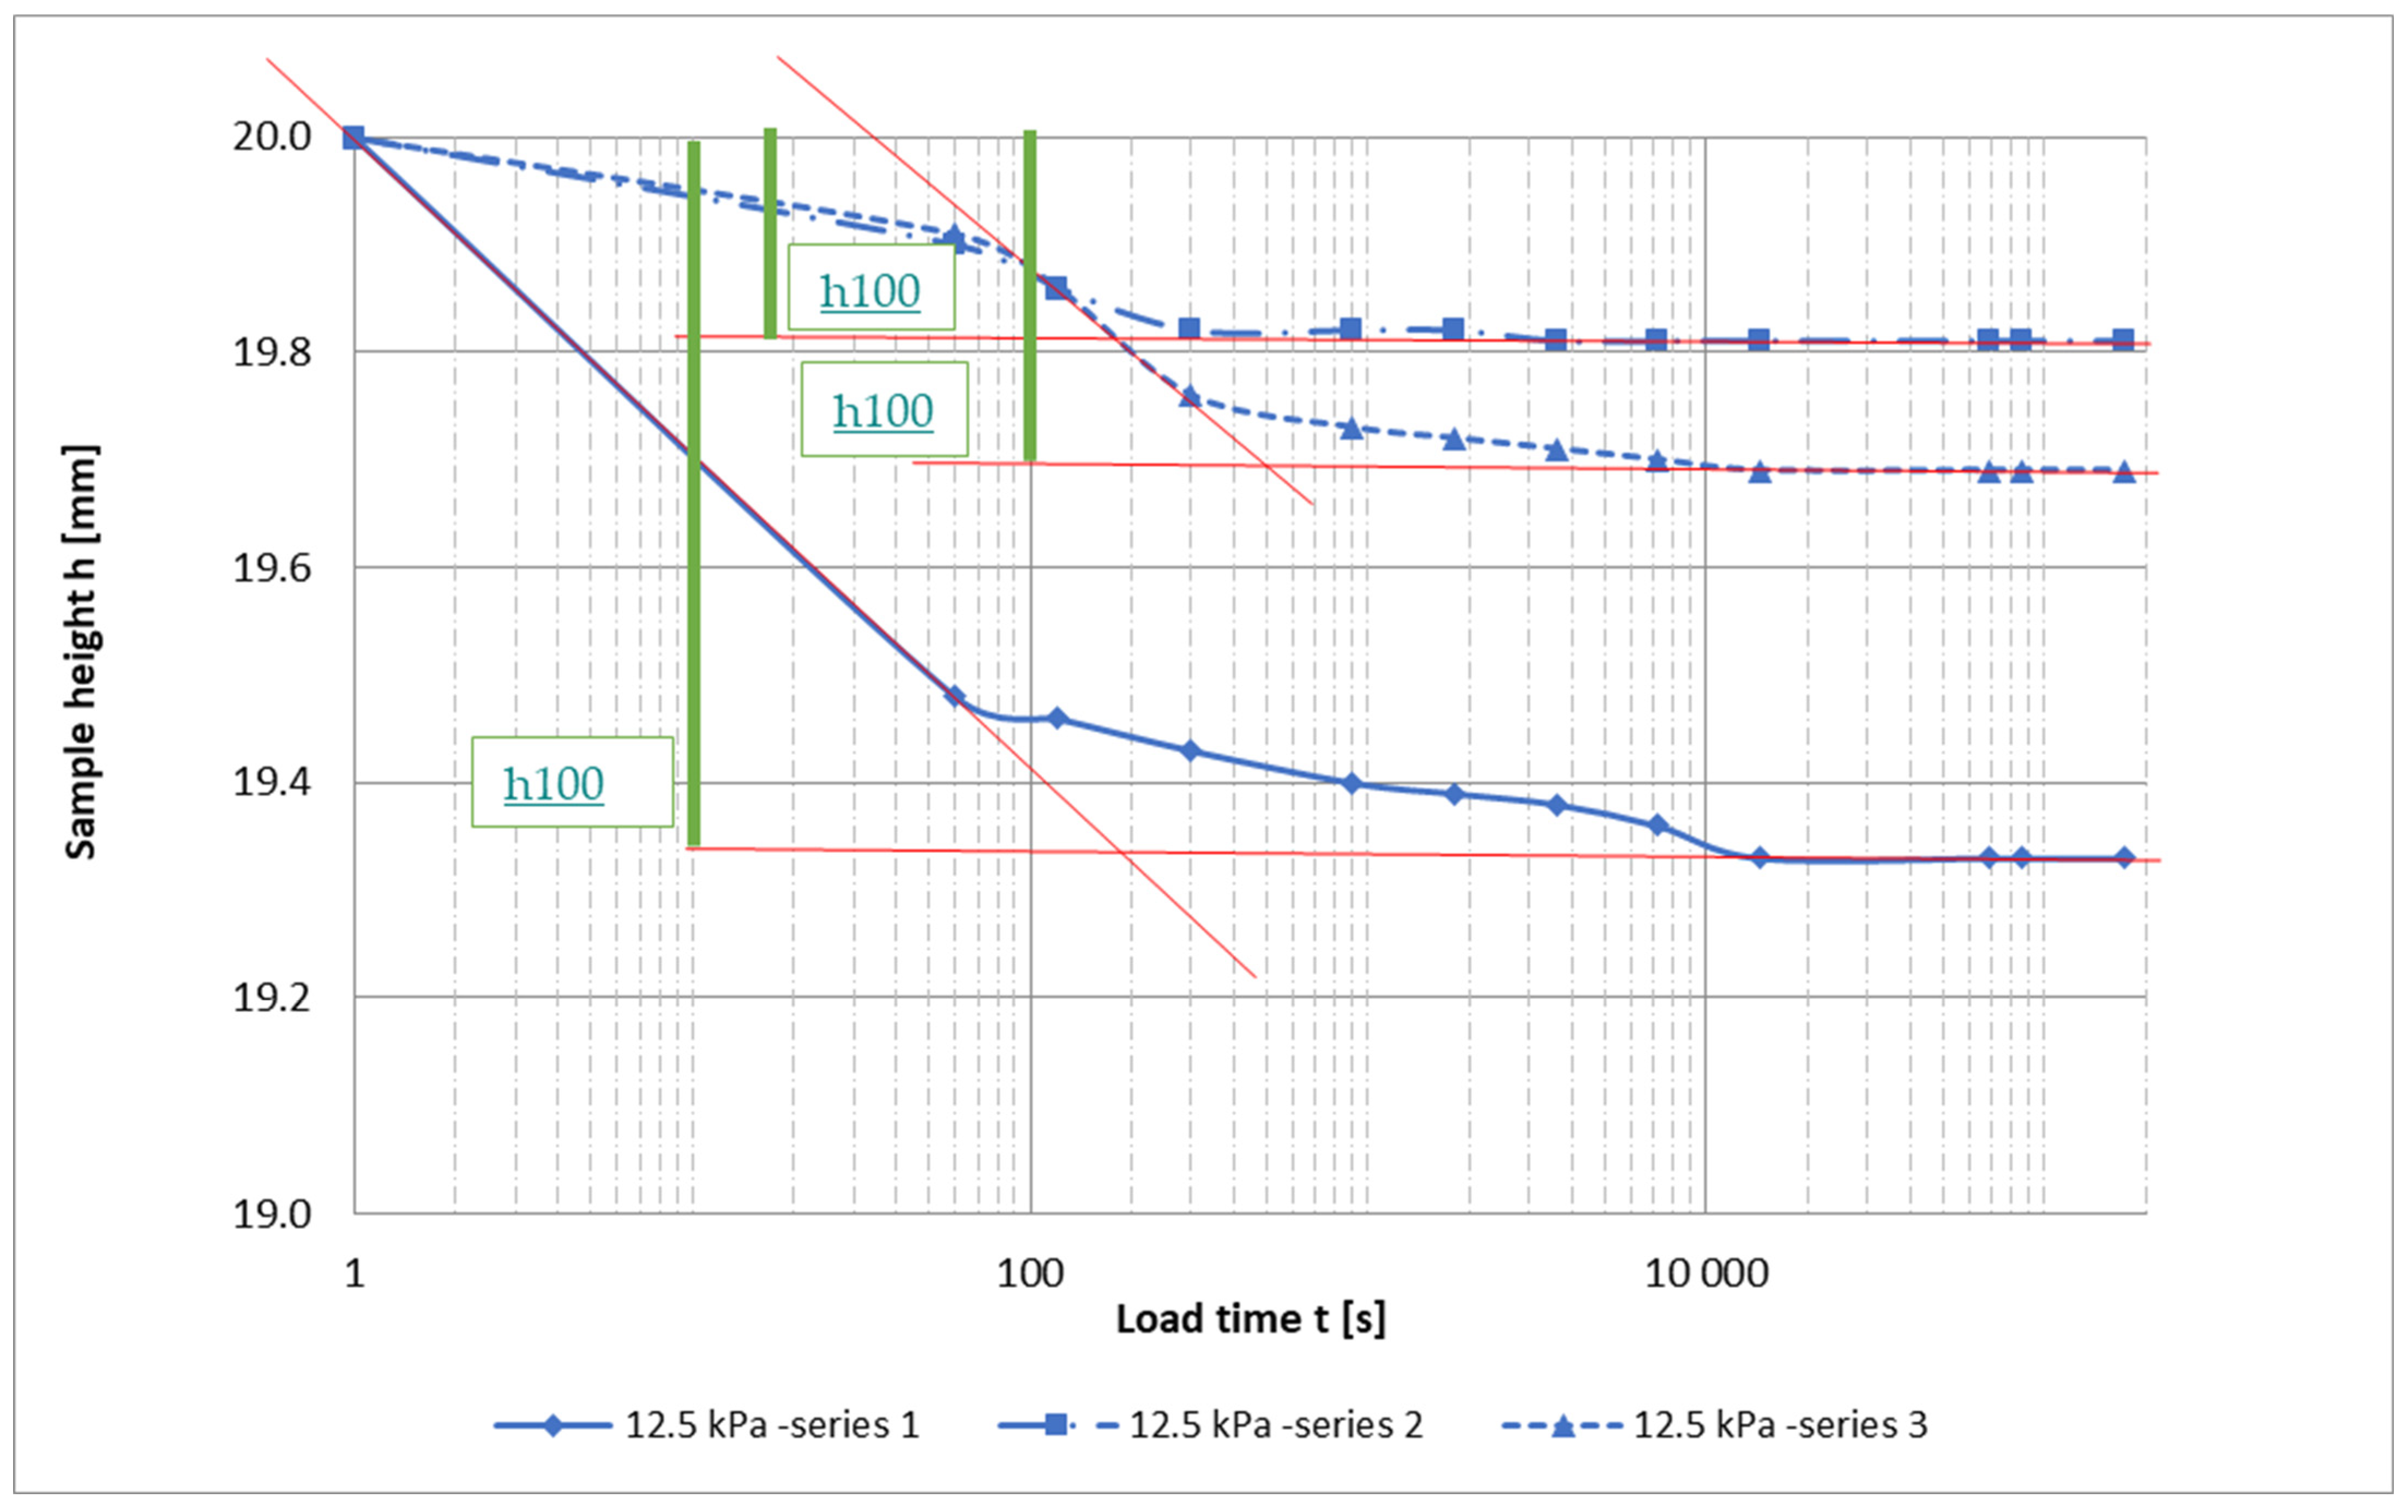
The classical soil consolidation curve is characterized by three phases of deformation: phase I–immediate settlement, phase II–primary (filtration) consolidation, and phase III–secondary (structural) consolidation [52]. The boundary between immediate and primary consolidation (within the first 60 s of the test) is clearly visible during the initial loading stage (12.5 kPa) for samples CS2 and CS3. Sample CS1 exhibited the highest compressibility (3.35% reduction in thickness), with a less distinct transition between the immediate and primary consolidation phases (Figure 6).
For the above specimens, the h100 point, representing the onset of the third phase of consolidation (secondary consolidation), was determined from the shape of the consolidation curves. For samples CS1 and CS2, the third phase begins approximately 200 s into the test, while for sample CS3 it occurs about 300 s later. The reduction in soil volume during structural consolidation is associated with the migration of part of the free water molecules into more strongly bound water zones. As the sample is loaded, soil particles move closer together, increasing interparticle attraction (a phenomenon known as structural creep, related to the colloidal fraction of the soil) [50]. In accordance with the recommendations of [50], testing at each loading stage was continued until the slope of the consolidation curve reached a value of 0.01 mm per 500 min.
An increase in load by an additional 12.5 kPa (second loading stage) resulted in only minor changes in the height of the individual samples (sample CS1–0.07 mm, CS2–0.06 mm, CS3–0.16 mm). This behavior can be attributed to the fact that most of the large pores had already been compressed during the previous consolidation stage, and a considerably higher load was required to expel water from the remaining smaller pores. This observation is confirmed by the subsequent stages of the test, where a further reduction in sample thickness was recorded with each successive loading increment (Figure 5).
The differentiated course of the consolidation curves among the samples persisted throughout the following loading stages. A common feature observed in all tested specimens was the gradual blurring of the boundary between the immediate and primary (filtration) consolidation phases. The most significant changes in sample volume occurred during the filtration consolidation phase, corresponding to water expulsion from the samples and the consequent reduction in pore volume.
The longest consolidation times for samples CS1 and CS3 were recorded during the second loading step (25 kPa), during which the reduction in thickness was also the smallest. In contrast, settlements in sample CS2 stabilized much faster at most load stages, except at 50 kPa, where the longest consolidation time was observed for this sample.
The values of the primary compressibility moduli at successive loading stages (Table 6) and calculated for them coefficient of variation (Table 7) show alternating increases and decreases in this parameter. These fluctuations reflect, to some extent, the mechanism governing the behavior of coal sludge samples during the compression process. In the first loading stage (12.5 kPa), a strong variation (V = 46.58%) in the primary compressibility modulus values was observed, which is associated with deformations resulting from the presence of organic matter and clay minerals. In the second loading stage (25 kPa), a decrease in the compressibility of the samples is attributed to the presence of SiO2, which begins to restrict excessive deformation. According to the adopted classification [47,48,49], the variability of the primary compressibility modulus values can be described as “moderate”.
An additional increase in load by 25 kPa causes compression of the clay matrix and carbonaceous particles, accompanied by significant variability (V = 46.37%) in the M0 values. In the subsequent stages of the test, a more uniform response of the samples is observed, as reflected in the reduction in the coefficient of variation. Within the load range of 0–400 kPa, the coefficient of variation reaches V = 15.98%, which indicates low variability of the primary compressibility modulus.
Recompression of the coal sludge samples (Figure 7) showed a significantly smaller increase in displacement. The least compressible sample was CS2, in which noticeable deformations occurred only after a load of 200 kPa was applied. For the recompression of the other specimens, thickness reduction began after exceeding a load threshold of 50 kPa, with the values for sample CS3 being approximately twice those of CS1. Maximum vertical displacements in CS3 occurred at a load of 400 kPa, reaching 0.21 mm. For the remaining samples, displacements were generated after each successive load threshold was exceeded, with their magnitude increasing with increasing applied stress. The highest vertical deformations were also observed under a vertical stress of 400 kPa. The values of the primary and recompression compressibility moduli are summarized in Table 6.
The absence of settlement in sample CS2 during the initial stages of secondary loading indicates that this sample exhibited greater stiffness. The lack of compressibility suggests that it may contain a higher proportion of SiO2 particles compared to the other samples. Once the load threshold of 200 kPa was exceeded, rheological processes associated with the presence of organic particles in the analyzed sample became activated. In contrast, for samples CS1 and CS3, the viscoelastic properties typical of mineral–organic mixtures were activated at the beginning of the test and intensified with each subsequent loading stage.
The calculated coefficient of variation confirms these observations. Within the lower load range, up to 200 kPa, the difference between samples CS1 and CS3 initially reached approximately 30%, but then decreased to about 5%, indicating only minor differences in settlement at a load of 200 kPa.
The consolidation curves for all three samples demonstrate that at higher loads (after the application of 400 kPa), deformations did not cease. Although the vertical stress remained constant, the samples continued to deform over time. This behavior corresponds to a creep mechanism, a phenomenon characteristic of soils exhibiting rheological properties. While the coefficient of variation for settlement showed in Table 7 within the load range of 0.2–0.4 MPa indicated low variability between samples (V < 25%), the variability observed for secondary compressibility (V = 43.04%) revealed a significant spread of results. This behavior of the tested coal sludge is attributed to the presence of organic matter.
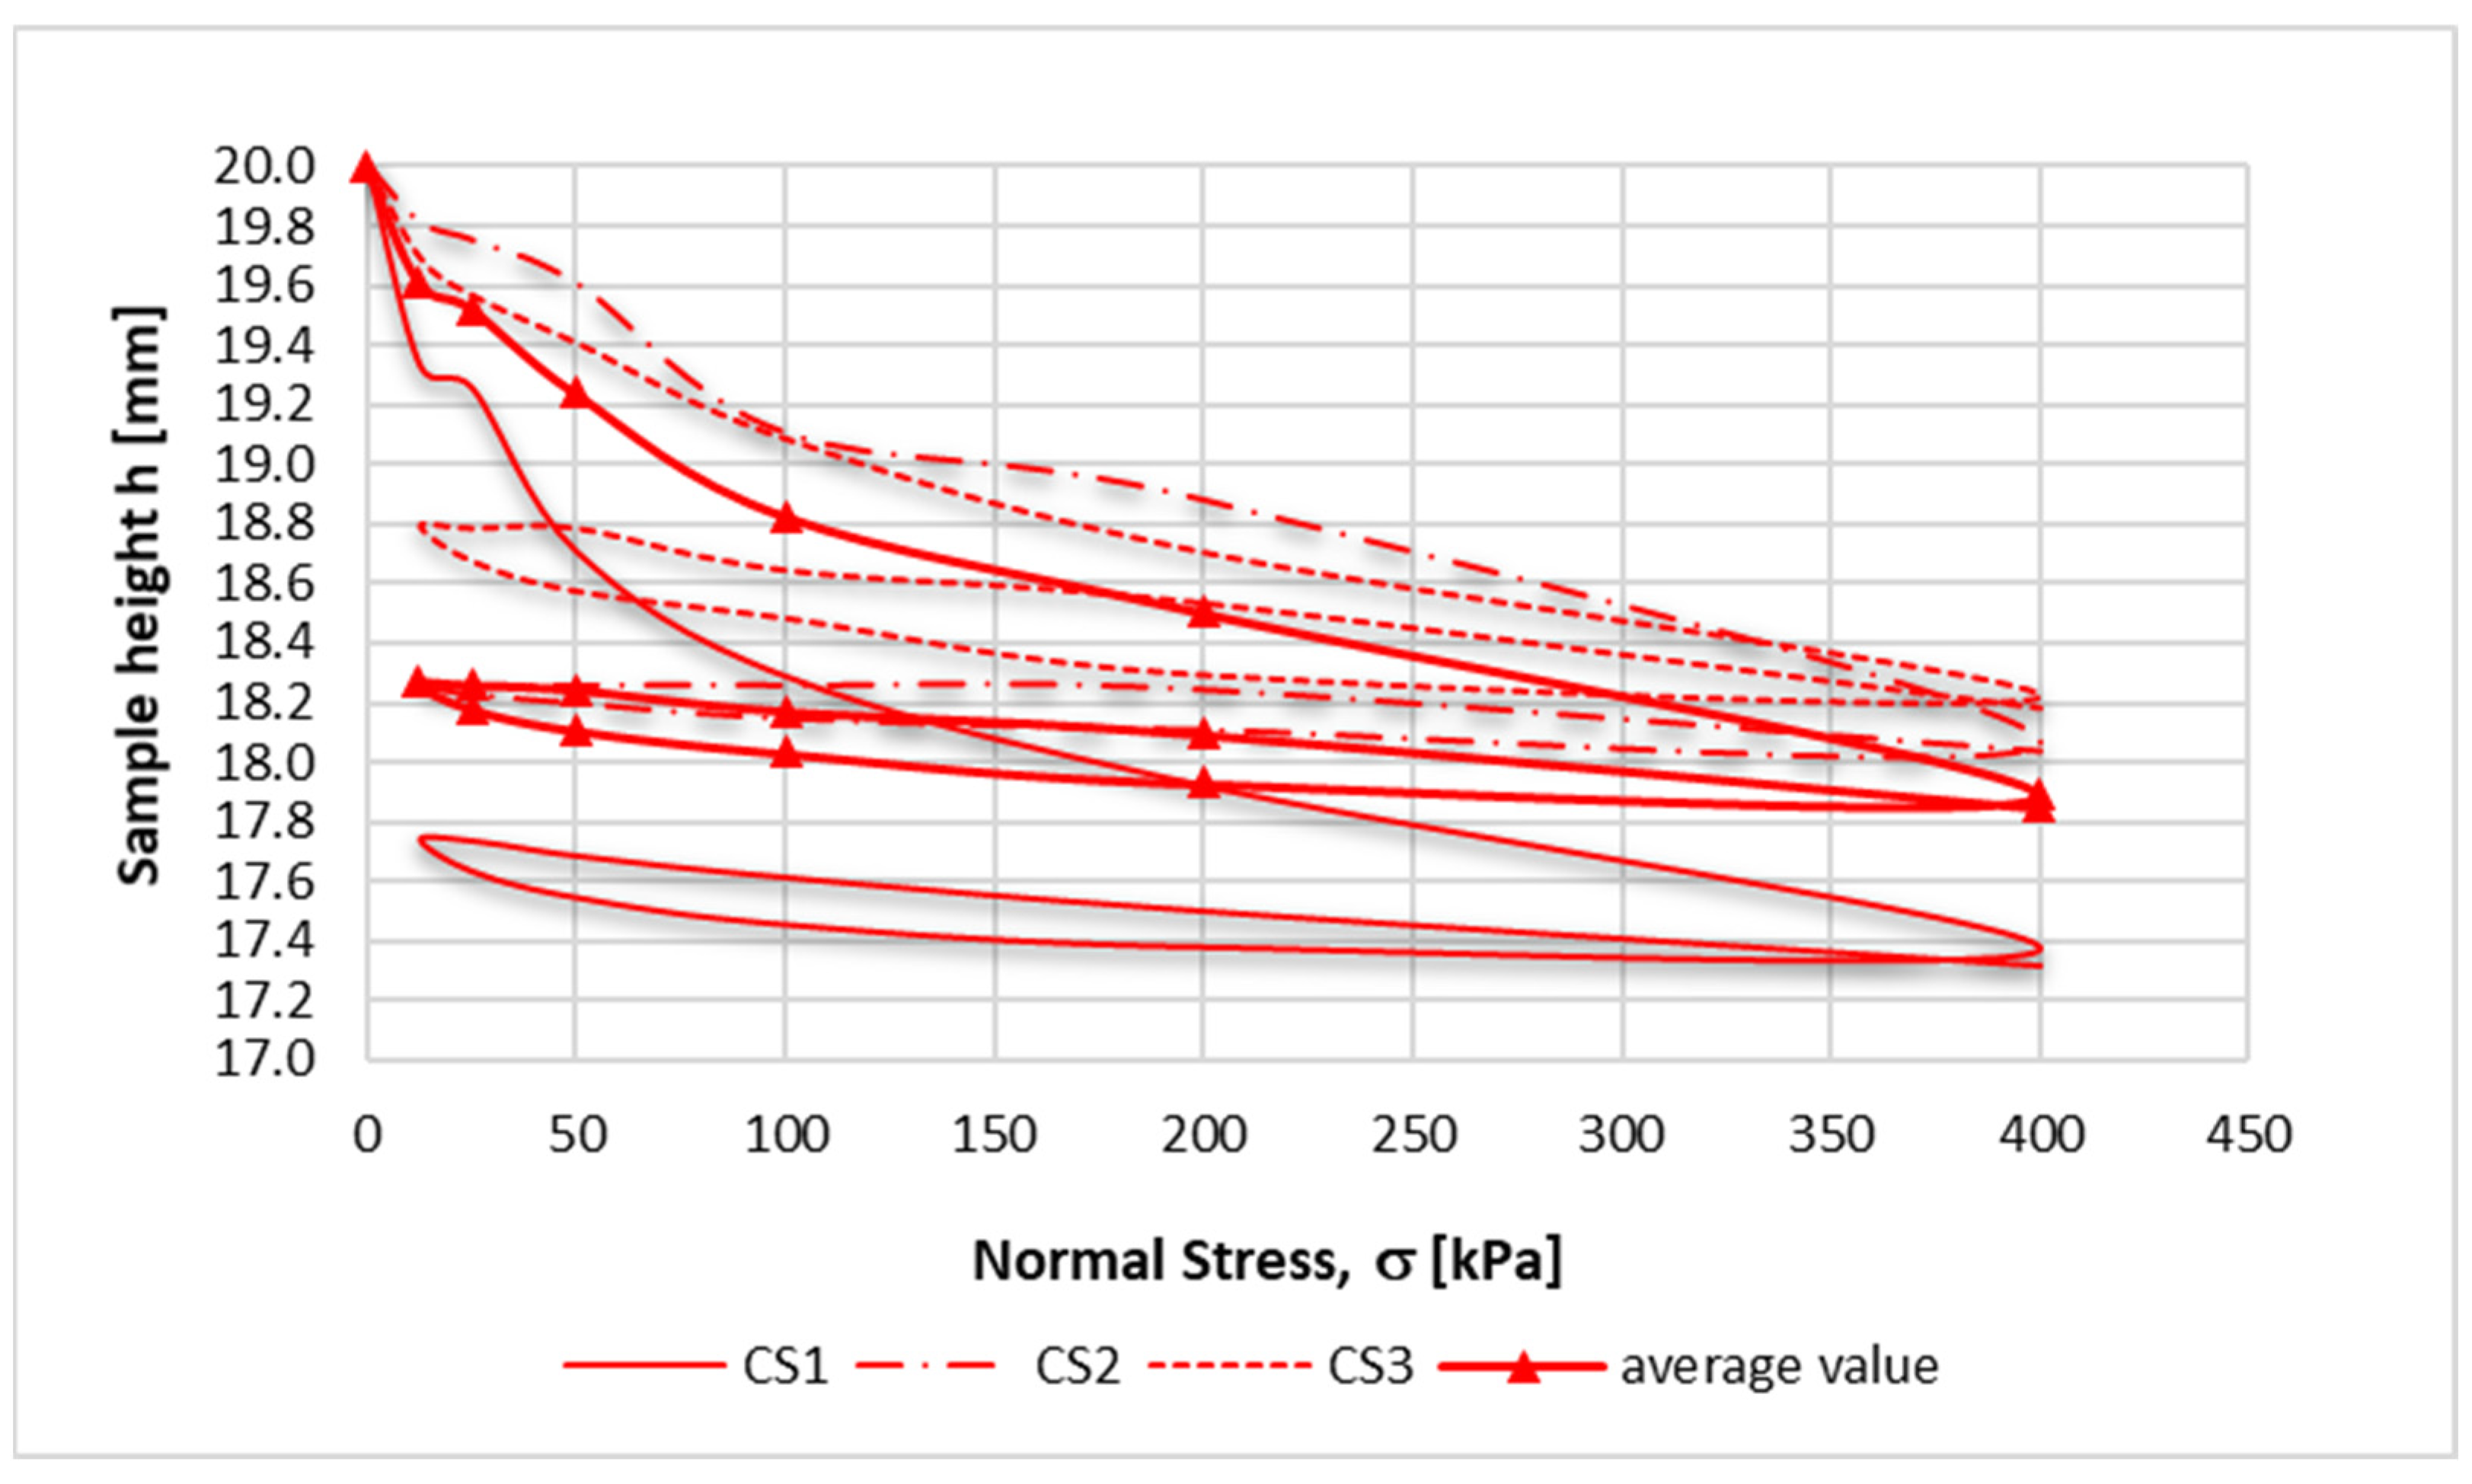
x ¯ x ¯ The above analysis is supported by the summary of the compressibility and swelling curves of the coal sludge presented in Figure 8. The compressibility behavior at different stages of the oedometer test is shown in the primary, swelling, and recompression curves. The primary compressibility curve indicates that sample CS1 is more compressible, particularly during the initial loading stages (0–50 kPa). At higher vertical stresses, the stiffness of sample CS1 increased. The similar shape of the compressibility curves for samples CS2 and CS3 suggests comparable vertical deformation behavior in these specimens. Sample CS2 exhibited the highest compressibility (M00–400 = 4.52 MPa). The most pronounced height changes occurred under a vertical stress of 400 kPa, with the average primary compressibility modulus calculated as M0 = 6.35 MPa. Over the entire loading range of 0–400 kPa, the mean oedometer primary compressibility modulus was 3.91 MPa. After primary consolidation, the average vertical deformation of the coal sludge samples reached approximately 10%.
Recompression loading revealed differences in the behavior of the individual specimens. Sample CS2 demonstrated the highest stiffness (M = 33.2 MPa), while samples CS1 and CS3 showed similar values, namely 16.9 MPa and 12.33 MPa, respectively. The average change in sample height after secondary loading was 0.042 mm, corresponding to an average modulus of M = 20.81 MPa.

4. Discussion

Coal sludge is a heterogeneous material; therefore, it was essential to standardize the sample preparation procedure. For the purposes of the tests, the material was adjusted to its optimum moisture content, and the sample density was set to correspond to the bulk density of the coal sludge, calculated based on the maximum dry density and the optimum moisture content. Furthermore, all tests were conducted under identical conditions. In the direct shear test, the samples were placed in a 6 × 6 cm shear box selected according to the granulometric composition of the coal sludge. Each sample was consolidated for 24 h under a vertical stress corresponding to the normal load applied during shearing. The shear rate was maintained at a constant 0.01 mm/min, and the test was conducted in accordance with [16] up to 10% horizontal strain. In the oedometer test, all samples had identical dimensions corresponding to the oedometer ring, and each subsequent loading step was applied after 24 h. Nevertheless, despite these uniform testing conditions, the obtained results differed.
The granulometric composition of the coal sludge (CS) is analogous to that of silt (siCl) with approximately 60–80% of particles smaller than 0.5 mm. Its chemical composition is dominated by SiO2 (33.5%) and Al2O3 (21%), values consistent with those reported for Polish coal waste. The SiO2/Al2O3 ratio (Ruxton Index = 1.6) indicates that CS behaves as a cohesive, clayey soil rich in aluminosilicate minerals and characterized by low permeability. SEM observations revealed predominantly fine particles (<0.1 mm), sharp-edged coal fragments, and dispersed quartz and feldspar grains embedded in a clayey matrix. XRD analysis confirmed the presence of kaolinite, illite, chlorite, mixed-layer smectite–illite, quartz, micas, feldspar, pyrite, halite, and carbon.
It should be noted that the studies cited [17,31,33], as well as the results of the strength and deformation parameter tests presented in this article, were conducted on material originating from the same mining facility and collected at the same time.
The above characterization of the mineral composition and microstructure of the coal sludge, along with its chemical and granulometric composition, is reflected in the material’s behavior in both the direct shear test and the oedometer test.
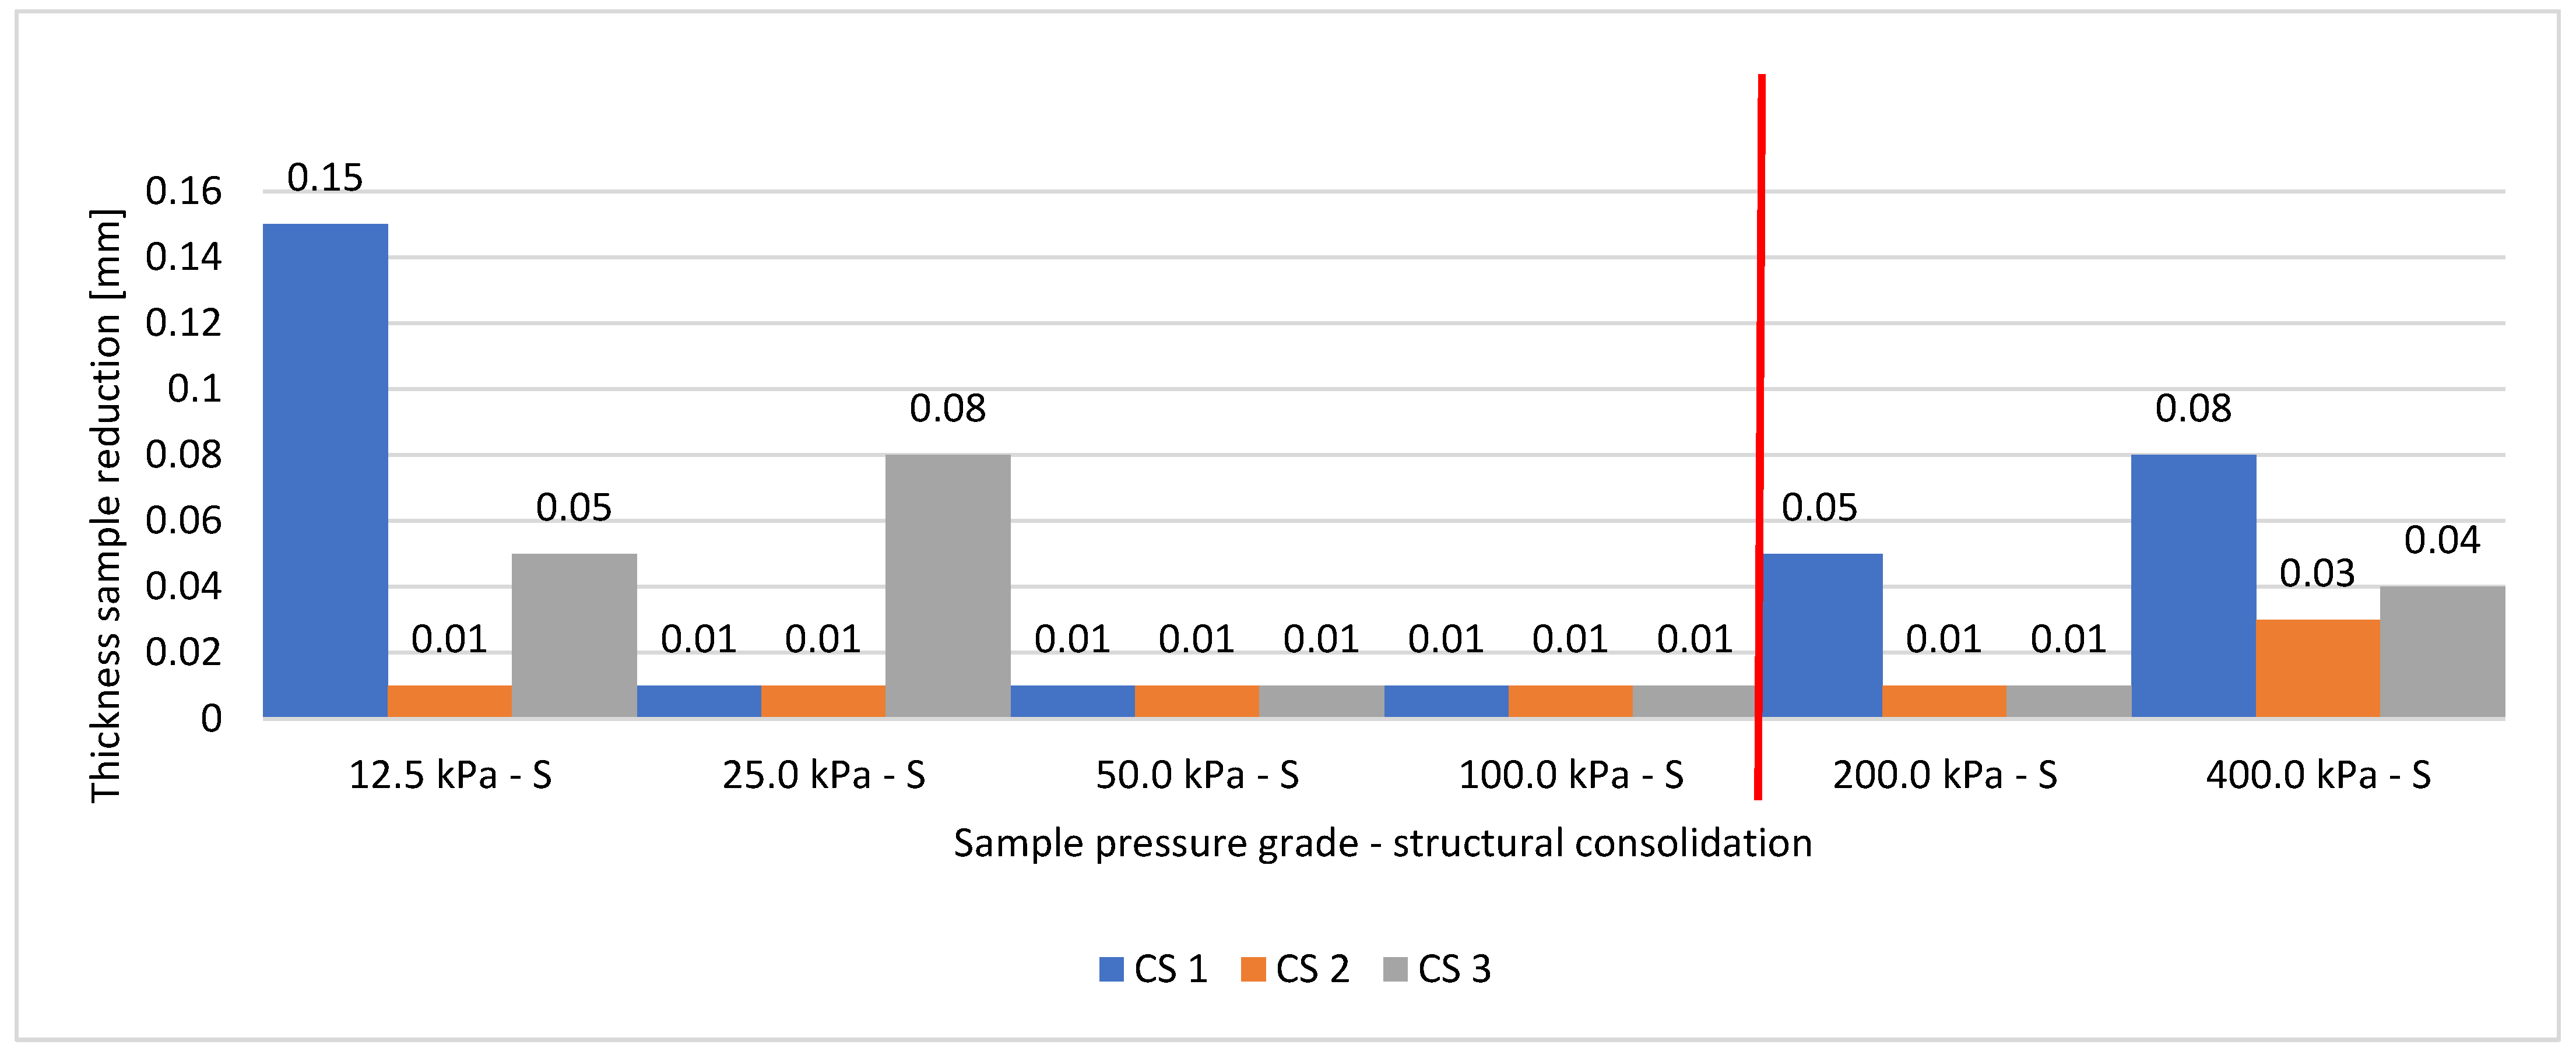
Analysis of the structural consolidation phase in primary compressibility shows that, when the samples are loaded above 100 kPa, the rheological properties of the coal sludge become active (Figure 9). This finding is important, as it indicates the maximum load the material can withstand without initiating creep processes.
The obtained values of the unilateral primary compressibility modulus for the tested coal sludge samples in the load range of 0–100 kPa are between 1.17 and 2.25 MPa. The lowest value was determined for sample CS1, which exhibited the highest compressibility. The compressibility modulus values, M0, for the other two samples (CS2 and CS3) were very similar, at 2.25 MPa and 2.2 MPa, respectively. The average value of M0 is 1.87 MPa.
Due to the approximately 50% organic content of the coal sludge, the obtained primary compressibility moduli were compared with values for organic soils (Table 8). Analysis of the data in Table 8 shows that coal sludge performs better than peat. The minimum compressibility modulus values for coal sludge fall within the upper limit of the reported ranges, while the other results are significantly higher.
The primary compressibility modulus of the studied coal silt, compared to a mixture with a grain-size composition of 34% clay, 59% silt, and 7% sand (M0 = 1053 kPa at 100–200 kPa and 1695 kPa at 200–400 kPa [58]), as well as to bentonite (M0 = 2073 kPa for 0–400 kPa [59]), shows that coal silt has lower compressibility.
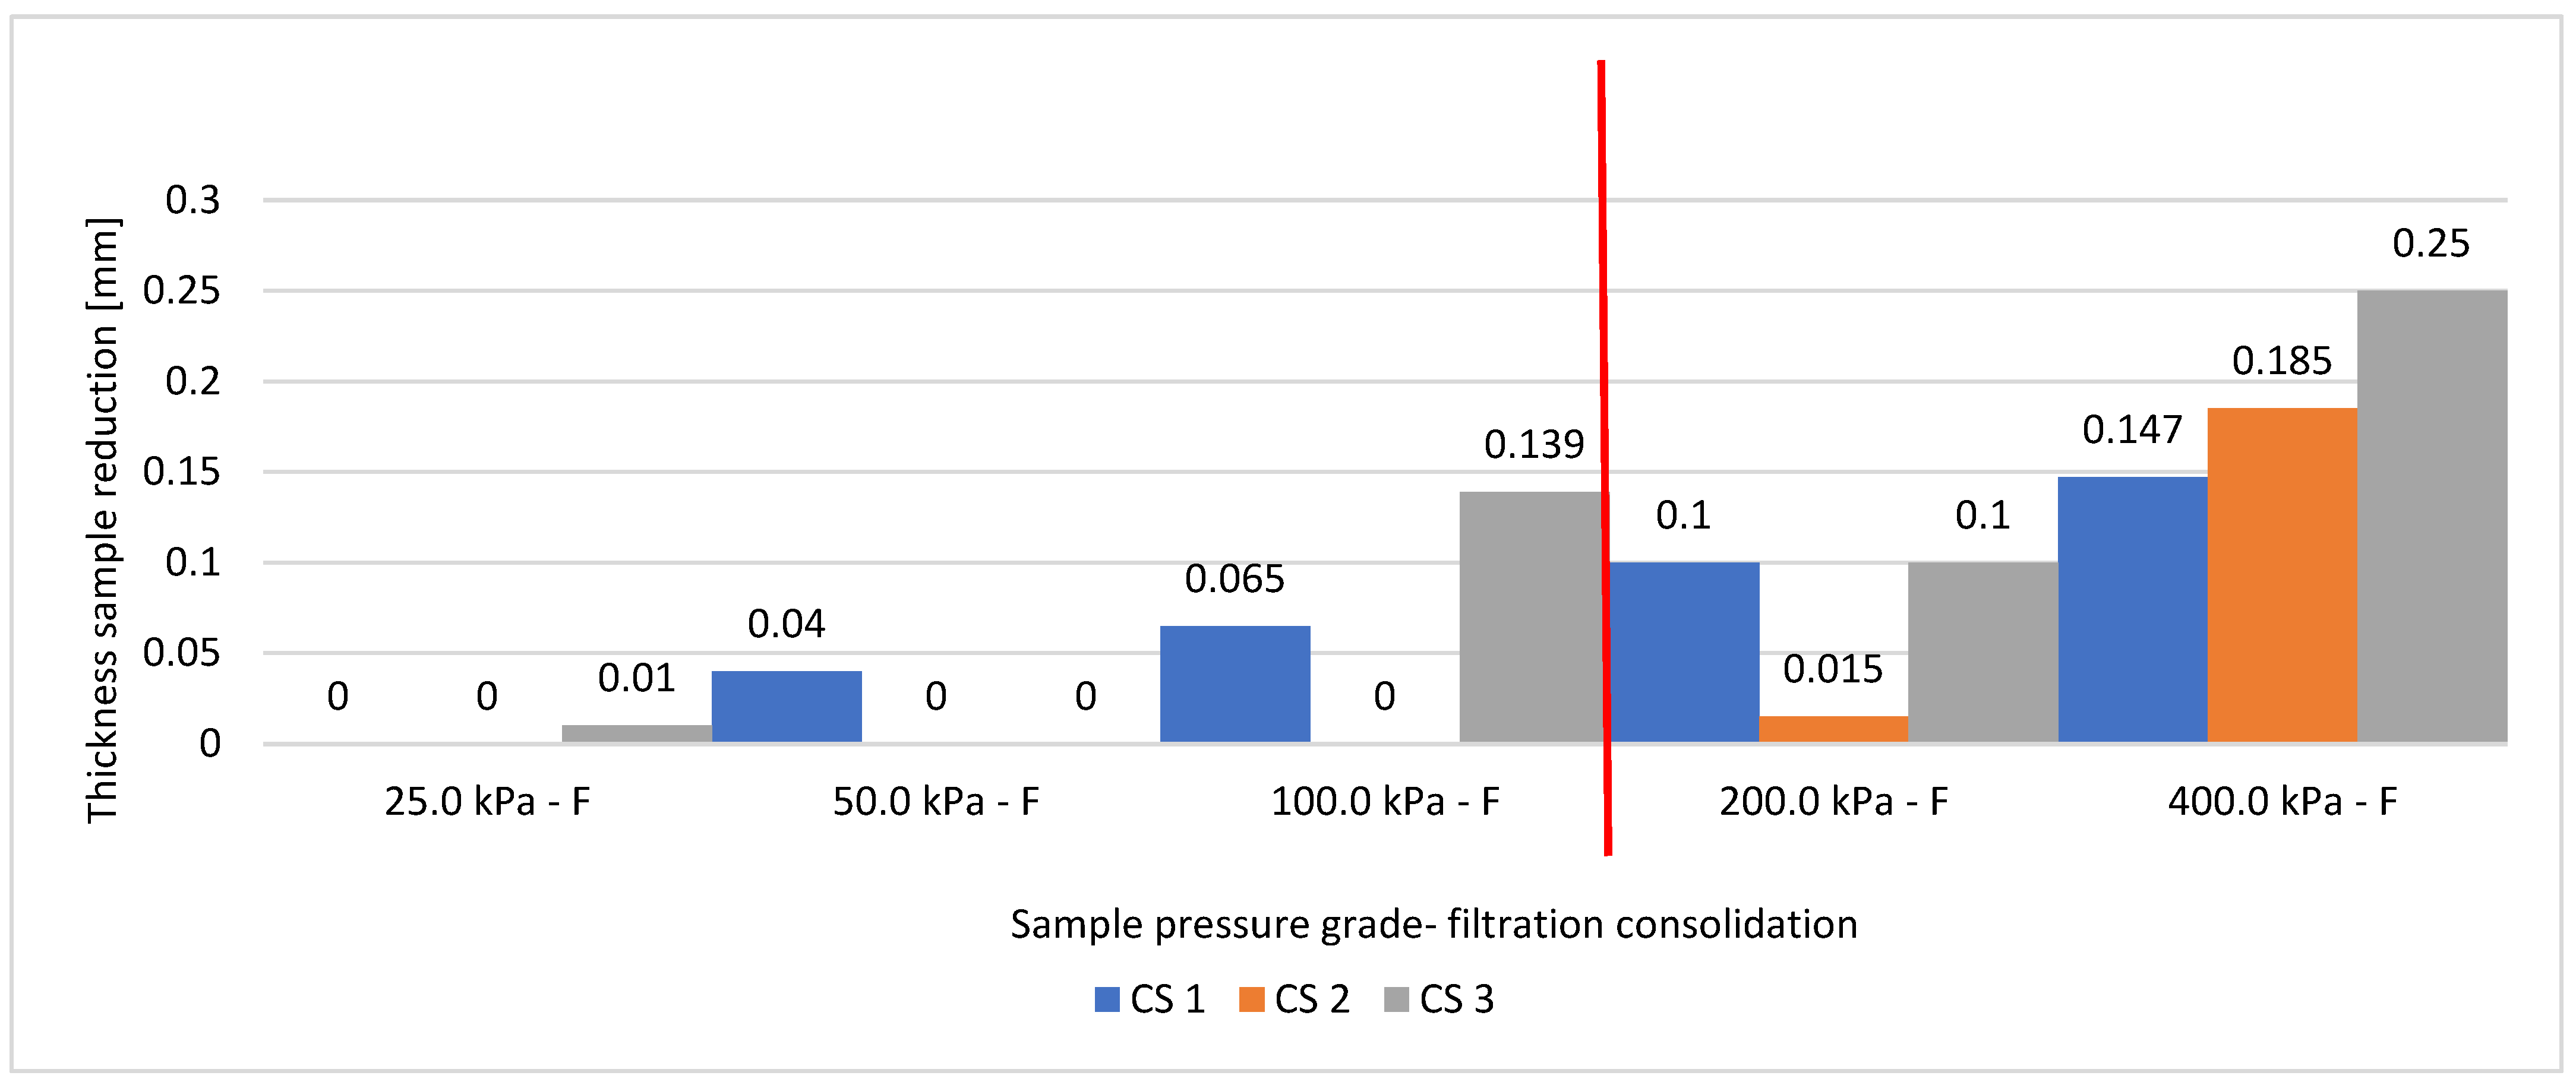
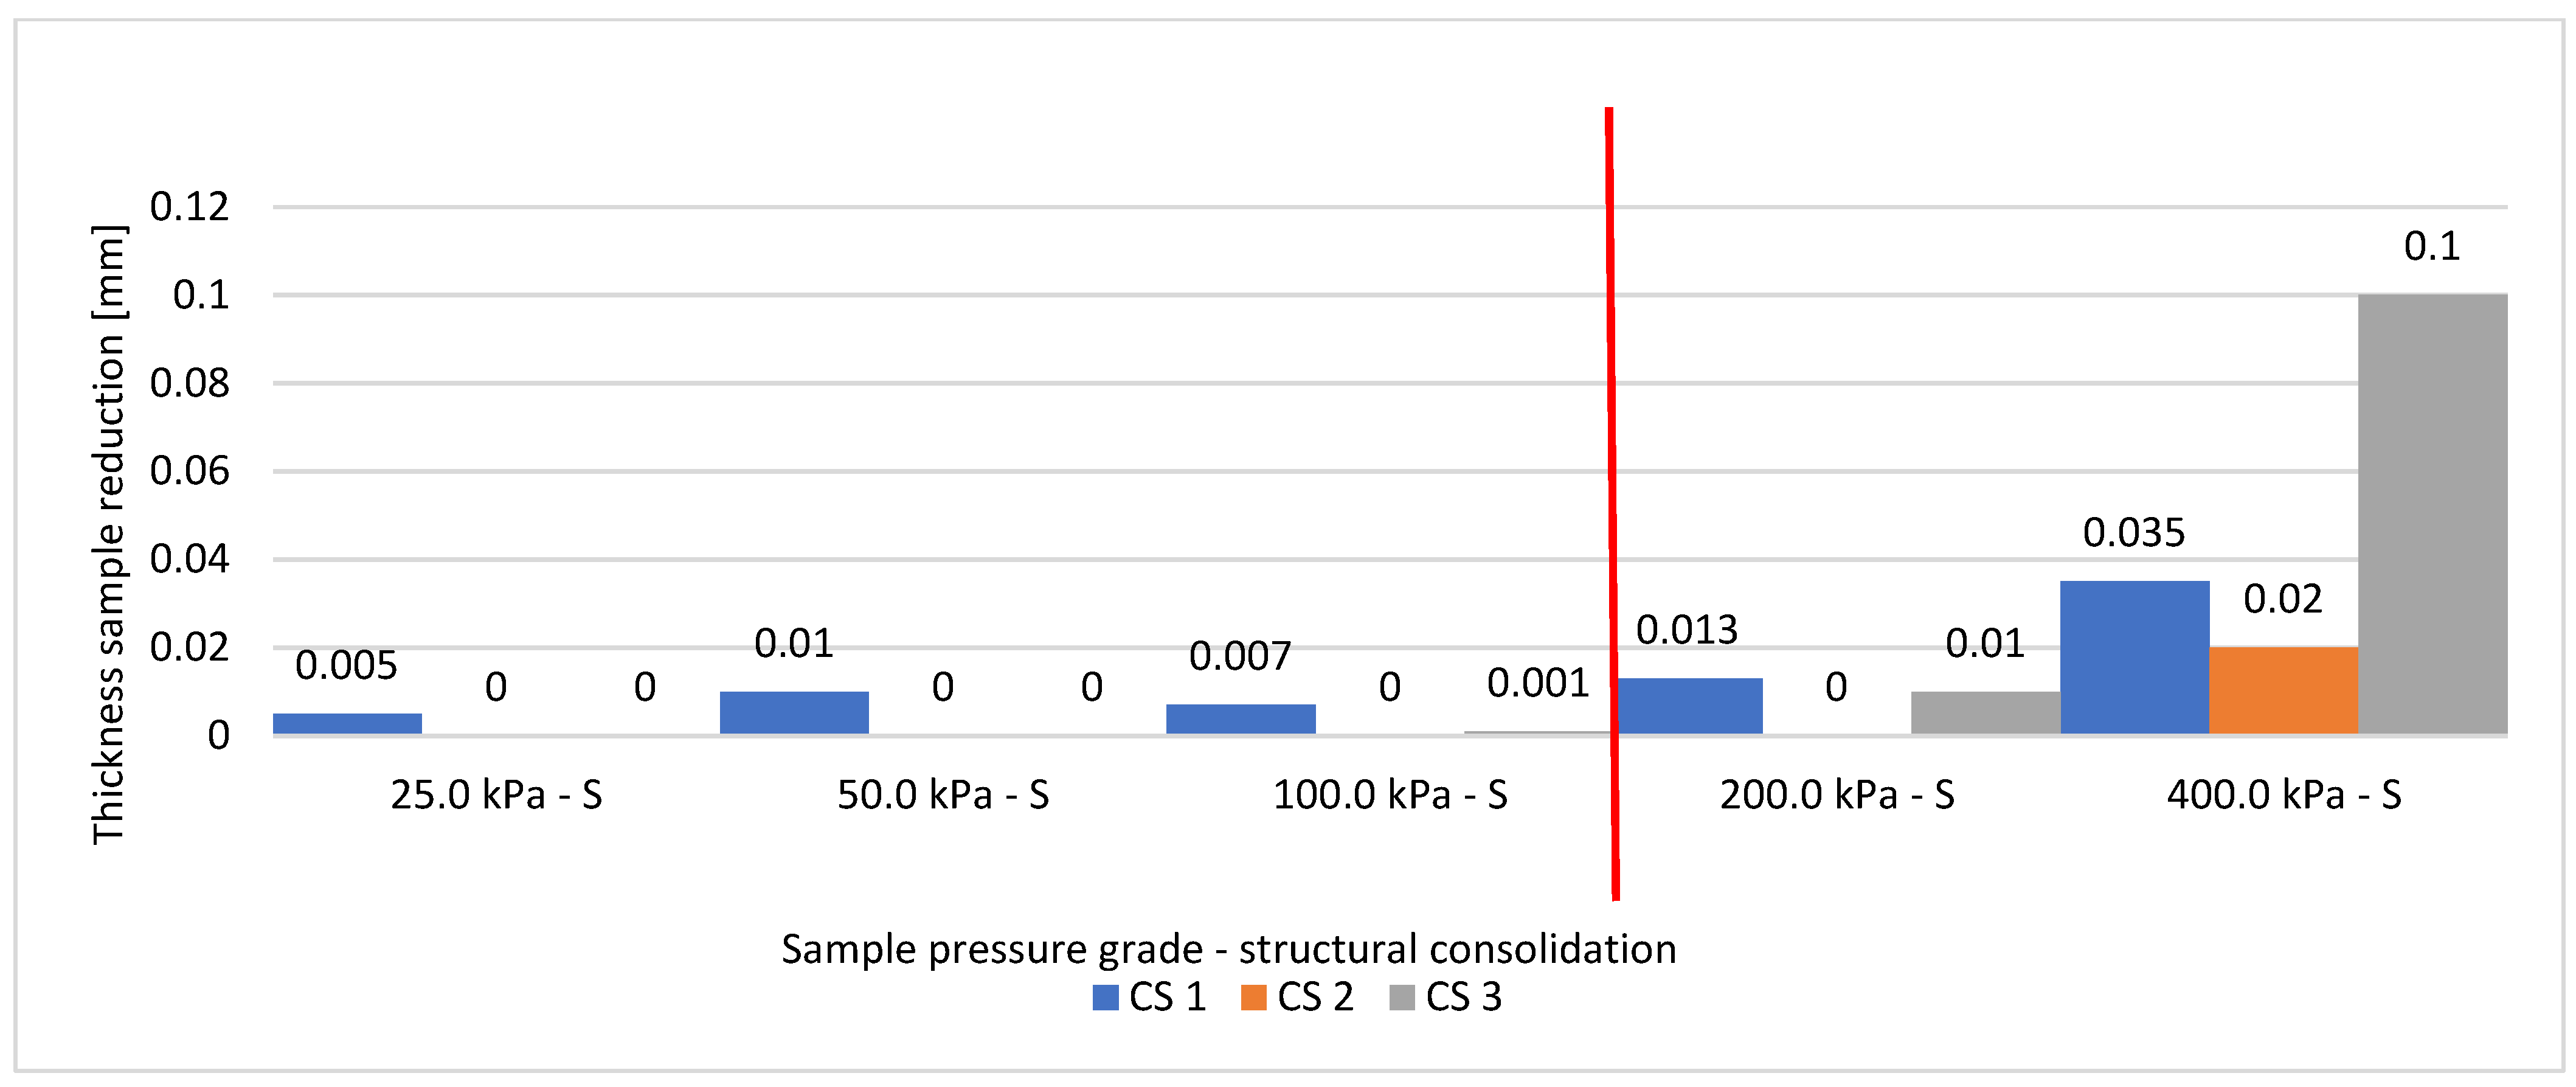
Analysis of the recompression loading curves shows the boundary between the filtration and secondary consolidation phases (Figure 6). In the load range of 0–100 kPa, the reduction in sample height occurs primarily during the filtration consolidation phase. At higher loads, sample height decreases in both the filtration and secondary consolidation phases (Figure 10 and Figure 11). These observations confirm the conclusions from the primary consolidation tests: above a load of 100 kPa, the material exhibits rheological behavior.
The increase in strength of the test material in the recompression range is also reflected in the recompression modulus values. Table 6 presents the values of the primary and recompression moduli obtained from the oedometer test. The results show that the coal sludge exhibits some variability in these parameters. In the load range of 0–400 kPa, the primary compressibility modulus M0 ranged from 3.5 to 4.53 MPa, and the recompression modulus M ranged from 12.33 to 33.2 MPa, with average values of M0 = 3.91 MPa and M = 20.81 MPa, respectively.
The recompression modulus values of the coal sludge, also presented in Table 6, depend on the applied load range and vary from 6710 to 44,360 kPa (excluding extreme values: 8870 to 23,500 kPa). For comparison, recompression moduli for organic soils range from 200 to 8000 kPa [56], while for mineral soils they are 8000–18,000 kPa (silts and silty clays), 10,000–20,000 kPa (medium-density clays), and 1000–25,000 kPa (hard-plastic clays) [59] or dumped Krakowiec Clays (11,000–32,000 kPa) [60]. Based on this comparison, the obtained recompression moduli for the coal sludge fall within the range typical for the mineral soils mentioned above.
The presence of SiO2 in the mineral composition increases the stiffness of the material. In the oedometer test, relatively low deformations are observed under initial loading, which quickly stabilize. These minerals have little influence on the development of secondary deformations. The presence of clay minerals in the soil often leads to swelling and contributes to increased compressibility of the material. High porosity, large water content, and a fibrous structure may be caused by the presence of organic matter in the material. In the oedometer test, this results in high susceptibility to deformation and an extended consolidation time. The presence of clay minerals and organic compounds prolongs the development of secondary deformations. The behavior of organic matter in the sample depends on the stress range as well as the degree of particle size and the decomposition state of the organic matter.
The mineral composition structure in the examined coal sludge is complex, which is reflected in the nonlinear behavior of the material in the oedometer test. At low loads, the organic matter acts as a binder, filling the spaces between mineral grains. Settlements are dampened because the grain arrangement is stabilized by adhesion and capillary forces. This is visible in Figure 5, where the initial loading stages up to 100 kPa show progressively smaller vertical deformations. The mechanism of organic matter changes drastically under higher stresses, when its structure is destroyed. In the coal sludge samples, applying a load of 200 kPa caused the bonds between organic and mineral particles to break, resulting in the organic matter losing its binding properties. The weakening of the coal sludge is evident in the increased vertical deformations at higher load stages (200 kPa and 400 kPa).
In the direct shear test, the effect of organic matter on the behavior of coal sludge samples was similar. At low vertical stresses (50 kPa), the sample exhibited greater stiffness, with the organic matter acting as a binder (results were also the most consistent here, V = 5.42%). At higher loads, structural degradation of the organic matter occurred, causing the samples to weaken. This process was uneven, with kinetic friction appearing between the grains, which contributed to a reduction in the internal friction angle. Compared to organic soils, coal sludge has higher strength parameters; however, due to its heterogeneous structure, it can weaken more quickly, which was observed in the more variable test results obtained.
A comparison of the results from the three series shows a relatively wide range of values for the angle of internal friction and cohesion, 22.98–30.25° and 5.36–44.56 kPa, respectively (Table 3). An analysis of the maximum shear stresses within the 10% horizontal deformation range of the specimens shows that the highest values were obtained in series 3, while the lowest values were recorded in series 1.
Considering the results from all three series together, the average angle of internal friction was φ = 26.46° and cohesion c = 22.60 kPa, with an average compaction index Is = 0.96. The moisture content of the individual samples during testing ranged from 33.57% to 36.56%. These values are comparable to the strength parameters for semi-cohesive soils, such as sandy silt (SaSi), where φ = 22° and c = 25 kPa [50]. Hence the conclusion that it is a material with deformation properties intermediate between organic soil and mineral soil. The comparison of the internal friction angle and cohesion values of coal sludge with the strength parameters of other soils presented in Table 9 indicates that coal sludge exhibits very similar properties to fly ash, and its values fall within the range typical of organic soils.
The direct shear apparatus assumes a linear relationship between shear stress and normal stress. In reality, however, soils—especially cohesive soils—exhibit uneven stress distribution and local overloads within the samples. It is impossible to determine whether failure occurs along a single plane imposed by the apparatus. As a result, these soils do not behave strictly linearly, and the test may either underestimate or overestimate the actual strength parameters, particularly cohesion. The measured cohesion also reflects the influence of capillary forces and pre-stresses and may not accurately represent the true soil strength. Moreover, due to the complex nature of coal sludge, the cohesion values obtained should be considered preliminary, and the range of results should be verified in subsequent testing, such as in a triaxial shear apparatus [63,64,65].

5. Conclusions

The research methodology was designed to standardize the material used for testing. Due to the inherent characteristics of coal sludge, this material poses challenges for homogenization. The analysis began with an assessment of its physical properties, including high moisture content and porosity, low density, a granulometric distribution comparable to soil dust, and a phase composition dominated by minerals prone to swelling. The chemical composition was also examined, encompassing silicates, aluminosilicates, sulfates, and chlorides—components that can contribute to corrosion of laboratory equipment.
To achieve a standardized test material, the coal sludge was conditioned to an optimal moisture content, and the sample density was adjusted to match the maximum dry density of the soil skeleton. The chemical composition of the samples corresponded to the values presented in Table 1, and no swelling behavior was observed. For the CS samples, shear strength parameters were determined using the direct shear test, while compressibility characteristics were evaluated using oedometer tests.
Although these tests have long been used in geotechnical engineering, the determination of parameters such as the internal friction angle, cohesion, and one-dimensional compressibility moduli for coal sludge (CS) represents a novel area of research. The obtained values of the internal friction angle and cohesion (φ = 24°, c = 28 kPa) are comparable to those of medium-cohesion soils, such as sandy silt (φ = 22°, c = 25 kPa [60]). The compressibility results (0.89 MPa < M0 < 6.35 MPa) fall within the range characteristic of native organic soils (e.g., organic silts: 0.5–5 MPa [60,66]). Consolidation curves indicated that coal sludge can be loaded up to 100 kPa, above which rheological properties become apparent.
Analysis of the sample behavior during oedometer testing showed that, in the initial stages, the load is first transferred to the clayey and organic fraction. After the pores in these components are compacted, the load is subsequently carried by the SiO2 particles. The variability in settlements observed among individual samples is likely associated with the spatial arrangement of the minerals within each specimen. This finding points to a direction for further research: while the mineral composition and microstructure of coal sludge can be characterized using SEM or XRD analyses, their spatial distribution could be investigated through computed tomography (CT) scanning.
The conducted research represents a continuation of previous analyses, which demonstrated that coal sludge exhibits a hydraulic conductivity on the order of k < 10−9 m/s [31,33], classifying it as an isolation material. The mechanical and deformation parameters obtained complement the hydraulic characteristics, indicating the potential use of coal sludge in the construction of isolation barriers.
Future research directions include assessing the long-term durability of barriers under cyclic loading (vibrations, variable water conditions), detailed characterization of rheological properties, pilot-scale field implementations under real hydrogeotechnical conditions (e.g., sections of flood embankments), and predicting barrier performance under long-term loading using numerical modeling (FLAC/FLAC3D).
The use of coal sludge as a material for constructing isolation barriers may provide a more cost-effective alternative or a complementary solution to geosynthetics and conventional materials such as clay or bentonite. The application of anthropogenic resources in this context aligns with the Sustainable Development Goals (SDGs) [67]. For example, utilizing coal sludge as an engineering material is consistent with SDG 9, as it represents an innovative technological solution supporting the development of sustainable infrastructure.
Additionally, directing coal waste, which would otherwise be disposed of in settling ponds, toward geotechnical applications reduces landfill requirements and promotes the sustainable management of natural resources (SDG 12). Intensifying the use of coal sludge in the reclamation of degraded lands supports SDG 15, contributing to the protection of terrestrial ecosystems and the restoration of degraded areas.
The variability of coal sludge properties, resulting from its heterogeneity, highlights the need for an integrated research and technological approach. This requires close cooperation between the mining and construction sectors to develop standardized methods for assessing coal sludge properties at early stages of coal processing, aligning with SDG 17, which promotes partnerships for sustainable development.
The conducted research has a pilot character, and the obtained results serve as a starting point for more detailed quantitative and qualitative analyses, which will enable full confirmation and further development of the conclusions in subsequent stages of research.

Funding

This research received no external funding.

Institutional Review Board Statement

Not applicable.

Informed Consent Statement

Not applicable.

Data Availability Statement

The data that support the findings of this study are available from the corresponding author upon request.

Conflicts of Interest

The author declare no conflict of interest.

Abbreviations

The following abbreviations are used in this manuscript:
CSCoal sludge
cCohesion
φInternal friction angle
M0Primary compressibility modulus
MRe-compressibility modulus
ΔεhVertical deformation increase

References

  1. Mirkowski, Z.; Badera, J. Odpady górnictwa węgla kamiennego, zagrożenia i ochrona środowiska. In Raport z Monitoringu Zagospodarowania Odpadów Wydobywczych; Towarzystwo dla Natury i człowieka: Lublin, Poland, 2015. [Google Scholar]
  2. Śliwka, M.; Kępys, W.; Pawul, M. Analysis of the properties of coal sludge in the context of the possibility of using it in biological reclamation. Miner. Resour. Manag. PAN 2022, 38, 173–189. [Google Scholar] [CrossRef]
  3. Miroshnichenko, D.V. Crushing Properties of Coal. Coke Chem. 2013, 56, 49–455. [Google Scholar] [CrossRef]
  4. Irshek, I.; Orazbike, I.; Hypσek, A.; Kamalchan, S.K.E. Investigation of the Possibility of Using Coal Flotation Waste in Production of Agglomerate. Preprints 2024. [Google Scholar] [CrossRef]
  5. Vidlar, J.; Pasiowiec, P. New directions in the research and development of reagents for flotation of coal and non-polar minerals. J. Pol. Miner. Eng. Soc. 2009, 2, 1–7. [Google Scholar]
  6. Wasilewski, R.; Raińczak, J. Formowalne paliwo stałe na bazie mułu węglowego. Inżynieria Chem. Proces. 2004, 25, 2385–2391. [Google Scholar]
  7. Jelonek, I.; Jelonek, Z.; Mirkowski, Z. Cechy flotokoncentratów i mułów węglowych stosowanych w piecach centralnego ogrzewania oraz charakterystyka produktów ubocznych powstałych w wyniku ich spalenia. Zesz. Nauk. IGSMiE PAN 2016, 96, 91–104. [Google Scholar]
  8. Klojzy-Karczmarczyk, B.; Mazurek, J. Propozycje rozszerzenia działań celem zagospodarowania materiałów odpadowych z górnictwa węgla kamiennego. Zesz. Nauk. IGSMiE PAN 2017, 98, 151–166. [Google Scholar]
  9. Klojzy-Kaczmarczyk, B.; Staszczak, J. Zastosowanie mułów węglowych do uszczelniania składowisk komunalnych—Rozpoznanie możliwości. Zesz. Nauk. Inst. Gospod. Surowcami Miner. Energią PAN 2018, 105, 95–108. [Google Scholar]
  10. Kępys, W.; Pomykała, R. The properties of the backfill mixtures based on own fine-grained waste. In Minefill 2020–2021; CRC Press: Boca Raton, FL, USA, 2021. [Google Scholar]
  11. Klatka, S.; Malec, M.; Ryczek, M.; Kruk, E.; Zając, E. Ocena zdolności retencyjnych wybranych odpadów przemysłowych. Acta Sci. Pol. Form. Circumiectus 2016, 15, 53–60. [Google Scholar] [CrossRef]
  12. Rećko, K.; Sanytsky, M. Możliwość wykorzystania mułu węglowego w ceramice budowlanej. Bud. Zoptymalizowanym Potencjale Energetycznym 2008, 5, 263–269. [Google Scholar]
  13. Kotlyar, V.D.; Lapunova, K.A.; Kozlov, G.A. Wall Ceramics Products Based on Opoka and Coal Slurry. Procedia Eng. 2016, 150, 1452–1460. [Google Scholar] [CrossRef]
  14. Wysocka, A.; Stêpniewski, W.; Horn, R. Swelling-shrinkage properties and hydraulic conductivity of a compacted coal minetailing rock likely to be used for landfill capping. Int. Agrophysics 2007, 21, 405–408. [Google Scholar]
  15. Sobko, W.; Baic, I.; Blaschke, W. Depozyty mułów węglowych—Inwentaryzacja i identyfikacja ilościowa. Rocz. Ochr. Sr. 2011, 13, 1405–1416. [Google Scholar]
  16. PN-88/B-04481; Grunty Budowlane. Badania Próbek Gruntu. Polish Standards: Warsaw, Poland, 1988.
  17. Cała, M.; Pomykała, R.; Kępys, W.; Adamczyk, J.; Stopkowicz, A.; Blajer, M. Opracowanie opisujące wskazanie kierunków i możliwości zagospodarowania skały płonnej oraz odpadowych mułów węglowych w Grupie Tauron oraz na rynku zewnętrznym. Unpublished Work. 2015. [Google Scholar]
  18. Doniecki, T.; Siedlecka, E. Odpadowe muły węglowe jako element izolacji mineralnej na składowiskach odpadów. Górnictwo Geinżynieria 2006, 30, 41–46. [Google Scholar]
  19. EN-ISO 14688-2; Geotechnical Investigation and Testing—Identification and Classification of Soil—Part 2: Principles for Clasiffication. Edition 2, European Standard: Brussels, Belgium, 2017.
  20. Craig, R.F. Mechanics Soil, 6th ed.; Spon Press: London, UK, 1997. [Google Scholar]
  21. Salam, S.; Xiao, M.; Khosravifar, A.; Liew, M.; Liu, S.; Rostami, J. Characterization of static and dynamic geotechnical properties and behaviors of fine coal refuse. Can. Geotech. J. 2019, 56, 1901–1916. [Google Scholar] [CrossRef]
  22. Kutepova, N.A.; Mosekin, V.V.; Kondakova, V.N.; Pospehov, G.B.; Straupnik, I.A. Specifiy of properties of coal processing waste regarding their storage. Min. Informational Anal. Bull. 2022, 12, 77–79. [Google Scholar] [CrossRef]
  23. Hegazy, Y.A.; Cushing, A.G.; Lewis, C.J. Physical, mechanical, and hydraulic properties of coal refuse for slurry impoundment design. In Proceedings of the Second International Conference on Geotechnical and Geophysical Characterization (ISC-2), Porto, Portugal, 19–22 September 2004; Available online: https://www.researchgate.net/publication/333296010 (accessed on 11 November 2025).
  24. Salam, S.; Xiao, M.; Khosravifar, A.; Wang, J. Cyclic Behavior and Liquefaction Resistance of Fine Coal Refuse—Experimental and Numerical Modeling. In Proceedings of the Geo-Congress 2019, Philadelphia, PA, USA, 24–27 March 2019. [Google Scholar] [CrossRef]
  25. Jedari, C.; Palomino, A.M.; Drumm, E.C.; Boles, D.R. Compressibility of Fine Coal Refuse. In Proceedings of the IFCEE 2018, Orlando, FL, USA, 5–10 March 2018. [Google Scholar] [CrossRef]
  26. Charles-Cruz, C.A.; Cousens, T.W.; Stewart, D.I. Compressibility and Creep Behaviour of Hydraulically Placed PFA and Mine Tailings Fills. In Proceedings of the 12th International Conference of International Association for Computer Methods and Advances in Geomechanics (IACMAG), Goa, India, 1–6 October 2008. [Google Scholar]
  27. Kaliński, M.; Philips, J.L. Development of Methods to Predict the Dynamic Behavior of Fine Coal Refuse: Preliminary Results from Two Sites in Appalachia. In Proceedings of the Geotechnical Earthquake Engineering and Soil Dynamics Congress IV, Sacramento, CA, USA, 18–22 May 2008. [Google Scholar] [CrossRef]
  28. Jedari, C.; Palomino, A.M.; Drumm, E.C.; Boles, D.R. In situ Characteristics of Fine coal Refuse. In Proceedings of the Geo-Congress 2019, Philadelphia, PA, USA, 24–27 March 2019. [Google Scholar] [CrossRef]
  29. Coufal, R.; Olszewska, M. Numerical simulation of changing value of compression modulus of organic soil under overloaded embankment. Mater. Bud. 2016, 1, 105–107. [Google Scholar] [CrossRef]
  30. Brzeziński, B.; Olchawa, A.; Wierzbicka, M. Wybrane właściwości gruntowych materiałów kompozytowych jako materiału konstrukcyjnego do budowy niskich nasypów obwałowań przeciwpowodziowych. Mater. Bud. 2023, 1, 35–39. [Google Scholar] [CrossRef]
  31. Adamczyk, J.; Pomykała, R. Coal Sludge Permeability Assessment Based on Rowe Cell Consolidation and Filtration Investigations. Minerals 2022, 12, 212. [Google Scholar] [CrossRef]
  32. Olek, B.; Pilecka, E. Hydraulic conductivity of coal mine tailings. STEF92 Technology. In Proceedings of the 18th International Multidisciplinary Scientific GeoConference SGEM2018, Vienna, Austria, 3–6 December 2018. [Google Scholar] [CrossRef]
  33. Adamczyk, J. Ocena Przydatności Mieszanek Kruszywa i Odpadowego Mułu Węglowego w Budowlach Ziemnych. Doctoral Dissertation, AGH University of Cracow, Kraków, Poland, 2019. [Google Scholar]
  34. Witczak, S.; Adamczyk, A. A Catalogue of Selected Physical, and Chemical Coefficients for Underground Waters Contamination, and the Methods to Determine Such Ones; Biblioteka Monitoringu Środowiska: Warsaw, Poland, 1994. [Google Scholar]
  35. Dowgiałło, J.; Kozerski, B.; Krajewski, S.; Macher, J.; Macioszczyk, T.; Malinowski, J.; Paczyński, B.; Płochniewski, Z.; Stenzel, P.; Szymanko, J.; et al. A Guidebook for Hydrogeologist; Wydawnictwo Geologiczne: Warsaw, Poland, 2007. [Google Scholar]
  36. Gavich, I.K. Teoreticheskiye osnowy izuczenija dwi zenija podziemnych wod v zemnoj kore. In Osnovy Gidrogeologii, T.II: Gidrogeodinamika; Zekcer, I.S., Ed.; Izdatelstvo Nauka: Novosybirsk, Russia, 1983. [Google Scholar]
  37. Wysokinski, L. Rules for the Construction of Waste Landfills, Building Research Institute, Instructions, Guidelines, Guides No 444/2009; Instytut Techniki Budowlanej: Warsaw, Poland, 2009. [Google Scholar]
  38. Darkin, M.G.; Gilpin, C.; Sangha, C.M. Direct wet surface imaging of an anaerobic biofilm by environmental scanning electronmicroscopy: Application to landfill clay liner barriers. Scanning 2001, 23, 346–350. [Google Scholar] [CrossRef]
  39. Luczak-Wilamowska, B. Neogene clays from Poland as mineral sealing barriers for landfills: Experimental study. Appl. Clay Sci. 2020, 21, 22–43. [Google Scholar] [CrossRef]
  40. Zabielska-Adamska, K.; Wasil, M. Tensile Strength of Barrier Material. In Proceedings of the 10th International Conference of Environmental Engineering (10th ICEE), Vilnius, Lithuania, 27–28 April 2017. [Google Scholar]
  41. Terzaghi, K.; Peck, R.B.; Mesri, G. Soil Mechanics in Engineering Practise, 3rd ed.; John Wiley & Sons, Inc.: Honoken, NJ, USA, 1996. [Google Scholar]
  42. Kowalski, J. Hydrogeologia z Podstawami Geologii, 3rd ed.; Wydawnictwo Uniwersytetu Przyrodniczego we Wrocławiu: Wrocław, Poland, 2007. [Google Scholar]
  43. Coduto, D.P.; Yeung, M.R.; Kitch, W.A. Geotechnical Engineering. Principles and Practices, 2nd ed.Prentice Hall: Englewood Cliffs, NJ, USA, 2011. [Google Scholar]
  44. Mbonimpa, M.; Ngabu, E.T.; Belem, T.; Kanteye, O.; Maqsoud, A. Optimization of Soil-Sludge Mixtures by Compaction for Potential Use in Mine Site Reclamation. Minerals 2023, 13, 806. [Google Scholar] [CrossRef]
  45. Skarżyńska, K.M. Reuse of coal mining wastes in civil engineering—Part 1: Properties of minestone. Waste Manag. 1995, 15, 3–42. [Google Scholar] [CrossRef]
  46. Pisarczyk, S. Gruntoznawstwo Inżynierskie, 1st ed.; Wydawnictwo Naukowe PWN: Warsaw, Poland, 2001. [Google Scholar]
  47. Sadowski, W. Small Encyclopedia of Statistics; PWE: Warsaw, Poland, 1976. [Google Scholar]
  48. Zeliaś, A. Statistical Methods; PWE: Warsaw, Poland, 2000. [Google Scholar]
  49. Wiłun, Z. Zarys Geotechniki, 8th ed.; Wydawnictwa Komunikacji i Łączności: Warsaw, Poland, 2007. [Google Scholar]
  50. Coefficient of Variation—Formula, Interpretation and Application in Statistics. Available online: https://www.geeksforgeeks.org/data-science/coefficient-of-variation-meaning-formula-and-examples/ (accessed on 11 November 2025).
  51. Lambe, T.W.; Whitman, R.V. Mechanika Gruntów; Wydawnictwo Arkady: Warsaw, Poland, 1977. [Google Scholar]
  52. Woźniak, H. Osiadania Gruntów Zwałowych w Świetle Badań Modelowych, 1st ed.; PAN Instytut Gospodarki Surowcami Mineralnymi i Energia: Cracow, Poland, 2009. [Google Scholar]
  53. Meyer, Z.; Bednarek, R. Prognozowanie osiadania gruntów słabych na podstawie modelu nieliniowego. Inżynieria Morska Geotech. 2008, 4, 211–214. [Google Scholar]
  54. Meyer, Z.; Kowalów, M.; Plucińska, A. Modelowanie osiadań podłoża słabego na podstawie badań in situ. Inżynieria Morska Geotech. 2008, 5, 268–274. [Google Scholar]
  55. Meyer, Z.; Olszewska, M. Methods Development for the Constrained Elastic Modulus Investigation of Organic Material in Natural Soil Conditions. Materials 2021, 14, 6842. [Google Scholar] [CrossRef]
  56. Gruchot, A.; Zydroń, Z. Shear Strength of Industrial Wastes and Their Mixtures and Stability of Embankments Made of These Materials. Appl. Sci. 2020, 10, 250. [Google Scholar] [CrossRef]
  57. Myślińska, E. Grunty Organiczne i Laboratoryjne Metody ich Badania, 3rd ed.; Wydawnictwo Naukowe PWN: Warsaw, Poland, 2001. [Google Scholar]
  58. Cheng, G.; Zhu, H.H.; Wen, Y.N.; Shi, B.; Gao, L. Experimental Investigation of Consolidation Properties of Nano-Bentonite Mixed Clayey Soil. Sustainability 2020, 12, 459. [Google Scholar] [CrossRef]
  59. Wan, T.; Lu, Y.; Zeng, Z.; Xie, Z.; Lin, S.; Nong, X. Compression Behavior of Rubber-Betnonite Mixture under different Salinities. Appl. Sci. 2023, 13, 8134. [Google Scholar] [CrossRef]
  60. Jaremski, J. Parametry geotechniczne niektórych gruntów występujących na obszarze województwa karpackiego. Zesz. Politech. Śląskiej 2003, 97, 421–430. [Google Scholar]
  61. Blajer, M.; Stopkowicz, A.; Adamczyk, J.; Cala, M. The Preliminary Research of the Physico-Mechanical Properties of Aggregates based on the Colliery Shale, Supplemented by Fly Ash, Arch. Min. Sci. 2019, 1, 21–34. [Google Scholar] [CrossRef]
  62. Pisarczyk, S. Grunty Nasypowe. Właściwości Geotechniczne i Metody ich Badania; Oficyna Wydawnicza Politechnika Warszawskiej: Warszawa, Poland, 2004. [Google Scholar]
  63. Das, B.M. Principles of Geotechnical Engineering, 10th ed.; Cengage Learning: Boston, MA, USA, 2022. [Google Scholar]
  64. Head, K.H. Manual of Soil Laboratory Testing. Volume 2: Permeability, Shear Strength and Compressibility Tests; Pentech Press: London, UK, 1994. [Google Scholar]
  65. Budhu, M. Soil Mechanics and Foundations, 3rd ed.; John Wiley & Sons: Hoboken, NJ, USA, 2011. [Google Scholar]
  66. PN-B-03020:1981; Posadowienie Bezpośrednie Budowli. Oblcizenia Statyczne i Projektowanie. Polish Standards: Warsaw, Poland, 1981.
  67. United Nations, Department of Economic and Social Affairs. Sustainable Development. Available online: https://sdgs.un.org/goals (accessed on 11 November 2025).
Figure 1. Elements of the cutting: (a) sampler base, ring in which the sample is placed, sampler blade; (b) A two-cut cutting ring for sampling.
Applsci 15 12360 g001
Figure 2. Preparing sample for the oedometer (a) Cutting ring filled with test material; (b) Cutting ring filled with test material after removing the blade; (c) Cutting ring filled with test material after removing upper and lower part of the sampler.
Applsci 15 12360 g002
Figure 3. Strength diagram determined in the direct shear apparatus–summary for coal sludge.
Applsci 15 12360 g003
Figure 4. Graph of the relationship between shear stress and relative shear strain for coal sludge–samples 1–3.
Applsci 15 12360 g004
Figure 5. Primary consolidation curves of coal sludge.
Applsci 15 12360 g005
Figure 6. Primary consolidation curves of coal sludge for the first load stage (12.5 kPa).
Applsci 15 12360 g006
Figure 7. Recompression consolidation curves of coal sludge.
Applsci 15 12360 g007
Figure 8. Summary of the compressibility and relaxation curves of coal sludge.
Applsci 15 12360 g008
Figure 9. Thickness reduction in the tested samples in the structural consolidation phase (S) for subsequent load levels in the oedometer.
Applsci 15 12360 g009
Figure 10. The thickness of the tested samples reduction in the filtration phase (F) of consolidation (recompression consolidation) for subsequent load levels in the oedometer.
Applsci 15 12360 g010
Figure 11. The thickness of the tested samples reduction in the structural phase (S) of consolidation (recompression consolidation) for subsequent load levels in the oedometer.
Applsci 15 12360 g011
Table 1. Chemical composition of coal sludge [19].
ComponentP2O5Mn2O5SiO2TiO2Al2O3Fe2O3
Content [%]0.100.0233.500.0221.003.76
ComponentCaOMgONa2OLi2OK2OSO3
Content [%]0.260.610.530.011.100.89
Table 2. Physical properties of coal sludge [35].
Parameter NameUnitValue
Moisture[%]30.1 ÷ 38
Specific density[g/cm3]1.97 ÷ 2.03
Volumetric density[g/cm3]1.5 ÷ 1.54
Porosity[-]0.44
Porosity index[-]0.76
Saturation moisture[%]38
Moisture degree[-]0.94
Table 3. Summary of Direct Shear Strength Apparatus research results for coal sludge.
Coal SludgeSample 1Sample 2Sample 3
Internal friction angle ϕ [°]30.2520.5622.99
Cohesion c [kPa]5.3636.1844.56
Table 4. Comparison of maximum shear stress values obtained for samples in Direct Shear test.
Test Series NumberNormal StressMax. Shear StressAverage ValueStandard DeviationCoefficient of Variation
[kPa][kPa] x ¯ σV [%]
Serie 150 45.4843.142.345.42%
Serie 240.8
Serie 3----
Serie 110054.7477.8716.7921.56
Serie 294.07
Serie 384.8
Serie 1150 77.8694.8214.1814.95
Serie 294.05
Serie 3112.56
Serie 1200 134.98121.8413.4711.05
Serie 2103.33
Serie 3127.22
Table 5. Comparison of the maximum values of strength parameters obtained in 3 series of the test in Direct Shear Box.
Test Series NumberParameterMax. Shear StressAverage ValueStandard DeviationCoefficient of Variation
[kPa] x ¯ σV [%]
Serie 1Internal friction
angle, φ [°]
30.2524.604.1216.73
Serie 220.56
Serie 322.99
Serie 1Cohesion,
c [kPa]
5.3628.7016.8558.73
Serie 236.18
Serie 344.56
Table 6. Comparison of the values of the primary compressibility modulus M0 and recompression compressibility modulus M for coal sludge.
Lp.Load Range ∆σi [MPa]M0 [MPa]M [MPa]
Serie 1Serie 2Serie 3Serie1Serie 2Serie 3
10.0 ÷ 0.01250.371.320.81---
20.0125 ÷ 0.0253.224.132.0544.36Δh = 023.5
30.025 ÷ 0.050.883.533.068.87Δh = 0Δh = 0
40.05 ÷ 0.12.231.963.0312.64Δh = 06.71
50.1 ÷ 0.25.018.315.0215.32Δh ≈ 016.95
60.2 ÷ 0.46.584.667.819.4517.3810.59
70.0 ÷ 0.050.782.561.6916.13Δh = 0Δh ≈ 0
80.0 ÷ 0.11.172.252.214.2Δh = 012.53
90.0 ÷ 0.21.933.573.114.79Δh ≈ 014.46
100.0 ÷ 0.43.054.154.5216.933.212.33
Table 7. Statistical characteristics of compressibility moduli obtained from oedometer tests for coal sludge.
Lp.Load RangeM0 [MPa]M [MPa]
Average ValueStandard DeviationCoefficient of VariationAverage ValueStandard DeviationCoefficient of Variation
∆σi [MPa] x ¯ σV [%] x ¯ σV [%]
10.0 ÷ 0.01250.830.3946.58---
20.0125 ÷ 0.0253.130.8527.1733.9310.4330.74
30.025 ÷ 0.052.491.1546.378.870.000.00
40.05 ÷ 0.12.410.4518.889.682.9730.65
50.1 ÷ 0.26.111.5525.4116.140.825.05
60.2 ÷ 0.46.351.2920.3615.813.7823.94
70.0 ÷ 0.051.680.7343.3416.130.000.00
80.0 ÷ 0.11.870.5026.5713.370.846.25
90.0 ÷ 0.22.870.6924.0514.630.171.13
100.0 ÷ 0.43.910.6215.9820.818.9643.04
Table 8. Primary compressibility modulus values summary for coal sludge and peat.
Load Range [kPa]CS [kPa]Peat
25–50880–3530199–980 [53,54,55]
50–1001960–3030180–600 [53,54,55]
100–2005010–8310600–1570 [53,54,55]
250–2260 [56]
0–1001170–22501660–1726, near Konstancin–Poland, Central Europe [55,57]
100–770, near Warsaw–Poland, Central Europe [55,57]
0–4003050–4520498–846, West Pomerania–Poland, Central Europe [55,57]
Table 9. Comparison of Strength Parameters of Coal Sludge and Other Soils.
Soil Typec [kPa]φ [°]Source
Coal sludge22.6026.46
Fly ash20.01
14.69
25.17
30.77
[56]
[61]
Peat0 ÷ 420 ÷ 26[62]
Muds2 ÷ 700 ÷ 28[62]
Gyttja7 ÷ 242 ÷ 7[62]
Disclaimer/Publisher’s Note: The statements, opinions and data contained in all publications are solely those of the individual author(s) and contributor(s) and not of MDPI and/or the editor(s). MDPI and/or the editor(s) disclaim responsibility for any injury to people or property resulting from any ideas, methods, instructions or products referred to in the content.