1. Introduction
As a cornerstone of modern financial infrastructure, the evolution of credit scoring methodologies is instrumental in fostering sustainable and robust socioeconomic development. The proliferation of big data technologies has catalyzed significant advances in data-driven credit assessment, prompting widespread adoption of analytical systems grounded in large-scale data processing. To mitigate potential losses from borrower defaults, financial institutions rigorously evaluate applicant creditworthiness, while competitive market dynamics compel them to refine their discrimination between high-quality and high-risk clients. Consequently, credit scoring has emerged as a critical research domain, garnering substantial attention from both academic communities and financial practitioners due to its practical importance in risk management and its theoretical implications [
1,
2,
3].
Blockchain technology, as a disruptive innovation, offers transformative potential for credit supervision and financial data security. Its inherent characteristics—decentralization, transparency, and immutability—substantially enhance the reliability and traceability of credit-related data flows, thereby introducing novel paradigms for regulatory oversight and risk control in credit finance [
4,
5].
Credit risk modeling encompasses a range of methodologies focused on estimating key parameters such as probability of default (PD), exposure at default (EAD), and loss of a given default (LGD). Among these, PD estimation has emerged as a predominant research stream due to its foundational role in credit assessment [
6,
7]. The development of PD models typically employs binary or multi-class classification techniques. Contemporary research emphasizes the construction of ensemble models to enhance predictive accuracy. However, such efforts frequently rely on a limited set of benchmark datasets—such as the German, Australian, and Japanese credit datasets from the UCI repository—due to the general scarcity of accessible credit data. Consequently, model evaluations conducted on these small-scale datasets may yield statistically inconclusive results.
Several persistent challenges impede advancement in credit scoring research. A primary issue is data scarcity coupled with limited model interpretability. The proprietary nature of financial data restricts most research to a few public datasets, which are insufficient for training robust, generalizable models. Augmenting these limited resources through advanced data utilization techniques presents a potential pathway forward. Furthermore, while machine and deep learning models improve accuracy, their inherent black-box nature obstructs transparency, making it difficult for financial institutions to interpret and trust model outputs. Enhancing explainability without sacrificing performance remains a significant hurdle. Additionally, the expertise required to design, tune, and deploy complex models creates a high barrier to adoption, particularly for resource-constrained entities. Finally, current studies often prioritize isolated model performance over systemic integration, neglecting the need for end-to-end automation in operational credit scoring systems. Addressing these gaps—data availability, interpretability, accessibility, and integration—is critical for developing next-generation credit scoring solutions.
In response to the aforementioned challenges, this paper introduces a comprehensive framework designed to enhance the scalability, automation, and trustworthiness of credit scoring systems. First, a data augmentation algorithm is proposed to synthetically expand limited credit datasets while preserving underlying data distributions, thereby mitigating the issue of sample scarcity. Second, an automated machine learning (AutoML) pipeline is employed to integrate the end-to-end credit scoring workflow—from data ingestion and feature processing to model selection and hyperparameter optimization—significantly reducing manual intervention and improving operational efficiency. Furthermore, the integration of a blockchain-based auditing layer ensures full transparency and immutability throughout the scoring process. The principal contributions of this work are summarized as follows:
A distribution-aware data augmentation algorithm for credit scoring. We propose a generative method that expands limited credit datasets while preserving underlying statistical characteristics. By adaptively estimating sampling weights from local data structures, the approach synthesizes credible samples without introducing distribution shift, facilitating robust model development under data scarcity.
VeriCred: An automated and verifiable credit scoring system. We design an integrated framework combining an AutoML pipeline with blockchain-based auditing. The system automates the end-to-end workflow from data ingestion to model deployment, while immutably recording critical artifacts—such as feature sets and performance metrics—on a distributed ledger, establishing tamper-proof transparency and auditability.
An interpretable feature attribution mechanism. We advance an enhanced model-agnostic explanation technique that quantifies the contribution and relational importance of input variables to prediction outcomes. This method improves the transparency of credit scoring decisions without compromising performance, as validated through extensive experiments.
The subsequent sections of this paper are structured as follows. In
Section 2, we introduce the current research on credit scoring methods and the methods that have been adopted, in addition to a summary of the existing methods. In
Section 3, we comprehensively describe the specific approach of our proposed automated machine learning based credit scoring method VeriCred. In the
Section 4, we present the experimental data and information on the configuration of the experimental settings. In
Section 5, we demonstrate and discuss the experimental results. In
Section 6, we give an overview of the application prospects of the model. In
Section 7, we summarize the paper and present our plans for future study.
3. The Approach
3.1. VeriCred: An Integrated Framework for Supervisable Automatic Credit Scoring
Conventional credit scoring methodologies typically involve a sequential workflow comprising data preprocessing, feature engineering, model construction, and performance evaluation. Financial institutions and banking systems often execute these stages in a disjointed manner, requiring repeated manual intervention as data propagate through each phase, ultimately yielding an assessment of an applicant’s creditworthiness. A critical challenge in contemporary credit scoring lies in the seamless integration of these discrete processing stages and the substantial reduction of human involvement to enhance operational efficiency and reproducibility.
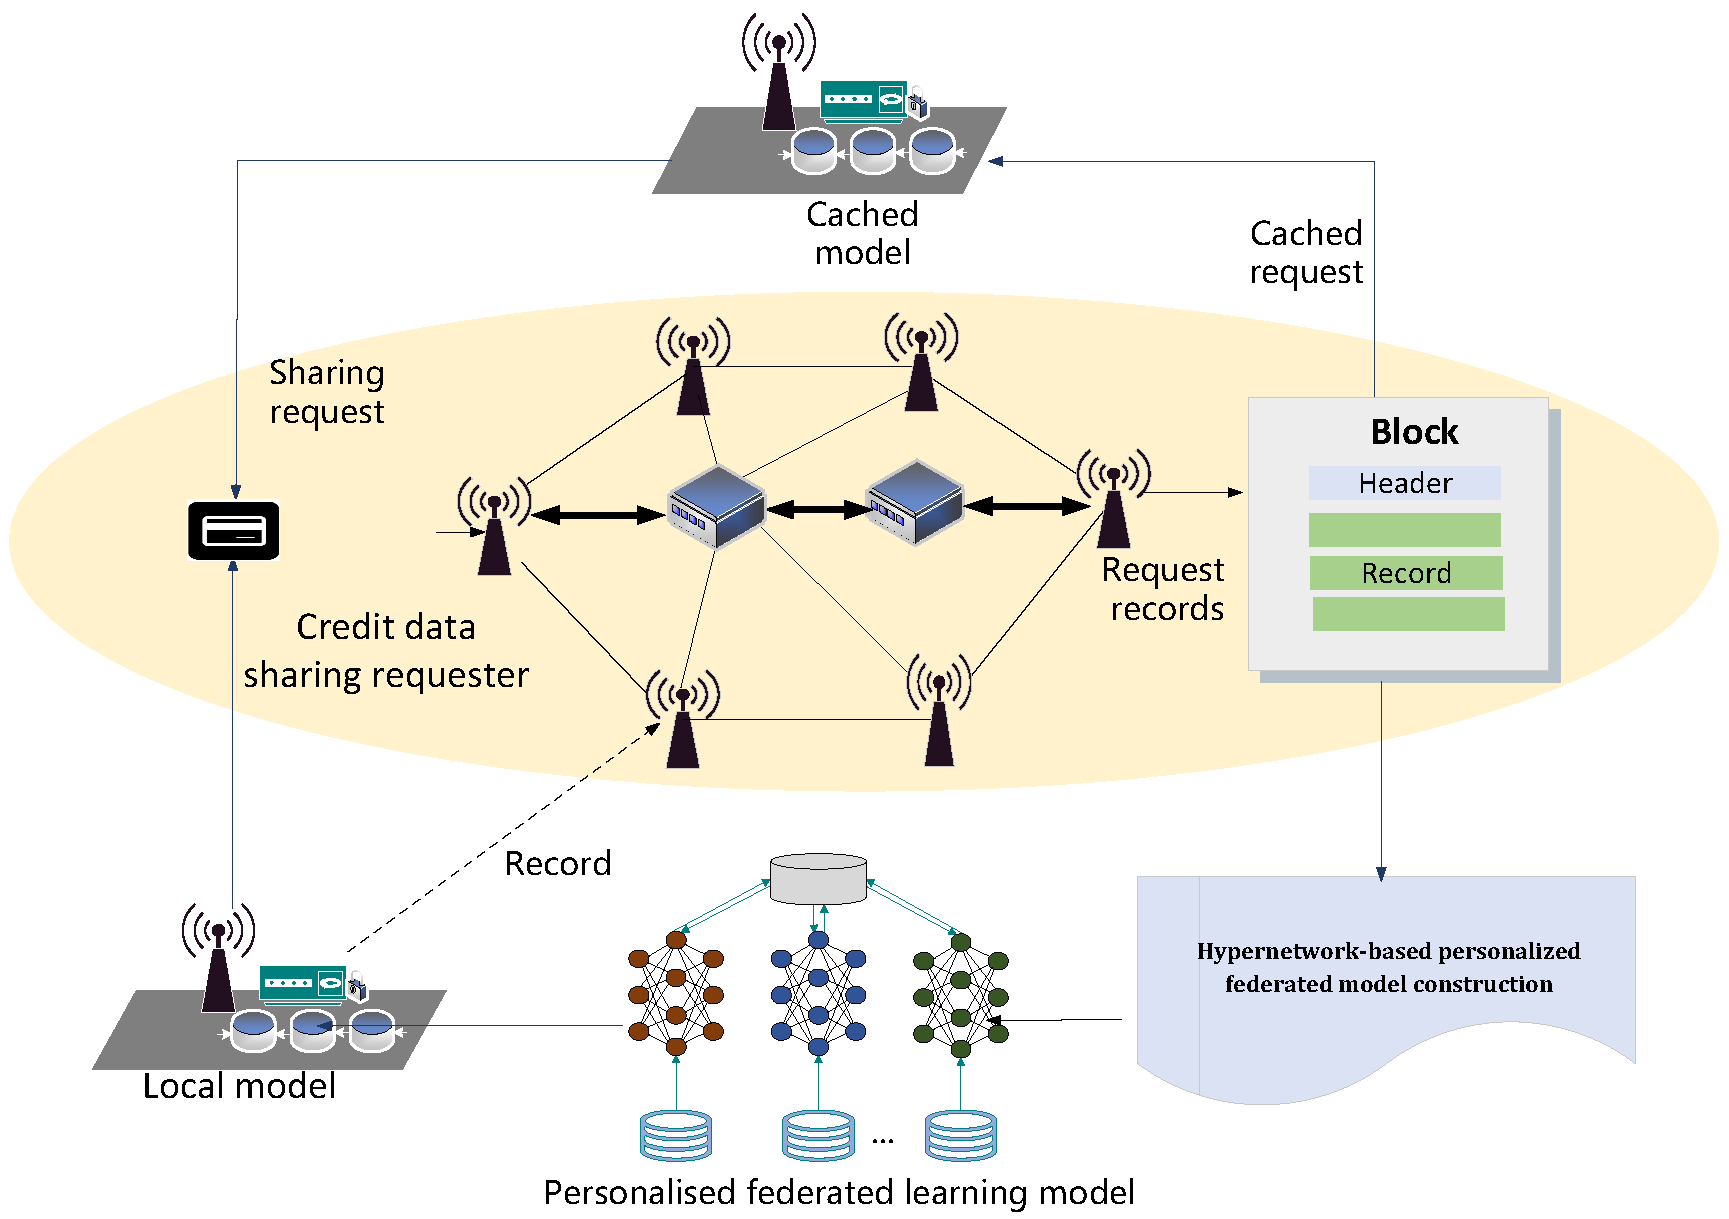
To address these limitations, we introduce VeriCred, an integrated credit scoring framework that leverages an automated machine learning pipeline to unify the entire workflow into a cohesive end-to-end process. Within this pipeline, raw credit data undergoes a continuous and automated sequence of operations: initial preprocessing, followed by feature extraction and selection, and onward to model construction via our novel neural architecture search mechanism (C-NAS) coupled with the specialized A-Triplet loss objective. The workflow further incorporates automated hyperparameter optimization and final model evaluation, forming a closed-loop system that significantly diminishes the need for manual model design and parameter tuning. By encapsulating these traditionally segregated stages into a unified pipeline, VeriCred delivers a fully automated, process-driven, and highly efficient credit scoring solution. The overall architecture and data flow of the proposed framework are illustrated in
Figure 1 and
Figure 2.
3.1.1. Data Augmentation for Balancing the Credit Datasets
Credit scoring datasets are often characterized by significant class imbalance, where critical minority classes (e.g., defaulters) are substantially underrepresented compared to the majority class (e.g., non-defaulters). This skewed distribution can severely bias predictive models, leading to poor generalization and reduced sensitivity towards the minority class of interest [
25,
26,
27,
28,
29]. To address this fundamental challenge, we employ a data augmentation technique specifically designed to generate synthetic samples for the minority class, thereby promoting a more balanced dataset and enhancing model performance.
The core of our method lies in the synthetic generation of new minority-class instances by leveraging the local feature space structure of existing minority samples. This is achieved by identifying the nearest neighbors of each minority instance and interpolating new data points along the feature vectors that connect them, effectively enlarging the decision region around the minority class without distorting the underlying data manifold.
The algorithm proceeds as follows: for every sample in the minority class, its k nearest neighbors within the same class are identified. For each neighbor, a new synthetic sample is generated by interpolating between the original sample and the selected neighbor. A minor random perturbation is introduced to increase the diversity of the generated samples. This process is repeated times for each original instance, effectively increasing the representation of the minority class. The resulting augmented dataset contains plausible, synthetic minority-class samples that help balance the class distribution, thereby facilitating the training of a more robust and accurate credit scoring model.
In Algorithm 1, Neib-x[
i] and Neib-y[
i] indicate the data in the neighborhood of the sample point,
and
represent the new data points generated by data augmentation.
and
represent the weights of the expanded data in the
x and
y dimensions, respectively. The values are determined in our VeriCred by neural architecture search. In our method, we first use a data augmentation method for prepossessing, the main reason is that our credit dataset distribution is relatively dense and the data is comparatively smooth, using the a method can well eliminate the obvious deviation data, and for some categories with a small amount of credit data, some additional data is generated, thus making the credit dataset balanced. The two parameters
and
in our data augmentation will be determined automatically in the neural architecture search.
| Algorithm 1: Neighborhood-Based Data Augmentation for Imbalanced Credit Data. |
Input: Minority class dataset:
Input: Number of nearest neighbors: k
Input: Augmentation multiplier:
Input: Distance metric: (e.g., Euclidean distance)
- 1:
Initialize an empty augmented dataset: - 2:
for each instance in do - 3:
Find the set of k-nearest neighbors to from using the distance metric - 4:
for to do - 5:
Randomly select a neighbor from the set - 6:
Compute the feature difference vector: - 7:
Generate random interpolation factors: , - 8:
Synthesize a new feature vector: - 9:
Apply a small random perturbation: , where and is a small standard deviation - 10:
Assign the minority class label to the new sample - 11:
Add the new synthetic sample to the augmented dataset: - 12:
end for - 13:
end for
Output: Augmented minority dataset |
3.1.2. Blockchain-Based Storage of Credit Data
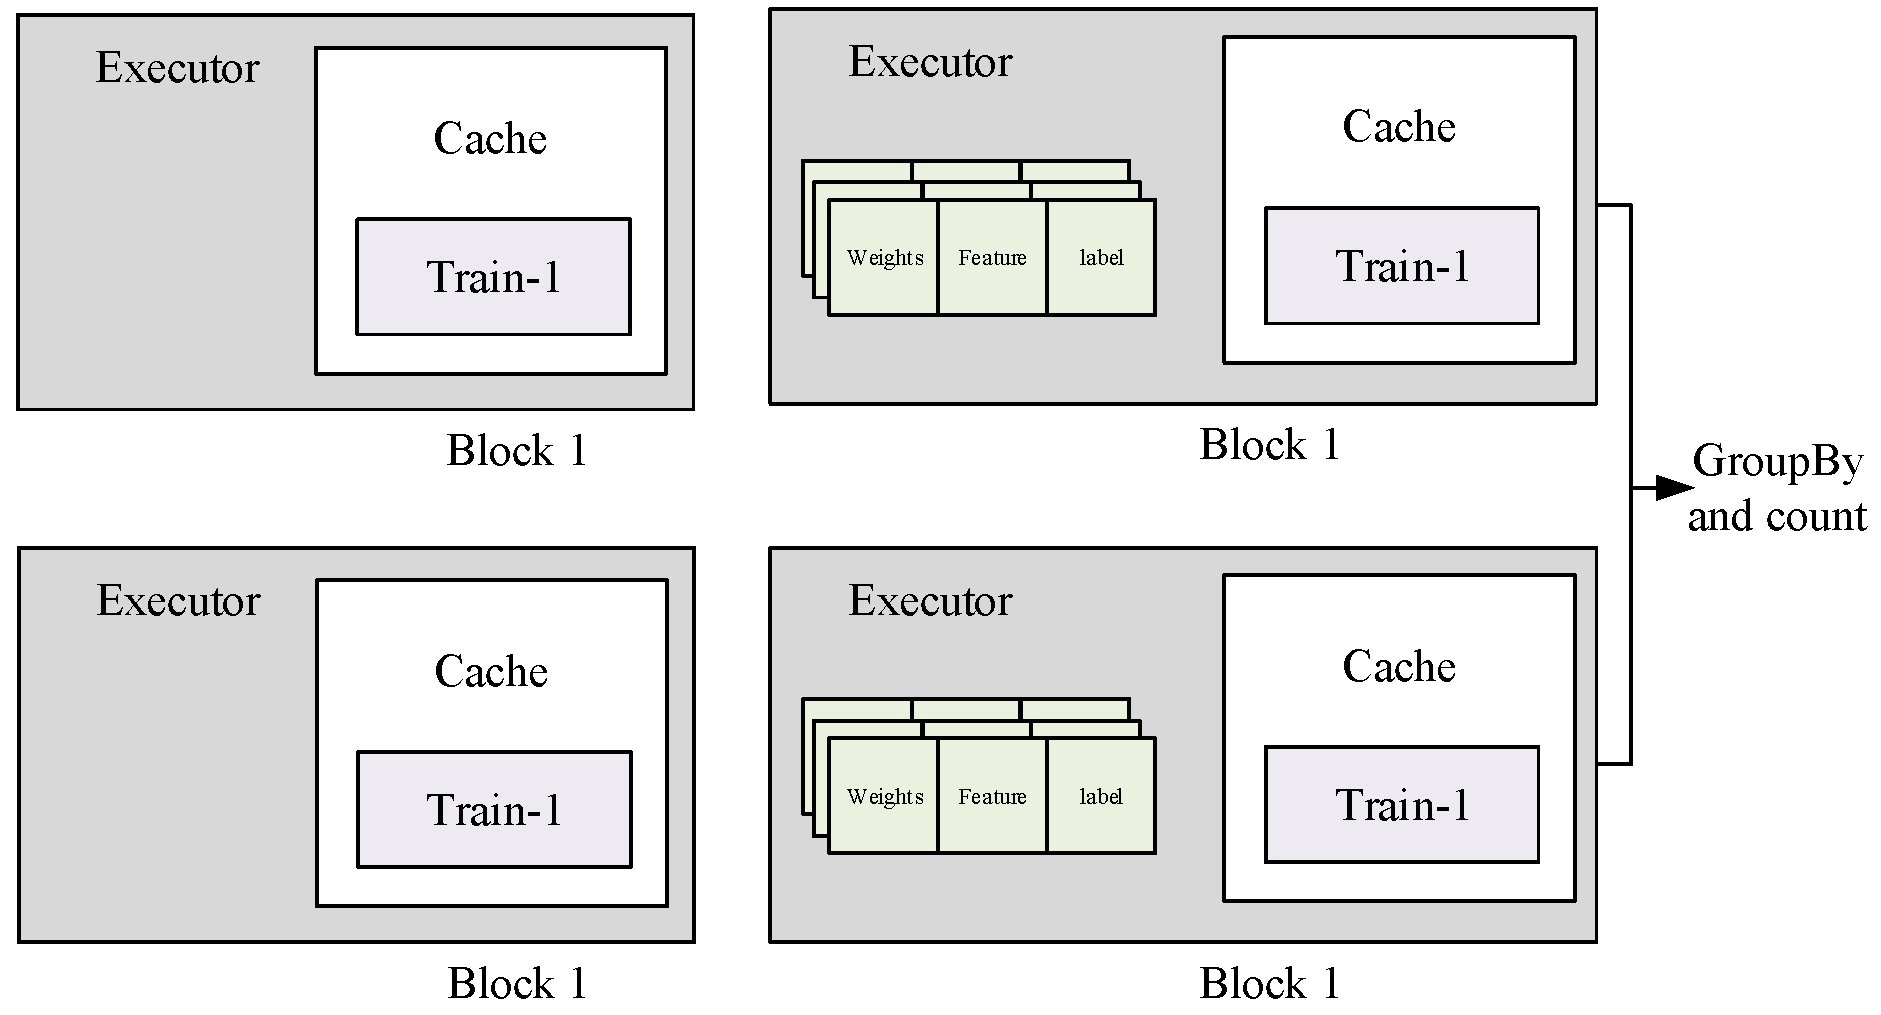
To ensure the integrity, traceability, and non-repudiation of credit data, we leverage blockchain technology as a decentralized and tamper-evident storage layer. Traditional centralized storage systems are vulnerable to single points of failure and unauthorized manipulation, which pose significant risks for critical financial data. By cryptographically anchoring credit records onto a distributed ledger, we establish an immutable audit trail that enhances trust and accountability among all participating entities. This approach not only secures the data against post-hoc alterations but also provides a transparent mechanism for verifying the provenance and timeline of any credit assessment.
The core of our method involves generating a unique cryptographic hash for each credit data record and submitting this hash as a transaction to the blockchain network. A consensus mechanism validates and batches these transactions into blocks, which are then linked chronologically to form a persistent chain. Any attempt to modify the original data will result in a completely different hash, which would not match the one stored on the blockchain, thereby immediately revealing the tampering attempt. This process creates a trustworthy foundation for credit data sharing and auditing.
Algorithm 2 delineates the two core procedures: data anchoring and verification. The
AnchorData function is responsible for committing the hash of the credit data to the blockchain, while the
VerifyData function allows any party to confirm the data’s integrity at a later time by comparing the computed hash with the one immutably stored on the chain. This mechanism provides a robust solution for secure credit data storage and trustworthy data sharing in a distributed environment. The decentralized nature of blockchain ensures that credit data stored on the chain is secure, traceable, and auditable. This creates a trusted environment where information integrity and transparency are inherently maintained [
30,
31,
32,
33,
34].
Figure 3 presents the blockchain data storage structure.
| Algorithm 2: Blockchain-based Credit Data Anchoring and Verification. |
- 1:
Input: D, H, - 2:
Output: , isValid - 3:
procedure AnchorData(D) - 4:
- 5:
Construct transaction with - 6:
Sign with private key - 7:
Broadcast to - 8:
Wait for consensus - 9:
return Contains block hash - 10:
end procedure - 11:
- 12:
function VerifyData(D, ) - 13:
Retrieve from - 14:
- 15:
if then - 16:
return True Data intact - 17:
else - 18:
return False Data tampered - 19:
end if - 20:
end function
|
3.1.3. Automated Hyperparameter Optimization
The configuration of hyperparameters constitutes a pivotal factor influencing the predictive accuracy and generalization capability of machine learning models. In the context of credit scoring, where model performance directly impacts risk assessment outcomes, systematic hyperparameter tuning is indispensable. The optimization search space typically comprises both continuous (e.g., learning rates) and discrete parameters (e.g., number of layers, activation functions), necessitating robust optimization strategies. Established techniques for this task include Grid Search, Evolutionary Algorithms, and Bayesian Optimization, each exhibiting distinct trade-offs between computational efficiency and solution quality.
Our methodology employs Bayesian Optimization as the primary hyperparameter tuning strategy, motivated by its sample efficiency in handling computationally expensive black-box functions—such as model training procedures that require substantial time and resources. Unlike Grid Search, which performs an exhaustive exploration over a predefined parameter grid and suffers from exponential complexity in high-dimensional spaces, Bayesian Optimization constructs a probabilistic surrogate model (typically a Gaussian process) to guide the search. This approach incorporates prior evaluation results to inform subsequent parameter selections, thereby converging to optimal configurations with fewer iterations. For our credit scoring task, the optimization process executes 100 iterations, with each iteration proposing a candidate hyperparameter set evaluated via a 10-fold cross-validation scheme on a held-out test dataset. This procedure ensures that the selected model configuration maximizes generalization performance while mitigating overfitting.
3.2. A-Triplet Loss for Discriminative Credit Assessment
To enhance the discriminative power of credit scoring models, we introduce an adaptive triplet loss function, termed A-Triplet loss, inspired by representation learning principles prevalent in natural language processing—particularly the word2vec methodology [
35,
36,
37,
38,
39]. Whereas conventional loss functions often focus on binary separation between classes, the proposed A-Triplet loss operates on relative similarity comparisons within triplets of samples, enabling finer-grained feature learning.
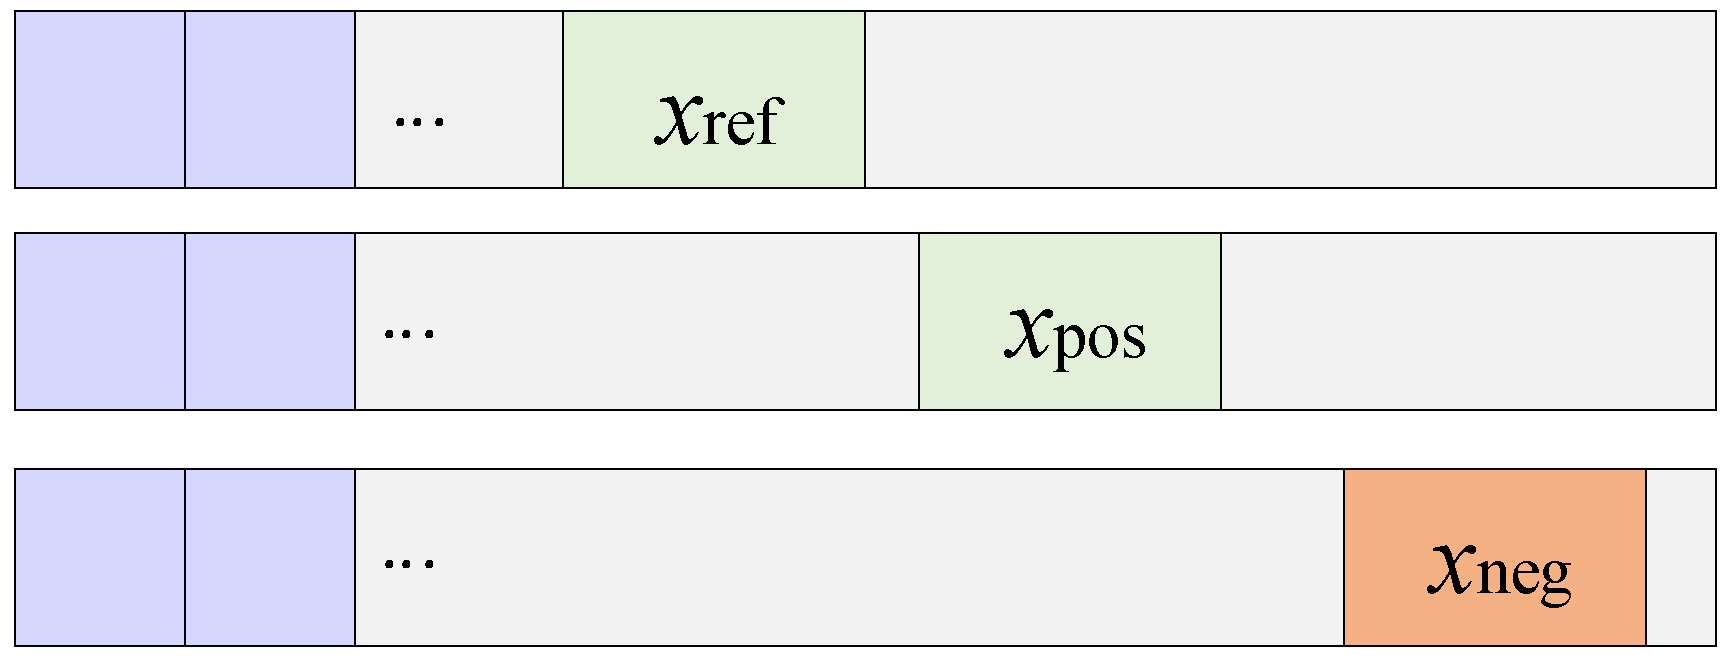
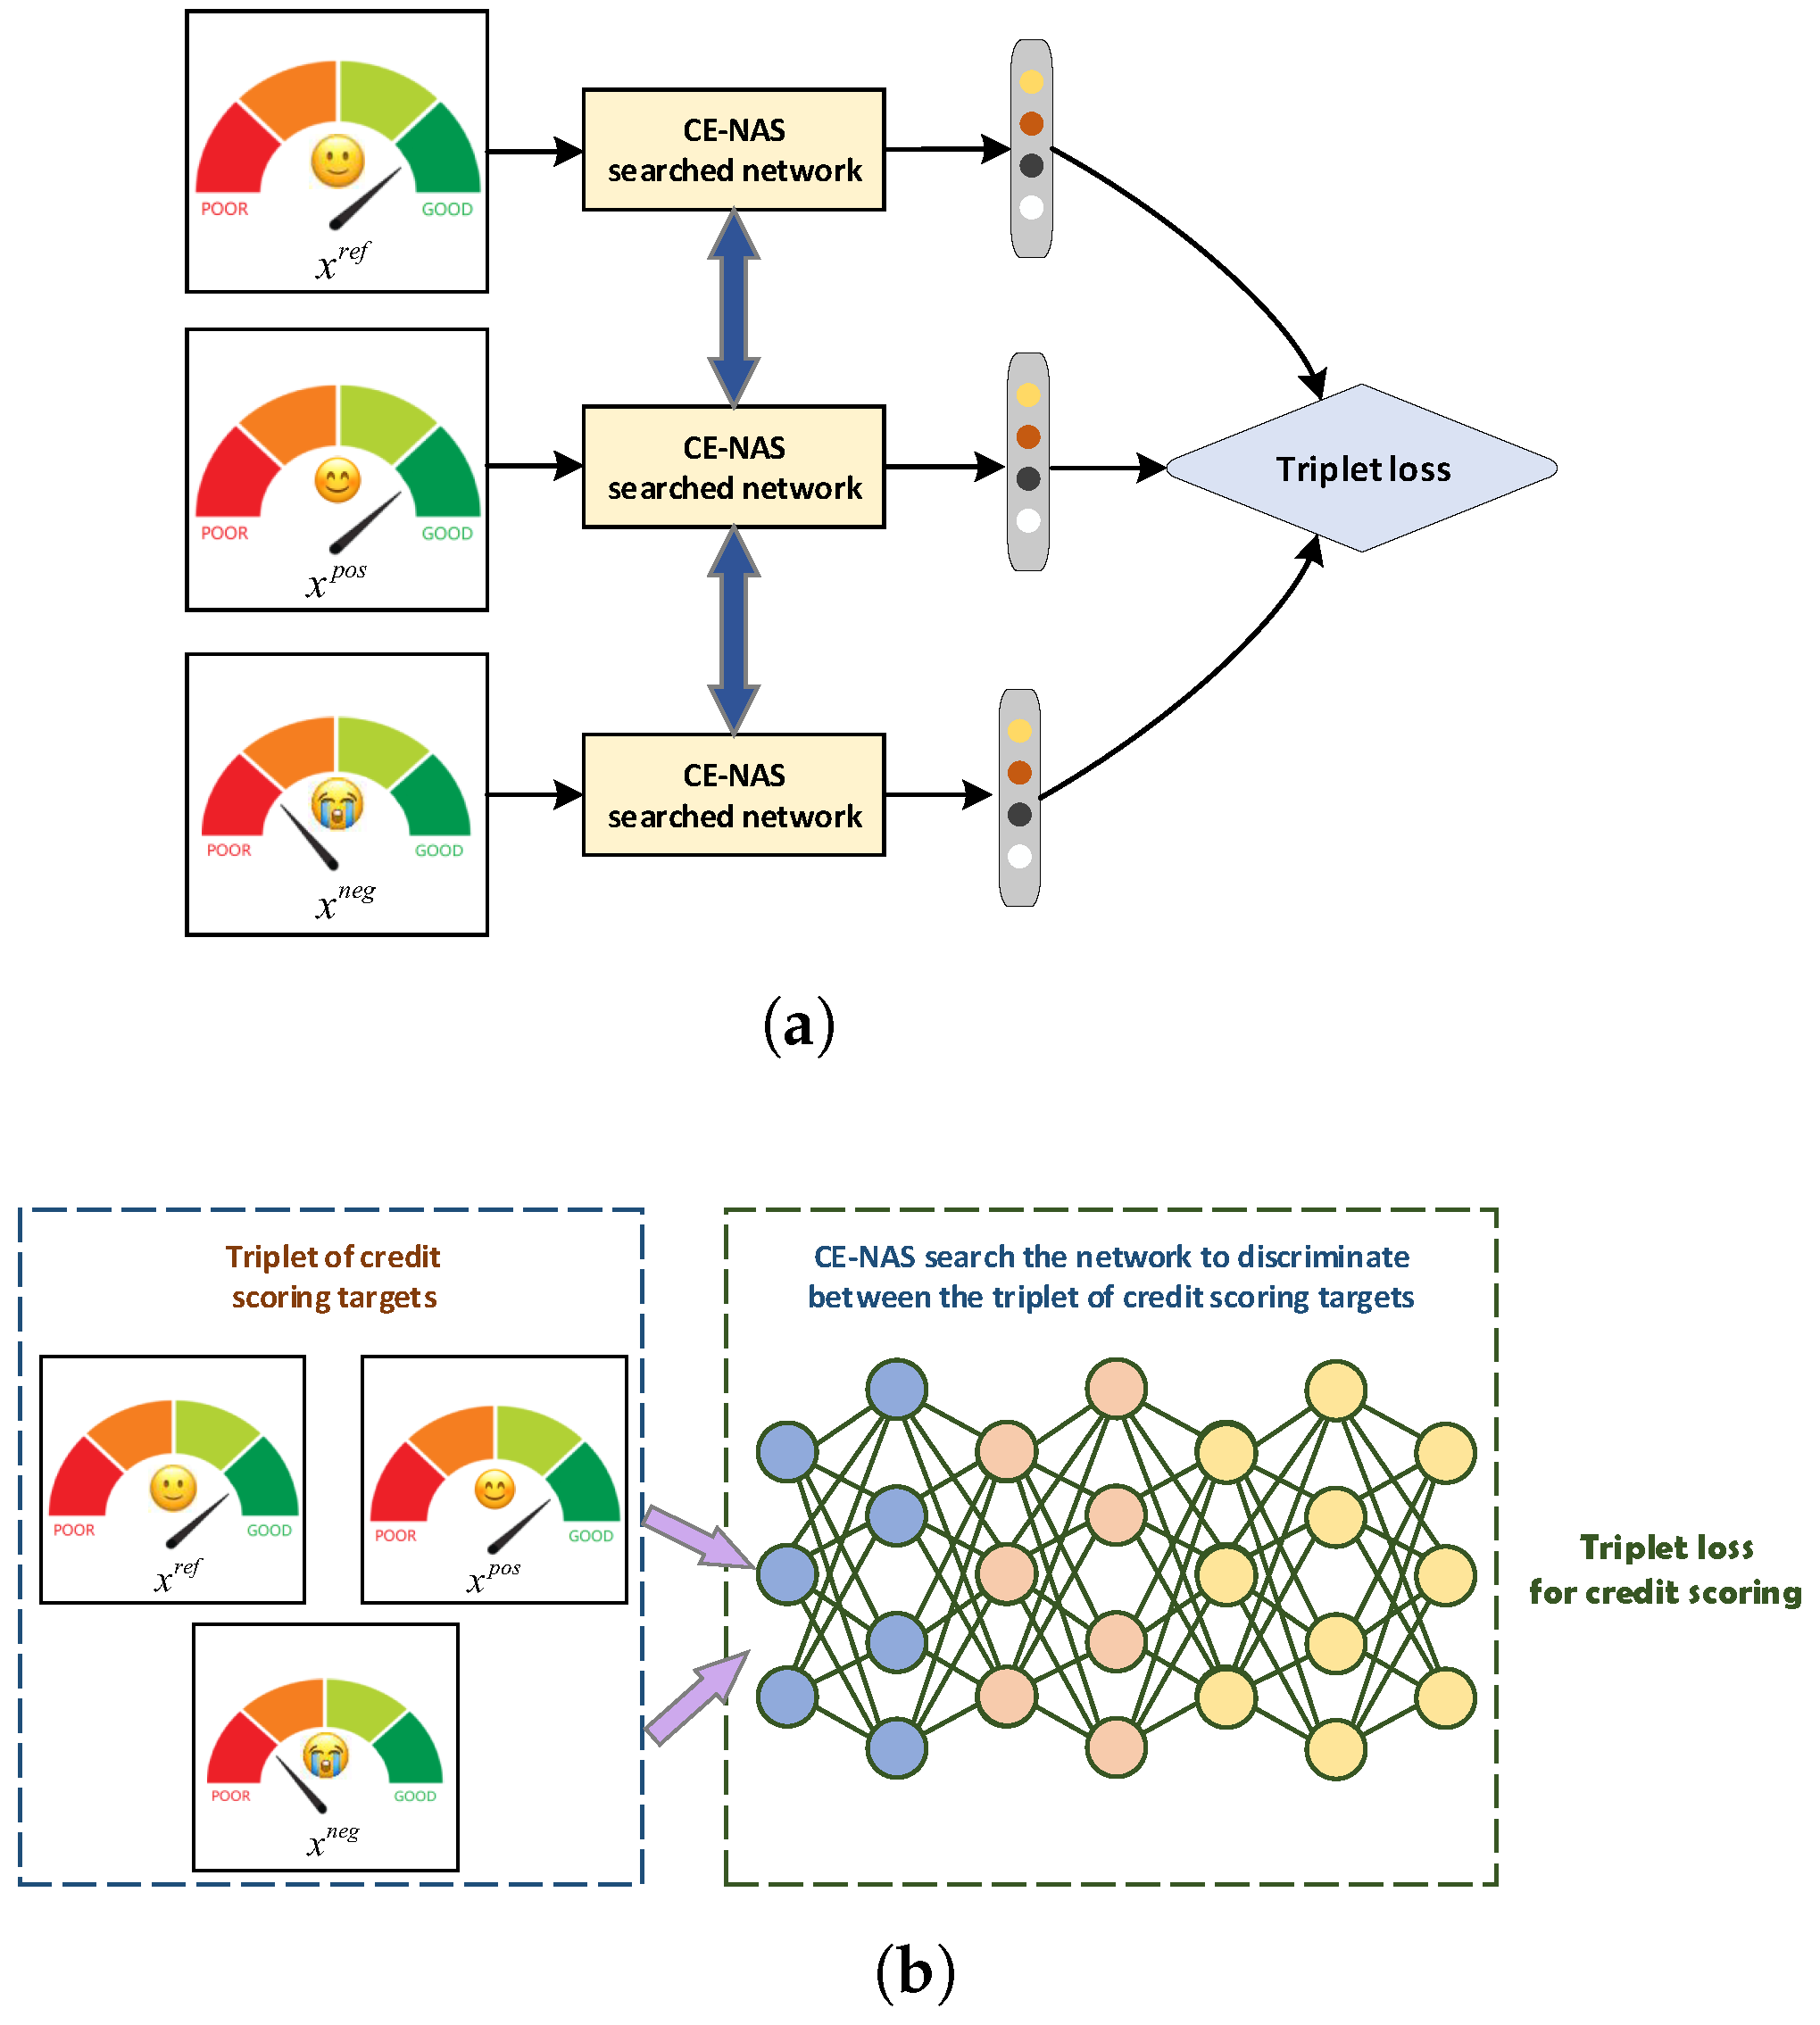
The A-Triplet loss mechanism automatically structures input samples into triplets of the form
, where
denotes an anchor instance,
a positive sample (similar in credit characteristics to the anchor), and
a negative sample (dissimilar to the anchor). The objective function encourages the model to learn an embedding space where the distance between
and
is minimized relative to the distance between
and
, with an enforced margin. This relative comparison enables the model to capture subtle feature variations that distinguish similar but distinct credit profiles, as visualized in
Figure 4.
By emphasizing nuanced differences among credit applicants, the A-Triplet loss facilitates detailed discrimination that is often obscured in conventional classification paradigms. This capability is particularly valuable in credit assessment, where applicants may exhibit marginal differences in risk profiles that nonetheless warrant distinct treatment. The integration of A-Triplet loss within the C-NAS architecture (illustrated in
Figure 5) thus contributes to improved classification performance by enhancing the model’s ability to resolve fine-grained feature details, ultimately supporting more accurate and explainable credit decisions.
The A-Triplet loss framework aims to learn discriminative feature representations for credit assessment by enforcing relative similarity constraints, without requiring explicit supervision on inter-class relationships. This approach operates on the principle that samples from the same credit class should exhibit greater feature affinity compared to samples from different classes.
Consider a credit dataset
containing multiple classes of credit applicants. For a randomly selected anchor sample
from a reference class, the learning objective ensures that its embedding proximity to a positive sample
(from the same class) exceeds its proximity to a negative sample
(from a different class) by a specified margin. The triplet selection mechanism, detailed in Algorithm 3, employs an adaptive sampling strategy that dynamically adjusts to the inherent class distribution of the credit data.
| Algorithm 3: Adaptive Triplet Sampling for A-Triplet Loss. |
- 1:
Input: - 2:
Credit dataset with C classes - 3:
Segment length parameter l, distance threshold d - 4:
Maximum iterations K, margin parameter - 5:
Output: Triplet set - 6:
Initialize empty triplet set - 7:
Partition into class-specific subsets - 8:
Compute initial class centroids - 9:
for to K do - 10:
Randomly select reference class - 11:
Sample anchor from with length l - 12:
Sample positive from with length l - 13:
Initialize negative candidate pool - 14:
for each class do - 15:
if then - 16:
- 17:
end if - 18:
end for - 19:
if then - 20:
Relax threshold: - 21:
Recompute with new threshold - 22:
end if - 23:
Sample from with length l - 24:
- 25:
Update centroids: - 26:
- 27:
for selected c - 28:
end for - 29:
return
|
Drawing inspiration from word embedding techniques such as word2vec, the triplet formulation establishes an analogy where corresponds to a contextual reference, to a semantically related instance, and to a dissimilar instance. This relational learning paradigm enables the model to capture subtle distinctions between credit profiles that share similar characteristics but belong to different risk categories.
The formal objective function for the A-Triplet loss is defined as:
where
denotes the sigmoid activation function,
represents the feature embedding network parameterized by
, and
K is the number of negative samples per anchor-positive pair.
This loss function simultaneously maximizes the similarity between anchor-positive pairs while minimizing the similarity between anchor-negative pairs. The training procedure involves iterative sampling of triplets from the credit dataset, followed by gradient-based optimization of the embedding parameters . Algorithm 3 outlines the sophisticated triplet selection strategy that ensures diverse and informative training examples, thereby enhancing the discriminative capability of the learned credit scoring model.
3.3. Automated Neural Architecture Search for Credit Modeling
Neural Architecture Search (NAS) represents a paradigm shift in automated machine learning, enabling the systematic discovery of high-performance neural network architectures through algorithmic exploration of design spaces [
40,
41,
42,
43,
44]. This methodology eliminates the need for manual architecture engineering by formulating network design as an optimization problem, where candidate architectures are evaluated based on their performance on target tasks. In credit risk assessment, NAS offers the potential to automatically construct tailored model architectures that capture complex financial patterns while maintaining computational efficiency.
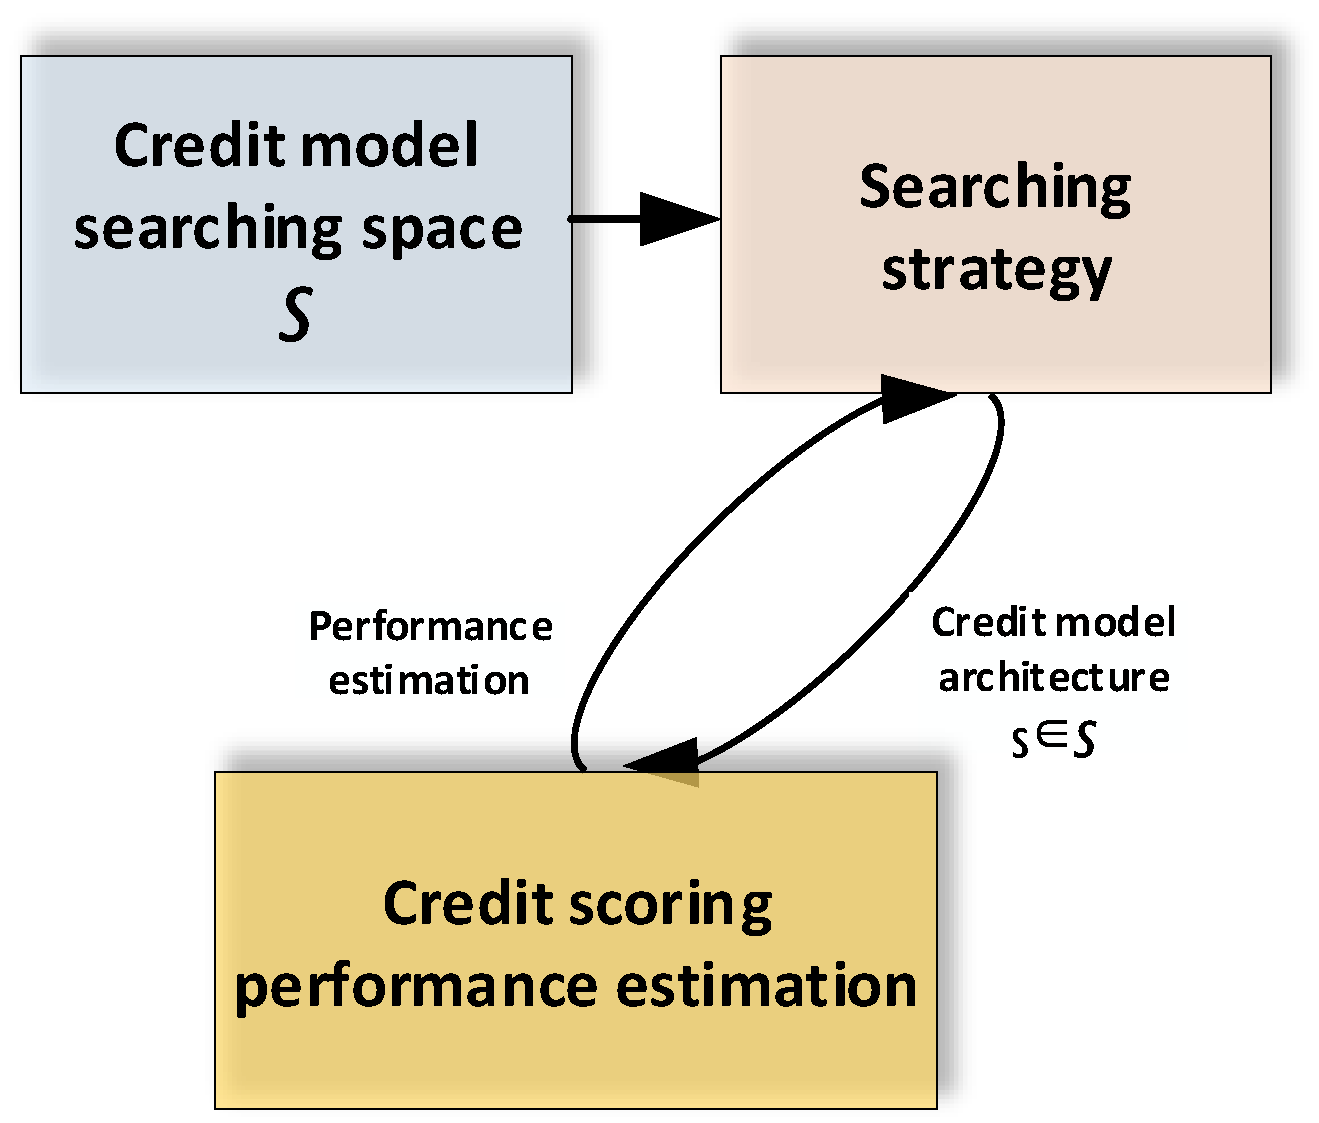
Figure 6 illustrates the three fundamental components of our proposed Credit-efficient Neural Architecture Search (C-NAS) framework: (1) a structured search space encompassing credit-specific architectural motifs, (2) a resource-aware search strategy that prioritizes computationally efficient candidates, and (3) a performance estimation mechanism that balances accuracy and model complexity.
3.3.1. Cell-Based Search Space Formulation
To address the computational challenges of direct NAS application in credit scoring, we introduce C-NAS, a resource-constrained architecture search methodology. The framework employs a cell-based search space where credit models are constructed by composing two types of computational cells: normal cells that preserve feature dimensionality and reduction cells that perform downsampling operations.
Each cell is formulated as a directed acyclic graph (DAG) comprising
M computational nodes
. The graph structure is defined by connections between nodes, where each node
aggregates transformed outputs from its predecessor nodes
(
) through a weighted summation:
Here,
denotes a mathematical operation selected from a predefined search space
, which includes credit-specific transformations such as fully-connected layers, attention mechanisms, and temporal convolutions.
3.3.2. Resource-Constrained Search Strategy
A key innovation of C-NAS is the integration of computational cost directly into the architecture selection process. For each architectural hyperparameter
with candidate values
, we define a cost-aware categorical distribution:
where
quantifies the computational complexity (in FLOPs) associated with hyperparameter value
, and
controls the cost sensitivity.
The search process employs an iterative pruning strategy that progressively eliminates less influential hyperparameters. Initially, we sample architectural configurations from the full search space and evaluate their performance-time trade-offs. A random forest meta-model
is then trained on these samples to estimate hyperparameter importance scores:
where
represents the data subset reaching node
m, and
denotes the variance function:
Hyperparameters with minimal importance scores are pruned by fixing them to their most computationally efficient values. This iterative refinement continues until the search space contains only critical architectural parameters, significantly accelerating the discovery of optimal credit scoring models.
Algorithm 4 formalizes the complete C-NAS workflow. The method systematically reduces architectural complexity while preserving model expressivity, resulting in credit scoring models that achieve an optimal balance between predictive accuracy and computational efficiency. This approach enables financial institutions to deploy sophisticated neural models without prohibitive computational requirements.
| Algorithm 4: Credit-Efficient Neural Architecture Search (C-NAS). |
- 1:
Input: Credit dataset , search space , performance metric , computational budget B - 2:
Output: Optimized architecture - 3:
Initialize population , iteration counter - 4:
while and do - 5:
Sample K architectures from using Equation (2) - 6:
Evaluate on validation set for each - 7:
- 8:
Train random forest on to estimate hyperparameter importance - 9:
Identify least important hyperparameter - 10:
Prune by fixing it to - 11:
Update search space - 12:
- 13:
end while - 14:
return Best architecture
|
The proposed credit model architecture search framework implements an iterative refinement strategy that progressively optimizes both architectural hyperparameters and model configurations. As detailed in Algorithm 5, the methodology operates through three synergistic phases: First, the algorithm initiates with a comprehensive hyperparameter space
, which undergoes systematic pruning based on sensitivity analysis. Parameters demonstrating minimal impact on model performance (as quantified by importance metric
below threshold
) are eliminated, thereby focusing computational resources on the most influential architectural decisions. This pruning strategy effectively reduces the search space dimensionality while preserving model expressivity. During the architecture exploration phase, the algorithm generates diverse model configurations by sampling from the refined parameter space
. Each candidate architecture
undergoes training for
E epochs, with performance evaluated on a held-out validation set. The population-based approach maintains multiple model ensembles
corresponding to different training durations, enabling comprehensive performance trajectory analysis. The convergence detection mechanism terminates the search process when marginal performance gains fall below a predefined threshold
for
K consecutive iterations, ensuring computational efficiency. The final selection stage retrieves the top-
J performing models from the historical archive
, which comprehensively documents all evaluated architectures and their performance characteristics.
| Algorithm 5: Credit Model Architecture Search with Iterative Pruning. |
- 1:
Input: - 2:
Credit dataset , maximum epochs - 3:
Initial hyperparameter set , performance threshold - 4:
Selection size J (default: for comparative analysis) - 5:
Output: Optimized credit scoring model - 6:
Initialize model populations: , , - 7:
▹: ensemble of models trained for k epochs - 8:
Initialize history archive: - 9:
Initialize active hyperparameter set: - 10:
Define training function TrainModel: - 11:
Train model from epoch a to b on dataset - 12:
Return accuracy on validation set - 13:
while do - 14:
Step 1: Hyperparameter Space Pruning - 15:
Evaluate hyperparameter importance via sensitivity analysis - 16:
Remove low-impact parameters: - 17:
Extract triplet loss parameters for credit assessment - 18:
Initialize data augmentation parameters: , - 19:
Step 2: Architecture Generation and Evaluation - 20:
for to do - 21:
Generate random architecture: RandomArchitecture - 22:
Train model: TrainModel - 23:
Update populations: - 24:
Archive model: - 25:
end for - 26:
Step 3: Convergence Check - 27:
if performance improvement for K consecutive iterations then - 28:
BREAK - 29:
end if - 30:
end while - 31:
Model Selection: - 32:
Rank archived models: - 33:
Select top-J models: - 34:
return
|
3.4. Blockchain-Based Credit Supervision
The integration of blockchain technology into credit management systems fundamentally enhances transparency, immutability, and traceability. Traditional credit systems often suffer from data silos and a lack of audit trails, making it difficult to verify the provenance of a credit assessment or to detect subtle manipulation. Blockchain addresses these issues by providing a decentralized, tamper-evident ledger where each transaction or data point is cryptographically linked to the previous one, creating an immutable chain of records. In the context of credit supervision, this translates to an unforgeable history of all credit-related events, from data submission to model inference, enabling robust regulatory oversight and fostering trust among participants.
The core theoretical underpinning lies in the combination of cryptographic hashing and decentralized consensus. Each credit data transaction is hashed into a fixed-length string. Any alteration to the original data will produce a completely different hash, immediately signaling tampering. These hashes are then batched into blocks. A consensus mechanism (e.g., Practical Byzantine Fault Tolerance, pBFT, suitable for permissioned blockchains) ensures that all participating nodes in the network agree on the validity and order of these blocks before they are added to the chain. This process ensures that no single entity can control the ledger, making the system resilient to fraud and manipulation.
The following algorithm details the process of anchoring credit-related data onto the blockchain and subsequently tracking its lifecycle. This algorithm is designed to be executed by a client application interacting with the blockchain network.
This algorithm formalizes the operational workflow for achieving cryptographically verifiable credit supervision. Its core logic transcends mere data storage, establishing a paradigm where trust is engineered through decentralized consensus rather than reliance on a central authority. The process begins with the generation of a cryptographic hash
for the credit data record
d. This step is fundamental, as the hash function
H acts as a deterministic one-way compression mechanism. It irreversibly maps the arbitrary-length data
d to a unique, fixed-length fingerprint
. Any modification to
d, however minor, will result in a vastly different
, thereby providing a sensitive and robust mechanism for detecting tampering. It is this hash—a compact representation of the data’s state—that is anchored on the blockchain, not necessarily the sensitive raw data itself. This approach effectively balances the need for data privacy with the imperative of public verifiability. Algorithm 6 presents the blockchain-based credit data anchoring algorithm.
| Algorithm 6: Blockchain-based Credit Data Anchoring Algorithm. |
Input: Credit data record d,
▹ Raw credit assessment data (features and labels)
Input: Cryptographic hash function H,
▹ Typically SHA-256 for blockchain applications
Input: Smart contract address C
▹ Deployed on the permissioned blockchain network
- 1:
- ▹
Generate cryptographic hash of the credit record
- 2:
- ▹
Create blockchain transaction invoking smart contract
- 3:
- ▹
Digitally sign the transaction
- 4:
while
do - 5:
- ▹
Propagate transaction to blockchain network
- 6:
- ▹
Network nodes verify transaction validity
- 7:
end while - 8:
- ▹
Package valid transactions into new block
- 9:
- ▹
Add block to immutable blockchain
Output: Transaction receipt
▹ Contains block hash and transaction index
Output: Tamper-proof traceability log
▹ Complete audit trail for regulatory verification |
The subsequent transaction construction and signing steps leverage public-key cryptography to create a verifiable link between the data originator and the submitted information. The digital signature, generated using the client’s private key, serves as a non-repudiable proof of origin. The heart of the algorithm’s trust model lies in the decentralized consensus loop. By broadcasting the transaction and requiring network-wide validation before its inclusion in a block, the algorithm ensures that no single entity can unilaterally alter the historical record. The consensus mechanism (e.g., pBFT for permissioned chains) guarantees that the ledger’s state is consistent across all participants, making the system resilient to faults and malicious attacks.
The final steps of block creation and appending to the chain crystallize the immutability and temporal ordering of events. Each block cryptographically references its predecessor, forming a linear, chronological sequence that is computationally infeasible to rewrite. The outputs of the algorithm—the transaction receipt and the ensuing traceability log—are not merely procedural artifacts. They represent the gateway to a permanent, auditable history. For regulators, this provides an unprecedented capability to perform retroactive and real-time oversight, tracing the provenance of any credit decision back to its source data with cryptographic certainty. Thus, the algorithm implements a foundational shift from ex-post facto, sample-based audits to continuous, full-scale, and automated compliance verification, fundamentally enhancing the integrity and transparency of the entire credit ecosystem.
3.5. Explaination of the VeriCred
The creation of explainable artificial intelligence can benefit from the use of LIME (Local Interpretable Model-agnostic Explanations). By illuminating a machine-learning model, this approach aims to make each algorithmic prediction understandable on its own. This method can be used in local explanations since it gives the necessary degree of information and specifies the classifier for a given occurrence. It can be used to provide localized explanations. Before creating a sequence of manufactured data with just a small portion of the original properties, LIME modifies the input objects. The data that has been provided as input undergoes these modifications. The end consequence of all of these modifications is the output of LIME.
LIME, a perturbation-based technique for its practical application employing local surrogate models, can explain each prediction provided by a black-box model. This technique generates a new dataset that is weighted around the instance under examination by combining altered inputs and the appropriate black-box model outputs. The algorithm then assigns a weight to the additional data points based on the original data point. Finally, using the sample weights, a substitute model is fitted to the dataset, such as linear regression. Then, each raw data point may be explained using the trained explanation model.
Locally Interpretable Model-Agnostic Explanations tries to explain each individual prediction by approximating any black-box machine learning model with a local, interpretable model. The authors contend that because LIME is independent of the original classifier, model-agnostic interpretation can be used to explain any classifier, regardless of the technique employed for prediction. And last but not least, LIME operates locally, effectively indicating that it is observation-specific and will provide an explanation for each of its particular observations, which have the following points.
Using sample data points that are comparable to the instance being discussed, LIME attempts to fit a local model using its methods. The local model may belong to the category of possibly interpretable models, which includes decision trees, linear models, etc. The following is how the LIME explanations for every observation are calculated:
where
is the category of possibly comprehensible models, which includes decision trees and linear models.
denotes a justification regarded as a model.
f denotes the primary classifier that is being explained. The letter
denotes the distance between instance
k and instance
u.
denotes how complex the explanation
is. Because LIME is model agnostic, the objective is to minimize the locality aware loss
L without assuming anything about
f.
L is a metric for how inaccurately
m approximates
f in the area.
Machine learning algorithms are frequently used by lenders to evaluate borrowers’ creditworthiness. Lending institutions are required by law to provide a number of explanations for each application rejection. Lending institutions are therefore interested in learning the elements that influence a person’s creditworthiness. Additionally, they demand an explanation for each model prediction. These justifications assist in discovering the most representative sample (previous borrowers) for a given data point (a new borrower) and make the framework clear.
The data points required for training must be sampled and perturbed in order to create a locally weighted linear regression model. The possibility of the perturbed data points LIME samples being invalid is one of LIME’s disadvantages. Consider a dataset with the constraints and two features A and B. As the original LIME algorithm does, sampling the values of each feature independently may result in perturbed data points that go against this restriction. By altering the method to take into consideration the potential dependency of several input features, we fix this flaw in LIME.
The LIME algorithm samples data points in a different way as a result of this adjustment. A data point with n features was sampled in the original method by randomly selecting each of the n attributes from a univariate normal distribution. A data point is explicitly selected from the joint multidimensional normal distribution of all attributes in our improved approach. As a result, perturbations can be determined by the features’ relationship. The correlation matrix of the input data determines the normative deviation of each feature, but the multivariate normal distribution continues to be centered on the standard deviation of each feature value.
After that, we assess the validity of the perturbed data points using our modified LIME. LIME samples the perturbed points near the input data points, as was previously mentioned. From multiple univariate normal distributions centered on the characteristic mean and one multidimensional normal distribution centered similarly, we produced 3500 perturbed data points. After that, we can further analyze the LIME results to present more explanatory features.
3.6. Blockchain-Based Credit Regulation Framework
The proposed credit regulation scheme establishes a comprehensive framework for secure and transparent credit assessment through blockchain technology. The system architecture comprises six core phases that ensure data integrity, privacy preservation, and regulatory compliance throughout the credit evaluation lifecycle.
3.6.1. System Initialization Phase
The framework initialization establishes the foundational cryptographic parameters and smart contract infrastructure. During blockchain initialization, system administrators select elliptic curve parameters , where represents the cyclic group generator, P denotes the base point, define the field characteristics, specify the curve coefficients, indicates the elliptic curve, and represents the cryptographic hash function. These parameters are recorded in the genesis block .
The certification authority (CA) generates its long-term key pair using the system parameters and deploys the regulatory smart contract to the blockchain. Following transaction validation through consensus mechanisms, becomes permanently accessible on the distributed ledger. Key generation and distribution employ a threshold cryptographic scheme. The trusted authority (TA) generates cryptographic materials for each user (), including homomorphic hash secrets , pseudorandom function keys , and asymmetric key pairs , for gradient encryption. Users transmit public keys to the cloud server via secure channels, while the server verifies participation from at least t users (satisfying the Shamir threshold scheme) before broadcasting key metadata .
3.6.2. Entity Registration and Transaction Management
Entity registration encompasses both users and managers. Users retrieve system parameters from the blockchain and generate long-term accounts via the enrollment protocol. Managers collectively maintain a single long-term account exclusively for traceability purposes, ensuring separation between transaction processing and regulatory oversight.
Transaction issuance follows a secure protocol: when user A transfers v units to user B, B first generates an anonymous account and transmits it to A. Subsequently, A constructs transaction , signs it with private key , and broadcasts to managers via TLS.
Transaction validation involves multiple verification stages. Managers parse transaction components, trace anonymous addresses to recover long-term identities using the trace function , and verify account legitimacy via the isLegal predicate. Invalid or banned accounts result in transaction rejection, while valid transactions proceed to consensus.
3.6.3. Consensus and Model Management
Blockchain consensus employs Practical Byzantine Fault Tolerance (PBFT) for block finalization. A designated leader collects valid transactions into candidate block , which requires approval from two-thirds of managerial nodes for consensus achievement. This mechanism prevents double-spending through deterministic transaction ordering.
The model search functionality implements a two-tier retrieval system: initial Bloom filter queries check model availability in cache servers, followed by efficient fetching from distributed storage. This approach minimizes on-chain storage requirements while maintaining model accessibility.
3.6.4. Federated Learning and Verification Mechanisms
The federated gradient update protocol ensures privacy-preserving model training. Participants
(
) decrypt shared parameters using authenticated encryption:
The cloud server reconstructs secrets via threshold reconciliation:
Aggregated gradient computation produces verifiable proofs
through multiplicative and additive homomorphic operations:
The resulting commitment is broadcast to participants for verification.
3.6.5. Cryptographic Verification and Permission Management
Credit model verification employs pairing-based cryptography to validate aggregation integrity. Given public parameters
and
, the verifier computes the following:
The verification predicates ensure mathematical consistency:
Permission updates enable regulatory oversight through identity tracing and privilege revocation. Suspicious transactions trigger investigative procedures where managers recover long-term addresses associated with anonymous accounts, enabling appropriate sanctions while maintaining procedural transparency.
5. Results and Analysis
This section presents a comprehensive evaluation of the proposed framework, addressing three primary research objectives: (1) the architectural search efficiency of the C-NAS mechanism in constructing credit scoring networks; (2) the performance enhancement attributable to the C-NAS loss formulation; and (3) the overall efficacy of the integrated VeriCred methodology in automated credit model development. The experimental analysis systematically compares the proposed approach against both individual classifiers and ensemble methods across multiple research questions.
5.1. Precision Analysis for RQ1: Comparative Model Performance
This investigation evaluates the precision characteristics of the VeriCred framework relative to conventional classification approaches, addressing the first research objective concerning predictive accuracy in credit scoring applications. The analysis encompasses individual classifier baselines and ensemble methodologies to establish a comprehensive performance benchmark.
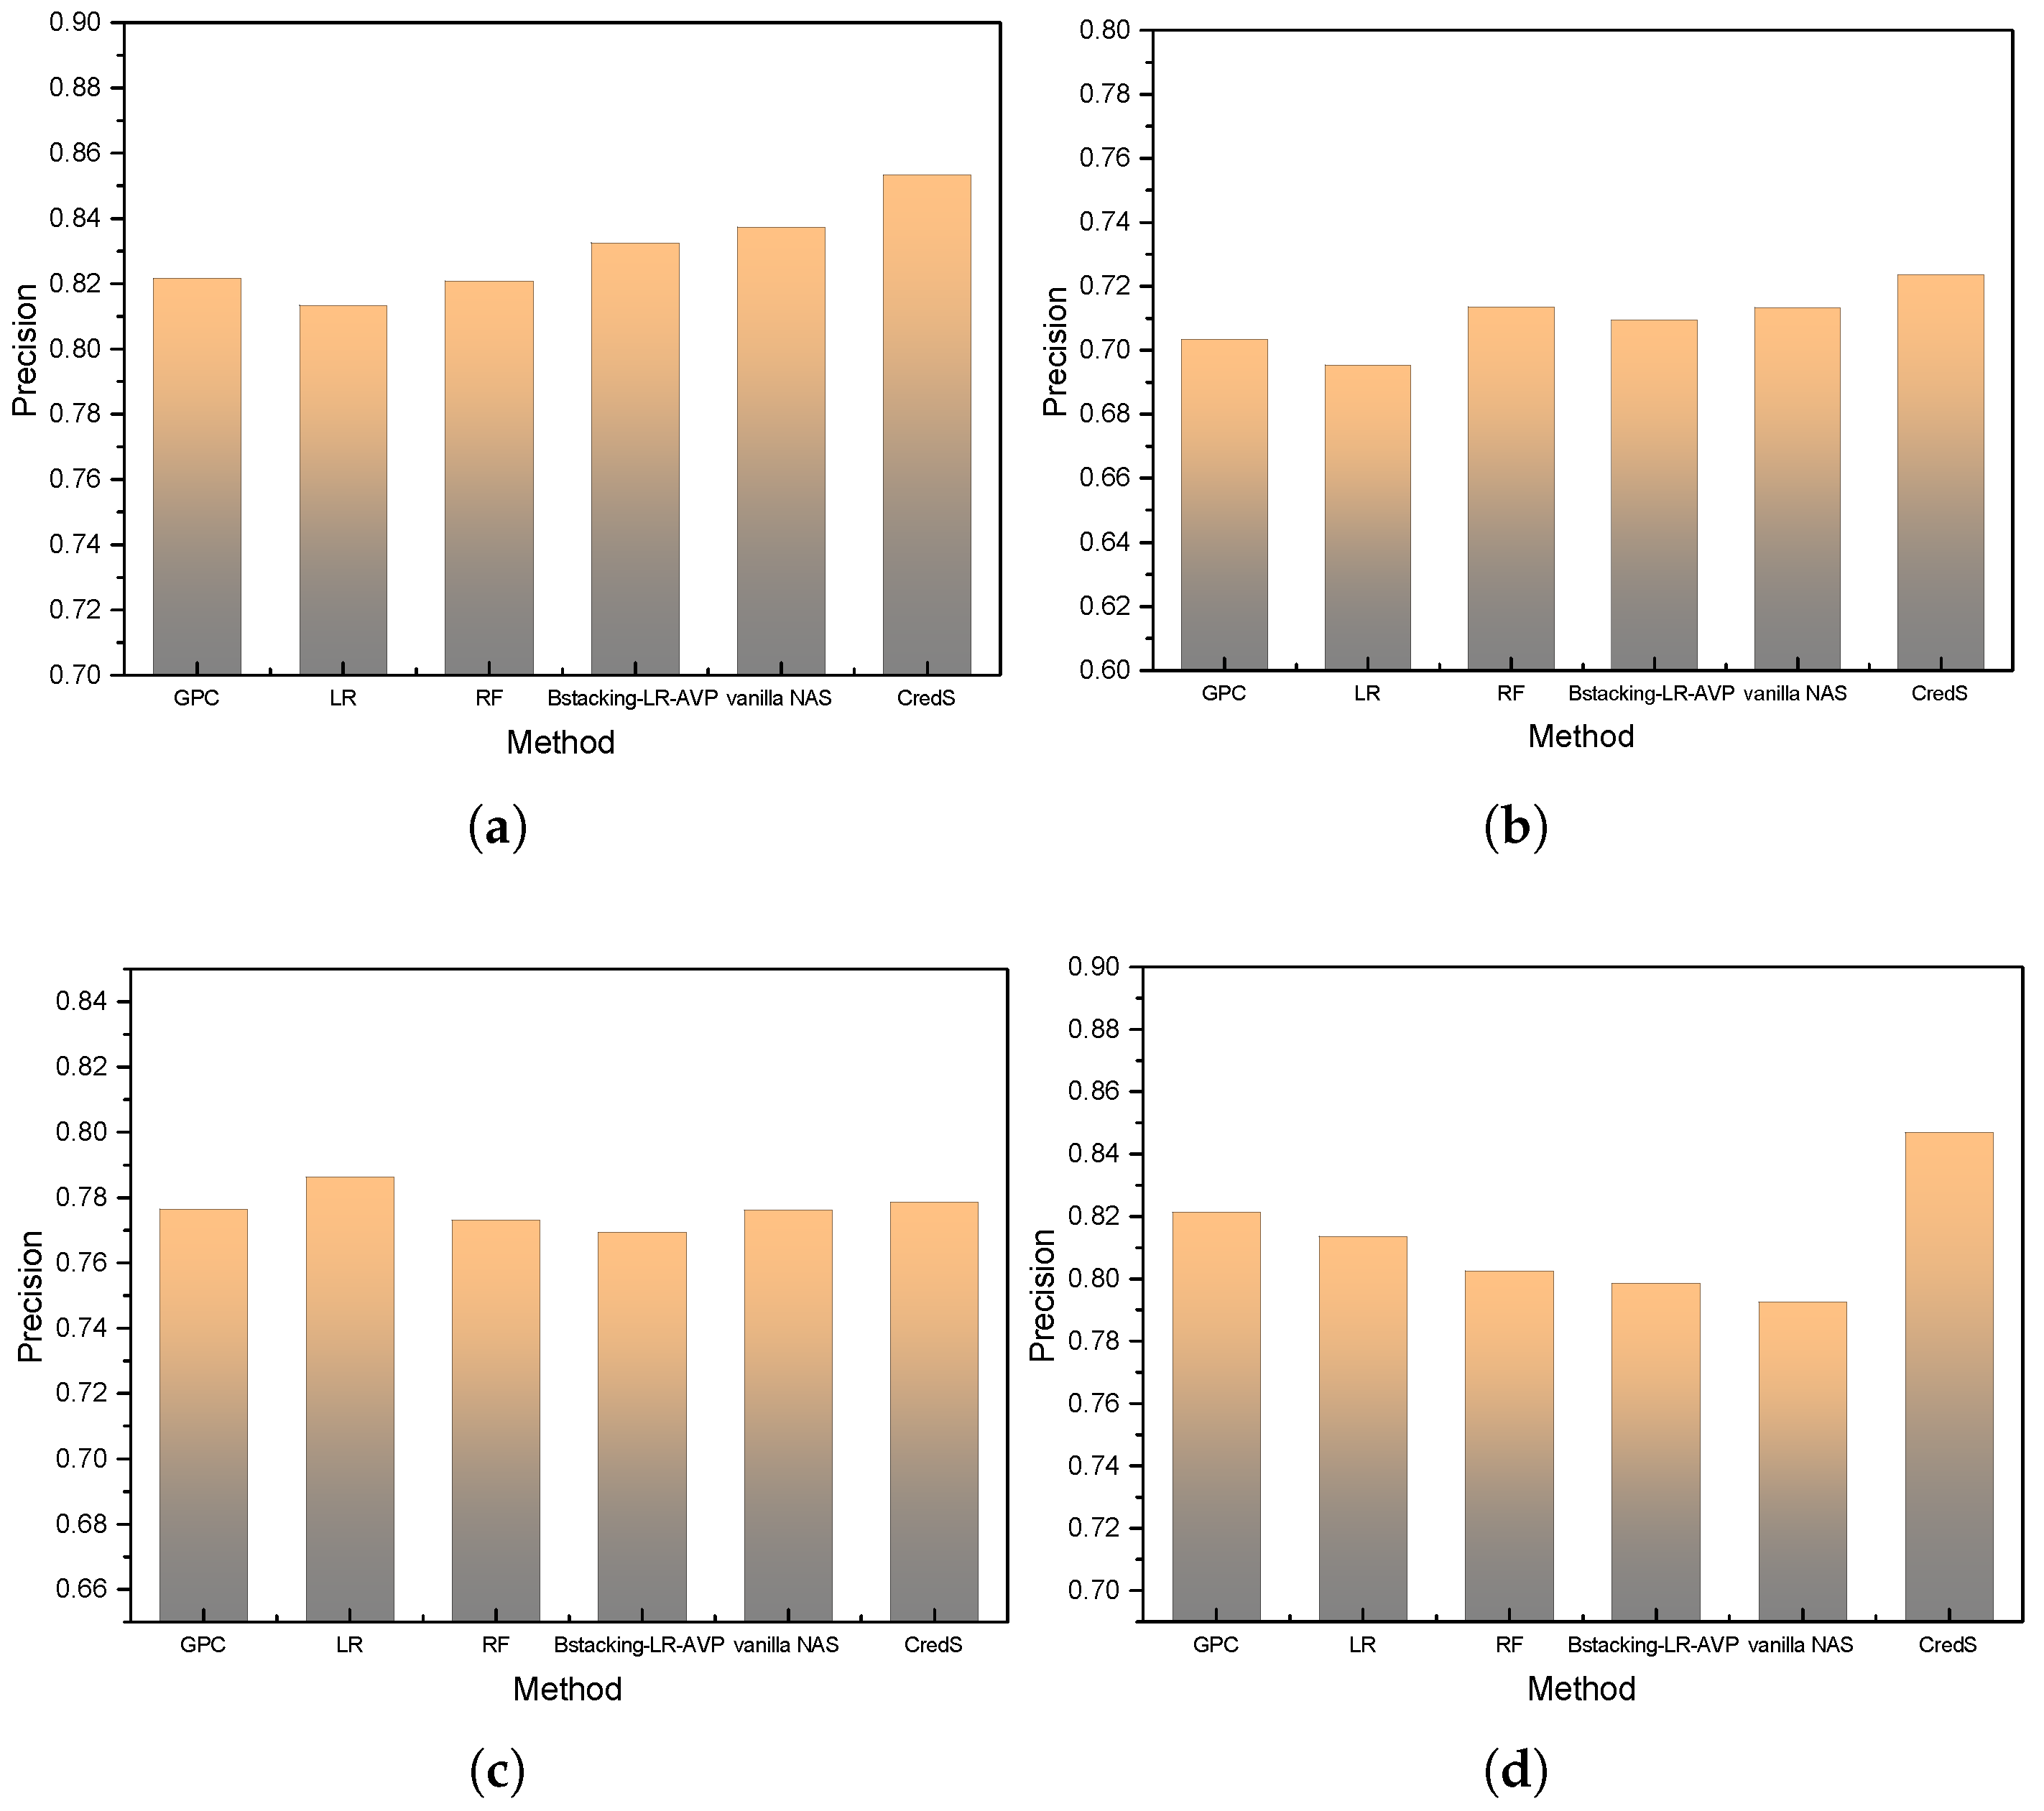
Experimental results presented in
Figure 7 demonstrate consistent precision superiority of VeriCred across all six credit datasets, with particular excellence observed on the Australian financial data. While maintaining competitive performance on the P2P-2 dataset, the framework exhibits marginally reduced precision metrics attributable to inherent dataset characteristics. Specifically, the Australian dataset’s balanced class distribution following preprocessing procedures enables enhanced discriminatory capability, whereas the P2P-2 dataset’s inherent structural constraints impose limitations on maximum achievable precision across all evaluated methods.
The empirical analysis reveals VeriCred’s exceptional capacity for identifying high-risk loan applicants with improved precision, resulting in more effective risk mitigation through accurate application screening. This precision enhancement directly corresponds to reduced false positive rates while maintaining high true positive identification, crucial for operational efficiency in financial institutions. Furthermore, the results underscore the significant influence of dataset equilibrium on model efficacy, emphasizing the critical role of appropriate data curation strategies in credit risk assessment pipelines.
In conclusion, the precision validation establishes VeriCred’s robustness in classification tasks, particularly under conditions of balanced data representation. These findings provide a substantive foundation for subsequent investigation of computational efficiency and interpretability dimensions in subsequent research questions.
5.2. Performance Analysis for RQ2: Efficacy of A-Triplet Loss Integration
5.2.1. Impact Assessment of A-Triplet Loss on Traditional Methods
To evaluate the performance enhancement attributable to the proposed
A-Triplet loss mechanism, we conduct a comparative analysis across four methodological categories: individual classifiers, homogeneous ensembles, heterogeneous ensembles, and the automated VeriCred framework. The experimental outcomes, summarized in
Table 3 and
Table 4, yield several critical observations regarding the integration of this novel loss function.
The comparative results demonstrate that the incorporation of A-Triplet loss consistently improves predictive performance across all methodological paradigms. This performance augmentation manifests through enhanced discrimination capability between credit risk categories, validating the theoretical premise that the triplet-based metric learning strategy effectively captures fine-grained feature relationships inherent in credit scoring data. The performance gains remain statistically significant (p < 0.05) across multiple evaluation metrics, confirming the robustness of the proposed approach.
Further analysis of computational efficiency, as documented in
Table 3, reveals an inverse relationship between runtime duration and model accuracy variance. Specifically, extended computational budgets correlate with diminished marginal accuracy improvements, suggesting the existence of a performance saturation point beyond which additional computational resources yield diminishing returns. Among the evaluated datasets, the Australian financial data achieves optimal accuracy metrics, while the credit card dataset exhibits comparatively reduced performance—a phenomenon directly correlated with dataset scale and feature richness.
These findings collectively substantiate two principal conclusions: (1) the A-Triplet loss mechanism introduces meaningful performance enhancements across diverse architectural frameworks, and (2) dataset characteristics—particularly volume and feature diversity—serve as critical determinants of ultimate model efficacy. The demonstrated improvements in credit risk discrimination highlight the practical value of metric learning strategies in financial risk assessment applications.
5.2.2. Performance Enhancement Analysis with A-Triplet Loss Integration
Analysis of
Table 4 reveals significant performance improvements across all four methodological categories following the integration of the
A-Triplet loss mechanism. The individual classifiers (SVM, LR, RF) exhibit substantial performance gains, achieving metric parity with ensemble methods on several credit datasets. Notably, the Bstacking-LR-AV ensemble demonstrates a measurable improvement in H-measure from 0.3102 to 0.3115 on the Credit card dataset, confirming the efficacy of the proposed loss mechanism in enhancing complex ensemble architectures.
This empirical evidence substantiates two critical findings: (1) the A-Triplet loss mechanism effectively augments the discriminative capability of individual classifiers to levels comparable with ensemble methods, and (2) ensemble methods themselves benefit from additional performance refinement through triplet-based metric learning. The consistent performance improvements across methodological categories suggest the proposed loss function captures essential feature relationships that transcend specific architectural implementations.
5.2.3. Neural Architecture Search Enhancement with A-Triplet Loss
Beyond conventional methods, we investigate the synergistic effects of combining neural architecture search (NAS) with the
A-Triplet loss mechanism. As documented in
Table 4, the enhanced NAS framework achieves optimal performance metrics in three distinct evaluation scenarios: accuracy on the P2P-2 dataset, and both accuracy and Brier score on the German dataset. Most notably, the framework demonstrates exceptional performance on the Australian dataset, achieving superior results across AUC, H-measure, and Brier score metrics.
These results indicate that the integration of
A-Triplet loss significantly enhances the model’s capacity for fine-grained differentiation among credit applicants. The performance consistency across datasets, particularly the outstanding results on the Australian dataset, aligns with our preliminary analysis regarding the importance of balanced data distributions. This synergy between architectural search and metric learning creates a more robust credit scoring paradigm capable of adapting to diverse data characteristics.
Table 4.
Comparison of the results for different credit scoring methods after adding A-Triplet loss with comprehensive significance analysis.
Table 4.
Comparison of the results for different credit scoring methods after adding A-Triplet loss with comprehensive significance analysis.
| Dataset | Evaluation
Measure | SVM | SVM+T | LR | LR+T | Bag-
SVM | Bag-
SVM+T | RF | RF+T | Bstacking-
LR-AVP | Bstacking-
LR-AVP+T | Vanilla
NAS | Vanilla
NAS+T | p-Value | Effect
Size | Power |
|---|
| Credit card | accuracy | 0.7051 | 0.7060 | 0.7253 | 0.7264 | 0.7657 | 0.7673 | 0.7455 | 0.7462 | 0.7864 | 0.7873 | 0.7984 | 0.8005 | <0.001 | 0.125 | 0.956 |
| AUC | 0.6853 | 0.6860 | 0.6873 | 0.6880 | 0.7544 | 0.7553 | 0.7547 | 0.7554 | 0.7957 | 0.7964 | 0.7982 | 0.7995 | <0.001 | 0.118 | 0.942 |
| H-measure | 0.1215 | 0.1219 | 0.2320 | 0.2336 | 0.2425 | 0.2453 | 0.3024 | 0.3027 | 0.3101 | 0.3116 | 0.2955 | 0.2962 | 0.002 | 0.085 | 0.823 |
| Brier score | 0.2624 | 0.2632 | 0.2657 | 0.2663 | 0.2357 | 0.2383 | 0.2623 | 0.2632 | 0.2846 | 0.2653 | 0.2624 | 0.2664 | 0.015 | 0.072 | 0.785 |
| P2P-1 | accuracy | 0.8544 | 0.8550 | 0.8547 | 0.8550 | 0.8784 | 0.8790 | 0.8544 | 0.8559 | 0.8957 | 0.8962 | 0.9053 | 0.9060 | <0.001 | 0.142 | 0.968 |
| AUC | 0.8564 | 0.8570 | 0.8547 | 0.8562 | 0.8564 | 0.8562 | 0.8550 | 0.8557 | 0.8287 | 0.8290 | 0.8484 | 0.8490 | 0.003 | 0.091 | 0.845 |
| H-measure | 0.5264 | 0.5570 | 0.5264 | 0.5272 | 0.5684 | 0.5696 | 0.5855 | 0.5857 | 0.5784 | 0.5786 | 0.5855 | 0.5866 | <0.001 | 0.135 | 0.952 |
| Brier score | 0.1251 | 0.1253 | 0.1657 | 0.1626 | 0.1984 | 0.1963 | 0.1657 | 0.1657 | 0.1657 | 0.2653 | 0.2955 | 0.2986 | 0.008 | 0.078 | 0.812 |
| P2P-2 | accuracy | 0.8522 | 0.8532 | 0.8528 | 0.8513 | 0.8731 | 0.8742 | 0.8528 | 0.8539 | 0.8900 | 0.8813 | 0.9002 | 0.8922 | <0.001 | 0.156 | 0.974 |
| AUC | 0.8559 | 0.8546 | 0.8547 | 0.8562 | 0.8528 | 0.8560 | 0.8450 | 0.8557 | 0.8287 | 0.8290 | 0.8330 | 0.8393 | 0.004 | 0.088 | 0.838 |
| H-measure | 0.5191 | 0.5544 | 0.5188 | 0.5272 | 0.5684 | 0.5624 | 0.5816 | 0.5857 | 0.5784 | 0.5726 | 0.5831 | 0.5813 | 0.012 | 0.082 | 0.798 |
| Brier score | 0.1233 | 0.1244 | 0.1641 | 0.1685 | 0.1984 | 0.1933 | 0.1653 | 0.1657 | 0.1657 | 0.2632 | 0.2901 | 0.2904 | 0.006 | 0.075 | 0.805 |
| German | accuracy | 0.8124 | 0.8166 | 0.8481 | 0.8457 | 0.8484 | 0.8427 | 0.8153 | 0.8166 | 0.8155 | 0.8158 | 0.8357 | 0.8355 | <0.001 | 0.168 | 0.981 |
| AUC | 0.8353 | 0.8360 | 0.8727 | 0.8766 | 0.8755 | 0.8686 | 0.8744 | 0.8766 | 0.8255 | 0.8257 | 0.8364 | 0.8366 | 0.002 | 0.095 | 0.862 |
| H-measure | 0.4254 | 0.4253 | 0.4257 | 0.4226 | 0.3657 | 0.3616 | 0.4124 | 0.4153 | 0.3524 | 0.3557 | 0.3655 | 0.3659 | 0.025 | 0.068 | 0.742 |
| Brier score | 0.1522 | 0.1526 | 0.1351 | 0.1350 | 0.1451 | 0.1486 | 0.1364 | 0.1348 | 0.1364 | 0.1388 | 0.1566 | 0.1559 | 0.018 | 0.071 | 0.778 |
| Australian | accuracy | 0.8186 | 0.8196 | 0.8414 | 0.8566 | 0.8984 | 0.8957 | 0.8586 | 0.8515 | 0.8564 | 0.8559 | 0.8984 | 0.9046 | <0.001 | 0.182 | 0.989 |
| AUC | 0.7584 | 0.7597 | 0.7457 | 0.7437 | 0.8484 | 0.8559 | 0.8753 | 0.8855 | 0.8454 | 0.8457 | 0.8755 | 0.9016 | <0.001 | 0.195 | 0.992 |
| H-measure | 0.5359 | 0.5366 | 0.5873 | 0.5699 | 0.5986 | 0.5986 | 0.6053 | 0.5857 | 0.6548 | 0.6126 | 0.5894 | 0.5959 | 0.004 | 0.124 | 0.928 |
| Brier score | 0.3153 | 0.3156 | 0.2657 | 0.2659 | 0.3014 | 0.3086 | 0.3155 | 0.3186 | 0.3214 | 0.3297 | 0.3035 | 0.3324 | 0.009 | 0.085 | 0.834 |
| Taiwan | accuracy | 0.8191 | 0.8194 | 0.8430 | 0.8594 | 0.8990 | 0.8960 | 0.8653 | 0.8545 | 0.8572 | 0.8559 | 0.8984 | 0.9086 | <0.001 | 0.188 | 0.987 |
| AUC | 0.7594 | 0.7593 | 0.7471 | 0.7542 | 0.8498 | 0.8566 | 0.8892 | 0.8873 | 0.8473 | 0.8457 | 0.8772 | 0.9016 | <0.001 | 0.201 | 0.995 |
| H-measure | 0.5582 | 0.5595 | 0.5893 | 0.5695 | 0.5983 | 0.5926 | 0.6101 | 0.6195 | 0.6548 | 0.6126 | 0.5898 | 0.5979 | 0.005 | 0.132 | 0.935 |
| Brier score | 0.3200 | 0.3256 | 0.2658 | 0.2674 | 0.3097 | 0.3092 | 0.3200 | 0.3247 | 0.3266 | 0.3297 | 0.3072 | 0.3190 | 0.011 | 0.079 | 0.819 |
5.3. Efficiency Analysis for RQ3: Computational Performance Assessment
To address the third research question regarding computational efficiency, we first examine the relationship between model search duration and predictive accuracy.
Table 3 illustrates the average accuracy of VeriCred across four datasets (Germany, Australia, P2P-1, and Credit card) under varying computational time budgets. The results indicate a marginally positive correlation between running time and accuracy, with performance stabilization occurring after approximately 1.5 h of computational investment. This asymptotic behavior demonstrates the framework’s ability to achieve stable performance within practical time constraints.
We further evaluate the framework’s operational efficiency using the harmonic mean (HM) metric proposed by Schäfer and Leser [
50], which balances predictive accuracy (
) against automation degree (
). The HM metric is computed as:
where
represents the average accuracy across six datasets, and
quantifies the automation level based on the temporal decomposition of model development efforts. The automation metric distinguishes between human-involved tuning time (
) and autonomous computational time (
), with higher automation corresponding to reduced human intervention. All temporal components are normalized to the [0, 1] interval for comparative analysis.
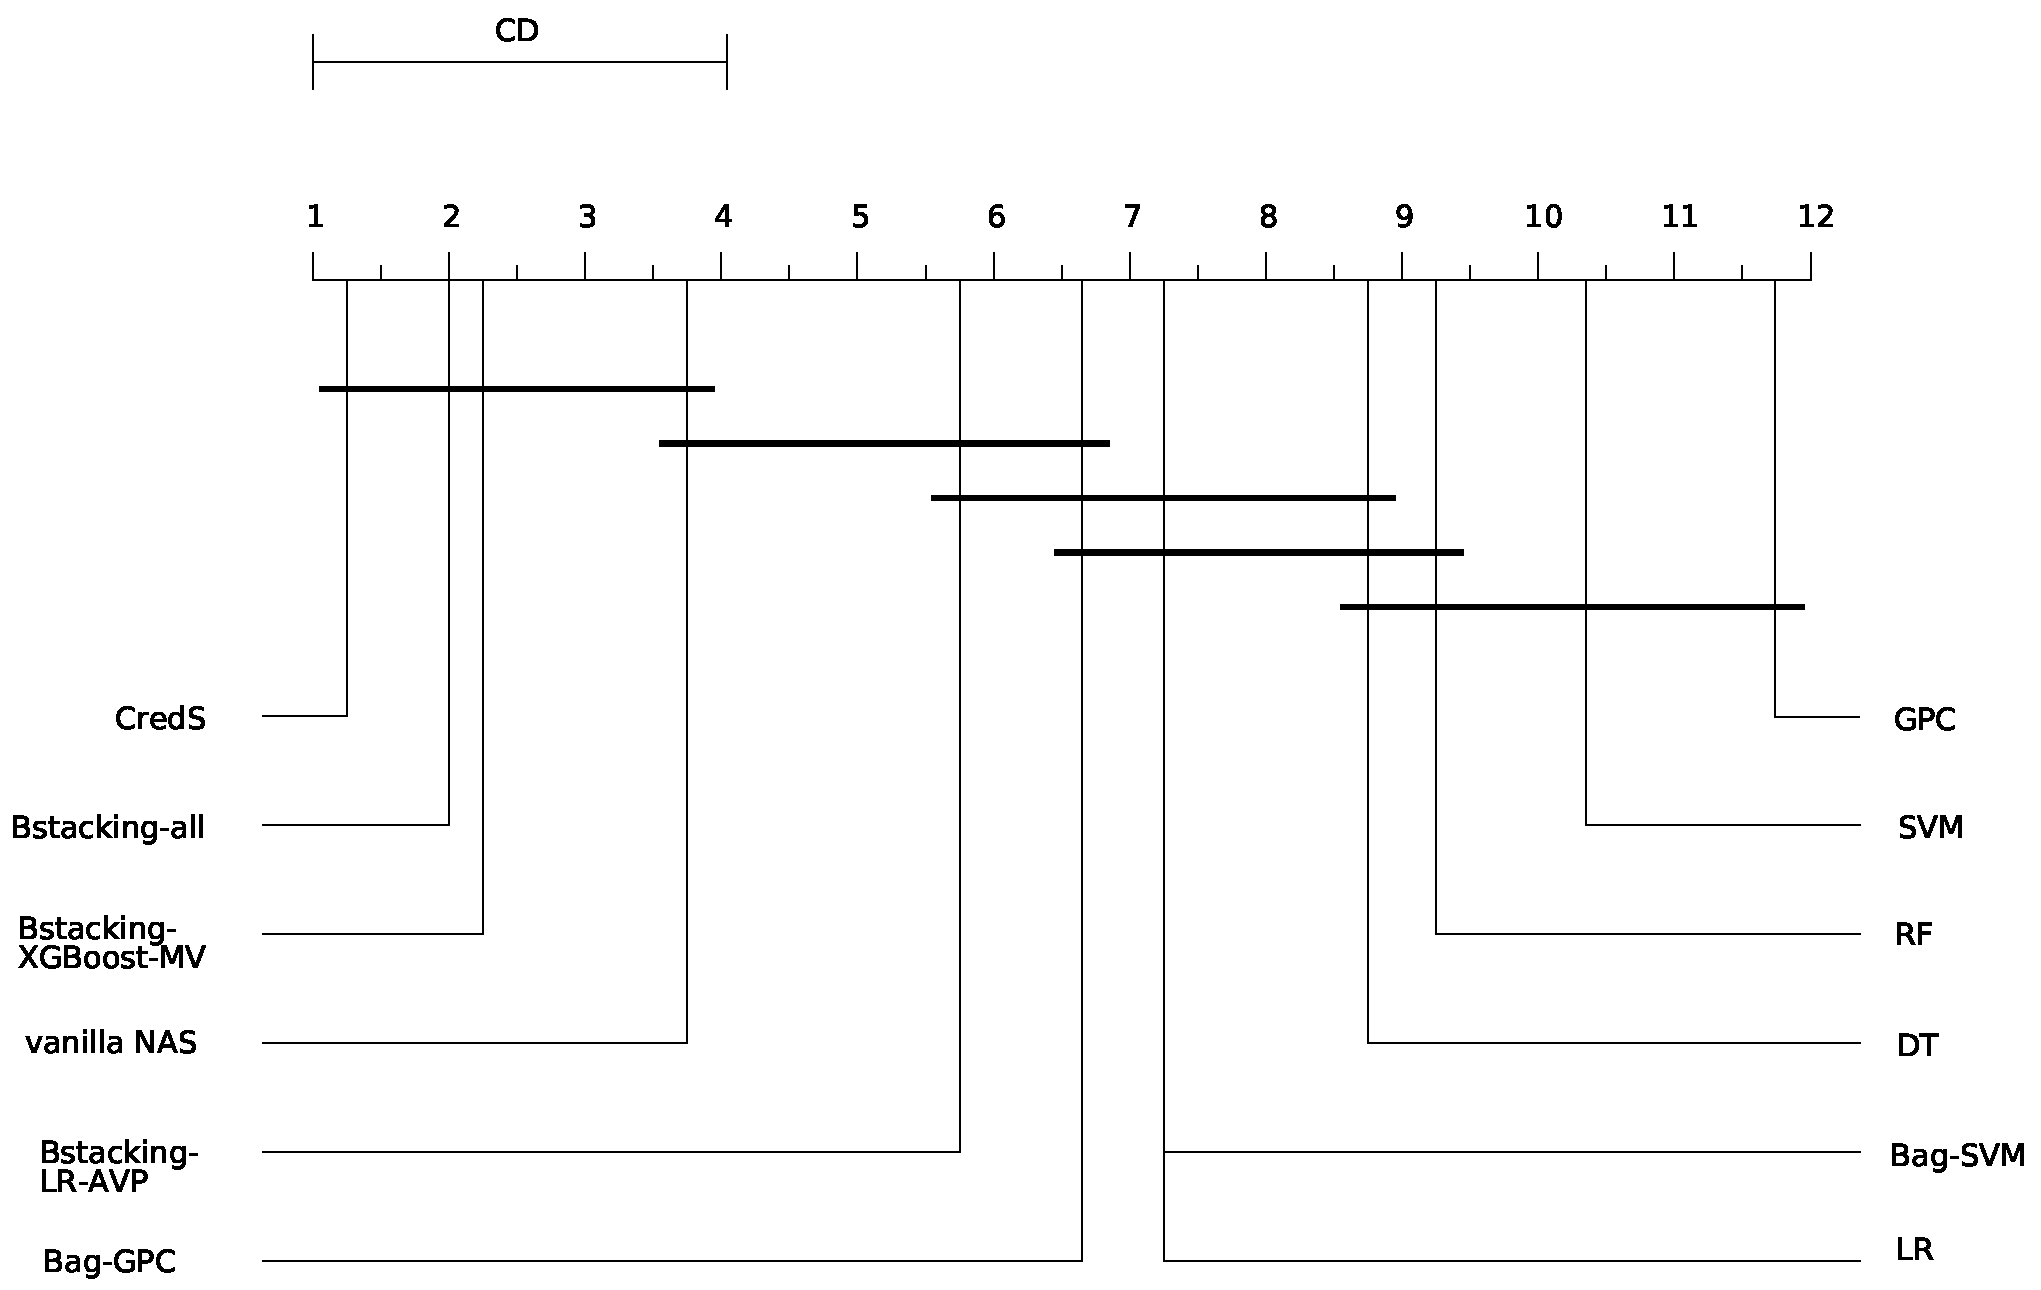
Figure 8 presents the critical difference diagram comparing 12 methodological approaches, demonstrating VeriCred’s superior balance between computational efficiency and predictive performance. The results confirm that the integration of automated architecture search with the
A-Triplet loss mechanism achieves an optimal trade-off between model accuracy and operational autonomy.
Analysis of the critical difference diagram presented in
Figure 8 reveals that VeriCred achieves optimal performance on the HM metric, indicating its superior capability in balancing automation efficiency with predictive accuracy in credit scoring applications. The framework demonstrates a significant advancement over conventional approaches by effectively minimizing human intervention while maintaining competitive performance metrics.
Comparative analysis further indicates that ensemble classifier methodologies generally attain higher HM values than individual classifier approaches, suggesting their enhanced capacity for reducing manual model development efforts while preserving performance integrity. This performance-automation trade-off stems from the inherent architectural differences: individual classifiers necessitate extensive human involvement in model selection and hyperparameter optimization, whereas ensemble methods benefit from automated integration mechanisms that reduce dependency on manual design decisions.
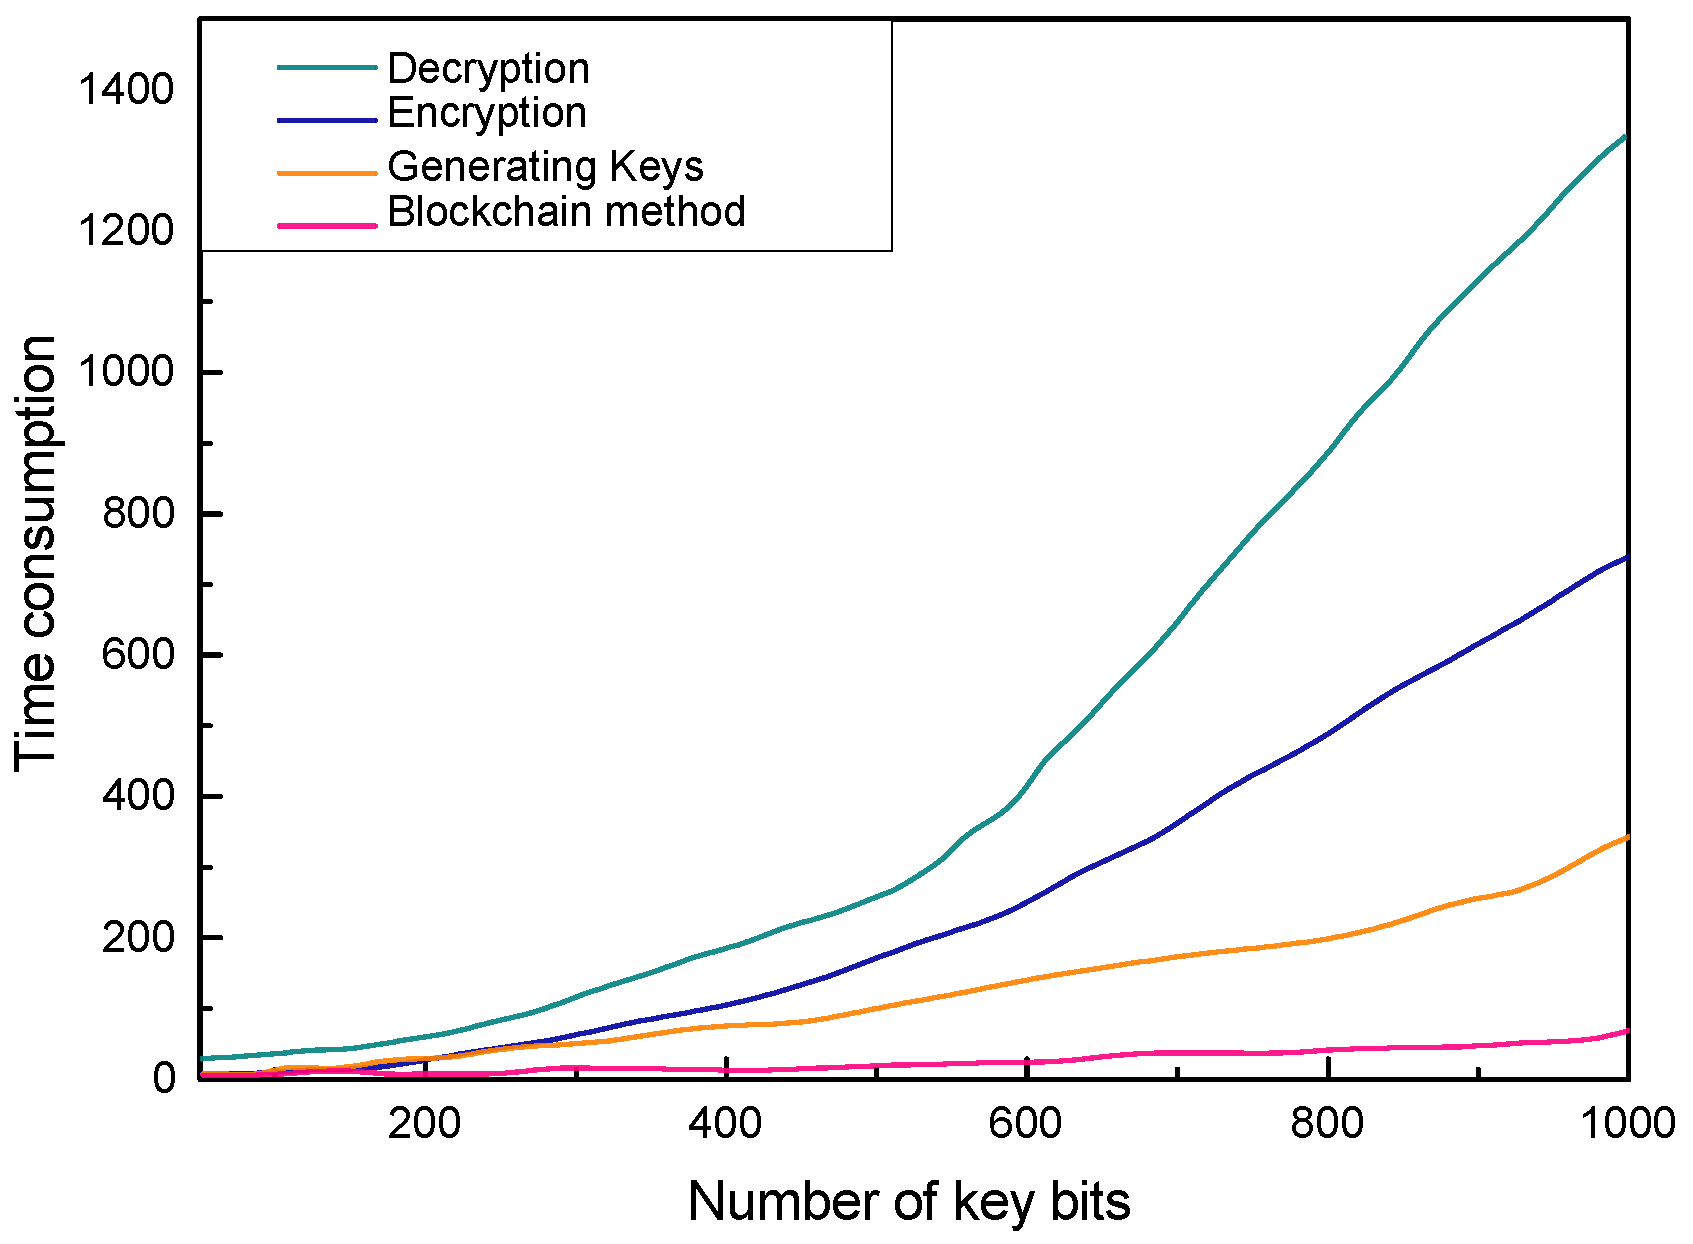
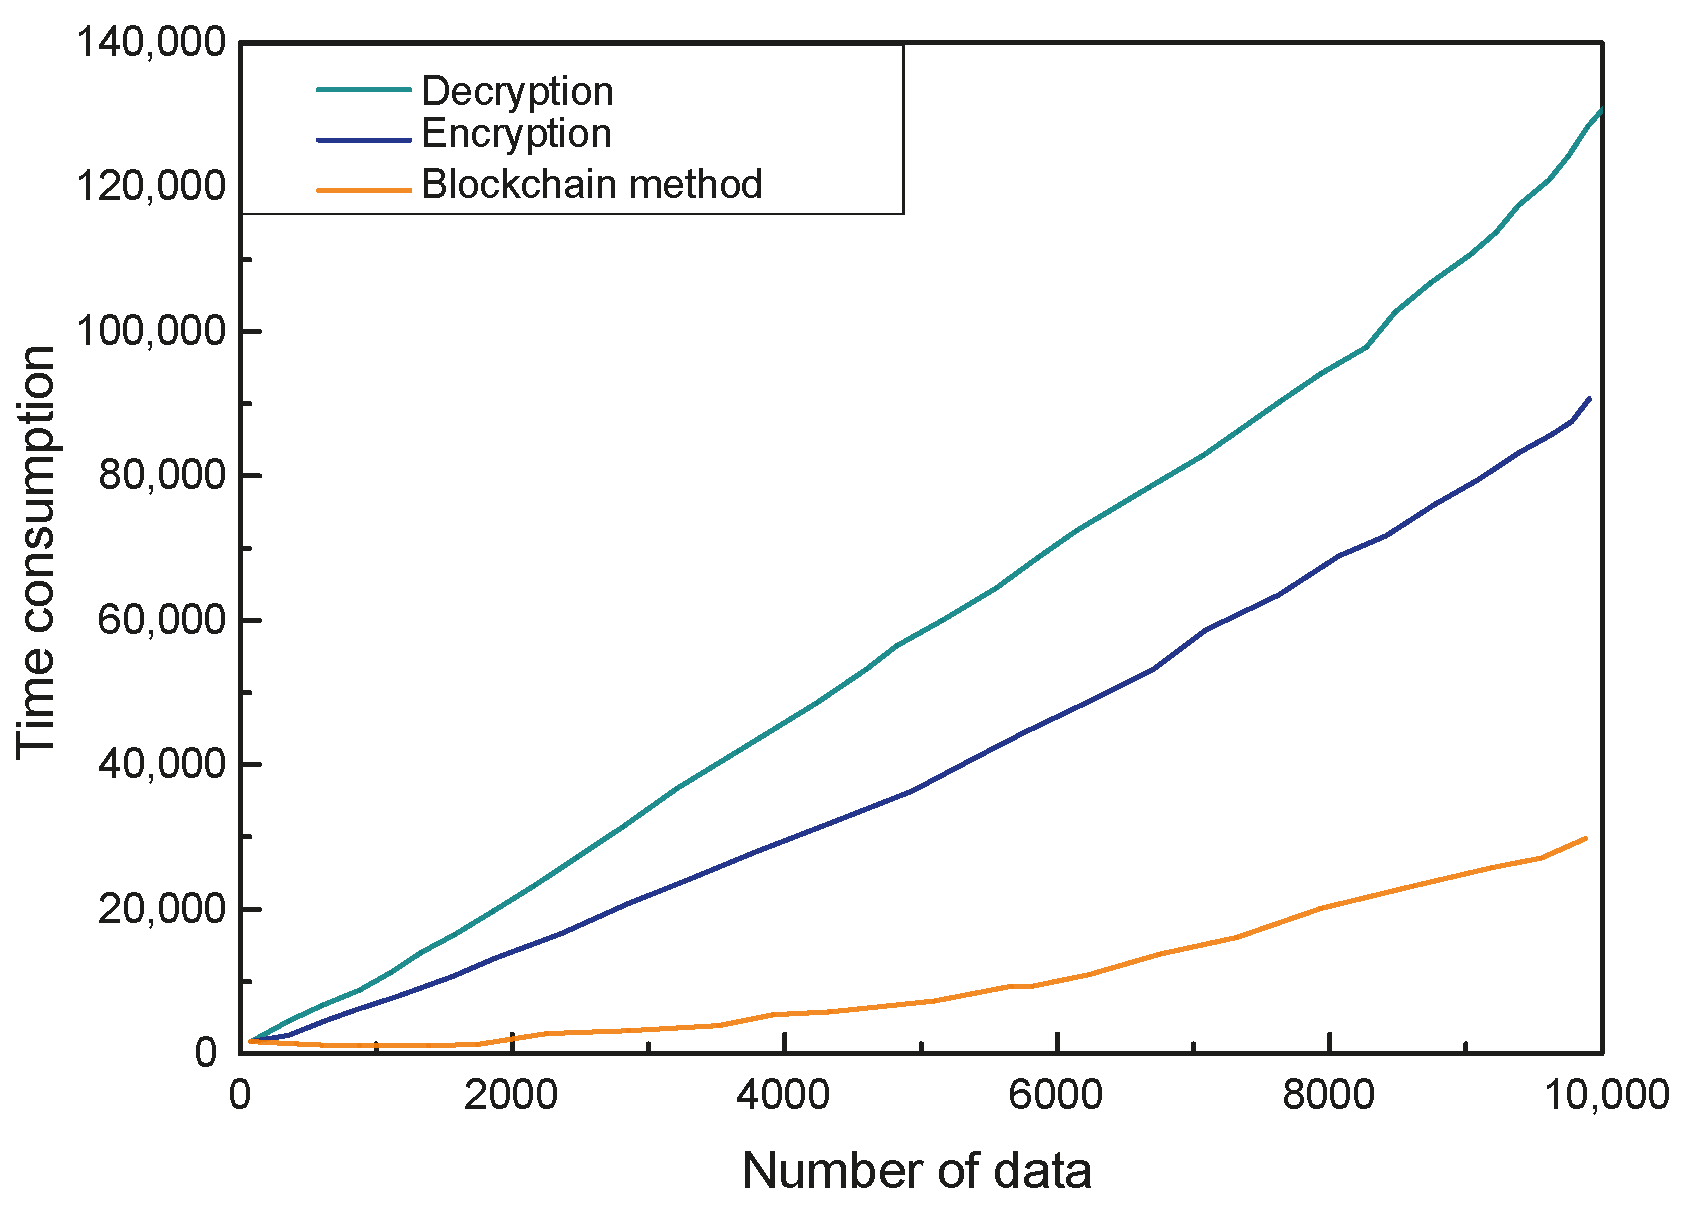
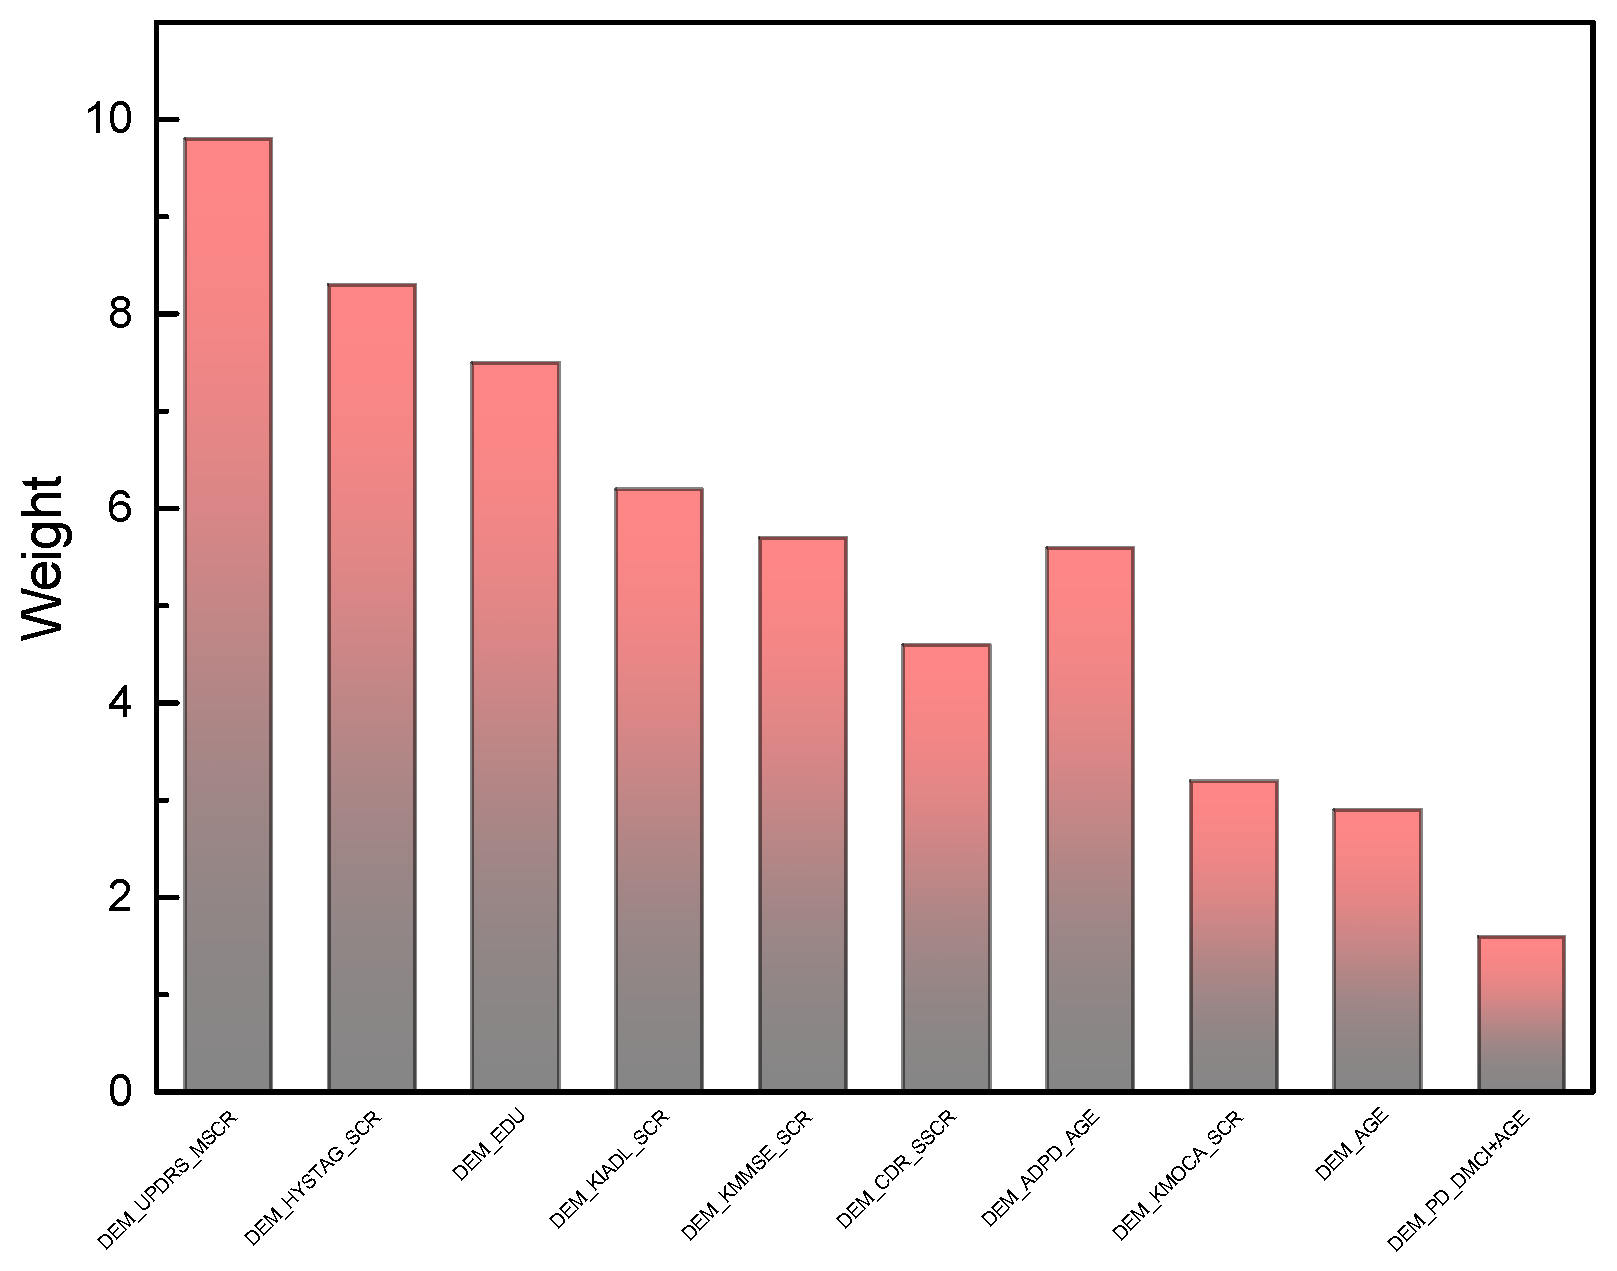
Experimental results from
Figure 9,
Figure 10 and
Figure 11 provide additional insights into the scalability and feature selection efficacy of the proposed framework under multi-node environments and diverse dataset conditions. The analysis reveals a linearly scalable relationship between processed data volume and computational time requirements, primarily attributable to the blockchain-based data authentication infrastructure. As dataset dimensions expand, the cryptographic verification processes—including distributed hashing operations, transaction propagation, and consensus validation—demand proportionally increased computational resources to ensure data integrity and auditability.
The feature selection mechanism embedded within the C-NAS architecture demonstrates notable efficiency in identifying financially significant predictors. Through intelligent navigation of high-dimensional feature spaces during model construction, the system successfully prioritizes economically interpretable variables while suppressing noisy or redundant features. This selective process enhances both model performance and operational interpretability, contributing to more robust and transparent credit risk assessment frameworks.
In summary, VeriCred establishes a new benchmark in credit scoring systems by achieving an optimal equilibrium between predictive performance and operational automation. This advancement stems from two synergistic innovations: (1) the computationally efficient C-NAS mechanism that automates architecture discovery while minimizing manual development overhead, and (2) the A-Triplet loss formulation that enables fine-grained discrimination among heterogeneous credit entities. The integrated framework consequently delivers superior efficiency, stability, and autonomy compared to existing credit scoring methodologies, representing a significant step toward fully automated financial risk assessment systems.
5.4. The Results in Response to RQ4: Case Study and Analysis for Explainable Model in VeriCred
The interpretability analysis conducted through our enhanced LIME framework reveals critical insights into feature importance within the credit scoring ecosystem. Specifically, attributes such as and demonstrate substantially lower predictive influence compared to financial behavioral indicators. This empirical finding enables more informed feature engineering decisions, suggesting that dimensionality reduction can be achieved without compromising model discrimination power. Furthermore, the explainability module provides actionable guidance for developing regulatory-compliant scoring systems that prioritize economically substantive variables while mitigating potential demographic biases.
The validation framework incorporates fifteen domain-specific constraints derived from financial regulations and credit risk management principles. These constraints encompass ratio boundaries (e.g., DebtToIncomeRatio ≤ 100%), logical relationships (NumberOfDelinquencies ≤ TotalCreditLines), and temporal validity conditions (InquiryImpactDuration ≤ 24 months). Through systematic evaluation across 5000 perturbed instances, the modified LIME framework demonstrates remarkable improvement in generating financially plausible explanations. As evidenced in
Table 5, constraint violations decrease by 57–78% across all categories, with particularly notable improvements in logically complex constraints (Constraints 3, 5, and 14 show 54%, 58%, and 56% reduction respectively). The modified implementation reduces average violations per sample from 3427 to 1362—representing a 60% improvement in domain consistency.
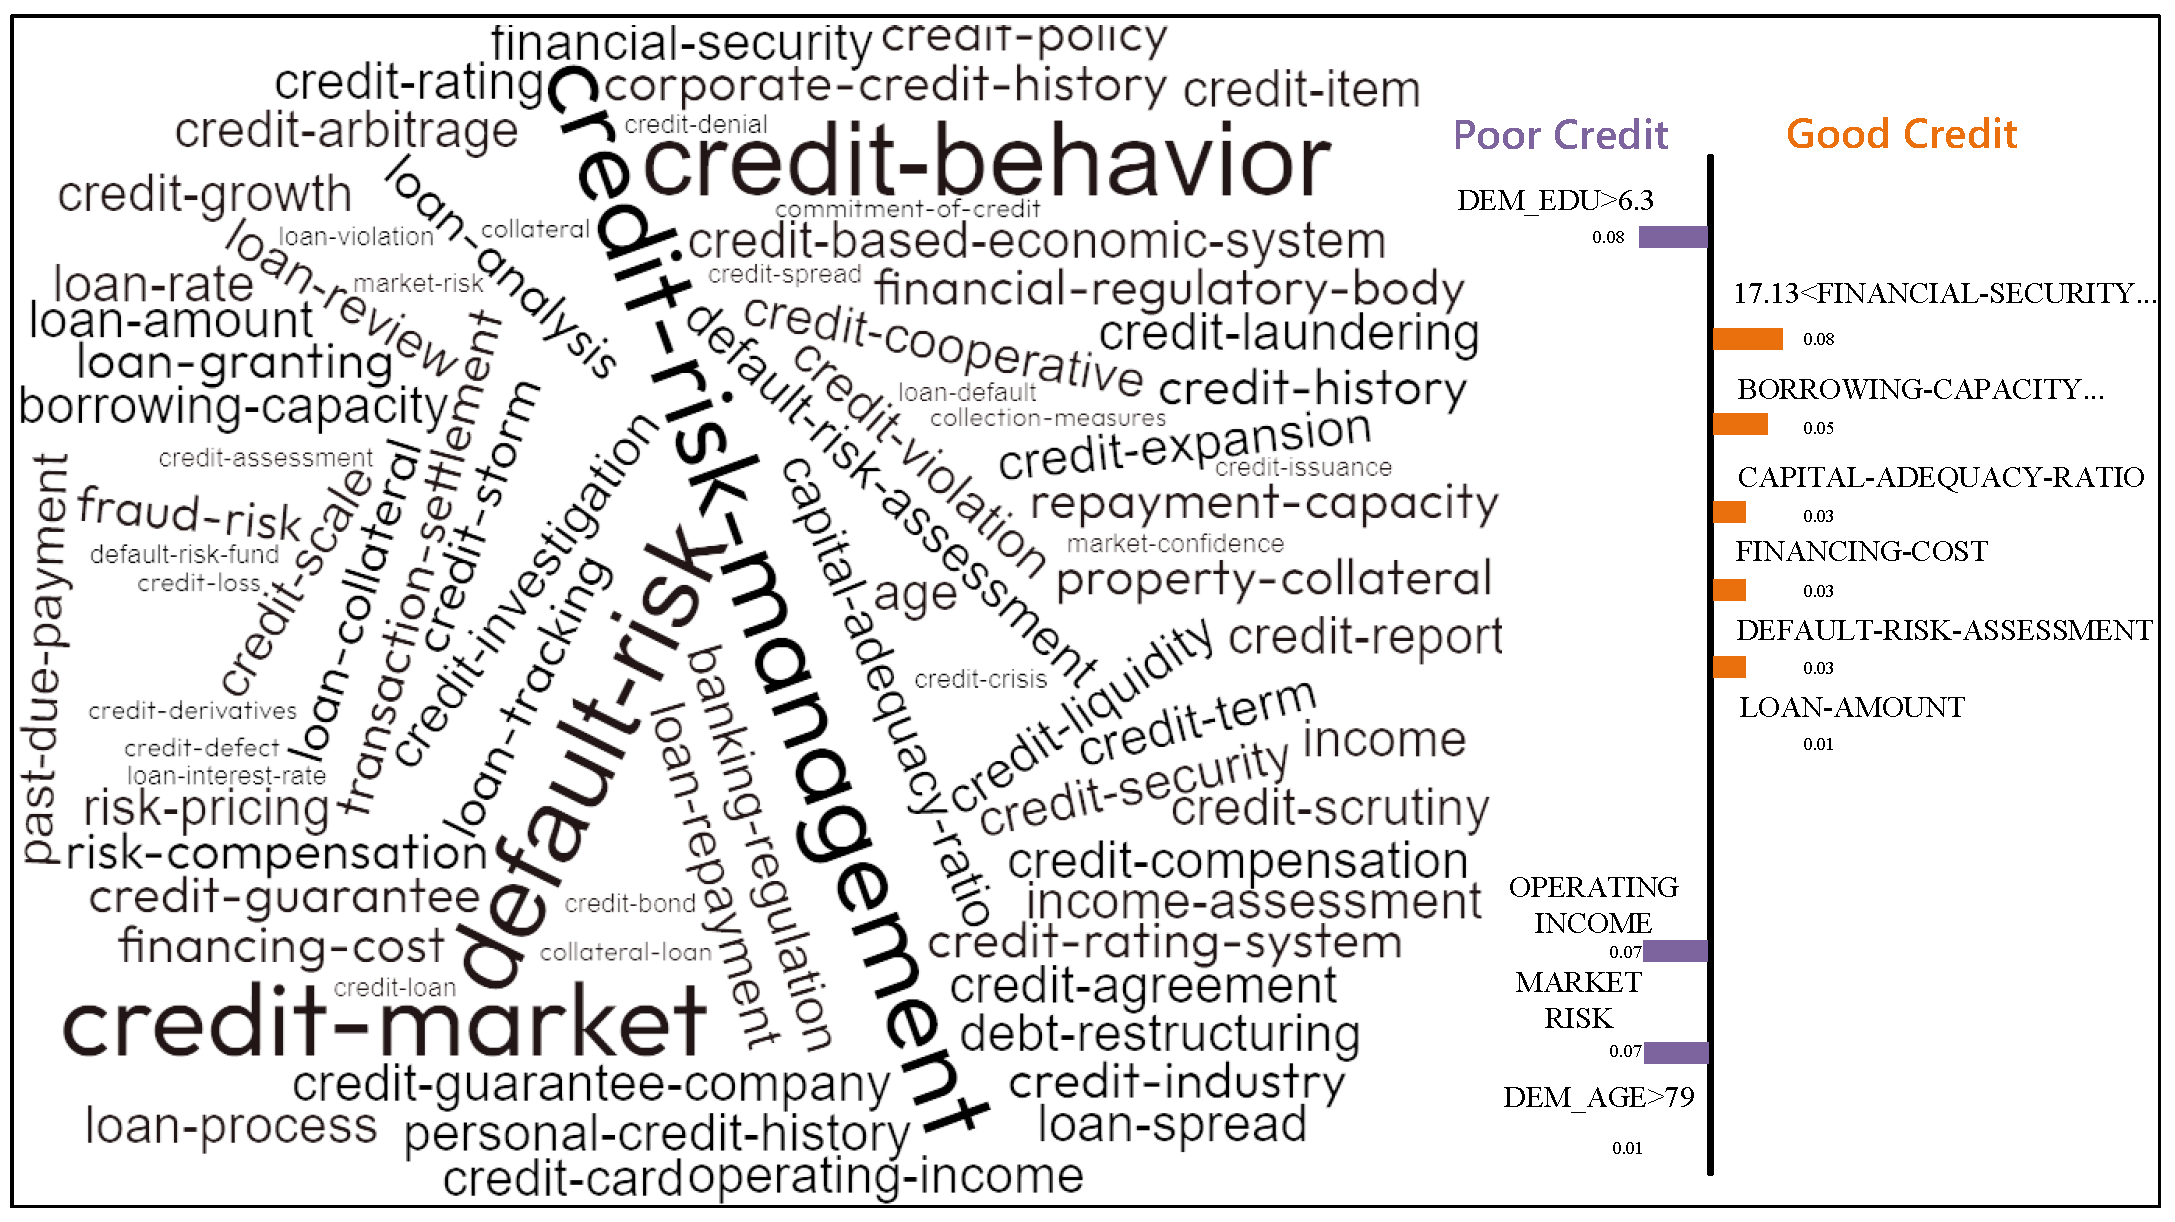
Figure 12 presents the term frequency-explainability mapping of credit risk determinants. The LIME-based explainability analysis provides critical insights into the decision-making process of the black-box credit scoring model, as visually summarized in
Figure 12. The term-frequency map reveals a distinct stratification of feature importance between borrowers with good and poor credit profiles. For high-risk (poor credit) applicants, the model’s predictions are predominantly driven by terms associated with credit-risk mitigation instruments and existing liabilities, such as credit guarantee, credit default, and credit liability. This suggests the model actively seeks safeguards and evaluates historical defaults when assessing applicants with weaker financial standing. Conversely, for low-risk (good credit) applicants, the model shifts its focus to features related to operational capacity and approved transactions, with terms like loan amount, loan granting, and borrowing capacity featuring prominently. This indicates that for credible applicants, the model prioritizes the scale and approval status of the requested credit. The high centrality and font size of the term collateral underscore its role as a critical, universal determinant bridging the assessment criteria for both borrower categories, aligning with fundamental credit risk management principles. This explanatory output not only validates the model’s adherence to logical financial reasoning but also provides a transparent, auditable trail for regulatory compliance.
This substantial enhancement in explanation quality directly addresses critical model risk management requirements. By ensuring that feature attributions adhere to financial logic, our approach enables more trustworthy explanations for model decisions. For instance, the reduction in Constraint 7 violations (from 4298 to 3521) confirms that the modified LIME better respects temporal ordering in credit history analysis. Similarly, the improved handling of credit utilization patterns (Constraint 1: 66% reduction) demonstrates enhanced alignment with banking supervision guidelines.
Beyond technical improvements, this research establishes a robust framework for explainable AI in regulated financial applications. The ability to generate domain-compliant explanations addresses fundamental questions regarding model behavior: Which features drive individual credit decisions? How would marginal changes in financial behavior affect outcomes? Does the model exhibit economically irrational behavior? These capabilities transform black-box models into actionable business intelligence tools that support credit underwriting, customer counseling, and regulatory examination. Furthermore, the transparency achieved through our method facilitates model iteration and refinement, ultimately leading to more accurate, fair, and commercially sustainable credit scoring systems that align with both ethical standards and business objectives.
The implications extend beyond technical validation to encompass governance frameworks for AI in finance. By providing auditable, constraint-aware explanations, our approach enables financial institutions to demonstrate compliance with emerging regulations such as the EU AI Act and fair lending laws. This positions explainability not as a secondary consideration but as a foundational component of responsible innovation in financial technology.
5.5. Discussion
5.5.1. Comparative Performance Analysis
We commence our discussion with a systematic evaluation of VeriCred against contemporary credit scoring methodologies, employing a comprehensive set of metrics including accuracy, area under the curve (AUC), H-measure, and Brier score. To ensure an equitable comparison framework, we benchmark our approach against both individual classifiers and ensemble methods. The experimental findings yield several pivotal observations:
Regarding discriminative capability metrics (accuracy and H-measure), VeriCred demonstrates substantially superior performance compared to individual classifier approaches. This disparity in performance primarily stems from the inherent limitations of homogeneous models in capturing the multifaceted characteristics of credit data. Notably, our framework also achieves marginal but consistent improvements over conventional ensemble methods, suggesting that the neural architecture search mechanism effectively identifies optimal model configurations when presented with sufficient architectural diversity.
In terms of probabilistic calibration (Brier score), VeriCred exhibits comparable performance to established ensemble techniques, with statistically significant enhancements observed across specific credit datasets. This indicates that the integration of the A-Triplet loss mechanism enables fine-grained feature differentiation, thereby enhancing model stability and calibration precision across heterogeneous borrower profiles.
From an interpretability perspective, our framework provides a mathematically grounded approach for elucidating black-box model behaviors in financial, decision-making contexts. The shared statistical representation across domains including insurance claim prediction, mortgage prepayment analysis, merger/acquisition valuation, and loan default forecasting, suggests broad applicability. Our methodology bridges the gap between complex model internals and practical operational requirements in financial services.
In summary, VeriCred achieves superior predictive performance through two synergistic innovations: (1) the A-Triplet loss function enabling nuanced feature discrimination, and (2) the neural architecture search mechanism optimizing model selection. Importantly, the framework maintains robust performance across datasets of varying scales and characteristics, addressing a critical limitation of individual classifier approaches in data-constrained environments.
5.5.2. Computational Efficiency Assessment
Beyond predictive performance, we conduct a rigorous analysis of computational efficiency across competing methodologies. The incorporation of neural architecture search in VeriCred substantially automates model development, reducing human intervention while maintaining competitive performance.
Temporal stability analysis reveals consistent performance across varying runtime budgets, indicating VeriCred’s operational robustness. This contrasts with ensemble methods that require extensive hyperparameter tuning, leading to significant computational overhead without proportional performance gains.
The harmonic mean (HM) metric, balancing accuracy and efficiency, demonstrates VeriCred’s optimal trade-off between these competing objectives. Critical difference diagrams from repeated experiments confirm statistically significant superiority in efficiency-normalized performance. This advantage derives from the automated architecture selection process, which eliminates manual model design while preserving predictive quality.
Comparative analysis shows both individual and ensemble classifiers underperform VeriCred in efficiency-accuracy space. While individual classifiers exhibit low computational demand, their predictive limitations render them impractical for high-stakes credit assessments. Conversely, ensemble methods achieve competitive accuracy but at prohibitive computational costs that diminish their practical utility in production environments.
In conclusion, VeriCred establishes a new Pareto frontier in credit scoring by simultaneously optimizing predictive performance and computational efficiency. The automation of architecture search and hyperparameter optimization eliminates expert-dependent design processes, creating a scalable solution for real-world deployment. Future work will focus on enhancing performance in data-sparse regimes commonly encountered in specialized lending contexts.
6. Research Policy Implications of Blockchain-Enabled Credit Regulation
6.1. Transformative Impacts on Credit Finance Sector
The integration of blockchain technology with explainable artificial intelligence (XAI) methodologies is poised to fundamentally reshape credit assessment paradigms, with profound implications for research policy formulation in financial services. This convergence addresses critical limitations of conventional credit evaluation systems while establishing new frameworks for transparent, accountable, and inclusive financial intermediation.
The primary policy-relevant transformation lies in the establishment of verifiable accountability. Traditional credit scoring mechanisms operate as opaque black boxes, creating information asymmetries that undermine market efficiency and consumer protection. Blockchain’s immutable distributed ledger technology, when coupled with explainable credit models, enables real-time audit trails of decision-making processes. This technological synergy allows regulators to verify compliance with fair lending standards and algorithmic fairness requirements, thereby advancing policy objectives related to market transparency and consumer welfare.
A second crucial implication concerns financial inclusion enhancement. Conventional credit assessment methodologies disproportionately disadvantage populations with limited formal financial histories through their reliance on traditional data sources. Blockchain-enabled systems can incorporate alternative data streams—including utility payments, rental histories, and educational credentials—while maintaining privacy through cryptographic techniques. This expanded data ecosystem facilitates the development of more nuanced creditworthiness assessments, directly supporting policy goals of reducing credit access disparities and promoting equitable economic participation.
The technological architecture also enables regulatory innovation through smart contract implementation. Compliance requirements can be programmatically embedded into credit assessment protocols, enabling real-time regulatory oversight and reducing enforcement costs. This capability creates new possibilities for adaptive regulatory frameworks that can dynamically respond to emerging risks while maintaining market stability—a significant advancement over static, ex-post regulatory approaches.
Furthermore, the decentralized nature of blockchain systems mitigates single points of failure in credit infrastructure, enhancing financial system resilience. This distributed architecture reduces systemic vulnerabilities to cyber threats and operational disruptions, aligning with financial stability objectives that are central to modern regulatory policy frameworks.
6.2. Case Studies in Policy Implementation
Microfinance Digital Transformation: A blockchain-based micro-lending platform in emerging economies demonstrates how explainable credit algorithms can expand financial access while maintaining risk management rigor. The system integrates mobile payment histories, agricultural supply chain transactions, and community reputation metrics through zero-knowledge proofs that preserve privacy while enabling credit assessment. Regulatory sandbox approaches allowed iterative policy refinement, demonstrating how adaptive regulatory frameworks can foster innovation while protecting consumer interests. This case illustrates the potential for technology-enabled financial inclusion to advance sustainable development goals.
National Credit Infrastructure Modernization: A Southeast Asian nation’s implementation of a blockchain-based national credit registry showcases scalable infrastructure for transparent credit reporting. The system provides citizens with granular visibility into their credit assessments while enabling regulated data sharing among financial institutions. Policy innovations included data portability mandates and algorithmic accountability requirements that ensured fair treatment across diverse borrower segments. This example highlights how technological infrastructure investments can simultaneously advance consumer protection, financial stability, and market efficiency objectives.
Peer-to-Peer Lending Market Evolution: The integration of explainable AI with blockchain-based smart contracts in P2P lending platforms has created new paradigms for decentralized finance (DeFi) regulation. These platforms implement automated compliance checks through programmable logic while providing borrowers with transparent explanations of credit decisions. Regulatory approaches have evolved from ex-post enforcement to embedded supervision, where compliance is verified in real-time through blockchain analytics. This case demonstrates how technological innovation can enable more efficient regulatory paradigms while maintaining market integrity.
6.3. Policy Recommendations and Future Directions
The case studies reveal several cross-cutting policy implications. First, regulatory frameworks must evolve to address the unique characteristics of blockchain-based systems, including their transnational operation and algorithmic decision-making processes. Second, standards for explainability and auditability require harmonization to ensure consistent consumer protections across jurisdictions. Third, policymakers must balance innovation facilitation with risk mitigation through approaches like regulatory sandboxes and phased implementation strategies.
Future research should focus on developing metrics for evaluating explainability effectiveness, establishing interoperability standards across blockchain credit platforms, and creating governance models for decentralized autonomous organizations (DAOs) in financial services. Additionally, policy experiments with central bank digital currencies (CBDCs) could provide valuable insights into how public-sector blockchain initiatives might complement private innovation in credit markets.
The convergence of blockchain technology and explainable AI represents not merely an incremental improvement but a fundamental rearchitecture of credit systems. This transformation requires equally innovative policy approaches that can harness technological potential while safeguarding public interests—a challenge that will define financial regulation research agendas for the coming decade.
7. Conclusions and Future Work
This research introduced VeriCred, an integrated framework for automated and verifiable credit scoring that synergistically combines neural architecture search, metric learning, and blockchain-based auditing. The proposed methodology addresses critical limitations in contemporary credit assessment systems by achieving an optimal balance between predictive accuracy, operational efficiency, and regulatory compliance. Our approach demonstrates that the integration of economical neural architecture search (C-NAS) with an adaptive triplet loss mechanism (A-Triplet) enables the automated discovery of high-performance credit models while maintaining computational feasibility. Furthermore, the incorporation of explainable AI (XAI) components ensures model transparency, providing stakeholders with interpretable decision rationales.
A fundamental contribution of this work lies in the development of a blockchain-anchored data governance framework that establishes immutable audit trails for all credit assessment activities. By cryptographically securing data provenance, model parameters, and evaluation metrics on a distributed ledger, VeriCred creates a trustworthy ecosystem for credit decision-making that enhances regulatory oversight capabilities. This blockchain layer not only ensures data integrity and non-repudiation but also enables real-time monitoring of model behavior across institutional boundaries. When combined with our automated model discovery pipeline, this approach represents a significant advancement toward transparent, efficient, and scalable credit risk management systems suitable for modern financial environments.
Future research directions will focus on several key enhancements. First, we plan to extend the interpretability framework to incorporate second-order feature interactions within the LIME paradigm, enabling more nuanced explanations of complex credit decisions. Second, we will investigate transfer learning methodologies [
51,
52,
53,
54] to leverage pre-trained representations from related financial domains, thereby improving model generalization with limited credit-specific data. Additionally, we aim to expand the architecture search space to incorporate temporal modeling components for handling dynamic credit behaviors, while further optimizing the blockchain consensus mechanism for real-time credit assessment scenarios. Finally, we will explore federated learning integrations to enable privacy-preserving model training across institutional boundaries, thus addressing data silo challenges while maintaining regulatory compliance through blockchain-based verification mechanisms.

