Article

Development of Wheat Bread Fortified with Sea Buckthorn (Hippophae rhamnoides L.) Pomace: Nutritional Enhancement, Technological Properties, and Consumer Acceptance

by
Anna Wirkijowska
1,
Piotr Zarzycki
1,* and
Konrad Terpiłowski
2
1
Department of Engineering and Cereals Technology, Faculty of Food Science and Biotechnology, University of Life Sciences in Lublin, Skromna 8, 20-704 Lublin, Poland
2
Department of Interfacial Phenomena, Maria Curie Skłodowska University, M. Curie Skłodowska Sq. 3, 20-031 Lublin, Poland
*
Author to whom correspondence should be addressed.
Appl. Sci. 2025, 15(22), 12319; https://doi.org/10.3390/app152212319
Submission received: 31 October 2025 / Revised: 17 November 2025 / Accepted: 19 November 2025 / Published: 20 November 2025

Abstract

Sea buckthorn (Hippophae rhamnoides L.) is a rich source of bioactive compounds, including vitamin C, polyphenols, carotenoids, and dietary fiber. In this study, sea buckthorn pomace, an underutilized by-product of oil processing, was incorporated into wheat bread at levels of 0, 3, 6, 9, and 12% (based on flour weight). The technological performance (dough yield, baking loss, loaf volume, texture, and color), nutritional composition (protein, fat, dietary fiber fractions, mineral content, and caloric value), and sensory attributes of the resulting breads were comprehensively evaluated. Pomace addition markedly increased the protein content of bread (from 13.5% to 16.8%) and more than doubled total dietary fiber (from 5.4% to 11.6%), while reducing caloric value by approximately 5.6%. Increasing pomace levels also affected dough behavior and bread structure: water absorption rose from 59.9% to 68.9%, specific loaf volume decreased by 11–28%, and crumb hardness increased from 3.8 N (control) to 12.4 N (12% addition). Sensory acceptability remained high up to 6% pomace incorporation (acceptability index > 90%), whereas breads containing 9–12% received significantly lower scores, mainly due to darker crumb color and intensified sour or bitter notes. Overall, sea buckthorn pomace can be effectively used as a nutritionally enriching, value-added ingredient in wheat bread, enhancing fiber and protein content while maintaining desirable technological and sensory properties at moderate substitution levels.

1. Introduction

Bread remains one of the most widely consumed staple foods worldwide, with an average per capita consumption of approximately 250 g per day [1]. It serves as an important source of carbohydrates, proteins, and minerals; however, the dietary fiber content of white wheat bread is relatively low, typically around 2–3% [2]. In recent years, changing consumer expectations and a growing interest in nutritionally improved and clean-label foods have driven innovation within the baking industry [3]. One direction in this development involves modifying bread formulations through the incorporation of natural ingredients capable of improving nutritional quality while supporting sustainable food production. The reuse of by-products generated during food processing has gained particular attention, as these materials can serve as valuable raw materials rich in nutrients and bioactive components [4,5]. According to FAO data, 20–50% of processed food raw materials may end up as waste or by-products, depending on the product category [6], and their reintroduction into the food chain aligns with the European Union’s circular economy strategy promoting resource efficiency and waste reduction [7].
Among such materials, oilseed press cakes represent promising ingredients due to their high contents of dietary fiber, protein, lipids, and minerals, as well as bioactive compounds with potential technological or nutritional benefits [6,8,9,10]. Their incorporation into bread formulations allows for nutritional fortification and improved sustainability, while meeting consumer expectations for environmentally responsible foods.
Sea buckthorn (Hippophae rhamnoides L.) is a plant widely recognized for its exceptional nutritional and functional properties. Its fruits are rich in vitamin C, polyphenols, carotenoids, tocopherols, and dietary fiber, which are associated with strong antioxidant, anti-inflammatory, and health-promoting effects, which have made sea buckthorn increasingly attractive for food applications [11]. Processing of sea buckthorn for juice or oil generates substantial quantities of by-products, such as pomace, seeds, and peels, that contain carotenoids, flavonoids, phytosterols, pectins, and mono- and polyunsaturated fatty acids (PUFAs). Sea buckthorn pomace obtained after cold oil pressing is especially rich in dietary fiber, proteins, lipids, antioxidants, and natural pigments, and may therefore influence both the nutritional value and color of bakery products. Its effective utilization also contributes to waste reduction and supports sustainable management of high-value agricultural resources [11,12,13].
The incorporation of oilseed press cakes or pomaces into wheat-based formulations offers a promising means to enhance the nutritional value of bakery products by increasing their content of dietary fiber, protein, and bioactive compounds. However, these additions also modify dough rheology, directly affecting bread-making performance and the sensory attributes of the final product. Enriching wheat dough with high-fiber and lipid-rich ingredients often leads to higher water absorption, altered dough development time and stability, and impaired gluten network formation. These changes can, in turn, influence loaf volume, crumb structure, and textural quality, sometimes resulting in less favorable consumer perception [6,8,9,10,14]. Thus, while such ingredients improve the nutritional and functional quality of bread, excessive use may compromise its technological and sensory properties. Understanding such interactions is essential from both processing and consumer acceptance perspectives, as inadequate adjustment of formulations can lead to quality deterioration and increased food waste [1].
Previous studies have demonstrated the potential of sea buckthorn pomace derived from juice pressing as a bread-enriching ingredient. Incorporating dried and milled pomace at 6–10% improved the nutritional profile and antioxidant capacity of wheat bread, although higher levels were associated with denser crumb structure and less favorable sensory attributes [15]. However, information on the use of sea buckthorn pomace from oil extraction is lacking. This pomace differs from juice-derived material in its higher lipid content and potentially altered fiber composition, which may affect dough rheology, baking behavior, and final bread quality. The present study addresses this gap by exploring the potential of oil-press sea buckthorn pomace as a functional ingredient in wheat bread production.
Therefore, the objective of the present study was to investigate the suitability of oil-pressed sea buckthorn pomace as a nutritionally enriching ingredient in wheat bread. The study evaluated the effects of its incorporation at different levels (0–12%) on dough rheology, baking performance, physicochemical and textural properties, nutritional composition, and sensory acceptance of the final product. Particular attention was given to identifying the concentration range that improves dietary fiber and protein content while maintaining acceptable technological quality and consumer perception. By addressing these aspects, this work supports the development of fortified, clean-label bread products consistent with circular economy principles.

2. Materials and Methods

2.1. Materials

Wheat flour (type 750) was used as the main ingredient, obtained from a retail store in Lublin, Poland. Prior to use, the flour was characterized for its basic physicochemical and technological properties. The moisture content was 12.98 ± 0.5%, and the ash content was 0.74% (dry matter). Gluten-related parameters included a wet gluten content of 27.2 ± 0.9%, dry gluten content of 9.6 ± 0.5%, water absorption capacity of 17.7 ± 1.0%, and a gluten index of 96.0 ± 0.5. The falling number was 280 ± 15 s, indicating moderate α-amylase activity. Particle size distribution analysis showed that 99% of particles passed through a 0.2 mm sieve, confirming good milling uniformity. According to the manufacturer’s nutritional label (per 100 g), the flour contained 1.6 g fat (including 0.4 g saturated fatty acids), 68 g carbohydrates (of which 2.1 g sugars), 3.9 g dietary fiber, 11.7 g protein, <0.01 g salt, and had an energy value of 1445 kJ. The flour was stored in sealed polyethylene bags at 22 ± 2 °C and relative humidity below 60% until use.
Sea buckthorn (Hippophae rhamnoides L.) pomace (SBP) was obtained from a certified local producer (Biogrim, Lublin, Poland). The pomace was generated as a by-product of cold-pressed oil extraction, aligning with zero-waste and sustainable food processing trends. The material was freeze-dried (lyophilized) and micronized, yielding a fine powder with 95% of particles passing through a 0.2 mm sieve. The pomace was stored in airtight containers, protected from light and moisture, at room temperature until use. Its proximate composition (dry matter basis) was determined as follows: protein 24.2 ± 0.7%, fat 14.8 ± 0.6%, total dietary fiber 55.8 ± 1.4% (including 44.5% insoluble and 11.3% soluble fractions), and ash 1.89 ± 0.06%. The inclusion of sea buckthorn pomace in the bread formulation was intended to enhance the nutritional value and provide bioactive compounds, dietary fiber, and natural pigments, contributing to the development of a clean-label and nutritionally enriched bakery product.
Commercial compressed baker’s yeast (Saccharomyces cerevisiae), sodium chloride (food grade), and potable water meeting EU standards for drinking water were used in bread preparation. All reagents and chemicals applied for analytical determinations were of analytical grade.

2.2. Bread-Making Procedure

Five bread formulations were prepared, differing in the percentage of sea buckthorn pomace addition: 0%, 3%, 6%, 9%, and 12% (flour basis). These levels were selected based on preliminary laboratory trials, which showed that additions above 12% caused excessive dough softening and loss of loaf structure, as well as on technological considerations indicating that fiber- and lipid-rich by-products are typically incorporated into bread at levels not exceeding 10–15% to maintain acceptable dough rheology and baking performance [14]. The control bread (CON) contained only wheat flour, water, yeast, and salt. Each formulation was produced in two independent baking trials, with three loaves per trial, resulting in six loaves per variant. A randomized design was employed to minimize the influence of potential batch effects and ensure statistical robustness.
All breads were prepared using a standard formulation consisting of 600 g wheat flour (type 750), 9 g sodium chloride, and 18 g compressed baker’s yeast (Saccharomyces cerevisiae). Sea buckthorn pomace replaced a proportional part of the flour in each formulation. The amount of water was adjusted individually for each variant based on farinographic water absorption (WA), to achieve a dough consistency of 500 Brabender Units (BU).
The bread-making process followed the straight dough method, as described by Zarzycki et al. [10], with minor modifications. Dough mixing was carried out in a BEAR Varimixer Teddy 5 L (Varimixer A/S, Brondby, Denmark) for 2 min at low speed and 5 min at high speed to ensure optimal gluten development. The dough was fermented in a Tefi Klima Pro 100 (Debag, Bautzen, Germany) proofing chamber at 30 °C and 85 ± 2% relative humidity (RH) for 90 min, with gentle degassing after 60 min. After fermentation, the dough was manually divided into 290 ± 5 g portions, molded, and placed in baking tins (18 × 7.5 × 7.0 cm). A second proofing step was carried out for 30 min under the same temperature and humidity conditions. Baking was performed in a Helios Pro 100 oven (Debag, Bautzen, Germany) at 230 °C for 35 min.
After baking, the loaves were cooled at room temperature (20 °C, 50% RH) for 1 h, weighed, packaged in polyethylene bags, and stored under ambient conditions until analysis. Bread samples were labeled according to the level of sea buckthorn pomace addition, using the abbreviation SBPB (Sea Buckthorn Pomace Bread) followed by the percentage of substitution (e.g., SBPB3, SBPB6, SBPB9, SBPB12).

2.3. Farinograph Properties of Dough

The rheological properties of dough were evaluated using a Farinograph-TS (Brabender, model 816100, Duisburg, Germany) in accordance with AACC Method 54-21 [16]. The farinograph results provided insight into the influence of sea buckthorn pomace on dough hydration, gluten development, and stability, allowing the identification of potential technological adjustments required for bread production with increasing levels of pomace substitution. The analysis included the determination of water absorption (WA), dough development time (DDT), stability time (ST), dough softening (DS), and the Farinograph Quality Number (FQN) as a composite index of dough quality. Each test was performed using 300 ± 0.1 g of wheat flour (corrected to 14% moisture content). The amount of water required to obtain a dough consistency of 500 Farinograph Units (FU) was recorded as water absorption. All measurements were carried out in triplicate to ensure reproducibility.

2.4. Evaluation of Bread Quality Characteristics

Bread quality was evaluated based on bread yield (BY; Equation (1)), baking loss (BL; Equation (2)), loaf volume, crumb porosity, and moisture content. All parameters were determined 24 h after baking, while crumb moisture was additionally measured after 72 h of storage.
Crumb porosity was analyzed using a VHX-7000 digital microscope (Keyence, Osaka, Japan) following the method described by Wirkijowska et al. [17]. Observations were performed on a 4 × 4 cm area in the central part of each slice under ring illumination at 20× magnification. The automatic image analysis mode, based on brightness extraction and hole-filling functions, was applied to quantify pores with diameters ≥0.01 mm. The pores were classified into five size categories (0.01–0.04, 0.05–0.09, 0.1–0.9, 1–4, and >4 mm2), and their number and surface area percentages were calculated relative to the total pore population. Three replicates were analyzed per sample.
Moisture content was determined according to AACC Method 44-15.02 [16] by drying samples at 105 °C for 3 h until constant weight. Bread volume was measured using the rapeseed displacement method (AACC 10-05.01), and the specific volume (cm3/g) was expressed as the ratio of loaf volume to loaf weight. All determinations were performed in triplicate.
Equations used for calculation of bread yield and baking loss are as follows:
B Y = ( W 1 / W 2 ) × 100 %
B L = W 3 W 1 W 3 × 100 %
where W1 is the weight of baked bread (1 h after removal from the oven), W2 is the amount of flour used for one loaf, and W3 is the weight of the proofed dough before baking.

2.5. Evaluation of Color Parameters of Bread Crumbs

The color of the bread crumbs was determined according to the CIE Lab color space, following the procedure described by Wirkijowska et al. [17]. Measurements were performed using a Chroma Meter CR-5 spherical spectrophotometer (Konica Minolta, Sakai, Osaka, Japan). The instrument was calibrated before each series of measurements using standard white and black reference plates. For each sample, twelve measurements were taken under a D65 illuminant, using a 10° standard observer and an 8 mm aperture. The parameters L* (lightness), a* (red–green coordinate), and b* (yellow–blue coordinate) were recorded.
The total color difference (ΔE*) relative to the control sample was calculated using the standard CIE formula, where the control sample’s color coordinates (Lc*, ac*, bc*) were used as reference values. In addition, the whiteness index (WI), yellowness index (YI), and browning index (BI) were calculated based on the measured color parameters, following the equations proposed by Felisiak et al. [18].
E * = ( L c * L i * ) 2 + ( a c * a i * ) 2 + ( b c * b i * ) 2
W I = 100 ( ( 100 L * ) 2 + a 2 + b 2 )
Y I = 142.83 × b * L *  
B I = X 0.31 × 100 0.17 ; w h e r e   X = a * + 1.75 × L * 5.645 × L * + a * 3.012 × b *

2.6. Texture Profile Analysis (TPA) of Bread

The crumb texture of bread samples was determined using a texture profile analysis (TPA) procedure adapted from Wirkijowska et al. [17]. Loaves were sliced into 20 mm-thick pieces, and the crusts were carefully removed. Cubic portions of the crumb (approximately 30 × 30 × 20 mm) were then cut for testing. Texture measurements were performed with a Brookfield AMETEK CTX texture analyzer (Middleboro, MA, USA) equipped with a flat cylindrical probe (50 mm diameter). A double compression test was applied, compressing each sample twice to 50% of its original height at a crosshead speed of 1 mm·s−1, with a trigger force of 0.98 N and a maximum applied force of 500 N. From the resulting force–time curves, the following TPA parameters were calculated using Texture Pro software (version 1.0.19): hardness (N), springiness (-), cohesiveness (-), and chewiness (N). Measurements were conducted 24 and 72 h after baking, and eight replicate determinations were performed for each bread formulation to ensure statistical reliability.

2.7. Sensory Evaluation of Bread

The sensory evaluation of breads containing different levels of sea buckthorn pomace was performed using a five-point hedonic scale, where 1 = “dislike extremely” and 5 = “like extremely”, following the general guidelines of ISO 8586:2012 and ISO 8589:2007 [19,20].
A panel of 12 trained assessors (8 women and 4 men) participated in the evaluation. Panelists were selected from among staff members of the University of Life Sciences in Lublin based on their sensory acuity, regular consumption of bread (at least four times per week), good health, and absence of gluten intolerance. The study protocol was approved by the Bioethics Committee (Resolution No. UKE/09/2023).
The assessment was conducted in a dedicated sensory laboratory equipped with individual booths, neutral wall colors, and adjustable lighting, ensuring standardized evaluation conditions. The laboratory maintained controlled temperature and humidity throughout the test. Bread samples were sliced into 1 cm-thick pieces, immediately wrapped in food-grade polyethylene film, and coded with three-digit random numbers. Samples were presented in a randomized order. Still mineral water was provided to cleanse the palate between samples. Each bread variant was evaluated in duplicate, and final scores for each attribute were calculated as the mean of all panelists’ ratings.
The following sensory attributes were evaluated: appearance—general shape of the loaf, crust surface uniformity, and visual appeal; color—tone and uniformity of crumb and crust color; elasticity and porosity—assessed by gently pressing the crumb and observing its recovery, as well as pore size and distribution; aroma—intensity and pleasantness of the characteristic bread scent, including notes derived from sea buckthorn pomace; taste—flavor intensity, balance, and the presence of desirable or specific characteristic notes; porosity—visual and tactile assessment of the crumb structure and openness.
For interpretation, an average score above 3.75 was considered indicative of high consumer acceptability, corresponding to an acceptability index (AI) ≥ 75%. According to Lukas et al. [21], products achieving an AI above 70% are regarded as sensory acceptable; this benchmark was applied to classify the bread variants as either acceptable or highly acceptable based on panel responses.

2.8. Chemical Composition of Raw Materials and Bread

The proximate composition of the raw materials and bread samples prepared with different levels of sea buckthorn pomace was analyzed following official AACC and AOAC procedures [16,22]. The following components were determined: moisture (AACC Method 44-15A), ash (AACC Method 08-01), and protein by the Kjeldahl method (AACC Method 46-08), applying a nitrogen-to-protein conversion factor of N × 5.7. Fat content was quantified according to AACC Method 30-26.
The total (TDF), soluble (SDF), and insoluble (IDF) fractions of dietary fiber were determined using AOAC 991.43 and AOAC 985.29, in accordance with AACC Methods 32-07, 32-21, and 32-05, respectively.
Available carbohydrates were calculated by difference, subtracting the sum of protein, fat, ash, moisture, and total dietary fiber from the total sample mass. The energy value of the samples was estimated using Atwater conversion factors: 4 kcal·g−1 for protein and carbohydrates, 9 kcal·g−1 for fat, and 2 kcal·g−1 for dietary fiber.
All chemical analyses were conducted in triplicate, and results were expressed on a dry matter basis (d.b.) unless stated otherwise.

2.9. Statistical Analysis

All experimental data were reported as mean values ± standard deviation (SD). Statistical differences between the tested samples were evaluated using one-way analysis of variance (ANOVA), followed by Tukey’s post hoc test to identify significant differences at a confidence level of p ≤ 0.05. For selected parameters, Pearson correlation coefficients were calculated to assess the strength and direction of relationships between the pomace substitution level and the corresponding responses. Statistical analyses were performed using Statistica software (version 13.3, StatSoft Inc., USA). Each determination was conducted in triplicate or greater, ensuring measurement accuracy and reproducibility.

3. Results and Discussion

3.1. Farinograph Properties of Dough

The farinographic characteristics of wheat dough with increasing levels of sea buckthorn pomace are presented in Table 1. The incorporation of pomace significantly affected (p ≤ 0.05) the mixing behavior and overall dough quality, which can be attributed to its distinct chemical composition compared with wheat flour (Table 2).
A clear increase in water absorption (the amount of water required to achieve a dough consistency of 500 Farinograph Units, FU) was observed, from 59.9% (CON) to 68.9% (SBPB12). This trend reflects the high total dietary fiber (TDF = 55.8%) and, in particular, the insoluble fraction (IDF = 44.5%) of the pomace. Insoluble fibers, mainly cellulose and hemicelluloses, exhibit strong water-binding and swelling capacities, leading to increased water demand during dough formation. The relatively high protein content of the pomace (24.2%) may further contribute to this effect, as both gluten and non-gluten proteins bind water through hydrogen bonding. The observed increase in WA is consistent with findings for other fiber- or protein-enriched doughs, where hydrophilic compounds enhance the water-holding capacity of the dough [23,24]. By-products such as fruit pomaces and oilseed cakes, rich in fiber and hydroxyl-bearing polysaccharides, readily form hydrogen bonds with water, thereby promoting water absorption during dough mixing [25,26,27]. However, the opposite trend has also been reported for fiber-rich ingredients with higher lipid contents. For example, Roozegar et al. [28] and Codina et al. [29] found that the addition of ground whole flaxseed decreased dough water absorption due to gluten dilution and the coating effect of lipids, which form hydrophobic films on starch and protein surfaces, thus limiting water uptake.
Dough development time, the period required to reach maximum dough consistency, increased significantly from 6.0 to 7.5 min with higher pomace addition. This extension suggests that gluten development was delayed by competition for available water between gluten proteins and the fiber-protein complexes from the pomace. Non-gluten proteins may also interfere with gluten polymerization, slowing network formation. Furthermore, the relatively high acidity of sea buckthorn pomace can inhibit enzymes such as α-amylase, altering dough rheology and extending both development and partial stabilization times [30]. However, excessive acidity may also destabilize the dough by disrupting enzyme activity crucial for gluten integrity. Studies on other fruit and oilseed by-products confirm that changes in DDT are not always consistent and depend strongly on the chemical and physicochemical characteristics of the additive [14]. For example, Mironeasa and Mironeasa [31] reported a longer DDT for dough containing up to 9% grape peel powder, while Kohajdová et al. [32] observed a similar effect for apple pomace (up to 15%). In contrast, Wirkijowska et al. [33] found that flaxseed cake (15%) shortened DDT, and Dahdah et al. [34] observed the same for freeze-dried olive pomace (up to 5%). These reductions are generally linked to gluten dilution and the presence of hydrophobic lipid fractions, which limit gluten hydration and accelerate dough softening [29]. Thus, while fiber content is an important determinant, the combined effects of lipids, proteins, and acidity must also be considered when assessing dough development behavior.
In contrast to DDT, stability time decreased markedly from 12.3 min (CON) to 5.5–5.9 min (SBPB9–SBPB12), indicating reduced tolerance to mechanical mixing. This decline likely results from both gluten dilution and structural interference caused by the high fiber (55.8%) and lipid (14.8%) contents of the pomace. Lipids can form surface layers on gluten and starch granules, hindering protein–protein interactions and weakening the dough matrix. Additionally, the elevated ash and fiber levels contribute to a more heterogeneous structure, further destabilizing the gluten network during mixing. The combined effects of soluble (SDF) and insoluble (IDF) fiber components (Table 2) also influence water retention and matrix continuity. High fiber content increases water absorption but simultaneously disrupts gluten continuity, making the dough less stable [30,35,36]. Proteins and fats present in the pomace can further interfere with gluten formation, jointly reducing dough stability [30,35].
Dough softening increased proportionally with pomace level from 45.3 FU in the control to 70.4 FU in SBPB9, confirming a progressive loss in dough consistency over time. This behavior can be attributed to a weaker gluten network and the limited ability of pomace-containing doughs to maintain resistance during extended mixing. Fiber particles act as discontinuities within the gluten matrix, reducing elasticity and facilitating structural breakdown under shear stress. Moreover, the high acidity of the pomace may further contribute to dough softening by altering enzyme activity and water distribution [30,37,38]. These combined factors lead to a softer, less cohesive dough.
As a consequence, the Farinograph Quality Number (FQN) decreased significantly, from 137.1 (CON) to approximately 104–110 for samples containing ≥6% pomace. This decline reflects the combined impact of gluten dilution, fiber-protein-lipid interactions, and modified water dynamics. Similar reductions in FQN have been observed for doughs enriched with high-fiber materials such as fruit pomaces, bran, and other cereal by-products [39,40].
Overall, the addition of sea buckthorn pomace increased dough water absorption but reduced stability and overall strength at higher inclusion levels. These effects are closely related to the pomace’s chemical composition; its high fiber, lipid, and mineral contents increase water demand while reducing gluten cohesiveness. Moderate substitution levels (3–6%) maintained acceptable farinograph performance, suggesting that this range allows for partial nutritional enhancement without compromising the technological quality of the dough.

3.2. Chemical Composition of Raw Materials and Bread

The proximate composition of raw materials and the resulting breads is presented in Table 2. Pronounced compositional differences were found between wheat flour and sea buckthorn pomace (SBP), which directly influenced the nutritional characteristics of the breads.
Sea buckthorn pomace exhibited considerably higher levels of protein (24.2%), fat (14.8%), ash (1.89%), and total dietary fiber (TDF; 55.8%) compared to wheat flour (13.3%, 0.49%, 0.72%, and 5.38%, respectively). The pomace contained predominantly insoluble fiber (44.5%) and a smaller soluble fraction (11.3%), whereas its carbohydrate content (3.3%) and energy value (319.8 kcal/100 g) were markedly lower than those of wheat flour (80.1% and 340.3 kcal/100 g). These differences reflect the fibrous, low-starch nature of SBP, which consists largely of seed and peel residues remaining after oil extraction.
The incorporation of SBP into the bread formulation led to noticeable compositional shifts. The ash content increased gradually from 2.29% (CON) to 2.51% (SBPB12), confirming the mineral contribution from the pomace. Similarly, protein content rose significantly (p ≤ 0.05) from 13.5% in the control to 16.8% at 12% pomace addition, demonstrating the protein-enriching potential of the by-product.
A marked increase was also observed in the fat content, which rose more than fourfold from 0.51% in the control to 2.13% in SBPB12. This trend corresponds with the naturally high lipid level of the pomace and may enhance the nutritional quality of the lipid fraction, as sea buckthorn oil is rich in unsaturated fatty acids such as oleic, linoleic, and palmitoleic acids [12,13].
The total dietary fiber (TDF) content increased substantially from 5.4% in the control to 11.6% in SBPB12, with the insoluble fraction (IDF) being dominant. The soluble fraction (SDF) also increased from 2.99% to 4.11%, potentially enhancing the functional properties of the bread by improving digestive health and modulating the glycemic response, although these effects require confirmation in further studies. Sea buckthorn pomace contains considerable amounts of insoluble fiber, mainly cellulose, lignin, and hemicelluloses [15], which promotes intestinal regularity and increases stool bulk [36,41]. The soluble fraction, composed largely of pectin and non-cellulosic polysaccharides, can slow glucose absorption and support blood glucose regulation [36,41].
In contrast, carbohydrate content (CHO) decreased proportionally with increasing substitution level, from 78.2% (CON) to 67.0% (SBPB12), reflecting the replacement of starch-rich wheat flour with a fiber- and protein-rich additive. Consequently, the energy value of the breads declined from 229.6 kcal/100 g (control) to 216.8 kcal/100 g (SBPB12), representing a reduction of about 5.6%. Although fat content increased, the concurrent drop in available carbohydrates led to a lower overall caloric value. From a nutritional standpoint, this shift is favorable, as the bread becomes richer in fiber and protein while slightly reducing caloric density. Comparable results were reported by other authors who utilized sea buckthorn pomace powder (up to 10%) obtained after juice extraction [15]. In that study, the energy value of bread samples ranged from approximately 217 to 260 kcal/100 g, with all pomace-enriched variants showing lower caloric content than the control. Minor variations in energy value were attributed to differences among the sea buckthorn varieties used, yet these differences were not statistically significant. Overall, the findings confirmed that the incorporation of sea buckthorn by-products can effectively reduce the caloric value of bread while simultaneously improving its nutritional profile.
Overall, the addition of sea buckthorn pomace significantly improved the nutritional quality of the bread by increasing its protein, mineral, lipid, and dietary fiber contents. The observed compositional modifications confirm the potential of this by-product as a functional, clean-label ingredient that simultaneously supports nutritional enhancement and sustainable raw material utilization. However, it should be noted that the study has certain limitations, particularly the lack of biochemical analyses of the final product and the absence of functional tests (e.g., antioxidant or antimicrobial activity). Future studies could address these gaps to provide a more comprehensive characterization of the bread’s bioactive potential and functional properties.

3.3. Evaluation of Bread Quality Characteristics

The physical properties of breads with increasing levels of sea buckthorn pomace are presented in Table 3. Significant differences (p ≤ 0.05) were observed among samples in terms of baking yield, specific loaf volume, and crumb moisture.
Bread yield increased steadily from 136.3% (CON) to 157.3% (SBPB12), which reflects the enhanced water retention capacity of the dough. This effect can be directly linked to the high dietary fiber content of the pomace (Table 2), particularly the insoluble fraction (IDF = 44.5%) that effectively binds and immobilizes water during dough mixing and baking. Such behavior has been reported previously for fiber-enriched systems, where increased hydration and capillary water entrapment led to higher baking yields [42]. The simultaneous decrease in baking loss from 10.8% to 9.9% supports this observation, suggesting that the pomace matrix limited water evaporation during baking [42,43].
In contrast, the specific loaf volume decreased significantly (p ≤ 0.05) with increasing pomace level from 3.45 cm3/g (CON) to 2.42 cm3/g (SBPB12). This decline indicates reduced gas retention capacity and a weaker gluten network, consistent with the farinograph results (Table 1). The addition of non-gluten components, such as fiber, proteins, and lipids from sea buckthorn pomace, likely interfered with gluten development and gas cell stabilization during proofing. At low pomace levels (3–6%), the gluten network remained sufficiently cohesive to support gas expansion, while higher additions (≥9%) led to a denser and less aerated crumb. A similar negative effect on loaf volume has been described for wheat breads enriched with fruit pomaces and other high-fiber additives [15,24,25,42].
Crumb moisture, measured after 24 and 72 h of storage, increased significantly (p ≤ 0.05) in all breads containing pomace. After 24 h, values ranged from 40.0% (CON) to 42.6% (SBPB12), and after 72 h from 38.5% to 41.1%, respectively. The higher moisture retention is consistent with the composition of the pomace (Table 2), particularly its high levels of soluble and insoluble fiber, which act as water-binding agents and slow down moisture migration during storage. This effect aligns with earlier observations that plant-derived fibers, especially those containing pectic and hemicellulosic polysaccharides, enhance water-holding capacity and contribute to delayed crumb staling [15,44,45].
The increase in crumb moisture over storage time also suggests a redistribution of bound and free water within the crumb matrix. Soluble fiber fractions (SDF = 11.3% in pomace) can form viscous gels that entrap water, stabilizing crumb texture and reducing moisture loss [44,45]. These effects are nutritionally beneficial, as they not only improve perceived freshness but also contribute to prolonged softness and consumer acceptability.
In summary, the incorporation of sea buckthorn pomace into wheat bread formulations resulted in higher baking yield and moisture retention, but reduced loaf volume at higher inclusion levels. The observed physical changes are consistent with the chemical composition of the pomace; its high fiber and fat contents increased water-binding capacity but weakened the gluten network. Moderate substitution levels (3–6%) provided a balanced compromise between technological quality and nutritional improvement, while higher levels (≥9%) caused excessive dough weakening and loss of gas retention capacity.
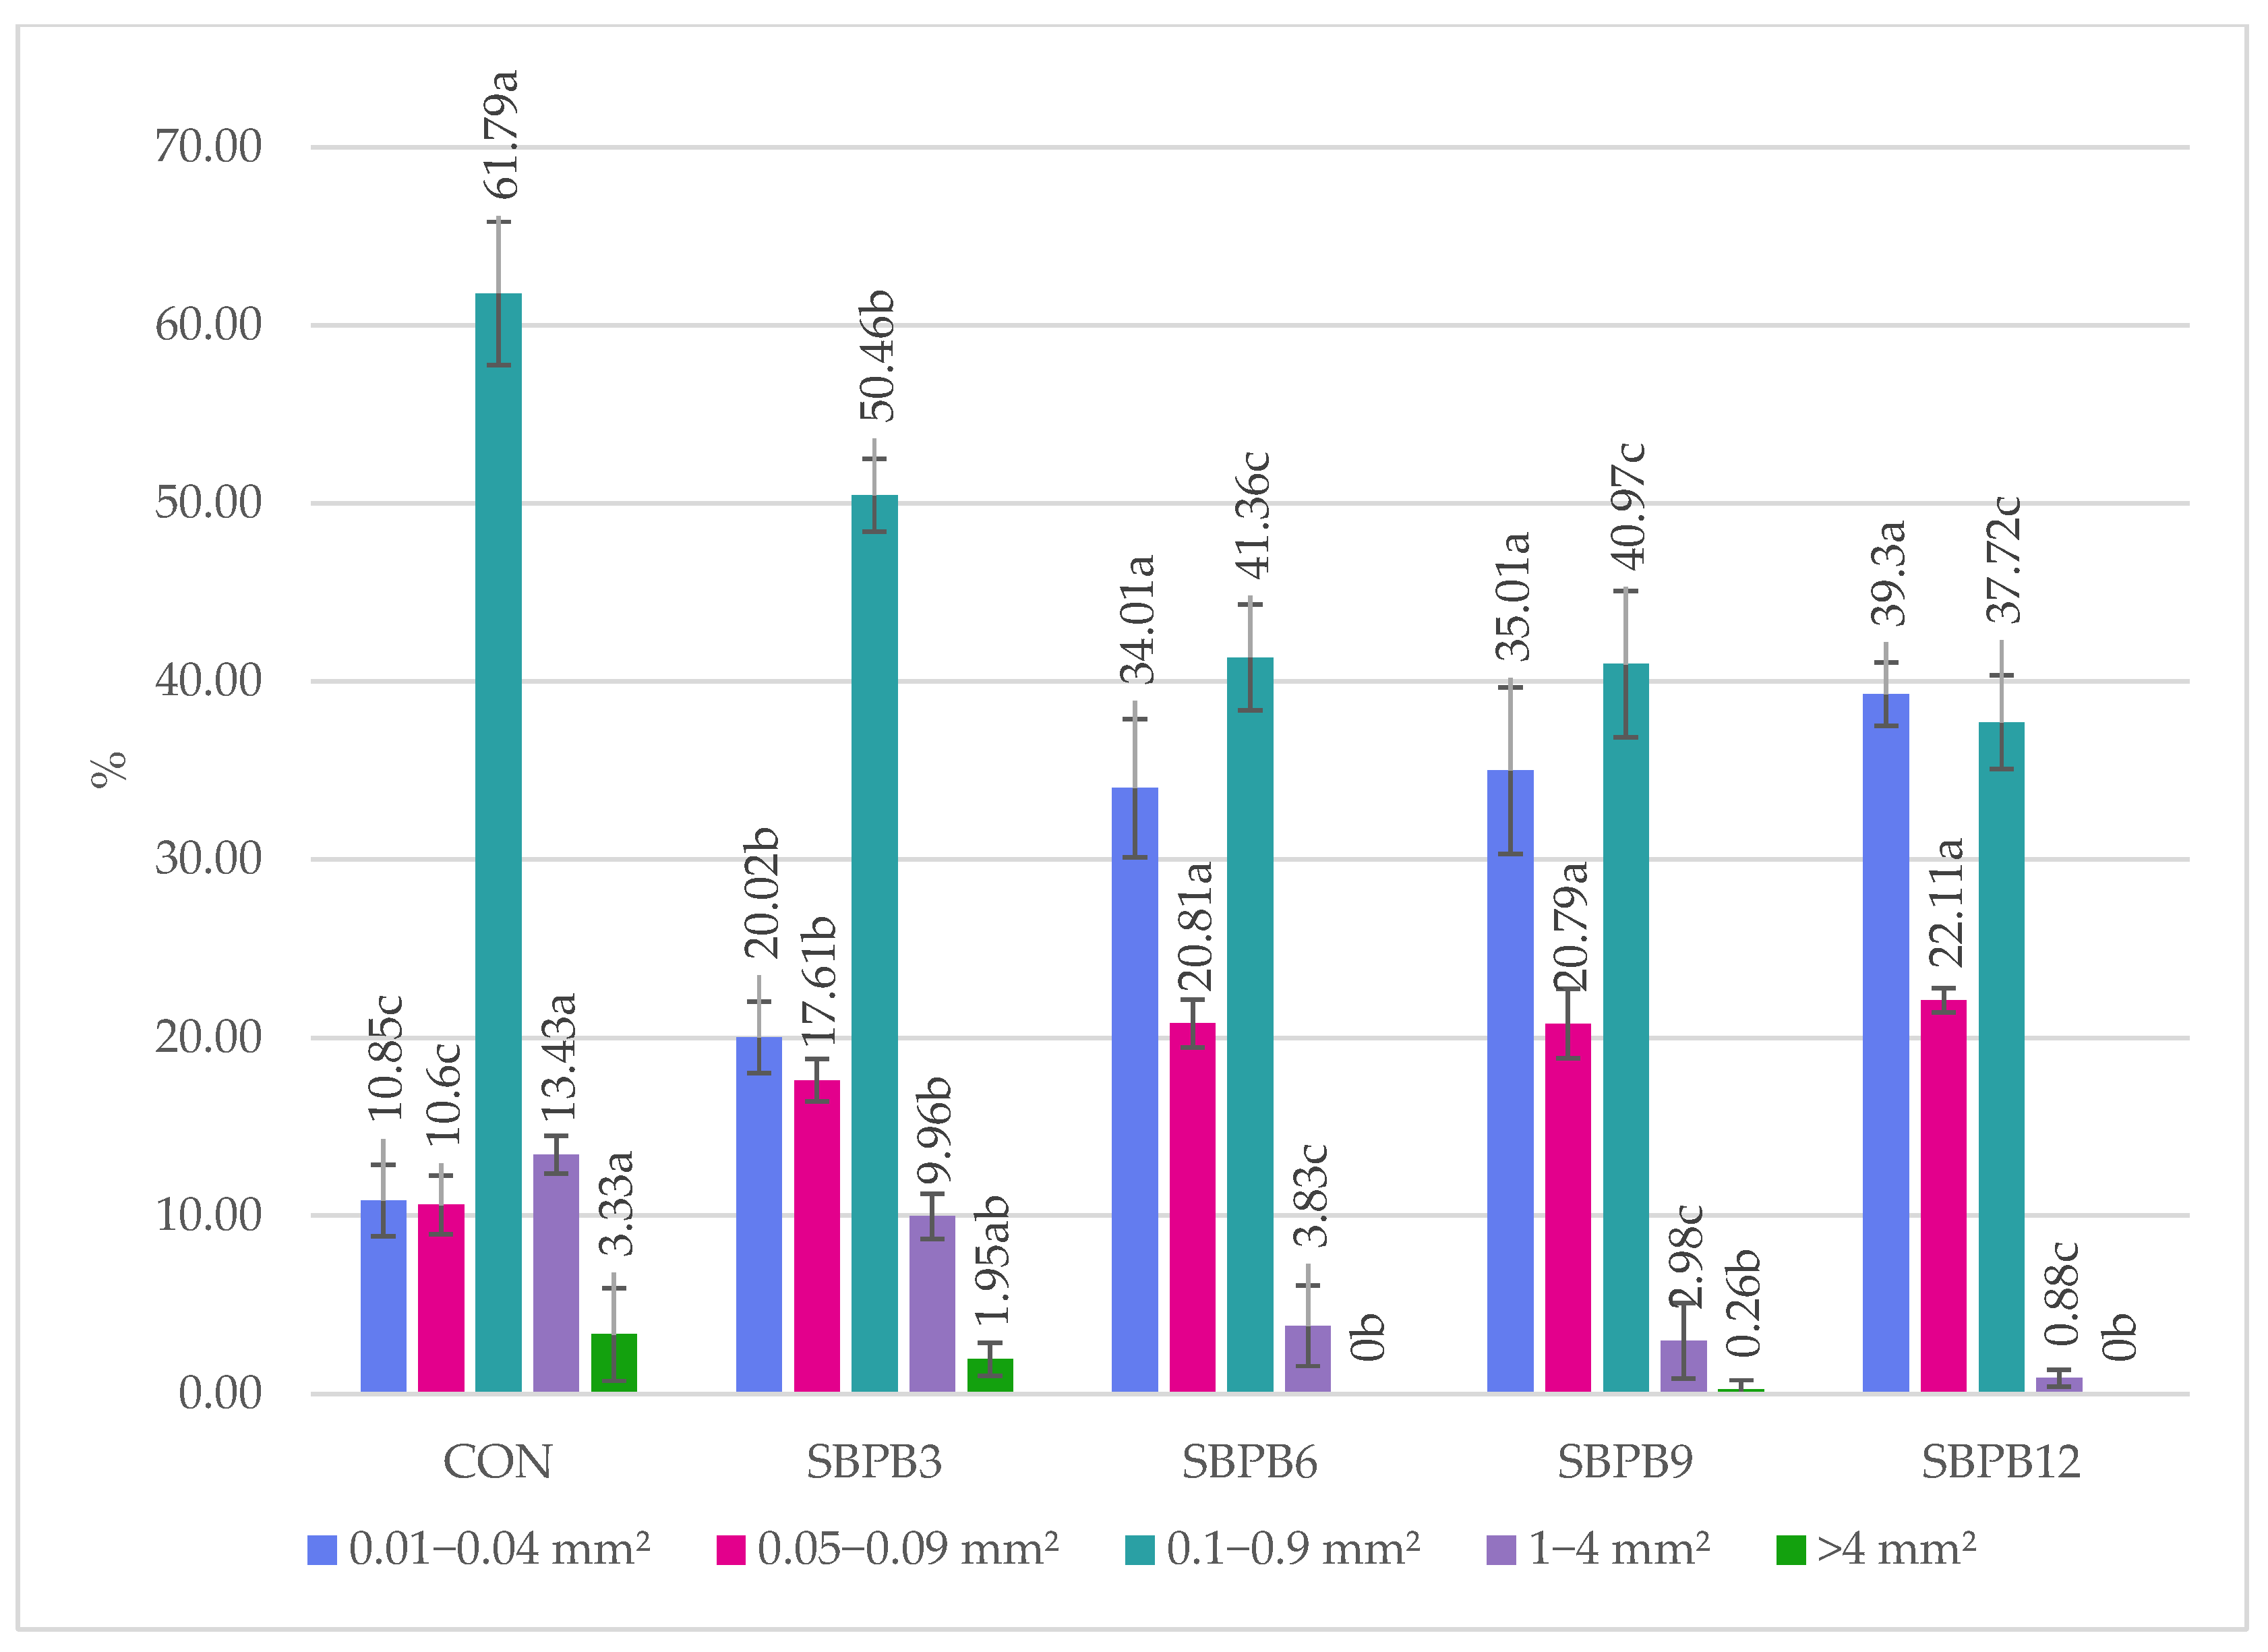
The pore structure of bread crumb, expressed as both the number and surface area of pores in defined size classes, is presented in Figure 1 and Figure 2. The distribution of pore sizes was significantly (p ≤ 0.05) influenced by the addition level of sea buckthorn pomace.
In the control sample, small pores (0.01–0.04 mm2) accounted for approximately 58% of all pores, whereas medium-sized pores (0.1–0.9 mm2) represented about 24%. The incorporation of sea buckthorn pomace led to a progressive increase in the number of small pores, reaching nearly 80% in SBPB12, accompanied by a notable decline in the share of larger pores (>0.1 mm2). This shift toward smaller pore sizes indicates reduced gas retention and limited expansion during proofing, likely resulting from partial gluten network disruption and increased dough viscosity caused by the high fiber and lipid content of the pomace (Table 2).
The proportion of pores in the 0.05–0.09 mm2 and 0.1–0.9 mm2 ranges decreased markedly with increasing pomace addition. In particular, the number of pores between 0.1 and 0.9 mm2 dropped from 24% (CON) to only 6.7% (SBPB12), while pores larger than 1 mm2 were almost absent in breads with ≥6% pomace. These results confirm that the incorporation of SBP limited gas cell expansion, leading to a more compact and homogeneous crumb.
Analysis of the total pore surface area (Figure 2) further supports this observation. In the control sample, the 0.1–0.9 mm2 pores dominated, accounting for over 60% of the total pore surface. With increasing pomace levels, this proportion steadily declined to about 38% in SBPB12, while the share of the smallest pores (0.01–0.04 mm2) increased from approximately 11% to nearly 40%. Larger pores (1–4 mm2) and very large pores (>4 mm2) were detected only in the control and SBPB3 samples, confirming a gradual densification of crumb structure.
The observed decline in both the number and surface share of large pores corresponded well with the reduced specific loaf volume (Table 3) and increased crumb hardness (Table 4). Quantitative image analysis confirmed a gradual reduction in overall crumb porosity (defined as the ratio of total pore area to the total slice area), decreasing by approximately 3% for SBPB3, 7.2% for SBPB6, 22.1% for SBPB9, and 27% for SBPB12 relative to the control. Such a pronounced decline indicates progressively lower gas retention and expansion capacity with increasing pomace concentration. Similar relationships between fiber enrichment and reduced porosity have been reported in other studies. Ghendov-Mosanu et al. [46] observed that the incorporation of 3–5% sea buckthorn pomace powder (derived from juice pressing) decreased crumb porosity by 5.7–17.4% compared with the control, which the authors attributed to limited dough extensibility and impaired gas retention during fermentation. Likewise, comparable trends have been described for other high-fiber by-products, such as flaxseed cake and olive pomace, where increased fiber and lipid contents disrupted the gluten matrix and restricted gas cell expansion [33,34].
However, some authors have reported opposite effects when lower levels of pomace or varieties rich in simple sugars were used, which may enhance yeast activity and gas production during fermentation [47]. These contrasting findings suggest that the direction and magnitude of porosity changes depend strongly on both the type and concentration of the additive, as well as its composition, particularly fiber solubility, residual sugar content, and acidity.
Overall, the addition of sea buckthorn pomace induced a concentration-dependent modification of crumb microstructure. Low inclusion levels (3–6%) maintained relatively open and balanced porosity, whereas higher concentrations (≥9%) resulted in finer, denser, and more uniform crumb structures. These microstructural transformations align with farinographic and textural results, confirming that sea buckthorn pomace modifies both dough rheology and crumb architecture through its complex matrix of dietary fibers, lipids, and proteins.

3.4. Texture Profile Analysis (TPA) of Bread

The texture profile parameters of bread crumb (hardness, springiness, cohesiveness, and chewiness), after 24 and 72 h of storage are presented in Table 4. Both storage duration and the proportion of sea buckthorn pomace significantly (p ≤ 0.05) affected crumb texture, confirming the strong influence of fiber- and lipid-rich ingredients on the mechanical properties and staling behavior of wheat bread.
Crumb hardness increased significantly (p ≤ 0.05) with both higher pomace levels and prolonged storage. After 24 h, hardness ranged from 3.8 N (CON) to 12.4 N (SBPB12), and after 72 h from 7.1 N to 25.8 N, respectively. This progressive firming corresponds to the high content of insoluble dietary fiber (44.5% d.b.), protein (24.2% d.b.), and lipids (14.8% d.b.) in sea buckthorn pomace (Table 2). These components contribute to dough stiffening and, as reported in previous studies, increase crumb firmness in breads fortified with fiber- or oil-extraction by-products [48,49]. The lower specific loaf volume of enriched breads (Table 3) further supports this relationship; denser crumbs exhibit greater mechanical resistance and thus higher hardness. Similar trends were observed in breads containing other oil-pressing residues [42,45].
Interestingly, although hardness increased in all formulations during storage, the relative rate of firming was lower in SBPB3 and SBPB6, suggesting that moderate pomace levels (3–6%) may help stabilize crumb softness. This effect may be related to the water-binding capacity of soluble fibers and minor hydrocolloidal components, which can limit water migration and slow down moisture loss during storage [42].
Springiness, reflecting the elastic recovery of the crumb after compression, decreased slightly with pomace addition and storage time. After 24 h, values ranged from 0.97 (CON) to 0.85 (SBPB12), showing statistically significant differences (p ≤ 0.05) between the control and pomace-containing breads. However, within the range of 3–12% pomace, differences among levels were small and not statistically significant. After 72 h, springiness declined modestly, with no significant changes between 24 and 72 h for most samples except SBPB12. These results suggest that pomace addition slightly reduced crumb elasticity relative to the control, but storage did not markedly alter this property. The lower springiness of SBPB12 may result from combined effects of gluten dilution and reduced gas cell uniformity [42], as reflected in its smaller specific loaf volume (Table 3).
Cohesiveness, describing the internal bonding strength of the crumb, also decreased with pomace addition but without clear dependence on substitution level. After 24 h, values ranged from 0.66 (CON) to 0.54 (SBPB12), and after 72 h from 0.46 (CON) to 0.34 (SBPB12). Although a general decline was observed, differences between pomace levels were not statistically significant (p ≥ 0.05). The reduced cohesiveness may be attributed to the high fiber content and structural changes introduced by the pomace [15], consistent with observations for other fruit or oilseed by-products [50]. The decrease in cohesiveness reflects partial disruption of the gluten-starch matrix, as insoluble dietary fibers reduce the extractability of low molecular weight glutenin subunits (LMW-GS), promoting glutenin polymerization and limiting dough extensibility and fermentation capacity. This mechanism leads to a denser and less cohesive crumb [51]. Interactions between insoluble fibers and gluten depend on their degree of swelling and hydration. Both physical effects, such as competition for water and steric hindrance, and chemical effects, including hydrogen bonding, play important roles in shaping the dough structure [52]. The farinograph results (Table 1), showing reduced dough stability and increased softening, support this interpretation, indicating that the addition of pomace weakens the gluten network and promotes the formation of a more fragile crumb structure.
Chewiness, a derived parameter combining hardness, cohesiveness, and springiness, increased with both pomace addition and storage time. After 24 h, it ranged from 2.5 N (CON) to 5.7 N (SBPB12), and after 72 h from 3.7 N to 6.7 N. These differences were not statistically significant (p ≥ 0.05), reflecting compensating effects of other texture attributes. The general increase in chewiness corresponds to the higher hardness and overall moisture content of pomace-enriched breads, although much of this water was bound within the fiber matrix and thus unavailable to plasticize the gluten-starch network [50]. Consequently, despite higher total moisture, the crumb became denser and mechanically more resistant. Strong correlations between hardness and chewiness (r > 0.95) and negative correlations between springiness and moisture (r ≈ −0.9) indicate that textural changes during storage were primarily driven by water redistribution and reduced mobility of bound water within the crumb matrix.
Overall, the texture of breads enriched with sea buckthorn pomace was influenced mainly by the fiber-related structural effects and water dynamics during storage. High levels of insoluble fiber promoted crumb firming and reduced elasticity, while lipids and proteins modified water binding and gluten interactions [50,51,52]. Nevertheless, low to moderate pomace levels (3–6%) maintained an acceptable texture profile and may enhance nutritional value without compromising consumer-relevant quality. These findings align with previous studies on fiber-rich bakery ingredients, which demonstrated that moderate enrichment can improve crumb softness and delay staling, whereas excessive amounts tend to disrupt the gluten matrix and increase firmness [50,51,52]. The combined analysis of farinograph behavior, loaf volume, crumb moisture, and texture parameters confirms that sea buckthorn pomace influences both dough rheology and bread staling kinetics through its complex composition of hydrophilic and hydrophobic components.

3.5. Evaluation of Color Parameters of Bread Crumbs

Crumb color is a key sensory and quality attribute that affects consumer perception of bread freshness, composition, and overall appeal. The total color difference (ΔE*) calculated relative to the control sample clearly demonstrated the effect of sea buckthorn pomace addition on crumb color (Table 5). Even the lowest pomace level (3%) produced a statistically significant difference (p ≤ 0.05), with ΔE* increasing progressively up to values above 9 units for SBPB12, confirming that these changes were perceptible to the human eye.
The lightness (L*) and whiteness index (WI) values followed similar patterns, both showing a gradual and statistically significant (p ≤ 0.05) decrease as the proportion of sea buckthorn pomace increased. The control bread exhibited the highest brightness (L* = 62.4; WI = 60.6), while SBPB12 showed the lowest (L* = 53.5; WI = 51.8). These reductions reflect the dark-orange hue of the pomace itself, rich in carotenoids and phenolic pigments, which contributed to darker crumb coloration. The changes in L* and WI were not strictly linear, samples SBPB3 and SBPB6 differed only slightly from the control, while a pronounced decrease was observed in SBPB9 and SBPB12. This suggests that at low addition levels, the pomace pigments are diluted within the flour matrix, while higher inclusions increase pigment transfer and browning intensity during baking.
The a* parameter (red–green axis) also increased significantly (p ≤ 0.05) at the highest substitution level, from 0.7 (CON) to 0.9 (SBPB12), indicating a shift toward reddish tones. Although the differences between intermediate samples (3–9%) were not statistically significant, the trend reflects the intrinsic orange–red coloration of sea buckthorn pomace.
In contrast, the b* coordinate (yellow–blue axis), together with the yellowness index (YI), revealed more complex, non-linear behavior. At low pomace levels (SBPB3 and SBPB6), b* and YI values decreased slightly compared to the control, suggesting a mild dilution of natural flour pigments. However, at higher levels (SBPB9 and SBPB12), both parameters increased sharply, reaching maximum values of 12.4 (b*) and 33.3 (YI), significantly exceeding those of the control (p ≤ 0.05). This indicates that the yellowness of the crumb intensified only once the pigment concentration of the pomace dominated over the flour’s native color compounds.
The browning index (BI) showed a similar trend, rising significantly from 20.8 in the control to 27.3 in SBPB12. This increase reflects both the direct contribution of carotenoids and the intensified Maillard and caramelization reactions during baking, promoted by the presence of simple sugars and amino acids in the pomace matrix. Taken together, the color changes, particularly the decrease in L* and WI and the increase in YI and BI, demonstrate that sea buckthorn pomace addition leads to perceptible darkening and yellow-orange enhancement of the bread crumb. The total color difference (ΔE*) exceeding 5 in SBPB9 and SBPB12 confirms that these modifications are visually evident. From a sensory perspective, such darker and warmer crumb tones may be positively perceived by consumers, as they are often associated with higher fiber and bioactive compound content. However, the non-linear response suggests that moderate inclusion levels (3–6%) allow for visual differentiation without excessive darkening, maintaining an appealing appearance and aligning with desirable quality attributes.

3.6. Sensory Evaluation of Bread

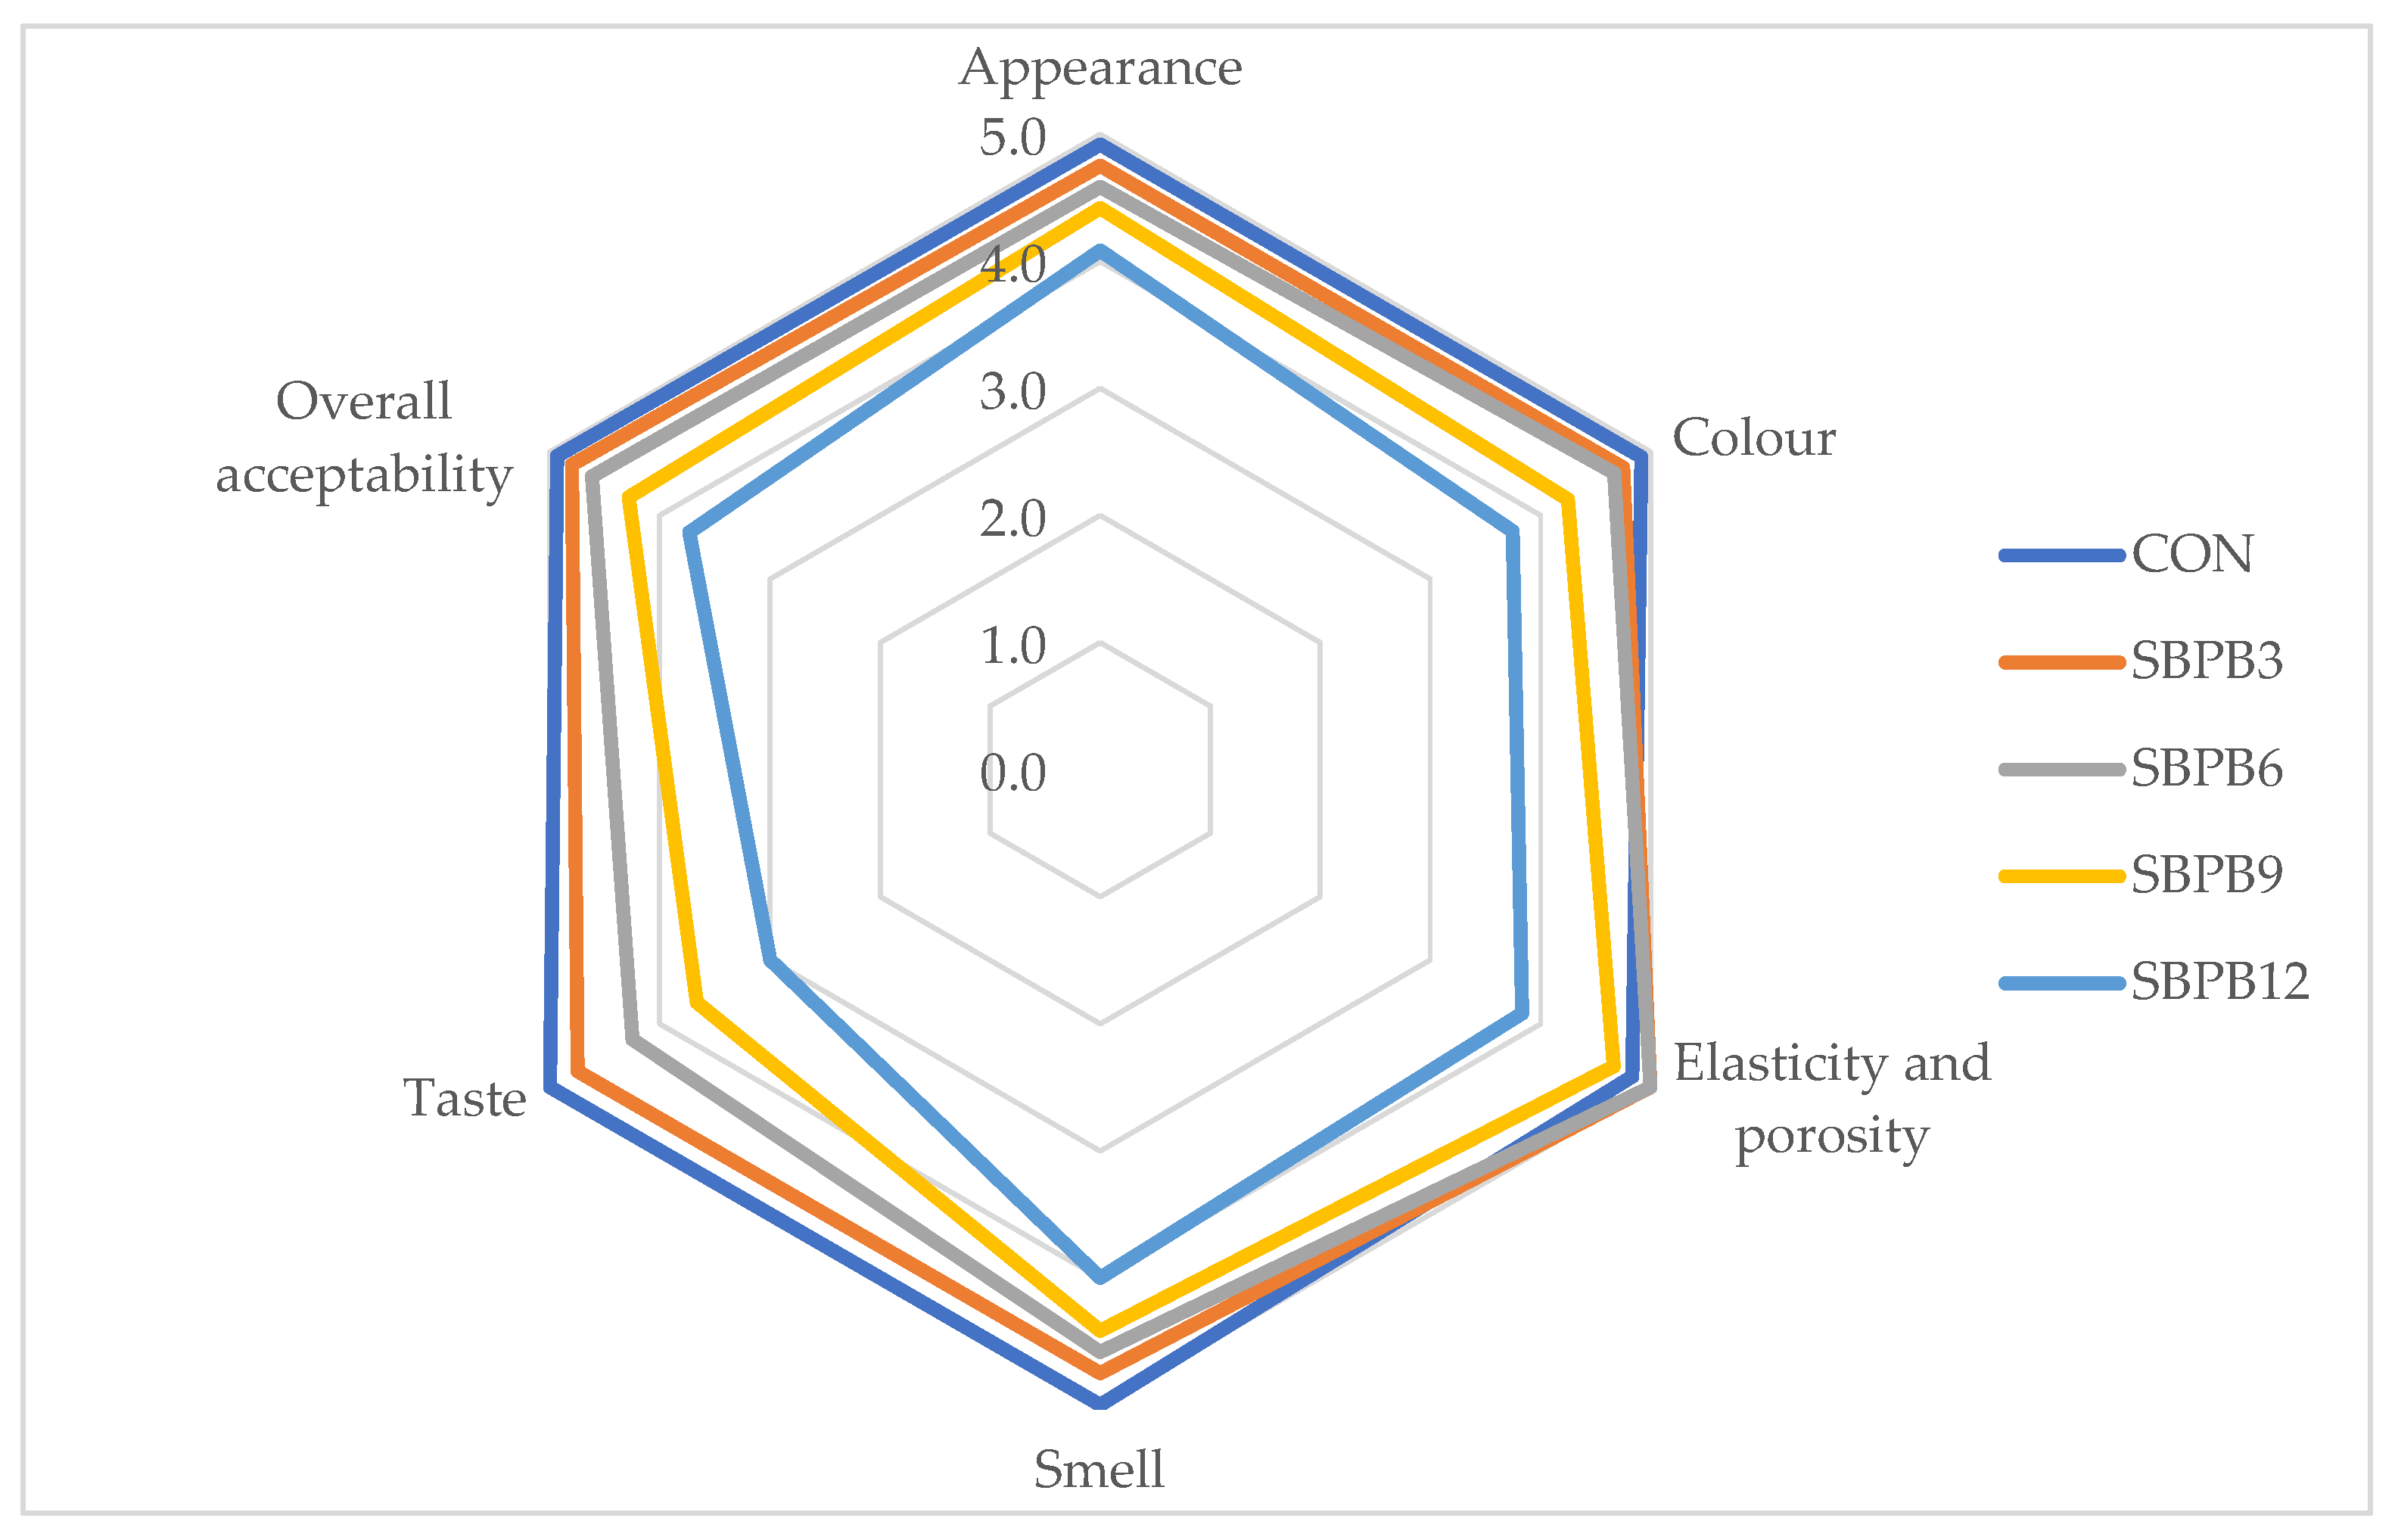
The sensory quality of bread is a key factor determining consumer acceptance and market potential. Mean scores for appearance, color, elasticity and porosity, smell, taste, and overall acceptability are presented in Figure 3. In general, the incorporation of sea buckthorn pomace had a significant (p ≤ 0.05) effect on several sensory attributes, particularly at higher substitution levels.
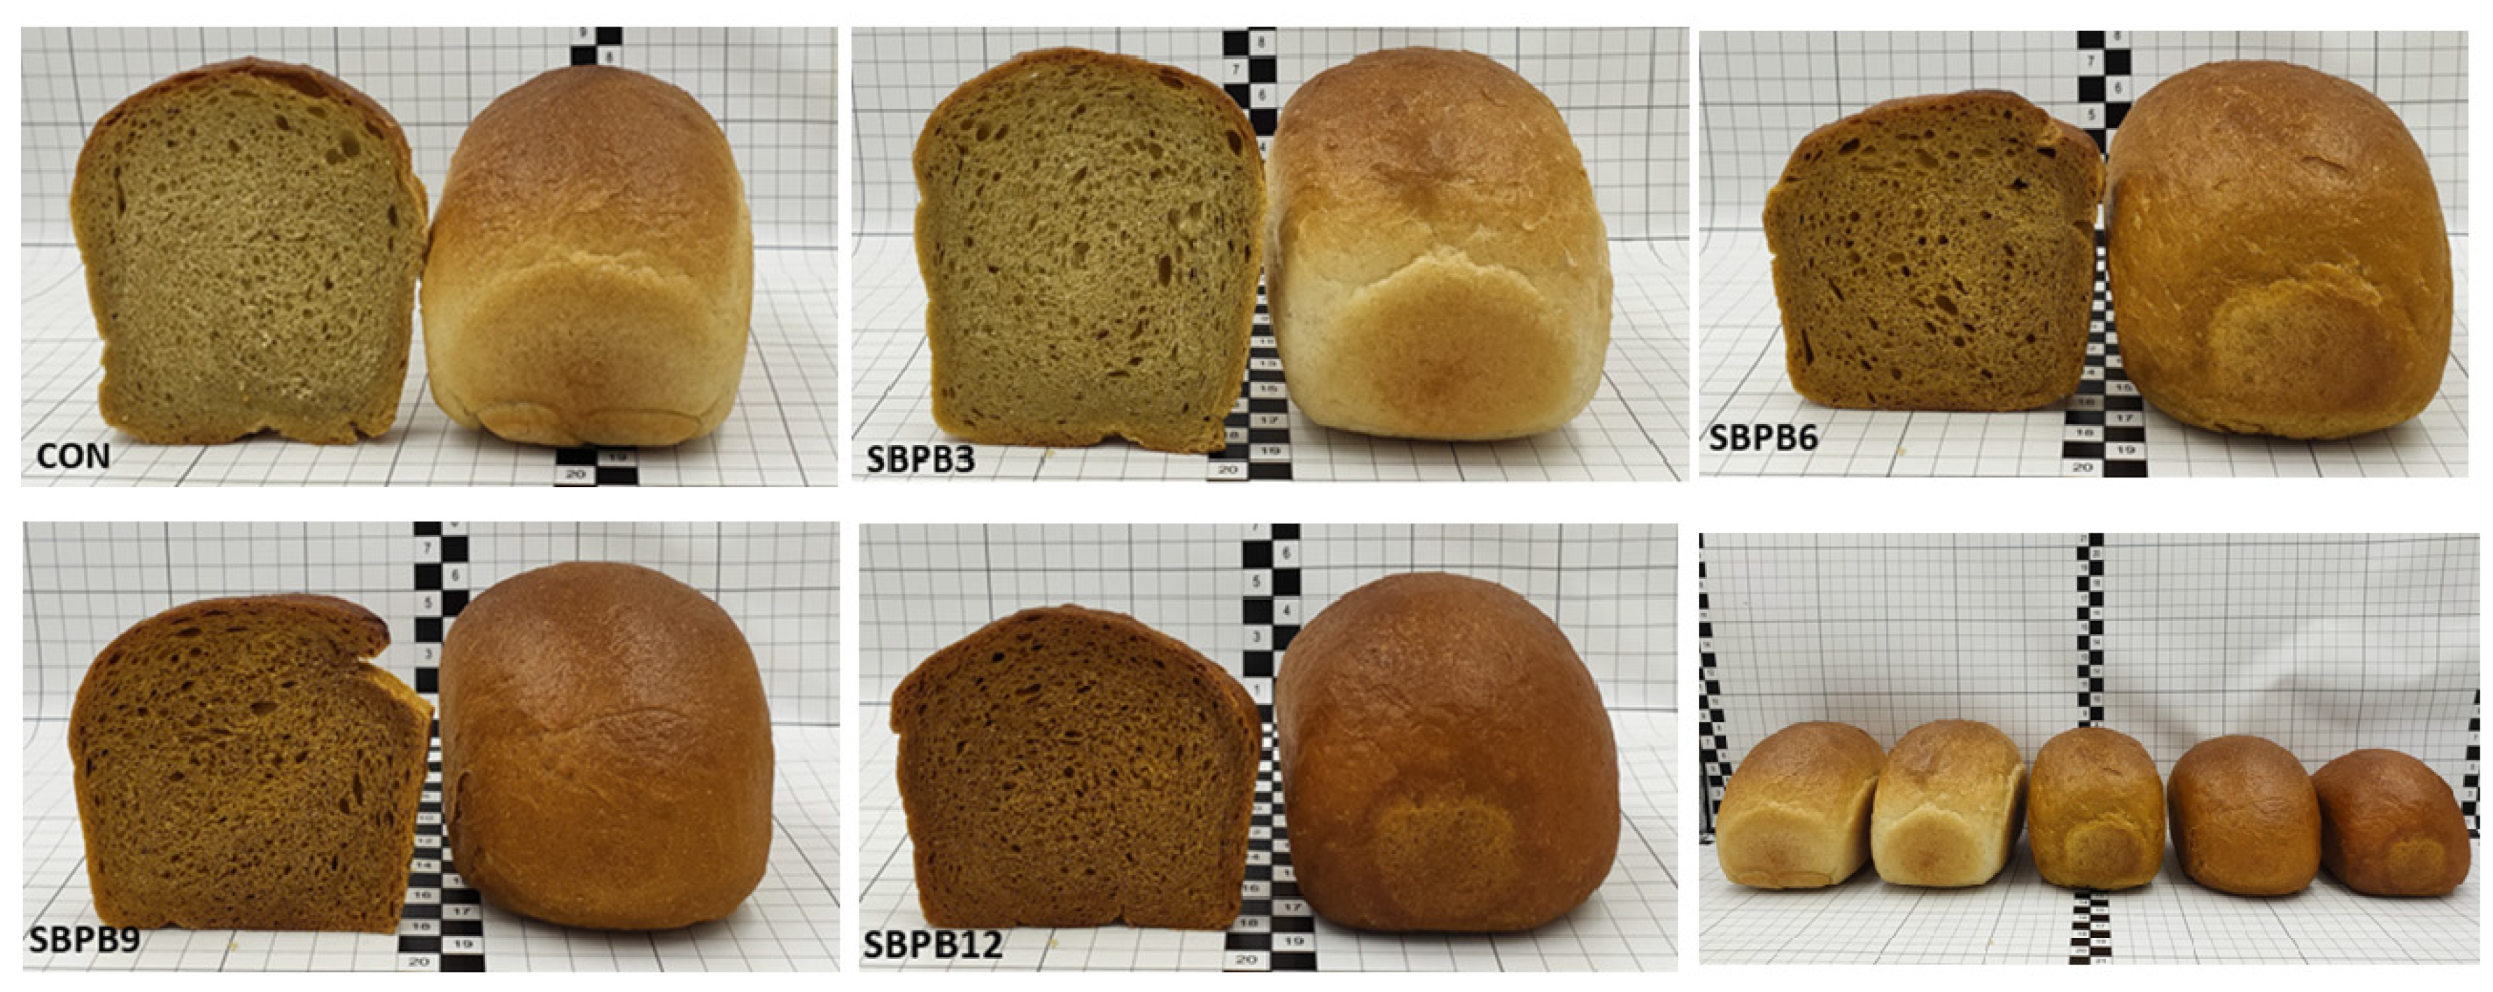
To illustrate the external and internal characteristics of the loaves, representative surface and cross-section images of breads containing 0–12% sea buckthorn pomace are shown in Figure 4. The photographs illustrate the progressive color darkening and structural densification with higher pomace addition.
All breads containing up to 6% pomace (SBPB3 and SBPB6) achieved high ratings across most parameters, with mean overall acceptability exceeding 4.5 points and an acceptability index (AI) above 90% (ranging from 98.7% for the control to 96.0%, 92.3%, 85.7%, and 74.7% for samples with 3%, 6%, 9%, and 12% pomace addition, respectively). These values confirm that low-to-moderate pomace addition did not negatively affect sensory appeal. According to Lukas et al. [21], products with an AI exceeding 70% are considered well accepted; therefore, all formulations except SBPB12 can be classified as sensorially acceptable.
At higher inclusion levels (9–12%), a gradual but statistically significant (p ≤ 0.05) decline was observed in appearance, color, and especially in taste and elasticity/porosity. The lowest ratings were obtained for SBPB12, with overall acceptability of 3.7 ± 0.8 (AI = 74.7%), just above the threshold of sensory acceptance. This suggests that excessive pomace addition may begin to limit consumer preference.
The reduction in visual scores for appearance and color is consistent with instrumental color measurements (Table 5), which showed a decrease in lightness (L*) and whiteness index (WI) with increasing pomace level. The darker, orange-tinted crumb coloration, resulting from carotenoid pigments, may have been perceived as less typical for wheat bread, slightly reducing its visual attractiveness. However, at 3–6% addition, these color shifts were minor and did not significantly affect overall acceptability.
Elasticity and porosity, which represent crumb texture and internal structure, remained high (≈5.0 points) up to 6% pomace but decreased sharply at 9–12%, in line with the instrumental texture findings (Table 4). Increased hardness and reduced cohesiveness at higher pomace levels likely contributed to the perception of a denser, less elastic crumb. The correspondence between textural firmness and sensory elasticity confirms the influence of insoluble fiber and lipid components on dough structure and moisture distribution. As shown previously, higher pomace levels reduced loaf volume and increased hardness (Table 3 and Table 4, Figure 1 and Figure 2), both of which correlate with lower sensory elasticity and porosity.
Taste and aroma were the most differentiating attributes. Although aroma scores remained satisfactory across all samples, a significant (p ≤ 0.05) decline in taste ratings occurred above 6% pomace addition. Panelists described a slightly bitter and sour aftertaste, likely linked to phenolic compounds and organic acids naturally present in sea buckthorn pomace. Similar findings were reported by Stanciu et al. [15], who observed that breads containing sea buckthorn pomace powder (obtained after juice pressing) developed a mild sea buckthorn aroma and characteristic, slightly tart and bitter flavor. In that study, breads with 8% pomace addition were most appreciated by consumers, combining a light crust, dense but elastic crumb, and pleasant flavor profile. Higher substitution levels, however, intensified the sour/bitter notes and led to lower sensory scores. The authors also highlighted that flavor intensity varied depending on the variety of sea buckthorn used, suggesting that raw material composition, especially acidity and phenolic content, plays a decisive role in sensory outcomes.
These observations align with the present results, indicating that moderate pomace enrichment (up to 6%) preserves the sensory quality of wheat bread while enhancing its nutritional composition. Beyond this level, darker crumb color, firmer texture, and intensified characteristic taste begin to diminish consumer acceptability.
In summary, sea buckthorn pomace can be effectively used in wheat bread formulations at levels up to 6% without compromising sensory perception. Higher concentrations (≥9%) may introduce less desirable sensory traits, such as increased hardness, darkening of crumb, and stronger acidic or bitter flavor. These changes, linked to both compositional and structural modifications, define the sensory limits for incorporating sea buckthorn pomace while maintaining consumer-relevant product quality.

4. Conclusions

The incorporation of sea buckthorn pomace into wheat bread significantly affected dough rheology, loaf characteristics, nutritional composition, texture, and sensory quality in a concentration-dependent manner. The most favorable results were obtained for breads containing 3–6% pomace, which showed the highest technological performance: acceptable dough stability, only moderate reductions in loaf volume, and a crumb structure similar to the control. These levels also produced the best sensory outcomes, with overall acceptability indices exceeding 90%. Nutritionally, the same range resulted in marked enrichment, protein increased from 13.5% to 15.3–16.0%, and total dietary fiber nearly doubled, while caloric value decreased by approximately 4–5%. In contrast, higher additions (9–12%) led to excessive increases in dough water absorption and crumb hardness, reduced extensibility, a denser pore structure, and the lowest sensory scores, mainly due to intensified sour/bitter notes and darkening of the crumb. These effects were driven primarily by the high insoluble fiber content and elevated lipid fraction of the pomace, which modified hydration patterns and interfered with gluten development. Although the study demonstrates the technological feasibility and nutritional enrichment potential of wheat bread fortified with sea buckthorn pomace, the findings should be interpreted in light of certain limitations. The pomace originated from a single industrial oil-pressing process, and its composition, particularly fiber structure, pigment profile, and residual lipids, may vary depending on cultivar, maturity, and processing conditions. The storage period assessed was relatively short and provides only a preliminary insight into staling behavior. Importantly, this study did not assess any physiological, health-related, or functional effects; therefore, no functional claims can be made based on the present results. Future research should therefore include detailed biochemical characterization of bioactive compounds (polyphenols, carotenoids, vitamin C), their stability during processing, and their interactions with gluten–starch networks, as well as evaluations of antioxidant or antimicrobial activity and potential physiological effects (e.g., glycaemic response, prebiotic properties). Extended storage trials and studies involving enzymatic or mechanical pre-treatment of pomace may further optimize its technological performance and expand its applicability in cereal-based products.

Author Contributions

Conceptualization, A.W.; methodology, A.W. and P.Z.; formal analysis, A.W.; investigation, A.W., P.Z. and K.T.; resources, A.W. and P.Z.; data curation, P.Z. and A.W.; writing—original draft preparation, A.W., P.Z. and K.T.; writing—review and editing, P.Z., A.W. and K.T.; visualization, P.Z. and A.W.; supervision, A.W. All authors have read and agreed to the published version of the manuscript.

Funding

The authors declare that no funds, grants, or other support were received during the preparation of this manuscript.

Institutional Review Board Statement

The study was approved by the Bioethics Committee at University of Life Sciences in Lublin (Resolution No. UKE/09/2023).

Informed Consent Statement

Not applicable.

Data Availability Statement

The data presented in this study are available on request from the corresponding author.

Conflicts of Interest

The authors declare no conflicts of interest.

References

  1. Mollakhalili-Meybodi, N.; Ehrampoush, M.H.; Hajimohammadi, B.; Mosaddeg, M.H. Formulation optimization of functional wheat bread with low glycemic index from technological and nutritional perspective. Food Sci. Nutr. 2023, 11, 284–294. [Google Scholar] [CrossRef]
  2. Almeida, E.L.; Chang, Y.K.; Steel, C.J. Dietary fibre sources in bread: Influence on technological quality. LWT-Food Sci. Technol. 2013, 50, 545–553. [Google Scholar] [CrossRef]
  3. FMCG Gurus. Clean Label: Redefining the Bakery Sector. Food Business Insights. 2020. Available online: https://eu-assets.contentstack.com/v3/assets/blt7a82e963f79cc4ec/blt02da71327172fae1/64b54ea9221d77b423491c9d/FBI-DM-CleanLabelBakery-0620.pdf (accessed on 28 April 2025).
  4. Trigo, J.P.; Alexandre, E.M.C.; Saraiva, J.A.; Pintado, M.E. High value-added compounds from fruit and vegetable by-products—Characterization, bioactivities, and application in the development of novel food products. Crit. Rev. Food Sci. Nutr. 2019, 60, 1388–1416. [Google Scholar] [CrossRef]
  5. Jimenez-Moreno, N.; Esparza, I.; Bimbela, F.; Gandia, L.M.; Ancin-Azpilicueta, C. Valorization of selected fruit and vegetable wastes as bioactive compounds: Opportunities and challenges. Crit. Rev. Environ. Sci. Technol. 2020, 50, 2061–2108. [Google Scholar] [CrossRef]
  6. Ancuța, P.; Sonia, A. Oil press-cakes and meals valorization through circular economy approaches: A review. Appl. Sci. 2020, 10, 7432. [Google Scholar] [CrossRef]
  7. Faustino, M.; Veiga, M.; Sousa, P.; Costa, E.M.; Silva, S.; Pintado, M. Agro-Food Byproducts as a New Source of Natural Food Additives. Molecules 2019, 24, 1056. [Google Scholar] [CrossRef] [PubMed]
  8. Fernández-López, J.; Lucas-González, R.; Viuda-Martos, M.; Sayas-Barberá, E.; Pérez-Alvarez, J.A. Chia oil extraction coproduct as a potential new ingredient for the food industry: Chemical, physicochemical, techno-functional and antioxidant properties. Plant Foods Hum. Nutr. 2018, 73, 130–136. [Google Scholar] [CrossRef]
  9. Prakash, K.; Naik, S.N.; Vadivel, D.; Hariprasad, P.; Gandhi, D.; Saravanadevi, S. Utilization of defatted sesame cake in enhancing the nutritional and functional characteristics of biscuits. J. Food Process. Preserv. 2018, 42, e13751. [Google Scholar] [CrossRef]
  10. Zarzycki, P.; Wirkijowska, A.; Nawrocka, A.; Kozłowicz, K.; Krajewska, M.; Kłosok, K.; Krawęcka, A. Effect of Moldavian Dragonhead Seed Residue on the Baking Properties of Wheat Flour and Bread Quality. LWT 2022, 155, 112967. [Google Scholar] [CrossRef]
  11. Suryakumar, G.; Gupta, A. Medicinal and therapeutic potential of Sea buckthorn (Hippophae rhamnoides L.). J. Ethnopharmacol. 2011, 138, 268–278. [Google Scholar] [CrossRef]
  12. Nour, V.; Panaite, T.D.; Corbu, A.R.; Ropota, M.; Turcu, R.P. Nutritional and Bioactive Compounds in Dried Sea-Buckthorn Pomace. Erwerbs-Obstbau 2021, 63, 91–98. [Google Scholar] [CrossRef]
  13. Mihalcea, L.; Turturică, M.; Cucolea, E.I.; Dănilă, G.-M.; Dumitrașcu, L.; Coman, G.; Constantin, O.E.; Grigore-Gurgu, L.; Stănciuc, N. CO2 Supercritical Fluid Extraction of Oleoresins from Sea Buckthorn Pomace: Evidence of Advanced Bioactive Profile and Selected Functionality. Antioxidants 2021, 10, 1681. [Google Scholar] [CrossRef]
  14. Zarzycki, P.; Wirkijowska, A.; Teterycz, D.; Łysakowska, P. Innovations in Wheat Bread: Using Food Industry By-Products for Better Quality and Nutrition. Appl. Sci. 2024, 14, 3976. [Google Scholar] [CrossRef]
  15. Stanciu, I.; Ungureanu, E.L.; Popa, E.E.; Geicu-Cristea, M.; Draghici, M.; Mitelut, A.C.; Mustatea, G.; Popa, M.E. The Experimental Development of Bread with Enriched Nutritional Properties Using Organic Sea Buckthorn Pomace. Appl. Sci. 2023, 13, 6513. [Google Scholar] [CrossRef]
  16. American Association of Cereal Chemists (AACC). AACC Approved Methods of Analysis, 11th ed.; American Association of Cereal Chemists: St. Paul, MN, USA, 2010. [Google Scholar]
  17. Wirkijowska, A.; Teterycz, D.; Zarzycki, P. The Impact of Nut-Based Plant Beverages on Wheat Bread Quality: A Study of Almond, Hazelnut, and Walnut Beverages. Appl. Sci. 2025, 15, 8821. [Google Scholar] [CrossRef]
  18. Felisiak, K.; Przybylska, S.; Tokarczyk, G.; Tabaszewska, M.; Słupski, J.; Wydurska, J. Effect of Chickpea (Cicer arietinum L.) Flour Incorporation on Quality, Antioxidant Properties, and Bioactive Compounds of Shortbread Cookies. Foods 2024, 13, 2356. [Google Scholar] [CrossRef]
  19. ISO 8586:2012; Sensory Analysis—General Guidelines for the Selection, Training and Monitoring of Selected Assessors and Expert Sensory Assessors. International Organization for Standardization: Geneva, Switzerland, 2012.
  20. ISO 8589:2007; Sensory Analysis—General Guidance for the Design of Test Rooms. International Organization for Standardization: Geneva, Switzerland, 2007.
  21. Lukas, B.F.; Morais, M.G.; Santos, T.D.; Costa, J.A.V. Spirulina for Snack Enrichment: Nutritional, Physical and Sensory Evaluations. LWT 2018, 90, 270–276. [Google Scholar] [CrossRef]
  22. Association of Official Analytical Chemists International (AOAC). AOAC Official Methods, 20th ed.; Association of Official Analytical Chemists International: Rockville, MD, USA, 2016. [Google Scholar]
  23. Zhou, J.; Liu, J.; Tang, X. Effects of whey and soy protein addition on bread rheological property of wheat flour. J. Texture Stud. 2018, 49, 38–46. [Google Scholar] [CrossRef]
  24. Bchir, B.; Rabetafika, H.N.; Paquot, M.; Blecker, C. Effect of Pear, Apple and Date Fibres from Cooked Fruit By-products on Dough Performance and Bread Quality. Food Bioprocess Technol. 2014, 7, 1114–1127. [Google Scholar] [CrossRef]
  25. Azadfar, E.; Rad, A.H.; Sharifi, A.; Armin, M. Effect of olive pomace fiber on the baking properties of wheat flour and flat bread (Barbari Bread) quality. J. Food Process. Preserv. 2023, 1, 1405758. [Google Scholar] [CrossRef]
  26. Tolve, R.; Simonato, B.; Rainero, G.; Bianchi, F.; Rizzi, C.; Cervini, M.; Giuberti, G. Wheat Bread Fortification by Grape Pomace Powder: Nutritional, Technological, Antioxidant, and Sensory Properties. Foods 2021, 10, 75. [Google Scholar] [CrossRef]
  27. Usman, M.; Ahmed, S.; Mehmood, A.; Bilal, M.; Patil, P.J.; Akram, K.; Farooq, U. Effect of apple pomace on nutrition, rheology of dough and cookies quality. J. Food Sci. Technol. 2020, 57, 3244–3251. [Google Scholar] [CrossRef]
  28. Roozegar, M.H.; Shahedi, M.; Keramet, J.; Hamdami, N.; Roshanak, S. Effect of Coated and Uncoated Ground Flaxseed Addition on Rheological, Physical and Sensory Properties of Taftoon Bread. J. Food Sci. Technol. 2015, 52, 5102–5110. [Google Scholar] [CrossRef] [PubMed]
  29. Codină, G.G.; Istrate, A.M.; Gontariu, I.; Mironeasa, S. Rheological Properties of Wheat–Flaxseed Composite Flours Assessed by Mixolab and Their Relation to Quality Features. Foods 2019, 8, 333. [Google Scholar] [CrossRef] [PubMed]
  30. Koneva, S.I.; Zakharova, A.S.; Meleshkina, L.E.; Egorova, E.Y.; Mashkova, I.A. Technological Properties of Dough from a Mix of Rye and Wheat Flour with Processed Sea Buckthorn. Food Process. Tech. Technol. 2023, 53, 247–258. [Google Scholar] [CrossRef]
  31. Mironeasa, S.; Mironeasa, C. Dough bread from refined wheat flour partially replaced by grape peels: Optimizing the rheological properties. J. Food Process Eng. 2019, 42, e13207. [Google Scholar] [CrossRef]
  32. Kohajdová, Z.; Karovičová, J.; Magala, M.; Kuchtová, V. Effect of apple pomace powder addition on farinographic properties of wheat dough and biscuits quality. Chem. Pap. 2014, 68, 1059–1065. [Google Scholar] [CrossRef]
  33. Wirkijowska, A.; Zarzycki, P.; Sobota, A.; Nawrocka, A.; Blicharz-Kania, A.; Andrejko, D. The possibility of using by-products from the flaxseed industry for functional bread production. LWT 2020, 118, 108860. [Google Scholar] [CrossRef]
  34. Dahdah, P.; Cabizza, R.; Farbo, M.G.; Fadda, C.; Mara, A.; Hassoun, G.; Piga, A. Improving the Rheological Properties of Dough Obtained by Partial Substitution of Wheat Flour with Freeze-Dried Olive Pomace. Foods 2024, 13, 478. [Google Scholar] [CrossRef]
  35. Kaminskytė, G.; Jagelavičiūtė, J.; Bašinskienė, L.; Syrpas, M.; Čižeikienė, D. Effect of Modification Methods on Composition and Technological Properties of Sea Buckthorn (Hippophae rhamnoides L.) Pomace. Appl. Sci. 2025, 15, 8722. [Google Scholar] [CrossRef]
  36. Xiao, Q.; Yang, L.; Guo, J.; Zhang, X.; Huang, Y.; Fu, Q. Preparation, Structural Characterization, and Hypoglycemic Activity of Dietary Fiber from Sea Buckthorn Pomace. Foods 2024, 13, 3665. [Google Scholar] [CrossRef]
  37. Wang, L.; Yan, M.; Jiang, Q.; Wang, B.; Luo, D.; Yue, C.; Guo, J.; Qiu, J.; Wang, H.; Wu, W.; et al. Effect of buckwheat bran protein enzymatic hydrolysates on the rheological, textural and structural properties of non-fermented wheat dough. Food Chem. X 2025, 27, 102501. [Google Scholar] [CrossRef] [PubMed]
  38. Zhao, Y.; Li, T.; Zhao, J.; AL-Ansi, W.; Fan, M.; Wafaa, K.A.; Qian, H.; Li, Y.; Wang, L. Effects of sea buckthorn residue protein hydrolysate on the quality of frozen pre-baked bread: Water state and gluten structures. Food Hydrocoll. 2025, 167, 111404. [Google Scholar] [CrossRef]
  39. Sudha, M.L.; Rajeswari, G.; Venkateswara Rao, G. Effect of wheat and oat brans on the dough rheological and quality characteristics of instant vermicelli. J. Texture Stud. 2012, 43, 195–202. [Google Scholar] [CrossRef]
  40. Rocha-Parra, A.F.; Belorio, M.; Ribotta, P.D.; Ferrero, C.; Gómez, M. Effect of the particle size of pear pomace on the quality of enriched layer and sponge cakes. Int. J. Food Sci. Technol. 2019, 54, 1265–1275. [Google Scholar] [CrossRef]
  41. Hussain, S.; Sharma, M.; Bhat, R. Valorisation of Sea Buckthorn Pomace by Optimization of Ultrasonic-Assisted Extraction of Soluble Dietary Fibre Using Response Surface Methodology. Foods 2021, 10, 1330. [Google Scholar] [CrossRef] [PubMed]
  42. Cacak-Pietrzak, G.; Dziki, D.; Gawlik-Dziki, U.; Parol-Nadłonek, N.; Kalisz, S.; Krajewska, A.; Stępniewska, S. Wheat Bread Enriched with Black Chokeberry (Aronia melanocarpa L.) Pomace: Physicochemical Properties and Sensory Evaluation. Appl. Sci. 2023, 13, 6936. [Google Scholar] [CrossRef]
  43. Pecyna, A.; Krzywicka, M.; Blicharz-Kania, A.; Buczaj, A.; Kobus, Z.; Zdybel, B.; Domin, M.; Siłuch, D. Impact of incorporating two types of dried raspberry pomace into gluten-free bread on its nutritional and antioxidant characteristics. Appl. Sci. 2024, 14, 1561. [Google Scholar] [CrossRef]
  44. Schleißinger, M.; Meyer, A.L.; Afsar, N.; Nagy, Á.G.; Dieker, V.; Schmitt, J.J. Research Article Impact of Dietary Fibers on Moisture and Crumb Firmness of Brown Bread. Adv. J. Food Sci. Technol. 2013, 5, 1281–1284. [Google Scholar] [CrossRef]
  45. Sardabi, F.; Azizi, M.H.; Gavlighi, H.A.; Rashidinejad, A. The effect of Moringa peregrina seed husk on the in vitro starch digestibility, microstructure, and quality of white wheat bread. LWT 2021, 136, 110332. [Google Scholar] [CrossRef]
  46. Ghendov-Mosanu, A.; Cristea, E.; Patras, A.; Sturza, R.; Padureanu, S.; Deseatnicova, O.; Turculet, N.; Boestean, O.; Niculaua, M. Potential Application of Hippophae rhamnoides in Wheat Bread Production. Molecules 2020, 25, 1272. [Google Scholar] [CrossRef] [PubMed]
  47. Nilova, L.; Malyutenkova, S. The possibility of using powdered sea-buckthorn in the development of bakery products with antioxidant properties. Agron. Res. 2018, 16, 1444–1456. [Google Scholar] [CrossRef]
  48. Wiedemair, V.; Gruber, K.; Knöpfle, N.; Bach, K.E. Technological Changes in Wheat-Based Breads Enriched with Hemp Seed Press Cakes and Hemp Seed Grit. Molecules 2022, 27, 1840. [Google Scholar] [CrossRef]
  49. Jiang, X.; Wang, X.; Zhou, S. Effect of flaxseed marc flour on high-yield wheat bread production: Comparison in baking, staling, antioxidant and digestion properties. LWT 2022, 169, 113979. [Google Scholar] [CrossRef]
  50. Almoumen, A.; Mohamed, H.; Sobti, B.; Ayyash, M.; Kamleh, R.; Al-Marzouqi, A.H.; Kamal-Eldin, A. Quality of bread rolls fortified with date fruit pomace: Structure, proximate composition, staling, and sensory evaluation. NFS J. 2025, 38, 100214. [Google Scholar] [CrossRef]
  51. Wang, C.C.; Yang, Z.; Xing, J.J.; Guo, X.N.; Zhu, K.X. Effects and underlying mechanisms of insoluble dietary fiber and ferulic acid on the crumb structure of steamed bread. Food Hydrocoll. 2022, 125, 107448. [Google Scholar] [CrossRef]
  52. Zhou, Y.; Dhital, S.; Zhao, C.; Ye, F.; Chen, J.; Zhao, G. Dietary fiber-gluten protein interaction in wheat flour dough: Analysis, consequences and proposed mechanisms. Food Hydrocoll. 2021, 111, 106203. [Google Scholar] [CrossRef]
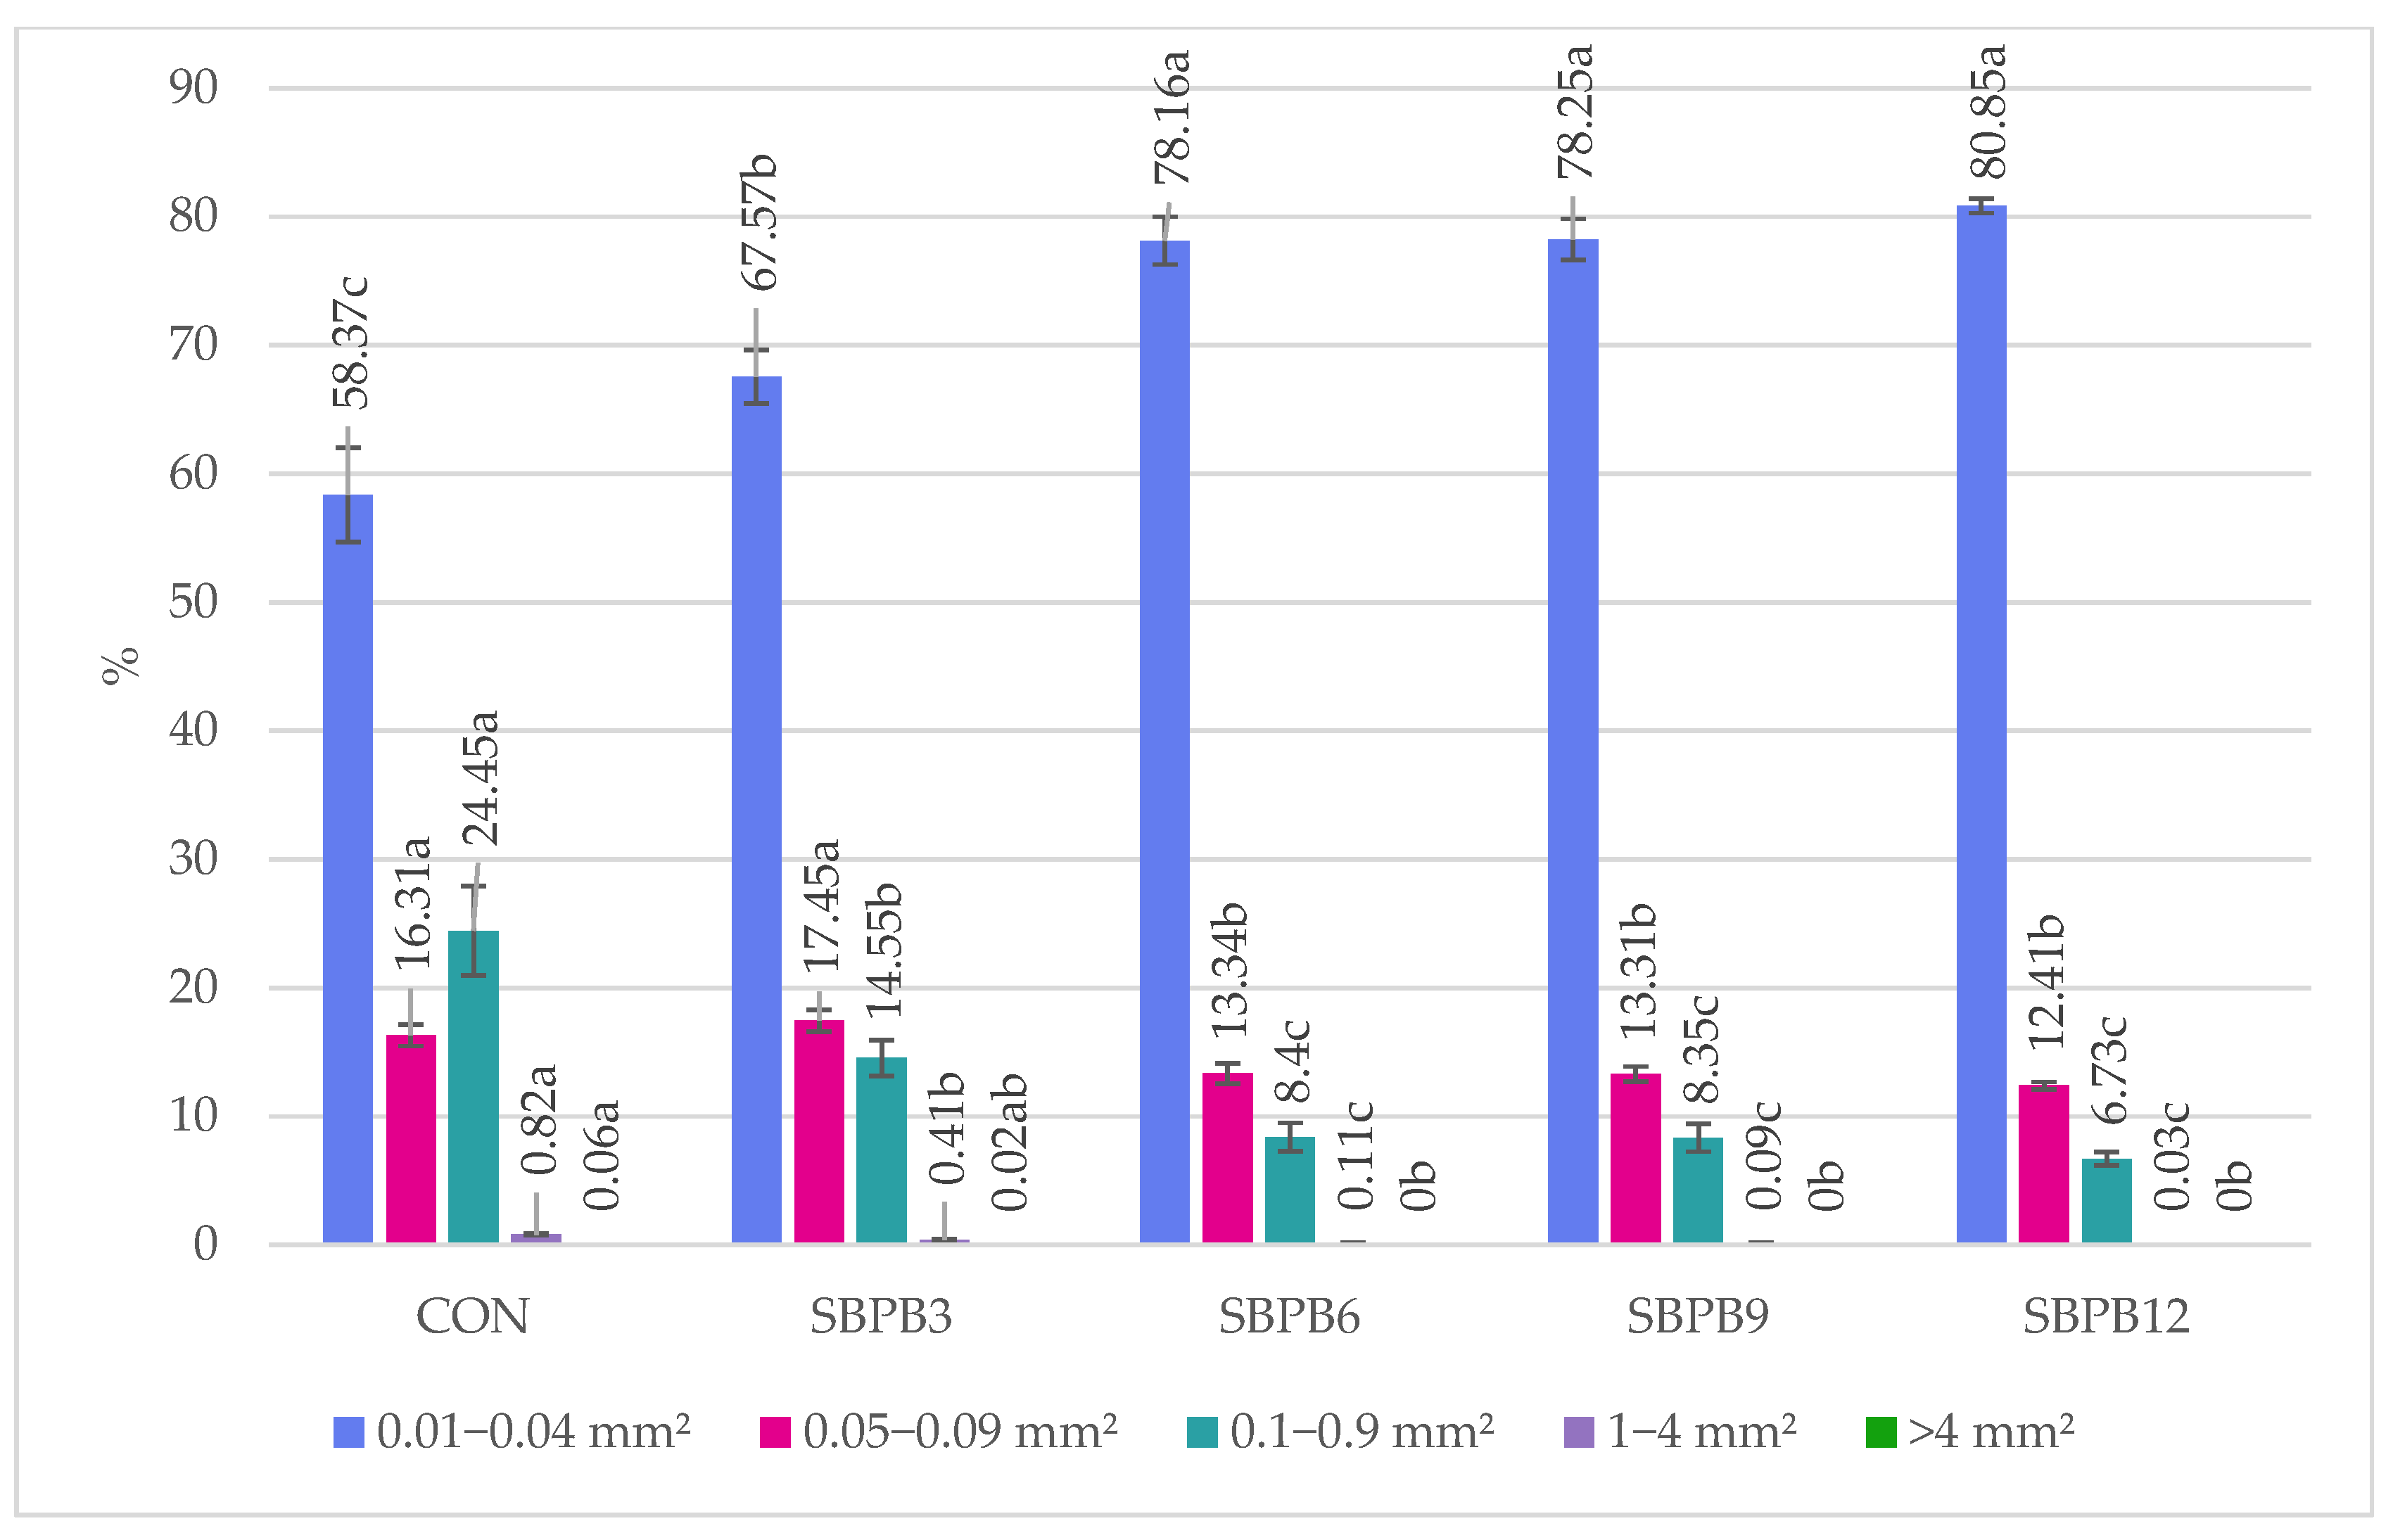
Figure 1. Percentage distribution of crumb pores by number within defined size ranges. Different lowercase letters above the bars indicate statistically significant differences between samples (Tukey’s test, p ≤ 0.05). CON—control bread; SBPB3, SBPB6, SBPB9, and SBPB12—bread containing 3%, 6%, 9%, and 12% sea buckthorn pomace.
Applsci 15 12319 g001
Figure 2. Percentage distribution of crumb pores by surface area across defined size ranges. Different lowercase letters above the bars indicate statistically significant differences between samples (Tukey’s test, p ≤ 0.05). CON—control bread; SBPB3, SBPB6, SBPB9, and SBPB12—bread containing 3%, 6%, 9%, and 12% sea buckthorn pomace.
Applsci 15 12319 g002
Figure 3. Sensory evaluation of bread containing increasing levels (3–12%) of sea buckthorn pomace (SBPB3–SBPB12). CON—control bread; SBPB3, SBPB6, SBPB9, and SBPB12—bread containing 3%, 6%, 9%, and 12% sea buckthorn pomace.
Applsci 15 12319 g003
Figure 4. Surface and cross-sections of wheat breads containing increasing levels (3–12%) of sea buckthorn pomace (SBPB3–SBPB12). CON—control bread; SBPB3, SBPB6, SBPB9, and SBPB12—bread containing 3%, 6%, 9%, and 12% sea buckthorn pomace.
Applsci 15 12319 g004
Table 1. Farinograph characteristics of wheat dough containing increasing levels (0–12%) of sea buckthorn pomace, based on flour weight.
SampleWA [%]DDT [min]ST [min]DS [FU]FQN
CON59.9 ± 1.2 d6.0 ± 0.1 b12.3 ± 0.4 a45.3 ± 1.2 d137.1 ± 3.2 a
SBPB361.6 ± 1.1 dc6.5 ± 0.1 b10.3 ± 0.3 b52.2 ± 1.7 c126.2 ± 4.7 a
SBPB664.5 ± 2.1 cb7.6 ± 0.3 a6.2 ± 0.1 c62.2 ± 1.7 b109.9 ± 3.7 b
SBPB966.5 ± 1.5 ba7.4 ± 0.3 a5.5 ± 0.2 d70.4 ± 2.6 a103.8 ± 4.9 b
SBPB1268.9 ± 1.8 a7.5 ± 0.4 a5.9 ± 0.2 dc66.5 ± 2.7 ba108.0 ± 5.9 b
CON—control dough (100% wheat flour); SBPB3, SBPB6, SBPB9, and SBPB12—doughs containing 3%, 6%, 9%, and 12% sea buckthorn pomace, respectively (based on flour weight); mean values (n = 3) ± SD; different lowercase letters (a–d) within a column indicate statistically significant differences (Tukey’s test, p ≤ 0.05); WA—water absorption; DDT—dough development time; ST—stability time; DS—dough softening; FQN—Farinograph Quality Number.
Table 2. Proximate composition of wheat flour, sea buckthorn pomace, and breads containing increasing levels (3–12%) of pomace addition, based on flour weight (SBPB3–SBPB12).
SampleRaw Materials and Bread Compositions [% d.b.]
AshProteinFatTDFIDFSDFCHOEnergy
[kcal/100 g]
Raw materials
  WF0.72 ± 0.02 b13.3 ± 0.4 b0.49 ± 0.02 b5.38 ± 0.14 b2.45 ± 0.07 b2.97 ± 0.07 b80.1 ± 0.6 a340.3 ± 0.2 a
  SBP1.89 ± 0.06 a24.2 ± 0.7 a14.8 ± 0.6 a55.8 ± 1.4 a44.5 ± 1.0 a11.3 ± 0.3 a3.3 ± 2.8 b319.8 ± 0.4 b
Bread
  CON2.29 ± 0.05 b13.5 ± 0.4 b0.51 ± 0.02 e5.4 ± 0.2 e2.4 ± 0.1 e2.99 ± 0.07 c78.2 ± 0.6 a229.6 ± 0.3 e
  SBPB32.33 ± 0.06 b13.6 ± 0.3 b1.05 ± 0.02 d7.2 ± 0.2 d3.8 ± 0.1 d3.43 ± 0.12 b75.8 ± 0.5 b223.7 ± 0.3 d
  SBPB62.38 ± 0.07 ba14.2 ± 0.4 b1.26 ± 0.04 c8.5 ± 0.2 c5.0 ± 0.1 c3.47 ± 0.13 b73.7 ± 0.8 c222.3 ± 0.3 c
  SBPB92.45 ± 0.06 ba16.4 ± 0.4 a1.78 ± 0.05 b10.4 ± 0.3 b6.6 ± 0.1 b3.85 ± 0.13 a69.0 ± 0.8 d219.2 ± 0.3 b
  SBPB122.51 ± 0.06 a16.8 ± 0.4 a2.13 ± 0.06 a11.6 ± 0.4 a7.4 ± 0.2 a4.11 ± 0.13 a67.0 ± 0.8 e216.8 ± 0.4 a
CON—control bread (100% wheat flour); SBPB3, SBPB6, SBPB9, and SBPB12—bread containing 3%, 6%, 9%, and 12% sea buckthorn pomace, respectively (based on flour weight); WF—wheat flour type 750; SBP—sea buckthorn pomace; TDF—total dietary fiber; IDF—insoluble dietary fiber; SDF—soluble dietary fiber; CHO—carbohydrates; mean values; mean values (n = 3) ± SD; different lowercase letters (a–e) within a column indicate statistically significant differences (Tukey’s test, p ≤ 0.05).
Table 3. Physical properties of bread containing increasing levels (3–12%) of sea buckthorn pomace (SBPB3–SBPB12).
SampleBread Yield [%]Baking Loss [%]Specific Volume [cm3 g−1]Crumb Moisture After 24 h [%]Crumb Moisture After 72 h [%]
CON136.3 ± 0.2 e10.8 ± 0.1 a3.45 ± 0.08 a40.0 ± 0.9 b38.5 ± 0.9 b
SBPB3140.5 ± 0.5 d10.6 ± 0.3 ba3.49 ± 0.11 a41.4 ± 0.1 a40.0 ± 0.1 ab
SBPB6147.1 ± 1.4 c10.4 ± 0.5 ba2.86 ± 0.06 b41.5 ± 0.2 a40.0 ± 0.3 ab
SBPB9152.5 ± 1.0 b10.2 ± 0.2 ba2.69 ± 0.10 cb42.0 ± 0.3 a40.8 ± 0.4 a
SBPB12157.3 ± 0.7 a9.9 ± 0.5 b2.42 ± 0.12 c42.6 ± 0.5 a41.1 ± 0.7 a
CON—control bread (100% wheat flour); SBPB3, SBPB6, SBPB9, and SBPB12—bread containing 3%, 6%, 9%, and 12% sea buckthorn pomace, respectively (based on flour weight); mean values (n = 6) ± SD; different lowercase letters (a–e) within a column indicate statistically significant differences (Tukey’s test, p ≤ 0.05).
Table 4. Texture profile analysis (TPA) of bread containing increasing levels (3–12%) of sea buckthorn pomace (SBPB3–SBPB12).
SampleHardness [N]Cohesiveness [-]Chewiness [N]Springiness [-]
24 h72 h24 h72 h24 h72 h24 h72 h
CON3.8 ± 0.3 dB7.1 ± 0.8 eA0.66 ± 0.04 aA0.46 ± 0.06 aB2.5 ± 0.2 dA3.0 ± 0.3 cA0.97 ± 0.02 aA0.94 ± 0.02 aA
SBPB36.8 ± 0.5 cB10.7 ± 1.9 dA0.58 ± 0.04 bA0.44 ± 0.04 aB3.5 ± 0.4 cA4.2 ± 1.2 bcA0.89 ± 0.05 bA0.88 ± 0.05 baA
SBPB68.4 ± 0.5 bB14.5 ± 0.7 cA0.58 ± 0.04 bA0.36 ± 0.01 bB4.3 ± 0.6 bA4.4 ± 0.4 bA0.88 ± 0.08 bA0.84 ± 0.05 cbA
SBPB98.8 ± 0.8 bB17.2 ± 1.1 bA0.58 ± 0.02 bA0.35 ± 0.03 bB4.4 ± 0.4 bA5.0 ± 0.4 bA0.88 ± 0.03 bA0.83 ± 0.06 cbA
SBPB1212.4 ± 0.7 aB25.8 ± 2.1 aA0.54 ± 0.03 bA0.34 ± 0.02 bB5.7 ± 0.5 aA6.7 ± 1.0 aA0.85 ± 0.03 bA0.77 ± 0.05 cB
CON—control bread (100% wheat flour); SBPB3, SBPB6, SBPB9, and SBPB12—bread containing 3%, 6%, 9%, and 12% sea buckthorn pomace, respectively (based on flour weight); mean values (n = 8) ± SD; different lowercase letters (a–e) within a column and uppercase letters (A–B) within a row indicate statistically significant differences (Tukey’s test, p ≤ 0.05).
Table 5. Crumb color of bread containing increasing levels (3–12%) of sea buckthorn pomace (SBPB3–SBPB12).
SampleL*a*b*∆E*WIBIYI
Raw materials
  WF87.3 ± 0.20.8 ± 0.111.1 ± 0.1-83.1 ± 0.314.0 ± 0.318.2 ± 0.3
  SBP46.4 ± 0.023.6 ± 0.443.7 ± 0.1-26.9 ± 0.2218 ± 1.8134.5 ± 0.5
Bread
  CON62.4 ± 2.9 a0.7 ± 0.2 ba11.6 ± 1.2 ba-60.6 ± 2.5 a20.8 ± 1.7 cb26.4 ± 1.9 cb
  SBPB361.4 ± 2.9 a0.5 ± 0.3 b11.1 ± 1.0 b2.8 ± 1.4 b59.8 ± 2.8 a20.1 ± 2.7 cb25.9 ± 2.9 cb
  SBPB659.5 ± 3.0 a0.4 ± 0.1 b9.8 ± 0.7 c3.8 ± 2.6 ba58.3 ± 2.9 a18.1 ± 1.5 c23.5 ± 1.8 c
  SBPB954.1 ± 2.1 b0.4 ± 0.5 b10.5 ± 0.8 bc8.4 ± 2.1 a52.8 ± 2.2 b21.9 ± 3.2 b27.9 ± 2.9 b
  SBPB1253.5 ± 2.5 b0.9 ± 0.4 a12.4 ± 0.9 a9.0 ± 2.5 a51.8 ± 2.6 b27.3 ± 3.3 a33.3 ± 3.4 a
CON—control bread (100% wheat flour); SBPB3, SBPB6, SBPB9, and SBPB12—bread containing 3%, 6%, 9%, and 12% sea buckthorn pomace, respectively (based on flour weight); WF—wheat flour type 750; SBP—sea buckthorn pomace; mean values (n = 12) ± SD; different lowercase letters (a–c) within a column indicate statistically significant differences (Tukey’s test, p ≤ 0.05); ∆E*—total color difference; WI—whiteness index; BI—browning index; YI—yellowness index.
Disclaimer/Publisher’s Note: The statements, opinions and data contained in all publications are solely those of the individual author(s) and contributor(s) and not of MDPI and/or the editor(s). MDPI and/or the editor(s) disclaim responsibility for any injury to people or property resulting from any ideas, methods, instructions or products referred to in the content.