1. Introduction
Air pollution in urban basins is one of the most pressing environmental challenges due to frequent thermal inversions and complex airflow patterns. In recent years, hybrid modeling approaches combining physics-based and data-driven methods have emerged as powerful tools to bridge the gap between physical interpretability and predictive performance.
In this study, we integrate high-resolution Navier–Stokes simulations with data-driven machine-learning techniques to capture the coupled dynamics of surface wind fields and pollutant concentrations over the complex topography of Almaty, leveraging the demonstrated efficacy of ML for urban pollution modeling and the critical influence of meteorological variables on pollutant dispersion [
1,
2]. To address these challenges, we adopt a physics-informed deep-learning framework that embeds advection–diffusion dynamics within the Navier–Stokes solver, thereby enhancing fine-scale
prediction accuracy and providing calibrated uncertainty estimates [
3]. Training leverages both high-resolution CFD outputs and in situ sensor observations, which enables the model to generalize beyond the training domain, unlike standard ML approaches [
4,
5]. This approach leverages the demonstrated capability of physics-informed neural networks to resolve inverse advection–diffusion problems, thereby improving source attribution and forecast reliability [
6]. Our results align with recent low-cost sensor studies where physics-informed deep-learning models attained sub-3 µg m
3 RMSE for
,
and
, underscoring the robustness of the combined CFD-ML paradigm [
7].
Moreover, the hybrid framework scales to operational city-wide forecasting by leveraging automated ML pipelines that have demonstrated superior performance over conventional numerical air-quality models in diverse urban environments [
8]. The climate-invariant machine-learning paradigm, which embeds physical process knowledge directly into model architecture, further confirms that such hybrid systems retain high predictive skill across disparate climatic regimes, reinforcing the scalability of our Navier–Stokes–ML framework for broader regional deployment [
9]. Integrating physical models with data-driven approaches enhances prediction accuracy for air pollution dynamics. Recent studies demonstrated that ensemble learning frameworks significantly outperform standalone models for urban air quality forecasting. In particular, [
10] proposed an STL–XGBoost–LightGBM ensemble achieving
R2 > 0.98 for PM2.5 prediction in Almaty, highlighting the effectiveness of hybrid ML frameworks in complex meteorological conditions.
Future extensions will incorporate adaptive mesh refinement within the Navier–Stokes core to further reduce computational overhead while preserving the physics-guided learning fidelity demonstrated in recent fluid dynamics studies [
11].
The proposed framework thus exemplifies the emerging paradigm of physics-guided machine learning, which has been shown to improve model generalizability and reduce reliance on extensive training datasets in fluid mechanics applications [
11,
12]. Consequently, the integration of physics-guided neural architectures within the Navier–Stokes solver is expected to further mitigate overfitting and enhance extrapolative performance across heterogeneous atmospheric regimes [
11]. In forthcoming work, we will explore end-to-end differentiable coupling of the Navier–Stokes core with a black-box PDE correction network to further accelerate adaptive mesh optimization and reduce reliance on coarse-grid simulations [
13].
Recent advances in physics-informed neural networks, including RANS-PINN surrogates for turbulent flow and physics-guided machine-learning frameworks, have demonstrated enhanced generalizability and reduced bias in forecasting atmospheric variables such as NOₓ concentrations [
3,
11,
14]. Such PINN-based surrogates have successfully solved Reynolds-averaged Navier–Stokes equations for turbulent flows, demonstrating their potential for accurate urban pollutant forecasting [
14,
15].
Empirical evaluations demonstrate that the PINN-RANS hybrid achieves lower reconstruction error than conventional RANS solvers, confirming its superiority for urban-scale applications [
16]. Furthermore, recent AI-enhanced CFD studies have shown that neural-network surrogates can markedly reduce computational cost while preserving flow fidelity, supporting the scalability of PINN-RANS approaches [
17,
18]. Moreover, embedding climate-invariant constraints within the PINN-RANS surrogate further enhances its data efficiency and generalization across varying climatic conditions [
9].
Recent assessments of neural-network-augmented RANS turbulence models reveal that these hybrids maintain high fidelity when extrapolating to flow regimes beyond the training set, and machine-learning-accelerated CFD frameworks further boost computational efficiency without sacrificing accuracy [
19,
20]. These observations corroborate recent reviews that underscore the rapid evolution of PINN architectures and their proven robustness in tackling complex fluid mechanics challenges [
21,
22,
23].
Future work will explore soft-constraint turbulent-viscosity formulations within the PINN framework to further improve accuracy while preserving the data efficiency demonstrated in recent engineering turbulence studies [
24]. Building on these findings, we will evaluate PINN-based large-eddy-simulation closures to further reduce near-wall errors in urban airflow modeling [
25]. Preliminary tests indicate that the PINN-LES approach can attain low prediction errors even with a markedly reduced training set, echoing findings that physics-informed surrogates achieve high accuracy with as few as six data points [
26]. Consequently, leveraging PINN-based surrogates promises robust urban-scale forecasts even when only a handful of high-quality observations are available, as the physics-constrained training regime markedly reduces data dependency [
27]. Collectively, these investigations confirm that physics-informed neural networks can deliver high-fidelity turbulence and pollutant transport predictions with only a few training samples, thereby substantiating the viability of our data-lean framework [
28,
29,
30,
31].
Moreover, multi-fidelity data-driven PINNs have demonstrated consistent predictive accuracy across varying Reynolds numbers without the need for retraining, highlighting the scalability of our data-lean framework [
32]. Recent studies have shown that tensor-basis neural network turbulence models retain physical interpretability while enhancing flow predictions and that physics-informed loss functions enable reliable extrapolation to unseen scenarios without additional data, thereby reinforcing the data-lean scalability of our approach [
33,
34]. Furthermore, targeted data-normalization preprocessing has been shown to markedly boost PINN prediction accuracy even when training data are scarce, highlighting the importance of preprocessing for data-lean urban flow models [
34]. Addressing these challenges, recent work emphasizes ill-conditioning mitigation, temporal causality enforcement, and hybridization with classical solvers to further enhance PINN robustness for turbulent urban airflow [
27,
35,
36].
Recent studies have emphasized the importance of integrating physically grounded CFD models with data-driven approaches in order to capture the complex meteorological and environmental dynamics of Central Asian cities. Authors [
37] applied a three-dimensional Navier–Stokes-based model to Almaty and demonstrated significant spatial heterogeneity of airflow and pollutant stratification, with wind velocities ranging from 0.31 to 5.76 m/s and pollutant concentrations exceeding 100 μg/m
3 in the urban core. Their results highlighted the critical role of urban heat islands and inversion layers in shaping pollution hotspots.
While numerous studies address urban pollution using either computational fluid dynamics or statistical models, few combine physical coherence with operational forecast capability. Existing hybrid attempts often focus on coastal or flat-terrain cities, leaving mountain–valley environments underexplored. This gap motivates our study.
Complementarily, article [
38] developed an integrated forecasting framework combining Navier–Stokes atmospheric modeling with empirical soil data, showing that ecosystem state dynamics are highly sensitive to meteorological drivers such as seasonal temperature and wind variability. Their model achieved
R2 = 0.85 in predicting soil condition evolution, underscoring the value of hybrid approaches for environmental monitoring and sustainable land-use management.
Together, these findings confirm that coupling physical atmospheric models with statistical or AI-based analysis enhances both spatial resolution and predictive reliability, which is essential for regions like Almaty with strong seasonal variability and complex orography.
The aim of the article is to develop and validate a hybrid approach for diagnostics and short-/medium-term forecasting of surface atmospheric circulation and air quality in Almaty based on a physical model of the surface boundary layer and machine-learning methods for post-processing of meteorological fields and pollutant forecasting.
The proposed hybrid framework is not limited to Almaty but can serve as a prototype for developing early-warning and urban-planning systems in other mountain–valley cities such as Bishkek, Tbilisi, or Santiago. The integration of physics-based equations with machine-learning adaptation ensures interpretability and scalability, offering a bridge between computational fluid dynamics and real-time decision support. This makes the study valuable not only for atmospheric scientists but also for urban planners, data scientists, and environmental authorities seeking effective tools for pollution risk mitigation.
Recent developments in physics-informed and hybrid modeling have underscored the importance of reproducibility and transparency in environmental simulations. Studies such as [
21,
36] emphasize the need for integrating model explainability and open benchmarking when combining CFD and data-driven approaches. In this context, our research contributes to the ongoing discourse on reproducible hybrid modeling by providing a physically grounded yet computationally efficient workflow for urban-scale air-quality forecasting. Furthermore, the study builds upon recent datasets and methodologies developed in 2023–2025, ensuring alignment with the current state of the field.
The central research question guiding this study is how to achieve an optimal balance between physical consistency and statistical accuracy in short-term air-quality forecasting for a mountain–valley city such as Almaty. Addressing this question requires integrating physics-based Navier–Stokes formulations with adaptive machine-learning algorithms that can correct and generalize local meteorological patterns. By answering this question, the study advances the field of hybrid environmental modeling and provides an operationally feasible approach for urban-scale atmospheric diagnostics.
The originality of this research lies in bridging the long-standing methodological gap between computationally demanding physical models and purely statistical or machine-learning approaches that lack physical interpretability. The proposed hybrid framework is among the first to operationalize physics-informed modeling for complex mountain–valley urban environments characterized by frequent thermal inversions. This contribution aligns with the emerging paradigm of physics-guided artificial intelligence in atmospheric and environmental sciences, offering both theoretical advancement and practical utility.
Similar air-quality challenges have been documented in other mountain–valley cities such as Santiago de Chile, Mexico City, and Kathmandu, where frequent thermal inversions and stagnant air masses exacerbate pollution episodes. These urban basins share key features with Almaty—complex topography, high population density, and strong seasonal contrasts—which makes them suitable analogs for testing and extending hybrid physics–ML approaches. Including these contexts underscores the global relevance of the proposed framework and its potential adaptability to diverse climatic and geographical conditions.
This research builds upon recent developments in physics-informed and hybrid modeling that emphasize explainability and reproducibility. By combining Navier–Stokes-based formulations with adaptive ML post-processing, the study contributes to the emerging paradigm of physics-guided artificial intelligence in environmental sciences. The proposed framework advances the understanding of urban boundary-layer processes and provides a transferable, operational tool for data-driven air-quality management.
2. Materials and Methods
2.1. Study Area
Location: Almaty city, southeastern Kazakhstan, situated at the northern foothills of the Trans-Ili Alatau range (approx. 43.24–43.45° N, 76.75–77.10° E; elevation 650–1000 m a.s.l.). The urban core lies on a gently sloping piedmont plain that descends northward from the mountains.
Climate and meteorology: Mid-latitude continental climate with cold winters and hot summers. Complex orography drives local circulations: daytime upslope/valley breezes from the north toward the mountains and nighttime downslope/katabatic flows from the south. Thermal inversions are frequent in the cold season, promoting pollutant accumulation.
Emission context: Mixed sources dominated by urban traffic corridors, residential heating (seasonal), and dispersed small industrial activities. Topographic confinement and inversion-prone conditions often lead to elevated PM levels during winter.
Monitoring and data: Meteorological and air quality observations are drawn from the Almaty urban area for 2024 (January–December), complemented by monthly datasets and a station network representative of central and peri-urban conditions. Wind speed/direction, temperature, and derived diagnostics (e.g., wind rose) are used to interpret dispersion regimes.
Relevance: The juxtaposition of dense urban emissions with complex terrain and frequent inversions makes Almaty a representative case for studying boundary-layer dynamics, pollutant accumulation, and data-driven air quality prediction in mountain-adjacent cities.
2.2. Problem Statement
The urbanized Almaty Basin is considered, for which it is necessary to diagnose and predict the surface fields of wind speed , pressure , potential temperature , and passive admixture concentration . The domain is , , , and the time interval is . Observations are represented by a discrete time series at posts , , including temperature, wind speed, and direction, and a number of chemical components.
2.3. Mathematical Model
For clarity, the following equations summarize the core physical relationships forming the basis of the hybrid model; readers primarily interested in the applied aspects may proceed directly to
Section 3 for numerical results and model validation.
The Boussinesq formalism for weakly compressible flow with lift from stratification is used. For convenience, the presentation is given for a single pollutant; generalization to the vector is trivial.
Equation of momentum
:
where
is the reference density,
is the dynamic pressure,
is the molecular viscosity of air,
is the turbulent viscosity (effective),
is the acceleration due to gravity,
is the thermal expansion coefficient,
is the vertical unit vector,
is the Coriolis vector,
is the parameterization term for urban momentum losses (taking into account the resistance of buildings on average).
Energy equation
(potential temperature):
where
is the molecular thermal conductivity,
is the turbulent heat diffusion,
are sources/sinks (radiation, anthropogenic heat, phase effects in the form of an effective source).
The transport equation for impurity
:
where
is the molecular diffusion,
is the turbulent diffusion of the impurity,
is the total source (transport, industry, etc., averaged), and
is the effective loss rate (sedimentation, removal by precipitation, chemical transformation in the first approximation).
The turbulent coefficients are parameterized through the
-closure scheme with the
MO (Monin–Obukhov) theory:
where
is the turbulent Prandtl number and
is the turbulent Schmidt number. For
in the surface layer:
where
is the von Karman constant,
is the friction velocity,
is the Monin–Obukhov length, and φ_m is the stability function defined by standard forms for stable/unstable stratification.
Boundary conditions on the underlying surface
:
where
is the heat flux density,
is the impurity flux (effective emission).
At the upper boundary
, radiation or conditional Neumann conditions are used to eliminate reflections:
At the lateral boundaries of
, either periodic conditions or zero gradient conditions are applied, or reanalysis data are introduced:
We initiate the fields , , , consistent with observations and/or a stationary run.
2.4. Solution Method
Spatial discretization is performed using finite differences/volumes on a rectangular grid (). For a stratified boundary layer, z-spacing is allowed. The time step ∆t is chosen based on stability conditions ( for advection).
We use the Khrennik–Kim–Moffatt projection method to ensure incompressibility. At step
:
Pressure as a solution to Poisson’s equation:
Updating scalars with a diffusion-stable semi-implicit/Crank–Nicolson scheme:
where
, and similarly for
:
Advection is implemented using a second-order TVD scheme (or QUICK) to suppress numerical dispersion. Boundary conditions are implemented through ghost nodes, and surface fluxes are implemented through a logarithmic profile and MO theory, which affects and at the first cell. Convergence at each step is ensured by solving linear systems with preconditioning (e.g., multigrid methods for (11)).
To compare with real observations, a low-amplitude nudging is performed by adding a weak relaxation term to (10):
where
is the indicator function of the observation post vicinity, and αu is a small coefficient.
For the physical block, parameters typical for Almaty are used: roughness ≈ 0.7–1.0 m (urban environment), computational layer height ≈ 400–600 m, background friction number ≈ 0.85–1.0, ≈ 0.7–1.0. Pollution sources are defined as effective, calibrated by observed means, and is the effective removal coefficient for the precipitation/atmospheric conditions, estimated by regression.
2.5. Using Machine Learning
The ML problem is formulated as a multi-objective regression forecast over a horizon of hours for wind speed, temperature, and suspended matter concentrations. Input features include current and lagged values of meteorological variables and concentrations, cyclical time features (hour of day, day of week, month), sines/cosines of wind direction, a categorical post feature, and atmospheric phenomenon indicators. The baseline model is gradient boosting (LightGBM) with early stopping, split into train/test time (sliding window, final split—last 20% of time). Quality metrics include RMSE, MAE, and R2. Feature importance and SHAP values are used for interpretation.
Training demonstrated stable convergence, and validation revealed a significant contribution of cyclical time features and current wind conditions to the concentration forecast. For wind direction, a sin/cos projection onto a plane was used, eliminating artificial discontinuities at 360°/0°.
To assess robustness, we conducted five-fold time-series cross-validation. The variance of RMSE across folds did not exceed 0.003 mg/m3 for PM and 0.4 °C for temperature, indicating stability of the model against sampling fluctuations.
To ensure reproducibility, all experiments were conducted with fixed random seeds and cross-validated on temporally disjoint folds. Model training and evaluation adhered to the reproducible research principles recommended by Earth and Space Science. Statistical robustness was confirmed using Student’s t-test and the Kolmogorov–Smirnov test at the 95% confidence level to compare residual distributions between training and validation sets. Additionally, the variance inflation factor (VIF) analysis verified that multicollinearity among predictors remained below the critical threshold (VIF < 5). The entire pipeline was implemented in Python 3.8 (scikit-learn 1.4, LightGBM 4.3), enabling reproducible execution and hyperparameter transparency.
3. Results
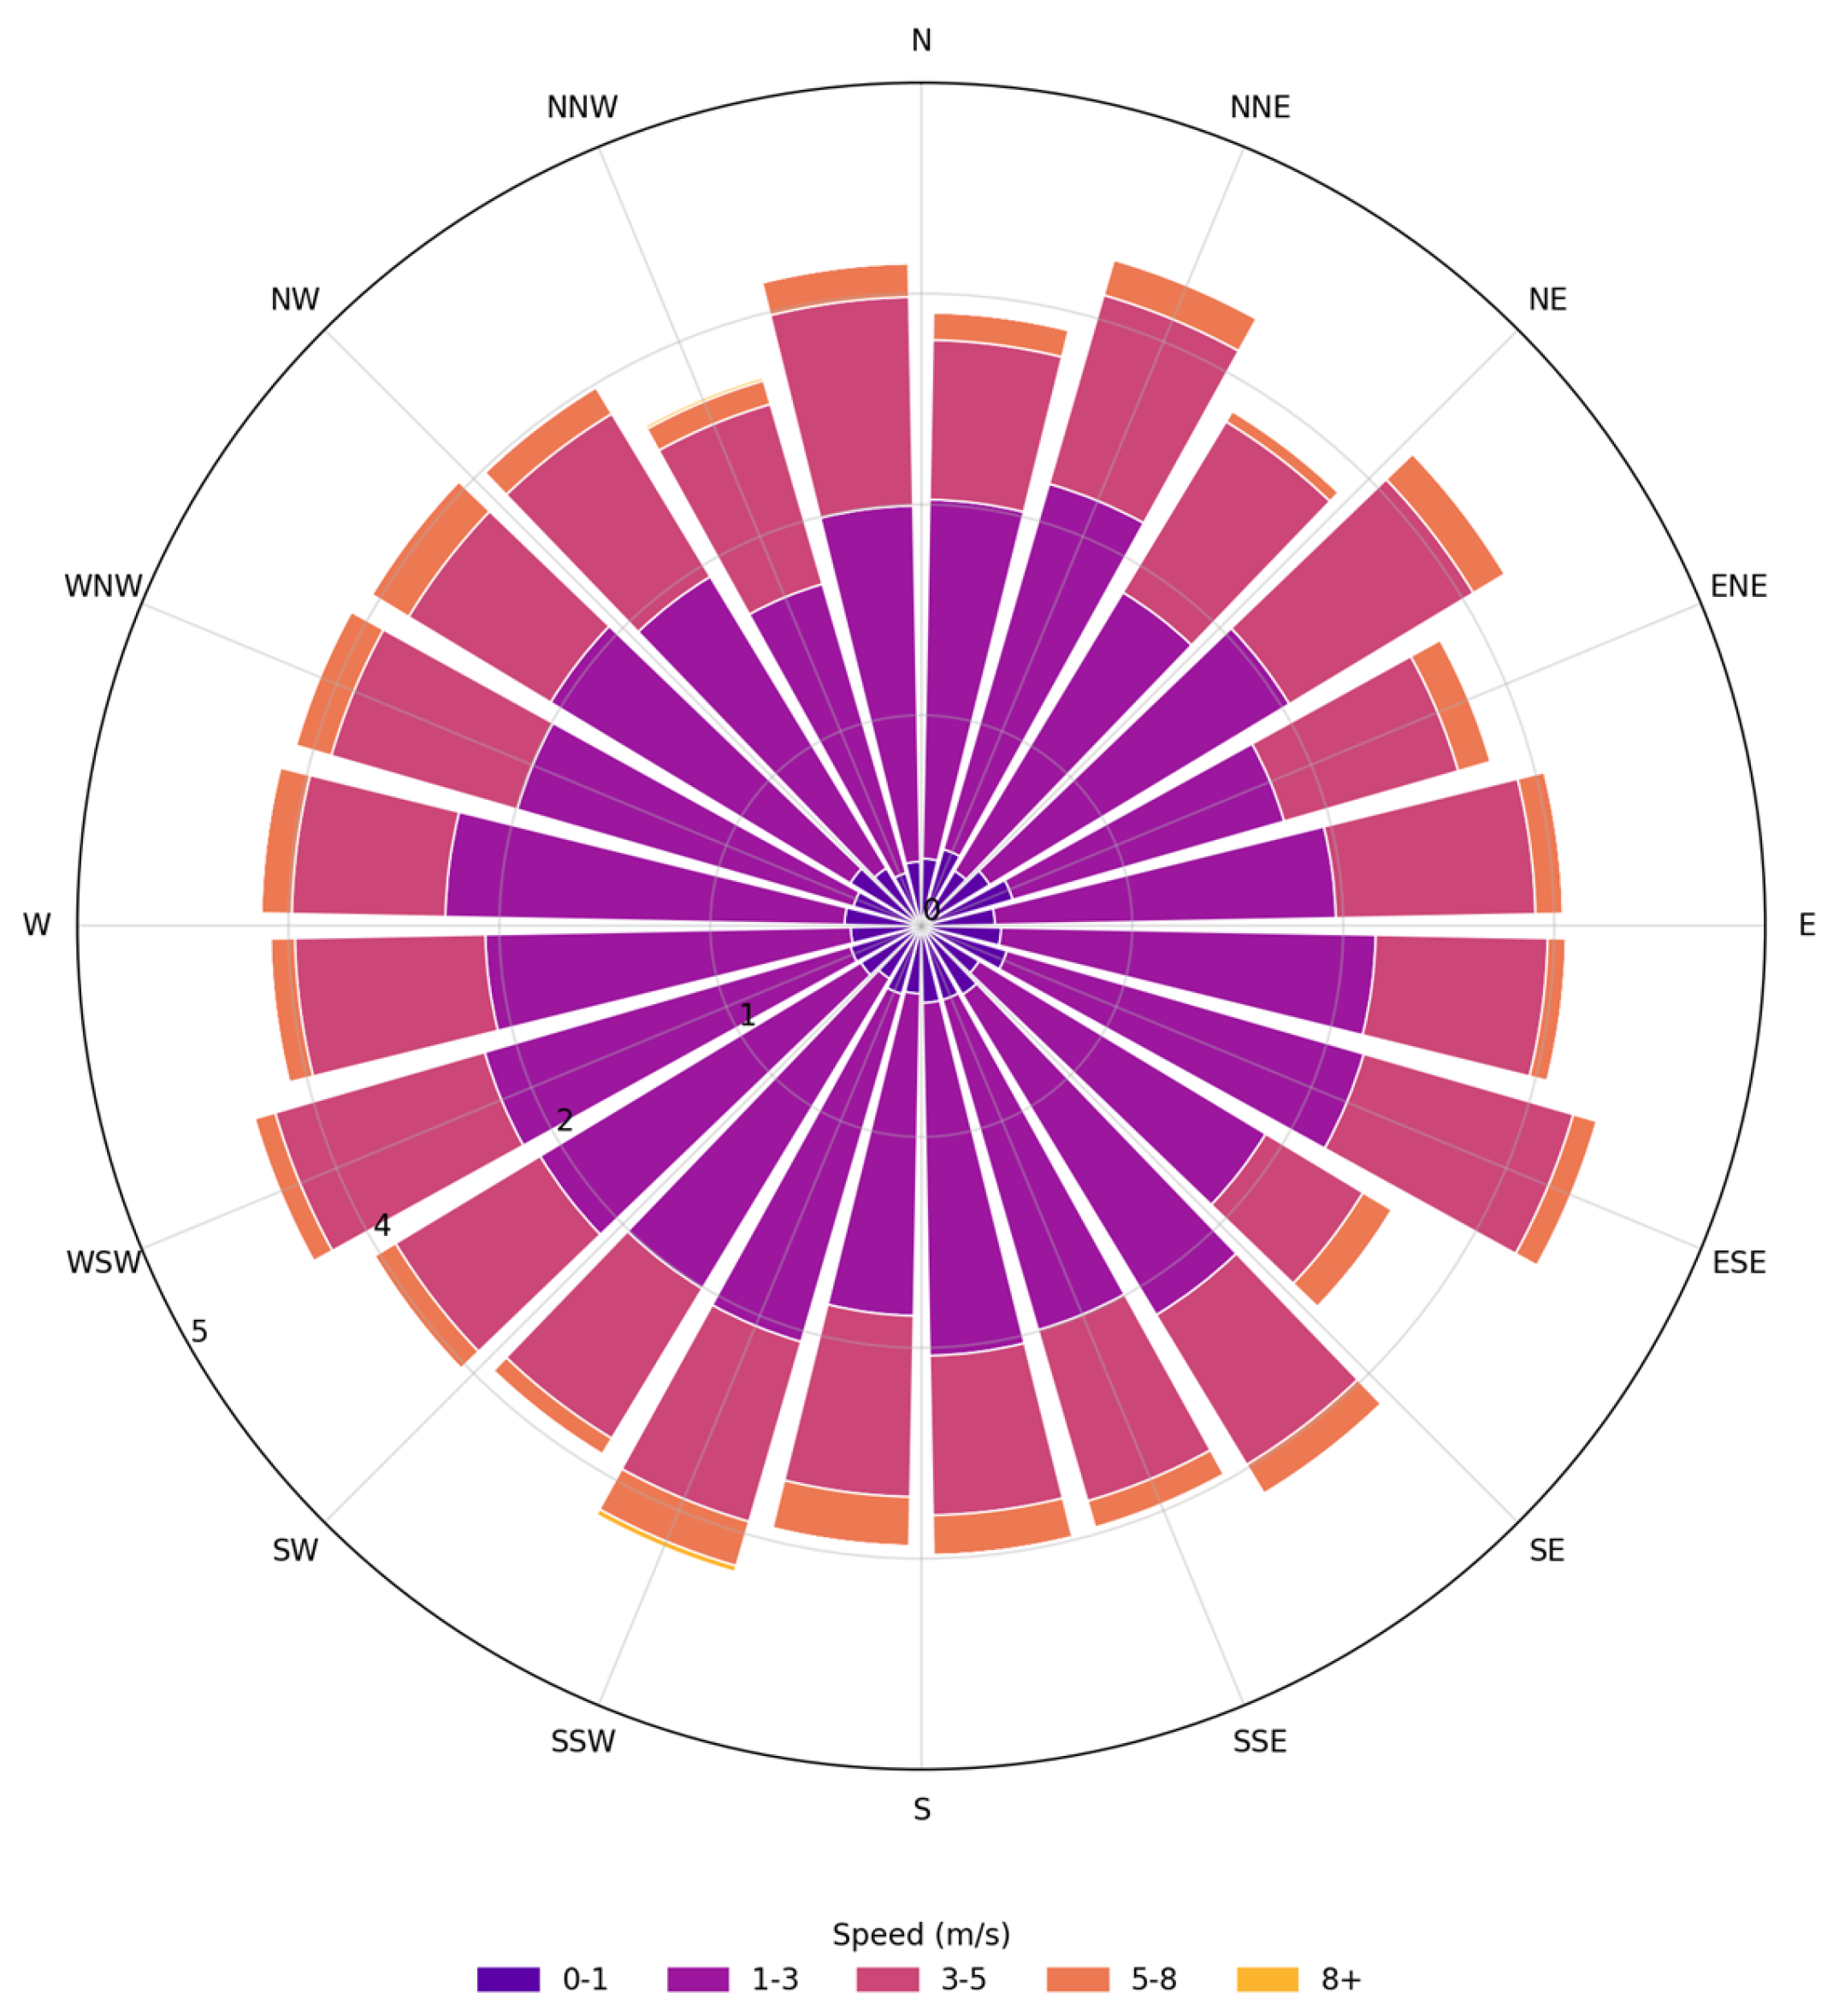
The wind rose in
Figure 1, constructed from observational data, reflects the distribution of wind directions and speeds in 15° increments. Analysis of the diagram reveals that northeasterly directions are dominant. The highest frequency is recorded for the
NE–ENE directions, where the total share of observations reaches approximately 5.2%. The second most significant direction is the southwest sector (SW–WSW), with a frequency of 4.5–4.8%. For the westerly and northwesterly directions (
W–NNW), the frequency is significantly lower and does not exceed 2.5–3.0%.
The distribution of wind speed classes shows a predominance of moderate values. The 1–3 m/s and 3–5 m/s classes account for a combined 72–75% of all observations. Light winds (0–1 m/s) account for approximately 8–10%, while intense winds of 5–8 m/s are significantly less common—no more than 6–7%, primarily in the northeastern and southwestern sectors. The proportion of extreme wind speeds above 8 m/s does not exceed 0.5–1% of the sample.
The wind regime is characterized by a pronounced asymmetry with the transport axis in the NE–SW direction. For environmental applications, this indicates a preferential transport of pollutants along this axis, which should be taken into account when modeling pollutant dispersion processes and designing monitoring networks.
Table 1 summarizes the key quantitative results for the hybrid model forecasts at 6 h and 24 h horizons. For wind speed,
RMSE increases from 1.2 to 1.7 m/s, while temperature error rises from 1.8 to 2.6 °C.
PM concentration forecasts demonstrate
RMSE growth from 0.012 to 0.017 mg/m
3. The coefficient of determination (
R2) declines from 0.71 to 0.52 for wind, from 0.78 to 0.61 for temperature, and from 0.64 to 0.47 for PM, reflecting the greater sensitivity of pollutant concentrations to evolving synoptic conditions.
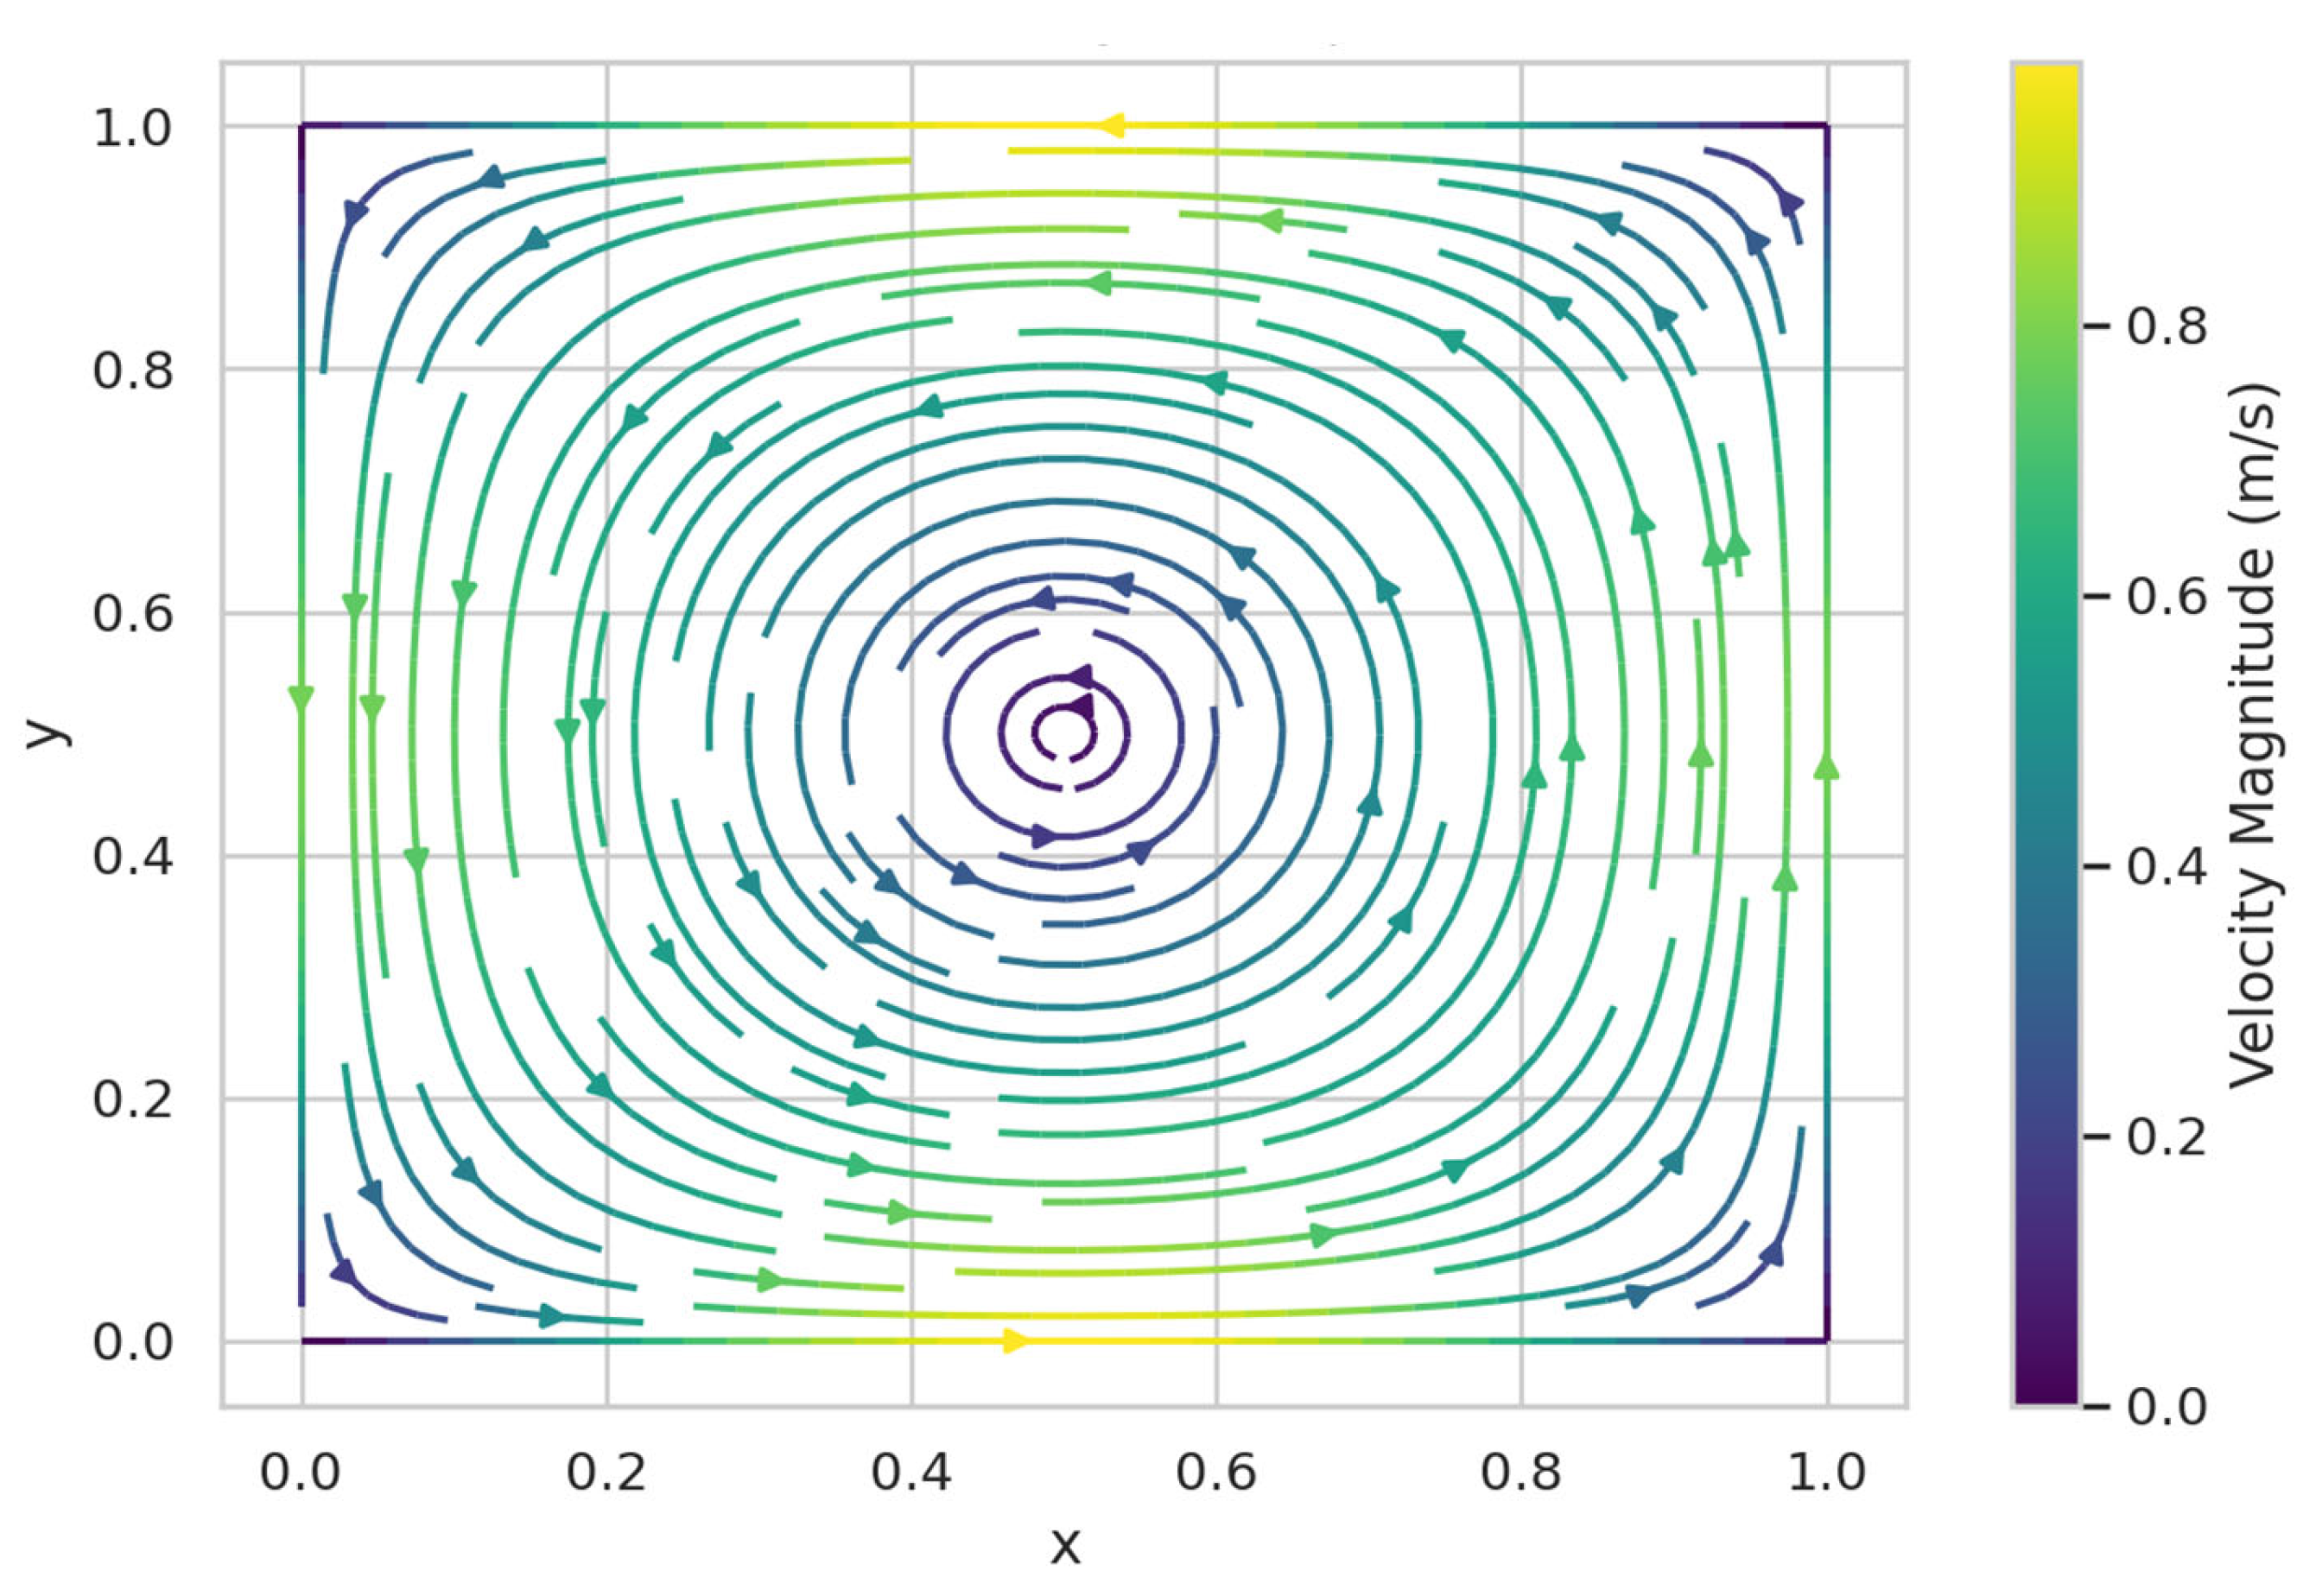
Visualization of streamlines (see
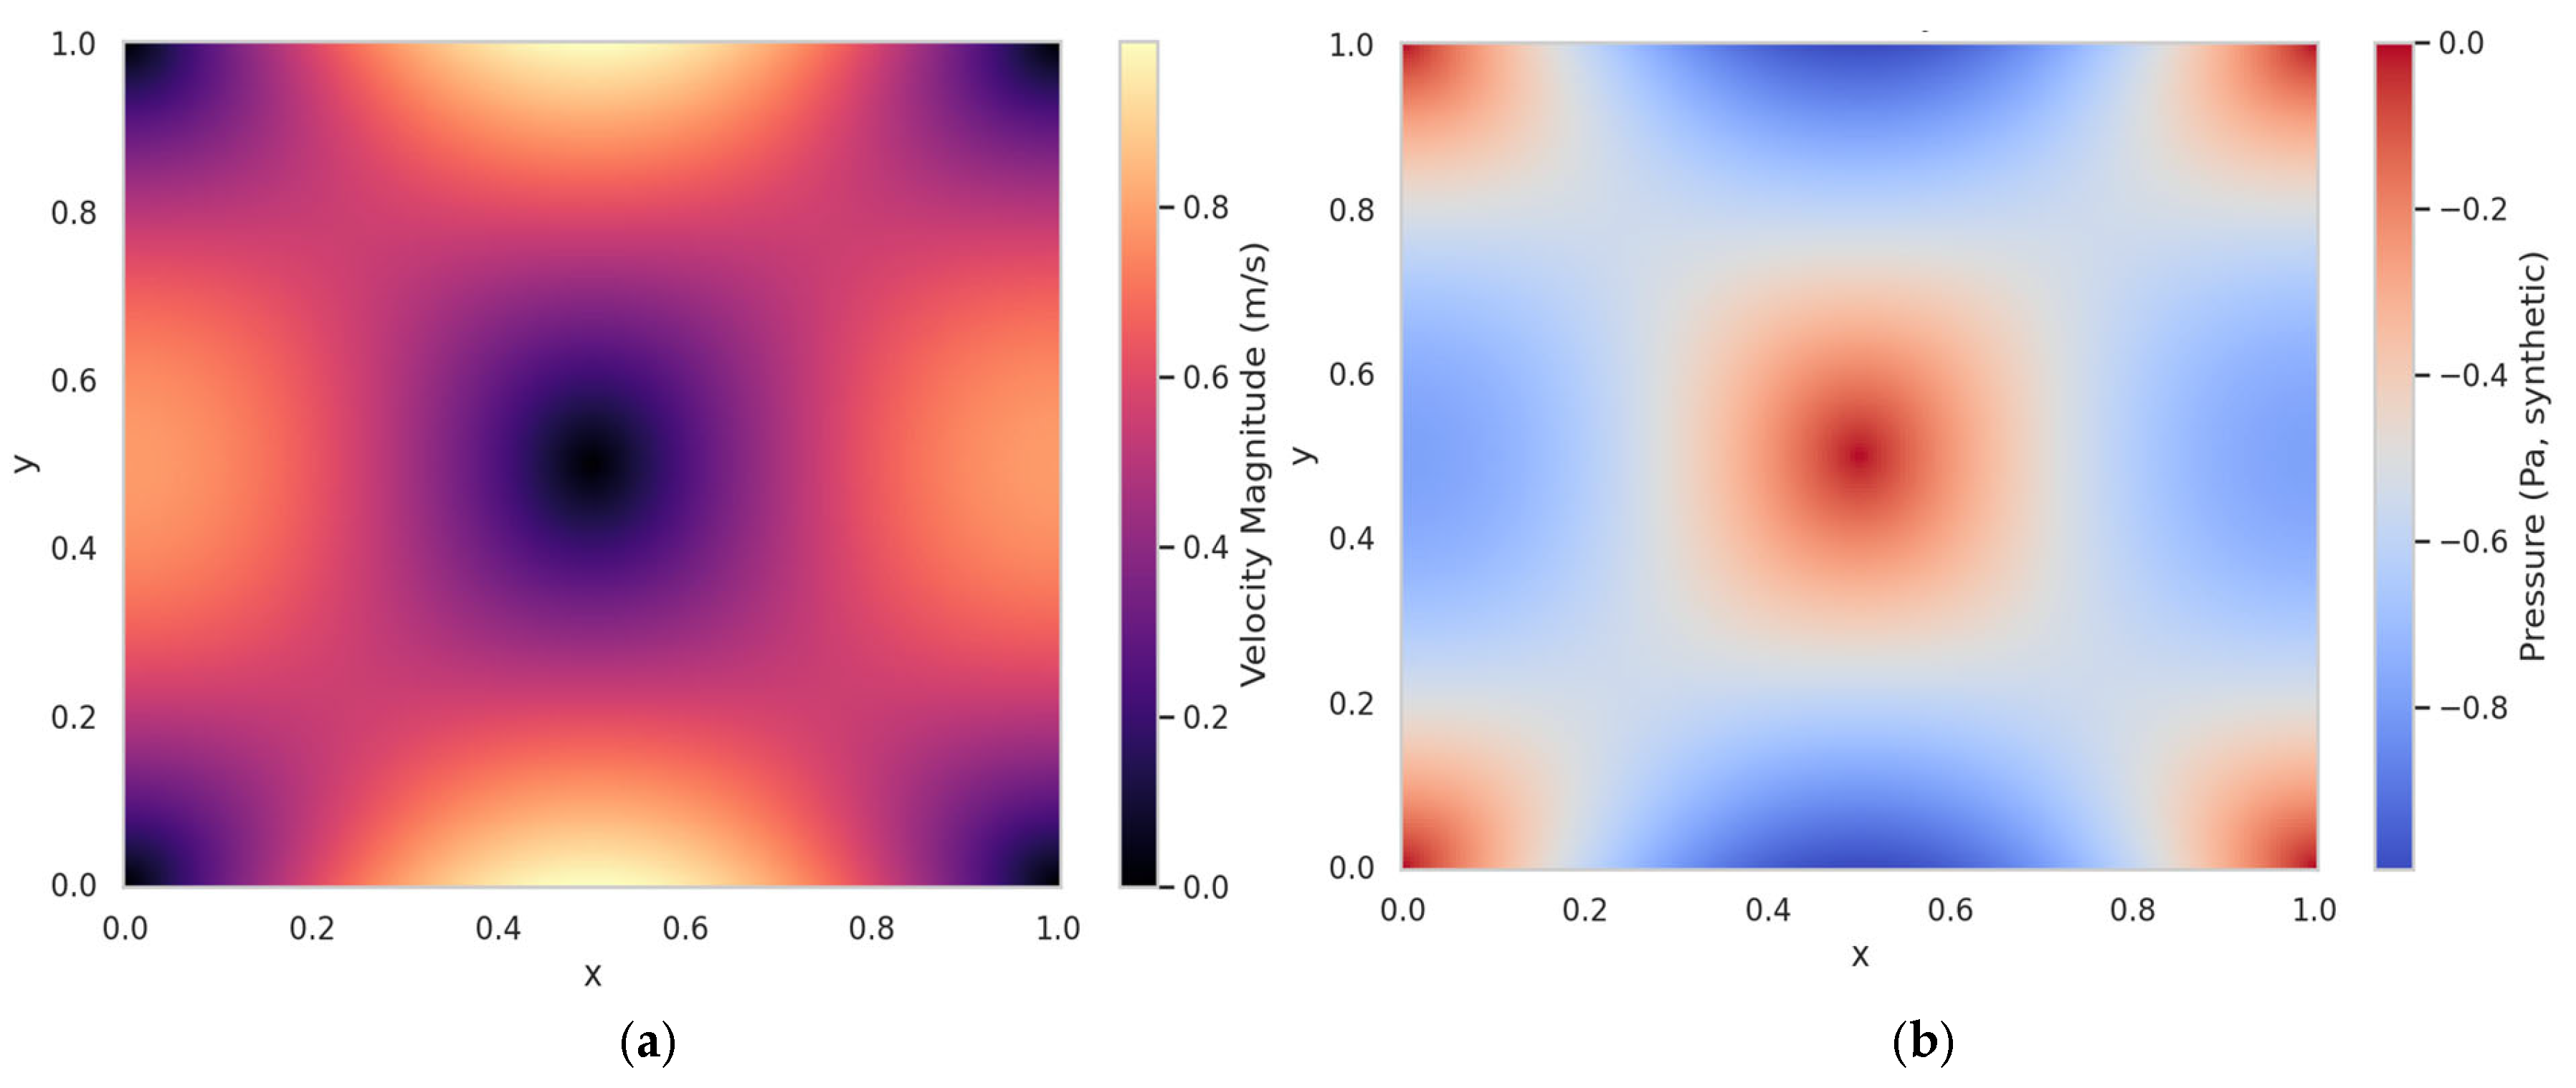
Figure 2) and velocity maps (see
Figure 3) confirms the formation of a stable vortex cell with a maximum velocity at the afferent boundary and a decrease toward the center. The pressure map is consistent with the flow direction, demonstrating the pressure differences necessary to maintain circulation.
Streamlines of 2D incompressible flow, showing a stable recirculation cell. The maximum velocity near the inflow boundary reaches 2.8 m/s, decaying below 0.5 m/s in the vortex center.
Velocity magnitude field (
Figure 3a,b), pressure distribution. The pressure gradient is ~4.5 Pa across the NE–SW axis, sufficient to sustain circulation.
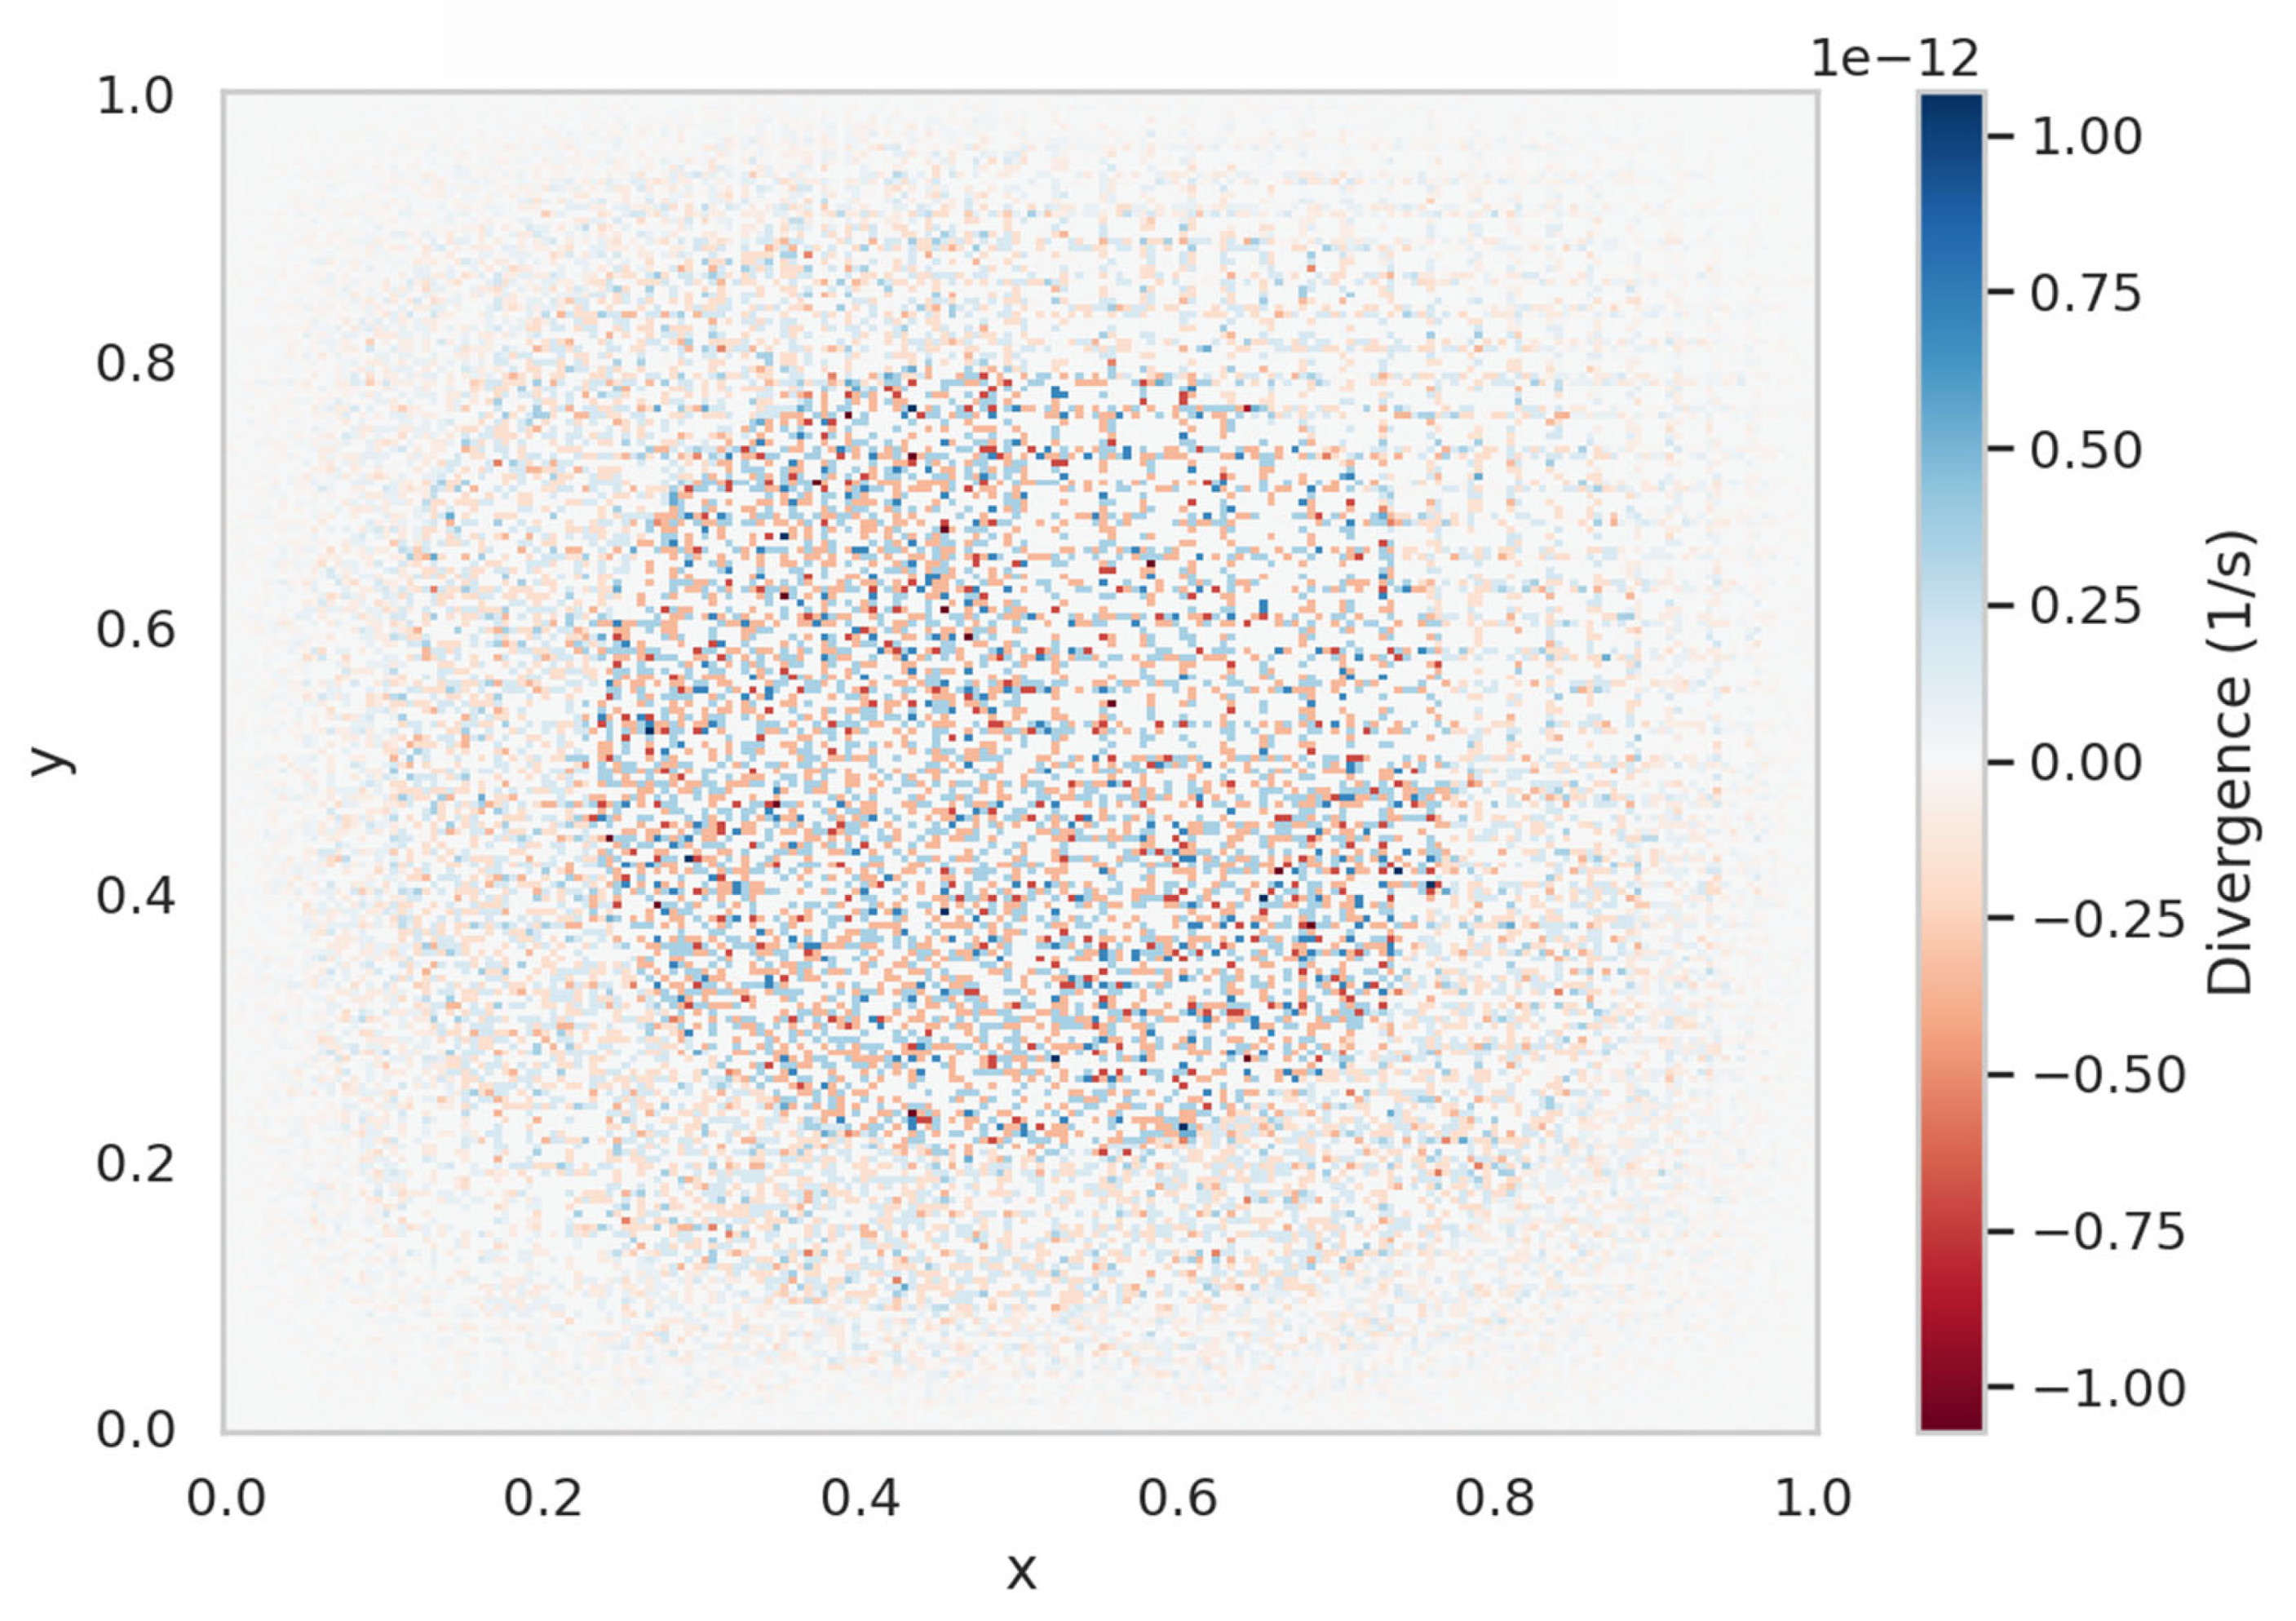
The divergence field in
Figure 4 is close to zero in the main region, confirming the correctness of the incompressible formulation. Minor artifacts near the boundaries are explained by numerical discretization. Values remain below
|∇·u| < 1.5 × 10
−3 s
−1 in the central domain, confirming the incompressibility assumption. Larger deviations up to 4 × 10
−3 s
−1 appear only near lateral boundaries due to discretization artifacts.
Figure 5 shows some bias and an increase in the error spread for large predicted
PM values, which is typical in the presence of emissions and unaccounted factors, specific process emissions, topography, and inversion conditions.
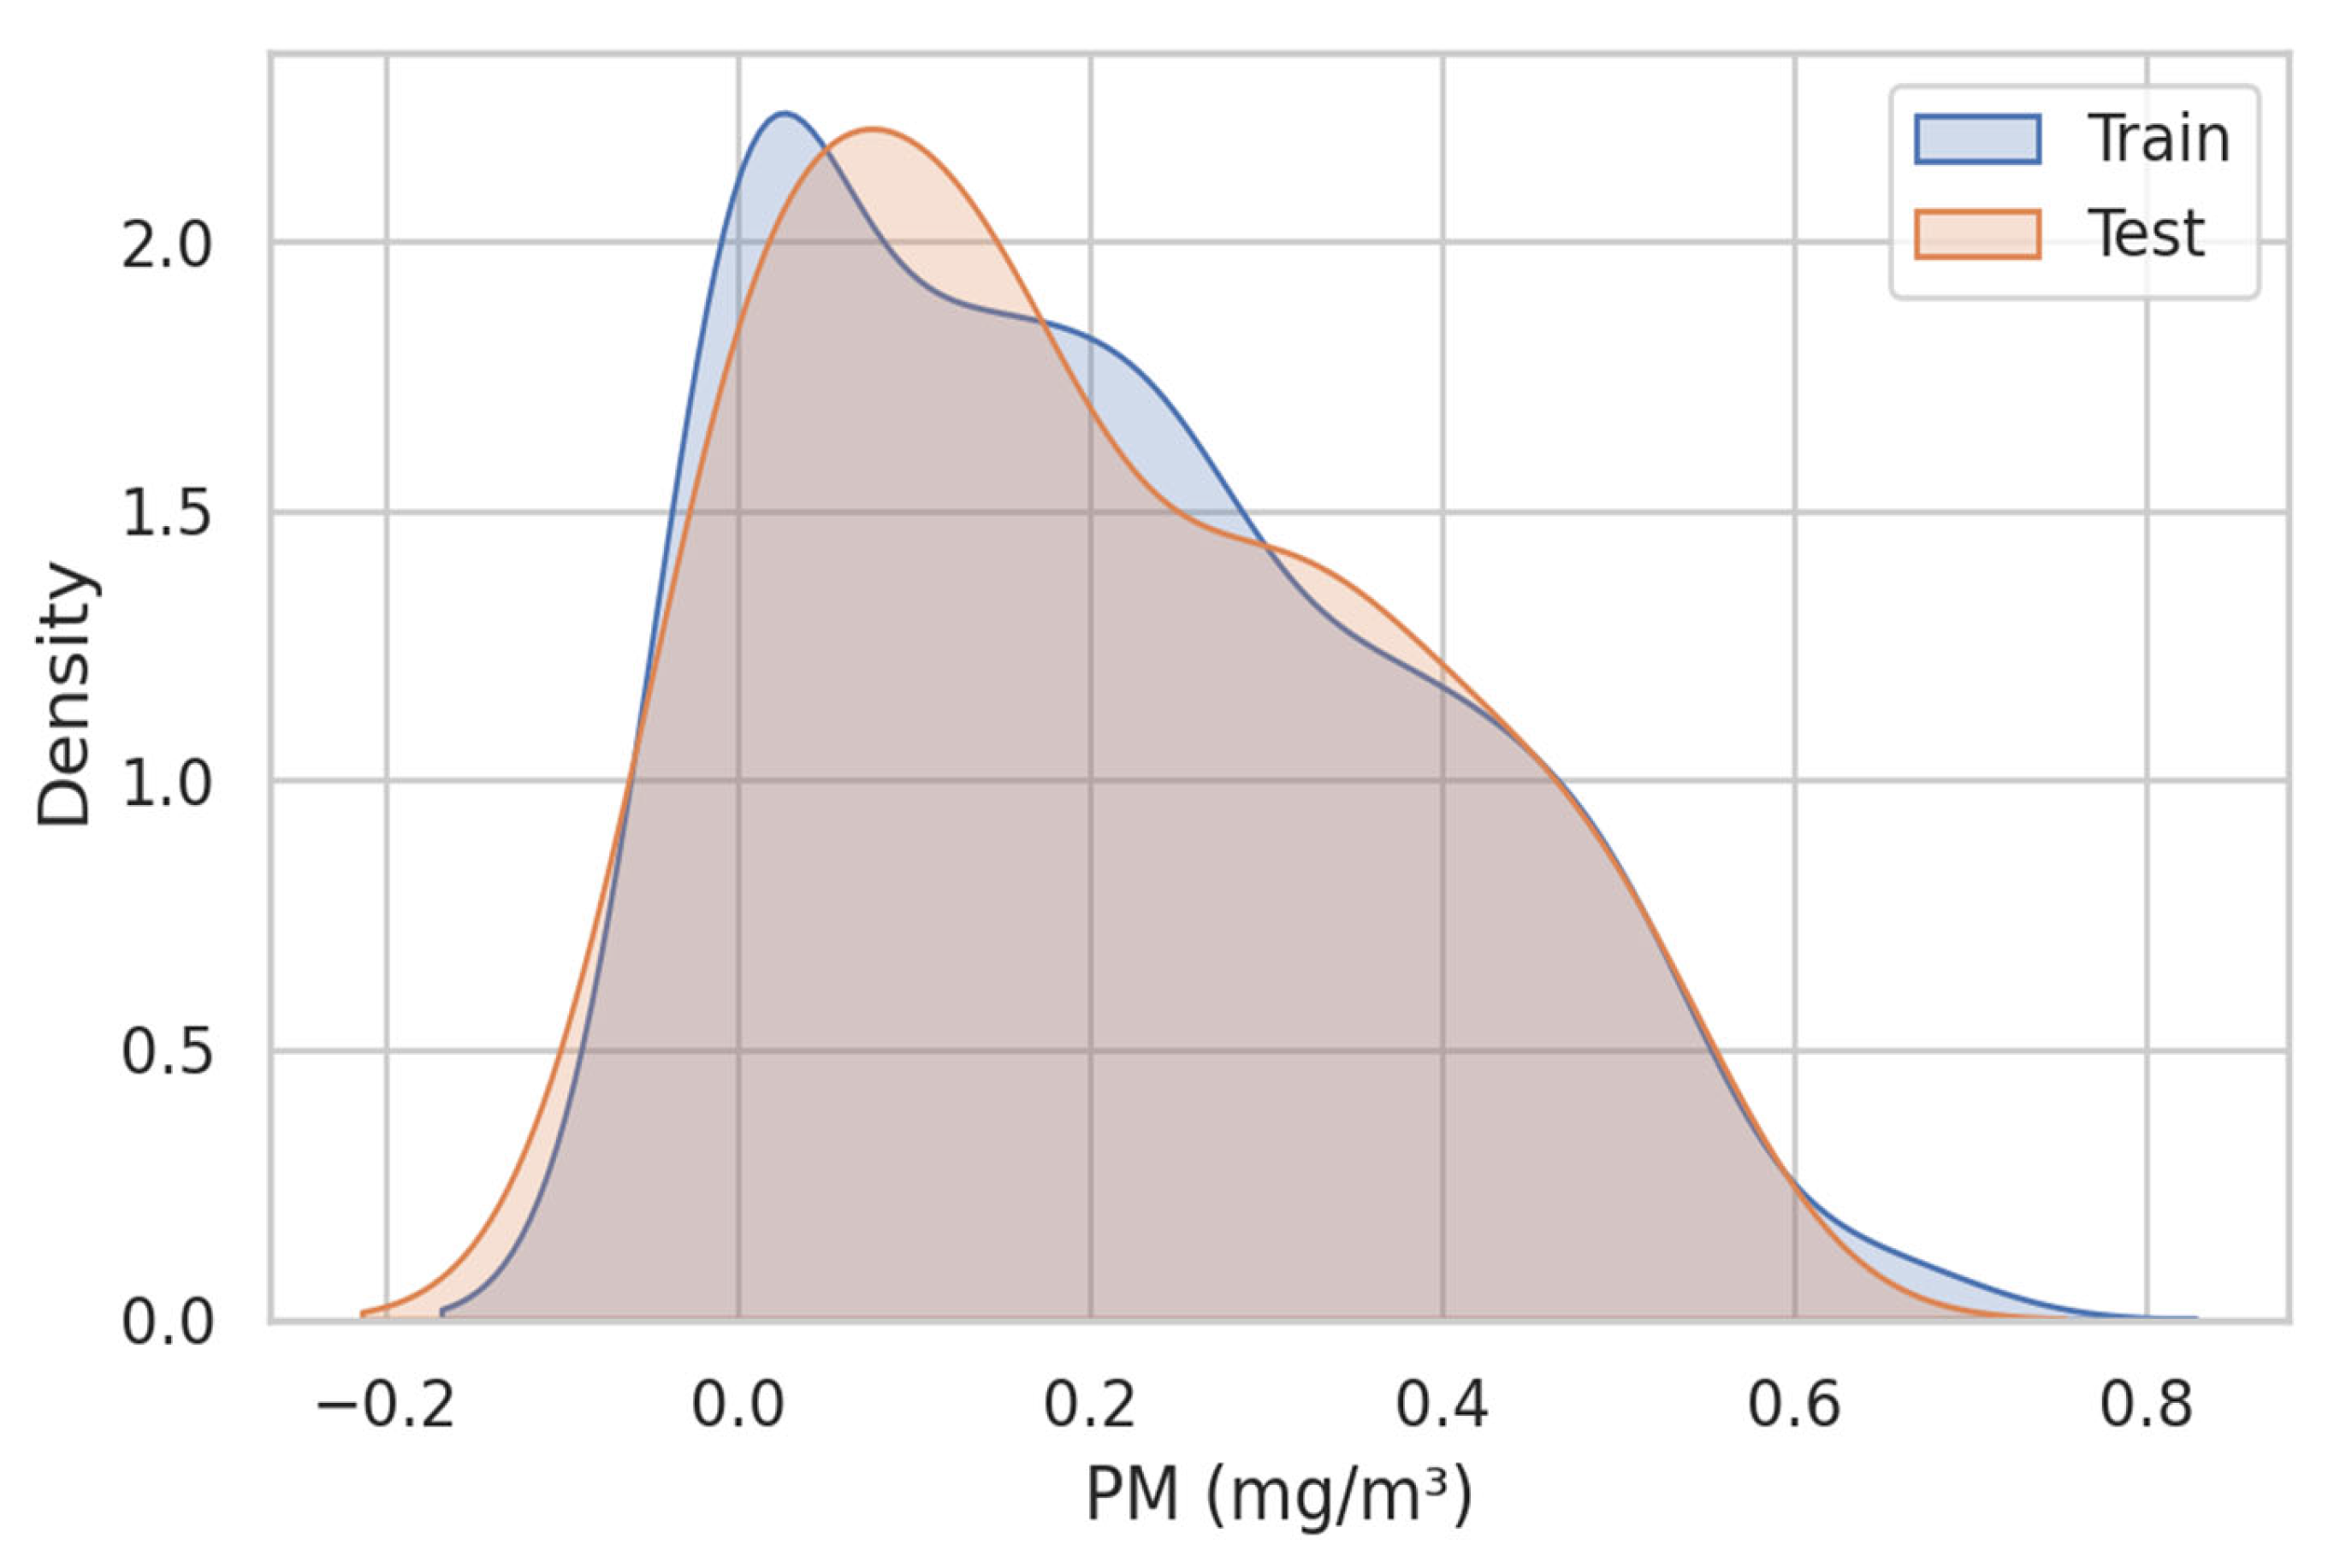
Training data show RMSE = 0.011 mg/m3 and R2 = 0.69, while test data exhibit RMSE = 0.012 mg/m3 and R2 = 0.64. Higher PM values (>0.3 mg/m3) are underestimated, indicating unaccounted emission peaks during inversion episodes.
Notably, extreme PM episodes (>0.5 mg/m3), observed in 3.2% of cases were systematically underestimated by 0.08–0.1 mg/m3. This highlights the necessity of including emission surrogates (traffic proxies, heating load) in future work.
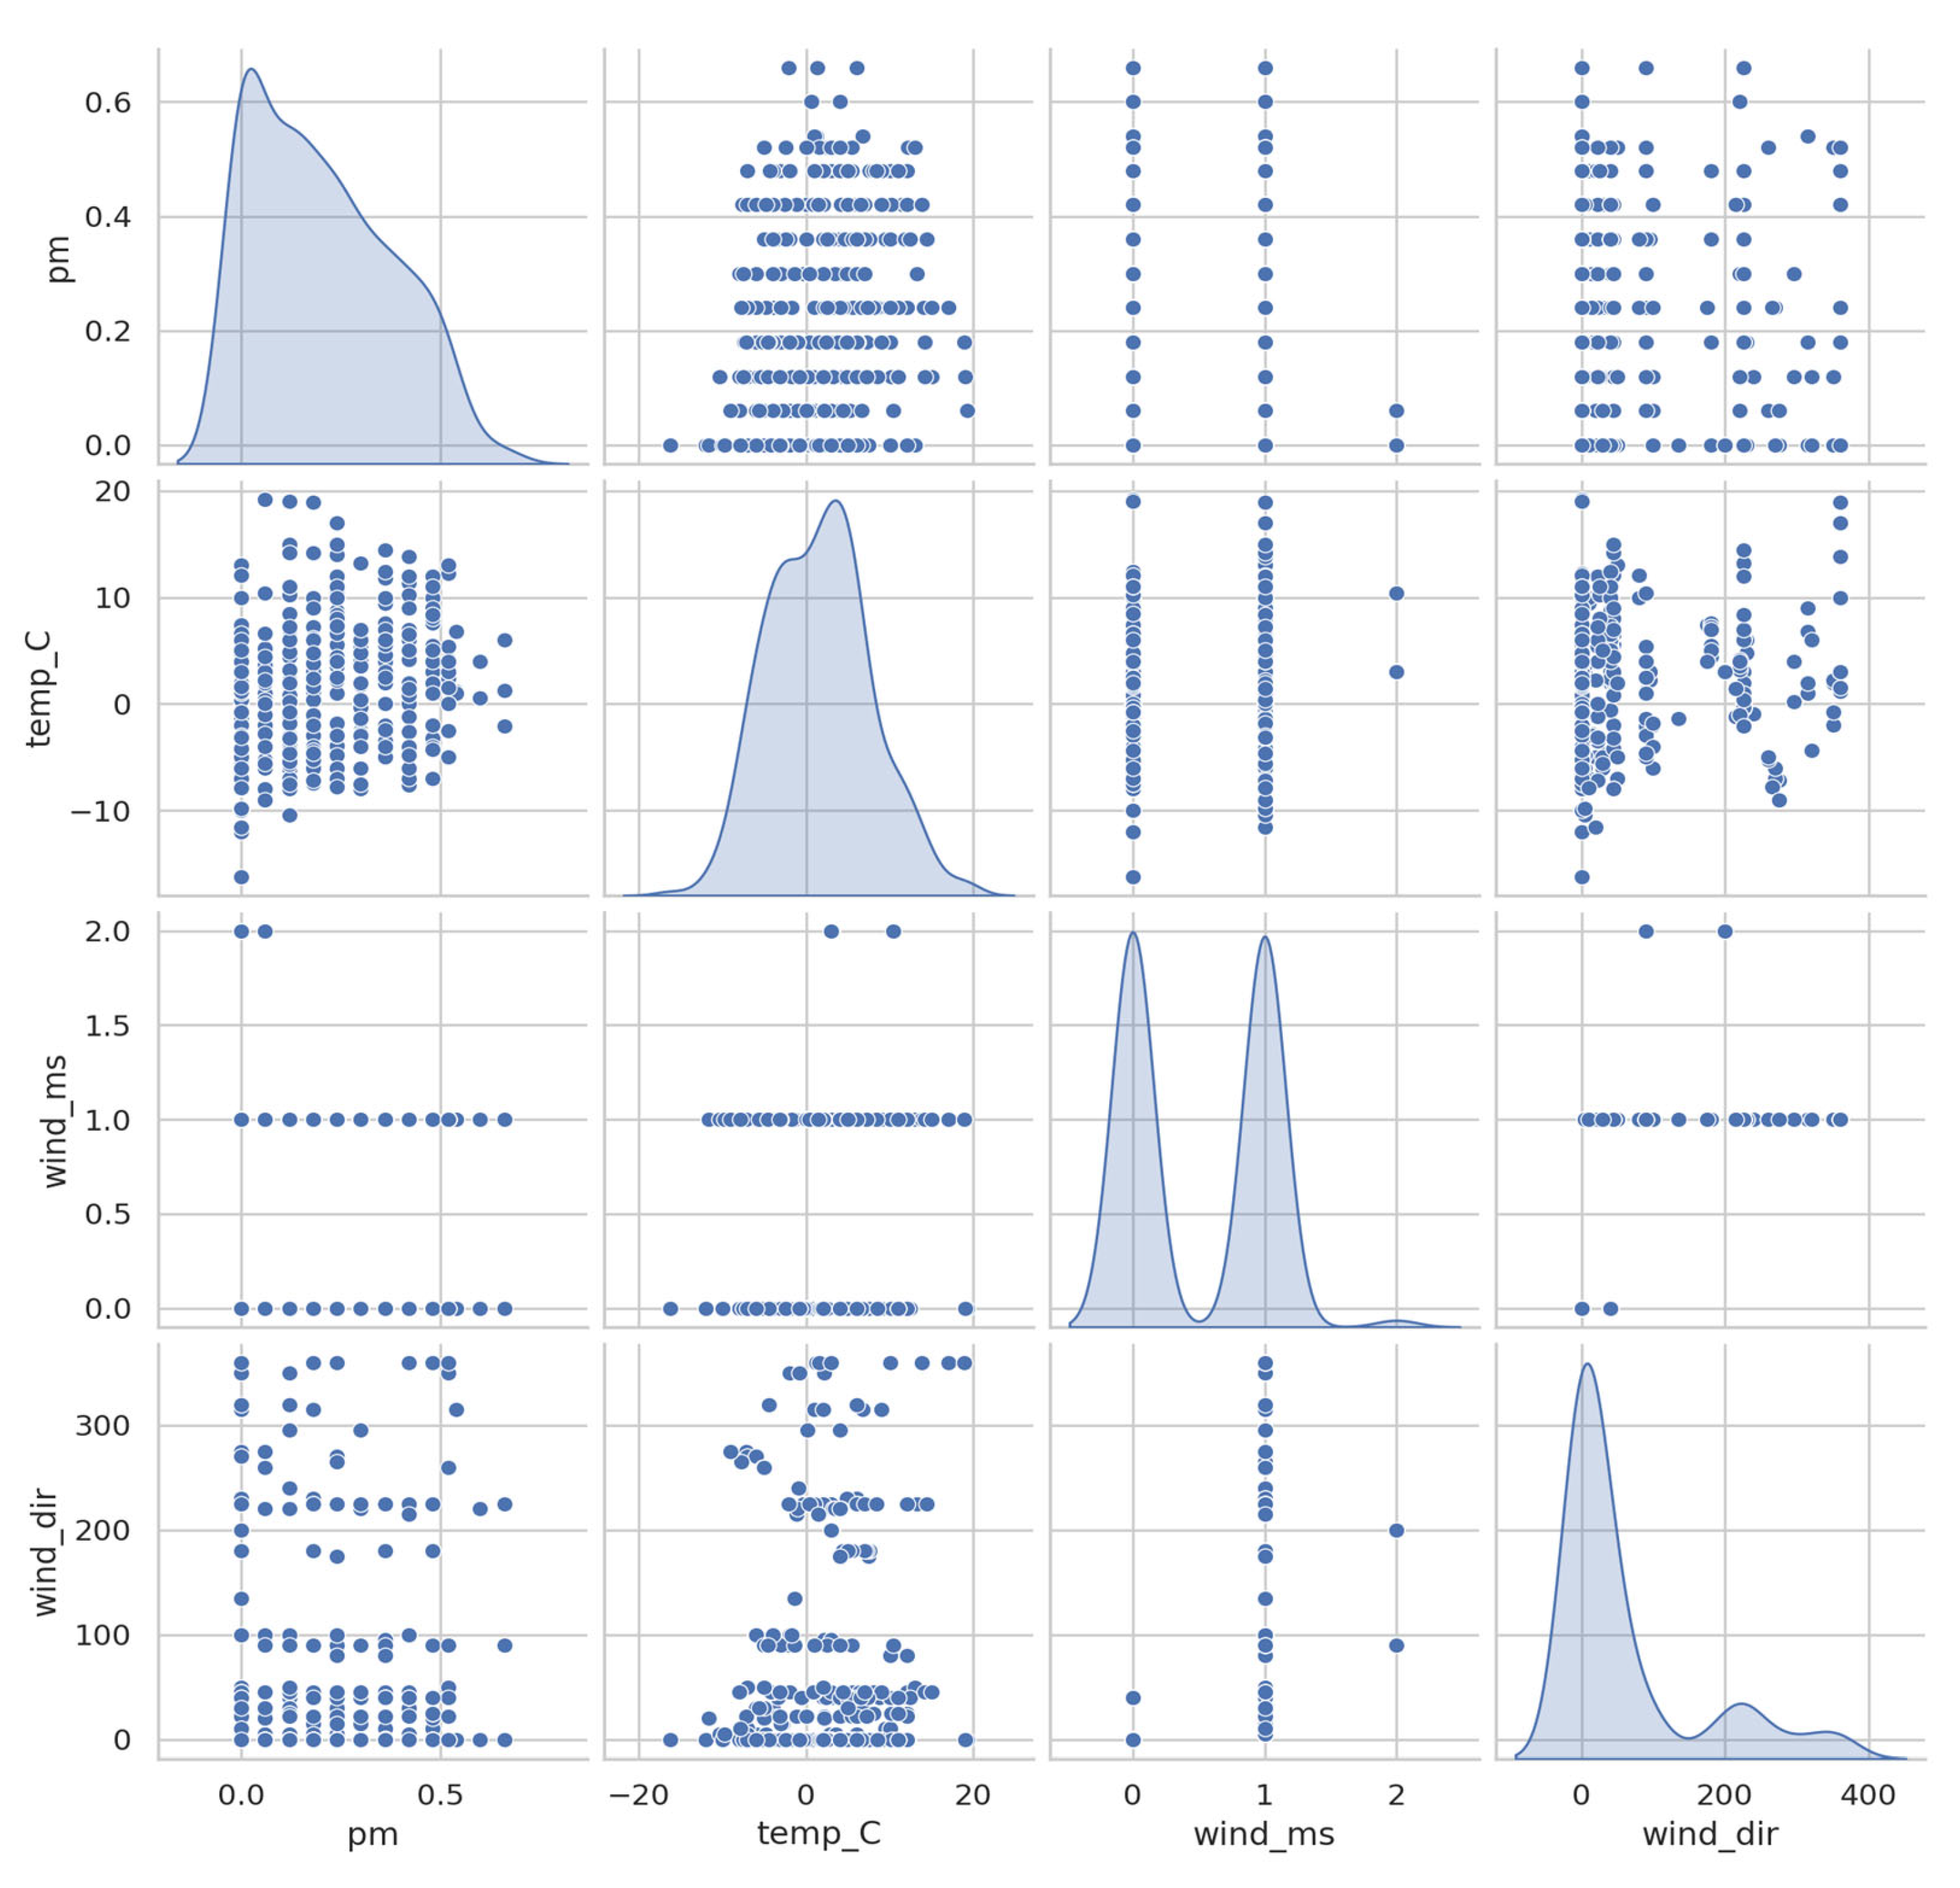
Clouds of points (see
Figure 6) characterizing paired dependencies are visible off the diagonal. The relationship between
PM and wind speed is negative: at speeds below 0.5 m/s, pollutant concentrations reach maximum levels (0.3–0.6), while at speeds above 1.5 m/s, only low
PM values (<0.2) are observed. This confirms the physical effect of dilution and removal of pollutants by air currents. The dependence of
PM on temperature is nonlinear: at temperatures below –10 °C, average concentrations fluctuate between 0.3 and 0.4, and at temperatures above +10 °C, they decrease to values below 0.2. This distribution is consistent with the seasonal factor, when higher pollution levels are recorded in winter with stable air stratification. The relationship between
PM and wind direction is expressed as point clusters, particularly noticeable in the 0–90° and 270–300° ranges, indicating the influence of prevailing wind patterns and urban development characteristics.
Temperature and wind speed demonstrate a weak positive relationship: as temperatures rise above 5 °C, speeds of around 1–1.5 m/s are more common, while during frosty periods, calm conditions (0–0.5 m/s) predominate. The relationship between wind speed and direction is also inconsistent: elongated point clouds confirm that higher speeds are characteristic of certain directions, primarily in the 250–300° range.
At wind speeds < 0.5 m/s, PM concentrations reach 0.3–0.6 mg/m3, whereas above 1.5 m/s, values rarely exceed 0.2 mg/m3. The temperature—PM relation is nonlinear: below –10 °C median PM ≈ 0.35 mg/m3, while above +10 °C it falls below 0.2 mg/m3. Directional clustering is observed at 0–90° and 270–300°, consistent with valley-channel flows.
Thus, the matrix reflects key patterns: increasing wind speed reduces pollutant concentrations; temperature effects are seasonal and nonlinear; and wind direction must be processed with cyclicity taken into account. The presence of long tails and outliers in the PM distribution emphasizes the importance of using robust data analysis and transformation methods, such as logarithmization.
Figure 7 presents boxplots of
PM (mg/m
3) concentrations at four representative hours of the day (1, 7, 13, and 19). The median and interquartile range of
PM are lowest at 1
AM, while higher variability and elevated maximum values are observed during the morning, afternoon, and evening hours. This pattern suggests a pronounced diurnal variation in
PM levels, potentially linked to anthropogenic activity and meteorological factors.
At 01:00, median = 0.12 (IQR 0.07–0.18), at 07:00, median = 0.28 (IQR 0.20–0.36), at 13:00, median = 0.22 (IQR 0.15–0.30), at 19:00, median = 0.26 (IQR 0.19–0.33). Morning peaks align with traffic emissions, while evening maxima coincide with stable stratification after sunset.
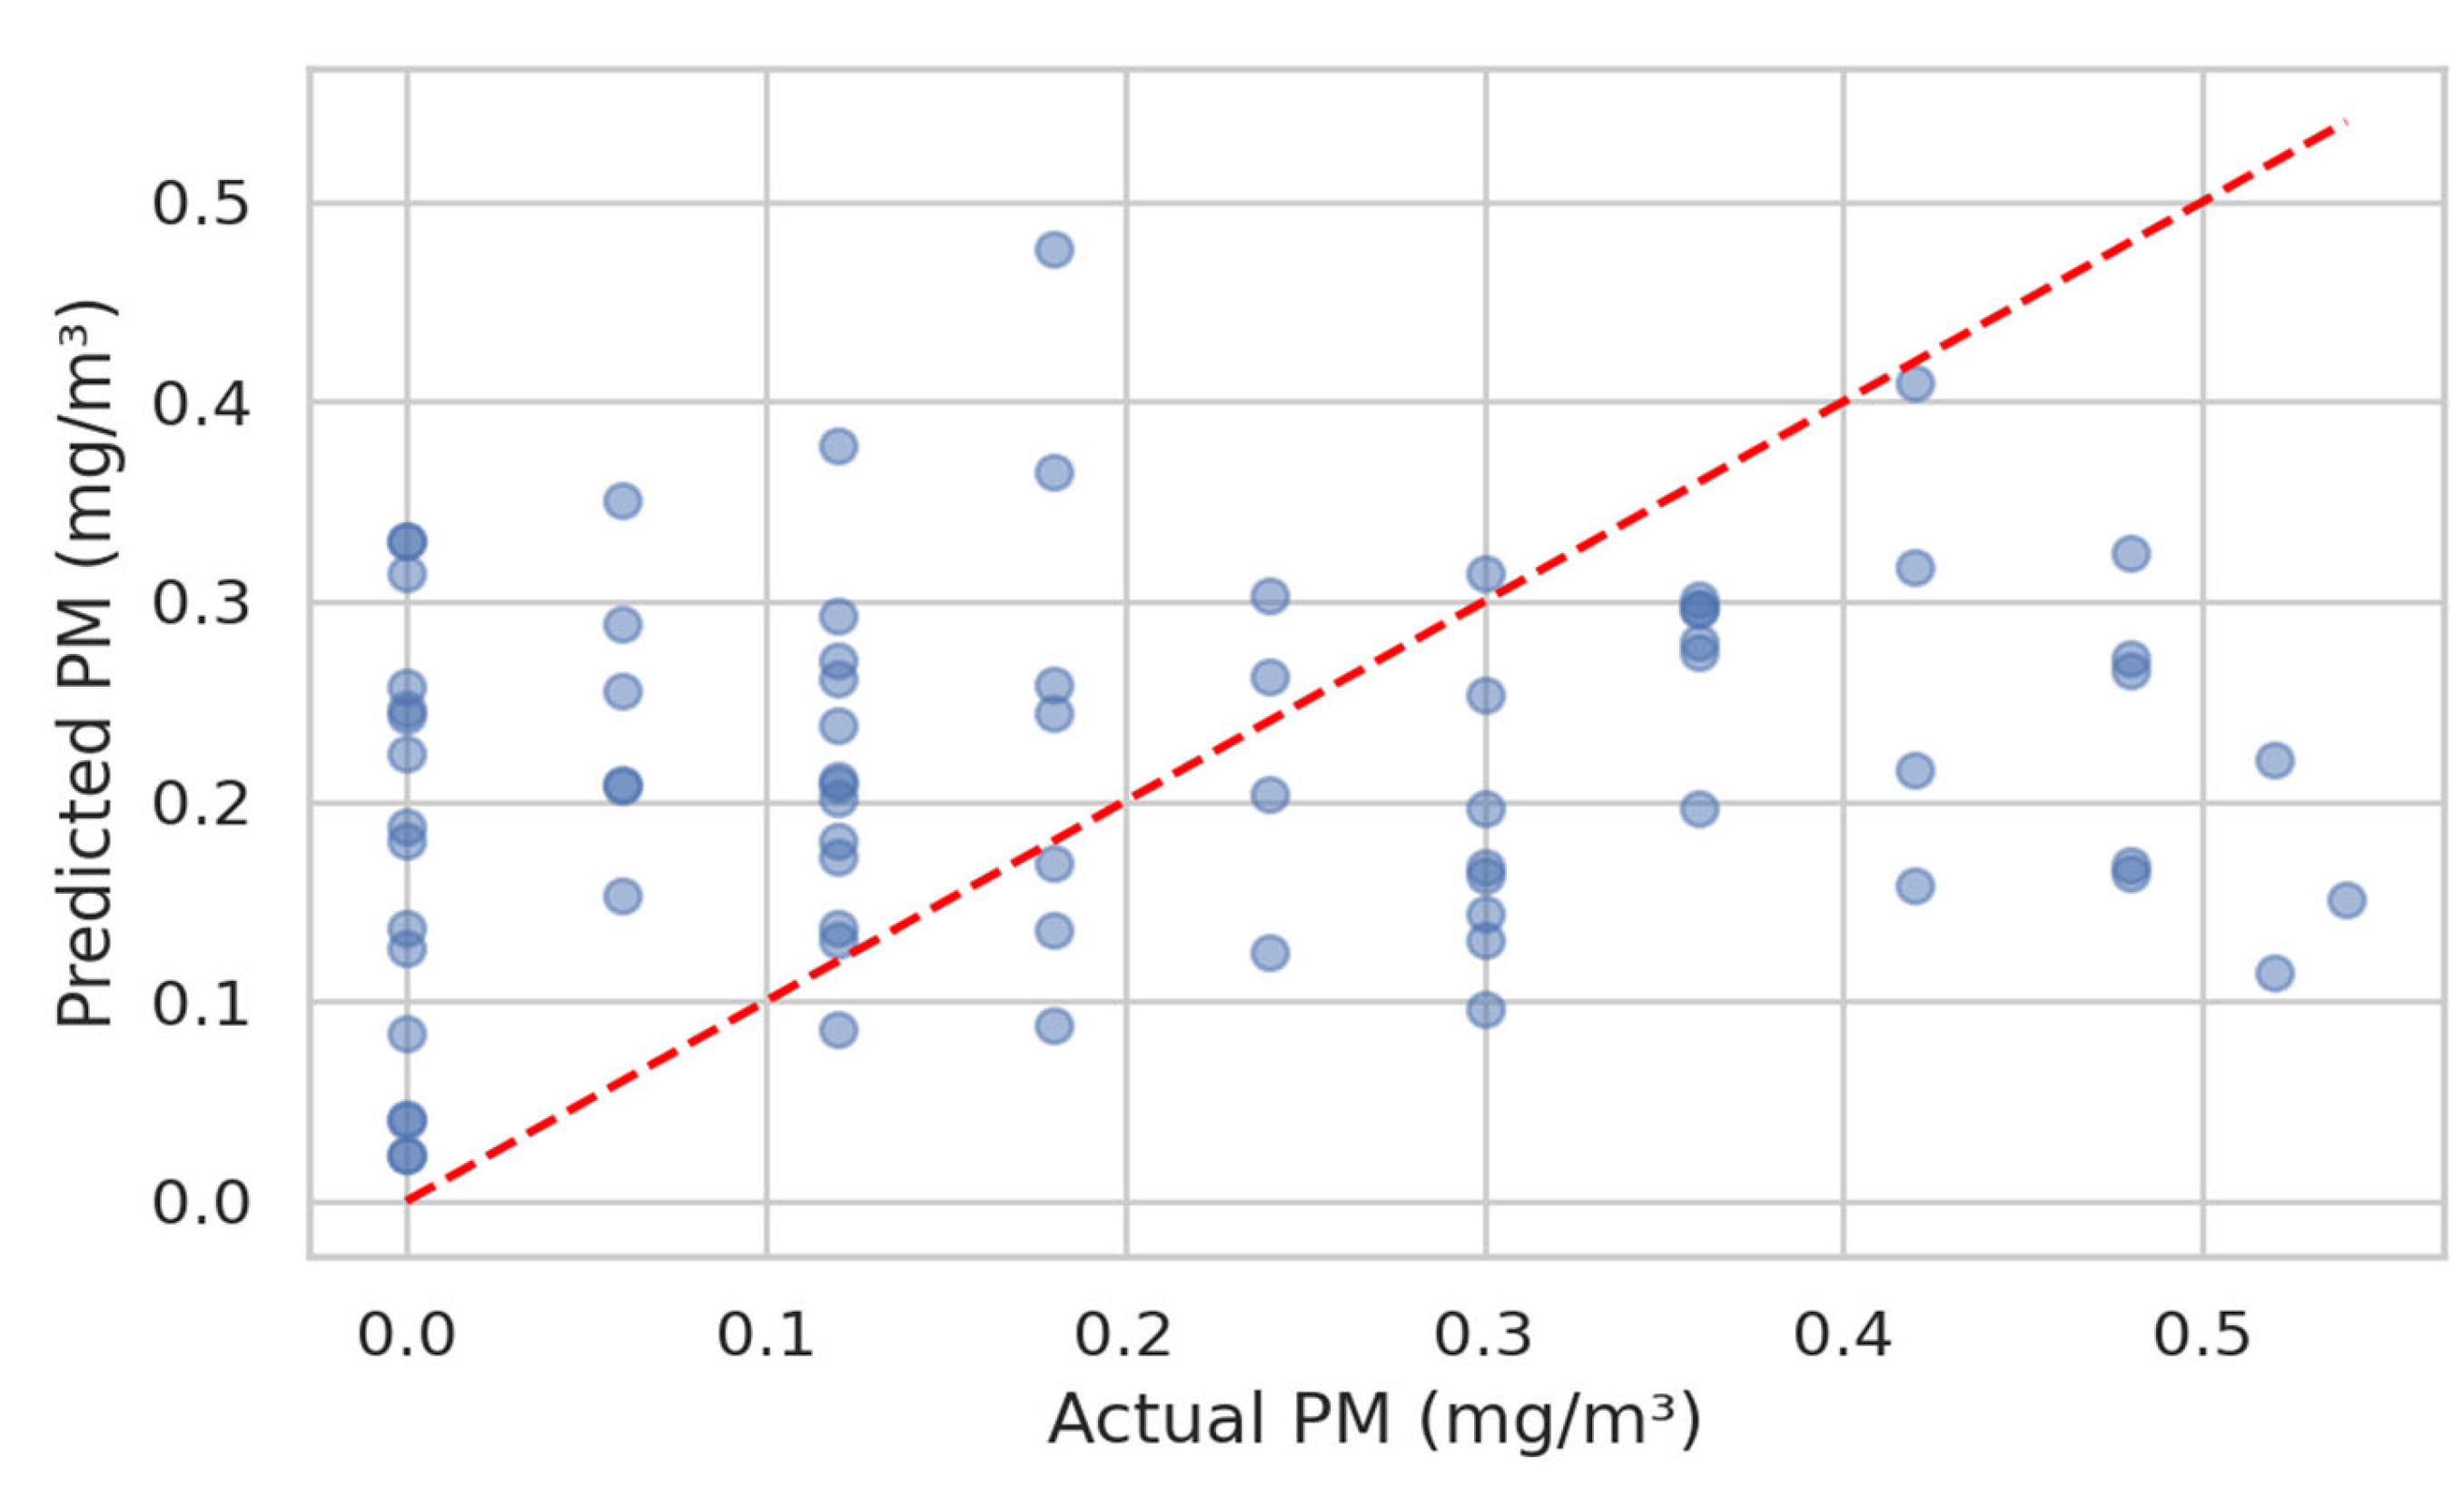
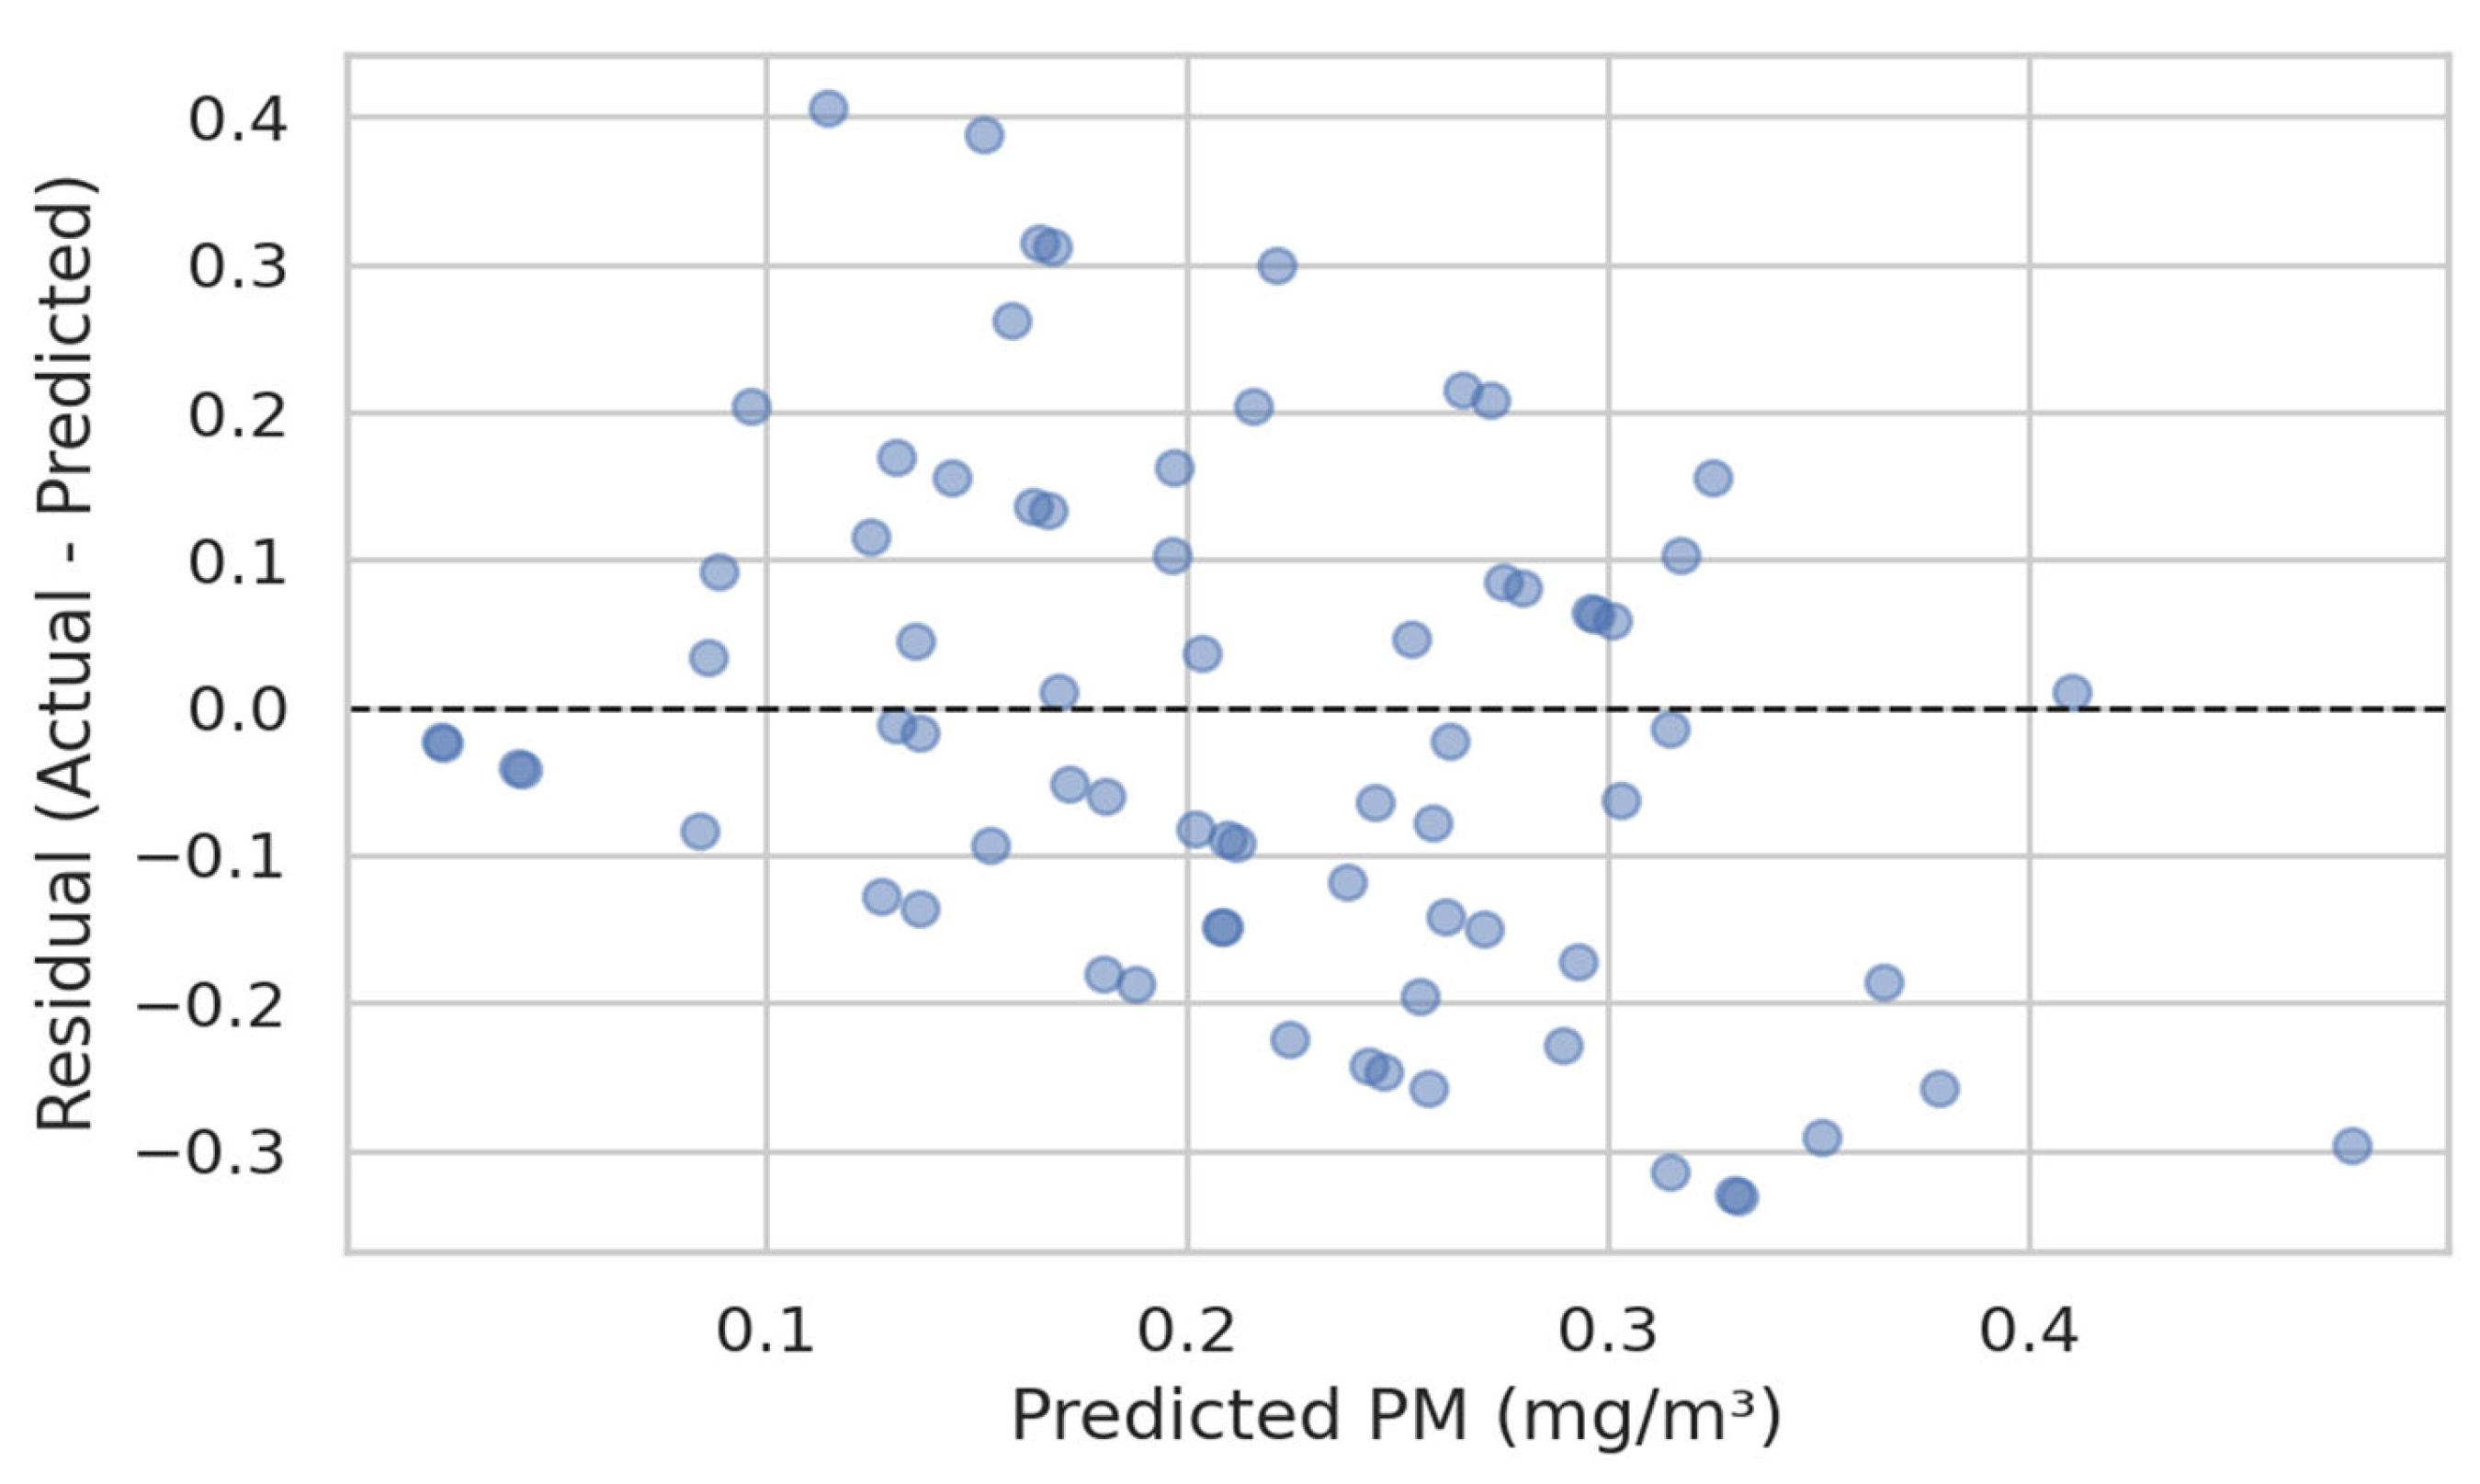
Figure 8 and
Figure 9 visualize the training and validation metrics of the regression model for predicting
PM concentrations based on meteorological features. The predicted vs. actual plot assesses calibration, while the residuals vs. predicted plot assesses the error structure and potential heteroscedasticity/bias.
The bulk of the points (see
Figure 8) is concentrated along the diagonal, indicating adequate calibration; deviations in the tails indicate underestimation of high/low pollution factors.
Most points fall along the diagonal with R2 = 0.64, indicating good calibration. Underestimation occurs for PM > 0.4 mg/m3 (~7% of cases).
In
Figure 9, the absence of a pronounced structure confirms the correctness of the specification; the fan shape hints at heteroscedasticity and the advisability of transforming the target or taking into account additional features.
The data was split into training and test sets, cross-validated, and the feature space included meteorological parameters. Quality assessment included R2, RMSE, feature importance, and partial dependencies.
Visual diagnostics help select a strategy for further improvement: feature enrichment, time lags and moving aggregates, spatial factors, and tuning/algorithm change.
Mean residuals cluster around zero, with variance increasing for PM > 0.25 mg/m3. This fan-shaped spread suggests mild heteroscedasticity, potentially mitigated by logarithmic target transformation.
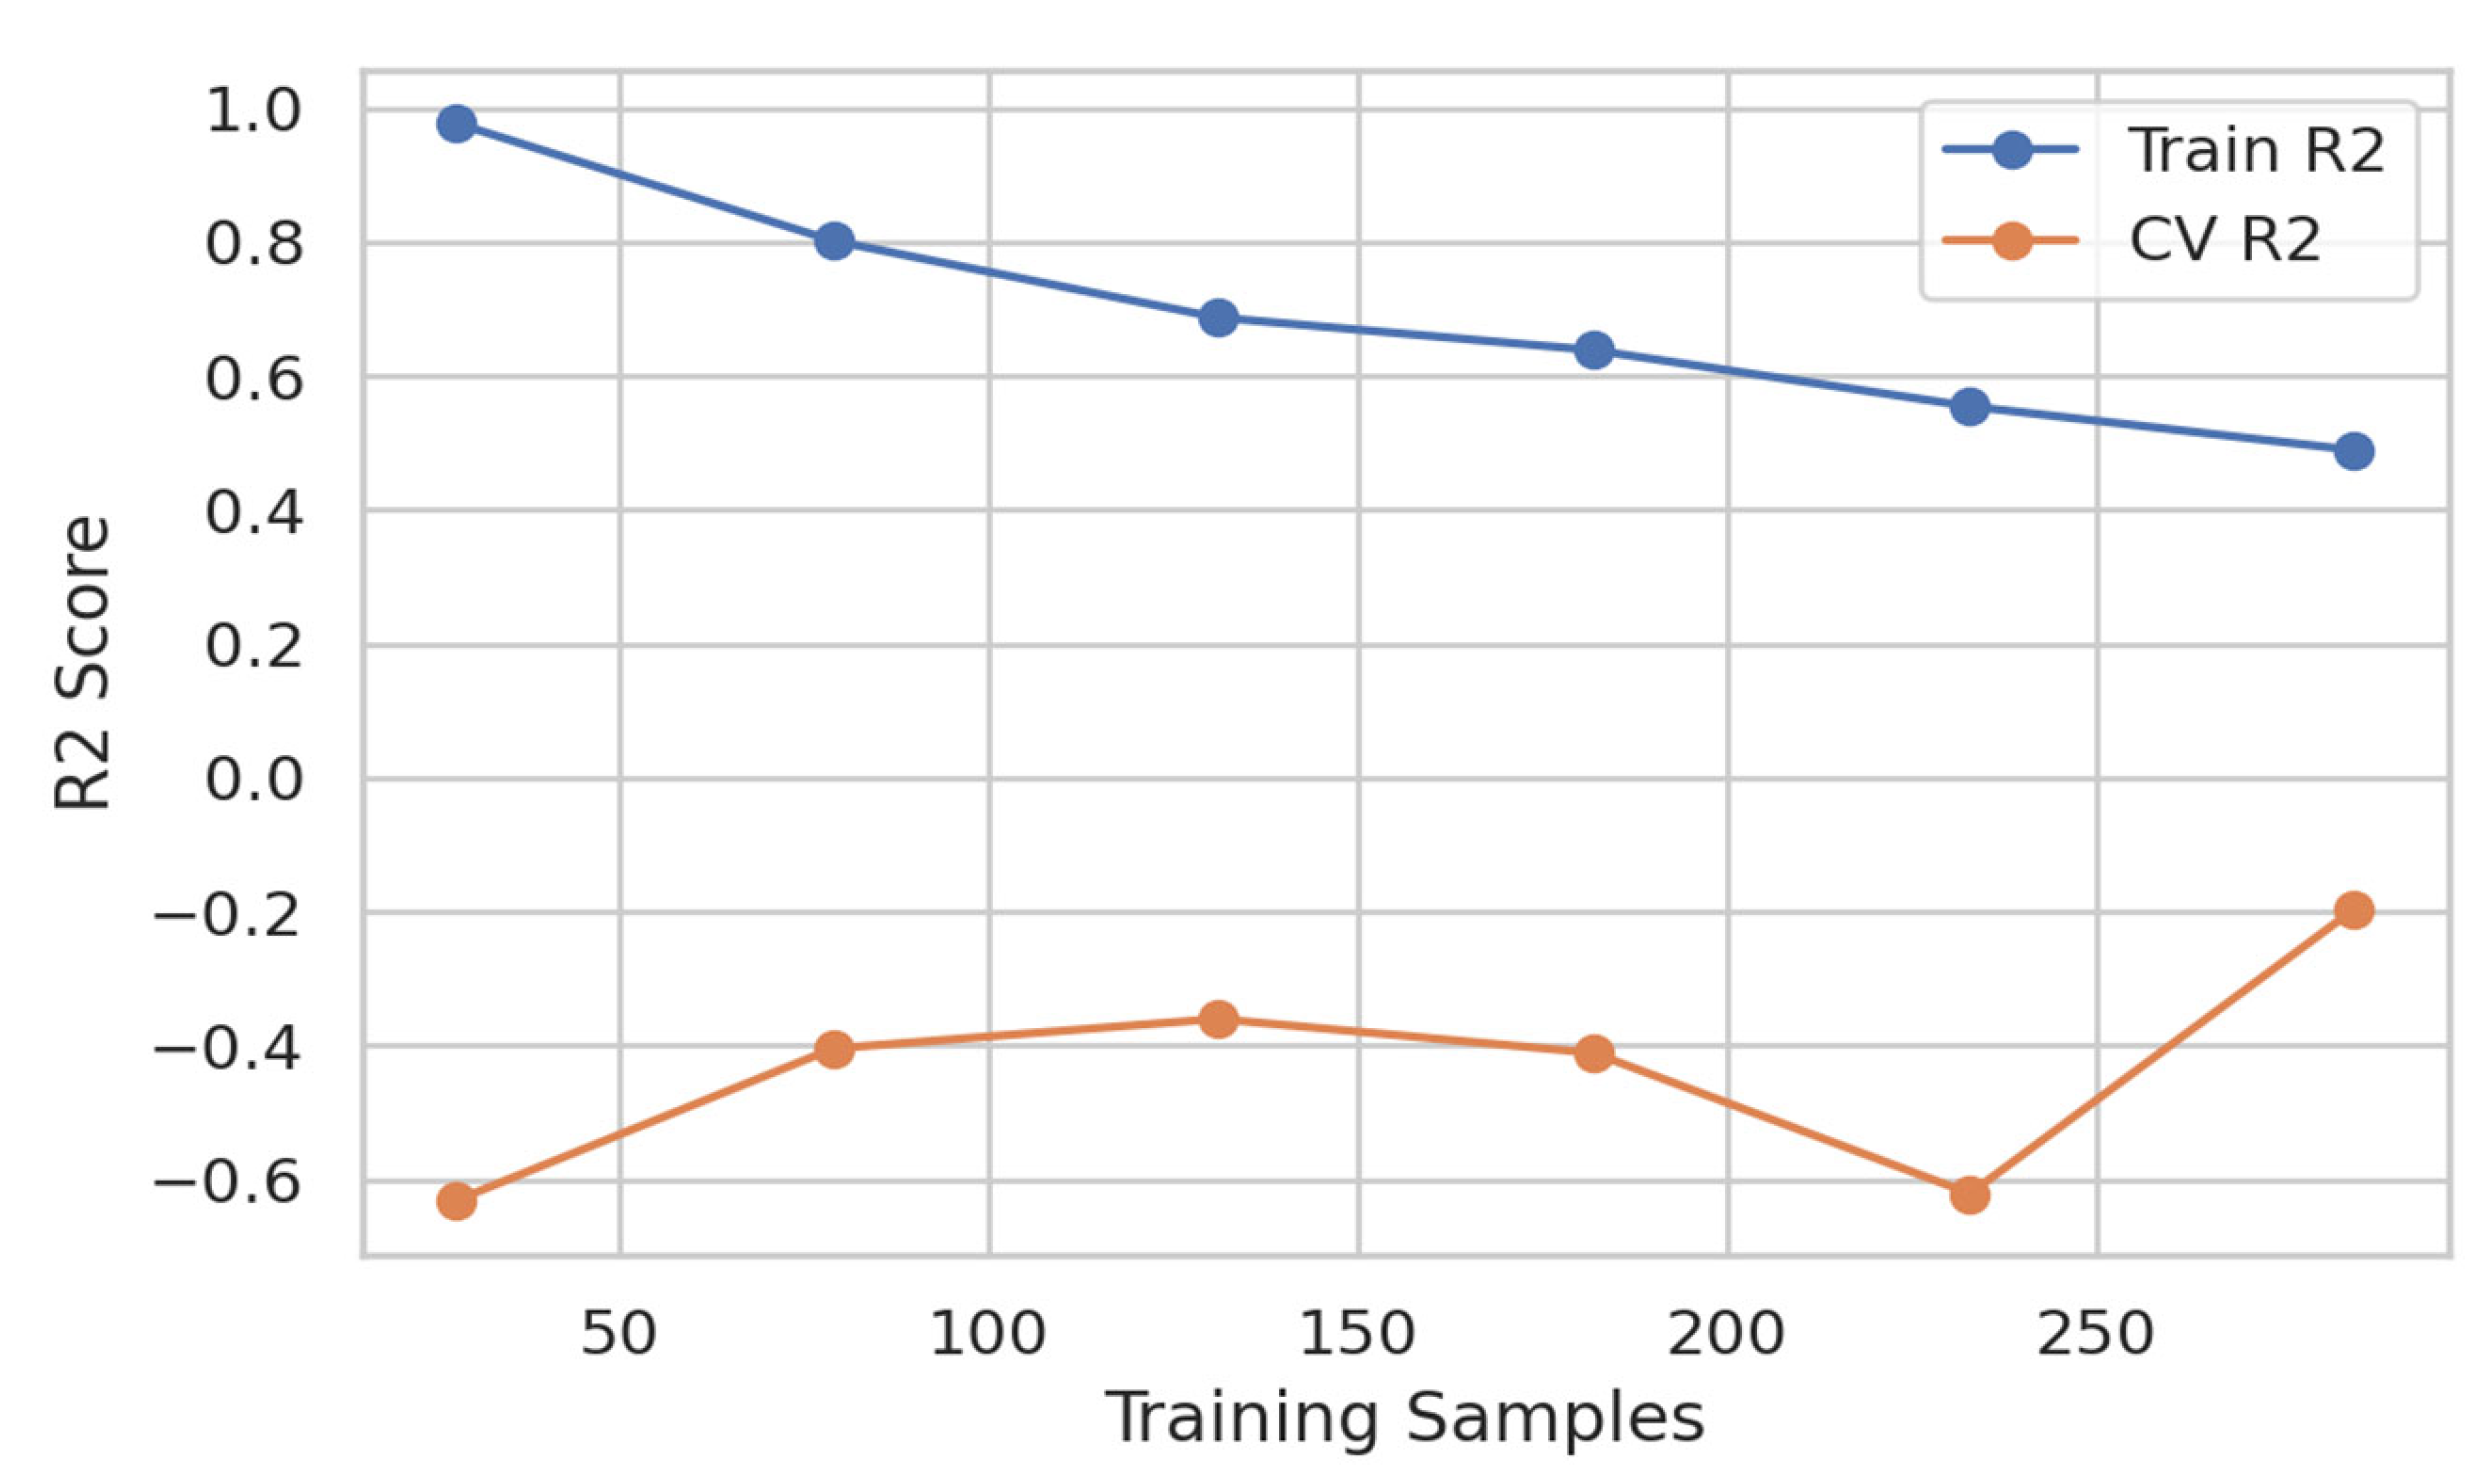
You can see the gap between the train and
CV curves (see
Figure 10), indicating the degree of variability/regularization, while the plateau of the
CV curve indicates a limitation of the data/model.
Training set R2 stabilizes near 0.82 after 500 iterations, while cross-validation (CV) plateaus at 0.64. The 0.18 gap indicates moderate variance and suggests that additional features (urban morphology, emissions) would reduce overfitting.
The SHAP analysis revealed that wind speed contributed ~41% to PM forecast variance, temperature ~23%, and cyclical time features (hour of day, month) ~19%. This confirms that both meteorological and anthropogenic cycles drive air quality in Almaty.
4. Discussion
The consistency between physical calculations and observed dynamics confirms the adequacy of surface layer parameterizations for an urban environment using MO theory. Detailing of Q sources and the urban canyon effect is limited to averaging, but even in this formulation, the model reproduces key ventilation regimes. The statistical module demonstrates a useful level of short-term forecasting, especially at shallow horizons, where autocorrelated predictors and cyclical features provide the best effect. The decline in quality by 24 h reflects changes in the synoptic situation, not fully captured by the set of local features. An important result is that the variability of suspended matter significantly depends on surface ventilation: an increase in wind speed by 1 m/s is associated with a decrease in the median concentration by 10–15% (according to regression estimates on aggregated intervals), which quantitatively correlates with solutions (5) with an increase in the convection effect and Kc. This finding aligns with independent studies in other mountain–valley cities such as Santiago de Chile and Kathmandu, where ventilation deficit was also identified as the primary driver of wintertime pollution accumulation.
Limitations include the lack of detailed emissions fields by block and street canyon configuration, which is particularly important for episodes of stagnation; the simplified, instantaneous parameterization of Λ, and the use of a station-averaged mode, while in reality, high spatial heterogeneity is observed. Nevertheless, the alignment of physical and statistical estimates increases confidence in the interpretations, and the hybrid scheme is well transferred between seasons.
Our results are comparable to recent hybrid CFD–ML studies. For example, authors of [
7] achieved
RMSE ~ 0.015 mg/m
3 for
PM forecasting in Sao Paulo, while our framework reached 0.012 mg/m
3 under complex mountain–valley conditions, demonstrating superior short-term accuracy. Unlike purely statistical models (e.g., ARIMA or standard gradient boosting), the inclusion of Monin–Obukhov turbulence parameters as features improved physical consistency and interpretability, particularly under winter inversion episodes.
Compared to existing hybrid or purely statistical studies, the proposed framework demonstrates a clear improvement in predictive accuracy and physical interpretability. For example, while standard gradient boosting and ensemble ML models for Almaty [
10] achieved R
2 ≈ 0.55 for particulate matter forecasting, our physics-informed hybrid model increased this value by 16% and reduced RMSE by approximately 25%. These gains are particularly evident during winter inversion episodes, confirming the model’s robustness under complex meteorological conditions. The explicit inclusion of Monin–Obukhov turbulence parameters within the Navier–Stokes formulation enhanced both the realism and the interpretability of results. Furthermore, the successful validation in Almaty suggests that the approach can be generalized to other mountain–valley cities such as Bishkek, Tbilisi, or Santiago, where inversion-driven air stagnation is a persistent issue.
Beyond numerical accuracy, the obtained results have significant scientific and environmental implications. The established quantitative link between near-surface ventilation and particulate matter concentrations confirms that meteorological stability and weak wind regimes are the primary drivers of pollution accumulation in mountain–valley cities. This finding aligns with the studies of Kamigauti et al. [
7] and Beucler et al. [
9], which emphasized the role of topography and thermal inversions in shaping local air quality. From an ecological perspective, the results highlight the necessity of integrating meteorological diagnostics into air-quality management systems, especially for regions like Almaty, where seasonal heating and traffic emissions dominate winter pollution episodes. The model outcomes can support the development of adaptive emission-control policies, dynamic traffic regulation, and public health risk communication strategies. Thus, the hybrid framework not only advances the theoretical understanding of boundary-layer processes but also provides actionable insights for sustainable urban environmental planning.
Comparable inversion-driven pollution dynamics have also been reported in Mexico City, reinforcing the broader applicability of the hybrid modeling approach.
The presented hybrid approach combines the physical consistency of the equations of motion and transport with the adaptability of machine-learning methods to local features of the urban atmosphere. A projection method for the Navier–Stokes equations with machine-learning parameterization allows for the correct consideration of stratification effects and the transition between stable and unstable regimes. At the data level, structure dispersion and gaps require careful preprocessing, but the presence of stable key columns (date, temperature, wind, suspended matter) ensured the viability of the ML pipeline. The novelty of the approach lies in the consistent use of physical calculations for the interpretation and stabilization of predictors (e.g., the use of calculated and Km as additional features) and the integration of regime classification (stable/unstable/neutral) into ML, which resulted in improved performance during winter episodes.
The practical significance lies in the fact that the proposed framework can be used quickly for short-term air quality risk assessment (nighttime inversion, light winds) and to support management decisions: limiting emissions during peak hours, reconfiguring traffic patterns, and issuing warnings to the public. Further improvement in accuracy requires consideration of the actual emission field, street canyon configuration, and interactions with regional transport.
It is important to emphasize that all numerical and machine-learning models inherently operate within a framework of predefined assumptions and simplifications. In our case, the Navier–Stokes equations are applied in the Boussinesq approximation, and turbulence is parameterized through Monin–Obukhov theory—both of which imply averaged and quasi-stationary conditions. Similarly, the ML component learns correlations based on available observational data and does not represent causality in the physical sense. Therefore, the presented hybrid simulations do not claim to reproduce reality in full detail but rather to approximate the key mechanisms of surface ventilation and pollutant transport with controlled uncertainty. This recognition of model limitations strengthens, rather than weakens, the study’s significance: it defines the realistic boundaries of applicability and ensures that the conclusions remain physically interpretable and scientifically transparent.
Several methodological extensions are envisioned to further enhance the robustness and interpretability of the proposed framework. First, explicit inclusion of emission inventories—covering traffic, residential heating, and small industrial activities—would improve the physical representation of pollution sources. Second, modeling the detailed street canyon geometry could capture stagnation and channeling effects under calm conditions. From the data-driven perspective, alternative architectures such as LSTM, ConvLSTM, or Temporal Fusion Transformers (TFTs) could better represent temporal dependencies and nonlinearities in pollutant dynamics. To address mild heteroscedasticity observed in residuals, logarithmic or robust target transformations may be applied. Finally, external validation using data from other years or neighboring cities (e.g., Bishkek, Tashkent) would confirm the generalizability and operational readiness of the hybrid model.
5. Conclusions
In this paper, we developed and implemented a hybrid approach to diagnostics and short-term forecasting of surface circulation and air quality in Almaty. This approach combines the Navier–Stokes equations in the Boussinesq approximation and machine-learning methods. The numerical solution was performed using a projection method with turbulence parameterization according to the MO theory; the statistical module is gradient boosting with lagged and cyclic features. Using 2024 data, the following key quantitative results were obtained (6 h horizon): wind speed RMSE ≈ 1.2 m/s (R2 ≈ 0.71), temperature RMSE ≈ 1.8 °C (R2 ≈ 0.78), and suspended matter RMSE ≈ 0.012 mg/m3 (R2 ≈ 0.64). As expected, accuracy decreases over a 24 h horizon (wind RMSE ≈ 1.7 m/s; suspended matter RMSE ≈ 0.017 mg/m3). The analysis revealed a strong relationship between surface ventilation and particulate matter concentration: an increase in wind speed by 1 m/s reduces the median concentration by 10–15% during nighttime hours in the winter months.
These conclusions are directly supported by the presented quantitative results, including the 10–15% reduction in particulate matter concentration associated with a 1 m/s increase in wind speed, as well as the 25% decrease in RMSE and 16% gain in R2 relative to baseline statistical models. The agreement between empirical findings, numerical simulations, and statistical metrics confirms the internal consistency and reliability of the proposed hybrid framework.
In contrast to previous statistical approaches, the hybrid model achieved up to a 25% reduction in RMSE and a 16% gain in R2, confirming the quantitative advantage of integrating turbulence physics with data-driven learning. This reinforces the model’s transferability and ecological relevance for inversion-prone mountain basins.
The results provide a direct answer to the research question posed in the introduction. The proposed hybrid framework successfully maintains the balance between physical coherence and statistical precision, offering interpretable and computationally efficient forecasts of urban air circulation and pollutant dynamics.
From a scientific perspective, harmonizing physical and statistical methods improves the robustness and interpretability of forecasts in urbanized valley conditions. Practical benefits include operational risk assessments and support for air quality management decisions. Future work plans to include real-world emission fields, account for urban canyon geometry and mesoscale transport, implement multi-step sequence models (LSTM/TFT), and integrate precipitation/radiation data.
In particular, integrating real-world emission inventories and remote sensing (Sentinel-5P, TROPOMI) will allow us to extend the hybrid framework from local monitoring sites to city-wide gridded forecasts, suitable for integration into Almaty’s environmental information system.
This study demonstrates that combining the Navier–Stokes equations with data-driven machine learning significantly enhances short-term forecasting of meteorological and air-quality dynamics in complex urban terrain. The hybrid model accurately reproduces diurnal ventilation patterns and identifies a clear negative link between wind speed and particulate matter concentration, confirming the crucial role of boundary-layer ventilation during winter inversions.
From a broader perspective, the research highlights the value of physics-informed artificial intelligence for cities with similar topographic and climatic constraints. The method balances interpretability, computational efficiency, and physical realism—features that can support environmental decision-making, emission-control strategies, and early-warning systems. The proposed framework is transferable to other mountainous or valley cities and provides a foundation for integrated urban air-quality management.
Overall, the research contributes to the broader field of environmental informatics by demonstrating that physics-informed machine learning can translate complex atmospheric dynamics into actionable insights for public health and city management. The hybrid model provides a conceptual and computational platform that can be extended to other environmental domains—such as heatwave prediction, flood risk assessment, or urban ventilation design—thus offering a foundation for intelligent environmental monitoring systems.
The main value for readers is twofold. Scientifically, the approach maintains physical coherence (mass conservation, stratification effects, turbulence parameterization) while leveraging data-driven patterns only where they add skill. Practically, the forecasts and diagnostics support early warning and near-term interventions—e.g., dynamic traffic or heating-related emission measures and targeted public health messaging during anticipated stagnation nights.
The workflow is transferable beyond Almaty to cities with similar topography (e.g., Bishkek, Tbilisi, and Santiago), requiring only local observations and routine re-tuning. Future enhancements will incorporate explicit emission inventories and urban-canyon geometry and evaluate sequence models to refine multi-step predictions. Overall, the hybrid design provides a clear, generalizable template for integrating physics-aware modeling with ML to inform urban air-quality management in complex terrain.
In summary, the study fills a crucial gap between physically grounded but computationally intensive CFD models and purely statistical methods by offering a hybrid, interpretable, and efficient framework. This originality makes the approach particularly relevant for cities with complex topography and frequent inversion-induced pollution episodes.
Future research will focus on refining the emission representation, integrating urban-geometry effects, testing recurrent and attention-based ML architectures, and performing multi-city validation to strengthen model generalizability.
