Article

Noninvasive Left Ventricular Pressure–Volume Loops Based on Combined 4D Flow MRI and CFD

1
Department of Radiology, Leiden University Medical Center, Albinusdreef 2, 2333ZA Leiden, The Netherlands
2
Faculty of Mechanical Engineering, Delft University of Technology, Mekelweg 2, 2628CD Delft, The Netherlands
3
Department of Radiology, Catharina Hospital Eindhoven, Michelangelolaan 2, 5623EJ Eindhoven, The Netherlands
4
Department of Cardiology, Catharina Hospital Eindhoven, Michelangelolaan 2, 5623EJ Eindhoven, The Netherlands
5
Department of Biomedical Engineering, Technical University Eindhoven, Theodor Fliednerstraat 2, 5631BN Eindhoven, The Netherlands
6
Department of Chemical Engineering, Faculty of Applied Sciences, Delft University of Technology, Van der Maasweg 9, 2629HZ Delft, The Netherlands
7
Delft Institute of Applied Mathematics, Delft University of Technology, Mekelweg 4, 2628CD Delft, The Netherlands
*
Author to whom correspondence should be addressed.
Appl. Sci. 2025, 15(22), 12305; https://doi.org/10.3390/app152212305
Submission received: 24 October 2025 / Revised: 16 November 2025 / Accepted: 18 November 2025 / Published: 20 November 2025

Abstract

A novel approach to generate left ventricular (LV) pressure–volume (PV) loops from combined 4D Flow MRI and computational fluid dynamics (CFD) is presented. Pressure was calculated from person-specific three-dimensional (3D) CFD models created from LV segmentations and peak-systolic pressure from the one-dimensional 111-artery CFD model, with aortic flow from 4D Flow MRI as input. Ten healthy volunteers underwent scan–rescan MRI. Additionally, one patient without cardiovascular abnormalities underwent MRI and invasive catheter measurement for single-case comparison. Scan–rescan reproducibility was very good overall, with no significant differences in any parameters and ICCs of all parameters but minimum pressure were significant and high (0.55–0.99). Aortic flow of 3D CFD model correlated well with 4D Flow (ICC = 0.74) and stroke volume of LV segmentation (ICC = 0.90). Segmentation volume variability resulted in 12% difference in stroke work and mean external power, while aortic flow variability resulted in 10–11% difference in most parameters. Single-case comparison is promising, with only 1.8 mmHg and 0.005 mmHg/mL difference in minimum pressure and EDPVR, and <10% differences for other parameters. Noninvasive pressure–volume loops can therefore reproducibly be generated from only aortic flow, cine short axis MRI, and brachial pressure measurement. Single-case comparison shows promise, but larger validation studies are needed.

1. Introduction

Cardiovascular diseases continue to be a leading cause of mortality worldwide, accentuating the need for accurate and reliable tools in the assessment of cardiac function [1]. An important relationship that describes cardiac function is the dynamic relation between the intra-chamber pressure and chamber volume. Over one cardiac cycle, the plotted pressure–volume curve forms a closed loop, i.e., the pressure–volume (PV) loop. This curve stands out as a valuable tool, providing comprehensive insight into the cardiac mechanics and hemodynamics [2]. By plotting pressure against volume, PV loops provide clinicians an exhaustive representation of left ventricular performance, enabling the diagnosis and management of various cardiovascular conditions. Consequently, PV loops have become a valuable tool in both clinical and research setting, serving as a foundation in the evaluation of cardiac function [2,3].
Despite their utility, the widespread adoption of PV loops has been hindered by the invasive nature of traditional catheter measurement to assess intra-chamber pressure, which involves risks such as infection, bleeding, and thrombosis [4]. Besides posing potential harm to the patients, these associated risks limit the feasibility of repeated measurements and therefore longitudinal studies. Furthermore, the invasive nature of this procedure can be prohibitive, especially for critically ill individuals, or the risks may not outweigh the benefits for less critically ill patients [4]. Thus, while PV loops offer unparalleled insights into cardiac physiology, the associated risks underscore the urgent need for noninvasive alternatives.
In recent years, advancements in medical imaging and computational modeling have paved the way for noninvasive approaches of PV loop generation, which may solve the challenges. By integrating computation fluid dynamics (CFD) and three-dimensional three-directional velocity encoded time-resolved phase-contrast magnetic resonance imaging, also called 4D Flow MRI, a novel method for patient-specific noninvasive PV loop generation is presented in this study. This innovative approach holds immense potential for offering clinicians a safer and more approachable technique of evaluating cardiac performance.
4D Flow MRI is an MRI technique that allows comprehensive and accurate assessment of flow in all spatial directions and over time [5]. It is acquired in a single acquisition and has become a valuable noninvasive tool for the clinical cardiovascular setting. 4D Flow MRI provides access to various hemodynamic parameters (e.g., arterial wall shear stress, valvular flow and regurgitation, vorticity and turbulent flow, hemodynamic forces) that have proven value in the identification of pathophysiological processes [6,7].
In this investigational study, we hypothesized that PV loops can be reproducibly and accurately generated using a noninvasive CFD and 4D Flow MRI-based approach. Specifically, we describe a scan–rescan investigation and an initial single-case comparison study to evaluate reproducibility and accuracy, thereby establishing the technical utility and estimating clinical utility of this novel approach for assessing cardiac performance.

2. Materials and Methods

An overview of the methodologies is illustrated in Figure 1.

2.1. Acquisition

Ten healthy volunteers aged 24 ± 3 years (70% male) underwent MRI scanning twice with repositioning in between. No dietary restrictions were instructed. The entire scan protocol was performed in both sessions and included 2-chamber (2Ch), 4-chamber (4Ch), and short-axis cine scans (SAx), as well as perpendicular cine scans through the aortic annulus and a whole heart 4D Flow MRI scan. The 4D Flow MRI was respiratory gated through navigator gating of the hemidiaphragm, using a weighted gating protocol that started with a 6 mm window and extended to 25 mm after 25% of data was acquired. Because a CENTRA spiral readout was used, this 25% of data included the center of k-space. Scanning was performed on a 3T MRI scanner (Elition, Philips Healthcare, Best, The Netherlands) with software release 5.6. Scan parameters are given in Table 1. Directly after each scan session, brachial pressures were measured in the left arm while the participant was still lying supine on the MRI table.
One male patient without cardiac and aortic abnormalities underwent invasive catheter measurement of left ventricular pressure throughout multiple cardiac cycles as part of the SAVI-AoS study, as well as the same MRI protocol as the healthy volunteers but without rescanning [8].
The study was conducted in accordance with the Declaration of Helsinki and was approved by the Medical Ethics Committee Leiden The Hague Delft (P18.034) and all participants gave informed consent. The one included patient received the examinations as part of the SAVI-AoS study and gave informed consent for use of his clinical data.

2.2. Data Analysis

Left ventricular endocardial contours were delineated manually on the SAx cine scans by one researcher (PRR) with over 3 years of CMR experience. CAAS MR Solutions 5.1 (Pie Medical Imaging B.V., Maastricht, The Netherlands), which included a segmentation export function and semi-automatic segmentation tools, was utilized. Segmentation was performed on ten of the thirty cardiac phases, equidistant in time, for later inherent temporal smoothing of the contours. This smoothing was required, as small variations in the segmentation between phases result in a jitter that has exemplified inaccuracies in the CFD. Other temporal shape smoothing methods were not technically feasible at the time. The contours were exported and subsequently post-processed using in-house developed scripts based on the open-source Vascular Modelling Toolkit (VMTK), which included smoothing the surface and creating a circular extension of the left ventricular outflow tract [9]. The resulting 3D models of LV were used for meshing for the time-dependent three-dimensional CFD model.
Whole heart 4D Flow MRI data were analyzed using CAAS MR Solutions 5.2 (Pie Medical Imaging B.V., Maastricht, The Netherlands). Perpendicular aortic annulus cine scans were used for semi-automatic tracking of the aortic valve based on landmark detection, as was performed similarly for the mitral valve with the 2-chamber and 4-chamber cine scans [10]. The contours of the annulus were subsequently delineated in the plane derived from the valve tracking, enabling the calculation of aortic and mitral valvular flows.
LV volumes were measured with SAx segmentation, which is a clinically used measurement that is already well established [11,12]. These volume measurements were compared with volumes derived from PV loops.

2.3. One-Dimensional 111-Artery CFD Model (1D CFD)

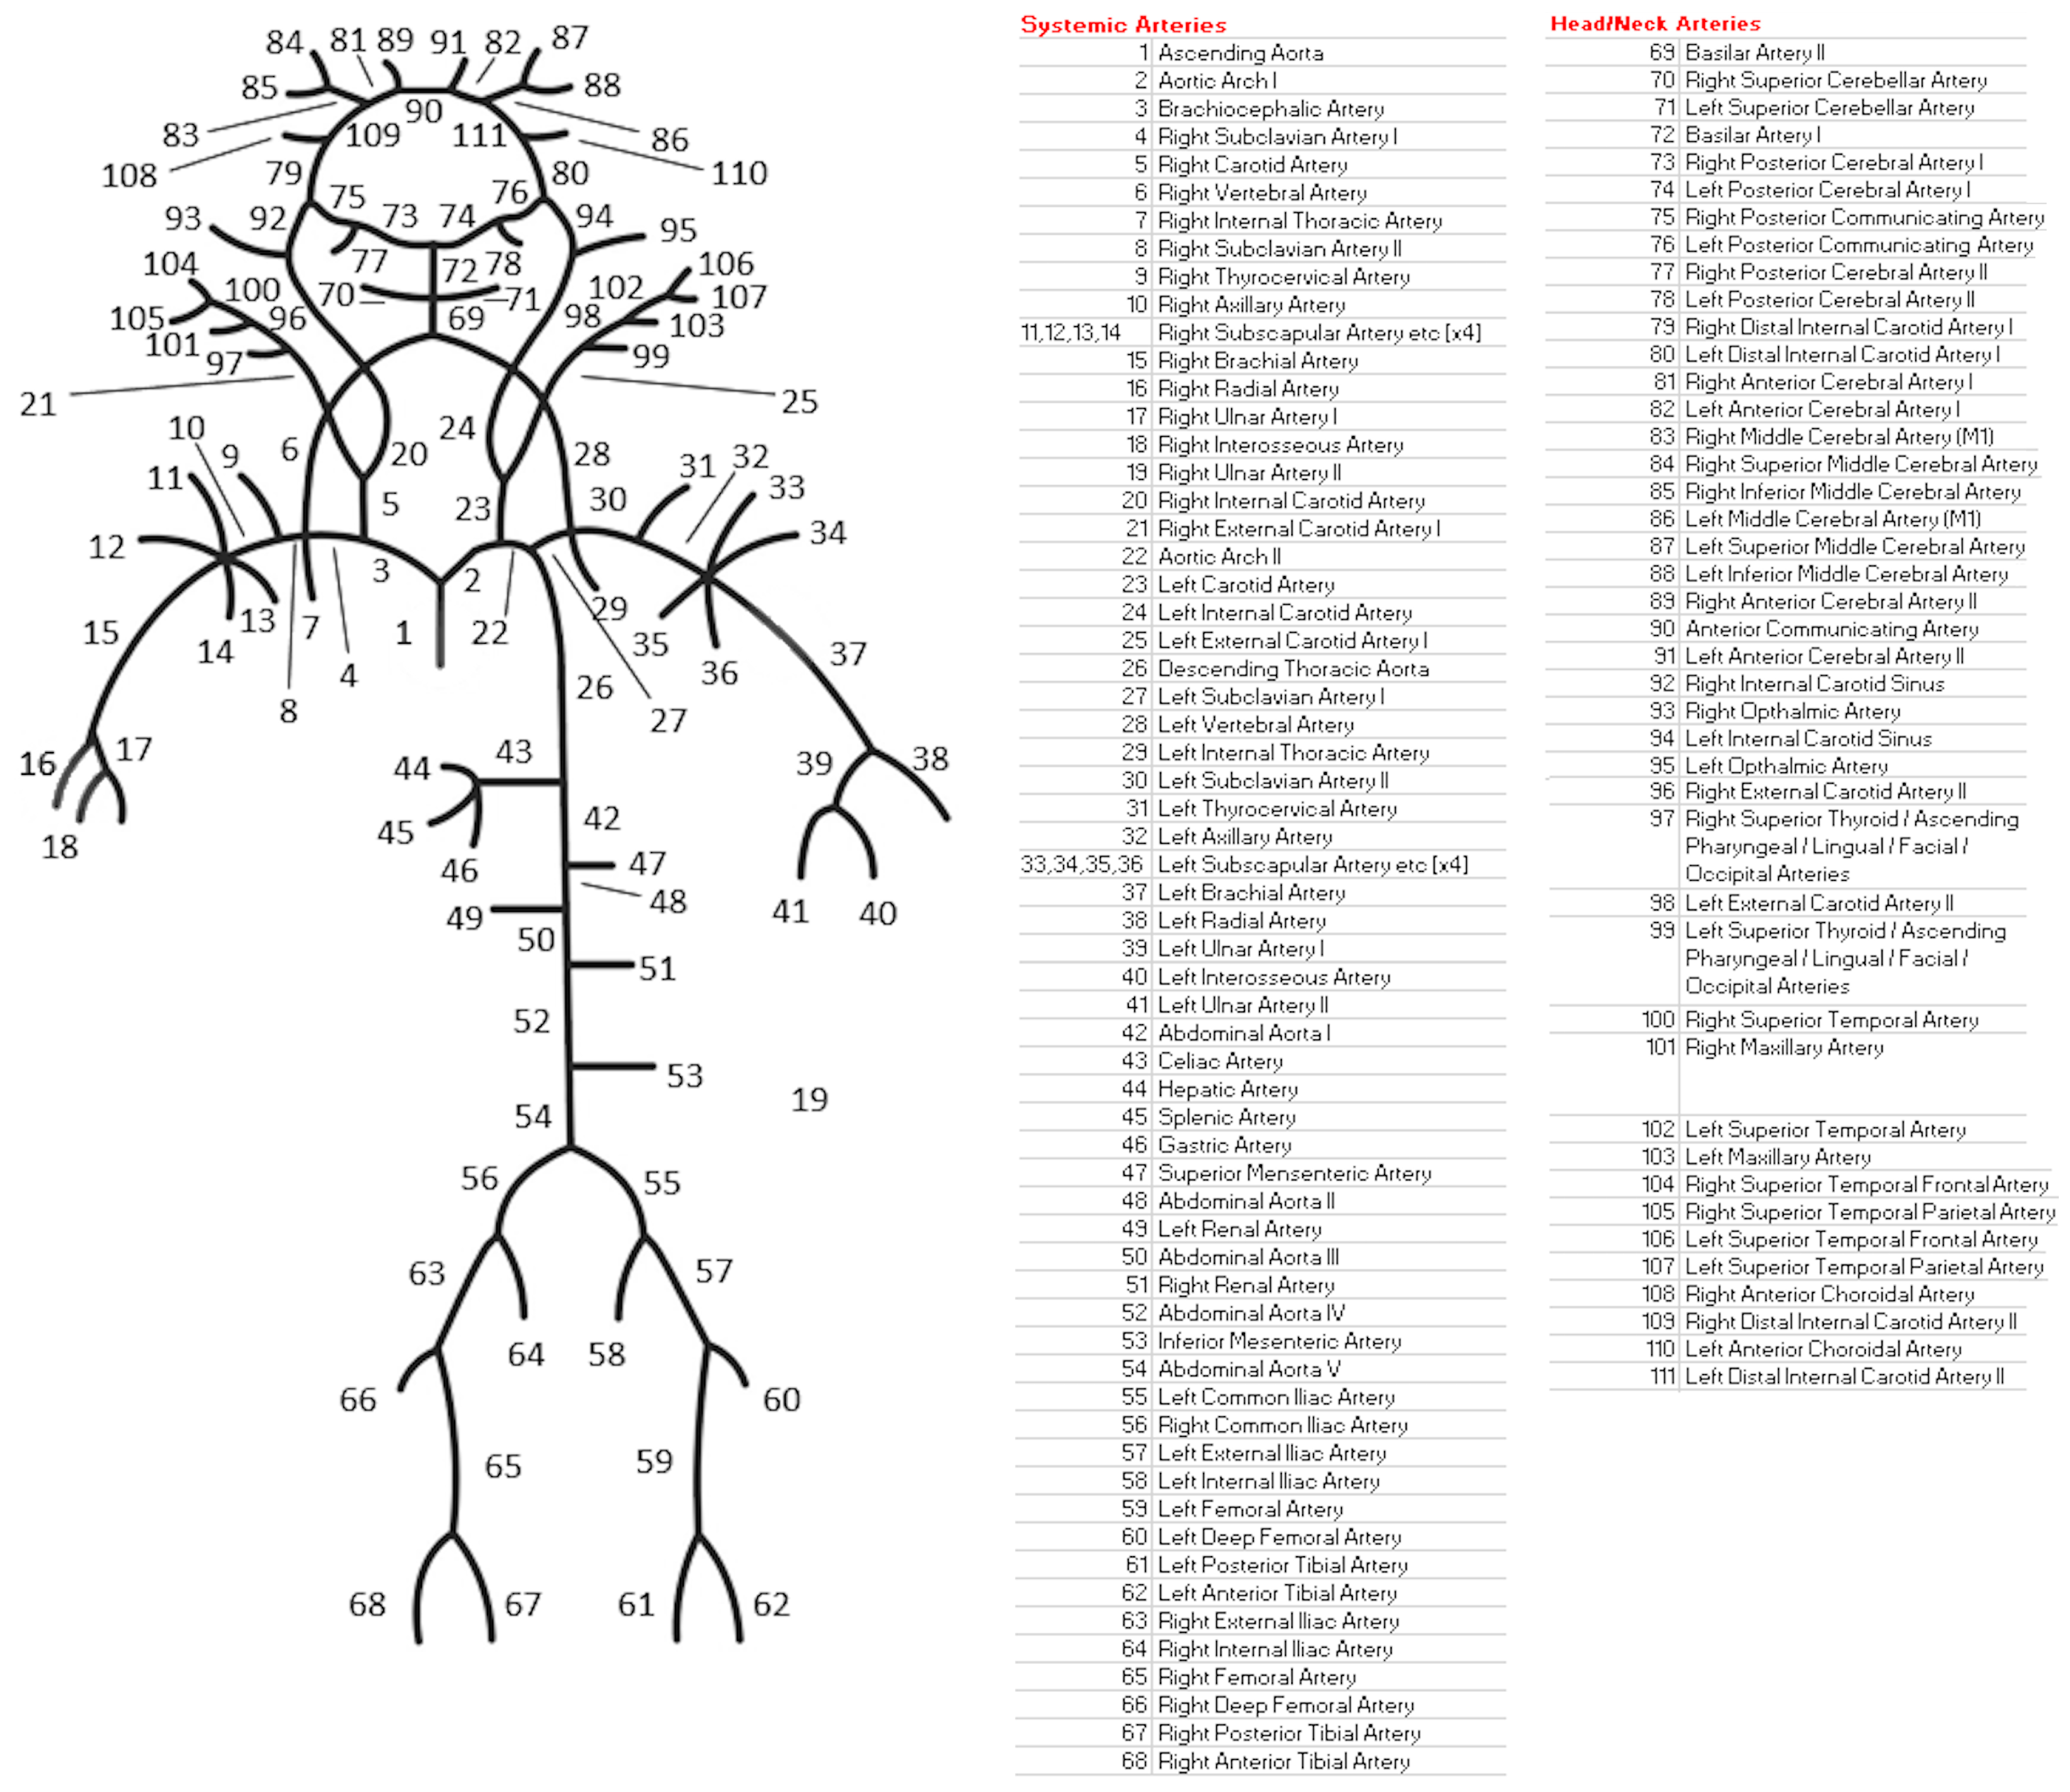
The aortic flow and annulus area, together with the brachial pressures, were used to scale and initialize a one-dimensional (1D) artery model. This one-dimensional CFD model that describes blood flow and pressure propagation through 111 compliant arterial blood vessels is based on the physical laws of conservation of mass and momentum. It is used to model the peak aortic pressure accurately, which is necessary to initiate the left ventricular 3D CFD (see section below). Methodologies on this 1D CFD are given in Appendix A. The coupling between the left ventricular 3D CFD and the 111-artery 1D CFD is obtained by extracting the pressure in the aortic root from the 1D CFD and increased by 5 mmHg to approximate the left ventricular pressure, which was then imposed as a boundary condition in the 3D CFD simulations [13].

2.4. Four-Dimensional Left Ventricular CFD Model (3D CFD)

In contrast to the one-dimensional CFD model, the time-dependent 3D CFD solves all three velocity components and the pressure field in the left ventricle. Here we applied the Arbitrary Lagrangian–Eulerian (ALE) form of the conservation of mass and momentum in moving geometries, which can be written as follows:
t V ρ d V + S ρ v v b · n d S = 0
V t ρ v d V + S ρ v v b · n d S = S p I ̿ · n d S + S τ ̿ · n d S
where V is the volume and S the surface of the discretized control element, n is the normal vector, v b is the velocity of the mesh movement, I ¯ is the unit tensor, and τ ̿ = μ v + v T is the viscous stress tensor (where T indicates transposition).
The end-diastolic 3D model, which was derived from SAx MRI segmentation, was utilized to generate a tetrahedral mesh with approximately 150,000 elements using Ansys ICEM software 2024 R2 (ANSYS, Inc., Canonsburg, PA, USA). Subsequently, an in-house developed algorithm employing radial basis functions (RBF), based on open-source Python Geometrical Morphing package 2.0.3 (PyGem), facilitated temporal interpolation of the mesh at a resolution of one millisecond [14,15,16,17]. This consisted of an automatic selection of 100 control points on each of the ten 3D LV models and deforming the mesh surface based control point movement utilizing a multi-quadratic biharmonic spline with a radius of 0.0041 m. Shape interpolation was visualized and underwent visual inspection prior to further analysis to ensure an error-free smooth shape motion was achieved.
A subject-specific 3D CFD model of the left ventricle was developed by employing Ansys FLUENT 23.1 (ANSYS, Inc., Canonsburg, PA, USA). Input and output boundary conditions were 13,300 Pa (10 mmHg) and peak aortic flow + 5 mmHg from 1D CFD. The simulation was run with a K-ω SST turbulence model and a pressure-based solver with SIMPLE pressure-velocity coupling. Spatial discretization was least squares cell-based for gradient, second order for pressure and second order upwind for momentum. Table A1 contains further details of the 3D CFD model. A steady-state simulation of the 3D CFD model was conducted until convergence (residuals < 1 × 10⁻⁴, Table A1), whereupon it was succeeded by a transient simulation encompassing five cardiac cycles. 3D CFD simulations were executed on a computer cluster outfitted with a minimum of sixteen threads, thereby facilitating parallel computing of the simulations, and computation of multiple simulations concurrently. Volume-averaged pressure was calculated at each timestep.
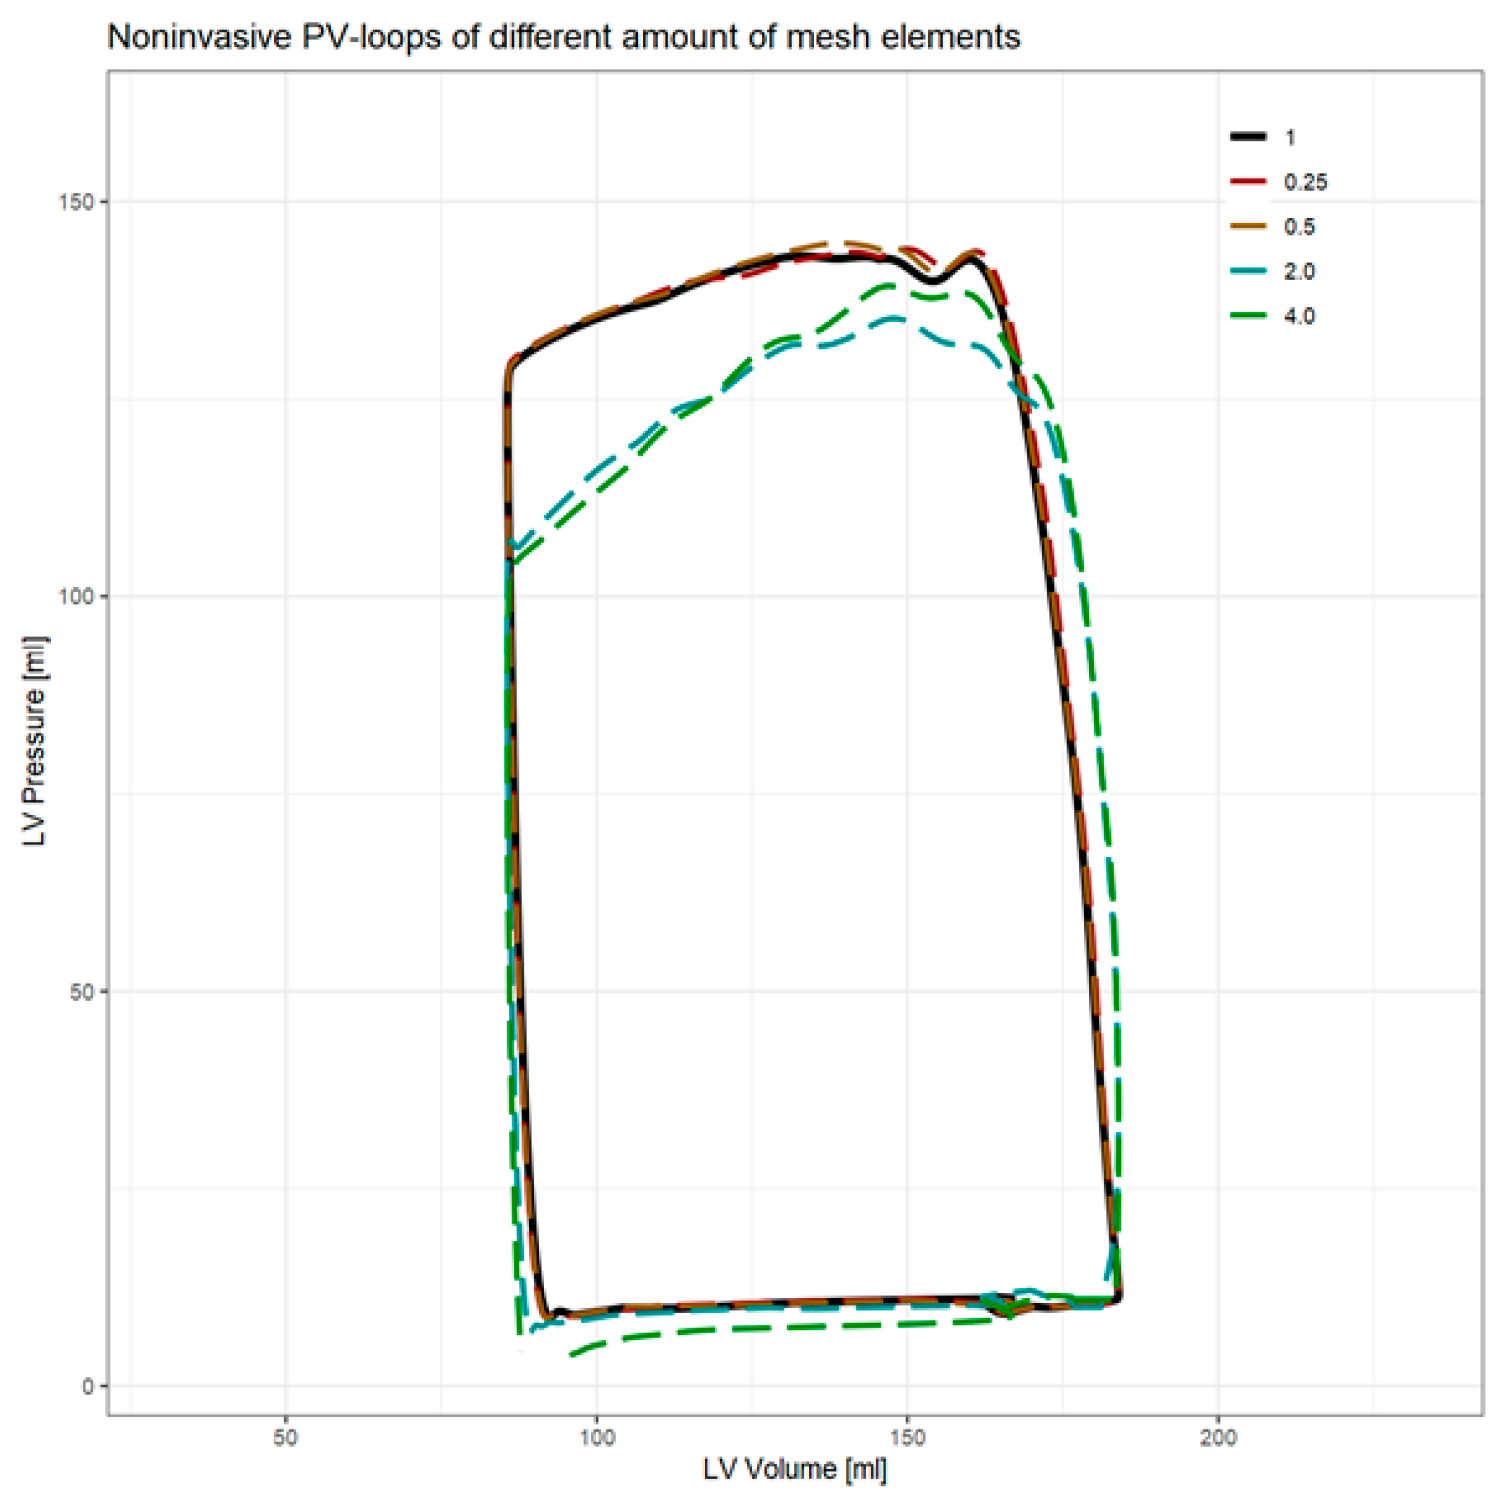
A mesh-independency study was performed on one of the healthy volunteer datasets by changing the number of elements by a factor of approximately 0.25, 0.5, 2, and 4. Differences in pressure–volume loops analysis and computation time were assessed.

2.5. Pressure–Volume Loops Analysis

The pressure data from all five cardiac cycles computed by the 3D CFD models were visually inspected for artifacts, and the first cycle absent of artifacts was chosen. Subsequently, the pressure values from this chosen cycle underwent smoothing with a Savitzky–Golay filter (window size 10 ms) to mitigate small fluctuations, with any residual artifacts, such as abrupt spikes or a small mismatch between start and end pressure, being rectified using linear interpolation where necessary [18]. Following this preprocessing, the pressure–volume relationship was visualized, and a comprehensive analysis of key parameters was conducted: maximum pressure, minimum pressure, end-diastolic pressure–volume relationship (EDPVR), end-systolic pressure–volume relationship (ESPVR), end-diastolic volume (EDV), end-systolic volume (ESV) and stroke volume (SV) were measured. EDPVR and ESPVR require the LV volume at zero LV pressure, which was assumed to be zero as based on the existing literature [19,20]. Stroke work (SW), the area enclosed by the PV loop, is the external work conducted by the myocardium to eject blood. Together with the mechanical potential energy (PE), which is the internal energy needed to overcome to eject blood, SW forms the entire PV area (PVA), which is equal to the mechanical energy consumption during a single heartbeat and is proportional to oxygen consumption of the myocardium [21]. Ventricular efficiency (VE) was calculated as SW divided by PVA. LV mean external power (MEP) was calculated as SW multiplied by heart rate divided by 60 [22]. Lastly, energy per ejected volume (EEV) was calculated as PVA divided by SV. A parallel analysis was conducted on the invasive catheter pressure measurement obtained from the included patient, employing a similar methodology of extracting the pressure data, post-processing together with the volume data, and analyzing the final PV loop parameters.

2.6. Variability

As the 3D CFD models, and thereby the final PV loops and parameters, depend on common MRI measurements, the PV loops are subject to variations occurring in these measurements, including in-scan and scan–rescan variability. SAx segmented volume has been reported to have an average inter- and intra-observer variability of around 7% and a scan–rescan variability of around 4–7% [23,24]. 4D Flow MRI manual valve tracking-based net forward volumes variation has been reported at 9.8% and automatic valve tracking variation at 4.9% [10]. To assess the effects of the variability of these underlying techniques on the PV loops, the beforementioned methods were applied to datasets with segmentations that were either increased or decreased by 7% and to datasets with aortic flow that were either increased or decreased by 9.8%. Segmentation scaling was performed by scaling each dimension with the cubic root of 1.07 for a 7% overall volume change, while aortic flow was increased or decreased by a single-factor scaling.
In the patient, multiple beats from the invasive pressure measurement were assessed. Variations in beat-to-beat maximum and minimum pressure were analyzed.

2.7. Statistical Analysis

RStudio 2024.04.0 with R 4.3.1 was used for statistical analysis [25,26]. p-values of less than 0.05 were considered statistically significant. Differences between PV loop parameters are assessed with paired sample t-tests and Bland–Altman plots. Intraclass correlation (ICC) between scan and rescan PV loop parameters are calculated as single rater absolute agreement with a two-way random effects model. Where applicable, means, standard deviations, and p-values are given.

3. Results

3.1. Computational Fluid Dynamics

Preprocessing, including segmentation, valve tracking analysis, 1D CFD analysis, 3D model preparation, mesh generation, and 3D CFD setup took approximately 4 h per CFD simulation. Actual 3D CFD simulation calculation time was on average 15 min (±10 min) for steady-state simulation and 11 h (±4 h) for transient simulation, which depended on the amount of mesh elements (thereby LV size), the amount of timesteps (thereby heart rate) and the availability of computation power. The average amount of mesh elements was 135,000 (±57,000 elements).
Decreasing the amount of mesh elements of the 3D CFD by a factor of 2 or 4 resulted in minor changes in PV loop parameters (<1%) (Figure A2 and Table A2). Increasing the amount of mesh elements resulted in an increase in timesteps with non-convergent solutions and therefore major changes (>4%) in PV loop parameters. The number of iterations per timestep in the transient simulation remained 100. Repeating a 1D or 3D CFD simulation achieved no different results, both in outcomes and computation time.
Pressure values were assessable on most cycles, but the second or third cycle was assessed in all ten volunteer cases. The first cycle often contained an initial inaccuracy that was absent in the other cycles, while the fourth and fifth cycle showed increasing instabilities in some cases.

3.2. Scan–Rescan in Healthy Volunteers

No abnormalities were found in the scanned data. Volunteers were on average 24 ± 3 years old, 70% male, and weighed on average 71.6 kg (±12.9 kg). None had a history of heart conditions, nor any symptoms during or around time of scanning. Heart rate was significantly lower (−5.1%, p = 0.001), while SV (26%, p < 0.001) and cardiac output (20%, p = 0.008) were significantly higher in 4D Flow MRI compared to short axis. Scan–rescan ICCs were high and significant for short axis heart rate (0.92, p = 0.006), short axis SV (0.77, p = 0.003), short axis CO (0.79, p = 0.001), 4D Flow MRI heart rate (0.97, p < 0.001), 4D Flow MRI SV (0.95, p < 0.001), and 4D Flow MRI CO (0.89, p < 0.001). ICCs of brachial blood pressure measurements were also high and significant for systolic (0.65, p = 0.012), diastolic (0.83, p = 0.001), and mean arterial pressure (0.78, p = 0.002). Mean scan–rescan variation in mean arterial pressure was 4.9%.
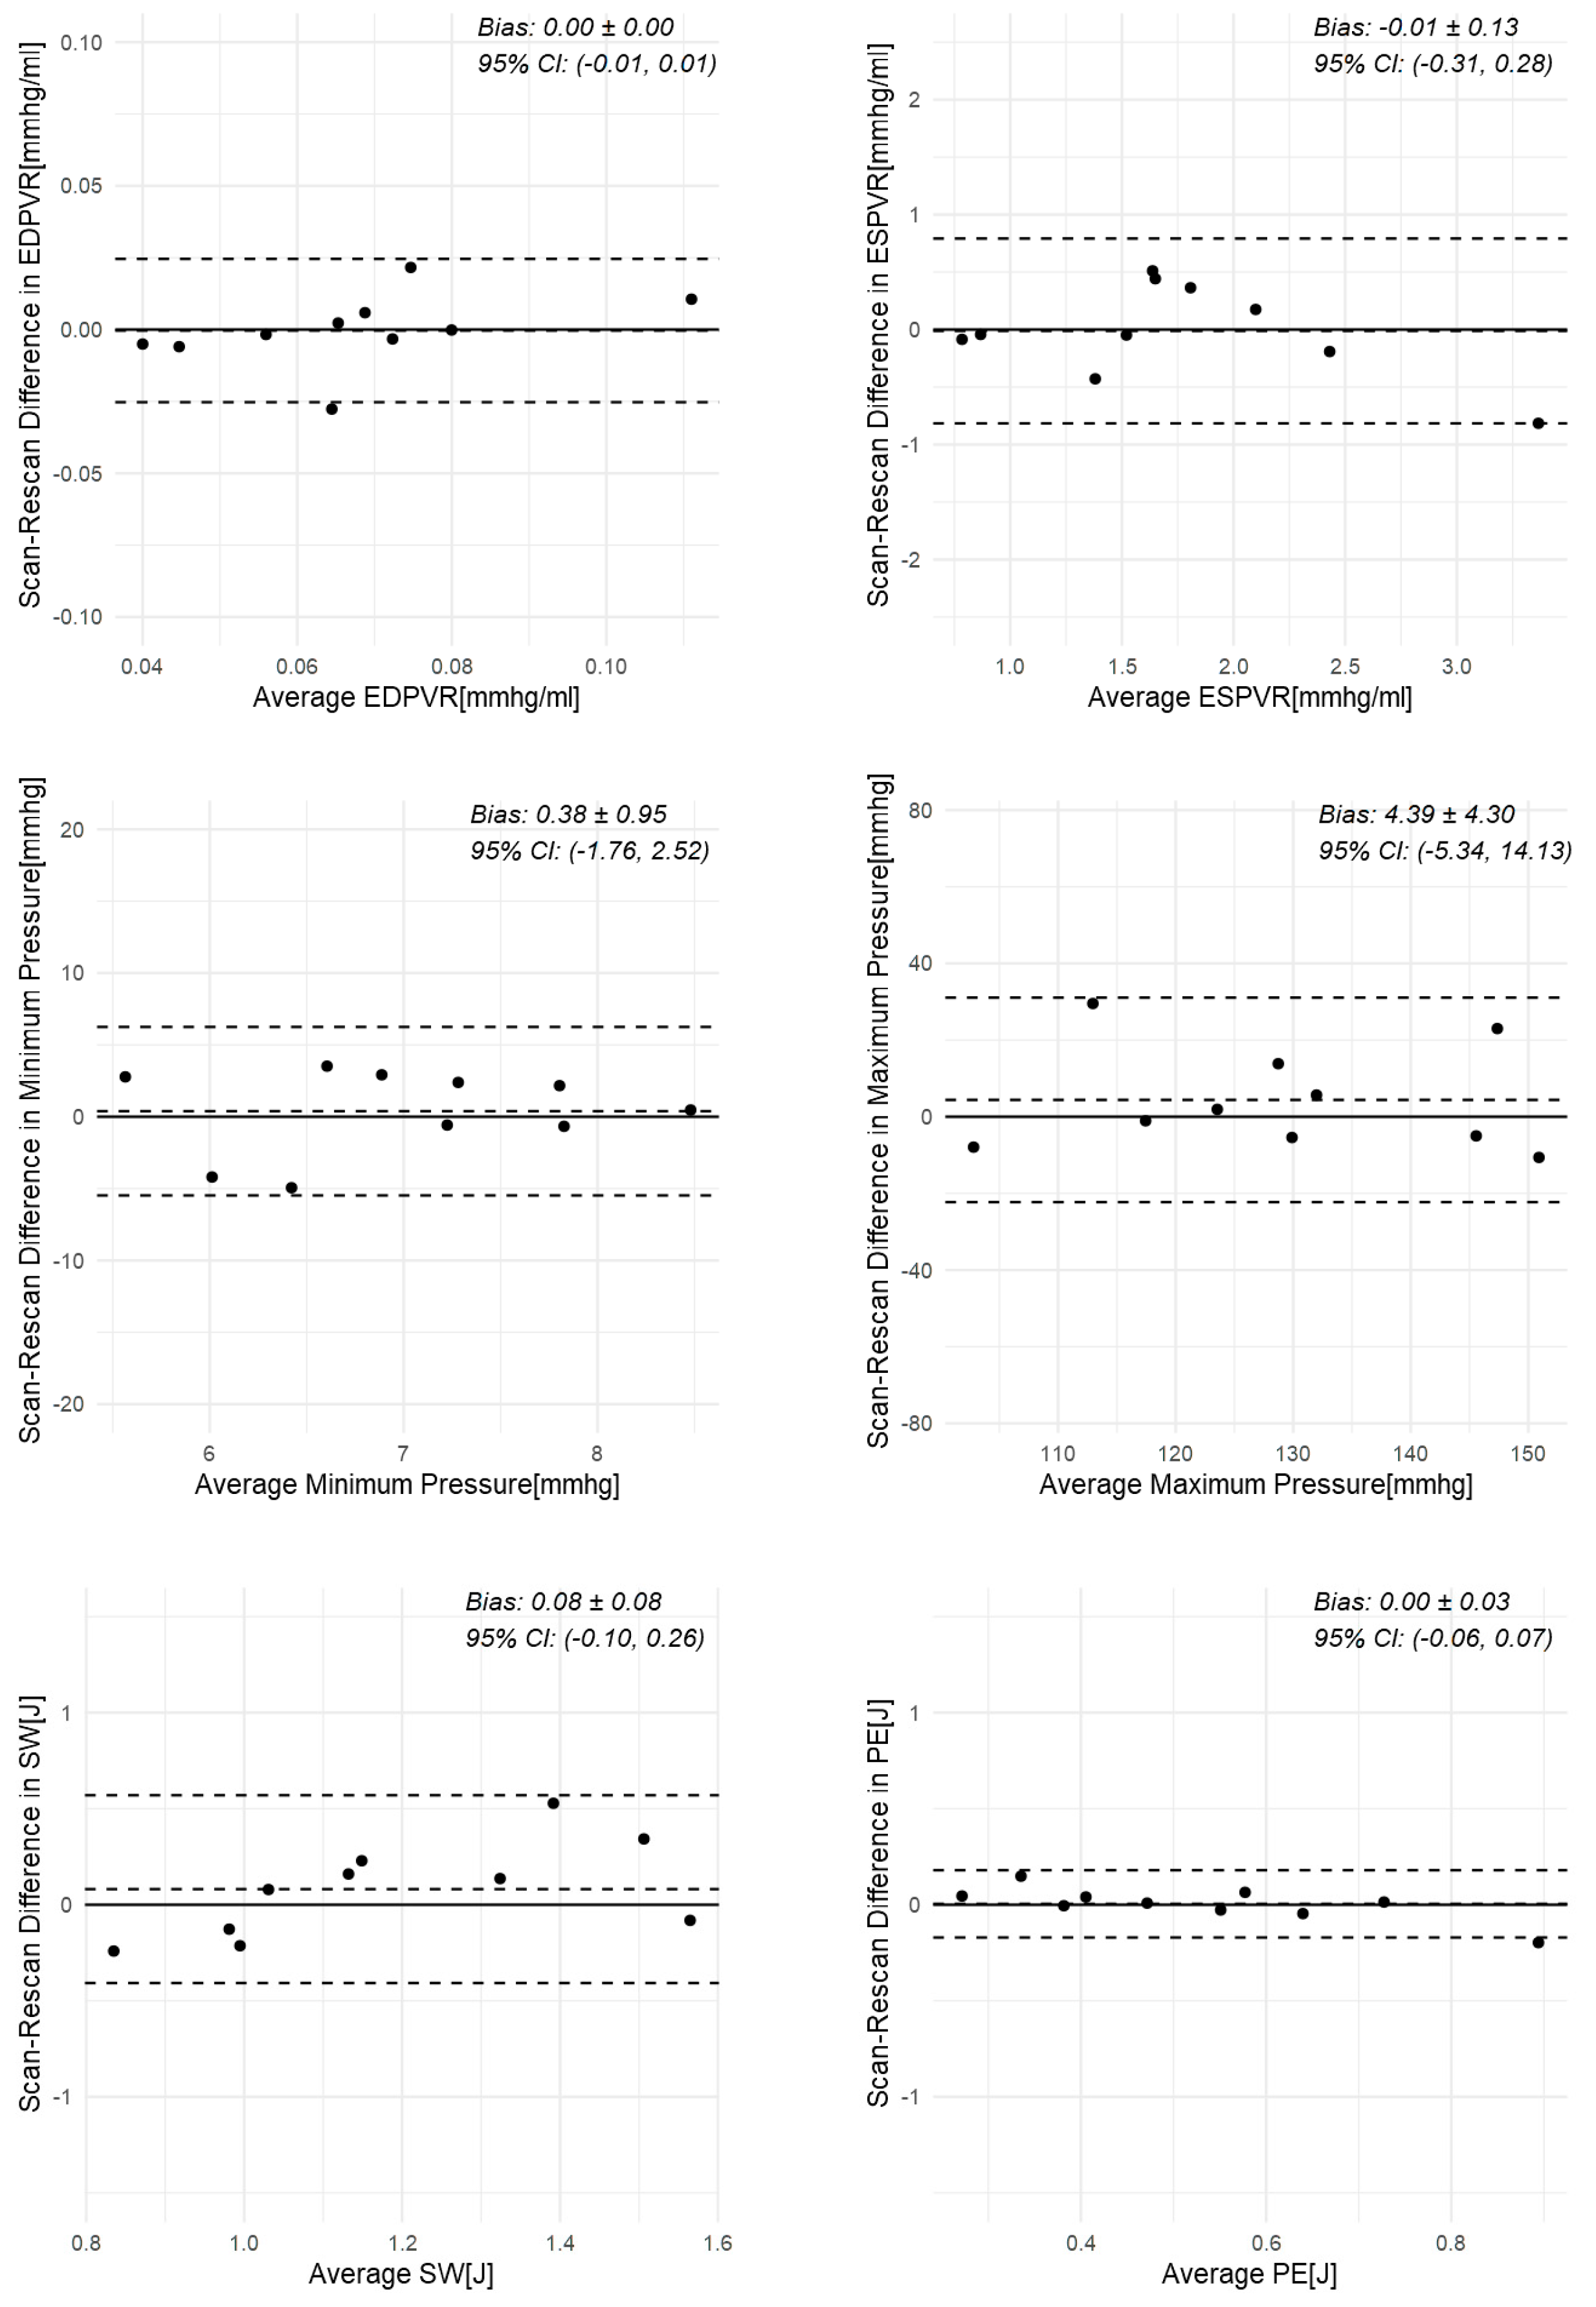
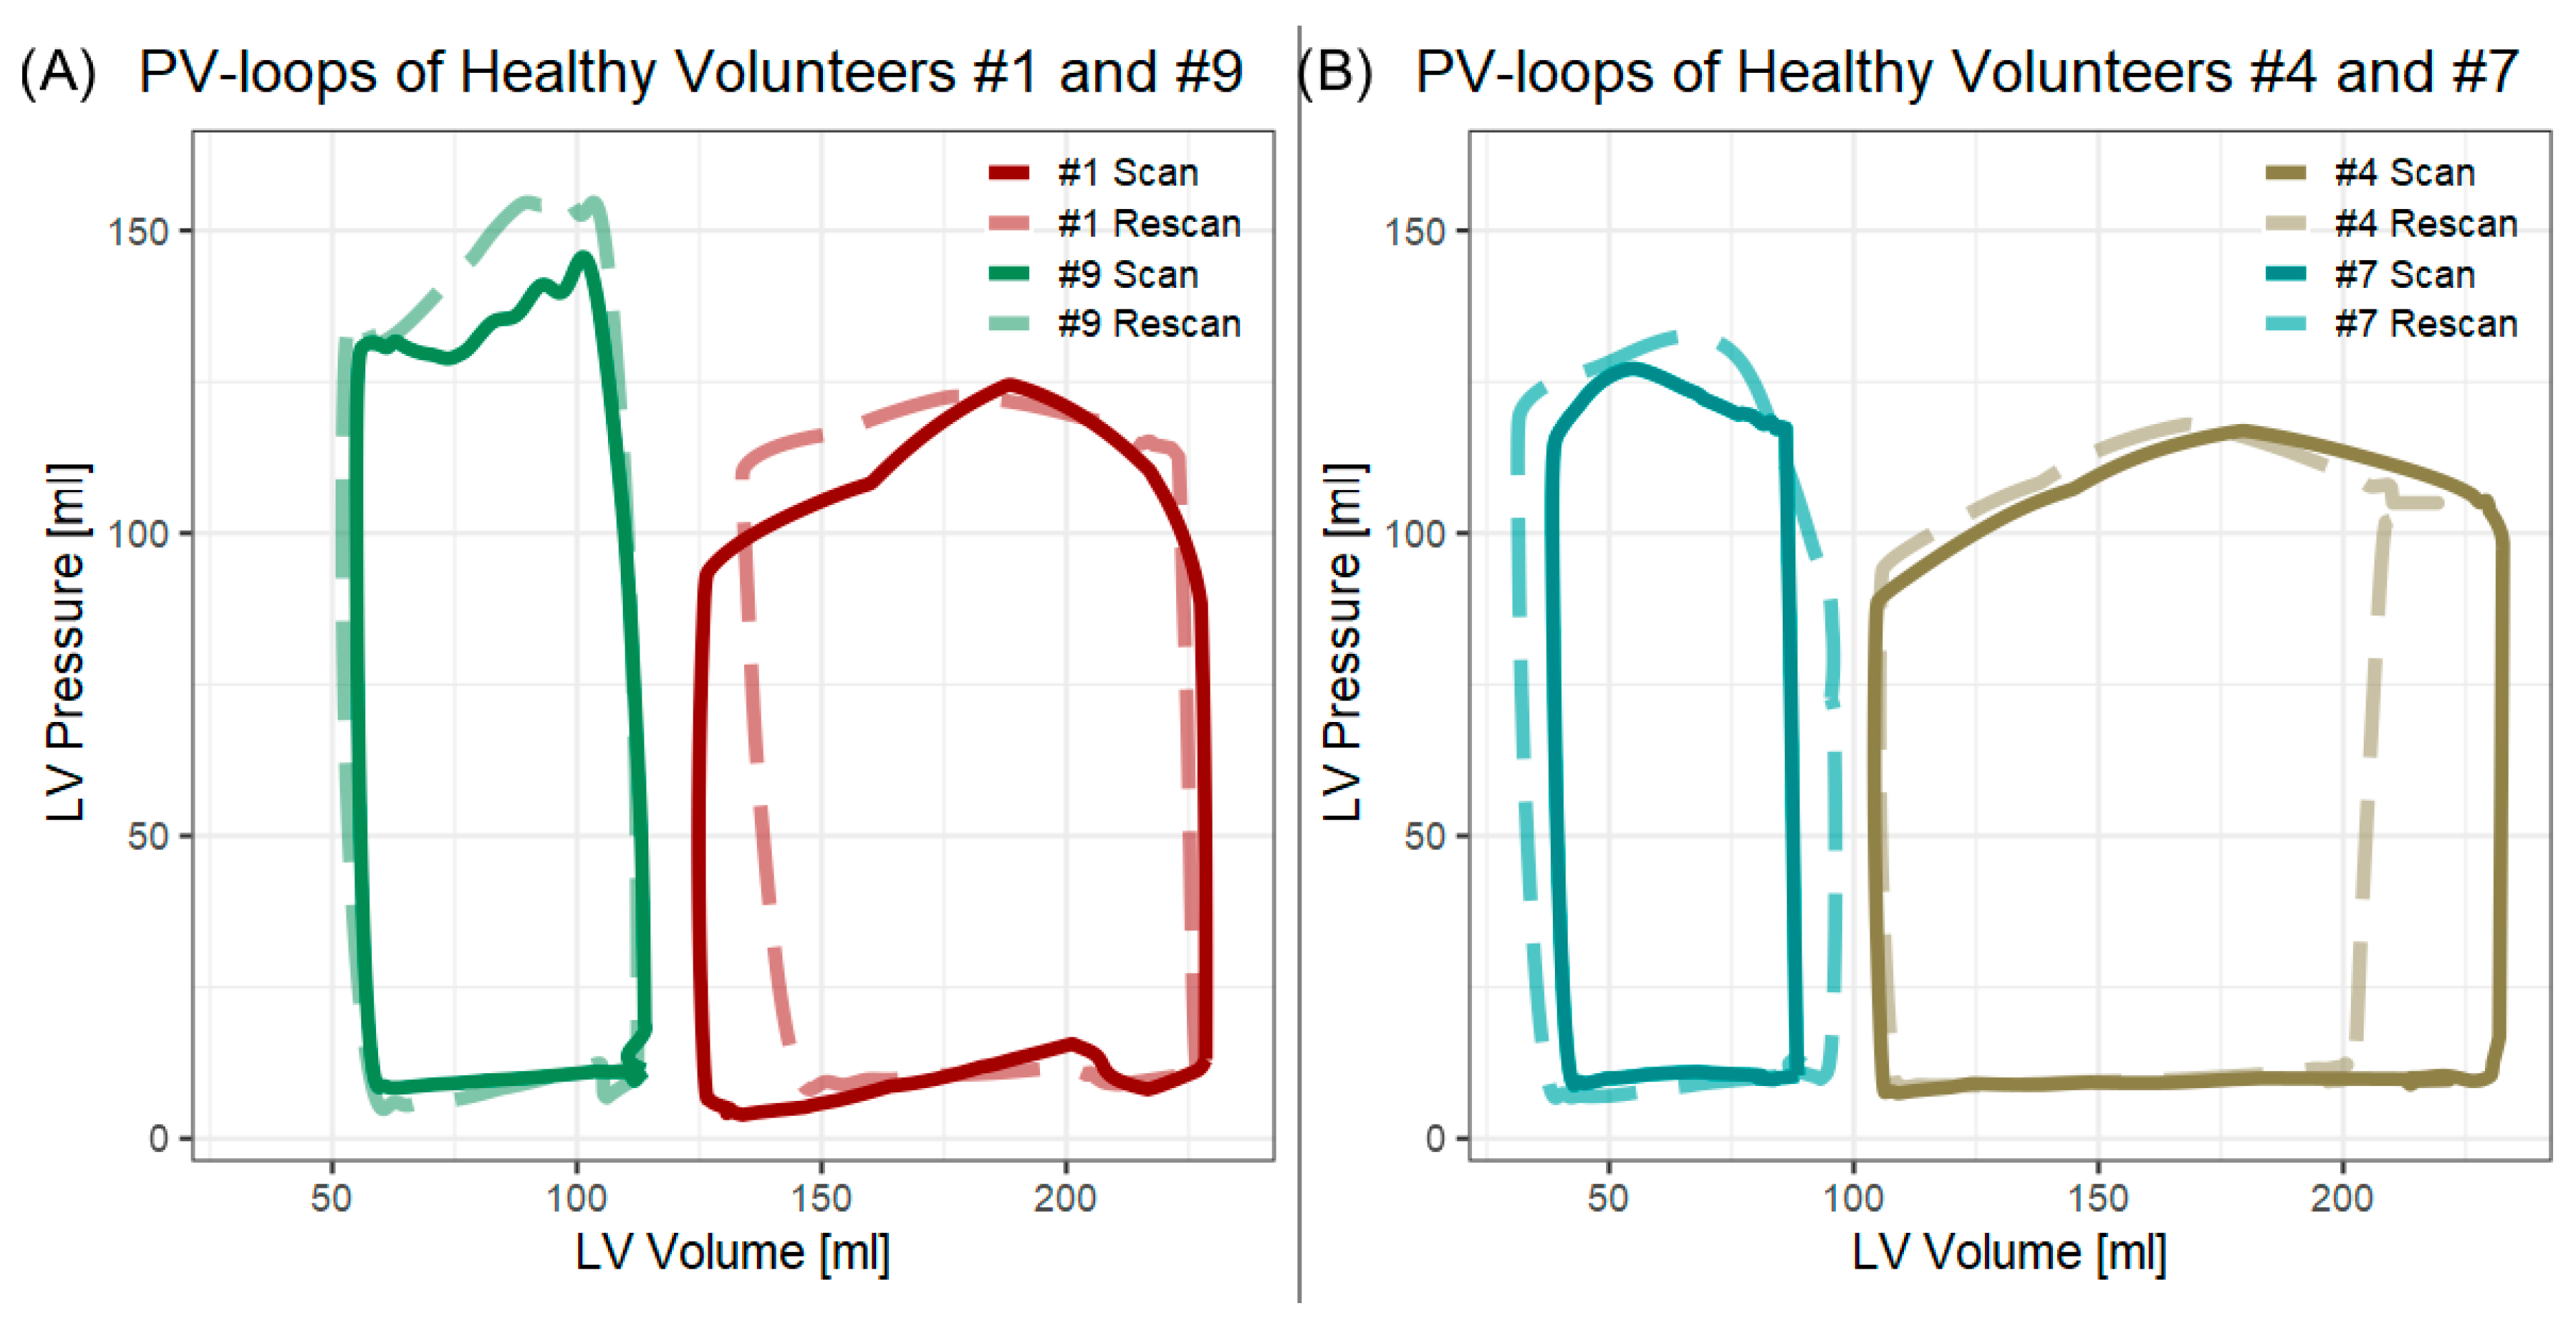
An example of scan and rescan noninvasive PV loops for four healthy volunteers are shown in Figure 2, while scan–rescan PV loop parameters are shown in Table 2. ICCs were high (>0.75) and significant for ESV, EDV, EDPVR, ESPVR, PE, PVA, MEP, and EEV. ICCs were lower but significant for maximum pressure (ICC = 0.61), SW (ICC = 0.56). ICC between minimum pressure from scan and rescan was not significant. There were no significant differences between scan and rescan for any of the PV loop parameters. The mean absolute scan–rescan difference in minimum and maximum LV pressure from 3D CFD was 2.5 mmHg and 10.4 mmHg, respectively. Bland–Altman plots are given in Figure A3.
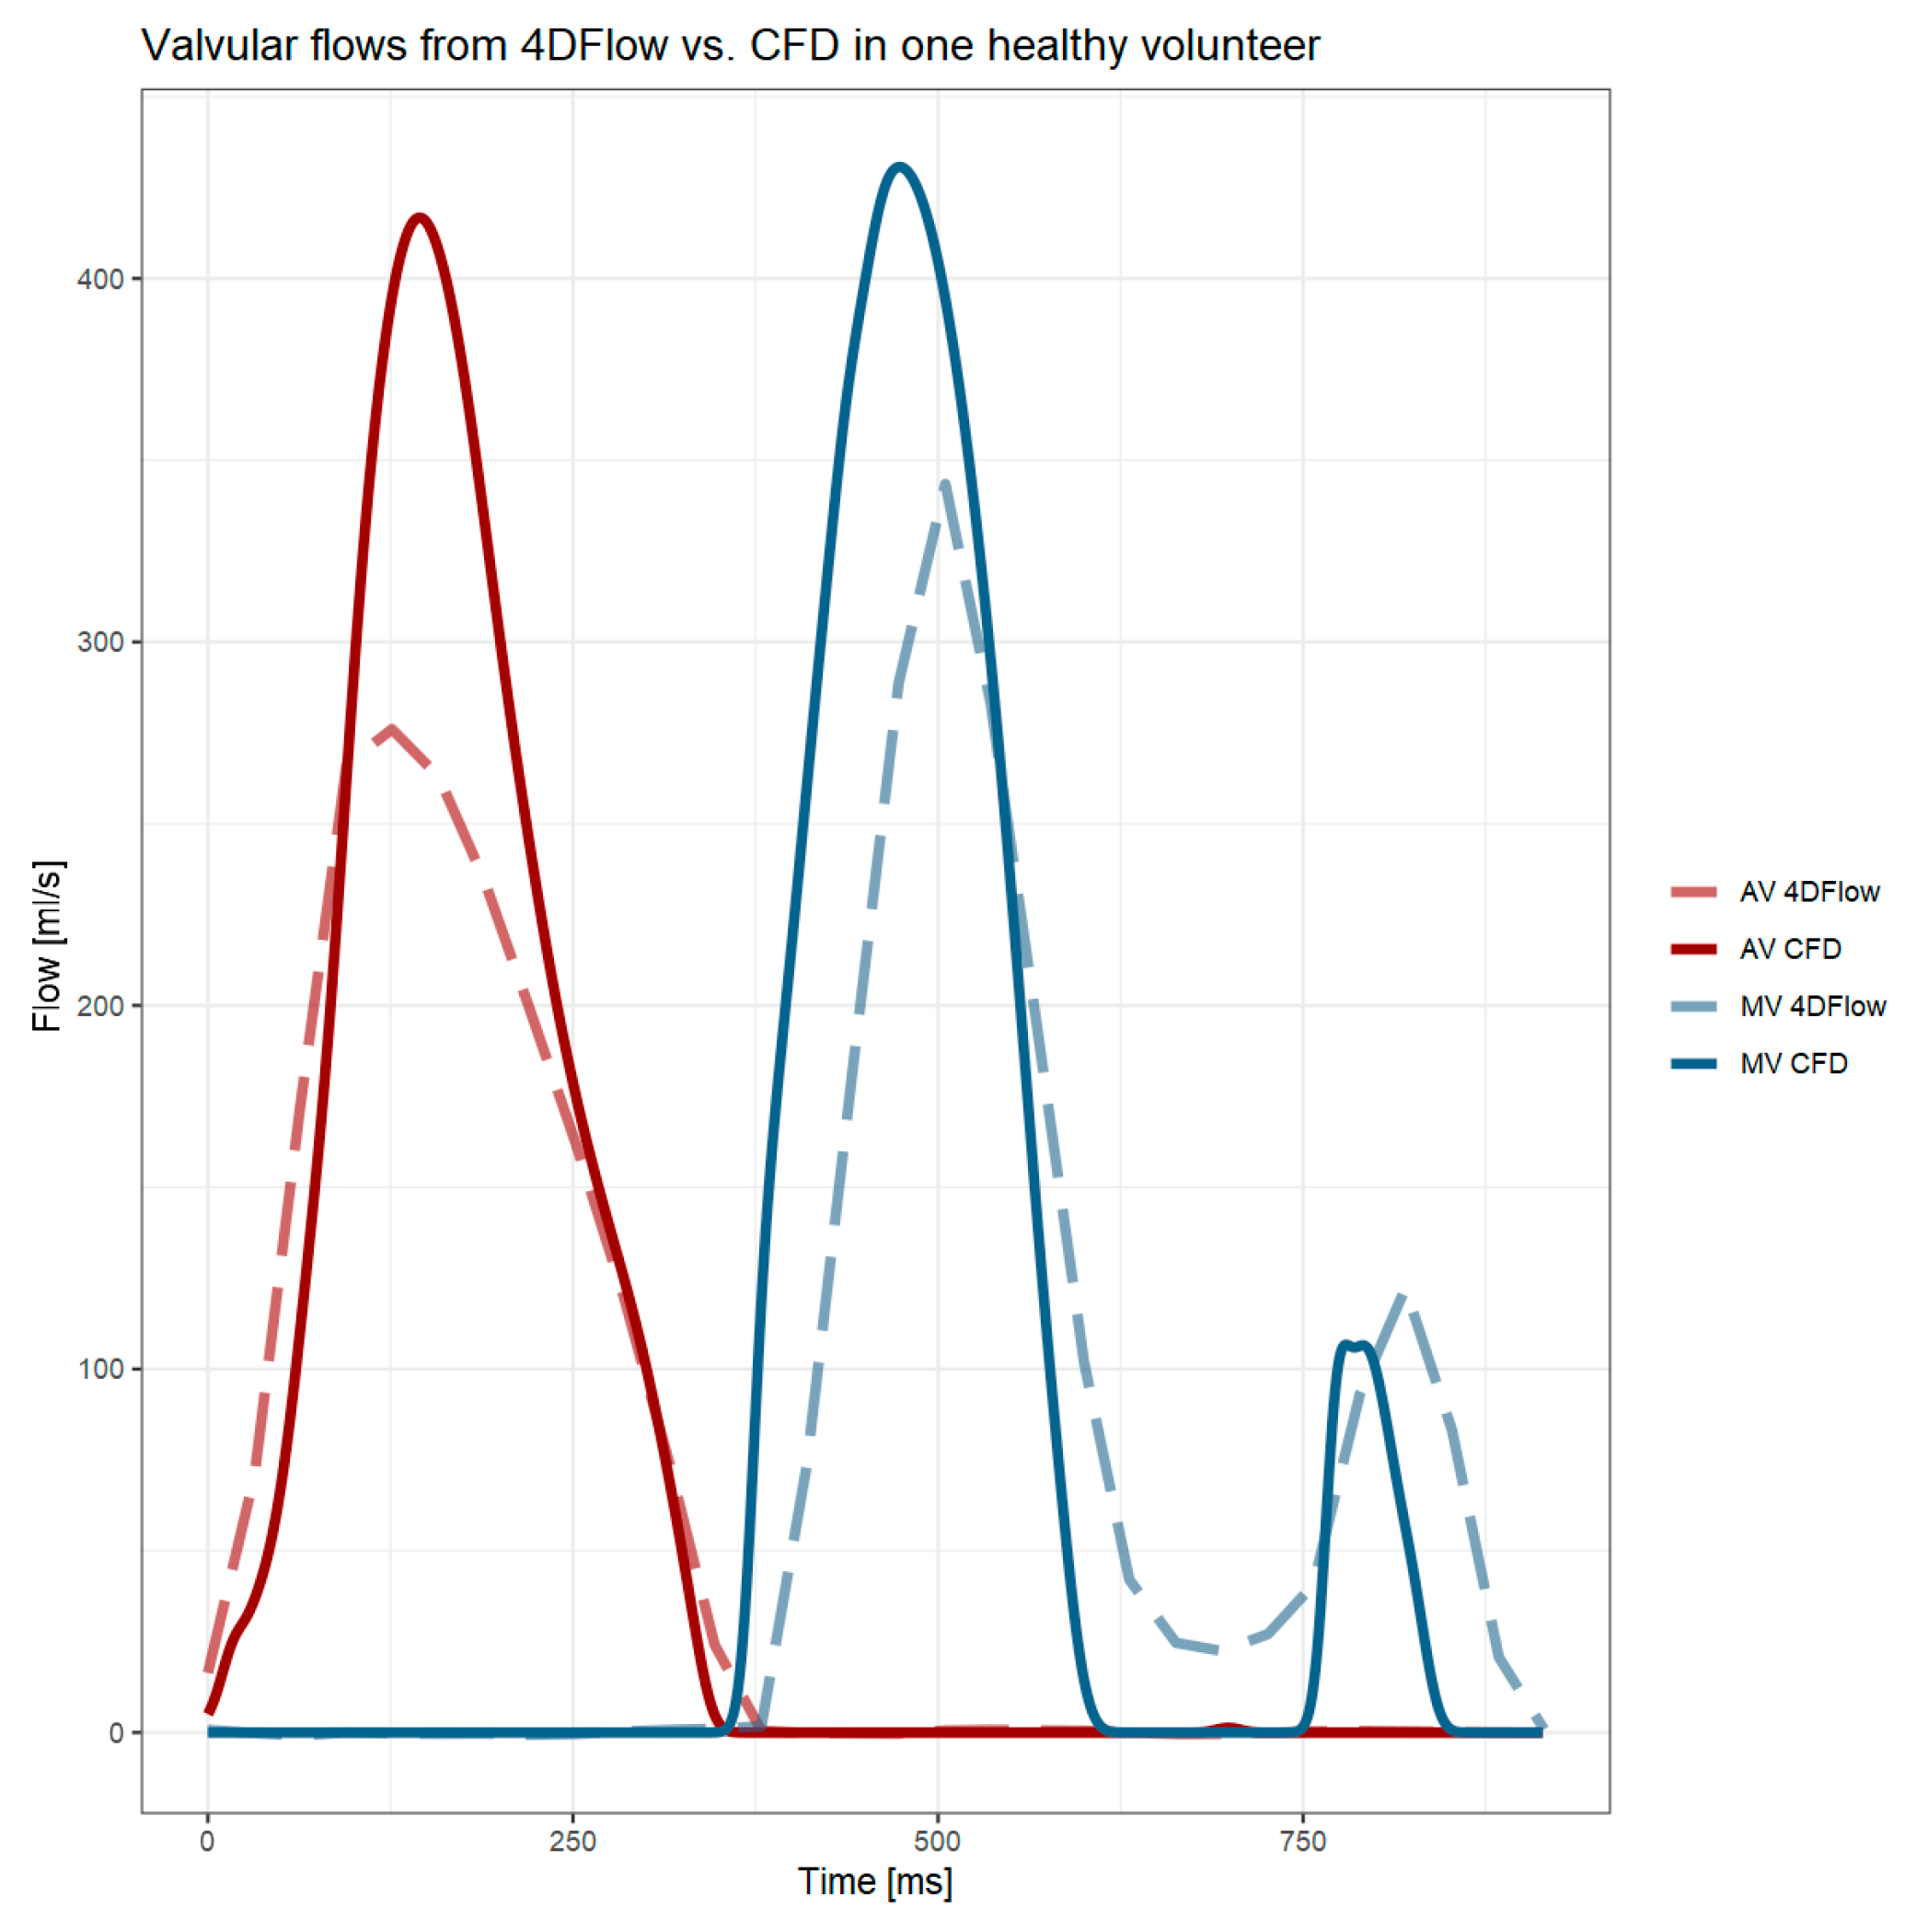
Aortic valve peak flow derived from 4D Flow MRI retrospective valve tracking was significantly lower than peak flow from 3D CFD by on average 103 mL/s (25.7%, p = 0.013), as also shown in the example in Figure 3. For mitral valve peak flow, this difference was not significant, but ICC was only 0.48. Total systolic aortic flow from 3D CFD correlated well with stroke volume from both SAx scan segmentation (ICC = 0.90) as well as from 4D Flow MRI (ICC = 0.74).

3.3. Variability in Healthy Volunteer

The PV loops resulting from datasets whose segmentation was manually increased, decreased or untouched (normal) are shown in Figure 4A, while the PV loops from datasets with manually increased, decreased, or normal aortic flow are shown in Figure 4B. PV loop parameters of these datasets are shown in Table 3. The biggest relative variability in the cases with ±7% segmentation volume was found in SW (12%), PVA (10%), and MEP (12%), of which the latter two depend on SW. In the cases with ±9.8% aortic flow, the variability was 10–11% in maximum pressure, ESPVR, SW, PE, PVA, MEP, and EEV.

3.4. Initial Patient Single-Case Comparison Results

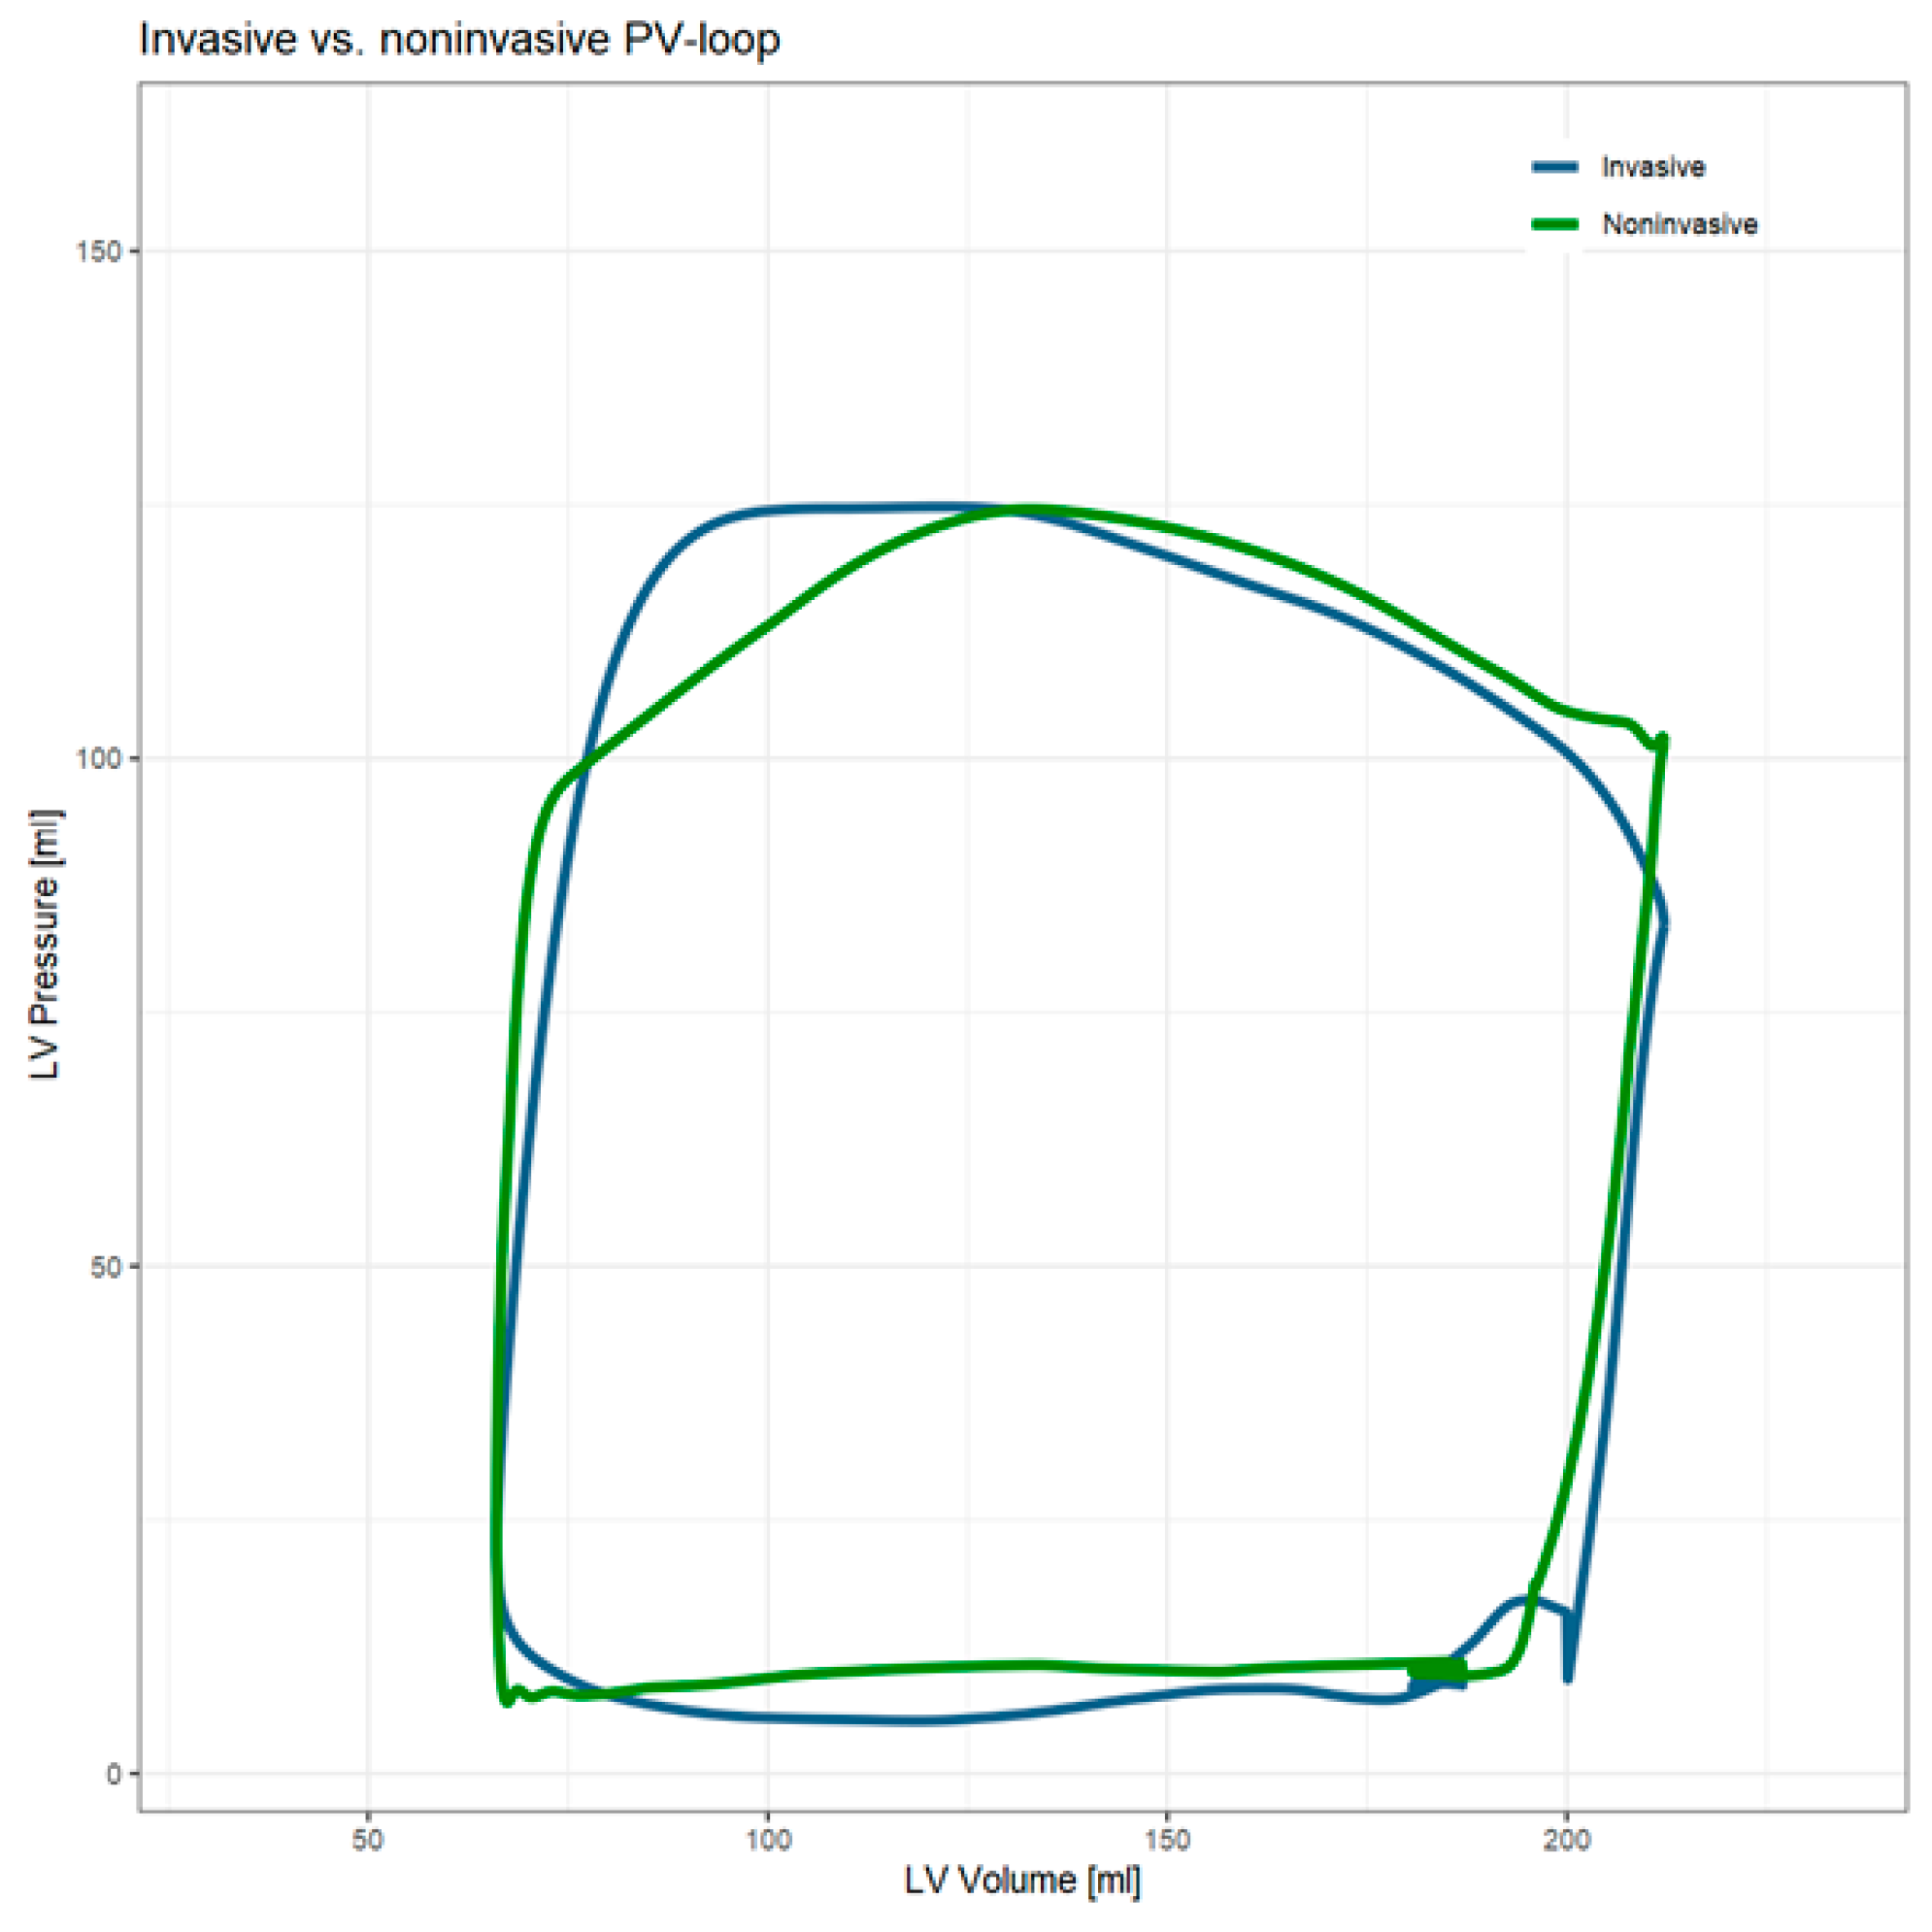
Noninvasive PV loop and invasive catheter-based PV loop in the patient without cardiac and aortic abnormalities are shown in Figure 5 and PV loop analysis results are shown in Table 4. The largest difference in parameters relative to invasive measurement was 35% (1.8 mmHg) in minimum pressure and 10% (0.005 mmHg/mL) in EDPVR, but the absolute differences were small for both parameters. Relative differences were small (<10%) for all other parameters.
Invasively measured minimum pressure of 15 beats was on average 0.9 mmHg (SD = 4.1 mmHg) and maximum pressure was on average 119.9 mmHg (SD = 5.5 mmHg).

4. Discussion

4.1. Scan Rescan

A novel approach for noninvasive left ventricular pressure–volume loops based on 4D Flow MRI and subject-specific CFD was introduced. Scan–rescan reproducibility was very good overall. EDV and ESV measured from 3D CFD are almost identical (ICC = 0.98–0.99), even though segmentations were post-processed before being used in 3D CFD. The calculation of pressure in the model is more complicated, and results based on pressure require more thorough examination.
Scan–rescan ICC for maximum pressure was high, but for minimum pressure there was no significant correlation. The differences in pressure over the one-hour period in between scan sessions are limited and to be expected: Average absolute scan–rescan differences for these measurements were, respectively, 10.4 mmHg for maximal pressure and 2.5 mmHg for minimal pressure, while the standard deviations of 15 consecutive beats in the patient were 5.5 mmHg and 4.1 mmHg, respectively.
The ICC-values of SW, VE, and MEP were significant but not very high. However, the average differences are small compared to the average values of the parameters: 7%, 0%, and 11% for SW, VE, and MEP, respectively.

4.2. Valvular Flows

The current 3D CFD model did not use both LV morphology and valvular flows as input; any discrepancy between valvular flow and LV volume would result in an impossible situation, thereby making the CFD unsolvable [27]. To evaluate the truthfulness of the simulations, we compared 3D CFD valvular flows with 4D Flow MRI valvular flows. Besides slight temporal deviations in flow peaks, aortic peak flows were 26% higher in 3D CFD than in 4D Flow MRI. However, total aortic flow, equal to stroke volume, correlated and agreed well with 4D Flow MRI and 3D CFD, similar to previous research on 4D Flow MRI valve tracking versus 2D planimetry [28]. Therefore, valvular flow peaks are higher but shorter in 3D CFD. Further research into the possible consequences of these altered valve flow peaks is needed.

4.3. Variability

The CFD solutions of both the 3D CFD model and 1D CFD model are stable and reproducible. Variations in CFD, and thereby PV loops, are therefore likely to be created by inter- and intra-observer variability in SAx segmentation and retrospective aortic valve tracking analysis. The average observer-dependent variation in these measurements was found to be 7% for segmentation volume and 9.8% for aortic flow [10,24]. The effects of these variations were assessed in a single case by manually scaling segmentation volume or aortic flow prior to 3D CFD or 1D CFD analysis.
As expected, variation in segmentation volume effected all parameters based on the volume, but also limitedly the minimum and maximum pressure (SD = 0.7 and 1.1 mmHg, respectively). Variation in flow had a roughly proportional effect on all parameters based on pressure, and more specifically systolic pressure, while the EDPVR remained the same. While these variations in PV loop parameters may seem large, the magnitude of the variations were chosen from the literature as a typical scenario. Improvements in automatic segmentations and valve tracking have decreased inter- and intra-observer variability, which therefore will decrease the variation in the noninvasive PV loops and the subsequently derived parameters as well [10,29]. The presented observer variability is a brief approximation of true inter- and intra-observer variability and does not replace this, but it gives an illustration of the expected observer variabilities.

4.4. Initial Single-Case Comparison

An initial single-case comparison of the noninvasive PV loops was conducted in a single patient without cardiac and aortic abnormalities. While this comparison is obviously limited by the sample size of one single patient, it was shown that there is good agreement between the PV loops. Obviously, since the volumes for both measurements was derived from the same cine SAx scan, these measures were the same. However, the CFD-derived pressure and the invasively measured pressure were shown to be very similar as well. Noninvasive maximum and minimum pressure fit well within the standard deviation of the 15 beats of invasive measurement.

4.5. Noninvasive PV Loop Method

This current study is the first to present a noninvasive LV PV loop based on 4D Flow MRI and CFD based on a 1D 111-artery model. A 4D Flow MRI was used instead of a simpler 2D phase contrast MRI to include in-plane components of flow through the aortic annulus, which can make a significant difference in patients with abnormal aortic annulus flow, such as patients with bicuspid aortic valve or aortic root aneurysm. Using 4D Flow also enabled accurate comparison with CFD flows for evaluation purposes. The 1D 111-artery model was chosen to accurately estimate peak systolic aortic pressure by using the aortic flow data, instead of traditional simple arithmetic methods of estimating aortic pressure based on just brachial pressures.
This study is not the first study that described noninvasively assessed LV PV loops. Seemann et al. have used a time-varying elastance model to calculate LV pressure over the cardiac cycle from which they created noninvasive PV loops [22]. Their method is less computationally expensive and LV pressure can be calculated instantaneously. However, the elastance modeling only limitedly models the pressure: the overall shape of the pressure curve is always the same and there is no accurate modeling of diastolic pressures [30]. The currently presented method can model the pressure in more detail, as shown by the varying patient-specific PV loop shape in Figure 2, and also model diastolic pressure by changes in LV morphology in diastole.
Results in PV-loop-derived parameters in this study are similar to results from the elastance model in healthy volunteers, suggesting a similar accuracy in healthy volunteers [31]. A thorough comparison between both methods, especially in patients with abnormal diastolic pressures, is necessary to showcase any clinically relevant differences.

4.6. Limitations

The noninvasive PV loops need to be validated against invasive pressure measurements in a larger cohort study and in patients with abnormal cardiac function (i.e., systolic and diastolic dysfunction) to warrant any clinical application of this methodology. Additionally, the use of a conductance catheter that can assess both pressure and volume simultaneously may improve this validation as this would give access to the LV volume measures during catheterization instead of using the same LV volumes measured during MRI for both examinations.
Noninvasive PV loops based on 4D Flow MRI and CFD are inherently limited by the limitations of the underlying techniques. Both 4D Flow MRI and 3D CFD are time-consuming, with the former taking around 15 min of acquisition time and the latter around 11 h of computation time (depending on computation power). Additionally, manual contouring, valve tracking, and the 1D CFD add additional time to the overall PV loop workflow. Several improvements of the workflow may be introduced to improve usability and quality of the noninvasive PV loops. The most time-consuming process is the segmentation of the LV epicardial contours. Even by segmenting only 10 cardiac phases, which is used to temporally smooth the segmentation to prevent CFD instabilities, this process requires the most work. An automatic approach could speed up this process while decreasing inter- and intra-observer variabilities [29].
Segmenting 10 temporally equidistant cardiac phases out of 30 is a limitation to temporal resolution. This step was introduced to temporally smooth the segmentation to prevent CFD instabilities. Small variations in wall motion that occur due to segmenting individual cardiac phases may result in larger variations in CFD, ultimately destabilizing the simulation. A temporal shape smoothing method is therefore essential. More robust smoothing methods should be explored, as the current method limits temporal resolution and thereby accuracy of the simulation. Other methods tried were not technically feasible at the time: simple methods were limited because the sequential segmentations were different in number of segmentation nodes. More advanced methods tried proved too aggressive, changing the LV volume significantly or smoothing out important LV motion. More fitting temporal smoothing methods that can utilize the full 30 cardiac phases will be explored.
Furthermore, this setup currently used lengthy 4D Flow MRI to compare valvular flows from MRI to 3D CFD. However, for the generation of PV loops with the current methodology, only aortic flow is necessary. Utilizing a short 2D flow scan of the aortic root can reduce patient scanning times, while increasing the applicability. Additionally, assessment of the 2D flow data might be performed fully automatically, reducing post-processing time further. However, 4D Flow MRI allows for valve tracking and compensation of the through-plane motion of the valve, preventing inaccuracies associated with 2D flow valvular flow due to misplacement of scanning planes or non-perpendicular flow [32].
The invasive catheter measurement only included a measurement of the LV pressure, as no conductance catheter was used. LV volume was therefore assessed on the same short axis MRI scan as the noninvasive method used. Although accurate assessment of LV volume is proven for both methods, conductance catheter measurement is preferred due to the simultaneous measurement of LV volume and pressure. Without this, volume and pressure need to be synchronized manually, which may introduce inaccuracies. In this study, an ECG signal that was acquired during catheter measurement aided in the synchronization. Nonetheless, the resynchronization may have introduced inaccuracies. Furthermore, the time between the catheter measurement and MRI exceeded multiple hours and differences in cardiac stress may have been present.
Lastly, 3D CFD simulations currently comprised five cardiac cycles to ensure a stable simulation of flow. However, artifacts in blood pressure sometimes occurred in the later cardiac cycles and less often in the first two cardiac cycles, possibly due to accumulation of non-convergent timesteps resulting in instabilities in some timesteps. More iterations per timestep or further mesh optimizations could solve this, but this can be tedious as these settings might be different for each model. For PV loop generation, 3D CFD of only the first cardiac cycle might be sufficient, further reducing the computation time to only approximately 2.5 h per 3D CFD model. Additional optimizations of CFD parameters may decrease computation time also, but this requires further study. Finally, automatic quality control and artifact recognition would decrease user time and may increase reproducibility.
Above limitations also apply to the applicability of this novel technique in clinical care. Overcoming these primarily technical limitations will pave the way towards implementation of these noninvasive PV loops. Further automation of the workflow, such as substituting manual segmentation of SAx scans with automatic segmentation of the 4D Flow MRI scans, will reduce both acquisition and post-processing time. The use of artificial intelligence in segmentation and other time-intensive workflow steps may also render the technique less labor-intensive, without compromising its essential methodologies. The reduction in manual labor, along with decreased acquisition and post-processing durations, will facilitate the seamless integration of the proposed methods into clinical care.

4.7. Future Developments

The currently presented method of noninvasive PV loop generation was developed as an initial baseline for patients without valvular disease. Further improvements can be made to not only increase the accuracy, but also the applicability in patients with a wider variety of cardiovascular diseases. For example, valve shape may be included to support the analysis of patients with abnormal valvular function.

5. Conclusions

We introduced a novel approach to generate noninvasive pressure–volume loops rom only MRI-assessed aortic flow, cine short axis MRI, and brachial pressure measurement. This approach combining 4D Flow MRI, SAx MRI, and CFD was shown to be reproducible in a scan–rescan study. Single-case comparison with invasive measurement shows great promise, but larger validation studies are needed.

Author Contributions

Conceptualization, P.R.R., J.J.M.W. and H.J.L.; data curation, P.R.R.; formal analysis, P.R.R.; funding acquisition, J.J.M.W. and H.J.L.; investigation, P.R.R. and R.E. methodology, P.R.R.; project administration, P.R.R.; resources, P.R.R.; software, P.R.R., J.J.T. and D.H.; supervision, J.J.M.W. and H.J.L.; validation, P.R.R.; visualization, P.R.R.; writing—original draft preparation, P.R.R.; writing—review and editing, P.R.R., J.J.T., T.i.d.B., R.E., P.H., P.A.L.T., H.C.M.v.d.B., D.H., C.V., S.K., J.J.M.W. and H.J.L. All authors have read and agreed to the published version of the manuscript.

Funding

This research was supported by a grant from the LUMC board of directors. P.R.R. has been employed via an internal fund from the LUMC Research board. T.i.d.B. has been employed via the Radiology Research Fund from the Dutch Society for Radiology (NVvR). This research received no additional external funding.

Institutional Review Board Statement

The study was conducted in accordance with the Declaration of Helsinki and approved by the Medical Ethics Committee Leiden The Hague Delft (protocol code P18.034, approved 3 July 2018).

Informed Consent Statement

Informed consent was obtained from all subjects involved in the study.

Data Availability Statement

The data underlying this article will be shared on reasonable request to the corresponding author.

Conflicts of Interest

H.L. has received consulting fees from Royal Philips and was member of the board of trustees of the SCMR and UEMS section Radiology without payment. Software licences for CAAS MR Solutions were made available free of charge as part of a research agreement between the Cardiovascular Imaging Group of the LUMC and PIE Medical Imaging B.V.

Abbreviations

The following abbreviations are used in this manuscript:
1DOne-dimensional
2ChTwo chamber
4ChFour chamber
4DFour-dimensional
CFDComputational fluid dynamics
EDPVREnd-diastolic pressure–volume relationship
ESPVREnd-systolic pressure–volume relationship
ICCIntraclass correlation coefficient
KEKinetic energy
LVLeft ventricle/left ventricular
MRMagnetic resonance
MRIMagnetic resonance imaging
PEPotential energy
PVPressure volume
SAxShort axis
SWStroke work

Appendix A

The one-dimensional CFD model that describes blood flow and pressure propagation through compliant blood vessels is based on the physical laws of conservation of mass and momentum, which can be written as follows:
A t + A · u x = 0
u t + u u x + 1 ρ p x + 8 π · μ · u A · ρ = 0
Here, A is the arterial circular cross-section, u is the velocity component perpendicular to A, and p is the pressure, whereas ρ and µ are blood density and dynamic viscosity, respectively. Here we assume a fully incompressible Newtonian fluid with ρ = 1060 kg/m3 and µ = 3.5 mPa s. Note that the last term in the momentum equation (Equation (2)) represents the friction term where it is assumed that the flow is fully developed and laminar (Poiseuille profile). To complete the system of equations, we assume the following relationship between the pressure within the blood vessel and its cross-sectional area, following Sherwin et al. (2003) [33]:
p = p e x t + β A A 0 , β = π h 0 E 1 v 2 A 0
where pext is the external pressure, A0(x) is the cross-sectional area in equilibrium ((p, u) = (pext, 0)), E(x) is the Young modules, h0 is the vessel thickness at equilibrium, and v is the Poisson ratio (v = 0.5 for the biological tissue). An empirical formula by Olufsen is used to determine h0 and E [34]:
c 0 2 = 2 3 ρ h 0 E r 0 = 2 3 ρ k 1 k 2 r 0 + k 3
Here, c0 and r0 are the pulse wave velocity and the radius of the vessel at rest. The values k1, k2, and k3 are set as 3 × 10⁶ g s−2 cm−1, −9 cm−1, and 33.7 × 10⁴ g s−2 cm−1, respectively [34].
The governing non-linear conservative equations are converted to the system of characteristic equations and discretized by an originally developed Finite Volume Method (FVM) in combination with a high-resolution flux difference splitting. The model includes a branching network of the main arteries of the human circulative system that contains a total of 111 blood vessels (starting with the ascending aorta, see Figure A1) in a full analogy with the works of Mynard and Smolich [35]. The model was extensively validated against the one-dimensional models presented in the literature for simplified (stented artery) and complex (full arterial circulation) cases (e.g., finite-element Discontinuous Galerkin method of Sherwin et al. [33] and Mynard and Smolich [35]) and an excellent agreement was obtained even on relatively coarse numerical mesh. Inlet velocity and area were prescribed from previous aortic annulus flow analysis from 4D Flow MRI. The entire model, including artery diameters and lengths, was then scaled with the measured area of the aortic annulus. The measured patient-specific brachial systolic and diastolic pressures were used to obtain the targeted range of calculated pressure within ±5 mmHg accuracy. The governing equations were solved numerically for each millisecond of the cardiac cycle. In total 10 cardiac cycles were simulated to obtain fully developed solutions. The entire 1D vascular network was represented by 4600 control volumes, which proved to provide the grid-independent results. Convergence of the 1D CFD model was defined as less than 1 mmHg difference in starting pressure between cardiac cycles.
Figure A1. Schematic of the 111 arteries used in the one-dimensional 111-Artery CFD model. See full size image for the table of all arteries.
Applsci 15 12305 g0a1
Figure A2. Noninvasive PV loops generated with CFD meshes with an increased or decreased amount of mesh elements. The figure legend depicts the approximate factor with which the amount of mesh elements has been increased. Decreased amount of mesh elements resulted in a very similar PV loop compared to baseline, while an increase in mesh elements resulted in a different PV loop.
Applsci 15 12305 g0a2
Figure A3. Bland–Altman plots of PV loop parameters. From left to right, top to bottom: end-diastolic pressure–volume relationship (EDPVR), end-systolic pressure–volume relationship (ESPVR), minimum pressure, maximum pressure, stroke work (SW), and potential energy (PE). Middle dotted line is mean, other dotted lines are ± 1.96 standard deviation.
Applsci 15 12305 g0a3
Table A1. The 4D CFD model parameters.
ParameterValue
Mesh elements~150,000
ModelK-ω turbulence model
SolverPressure-based
Pressure-velocity couplingSIMPLE
Spatial discretization
- GradientLeast Squares Cell-based
- PressureSecond order
- MomentumSecond-order upwind
Residuals<1 × 10⁻⁴
Boundary conditions2
- Input1330 mmHg
- OutputPeak systole aortic pressure + 5 mmHg
- Prevent reverse flowYes
Iterations
- Steady-stateUnlimited (~4000)
- Transient100
Timestep1 ms
Dynamic mesh
- Mesh deformationUser-defined Function
- Remeshing interval1 step
- Max smoothing iterations250
- Edge length>0.001 and <0.005
- Cell skew<0.7
- Face skew<0.7
Table A2. CFD simulation and PV loop parameters of mesh dependency test, relative to baseline measurement.
# ElementsComputation TimeConverged TimestepsMin. P [mmHg]Max. P [mmHg]EDPVR [mmHg/mL]ESPVR [mmHg/mL]SW [J]PE [J]PVA [J]VEMEP [J/s]EEV [J/L]
0.25−58.7%6.9%−0.2%0.7%1.1%0.6%1.1%0.4%0.9%0.2%1.1%0.9%
0.5−16.9%3.7%−2.2%1.2%1.3%0.2%0.9%0.2%0.7%0.2%0.9%0.7%
1------------
215.3%−9.2%−21.1%−5.5%9.8%−16.9%−4.7%−17.1%−8.8%4.4%−4.7%−8.8%
458.4%−9.4%−107.5%−2.6%8.1%−19.8%−1.1%−18.7%−6.7%6.2%−1.1%−6.9%
# Elements = number of elements; P = pressure; EDPVR = end-diastolic pressure–volume relationship; ESPVR = end-systolic pressure–volume relationship; SW = stroke work; PE = mechanical potential energy; PVA = pressure–volume area; VE = ventricular efficiency; MEP = mean external power; EEV = energy per ejected volume.

References

  1. Roth, G.A.; Mensah, G.A.; Johnson, C.O.; Addolorato, G.; Ammirati, E.; Baddour, L.M.; Barengo, N.C.; Beaton, A.Z.; Benjamin, E.J.; Benziger, C.P.; et al. Global Burden of Cardiovascular Diseases and Risk Factors, 1990–2019. J. Am. Coll. Cardiol. 2020, 76, 2982–3021. [Google Scholar] [CrossRef] [PubMed]
  2. Borlaug, B.A.; Kass, D.A. Invasive Hemodynamic Assessment in Heart Failure. Heart Fail. Clin. 2009, 5, 217–228. [Google Scholar] [CrossRef] [PubMed]
  3. Burkhoff, D.; Mirsky, I.; Suga, H. Assessment of systolic and diastolic ventricular properties via pressure-volume analysis: A guide for clinical, translational, and basic researchers. Am. J. Physiol. Heart Circ. Physiol. 2005, 289, H501–H512. [Google Scholar] [CrossRef] [PubMed]
  4. Stonko, D.P.; Edwards, J.; Abdou, H.; Elansary, N.N.; Lang, E.; Savidge, S.G.; Morrison, J.J. A technical and data analytic approach to pressure-volume loops over numerous cardiac cycles. JVS Vasc. Sci. 2022, 3, 73–84. [Google Scholar] [CrossRef]
  5. Bissell, M.M.; Raimondi, F.; Ait Ali, L.; Allen, B.D.; Barker, A.J.; Bolger, A.; Burris, N.; Carhäll, C.-J.; Collins, J.D.; Ebbers, T.; et al. 4D Flow cardiovascular magnetic resonance consensus statement: 2023 update. J. Cardiovasc. Magn. Reson. 2023, 25, 40. [Google Scholar] [CrossRef]
  6. Demirkiran, A.; van Ooij, P.; Westenberg, J.J.M.; Hofman, M.B.M.; van Assen, H.C.; Schoonmade, L.J.; Asim, U.; Blanken, C.P.S.; Nederveen, A.J.; van Rossum, A.C.; et al. Clinical intra-cardiac 4D flow CMR: Acquisition, analysis, and clinical applications. Eur. Heart J. Cardiovasc. Imaging 2022, 23, 154–165. [Google Scholar] [CrossRef]
  7. Maroun, A.; Quinn, S.; Dushfunian, D.; Weiss, E.K.; Allen, B.D.; Carr, J.C.; Markl, M. Clinical Applications of Four-Dimensional Flow MRI. Magn. Reson. Imaging Clin. N. Am. 2023, 31, 451–460. [Google Scholar] [CrossRef]
  8. Eerdekens, R.; Tonino, P.; Zelis, J.; Adrichem, R.; Ahn, J.M.; Demandt, J.; Eftekhari, A.; El Farissi, M.; Freeman, P.; Rahman Ihdayhid, A.; et al. Rationale and design of SAVI-AoS: A physiologic study of patients with symptomatic moderate aortic valve stenosis and preserved left ventricular ejection fraction. Int. J. Cardiol. Heart Vasc. 2022, 41, 101063. [Google Scholar] [CrossRef]
  9. Antiga, L.; Piccinelli, M.; Botti, L.; Ene-Iordache, B.; Remuzzi, A.; Steinman, D.A. An image-based modeling framework for patient-specific computational hemodynamics. Med. Biol. Eng. Comput. 2008, 46, 1097–1112. [Google Scholar] [CrossRef]
  10. Kamphuis, V.P.; Roest, A.A.W.; Ajmone Marsan, N.; van den Boogaard, P.J.; Kroft, L.J.M.; Aben, J.P.; Bax, J.J.; de Roos, A.; Lamb, H.J.; Westenberg, J.J.M. Automated Cardiac Valve Tracking for Flow Quantification with Four-dimensional Flow MRI. Radiology 2019, 290, 70–78. [Google Scholar] [CrossRef]
  11. Childs, H.; Ma, L.; Ma, M.; Clarke, J.; Cocker, M.; Green, J.; Strohm, O.; Friedrich, M.G. Comparison of long and short axis quantification of left ventricular volume parameters by cardiovascular magnetic resonance, with ex-vivo validation. J. Cardiovasc. Magn. Reson. 2011, 13, 40. [Google Scholar] [CrossRef] [PubMed]
  12. Forbat, S.M.; Sakrana, M.A.; Darasz, K.H.; El-Demerdash, F.; Underwood, S.R. Rapid assessment of left ventricular volume by short axis cine MRI. Br. J. Radiol. 1996, 69, 221–225. [Google Scholar] [CrossRef] [PubMed]
  13. Breall, W.S.; Shaffer, A.B. Effect of Heart Irregularity on Left Ventricular and Arterial Peak Systolic Pressures in Aortic Stenosis. Circulation 1959, 20, 1049–1052. [Google Scholar] [CrossRef]
  14. Xu, F.; Kenjeres, S. Numerical simulations of flow patterns in the human left ventricle model with a novel dynamic mesh morphing approach based on radial basis function. Comput. Biol. Med. 2021, 130, 104184. [Google Scholar] [CrossRef]
  15. Tezzele, M.; Demo, N.; Mola, A.; Rozza, G. PyGeM: Python Geometrical Morphing. Softw. Impacts 2021, 7, 100047. [Google Scholar] [CrossRef]
  16. Sieger, D.; Menzel, S.; Botsch, M. RBF morphing techniques for simulation-based design optimization. Eng. Comput. 2014, 30, 161–174. [Google Scholar] [CrossRef]
  17. Perinajová, R.; Van De Ven, T.; Roelse, E.; Xu, F.; Juffermans, J.; Westenberg, J.; Lamb, H.; Kenjereš, S. A comprehensive MRI-based computational model of blood flow in compliant aorta using radial basis function interpolation. Biomed. Eng. OnLine 2024, 23, 69. [Google Scholar] [CrossRef]
  18. Savitzky, A.; Golay, M.J.E. Smoothing and Differentiation of Data by Simplified Least Squares Procedures. Anal. Chem. 1964, 36, 1627–1639. [Google Scholar] [CrossRef]
  19. Sagawa, K. The end-systolic pressure-volume relation of the ventricle: Definition, modifications and clinical use. Circulation 1981, 63, 1223–1227. [Google Scholar] [CrossRef]
  20. Stevenson, D.; Revie, J.; Chase, J.G.; Hann, C.E.; Shaw, G.M.; Lambermont, B.; Ghuysen, A.; Kolh, P.; Desaive, T. Beat-to-beat estimation of the continuous left and right cardiac elastance from metrics commonly available in clinical settings. Biomed. Eng. OnLine 2012, 11, 73. [Google Scholar] [CrossRef]
  21. Suga, H. Ventricular energetics. Physiol. Rev. 1990, 70, 247–277. [Google Scholar] [CrossRef]
  22. Seemann, F.; Arvidsson, P.; Nordlund, D.; Kopic, S.; Carlsson, M.; Arheden, H.; Heiberg, E. Noninvasive Quantification of Pressure-Volume Loops From Brachial Pressure and Cardiovascular Magnetic Resonance. Circ. Cardiovasc. Imaging 2019, 12, e008493. [Google Scholar] [CrossRef]
  23. Moody, W.E.; Edwards, N.C.; Chue, C.D.; Taylor, R.J.; Ferro, C.J.; Townend, J.N.; Steeds, R.P. Variability in cardiac MR measurement of left ventricular ejection fraction, volumes and mass in healthy adults: Defining a significant change at 1 year. Br. J. Radiol. 2015, 88, 20140831. [Google Scholar] [CrossRef] [PubMed]
  24. Sakuma, H.; Globits, S.; Bourne, M.W.; Shimakawa, A.; Foo, T.K.; Higgins, C.B. Improved reproducibility in measuring LV volumes and mass using multicoil breath-hold cine MR imaging. J. Magn. Reson. Imaging 1996, 6, 124–127. [Google Scholar] [CrossRef] [PubMed]
  25. RStudio Team. RStudio: Integrated Development Environment for R; Rstudio PBC: Boston, MA, USA, 2020. [Google Scholar]
  26. The R Core Team. R: A Language and Environment for Statistical Computing; R Foundation for Statistical Computing: Vienna, Austria, 2023. [Google Scholar]
  27. Morris, P.D.; Narracott, A.; Von Tengg-Kobligk, H.; Silva Soto, D.A.; Hsiao, S.; Lungu, A.; Evans, P.; Bressloff, N.W.; Lawford, P.V.; Hose, D.R.; et al. Computational fluid dynamics modelling in cardiovascular medicine. Heart 2016, 102, 18–28. [Google Scholar] [CrossRef] [PubMed]
  28. Kamphuis, V.P.; van der Palen, R.L.F.; de Koning, P.J.H.; Elbaz, M.S.M.; van der Geest, R.J.; de Roos, A.; Roest, A.A.W.; Westenberg, J.J.M. In-scan and scan–rescan assessment of LV in- and outflow volumes by 4D flow MRI versus 2D planimetry. J. Magn. Reson. Imaging 2018, 47, 511–522. [Google Scholar] [CrossRef]
  29. Bartoli, A.; Fournel, J.; Bentatou, Z.; Habib, G.; Lalande, A.; Bernard, M.; Boussel, L.; Pontana, F.; Dacher, J.N.; Ghattas, B.; et al. Deep Learning-based Automated Segmentation of Left Ventricular Trabeculations and Myocardium on Cardiac MR Images: A Feasibility Study. Radiol. Artif. Intell. 2021, 3, e200021. [Google Scholar] [CrossRef]
  30. Arvidsson, P.M.; Green, P.G.; Watson, W.D.; Shanmuganathan, M.; Heiberg, E.; De Maria, G.L.; Arheden, H.; Herring, N.; Rider, O.J. Non-invasive left ventricular pressure-volume loops from cardiovascular magnetic resonance imaging and brachial blood pressure: Validation using pressure catheter measurements. Eur. Heart J. Imaging Methods Pract. 2023, 1, qyad035. [Google Scholar] [CrossRef]
  31. Edlund, J.; Arvidsson, P.M.; Nelsson, A.; Smith, J.G.; Magnusson, M.; Heiberg, E.; Steding-Ehrenborg, K.; Arheden, H. Noninvasive Assessment of Left Ventricular Pressure-Volume Relations: Inter- and Intraobserver Variability and Assessment Across Heart Failure Subtypes. Am. J. Cardiol. 2022, 184, 48–55. [Google Scholar] [CrossRef]
  32. Markl, M.; Schnell, S.; Barker, A.J. 4D Flow Imaging: Current Status to Future Clinical Applications. Curr. Cardiol. Rep. 2014, 16, 481. [Google Scholar] [CrossRef]
  33. Sherwin, S.J.; Formaggia, L.; Peiró, J.; Franke, V. Computational modelling of 1D blood flow with variable mechanical properties and its application to the simulation of wave propagation in the human arterial system. Int. J. Numer. Methods Fluids 2003, 43, 673–700. [Google Scholar] [CrossRef]
  34. Olufsen, M.S. Structured tree outflow condition for blood flow in larger systemic arteries. Am. J. Physiol. 1999, 276, H257–H268. [Google Scholar] [CrossRef]
  35. Mynard, J.P.; Smolich, J.J. One-Dimensional Haemodynamic Modeling and Wave Dynamics in the Entire Adult Circulation. Ann. Biomed. Eng. 2015, 43, 1443–1460. [Google Scholar] [CrossRef]
Figure 1. Noninvasive left ventricular (LV) pressure–volume (PV) loop workflow. 1D = one-dimensional; WH = whole heart.
Applsci 15 12305 g001
Figure 2. Noninvasive left ventricular (LV) pressure–volume (PV) loops of four healthy volunteers. PV loops of scan and rescan MRI data are shown. # = participant number which corresponds with other figures and tables of this research article.
Applsci 15 12305 g002
Figure 3. Flow through the aortic valve (AV) and through the mitral valve (MV) as measured with 4D Flow MRI with retrospective valve tracking and computational fluid dynamics (CFD) model. This example shows a full cardiac cycle of a healthy volunteer.
Applsci 15 12305 g003
Figure 4. Noninvasive left ventricular (LV) pressure–volume (PV) loops with manually added variability in the source data. (A) Variability in short-axis segmentation volumes of ±7%. (B) Variability in aortic flow of ±9.8%.
Applsci 15 12305 g004
Figure 5. Invasive and noninvasive left ventricular (LV) pressure–volume (PV) loops. Invasive pressure was measured with a LV catheter with pressure sensor, while volume was measured from the same MRI for both PV loops.
Applsci 15 12305 g005
Table 1. Scan parameters for cine scans and 4D Flow MRI.
Cine 2ch/4ch/AoCine Short-Axis4D Flow
Scan time (approximately)10 s12 × 5 s15 min
FoV [mm3]350 × 350 × 8.0350 × 350 × 104 *370 × 395 × 104 *
Acquired resolution [mm3]2.0 × 1.6 × 8.01.5 × 1.5 × 8.03.5 × 3.5 × 3.5
Reconstructed resolution [mm3]1.0 × 1.0 × 8.00.73 × 0.73 × 8.02.0 × 2.0 × 1.75
Temporal resolution46.8 ms48.0 ms40.8 ms
Slice gap [mm]00−1.5
TR [ms]2.63.05.1
TE [ms]1.31.53.0
Flip Angle [°]45455
Sense factor22.53/1.4
Segmentation factor17–18162
Respiratory compensationBreath-hold1 Breath-hold per sliceNavigator gating
Cardiac phases **303030
Venc [cm/s]--200
* Average Field of View (FoV) as the scan encompassed the entire heart. ** Across all scan types, thirty cardiac phases were reconstructed, unless constrained by the prevailing heart rate of the respective volunteers at the time of scanning.
Table 2. Scan–rescan left ventricular pressure–volume loop analysis results.
ParticipantScanESV [mL]EDV [mL]Min. P [mmHg]Max. P [mmHg]EDPVR [mmHg/mL]ESPVR [mmHg/mL]SW [J]PE [J]PVA [J]VEMEP [J/s]EEV [J/L]
1#11252283.9124.50.040.741.390.802.190.641.9921.1
#21342278.1122.60.040.831.260.992.250.561.6424.1
2#1541388.5135.60.072.191.210.431.640.741.4119.5
#2531356.1121.80.072.011.050.391.440.731.1617.7
3#1701367.0158.90.071.871.070.611.680.641.5525.4
#2751434.2135.90.071.430.990.541.540.651.3122.8
4#11042337.5116.90.040.851.680.622.290.731.5817.9
#21052198.2118.00.050.891.330.662.000.671.2217.5
5#1551518.3127.70.081.991.260.411.670.761.5617.5
#2481485.498.20.081.631.030.261.300.801.2612.9
6#1861848.7143.10.061.501.520.732.260.671.7023.0
#2841908.2148.10.061.541.610.722.330.691.7621.9
7#138888.9127.20.122.960.710.291.010.710.8120.1
#231966.7132.60.113.770.960.251.200.791.0618.6
8#1691536.998.80.071.170.890.381.270.700.8615.2
#2591587.5106.80.061.601.100.381.490.741.0715.1
9#1551148.4145.60.092.330.920.481.390.661.3923.6
#2521144.8156.20.062.531.040.471.510.691.4424.5
10#1651704.0134.80.051.891.660.542.190.751.6620.9
#2691568.9129.20.081.381.130.561.690.671.0619.5
Mean diff. (SD) 1 (6)1 (8)0.44.40.00−0.010.080.000.090.000.150.9
t-test p-value 0.620.710.690.330.930.930.330.870.310.950.120.18
ICC 0.98 *0.99 *−0.540.68 *0.83 *0.87 *0.59 *0.91 *0.82 *0.57 *0.55 *0.81 *
ESV = end-systolic volume; EDV = end-diastolic volume; P = pressure; EDPVR = end-diastolic pressure–volume relationship; ESPVR = end-systolic pressure–volume relationship; SW = stroke work; PE = mechanical potential energy; PVA = pressure–volume area; VE = ventricular efficiency; MEP = mean external power; EEV = energy per ejected volume; #1 = first scan; #2 = second scan; ICC = intraclass correlation. * Statistically significant: p < 0.05.
Table 3. Scan–rescan left ventricular pressure–volume loop analysis results of datasets with segmentation or flow variations.
VariationESV [mL]EDV [mL]Min. P [mmHg]Max. P [mmHg]EDPVR [mmHg/mL]ESPVR [mmHg/mL]SW [J]PE [J]PVA [J]VEMEP [J/s]EEV [J/L]
Segmentation
Smaller (−7%)801717.8144.30.061.661.190.701.890.631.3320.7
Normal861848.7143.10.061.501.520.732.260.671.7023.0
Bigger (+7%)921977.4145.30.061.441.480.802.280.651.6521.7
Mean861848.0144.20.061.531.400.752.150.651.5621.8
Std6130.71.10.000.120.180.050.220.020.201.1
Rel. Std7%7%8%1%6%8%12%7%10%3%12%5%
Flow
Lower (−9.8%)861848.4131.20.061.341.410.662.070.681.5721.0
Normal861848.7143.10.061.501.520.732.260.671.7023.0
Higher (+9.8%)861848.5159.50.061.681.730.822.560.681.9326.0
Mean861848.6144.60.061.501.550.742.290.681.7423.3
Std000.114.20.000.170.170.080.250.000.182.5
Rel. Std0%0%2%10%0%11%11%11%11%0%11%11%
ESV = end-systolic volume; EDV = end-diastolic volume; P = pressure; EDPVR = end-diastolic pressure–volume relationship; ESPVR = end-systolic pressure–volume relationship; SW = stroke work; PE = mechanical potential energy; PVA = pressure–volume area; VE = ventricular efficiency; MEP = mean external power; EEV = energy per ejected volume; Std = standard deviation.
Table 4. Analysis of invasive and noninvasive pressure–volume loops in patient.
VariationESV [mL]EDV [mL]Min. P [mmHg]Max. P [mmHg]EDPVR [mmHg/mL]ESPVR [mmHg/mL]SW [J]PE [J]PVA [J]VEMEP [J/s]EEV [J/L]
Invasive662125.2124.80.0471.3681.960.512.470.791.6216.9
Noninvasive662127.0124.60.0511.3151.910.472.380.801.5816.3
Difference--1.8−0.20.005−0.053−0.05−0.04−0.090.01−0.04−0.6
Rel. difference--35%0%10%−4%−3%−8%−4%1%−3%−4%
ESV = end-systolic volume; EDV = end-diastolic volume; P = pressure; EDPVR = end-diastolic pressure–volume relationship; ESPVR = end-systolic pressure–volume relationship; SW = stroke work; PE = mechanical potential energy; PVA = pressure–volume area; VE = ventricular efficiency; MEP = mean external power; EEV = energy per ejected volume.
Disclaimer/Publisher’s Note: The statements, opinions and data contained in all publications are solely those of the individual author(s) and contributor(s) and not of MDPI and/or the editor(s). MDPI and/or the editor(s) disclaim responsibility for any injury to people or property resulting from any ideas, methods, instructions or products referred to in the content.