Systematic Review

Computer Vision Methods for Vehicle Detection and Tracking: A Systematic Review and Meta-Analysis

1
School of Sciences and Technology, Universidade de Trás-os-Montes e Alto Douro, UTAD, Quinta de Prados, 5000-801 Vila Real, Portugal
2
Altice Labs, 3810-106 Aveiro, Portugal
3
Centre for the Research and Technology of Agroenvironmental and Biological Sciences, CITAB, Inov4Agro, Universidade de Trás-os-Montes e Alto Douro, UTAD, Quinta de Prados, 5000-801 Vila Real, Portugal
*
Author to whom correspondence should be addressed.
Appl. Sci. 2025, 15(22), 12288; https://doi.org/10.3390/app152212288
Submission received: 9 October 2025 / Revised: 13 November 2025 / Accepted: 14 November 2025 / Published: 19 November 2025
(This article belongs to the Special Issue Feature Review Papers in "Computing and Artificial Intelligence")

Abstract

Automatic vehicle detection and tracking are at the core of the latest smart city developments, enhancing mobility services across the globe. Nevertheless, research in this field often suffers from inconsistent results caused by heterogeneity in datasets, methodologies and evaluation metrics. These challenges highlight the need for this systematic review, which comprises the work of 29 peer-reviewed studies extracted from Scopus and ACM Digital Library published between 2020 and 2024, focusing on integrated vehicle detection–tracking systems using fixed top-down imagery. The selected works were critically examined according to their algorithms, methodological practices, dataset characteristics and performance metrics, culminating in a meta-analysis to quantify and fairly compare results. In parallel, the broader ecosystem surrounding vehicle detection and tracking was also explored to provide a complementary perspective, including evaluation standards and dataset diversity, helping to guide future works. The findings reveal that state-of-the-art research lacks standardization of metrics and reporting, heavily relies on datasets that are incompatible with tracking benchmarks and often limited in scenario diversity, and repeatedly exhibit methodological lenience compromising reproducibility and transparency. While the meta-analysis helps contextualize the best-reported implementations, the absence of standardized practices ultimately fragments the experiment. This review consolidates the current knowledge and suggests concrete directions to improve robustness, comparability and deployment of vehicle detection and tracking systems for future smart-cities infrastructures.

1. Introduction

Urbanization has accelerated rapidly, with over 4.6 billion people—or 56% of the global population—currently residing in urban areas, according to recent United Nations projections [1]. The same report estimates that, by 2050, 6.6 billion people—or 68% of the population—will live in cities. This rapid urban shift brings urgent challenges for traffic density and the sustainability of urban transport infrastructure. Many pollutants, such as nitrogen oxides (NOx) and carbon oxides (COx), are emitted during combustion processes, with their concentrations peaking at rush hours. These gases significantly increase the risk of developing health conditions, particularly cardiovascular diseases [2]. High traffic density has implications beyond pollution, since its impact can also be observed both economically and in time unnecessarily spent on the road. In a recent urban mobility report, the average American commuter incurred in approximately USD 1200 in traffic congestion costs in 2022, with an annual travel delay reaching 54 h—figures that closely mirror pre-pandemic levels from 2019 [3]. Extended time in traffic also contributes to increasing fatigue and stress, factors that elevate the possibility of car accidents [4]. Additionally, climate change mitigation also stands as one of humanity’s greatest challenges in the 21st century, with the environmental impact of vehicles representing a particularly significant and well-documented contributor to global warming. According to a report from Our World in Data, based on Climate Watch data, CO2 emissions from transportation in 2021 accounted for 7.6 billion tons, representing approximately 20% of total global CO2 emissions [5]. Furthermore, another Our World in Data article suggested that road travel alone was responsible for 75% of all transportation emissions, contributing a staggering 15% to global CO2 emissions [6]. Providing traffic authorities with detailed reports on public road usage, enabled by vehicle detection and tracking, can support effective traffic flow monitoring and even congestion prediction. This, in turn, contributes to reducing emissions that harm both the population and the environment, saves fuel and costs, and enhances overall road safety.
Computer vision is a transformative technology that operates both independently in simpler systems and integrated with deep learning algorithms to develop intelligent solutions. It encompasses a wide range of methods, from traditional techniques such as image processing to advanced approaches like convolutional neural networks (CNNs), enabling it to play a pivotal role in addressing modern challenges across various domains of society [7]. These technologies have been successfully applied in several areas, such as agriculture [8], healthcare [9] and ecology [10]. These achievements highlight the capabilities of computer vision systems—especially when combined with deep learning algorithms—in delivering effective solutions through multiple sectors. Particularly in smart cities [11], numerous approaches have already been tested and implemented (for instance, vehicle surveillance [12] and traffic prediction [13]), providing valuable insights to traffic authorities and users so that they can monitor flow, reduce congestion, and enhance security.
However, despite the promising results and expectations surrounding computer vision and deep learning techniques, their implementation in real-world surveillance systems faces significant engineering challenges. Deep learning-based solutions typically require substantial computational resources, including high-end GPUs or TPUs, large memory capacity, and highly optimized model architectures to manage their complexity and ensure efficient training and inference [14]. In addition, training such systems demands large, annotated datasets, often consisting of thousands of labeled images captured under diverse lighting, weather, and traffic conditions—data that can be restricted or time-consuming to collect or produce [15]. Environmental factors such as rain, fog, nighttime lighting, and shadows further complicate detection, requiring robust models capable of adapting to these urban dynamics. Furthermore, deploying these solutions in real-time settings introduces additional constraints, as low-latency inference and support for edge computing become critical for timely decision making in surveillance applications [14].
In parallel, several methodological issues are evident throughout our review of how the current scientific literature approaches the evaluation of these systems. One major concern is the lack of standardization in the reporting of results; many studies present selected metrics while omitting others, making it difficult to conduct fair comparisons and perform meta-analyses. Even within commonly used metrics, such as average precision (AP), inconsistencies arise when some papers report mean average precision (mAP) at fixed thresholds like mAP@0.5 or even mAP@0.35, while others report a range such as mAP@[0.5:0.95]. Similarly, inconsistencies in dataset usage present another problem. Some researchers use private or modified subsets of public datasets without clearly specifying the differences, increasing the risk of data leakage and misleading comparisons. These limitations emphasize the need for a comprehensive evaluation of existing approaches and a clear, critical analysis of their reported results, motivating this systematic review.
To assess the research gaps addressed in prior reviews and position this work as thoroughly comprehensive in comparison, a search strategy was designed to locate relevant reviews published since 2020 that address similar problems as ours, particularly vehicle detection and tracking implementations through images acquired by surveillance cameras. The search query is defined as follows: (“computer vision” OR “deep learning”) AND (“vehicle detection” AND “vehicle tracking”) AND (“review” OR “literature review” OR “systematic review” OR “review article”). The Scopus and IEEE Xplore databases were selected for this task due to their reputation for indexing high-quality and peer-reviewed scientific literature. Clearly off-topic papers were excluded from this analysis. The references and limitations of the selected studies are presented in Table 1 below.
This systematic review aims to address the engineering challenges and methodological inconsistencies, along with the research gaps in the existing literature identified in Table 1. It does so by providing a comprehensive evaluation of vehicle detection and tracking implementations, focusing on qualitative and quantitative analysis, algorithms, datasets, and evaluation metrics. This review is structured as follows: the Methodology section describes the research questions, search strategies and selection criteria; the Results and Discussion section presents the main findings, highlighting performance, key trends and strengths/limitations from the selected studies; lastly, the Conclusion section synthesizes the insights and suggests directions for future research. This structure ensures a transparent, replicable and rigorous analysis that enhances understanding of the topic.

2. Methodology

The methodology section clearly describes the refinement of this study, including the research questions, exclusion criteria, databases used, and other methodological considerations. The section concludes with a discussion regarding the number of articles selected and their significance in shaping the contributions of this study.
The PRISMA (Preferred Reporting Items for Systematic Reviews and Meta-Analyses) framework [22] provides a structuring methodology for conducting systematic reviews, ensuring the transparency and reproducibility of the methods. By adhering to the steps outlined in PRISMA and following the same procedures as this study, other researchers will likely reach similar conclusions, reinforcing the reliability and consistency of the review findings.
It is crucial to previously define the research questions, followed by the inclusion and exclusion criteria, databases and overall search strategy, and finishing with the PRISMA flow diagram and article selection process, with the purpose of ensuring a rigorous and transparent systematic review.

2.1. Research Questions

To properly guide this systematic review, a set of research questions was established to explore the current landscape of studies focusing on vehicle detection and tracking, analyzing critical components such as algorithms, architectures, datasets, and performance metrics. They are as follows:
RQ1: How do different detection and tracking algorithms compare in terms of performance?
RQ2: Which computer vision algorithms and architectures are commonly employed for vehicle detection and tracking?
RQ3: Which datasets are most widely adopted throughout the literature?
RQ4: Which performance metrics are frequently used to evaluate detection and tracking algorithms?

2.2. Search Strategy

In this subsection, we describe the strategy used to retrieve the selected studies.

2.2.1. Sources

The databases explored were Scopus and ACM Digital Library. These databases were chosen due to their extensive collection of high-quality, peer-reviewed articles in the fields of computer science, engineering and artificial intelligence. Other sources such as Springer Nature and IEEE Xplore were not selected since an unmanageable number of references were retrieved, even after applying all the exclusion criteria; arXiv did not ensure the peer-reviewed-only studies policy; and finally, Web of Science did not allow the authors to search for any documents with their institutional accounts. For these reasons, those databases were excluded. Concerning Scopus, the search was conducted in December 2024, while for ACM Digital Library, the search was conducted in October 2025.

2.2.2. Search Query Design

The search criteria were designed to identify articles that address our research questions. To achieve this, a set of targeted words were developed to ensure comprehensive coverage and specified analysis, avoiding irrelevant results. The following query was generated: (“Vehicle detection” AND “Vehicle tracking”) OR (“Vehicle tracking” AND “Computer vision”) OR (“Vehicle detection” AND “Deep learning”).

2.2.3. Inclusion and Exclusion Criteria

To encompass the latest developments in vehicle detection and vehicle tracking, this review focuses on articles published from the year 2020 to 2024, ensuring the analysis is aligned with recent advancements. However, some seminal works published before 2020 are foundational to our understanding of key approaches discussed and, while not included directly in this study’s main selection, they are referenced throughout this review when relevant.
Another restriction is that only research articles are included, as these provide comprehensive overviews and original findings while minimizing the risk of incorporating speculative content, thus maintaining a good standard for ensuring methodological rigor and academic trustworthiness.
Studies that lack robust statistical analysis, employ flawed experimental design, have insufficient methodological transparency, or fail to align with our research questions will also be excluded. This rigorous selection process guarantees that the final dataset consists only of high-quality and relevant studies that directly contribute to addressing the research objectives.
Every single study considered should be published in the English language to ensure the accessibility and comprehensibility of the research material. Given that English is widely recognized as the dominant language in the scientific community, restricting the review to English-language articles confirms that they are likely part of core scientific discourse and accessible to a more international audience, allowing for a standardized comparison of results with other works.
Some keywords that were clearly irrelevant to our research were removed to avoid the inclusion of unrelated articles and simplification of the analytical process.
Following the initial triage, a more granular set of exclusion criteria related to the content of the retrieved studies was applied. First, literature or systematic reviews were excluded, as this review only includes original findings. Studies that employ a methodology incoherent with the objectives of this study were also not selected. Papers that lack a clear integration of both detection and tracking models into a single system were also not considered. The analysis was also centered on pipelines using fixed top-down imagery to detect and track vehicles, so all studies utilizing ground-level, drone, or any other perspectives were also not considered. Finally, this review focuses on articles analyzing regular image formats, with minimal or no distortion, leading to the exclusion of studies that examine alternative spectral bands or specialized angles of view.
The inclusion and exclusion criteria defined for this systematic review ensure that only high-quality, relevant articles are considered, consequently improving the overall quality and reliability of the research.

2.2.4. Data Extraction

The PRISMA flow diagram [23] was developed to illustrate each stage of the article selection process, which can assist in the interpretation of this review’s decisions.
As shown in Figure 1, the query returned 2334 instances from the Scopus database. By sequentially implementing some exclusion criteria, 2033 articles were automatically removed, and by restraining irrelevant keywords, another 112 were removed. As for the ACM Digital Library database, the number of references retrieved from the query was 684. Following the same exclusion criteria implementation, 647 papers were automatically removed. This process yielded a total of 226 for preliminary screening, but 1 reference was dropped, since it was a duplicate between both databases. After reviewing titles and abstracts, 87 of those were removed due to lack of relevance. The remaining 138 underwent full-text review. Of these, 2 studies could not be retrieved, 15 employed a flawed methodology, 65 failed to address detection and tracking integration, 18 did not perform top-view imagery analysis, 1 did not employ standard image formats, and 7 were literature/systematic reviews rather than original implementations. Ultimately, 29 studies met the full inclusion criteria and were selected for detailed analysis and scrutiny in this article.
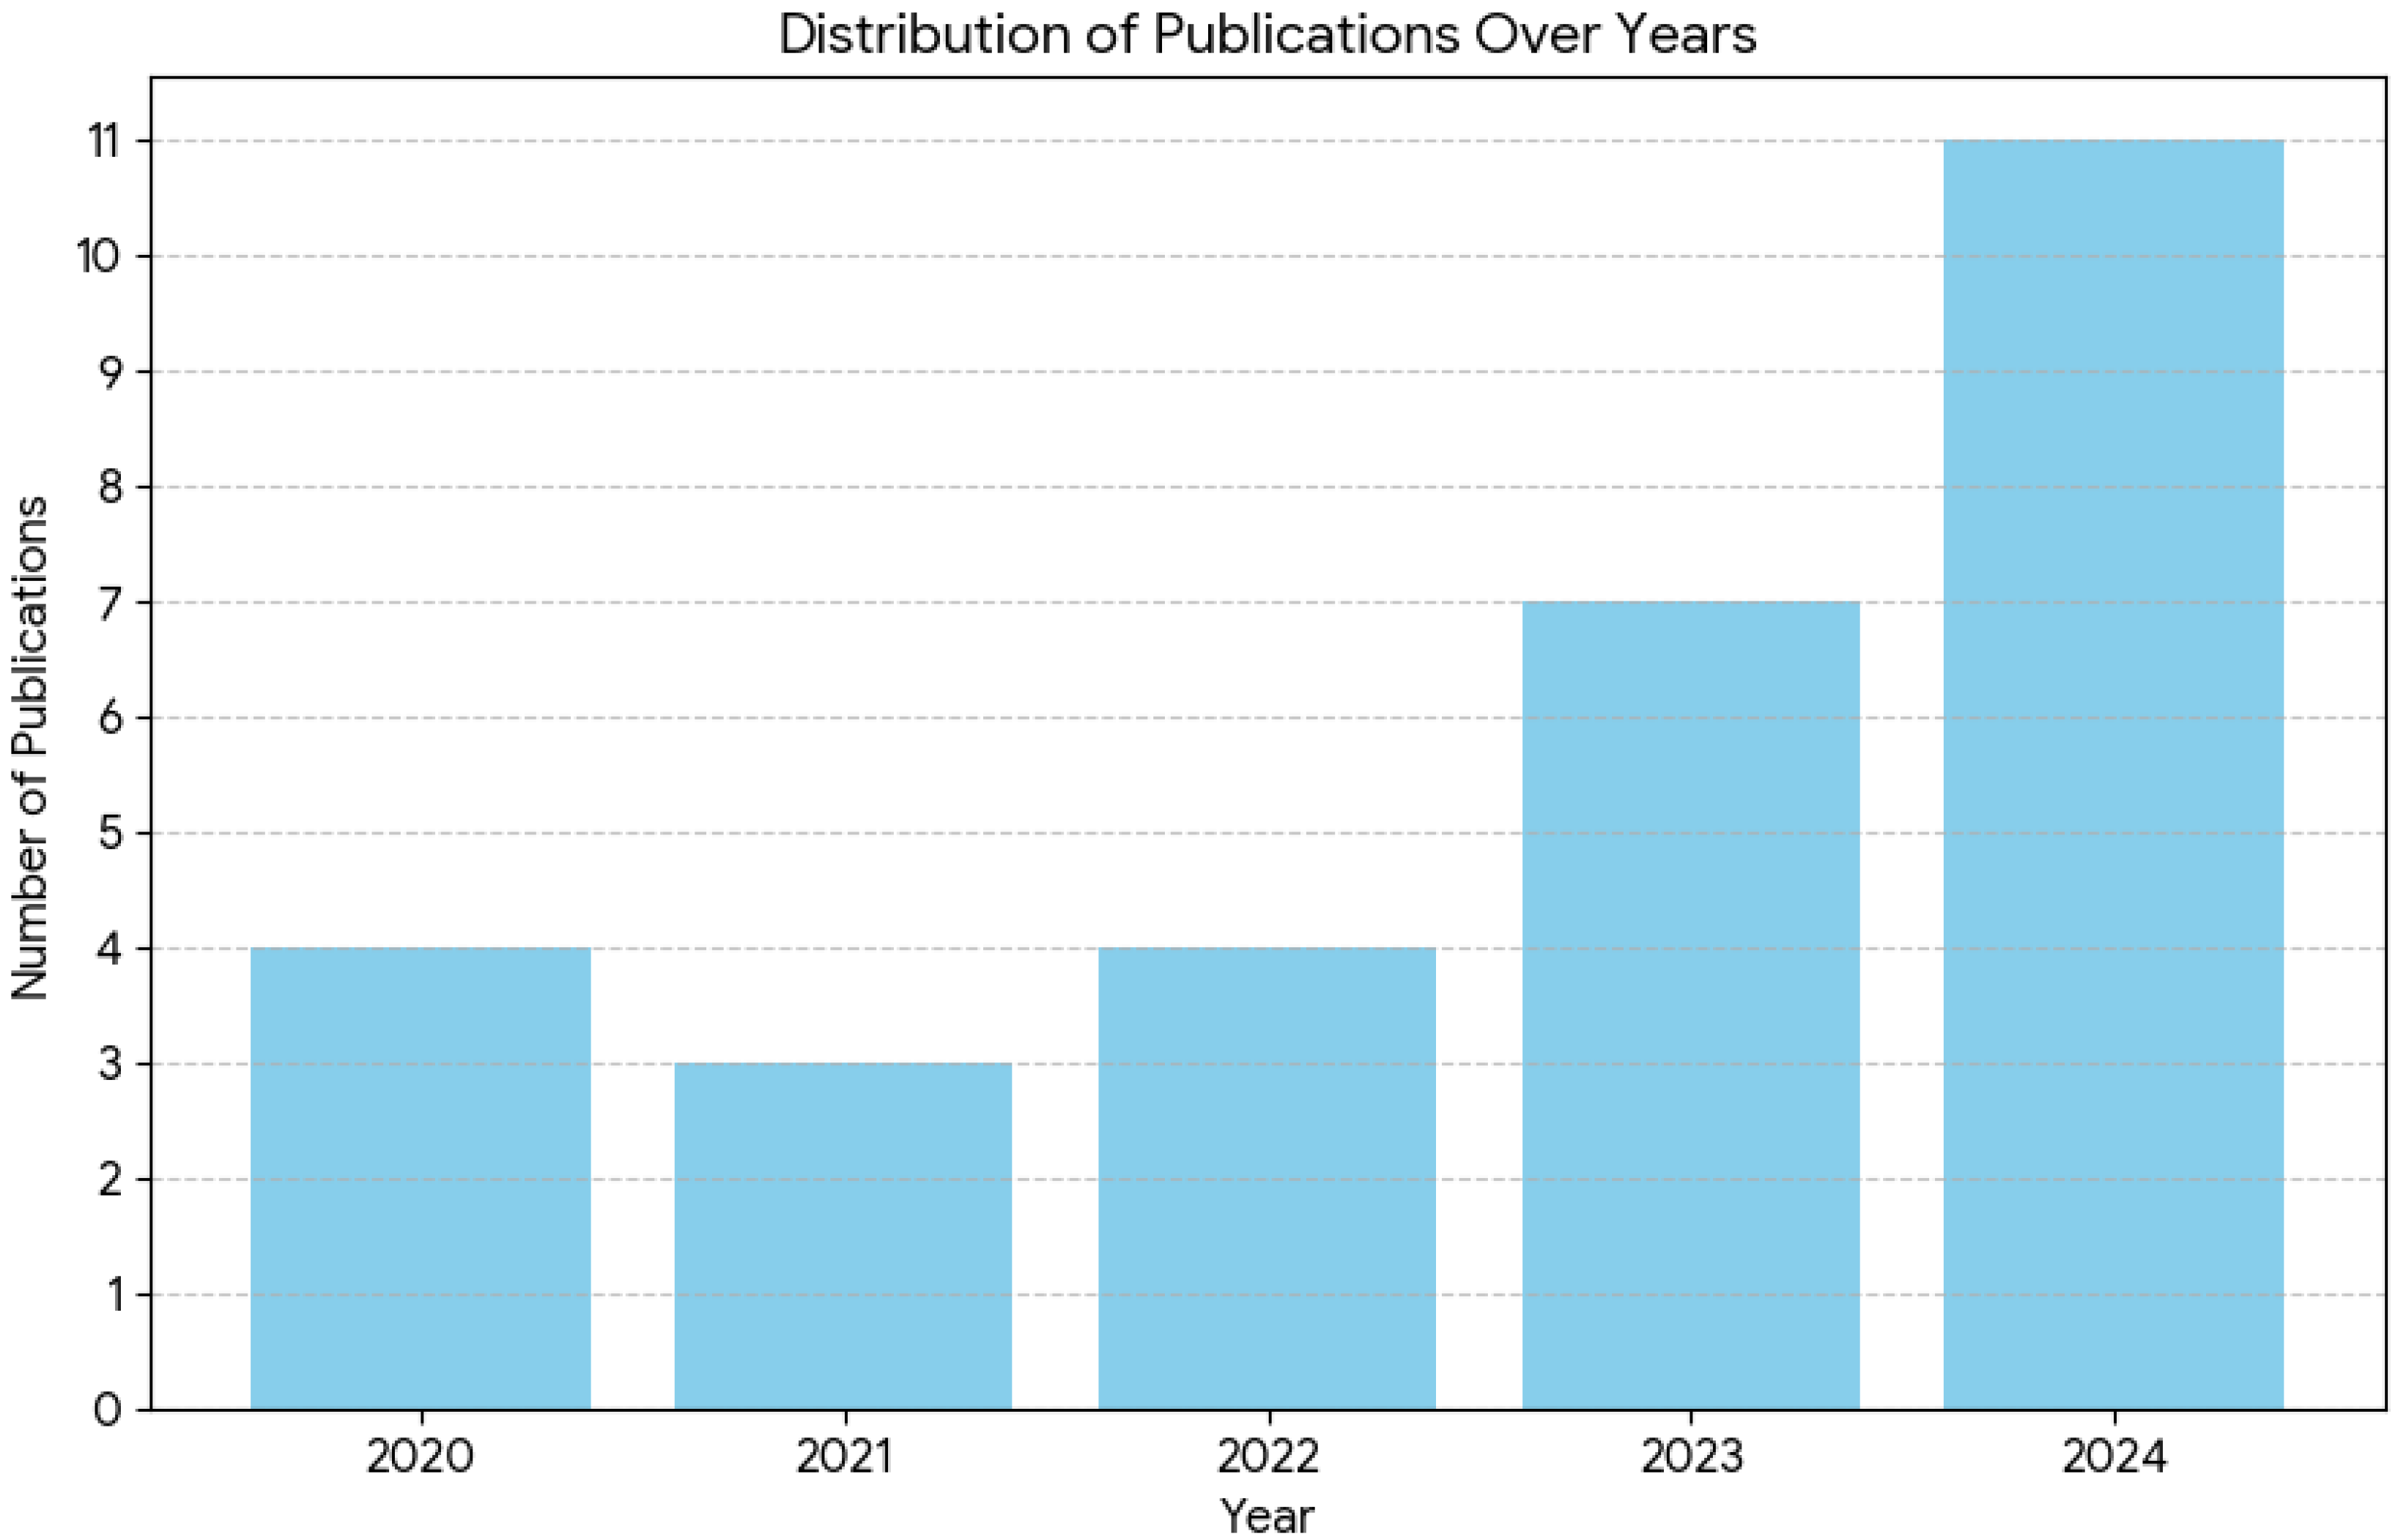
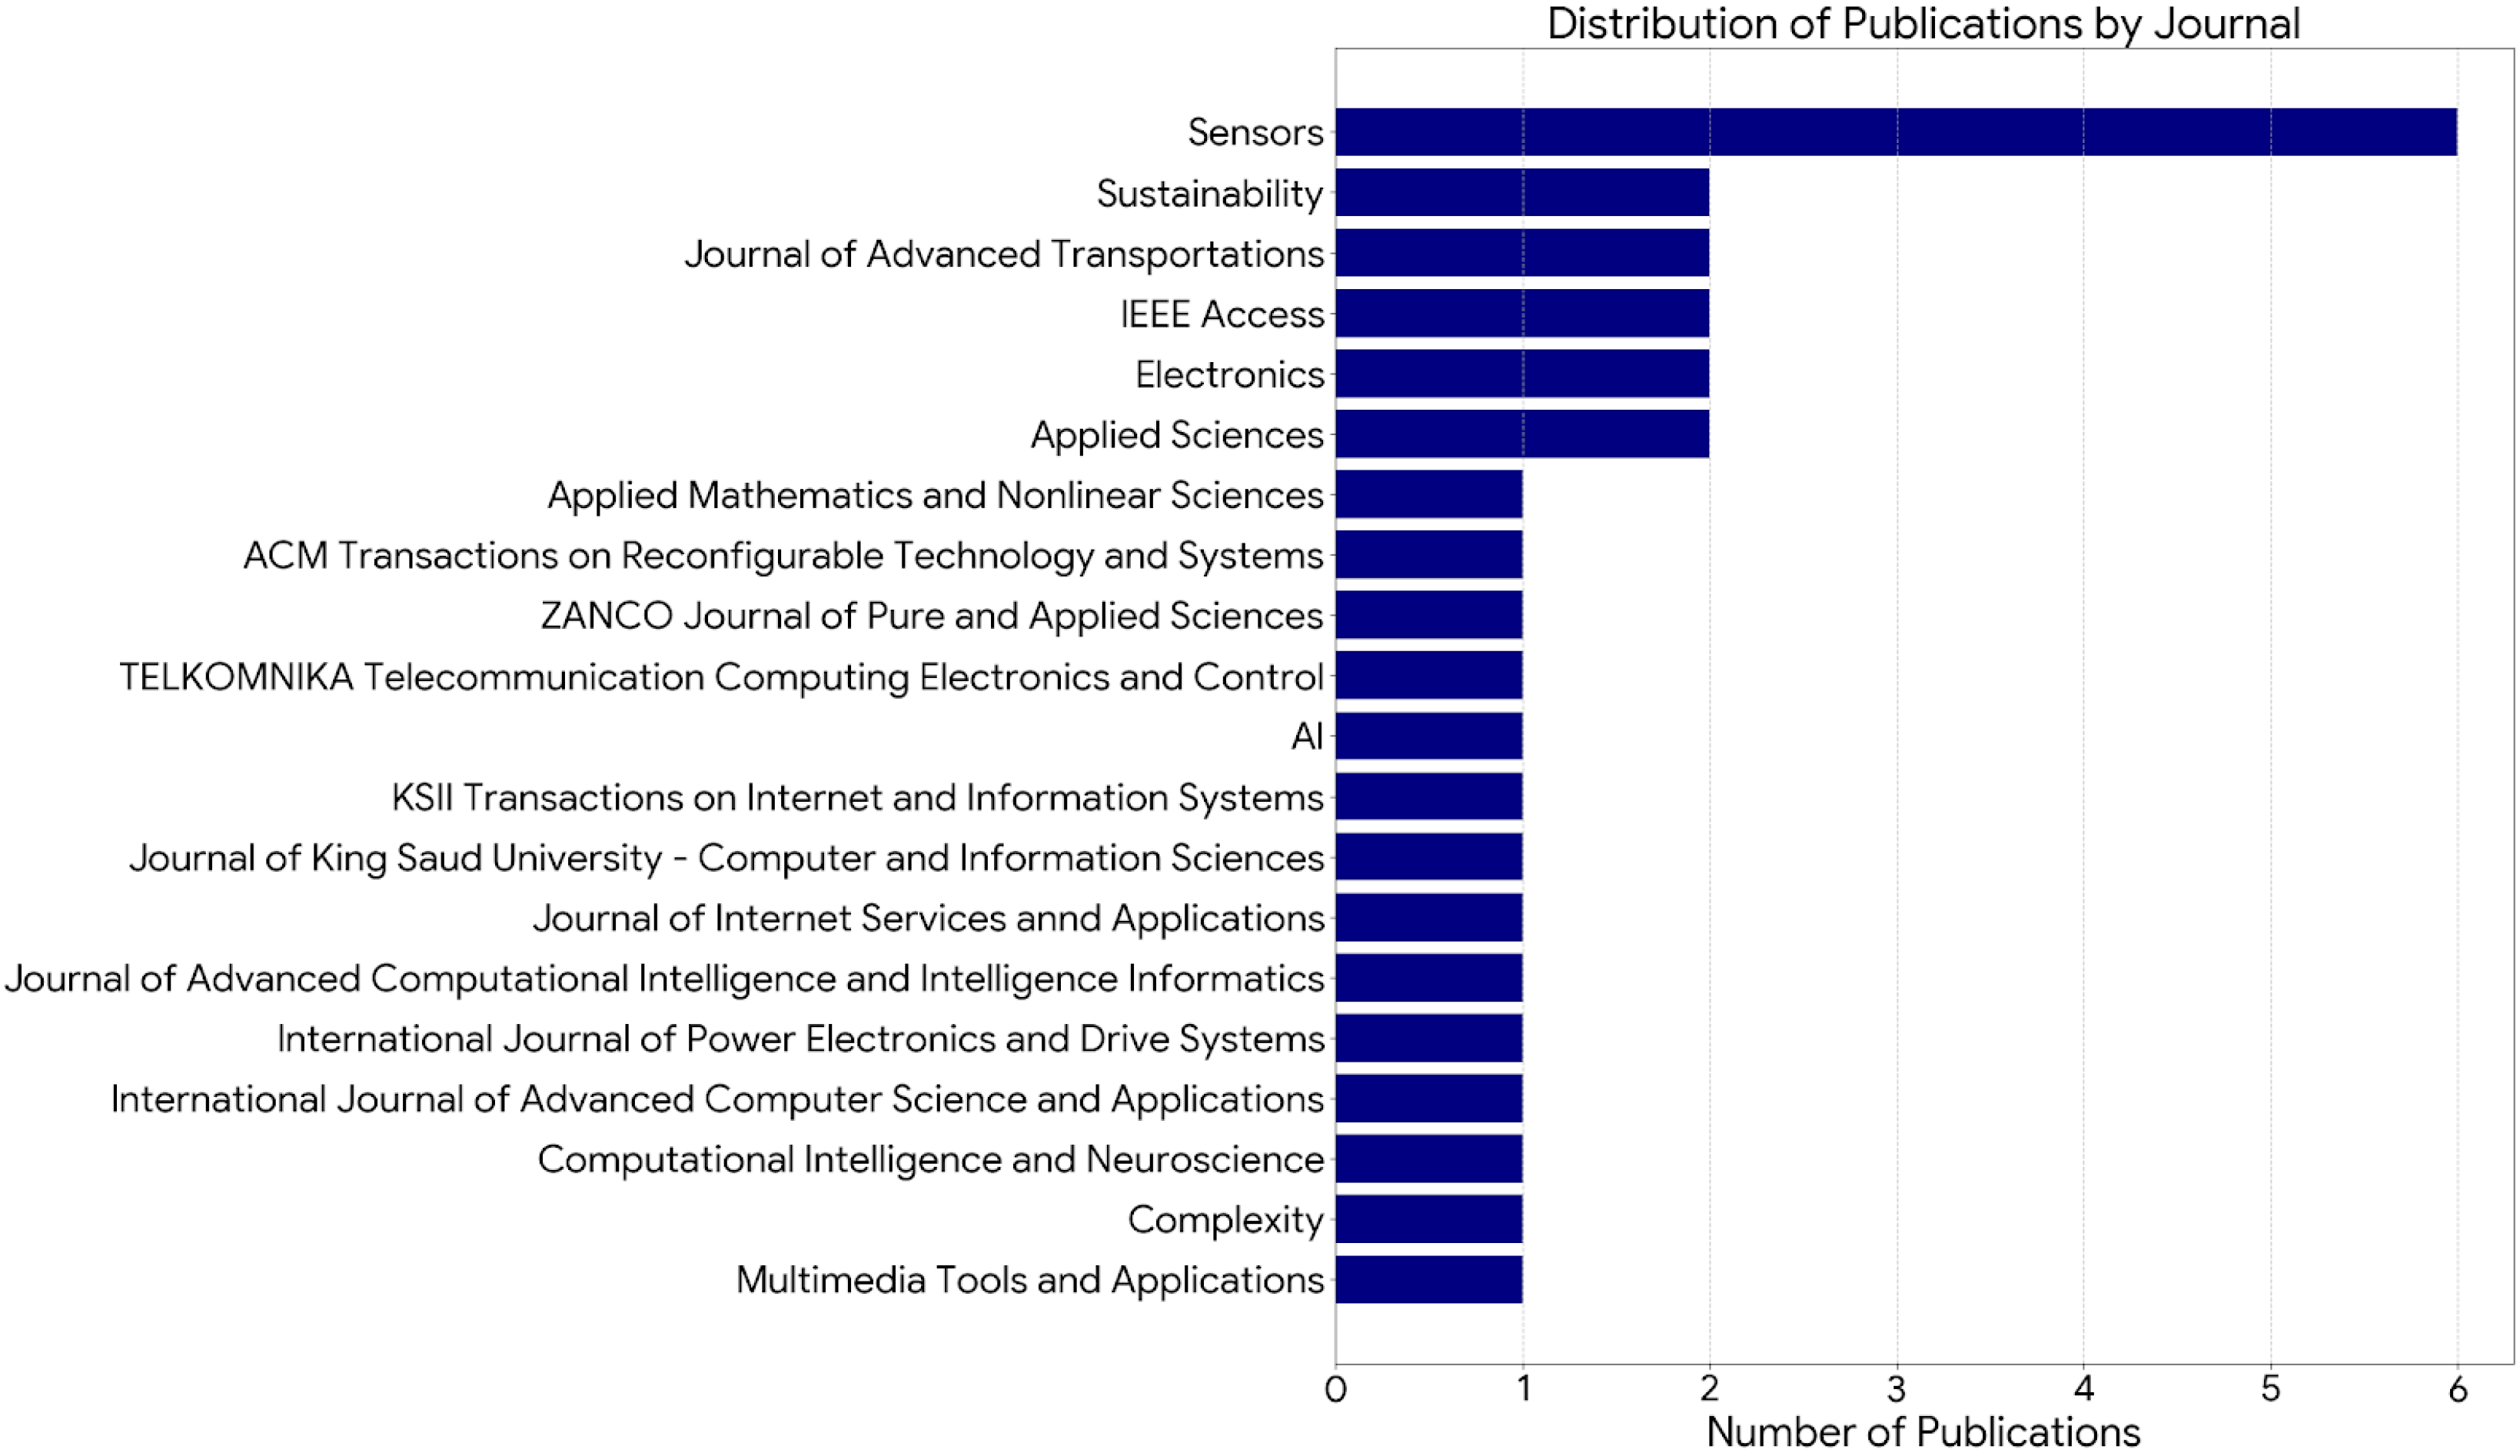
The bibliographic analysis of each study, through Figure 2, highlights a clear increase in the popularity of vehicle detection and tracking research, with the year 2024 alone retrieving 11 of the 29 selected articles and showing a consecutive rising trend all the way from 2021. Among journals, Figure 3 shows that Sensors contributed the most, publishing 6 of the selected papers.

3. Results and Discussion

This section synthesizes the findings from the 29 selected studies, directly addressing the research questions on vehicle detection and tracking. It begins by examining the performance metrics commonly used to evaluate each system, supported by their specific algorithmic approaches. This is followed by an overview of the datasets most frequently utilized across the studies and then a detailed analysis of each individual study supported by a summary table. Finally, a meta-analysis is performed to integrate the overall insights.

3.1. Performance Metrics

3.1.1. Detection-Related Metrics

Many of the metrics commonly used to conduct object detection experiments were standardized by the Pascal Visual Object Classes (VOC) 2007 Challenge [24], which established a consistent evaluation protocol that has since been established by Computer Vision benchmarks.
  • Precision
Precision measures the accuracy of the predictions by calculating the proportion of correct positive predictions (TP) among all predicted positives (TP + FP). The formula is given by
P r e c i s i o n = T P T P + F P
  • Recall
Recall measures how well a model identifies all the correct positives (TP) among all actual positive cases (TP + FN). The formula is given by
R e c a l l = T P T P + F N
  • Precision–Recall Curve
The precision–recall curve visualizes the trade-off between the precision and recall metrics across a threshold of confidence values. As the threshold for positive predictions changes, the model may gain more recall at a cost of prediction, or vice versa.
  • Average Precision (AP) and Average Recall (AR)
Average precision and average recall quantify the model’s ability to maintain high precision across varying recall levels and high recall across varying precision levels, respectively, for a specific class. Their measurement is commonly computed through 11 evenly spaced points, ranging from 0 all the way to 1, and averaging the results to summarize the performance along the full prediction confidences. In some cases, metrics such as AP@r or AR@r report the corresponding precision/recall value for a threshold value r, while AP@[r1: r2] or AR@[r1: r2] represent the values across a fixed length of thresholds r1 and r2. Both formulas are represented below:
A v e r a g e   P r e c i s i o n = 1 11 r = 0 1 p m a x ( r ) , r [ 0 , 0.1 , , 1 ]
A v e r a g e   R e c a l l = 1 11 r = 0 1 r m a x ( p ) , r [ 0 , 0.1 , , 1 ]
  • Mean Average Precision (mAP) and Mean Average Recall (mAR)
Mean average precision and mean average recall extend the concepts of average precision and average recall by averaging their values across all evaluated classes. Both formulas are shown below:
M e a n   A v e r a g e   P r e c i s i o n = 1 k i k A P i
M e a n   A v e r a g e   R e c a l l = 1 k i k A R i
  • F1-Score
The F1-score is the harmonic mean of precision and recall, a single metric that demonstrates both the model’s correctness (precision value) and completeness (recall value). Its formula is presented below:
F 1 - S c o r e = 2 × P r e c i s i o n × R e c a l l P r e c i s i o n + R e c a l l
  • Intersection over Union (IoU)
Intersection over union (IoU) is a metric used to evaluate the performance of detection and segmentation models, specifically measuring the overlap between the predicted bounding box, or segmentation mask, and the ground truth and quantifying how well the predicted region matches the object’s location. Its formula is described below:
I n t e r s e c t i o n   o v e r   U n i o n = A r e a   o f   I n t e r s e c t i o n A r e a   o f   U n i o n
  • Jaccard Index
The Jaccard index is used to evaluate the proportion of correct positives predictions relative to the total number of positive instances, both in the prediction and truth sets. The formula is detailed below:
J a c c a r d   I n d e x = | T P | T P + F N + | F P |

3.1.2. Tracking-Related Metrics

The CLEAR-MOT metrics, including MOTA and MOTP, were first introduced in the 2006 CLEAR-MOT Challenge [25] and later formalized in a widely cited 2008 paper [26], providing a standardized framework for evaluating multi-object detection systems that has since been widely adopted. The MT, FM, ML, and IDSW metrics were originally defined in 2006 [27], complementing MOTA and MOTP. Later, in 2016 [28], the IDF1 metric was also introduced. More recently, in 2020, the HOTA framework [29] was proposed to address some limitations of CLEAR-MOT, offering a modern evaluation approach through metrics such as DetA, AssA, HOTA, DetRe, DetPr, AssRe, AssPr and LocA.
  • Multiple Object Tracking Accuracy (MOTA)
MOTA is a metric that evaluates overall tracking performance, specifically penalizing the number of false negatives (FNs), false positives (FPs) and identity switches (IDSWs) relative to the ground truth detection values (gtDet). It produces a score between 0 and 1, where values closer to 1 indicate more tracking accuracy and values closer to 0 indicate more flaws. Sometimes, a mean MOTA (mMOTA) metric is used, but it is generally the same concept as standard MOTA but across all classes.
M O T A = 1 t F N + | F P | + | I D S W | t | g t D e t |
  • Multiple Object Tracking Precision (MOTP)
MOTP measures the location precision of a tracking system by evaluating how well the predicted bounding box positions align with the ground truth based on the average distance between correctly matched object pairs across all frames.
M O T P = t , i d t , i t c t
  • Mostly Tracked (MT) and Mostly Lost (ML)
MT and ML are identity-based metrics. MT (mostly tracked) indicates that an object is correctly tracked for at least 80% of its trajectory, while ML (mostly lost) indicates that an object is tracked for less than 20% of its trajectory.
  • IDSW
Identity switch is a metric that counts the number of times a tracker assigns a wrong ID to a given object after previously assigning the correct one, providing a clear indication of how consistent the tracker is in maintaining identity association.
  • Fragmentation (FM)
Fragmentation is a metric that measures how many times an object’s trajectory is interrupted or lost, indicating how often the tracker loses the object’s ID and later reacquires it.
  • Identity F1-Score (IDF1)
IDF1 focuses on how well the tracker consistently identifies an object over time, based on the concepts of identity precision and recall. A value closer to 1 tells that the model is good at both detecting objects and maintaining consistent identities, while closer to 0 means it is struggling at those tasks. Sometimes, a mean IDF1 (mIDF1) metric is used, but it is generally the same concept as standard IDF1 but across all classes.
I D F 1 = 2 × I D T P 2 × I D T P + I D F P + I D F N
  • Precision–Recall Metrics (PR-MOTA, PR-MOTP, PR-MT, PR-ML, PR-IDSW, PR-FM and PR-IDF1)
PR-based metrics are computed by integrating each tracking metric over a precision–recall curve, which is formed by varying the confidence threshold. For each point on the curve, a tracking metric is calculated, resulting in a score ψ (precision, recall), which represents the area under the metric surface.
P R   M e t r i c = 1 2 C Ψ p , r d s
  • Displacement Error (DetA)
DetA quantifies the average displacement between the predicted and ground truth object’s location across all frames.
D e t A α = | T P α | | T P α | + | F N α | + | F P α |
  • Assignment Error (AssA)
AssA measures how well the model matches object’s identities with the ground truth over time.
A s s A α = 1 | T P | c { T P } | T P A c | | T P A c | + | F N A c | + | F P A c |
  • Higher-Order Tracking Accuracy (HOTA)
HOTA is a comprehensive metric that combines both detection and association accuracy by associating DetA and AssA. It balances the localization precision and the identity consistency across different threshold levels. The parameter α allows weight adjustments for each metric, offering flexibility to HOTA.
H O T A α = D e t α × A s s α
H O T A = 0 1 H O T A α , α { 0.05 , 0.1 , , 0.95 }
  • Detection Recall (DetRe)
DetRe is a metric that quantifies the number of missed detections across frames by considering how many ground truth objects were not detected.
D e t R e α = | T P α | | T P α | + | F N α |
  • Detection Precision (DetPr)
DetPr is responsible for measuring how well the model manages to not predict extra objects that are not present in the scene.
D e t P r α = | T P α | | T P α | + | F P α |
  • Association Recall (AssRe)
AssRe measures how well the predicted trajectories match the ground truth trajectories.
A s s R e α = 1 | T P | c { T P } | T P A c | | T P A c | + | F N A c |
  • Association Precision (AssPr)
AssPr measures how well the predicted trajectory follows the same ground truth object.
A s s P r α = 1 | T P | c { T P } | T P A c | | T P A c | + | F P A c |
  • Localisation Accuracy (LocA)
LocA is a metric that evaluates how well the predicted object region aligns with the ground truth positions.
L o c A = 0 1 1 | T P α | c { T P α } S c d α

3.2. Datasets

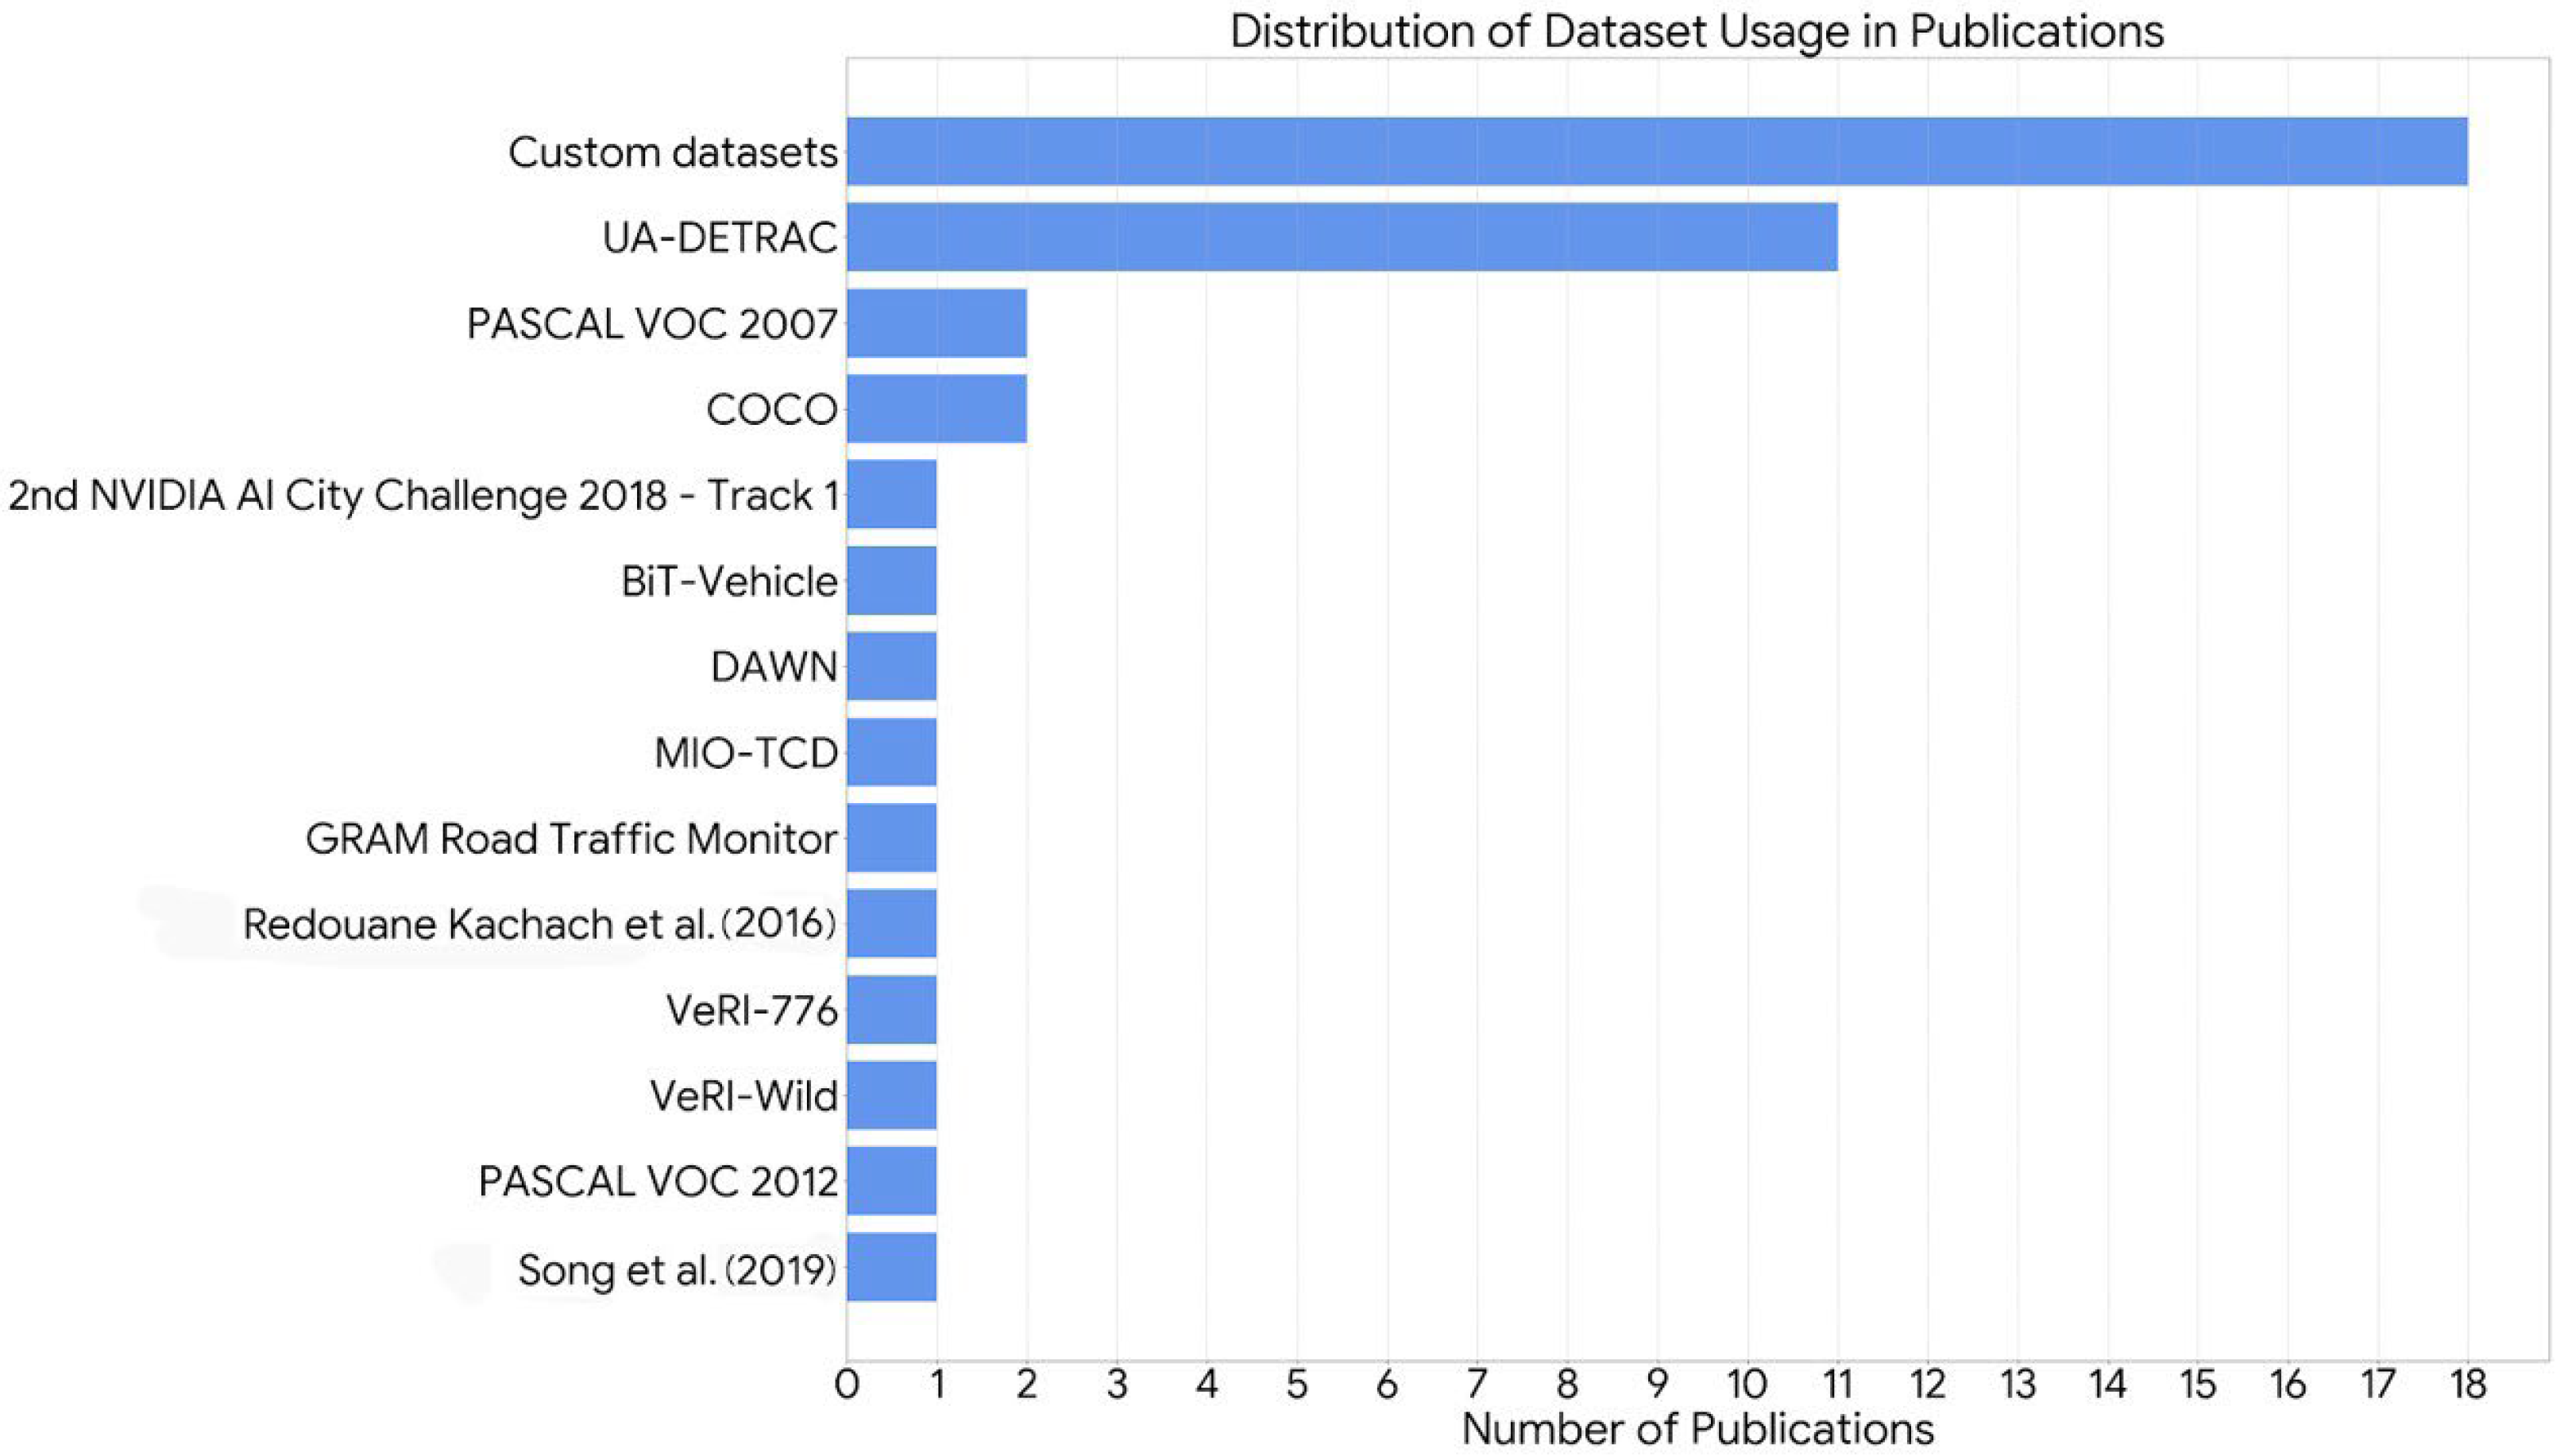
This section provides a description of the datasets used in the selected studies. It is worth noting that only datasets with publicly available references and proper documentation were analyzed, since most custom approaches were created solely for their specific implementations. Table 2 summarizes every publicly accessible dataset, including references, number of images, image sizes, number of classes, availability and problem domain. Then, Table 3 explains which contexts and scenarios are covered from frame-based datasets. Finally, a bar chart ranks them by frequency of use across studies, with the most commonly employed collections of data listed first.
According to Table 1, while MPI Sintel [42] was utilized in one of the reviewed studies, its primary purpose differs from the other datasets, as it is designed for evaluating optical flow and motion estimation rather than vehicle detection or tracking and was therefore not included in the official dataset selection. Among the selected references, UA-DETRAC stands out as the only standardized dataset that supports not just tracking but also an evaluation of its performance. The reason lies in its annotations, which include not only standard bounding box information but also unique IDs for each vehicle, enabling direct comparisons between predicted and ground truth identities, allowing comprehensive evaluations. In contrast, the other datasets that were also capable of integrating detection and tracking pipelines simultaneously described their “Problem Domain” as limited, since they lack such ground truth ID annotations, preventing tracking metrics from being computed.
Table 3 delineates the specific scenarios under which the included systems were trained and tested across the video-based datasets. Both UA-DETRAC and MIO-TCD stand out for their exceptional coverage, checking all the six possible scenarios, outlining their comprehensibility and resilience in diverse real-world challenges.
As demonstrated in Figure 4, a total of 18 articles use Custom Datasets for training or evaluation, highlighting their popularity. UA-DETRAC is a close second, referenced in 11 studies.

3.3. Article’s Analysis

This section presents summaries of the studies included in this systematic review, with special attention to their methodology design and results reporting. In the Summaries and Critiques subsection, each summary for every selected study is presented, concluding with critical remarks highlighting the study’s relevance as well as its strengths and limitations. Subsequently, three tables recap all the relevant information for each reference, and they are organized based on the detection algorithms used: the first focuses only on YOLO-based approaches, which really stand out in terms of popularity; the second covers other detector families; and the third is dedicated to novel approaches.
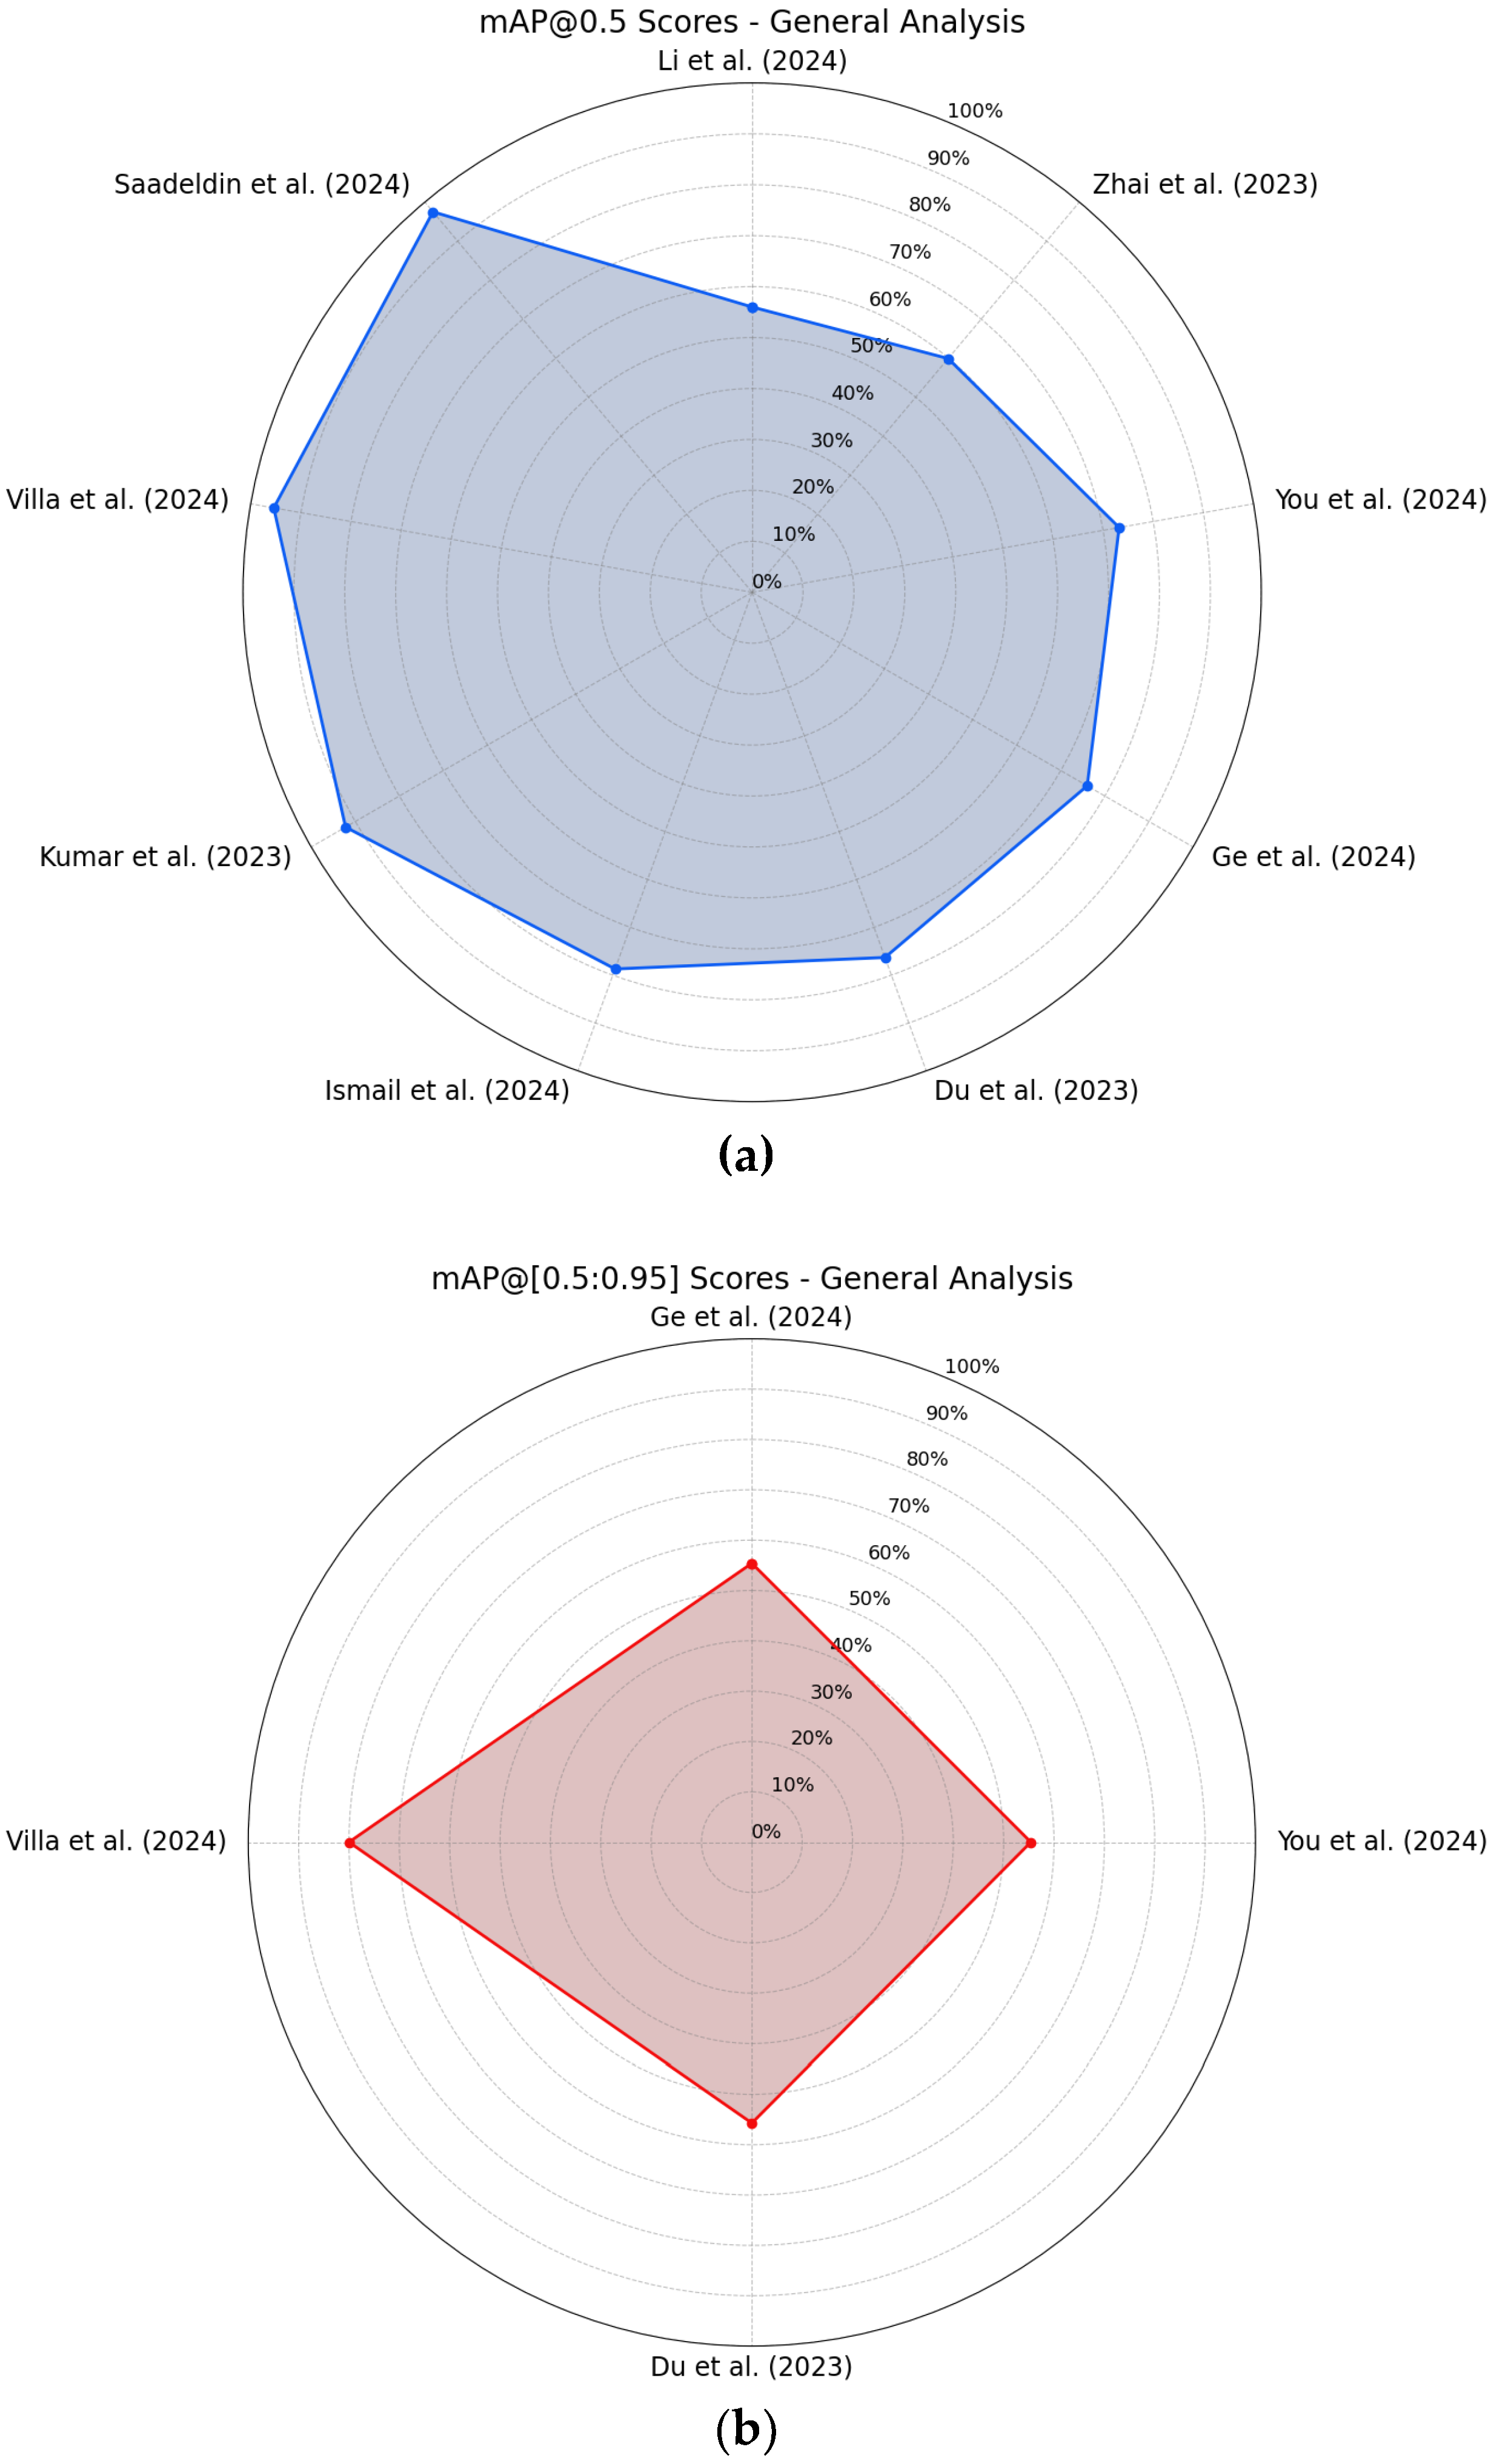
One study [43] explores a system combining YOLOv5m6, SSD and Mask R-CNN, all initialized with pre-trained weights, using the DeepSORT tracker. The dataset used for training merges three different sources: IStock videos, an open-source dataset by Song et al. 2019 [31], and a custom dataset made by videos acquired in the Kurdistan Region (split into 70% for training, 20% for validation and 10% for testing). The use of a virtual polygon zone to restrict counting to highways enhances reliability and robustness, since it allows the system to only perform detection in those specific areas. When evaluated, the systems with the YOLOv5m6, SSD and Mask R-CNN achieved an average counting accuracy of 95%, 84% and 91% and an mAP@0.5 of 78.7%, 83.2% and 76.5%, for a test conducted on another custom dataset composed of images acquired in Kirkuk Road. While mAP@0.5 is a great metric with which to report and is widely used across the literature, the use of the non-standard “average counting accuracy” metric, without a formal definition, weakens reproducibility. Based on context, it likely refers to the ratio between the number of counted vehicles and the actual number, but it is just speculation. Additionally, the lack of more comprehensive detection and specially tracking metrics renders the evaluation overly simplistic.
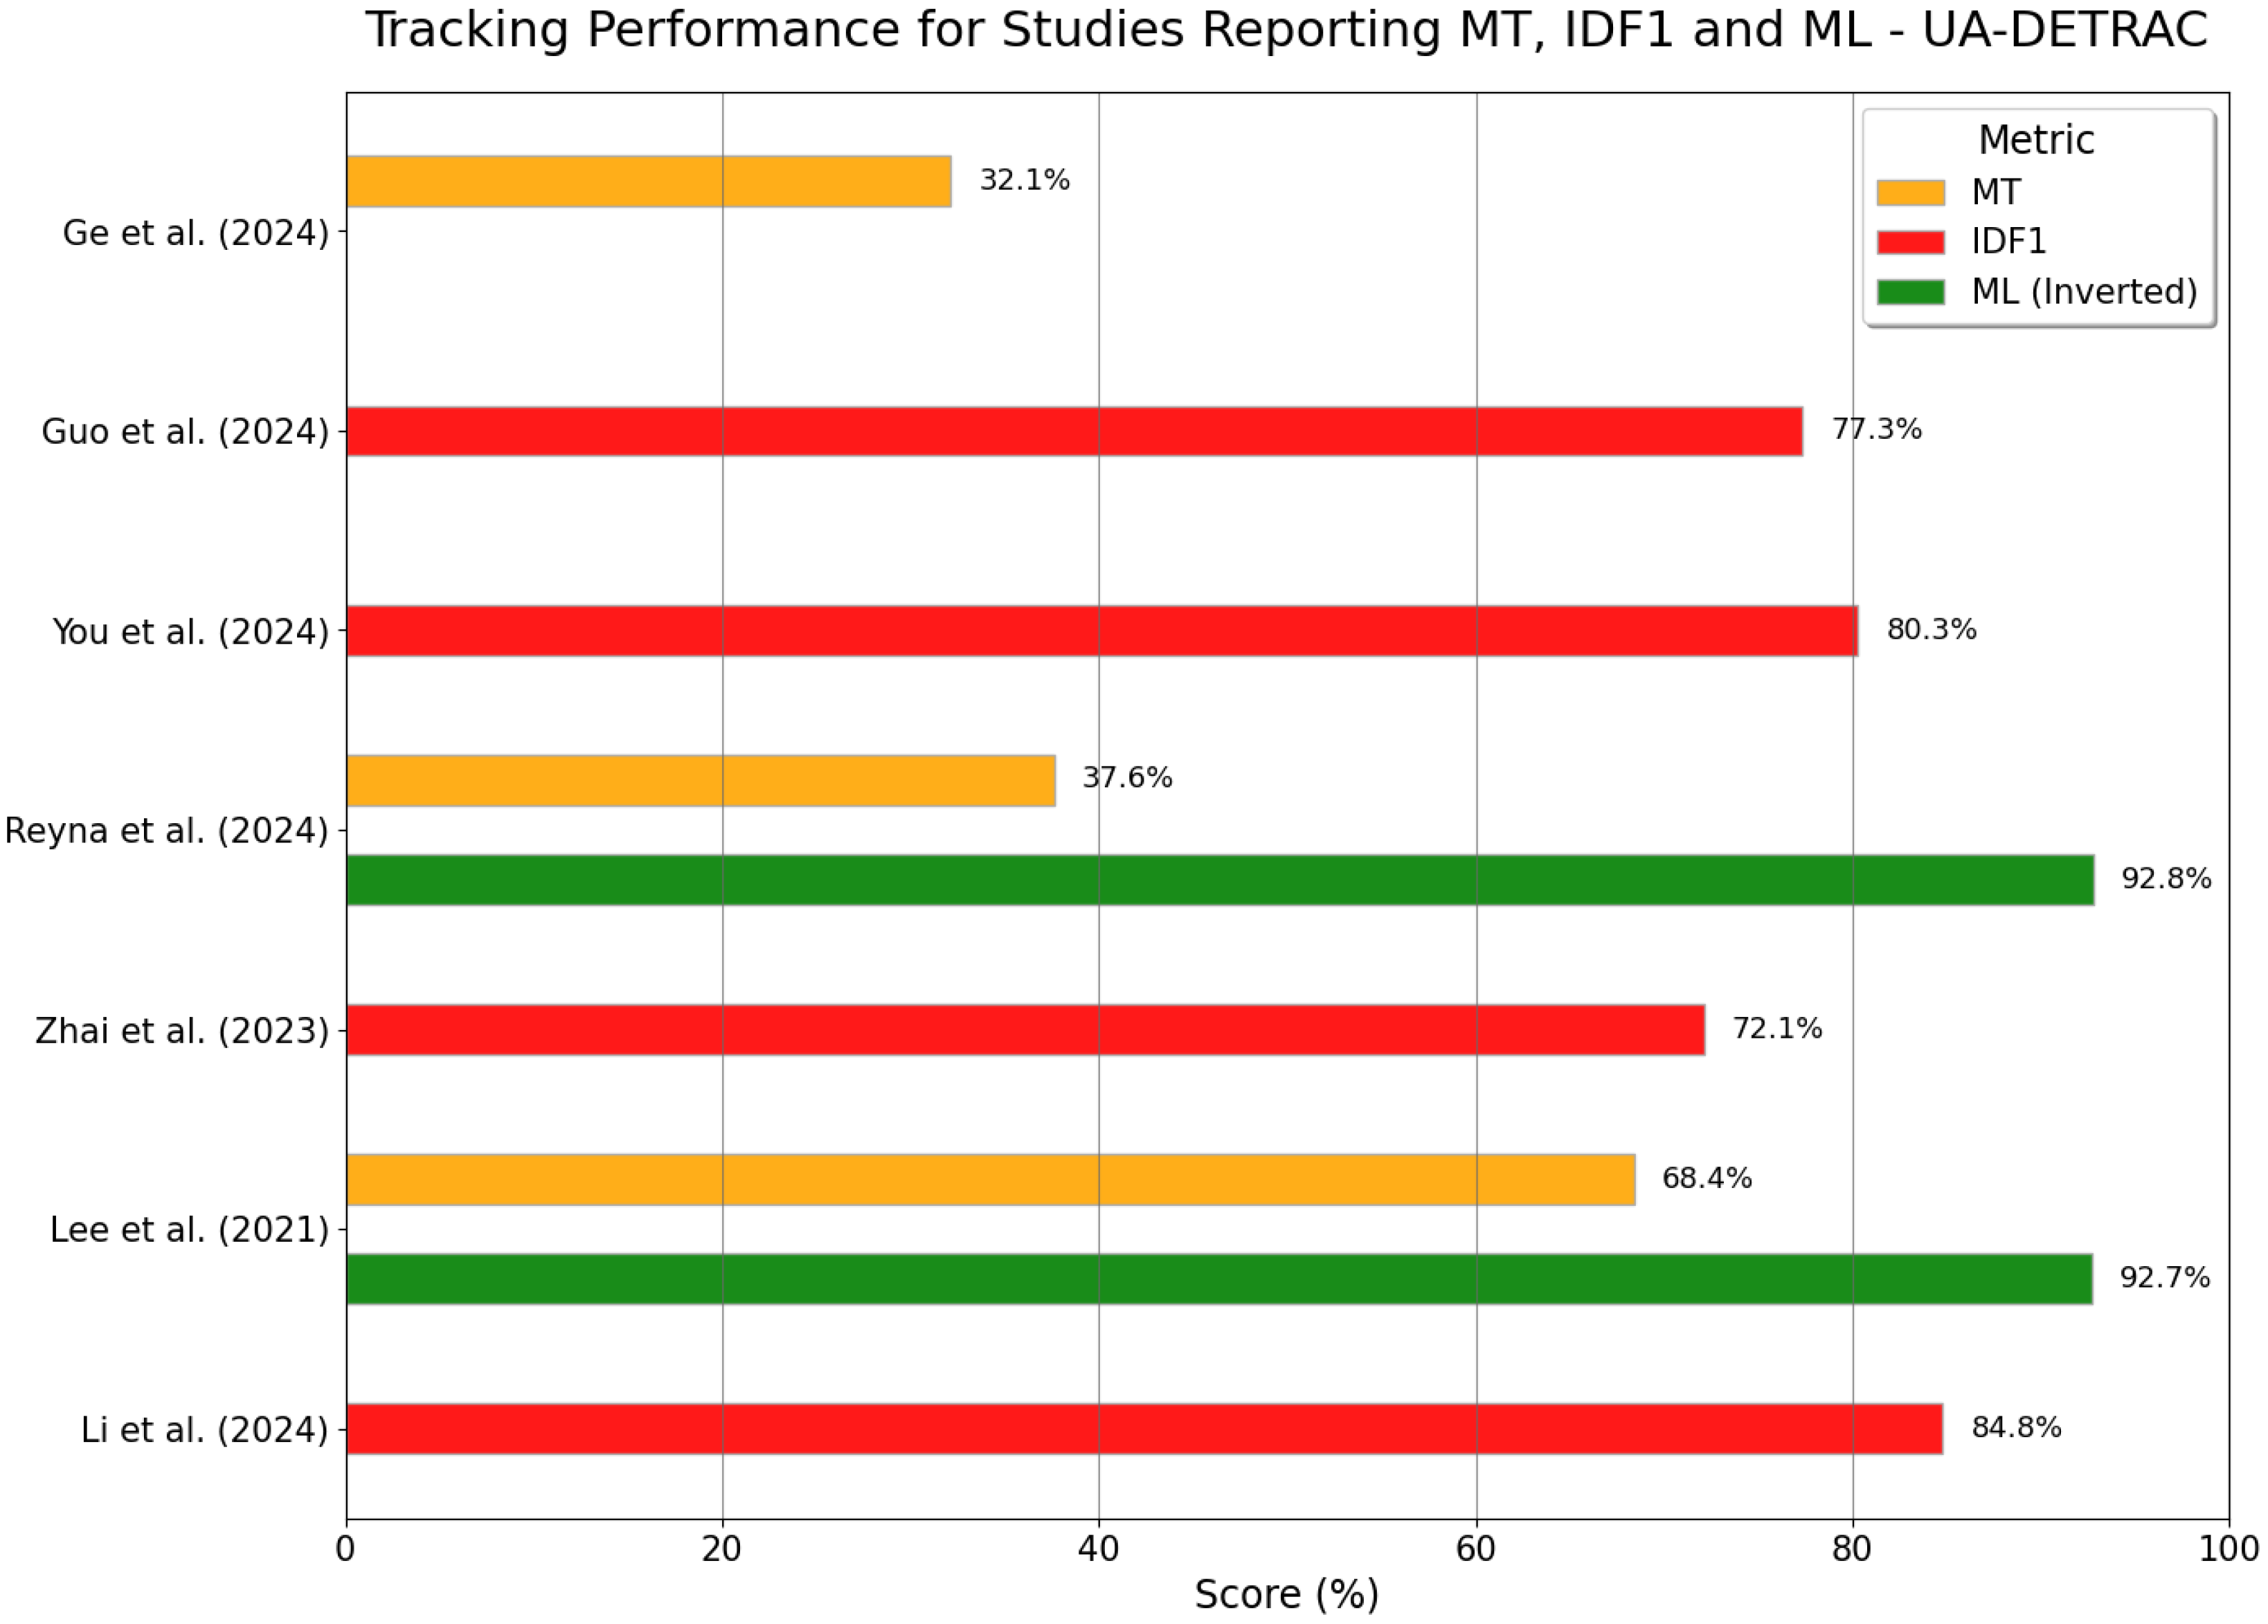
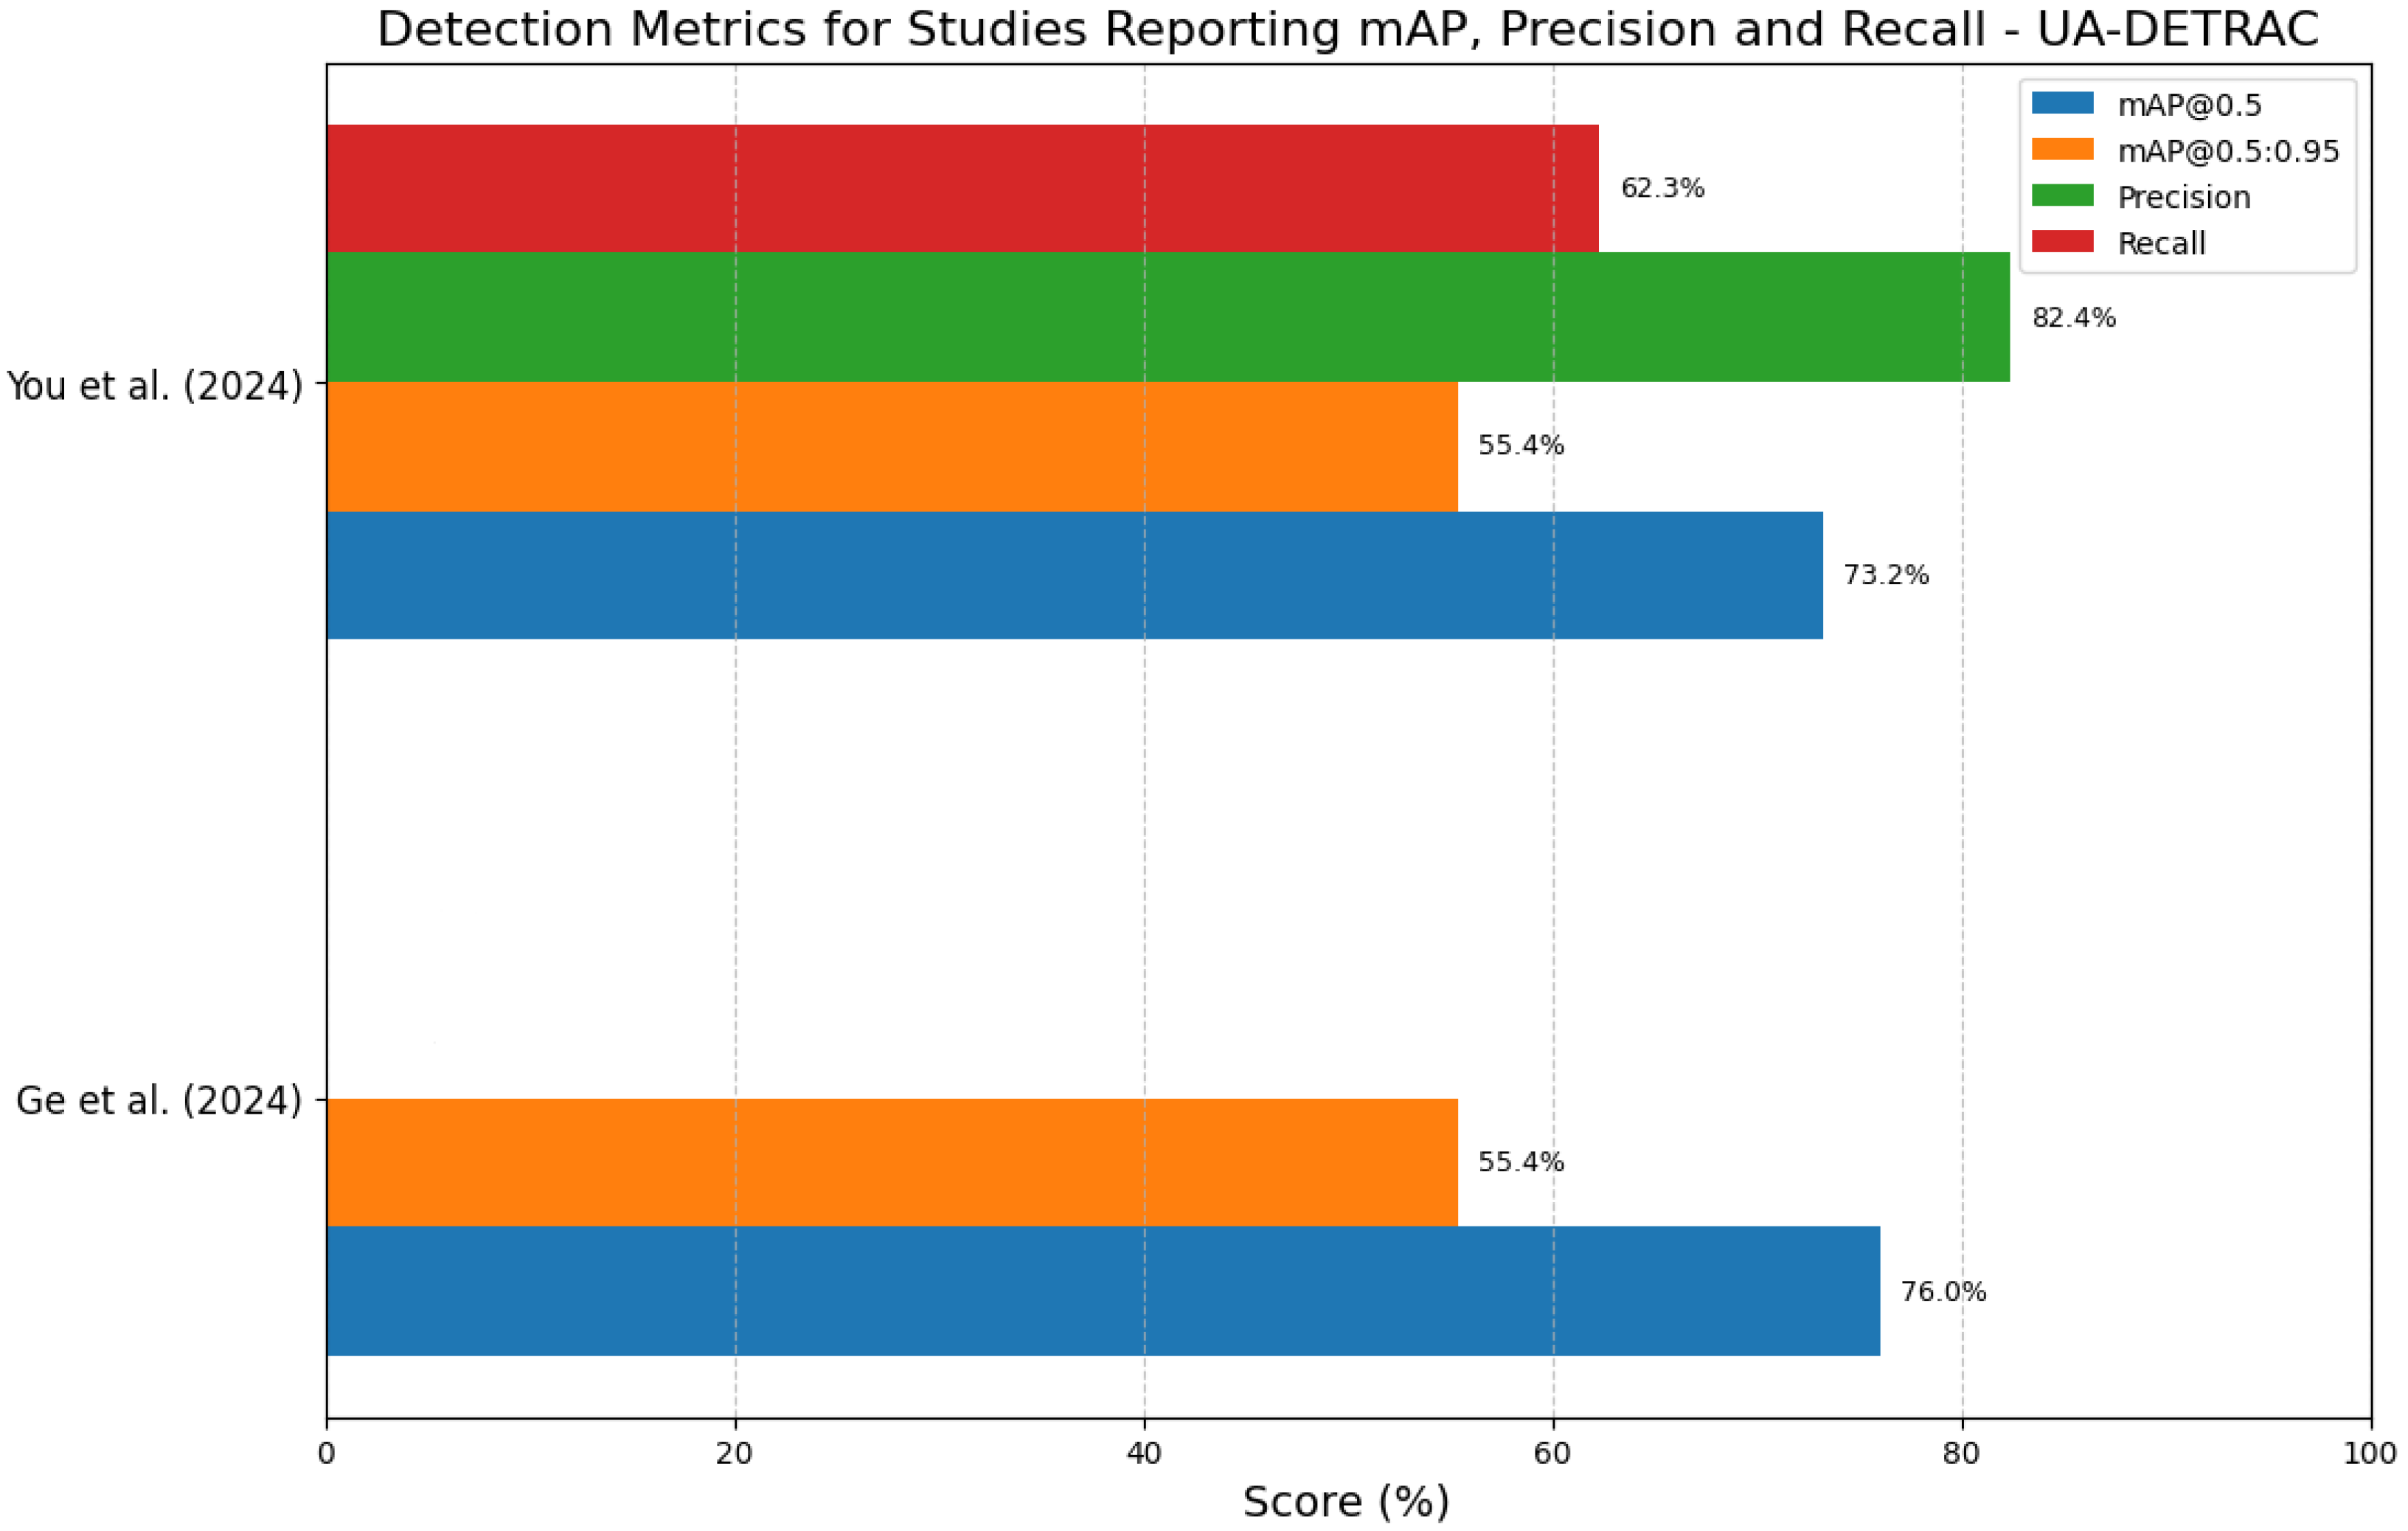
Another study [44] explores four experimental configurations: (1) YOLOv5-Small + DeepSORT; (2) YOLOv5-Small + Modified DeepSORT (which includes input layers resizing, removing of the second convolutional layer, addition of a new residual convolutional layer, and replacement of fully connected layers to an average pooling layer); (3) Modified YOLOv5-Small (which includes better bounding box alignment (WIoU), multi-scale feature extractor (C3_Res2), multi-head self-attention mechanism (MHSA) and a spatial group-wise enhancement attention mechanism (SGE)) + DeepSORT; and (4) modified YOLOv5-Small + Modified DeepSORT. All configurations are trained on the UA-DETRAC dataset, using a 1-in-10 frame sampling strategy for training simplification and overfit prevention. The Re-ID module from DeepSORT is trained on the VeRI dataset using 3000 images for training, while randomly selecting 20% for testing. Evaluations on the UA-DETRAC dataset show a gradual evolution in mAP@0.5 (from 70.3% to 76%) and mAP@[0.5:0.95] (from 51.8% to 55.4%) metrics as modules are sequentially added to the YOLO detector. Additionally, the superiority of the SGE module is proven by establishing a comparison analysis with other attention mechanisms. On the tracking experimental evaluation, the proposed system achieves the highest MOTA and MT scores, 29.6% and 32.1%, respectively, while also maintaining the lowest number of ID switches across all experiments, 187 in total (66 and 121 for each video, 94 as the average).
One other study [45] examines the integration of two distinct trackers—DeepSORT and TrafficSensor—with YOLOv3 and also evaluates the combination of TrafficSensor with YOLOv4. For the final experiment, it evaluates the TrafficMonitor model alone for detection and tracking. TrafficSensor combines a spatial proximity tracker and a KLT feature tracker. The system uses evaluation zones to restrict image processing to relevant areas. The models are trained and tested on the Redouane Kachach et al. 2016 [36] dataset, GRAM Road Traffic Monitoring dataset, and open online cameras, using an 80/20 training–validation split. There is also an overview of only detection performance for the overall dataset evaluation, but since it is performed before the integration of trackers, and given the fact the TrafficSensor tracker also has the ability to enhance detection performance, those results are not reported. As stated previously, the impact TrafficSensor has on detection performance is immense, since the mAP and mAR metrics comparing integration with DeepSORT versus TrafficSensor show a definitive improvement with the second method—good conditions showed a 7.7% increase in mAP and 3.2% in mAR; bad weather showed a 1% increase in mAP and 1.1% in mAR; poor quality showed a 5.9% increase in mAP and 5.3% in mAR. The introduction of YOLOv4 with TrafficSensor, replacing YOLOv3, also noticeably improved results. Good conditions showed a 1.3% increase in mAP and 6.6% in mAR; bad weather showed no increase in mAP and 0.2% in mAR; and poor quality showed a 4.6% increase in mAP and 4.7% in mAR. For the system relying on TrafficMonitor solely for detection and tracking, a clear drop in performance is reported in comparison to the YOLOv4 + TrafficSensor system. Good conditions showed a 46.9% decrease in mAP and 37.3% in mAR; bad weather showed a 74.9% decrease in mAP and 67.9% in mAR; and poor quality showed a 54.2% decrease in mAP and 36.1% in mAR. However, this study omits key tracking evaluations, limiting insight into the actual tracking performances of DeepSORT, TrafficSensor and TrafficMonitor. Not clarifying which specific YOLOv4 version is being used is also a major drawback.
Another study [46] explores the use of YOLOv3 and a custom detector called Mask-SpyNet, built upon the SpyNet optical flow and a mask-based segmentation branch, paired with DeepSORT. The models were trained on the MPI Sintel and a custom dataset produced by the authors, totaling 2045 images for training. Evaluation was conducted on another custom dataset consisting of footage captured from the Beijing–Taiwan expressway. However, the authors do not report results using standard metrics. Instead, they start by reporting the number of correctly tracked vehicles (true positives), the number of undetected vehicles (false negatives), and the number of falsely detected vehicles (false alarms, equivalent to false positives), allowing us to indirectly infer the values of precision and recall. Then, three unconventional metrics are introduced: detection rate (Rt), which is the ratio of the vehicles detected by all the vehicles present (identical in principle to the Jaccard index); the false negative rate (Rf), which is the ratio of the number of vehicles undetected by all the vehicles existent; and the false alarm rate (Ra), referring to the ratio of the vehicles incorrectly detected to all the vehicles present. YOLOv3 reported results of 82.3%, 7.1% and 10.6% for Rt, Rf and Ra, respectively, while Mask-SpyNet reported 93.1%, 2% and 4.9%, clearly outperforming the YOLOv3 system. For precision and recall, YOLOv3 reported 88.6% and 92.1%, while Mask-SpyNet achieved 95% and 97.9%. Despite the promising detection results, this article lacks any tracking-specific analysis, and the indirect treatment of the precision and recall metrics is certainly an important limitation.
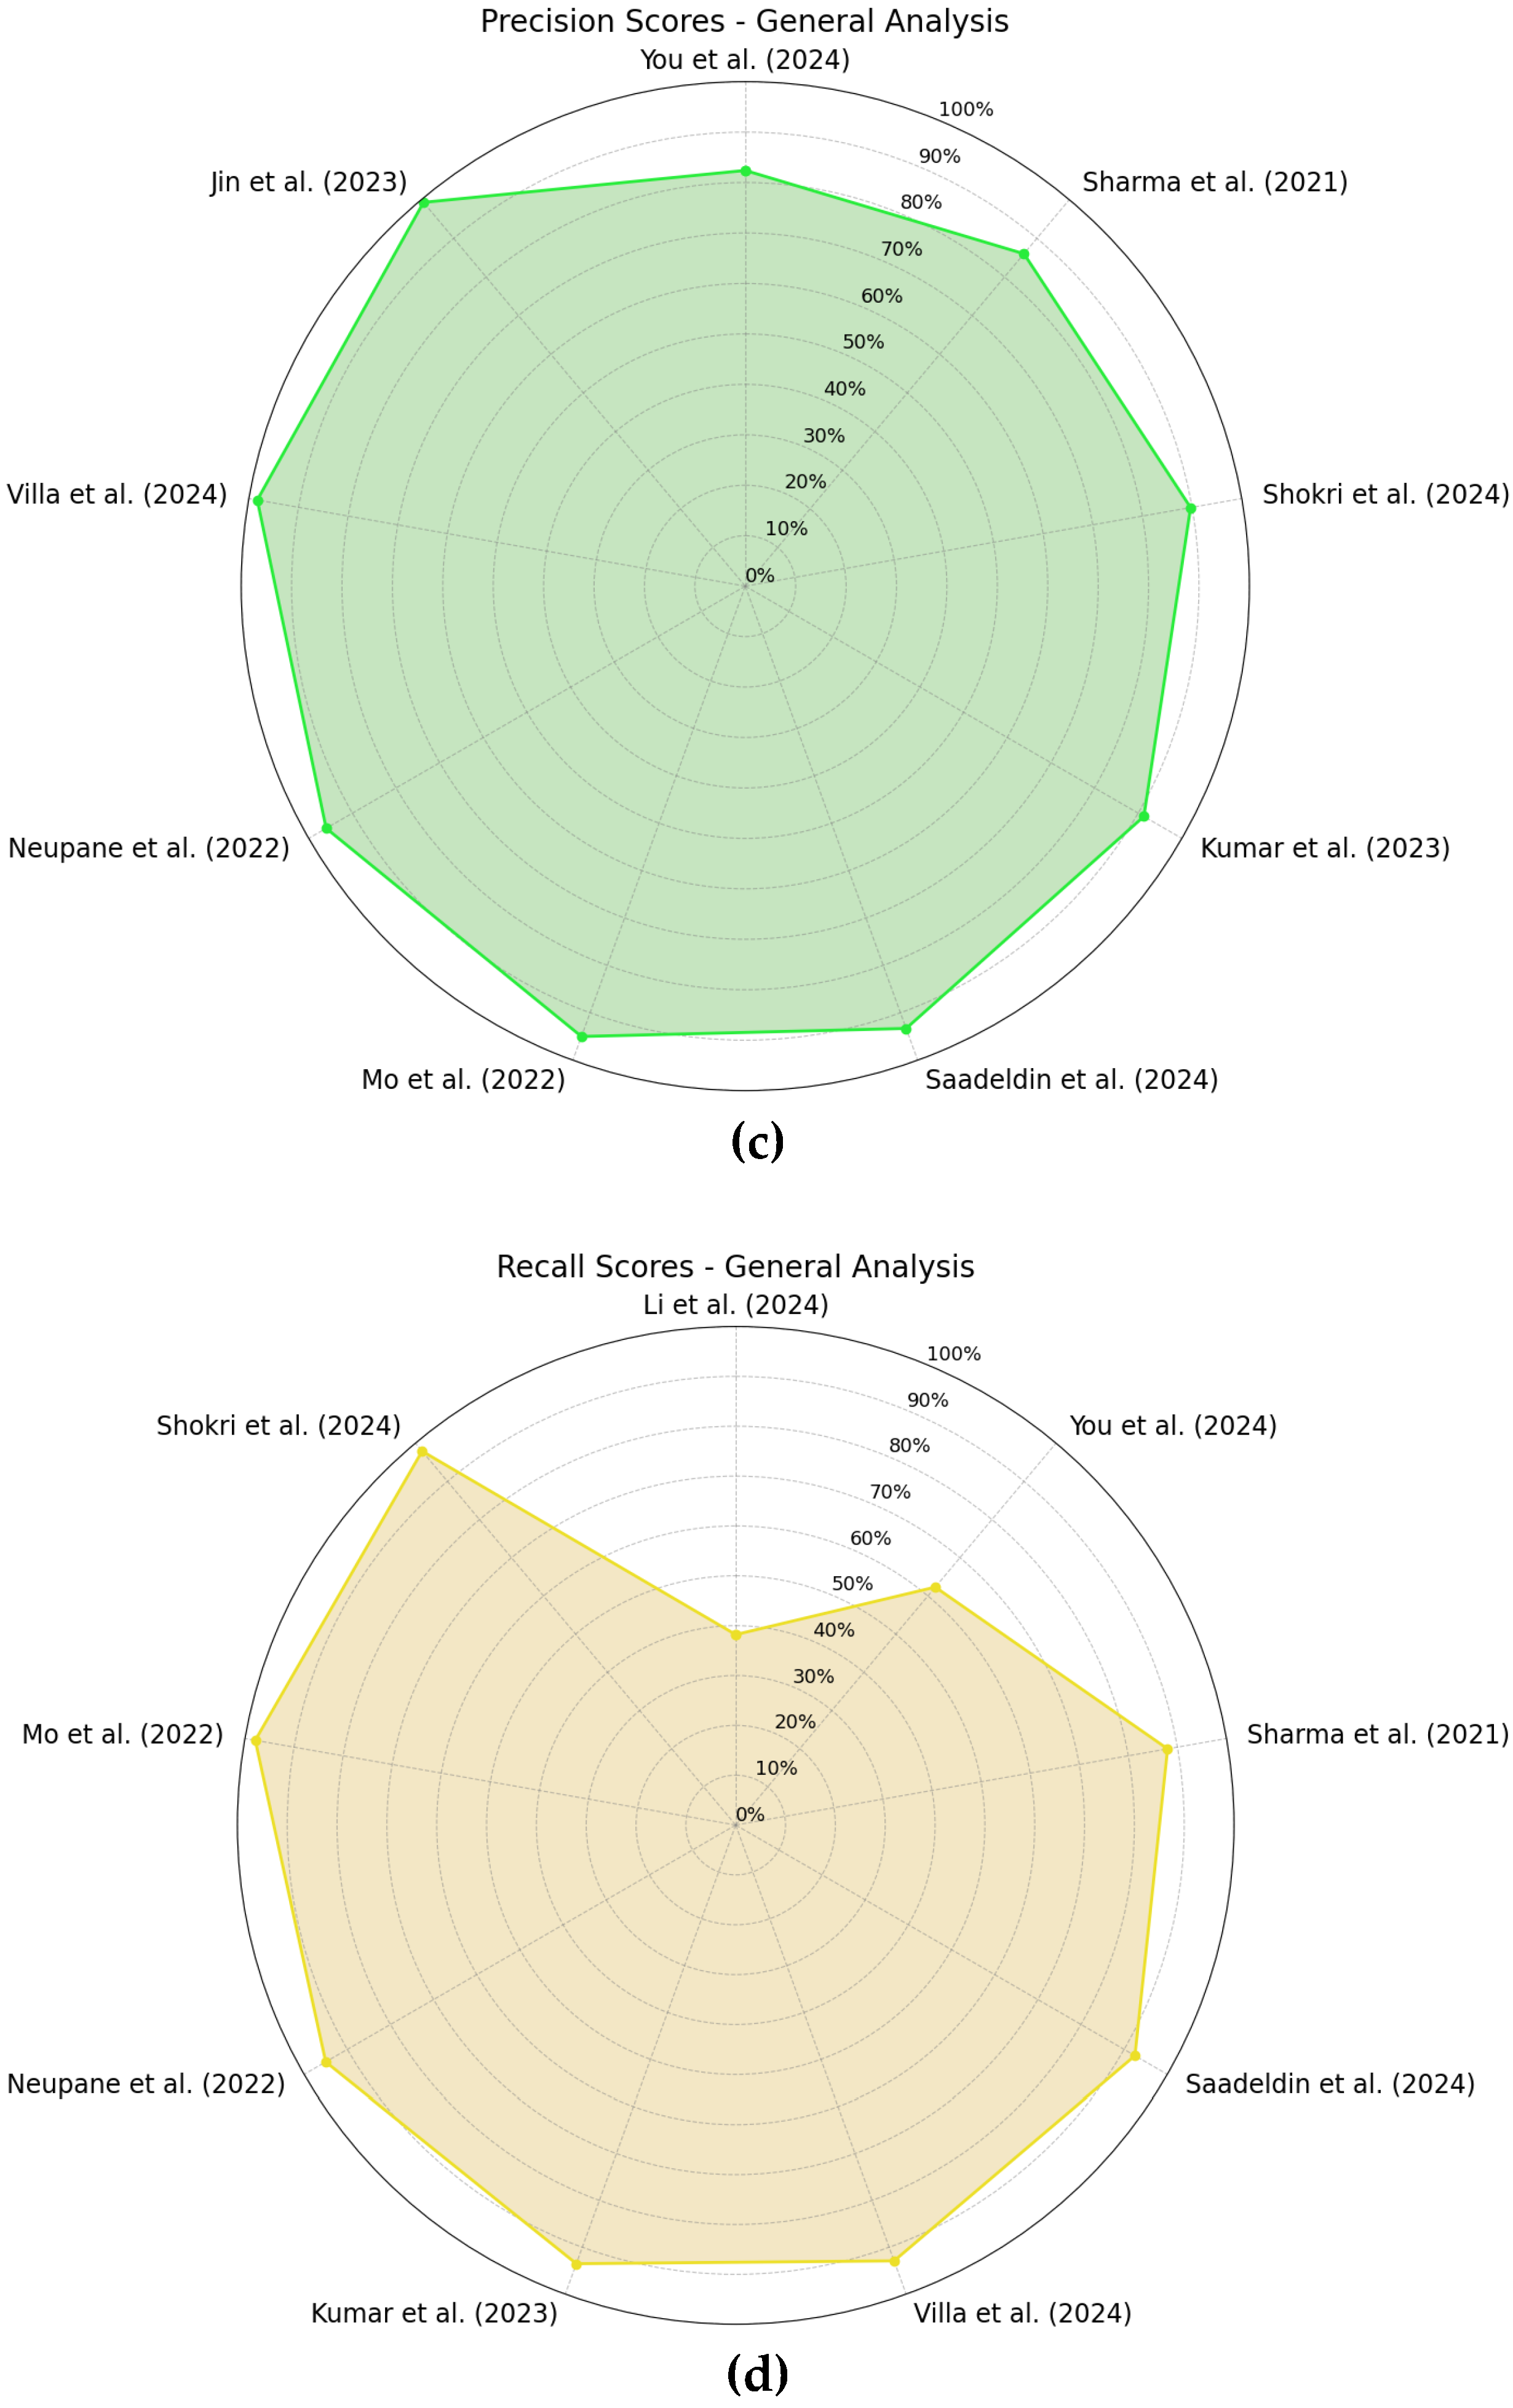
A different study [47] investigated a system that integrates YOLOv8-Nano detector—enhanced with a small object detection layer and a convolutional block attention module (CBAM)—with the DeepSORT tracker. Training and evaluation were conducted on the same three main datasets: Highway Vehicle Dataset, Miovision Traffic Camera (MIO-TCD) dataset, and a custom dataset composed of CCTV footage, other open-source datasets, and manually captured images, with a 70/20/10 train–validation–test split across 11,982 images. A virtual polygon area was used to restrict the detection of vehicles to the location of interest. The authors carefully analyzed the impact of each added module and of data augmentation through an ablation study, reporting results by focusing on the mAP@0.5, precision, and recall metrics. For mAP@0.5 and precision, results were the highest when both the small detection object layer and CBAM were active but not integrated with data augmentation, while recall improved when data augmentation was included along with the other two modules. The final proposed system, which included all enhancements, achieved 97.2% of mAP@0.5 score, 93.2% for recall, 92.1% for precision and 96.8% of “average vehicle counting accuracy”, the latter being an undefined metric in the paper. While it likely refers to the ratio between the detected and ground truth vehicle counts, it is just hypothesizing. The absence of a clear definition of average vehicle counting accuracy and the non-existence of tracking-related analysis are clear limitations.
A further study [48] analyzed the fusion of four object detectors—YOLOv3, YOLOv3-Tiny, YOLOv5-Large and YOLOv5-Small—with a centroid-based tracker. Even though multiple training phases were conducted to investigate training and fine-tuning differences on different datasets, the final models were trained on a surveillance video dataset provided by the Department of Rural Roads of Thailand, using an 80/15/5 train-validation–test split, and fine-tuned on a smaller custom dataset composed by manually collected footage, adding up to 366,082 total samples. The authors also used line polygons to restrict vehicle detection closer to the camera setup in a defined region of interest. The evaluation was also performed in a custom dataset to analyze and mitigate the domain-shift problem, increasing performance throughout the experiments. The results for each detector were as follows: YOLOv3: precision of 88%, recall of 92% and overall accuracy of 90%; YOLOv3-Tiny: precision of 88%, recall of 92% and overall accuracy of 90%; YOLOv5-Large: precision of 96%, recall of 95% and overall accuracy of 95%; YOLOv5-Small: precision of 85%, recall of 82% and overall accuracy of 83%. Additional evaluations on noisy and clear conditions confirmed YOLOv5-Large’s robustness, achieving a precision value of 84.1% and 94%, a recall value of 78.8% and 94%, and an overall accuracy 81.4% and 94%, respectively. As clearly explained by the authors, the “overall accuracy” metric refers to the average of the precision and recall metrics. However, this study lacks any analysis of tracking-specific metrics, which limits understanding of the centroid-based tracker’s performance.
Another study [49] analyzed the introduction of several enhancements into both the YOLOv8 detector—FasterNet backbone, small target detection head, SimAM attention mechanism and WIOUv1 bounding box loss—and the DeepSORT tracker, with an OS-NET for appearance feature extraction and GIoU metrics. The detectors were trained on the UA-DETRAC dataset, and the DeepSORT Re-ID module was trained on the VeRI-776 dataset. Several experiments were carried out to assess the contribution each module makes to the detector and tracker pipeline. For the MOTA, MOTP, IDF1 and IDSW metrics, each experiment achieved the following results: YOLOv8 + DeepSORT—MOTA of 55.6%, MOTP of 70.2%, IDF1 of 71.4% and IDSW of 476; Improved YOLOv8 + DeepSORT—MOTA of 57.6%, MOTP of 72.6%, IDF1 of 73.2% and IDSW of 455; Improved YOLOv8 + DeepSORT with OS-NET for appearance feature extraction—MOTA of 58.8%, MOTP of 73.2%, IDF1 of 73.8% and IDSW of 421; Improved YOLOv8 + DeepSORT with GIoU metric—MOTA of 58.6%, MOTP of 71.5%, IDF1 of 75.4% and IDSW of 414; Improved YOLOv8 + Improved DeepSORT—MOTA of 60.2%, MOTP of 73.8%, IDF1 of 77.3% and IDSW of 406. The results plainly outline that the final proposed system achieves the best performance results. Although the tracking analysis is thorough, the study lacks detection-specific metrics, omits detector information in comparison with other trackers (which is why those results are not reported), and does not specify which YOLOv8 version was used, limiting clarity and reproducibility.
One more study [50] explores the integration of various improvements into the YOLOv8-Small and BYTETrack pipeline. Enhancements to the detector included a context-guided module, a dilated reparameterization block and a soft-NMS, while the tracking component included an improved Kalman Filter and a Gaussian Smooth interpolation. The UA-DETRAC dataset was used for training and benchmark, selecting just one sample every ten images to avoid overfitting, totaling 8209 images for training and 5617 images for testing. Accounting for the detection-specific metrics—precision, recall, mAP@0.5 and mAP@[0.5:0.95]—and tracking-specific metrics—mIDF1, IDSW and mMOTA—four systems were benchmarked to evaluate the success of the improvements: YOLOv8-Small + BYTETrack—precision of 71.8%, recall of 58.6%, mAP@0.5 of 64.2%, mAP@[0.5:0.95] of 46.6%, mIDF1 of 76.9%, IDSW of 855 and mMOTA of 67.2%; Improved YOLOv8-Small + BYTETrack—precision of 82.4%, recall of 62.3%, mAP@0.5 of 73.2%, mAP@[0.5:0.95] of 55.4%, mIDF1 of 78.2%, IDSW of 785 and mMOTA of 70.6%; Improved YOLOv8-Small + BYTETrack with Improved Kalman Filter—precision of 82.4%, recall of 62.3%, mAP@0.5 of 73.2%, mAP@[0.5:0.95] of 55.4%, mIDF1 of 79.7%, IDSW of 717 and mMOTA of 73.1%; Improved YOLOv8-Small + Improved BYTETrack—precision of 82.4%, recall of 62.3%, mAP@0.5 of 73.2%, mAP@[0.5:0.95] of 55.4%, mIDF1 of 80.3%, IDSW of 530 and mMOTA of 73.9%. An additional experiment evaluated performance gains from each individual detector module, but since they were not integrated with a tracker, and for simplification purposes, those results are not reported. Similarly, a tracker comparison was also established, but considering that the detectors combined are not clearly mentioned, those results are not reported as well. Overall, the article clearly specifies the detector and tracker configurations along with their respective improvements and presents results in a way that effectively illustrates the system’s progressive evolution across both detection and tracking metrics.
A further study [51] introduces a novel tracker called MEDAVET, which combines bipartite graph integration, convex hull filtering, and QuadTree for occlusion handling. This tracker is integrated with YOLOv7-W6. The proposed system is trained and evaluated on the UA-DETRAC dataset and compared against several other trackers and detector–tracker pipelines. Results from SORT, IOU and CMOT are not included in this review, as the authors did not specify which detectors were integrated in those combinations, limiting a fair comparison; thus, only the YOLOv7-W6 + MEDAVET, Model2, JDE, FairMOT and ECCNet hybrid systems are included. The results for each tracking-specific metric were as follows: YOLOv7-W6 + MEDAVET—MOTA of 58.7%, MOTP of 87%, IDSW of 636, MT of 37.6% and ML of 7.2%; Model2—MOTA of 55.1%, MOTP of 85.5%, IDSW of 2311, MT of 47.1% and ML of 6.8%; JDE—MOTA of 24.5%, MOTP of 68.5%, IDSW of 994, MT of 28.4% and ML of 41.7%; FairMOT—MOTA of 31.7%, MOTP of 82.4%, IDSW of 521, MT of 36.8% and ML of 36.5%; ECCNet—MOTA of 55.5%, MOTP of 86.3%, IDSW of 2893, MT of 57.2% and ML of 20.7%. It can be clearly observed that the proposed system achieves great results, outperforming the other systems in most metrics. The authors also briefly demonstrate the effectiveness of the OPEN CLIP feature extractor over alternative methods. However, the absence of detection-specific inspection and the omission of detector information in some comparative studies remain notable limitations.
Another study [52] presents a system combining a YOLOv5-Nano detector with a DeepSORT tracker, incorporating a geolocation technique to restrict vehicle tracking to a specific portion of the road. Training was performed on a custom dataset consisting of recorded video sequences from Spain, totaling 16,000 images split into 70% for training and 30% for validation. Benchmark evaluations to analyze overall and per-class performance were carried out using four datasets. These were a portion of the custom dataset used for training and three subsets from the DAWN dataset, particularly with snowy, foggy, and rainy conditions. In the initial experiment, the system gradually improved its performance throughout training, ultimately achieving 98.3% precision, 92.9% recall, 95.4% mAP@0.5, and 80% mAP@[0.5:0.95]. As for the adverse weather conditions, the mAP@[0.5:0.95] scores were 33.2% (snow), 40.4% (fog) and 39.7% (rain), showing a drastic decrease. However, the paper does not state which percentage of the custom dataset was given to the first evaluation or whether additional validation samples were acquired. The absence of comparative analysis with other detection and tracking methods limits the strength of the findings. Additionally, incorporating more tracking-specific metrics, along with detection-specific metrics such as precision and recall in the DAWN evaluations, would offer a more comprehensive and insightful assessment of the system’s performance.
A different study [53] presents a YOLOv4 network, enhanced with Distance-IoU, integrated with a hybrid tracker approach, combining an IoU-based tracker, a Kalman Filter, and an OSNet. The model is trained on a custom dataset from videos of surveillance cameras captured in Hangzhou, China, and is evaluated on more captured images from the same location, totaling 25,080 images for training and 2891 images for testing. A side experiment suggests that this custom dataset offers better adaptability to this real-world scenario: models trained on VeRI-776 and VeRI-Wild datasets achieved less accuracy—72.5% and 48.5%, respectively—than the proposed method (95.6%). However, due to the lack of clarity in the experiment’s design, these results are not formally included in this review more than in this sentence. The main evaluation of the proposed model reports an accuracy of 97.7%, and, since the authors provided information about the True Positives (Correct Detection) and False Positives (False Detection), it is possible to indirectly compute the precision, which is 99.3%. The metric “accuracy” is defined by the authors as the ratio of the True Positives to the sum of True Positives, False Negatives, and False Positives. While the model demonstrates high performance, the fact that training and testing data were captured in the same location may have contributed to inflated results, which do not guarantee reproducibility. Additionally, the absence of standard tracking-specific metrics and a broader detection analysis weakens the depth of evaluation. The specific YOLOv4 version is not mentioned, and the overall presentation of the experiments lacks clarity, leaving room for misinterpretations.
Another study [54] describes the combination of a pre-trained YOLOv5-Small detector with a DeepSORT tracker. To improve vehicle accuracy, hot zones and virtual lines were introduced to restrict the tracking to those locations. However, the authors provided limited information about the training process, referring vaguely to “picture datasets” and omitting details regarding dataset splitting. The proposed system is evaluated against two other methods across two experiments, which were conducted in two datasets, but since one of them was composed solely of vehicle-perspective images, only the PASCAL VOC 2007 experiment was considered for this review. It outperforms the compared methods in all reported metrics with a precision of 65.7%, recall of 83.4% and mAP of 81.2%. A final experiment was conducted in an unspecified dataset, where the proposed system once again achieved the best results for precision, recall and mAP@0.5 metrics, with 91.25%, 93.52% and 92.18%, respectively. Despite the strong results, the absence of tracking-specific evaluation limits the depth of analysis, and the vague reporting of training and testing procedures, especially the datasets, clearly undermines replicability and clarity.
One more study [55] explored the integration of pre-trained versions of YOLOR CSP X, YOLOR CSP and YOLOR P6 with the DeepSORT tracker. The authors did not clearly specify which datasets were used for training, only stating that the algorithm was trained on “various datasets”, with COCO mentioned as one of them. Evaluation was conducted on six videos, with results grouped by environmental conditions (sunny weather: videos 1 and 6; cloudy weather: videos 2, 4 and 5; no sunlight: video 3). For video 1 testing (sunny weather), the following results were accomplished: YOLOR CSP X—average accuracy@0.35 of 79.9%, average accuracy@0.55 of 75% and average accuracy@0.75 of 66.3%; YOLOR CSP—average accuracy@0.35 of 83.8%, average accuracy@0.55 of 76.8% and average accuracy@0.75 of 54.7%; YOLOR P6—average accuracy@0.35 of 75%, average accuracy@0.55 of 68.2% and average accuracy@0.75 of 65.4%. For video 2 testing (cloudy weather), the scores were as follows: YOLOR CSP X—average accuracy@0.35 of 66.3%, average accuracy@0.55 of 75.6% and average accuracy@0.75 of 52.9%; YOLOR CSP—average accuracy@0.35 of 78.9%, average accuracy@0.55 of 70.2% and average accuracy@0.75 of 47.6%; YOLOR P6—average accuracy@0.35 of 56.7%, average accuracy@0.55 of 77.5% and average accuracy@0.75 of 46.7%. The best performing model—YOLOR CSP at 35% of confidence—was selected for a final evaluation across all videos, with the added detail of excluding the two least-performing classes. Using the average accuracy@0.35 and total accuracy@0.35 metrics, the mode achieved 91% and 99.3% (sunny), 93.6% and 98.5% (cloudy), and 89.6% and 98% (no sunlight), respectively. The authors define “average accuracy” as the comparison between the number of counted vehicles to the ground truth across different confidence levels, but “total accuracy” is not described. While the models, particularly YOLOR CSP at 35% confidence, show strong results in the benchmarks, the paper lacks transparency in the training process, omits critical dataset details, provides vague or missing metric definitions, and does not include standard detection and tracking-specific evaluations, all of which limit the interpretability and replicability of the work.
A further study [56] implements an improved version of the YOLOv4 algorithm, incorporating an enhanced feature fusion (SPP + PANet), deep-separable convolutions, and an improved loss function, alongside a novel tracking approach characterized by a Kalman Filter, an expanded state vector, a larger State Matrix, an improved initialization, and aspect ratio handling. There is no indication that the model was retrained, suggesting that the system may rely entirely on pre-trained weights. The first evaluation is excluded from the formal analysis in this review due to its insufficient methodological detail and absence of dataset information, though the authors claim that the proposed method achieved the best performance. In the second experiment, likely using the BiT-Vehicle dataset, the standard YOLOv4 achieved an mAP score of 94.35%, while the improved version achieved 95.68%. In a third experiment apparently conducted on real-world footage and divided into four videos, the mean MOTA, MOTP and IDSW scores across the videos for the baseline detector were 85.88%, 83.83%, and 45, while for the enhanced model, they were 86.88%, 84.08%, and 36. A final field test evaluated performance in sunny, cloudy, and rainy conditions, during both daytime and nighttime. The metric “correct identification rate” appears to refer to the ratio of detected vehicles over the total. For daytime, the scores for the sunny, cloudy and rainy weather were 100%, 98.6%, and 96.1%, while for the nighttime, they were 100%, 97.7%, and 95.4%, respectively. The study’s lack of transparency regarding training, the limited detail in the experiments, the avoidance of standard detection metrics besides mAP, and the absence of comparisons with other trackers significantly reduce the interpretability and reproducibility of these findings.
Another study [57] investigates the combination of an YOLOv4-Tiny detector with an optimized version of the DeepSORT tracker, referred to as FastMOT tracker, enhanced with a Kanade–Lucas–Tomasi optical flow. The model training is performed on a custom dataset composed of 437 images from Thailand, divided into 80% for training and 20% for evaluation. The system achieved an mAP score of 78.71%. This study also used Regions of Interest to restrict detection to specific areas and improve detection performance. While the approach shows functional implementation, the study is overly simplistic, limited by the small dataset size, and lacks key details—such as comparative analysis with other competing solutions and a deeper exploration of detection and tracking performances—although these may not have been the primary focus of the article.
One other study [58] investigated a system that dynamically switches between two compressed versions of YOLOv3 and YOLOv3-Tiny, integrated with RE-ID DeepSORT. The latter includes a re-identification module specifically trained on the UA-DETRAC dataset, designed to improve vehicle feature extraction and overall tracking performance. Both the detectors and RE-ID DeepSORT were optimized for low-latency, low-power edge devices. Trained and evaluated on the UA-DETRAC dataset, the pruned YOLOv3 model (with an 85% pruning rate) achieved an AP@0.5 score of 71.1%, outperforming the original model while reducing its complexity, whereas the YOLOv3-Tiny model, after two dynamic prunings (85% and 30%), reached an AP@0.5 score of 59.9%, showing only a minor drop in detection performance for a significant gain in computational efficiency. In a subsequent tracking experiment, the proposed system demonstrated its ability to switch between both reduced models—YOLOv3 and YOLOv3-Tiny—based on computational load, such as excess of detected vehicles prolonged across several consecutive frames. Across three test videos, the proposed system averages an MOTA of 59.2%, an MOTP of 13.7%, an IDF1 of 72.1%, an IDP (identification precision, measuring how many tracked objects have correct IDs) of 85.2%, an IDR (identification recall, measuring how many true objects are assigned correct IDs) of 64.6%, and an IDSW of 25. Since the detector paired with the standard DeepSORT is not referenced, those results are not officially included in this review to maintain a fair comparison, but the performance seems to be better with the enhanced version. A final experiment evaluated accuracy rates—defined as the ratio of the number of detected vehicles to the ground truth number—for the proposed YOLOv3 and YOLOv3-Tiny models under varying conditions, which are as follows: 96.2% and 92.3% for daytime; 94% and 92% for nighttime; and 81.8% and 75.8% in rainy weather. This article effectively illustrates how model compression can reduce computational complexity while maintaining strong detection and tracking performance and highlights the benefits of retraining the re-identification module with a vehicle-specific dataset. However, some lack of specificity regarding the dataset split and not properly mentioning the detector integrated with the standard DeepSORT tracker limits this study’s completeness and reproducibility.
Another study [59] explores the use of a pre-trained YOLOv3 network integrated with two different trackers: a Kalman filter and a centroid-based tracker. Each intersection analyzed had its own specific training dataset, meaning the proposed methods were evaluated only on data that closely resembles their training conditions. Five evaluations were conducted for images collected in the Netherlands (afternoon, high camera location), Sweden (afternoon, distant video shooting), Turkey (morning time, low-angle camera), Japan (evening time, close view) and Ukraine (afternoon, high-angle camera). The results, based on a custom “total accuracy” metric—defined as the sum each class’s accuracy weighted by its frequency—show that the centroid-based tracker system consistently outperformed the Kalman filter across all cases: 84.5% vs. 77% for the Netherlands; 88.4% vs. 81.7% for Sweden; 78.7% vs. 65.8% for Turkey; 88.5% vs. 81.9% and for Japan; and 82.9% vs. 70.7% for Ukraine. While these results clearly demonstrate the superior performance of the centroid-based tracker over the Kalman filter, under the given conditions, the extreme bias associated with reliance on location-specific training data undermines its replicability in real-world scenarios. Furthermore, the absence of standard detection and tracking-specific analysis, as well as the lack of transparency in dataset sampling, diminishes the overall rigor of this study.
A further study [60] explored the integration of the FAF-YOLOX detector—an enhanced version of the YOLOX replacing the original feature pyramid network with a feature adaptive fusion pyramid network, which incorporates a channel-to-spatial modules, an MBConv block and dynamic SPP—with DeepSORT. The system was trained, validated and tested on the UA-DETRAC dataset, with 55,818 images for training and 9852 images for validation, although the number of test samples was not specified. The proposed system achieved, for the metrics AP@0.5, AP@0.75 and AP@[0.5:0.95], scores of 76.27%, 65.73% and 55.65%, respectively, outperforming the detector integrating a path aggregation feature pyramid network in higher-threshold AP scores and surpassing the detector integrating a standard feature pyramid network across all evaluated thresholds. While the article clearly focuses on describing and benchmarking the improvements brought about by the novel detection method against other state-of-the-art techniques, particularly with other feature pyramid networks, it does not provide an in-depth exploration of additional detection metrics and, notably, lacks tracking-specific evaluation with which to assess the performance of the integrated DeepSORT tracker.
One other study [61] investigated the use of a pre-trained SqueezeDet detector (fine-tuned on the UA-DETRAC dataset and further adapted to a real-world environment using unsupervised pseudo-labeling and human-in-the-loop (HIL) refinement) integrated with an SORT tracker. The initial training and validation occurred on the UA-DETRAC dataset, using 76,380 images for training and 5704 for validation. A second fine-tuning phase was performed on a custom dataset acquired by the authors in the specific environment, with annotations being generated either in an unsupervised manner or with human assistance. The system trained on UA-DETRAC and refined using HIL annotations was compared against two variants: one SqueezeDet trained solely on UA-DETRAC data and another one also trained on UA-DETRAC data but fine-tuned on environment-specific data with unsupervised labelling. In terms of mAP, the baseline experiment scored 39%, the unsupervised fine-tuning variant reached 51.9%, and the HIL-refined model achieved the highest performance at 54.6%, supporting the conclusion that incorporating environment-specific data, particularly with human input, can substantially enhance detection performance. However, the absence of tracking-specific analysis and other standard detection metrics limits the depth of the investigation, and the reliance on continuous human involvement for data labeling raises concerns about the scalability and practicality of the system.
Another study [62] integrated a pre-trained Segment Anything Model (SAM) to detect and segment vehicles, combined with the DeepSORT tracker. No additional training was performed, as SAM is already capable of detecting a wide range of object types, but some post-processing heuristics were applied to restrict detection to only vehicles, which included a manual region of interest to focus only on road areas, a motion-based filtering to retain only moving objects across frames, and a vehicle segment merging to avoid fragmented segmentations by combining multiple parts of the same vehicle. The system was evaluated on images extracted from the 511 highways, in Quebec, Canada, and from the 2nd NVIDIA AI City Challenge Track 1, and a comparison was established with other detection models, but since training information was omitted, their results are not included in this review. SAM achieved a precision of 89.68%, a recall of 97.87% and a F1-score of 93.6%. The absence of tracking-specific analysis limits the depth of the research, and given the fact that SAM was already pre-trained on more than 11 million images and 1 billion masks from the SA-1B dataset, it remains unclear whether fine-tuning on domain-specific data would meaningfully improve detection and tracking performances.
A further study [63] explored the Portable Appearance Extension (PAE), a modular system designed to enhance both detection and tracking by integrating the appearance embedding head and the augmentation modules directly into the detector’s output, optimizing the detection performance, while also including components such as the cosine distance, Hungarian algorithm, Kalman filter, integrated embeddings, and hyperparameter optimization, effectively functioning as a tracking mechanism. PAE is tested in conjunction with the SSD and RetinaNet detectors and compared against several baselines’ configurations: SSD + SORT; SSD + DeepSORT; SSD + PAE; JDE (at 576 × 320 px and 864 × 480 px resolutions); RetinaNet + SORT; RetinaNet + DeepSORT; RetinaNet + PAE. All models were trained and evaluated on the UA-DETRAC dataset at varying difficulty levels (easy, medium, and hard detection), and the performances were assessed using HOTA guidelines, which capture both detection and tracking quality. In the standard evaluations, the RetinaNet + PAE achieved the highest scores on HOTA (58.04%), DetA (51.82%), AssA (65.34%), DetRe (63.98%), and AssRe (72.07%) metrics, while RetinaNet + SORT outperformed the others for the DetPr (70.55%), AssPr (87.05%) and LocA (87.37%) metrics, illustrating the efficiency of the RetinaNet’s model. As for the SSD systems, the SSD + PAE system consistently produced the best results against SORT and DeepSORT, except for the DetPr and AssPr metrics, where SSD + SORT held an advantage. As for the easy, medium, and hard evaluations where only the HOTA score was measured, the best results for each one of the settings were as follows: RetinaNet + SORT (63.74%); RetinaNet + PAE (61.01%); RetinaNet + PAE (45.53%). The proposed RetinaNet system achieved the best results in two out of the three tests performed, asserting its trustworthiness among other established models, while the SSD + PAE achieved the best results for all the tests when compared to the other SORT and DeepSORT integrations. Another smaller experiment compared the HOTA performance of SSD + PAE and RetinaNet + PAE systems under frame-dropping conditions, simplifying the training process while illustrating the resulting performance degradation at each step. A final experiment trained the SSD + DeepSORT system separately on UA-DETRAC and MARS datasets and tested both on UA-DETRAC, showing that the model trained on UA-DETRAC slightly outperformed the MARS-trained one in HOTA score (44.20% vs. 43.91%). This article stands out in this review for its comprehensive comparison between multiple detector-tracker pipelines and the robustness of the proposed solution. The evaluation metrics were also thoroughly established and adopted, making the results well received; however, the absence of CLEAR MOT metrics—widely used across the literature and particularly in this review—somewhat limits comparability with the other studies.
One other study [64] introduced the EMOT system, which features an EfficientDet-D0 backbone fused with output features and detection heads for the detection component, and integrates a Re-ID head for appearance embedding extraction, the Hungarian algorithm, a Kalman filter and a tracklet pool for tracking. This system was compared against the DMM-NET, the JDE, and, especially, the FairMOT—since the evaluation metrics are the same as the proposed system—as well as other systems referenced from selected articles. The UA-DETRAC dataset is used to train and test all the models, with evaluations being conducted across eight different conditions: standard, easy, medium, hard, cloudy, rainy, sunny, and nighttime. A wide range of CLEAR MOT metrics were used to assess the performance of each model, but due to the high volume of results, they are not listed here; instead, they are detailed in the Results section. EMOT consistently outperformed its competitors in most scenarios, demonstrating strong adaptability (for instance, achieving an MOTA score of 52.2%, compared to 42.5% by FairMOT in the difficult scenario). This article stands out for introducing a well-designed system and offering a thorough, fair comparison against established baselines and to other article’s approaches, supported by a comprehensive metric selection and the use of a highly benchmarked dataset, which enhances its clarity and comparability to the broader review.
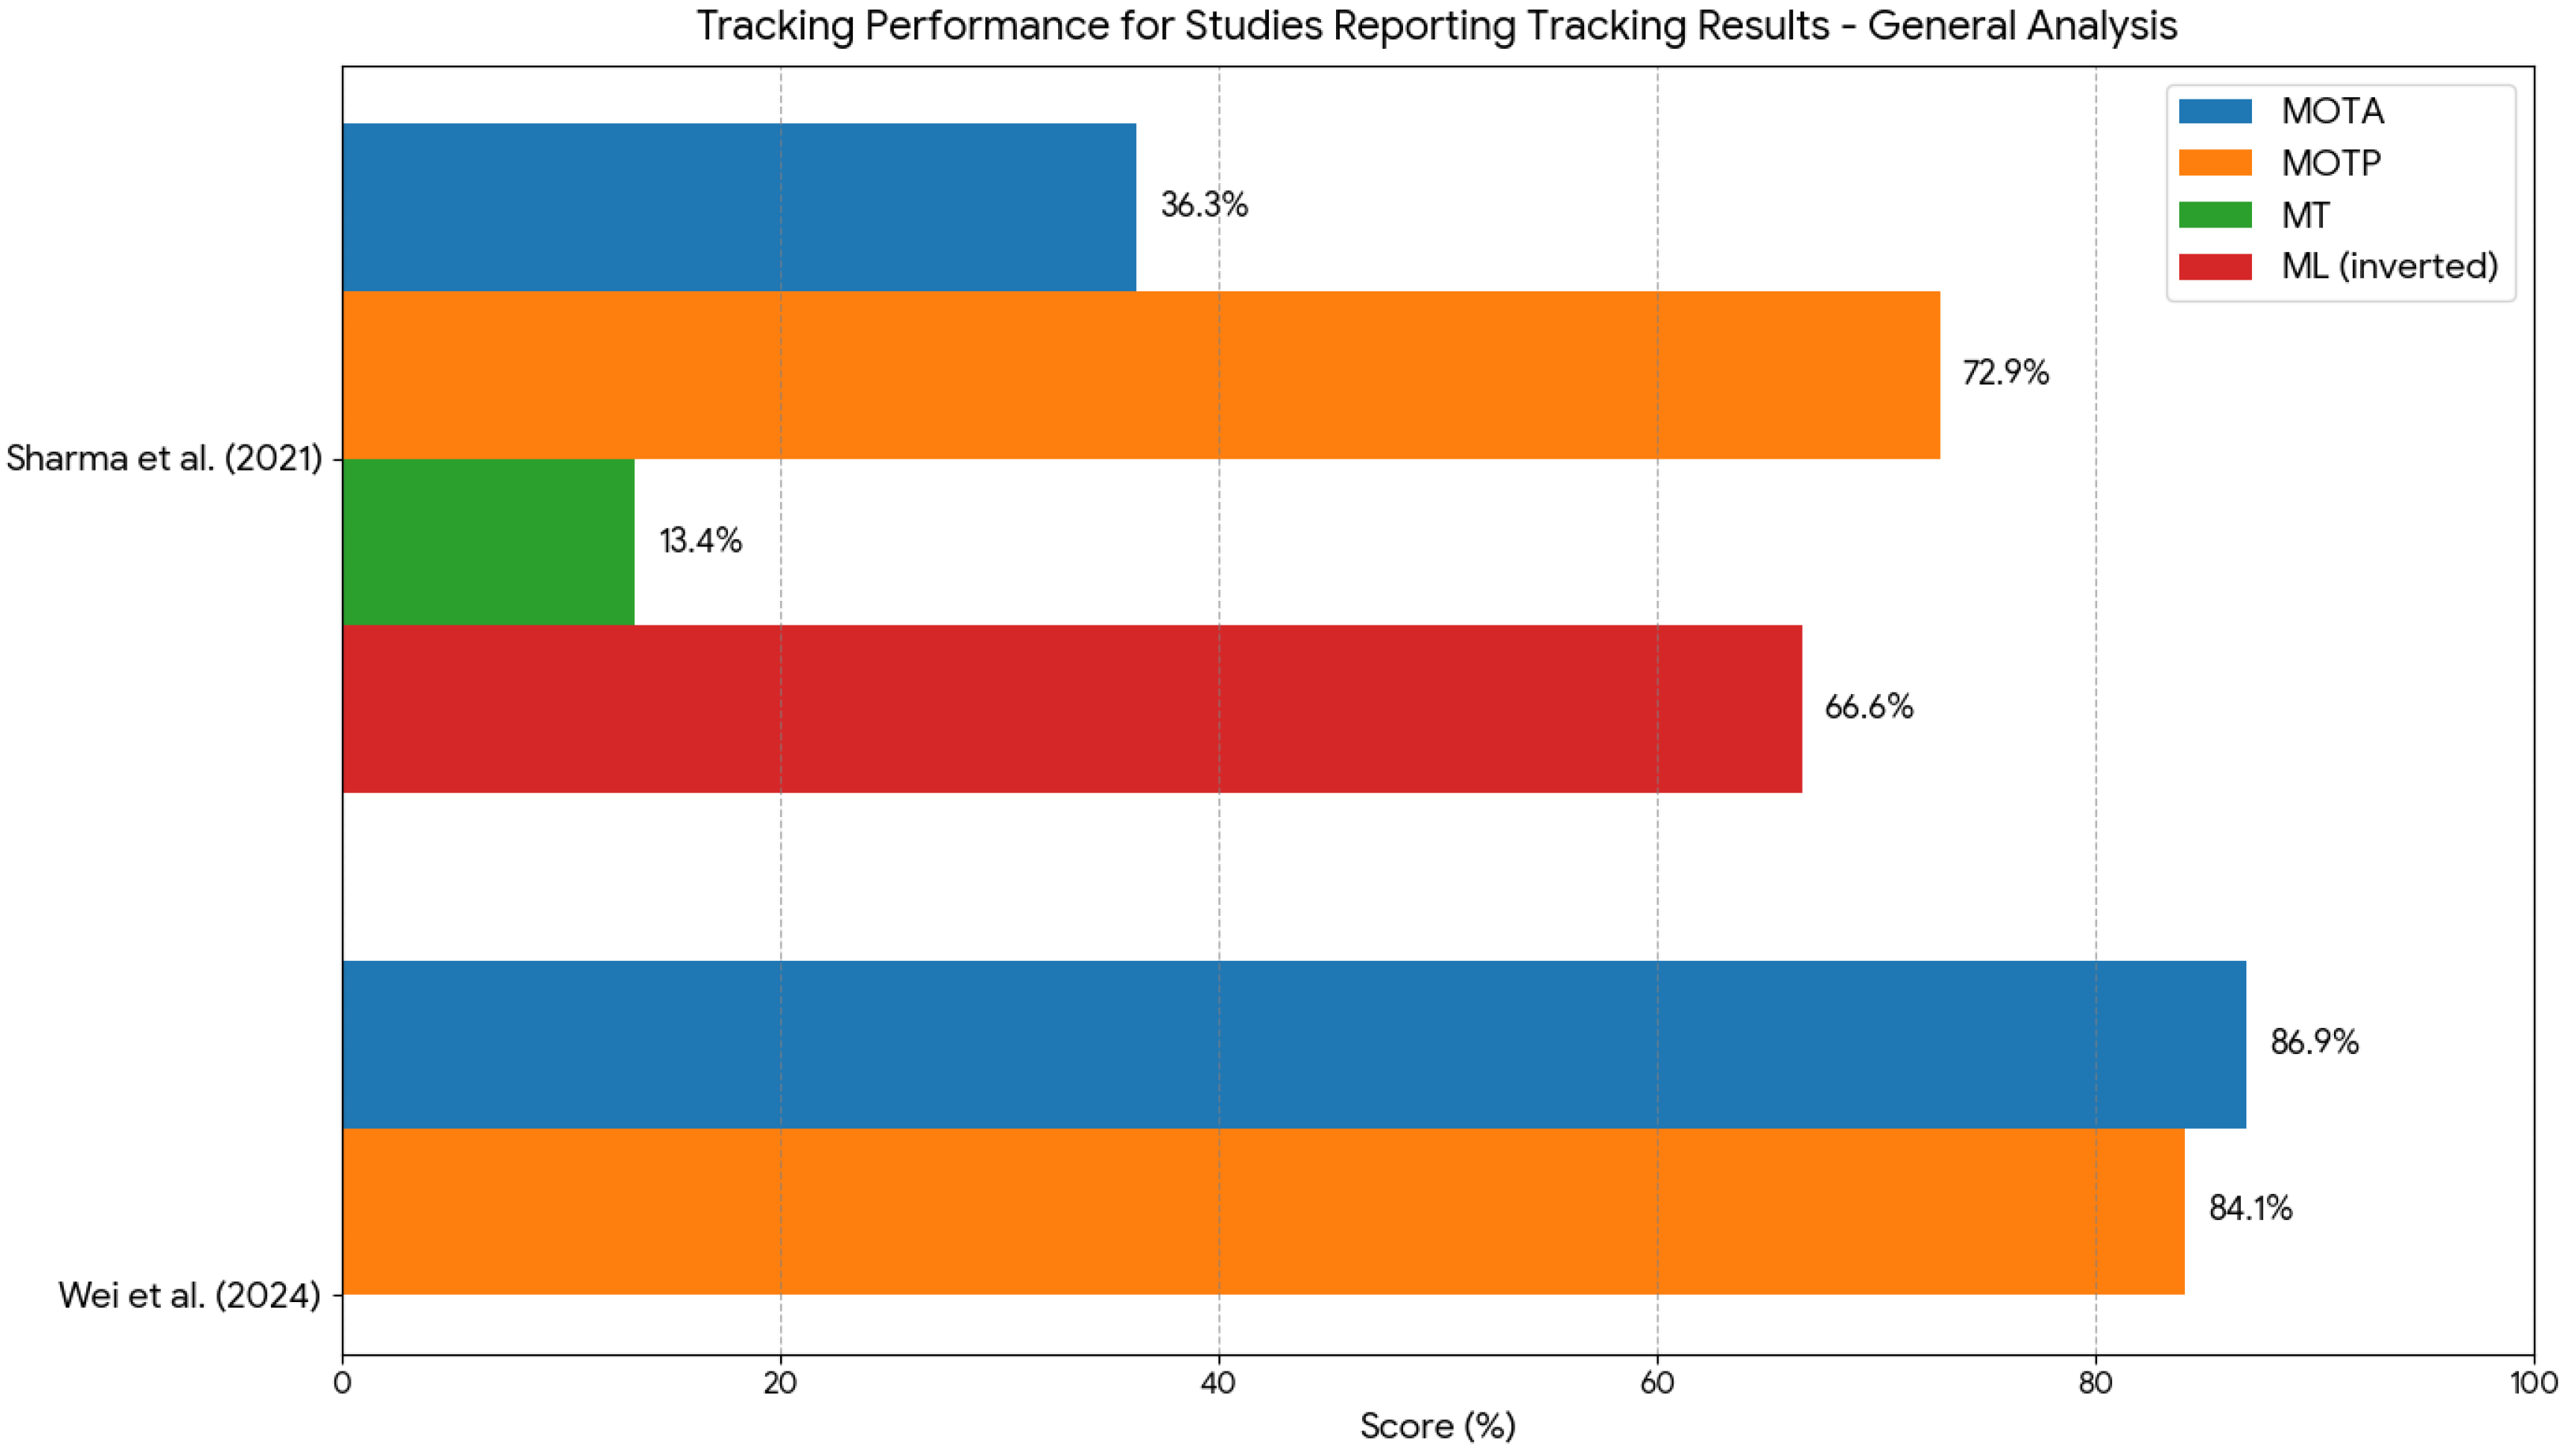
Another study [65] explored the use of the SSD detector, allied with Generative Adversarial Network (GAN) image restoration and integrated with an original tracker, which consists of the BEBLID feature extractor algorithm, the MLESAC module to purify feature points and exclude incorrect noise points, and homography transformation. Training and evaluation were conducted on a custom dataset made from images acquired in the DND road in Delhi, India, totaling 10,502 images but not specifying the train–validation–test split. A test was conducted to show the difference in performance between feeding the detector GAN-restored images and regular samples, and all the studied metrics showed the superiority of the proposed method for the following metrics: precision: 86% vs. 66%; recall: 88% vs. 71%; average IOU: 73.64% vs. 62.41%; mAP: 84.4% vs. 70.7%. The GAN-enhanced detector was then integrated the earlier-described detector, which achieved the following results: MOTA of 36.3%; MOTP of 72.9%; FAF (false alarm per frame, a metric designed to show the per-frame number of false positives) of 1.4%; MT of 13.4%; ML of 33.4%; FP of 140; FN of 304; IDSW of 35; and Frag of 28. This study introduces novel approaches both for the detector and tracking phases, specifically through the use of GANs on dataset image restoration, and the high-quality metrics chosen enhance the system’s comprehensibility. However, the poorly described FAF metric, the absence of benchmarking in a dataset more well supported by other studies, and the lack of comparison of performance with established detectors and trackers, just for performance contextualization, slightly hold the article back.
One other study [66] explored the FairMOT-MCVT algorithm, an enhanced version of the FairMOT system that incorporates a Swish activation function, multi-scale dilated attention (MSDA), a block-efficient module, and a joint loss function, allowing it to perform both detection and tracking. The system is trained on approximately 40 videos from the UA-DETRAC dataset. The first experiment, conducted on the COCO dataset, evaluates the impact of incrementally adding the Swish activation function, MSDA and the block-efficient module, resulting in a larger DLA-efficient architecture, which led to progressive improvements in AP (36.4% to 38.1%), AP@0.5 (53.9% to 56%), AP@0.75 (38.8% to 40.5%), and all the AP scores related to the size of the objects. A second experiment compares the FairMOT, the FairMOT + DLA-Efficient, the FairMOT + joint loss function module and the FairMOT-MCVT models on the UA-DETRAC dataset. The results revealed that FairMOT + DLA-Efficient outperforms the rest in terms of MOTA (79.2%), IDF1 (84.8%), MT (162), and ML (3), slightly ahead of its competitors but extremely close to FairMOT-MCVT, which outperforms the rest in IDSW (45, against the 50 produced by the FairMOT + DLA-Efficient) and also demonstrates more computational efficiency. A final experiment compares both the proposed system and the FairMOT baseline model to SORT, DeepSORT, CenterTrack, RobMOT and MTracker, though results for SORT and DeepSORT are excluded from this review since the detectors integrated are not clearly specified. FairMOT-MCTV achieved the best scores in MOTA, ML (tied), and IDSW, and the second-best score in IDF1 and MT, demonstrating its efficiency. While the study presents a compelling unified detection–tracking model with well-chosen metrics and clear results, its evaluation would benefit from additional detection-specific metrics (e.g., precision and recall) and clarification regarding the selection of detectors integrated with SORT and DeepSORT to extend comparison and replicability.
A further study [67] introduced a novel detection system composed of an Hourglass-like CNN backbone, a feature extractor, and bounding box output module, integrated with a tracking-by-detection framework. This paper lacks critical information regarding the training phase, such as the dataset used, its size and data split. Two evaluations were conducted to directly assess detection and tracking performance. The first used a custom dataset created from images acquired in nine locations in Poland; the proposed system reported a detection accuracy—defined as the ratio of correctly detected vehicles to the total number—above 96%. The second was conducted on a different custom dataset from images acquired in a T-shape intersection, showed a tracking accuracy—defined as the ratio of tracked vehicles to manually tagged vehicles—above 98% across five out of the six tested trajectories (with the sixth being excluded due to improper camera placement). However, this paper fails to further analyze established detection and tracking-specific metrics, such as precision, recall, F1-score, MOTA, and IDSW, and the limited information regarding the training phase, combined with the lack of evaluation on an established benchmark dataset, limits reproducibility and depth of analysis. This factor also makes it difficult to compare the proposed method with other state-of-the art techniques.
Another study [68] presented an innovative detection approach based on Horn–Schunck optical flow, which identifies moving objects—such as vehicles and their shadows—and integrates a shadow detector and removal module—via HSV thresholding and morphological operations—paired with three different tracking algorithms: the proposed immune particle filter, CAMSHIFT and Kalman filter. Since the detection is performed in a non-deep learning way, as it relies purely on classical computer vision techniques without the ability to learn patterns, the training phase is not required, which saves time and computational resources. Evaluations were conducted on a custom dataset of images acquired by a camera fixed in an overpass, under two conditions: good visibility and poor visibility. The study used the centroid error, which measures the positional accuracy of the tracked vehicle relative to the ground truth, and target domain coverage accuracy, which measures how well the tracked vehicle’s bounding box overlaps with the ground truth, as evaluation metrics through which to assess performance. Under good-visibility conditions, the immune particle filter outperformed others with a centroid error of 2.1 and target domain coverage accuracy of 93.6%, compared to CAMSHIFT (4.2 and 69.1%) and Kalman filter (3.8 and 71.3%). As for the poor-visibility subset, the performance declined across all systems, with the proposed method still leading (3.5 and 75.3%) versus CAMSHIFT (7.4 and 60.8%) and Kalman filter (6.7 and 61.1%). While the concept of combining traditional optical flow with a tracker is conceptually appealing and lightweight, the lack of analysis on standard detection and tracking metrics, the semi-manual nature of the shadow-removal thresholding, and the absence of evaluation on widely used benchmark datasets significantly limit the generalizability, reproducibility, and comparative value of the study.
One other study [69] introduced the HVD-Net system, a hybrid detection and tracking framework that integrates several modules for detection—including the first five layers of DarkNet19, a Dense Connection Block (DCB), Dense Spatial Pyramid Pooling (DSPP) for multi-scale processing, feature fusion, a detection head, and loss computation—and employs SORT for tracking. The detection component is trained using the UA-DETRAC and PASCAL VOC 2007 and 2012 datasets with a 60-20-20 train–validation–test split, while a third dataset is used solely for speed estimation and is not relevant to this review. The first evaluation, conducted on static images from PASCAL VOC, shows that the proposed model at 544 × 544 resolution achieved an mAP of 92.6%, outperforming its 416 × 416 counterpart and all compared methods. A second evaluation on dynamic test sequences from UA-DETRAC was conducted under various conditions (overall, cloudy, nighttime, rainy, and sunny), yielding respective mAP scores of 80.71%, 69.09%, 69.18%, 54.24%, and 73.53%. For the overall subset, tracking metrics were also reported: MOTA (29.3%), MOTP (36.2%), PR-IDSW (191), PR-FP (18,078), and PR-FN (169,219). The system outperformed competitors in most cases. While the results are promising, and the use of two well-established datasets strengthens the study’s comparability, there are several shortcomings. The UA-DETRAC dataset includes a predefined test subset, yet the authors opted for a random frame-based split, which risks data leakage by using highly similar training and test samples. Additionally, the lack of an explicitly stated overall mAP across all classes and ambiguity around which input resolution (“Our (VSM)”) was used with SORT hinder clarity. Finally, a deeper analysis of detection-specific metrics, such as precision and mAP across varying IoU thresholds, would have improved the completeness and interpretability of the evaluation.
A further study [70] presents a computer vision-based method for vehicle detection that employs Background Subtraction via Mixture of Gaussians (MoGs), followed by shadow removal and bounding box generation, integrated with a centroid-based tracker using Euclidean distance matching. As this approach relies solely on classical image processing techniques to generate the bounding boxes and perform classification, no training phase is required. The system was evaluated on a custom dataset composed of two scenarios; these were near a traffic light (3580 frames) and a standard urban road (2030 frames), achieving average accuracy scores of 96.13% and 97.43%, respectively. While some comparisons to other papers were provided, differences in the datasets used limit their validity. Despite delivering interesting results and being computationally lightweight due to the absence of deep learning components, the study is weakened by its lack of evaluation using standard detection and tracking metrics, the absence of benchmarking on widely recognized public datasets, and the omission of experiments under varied or challenging lighting conditions to assess the robustness and generalizability of the system.
One final article [71] studied REMOT, a framework that bypasses traditional detection approaches altogether, relying instead on the processing and following of asynchronous events through attention units. The system employs a non-data-driven approach, thus requiring no prior training phase. While its mechanism for simultaneously computing object detection and tracking is innovative, it complicates the separate benchmarking of these components. For this reason, the evaluation focused on the metrics DetA, AssA and HOTA, which assess both detection and tracking performances. The resulting scores for the inbound traffic subset were 50.9%, 58%, and 54.3%, respectively, while the outbound subset yielded lower performance at 39%, 47.8%, and 43.1%, respectively. Although this non-traditional approach diverges significantly from methods found in the existing literature, its utility and future contribution would be enhanced through, first, a more granular experimentation focused on the system’s detection component to increase its comprehensibility and, second, conducting an evaluation on a standardized public dataset to establish its replicability and ensure direct comparison with other state-of-the-art experiments.
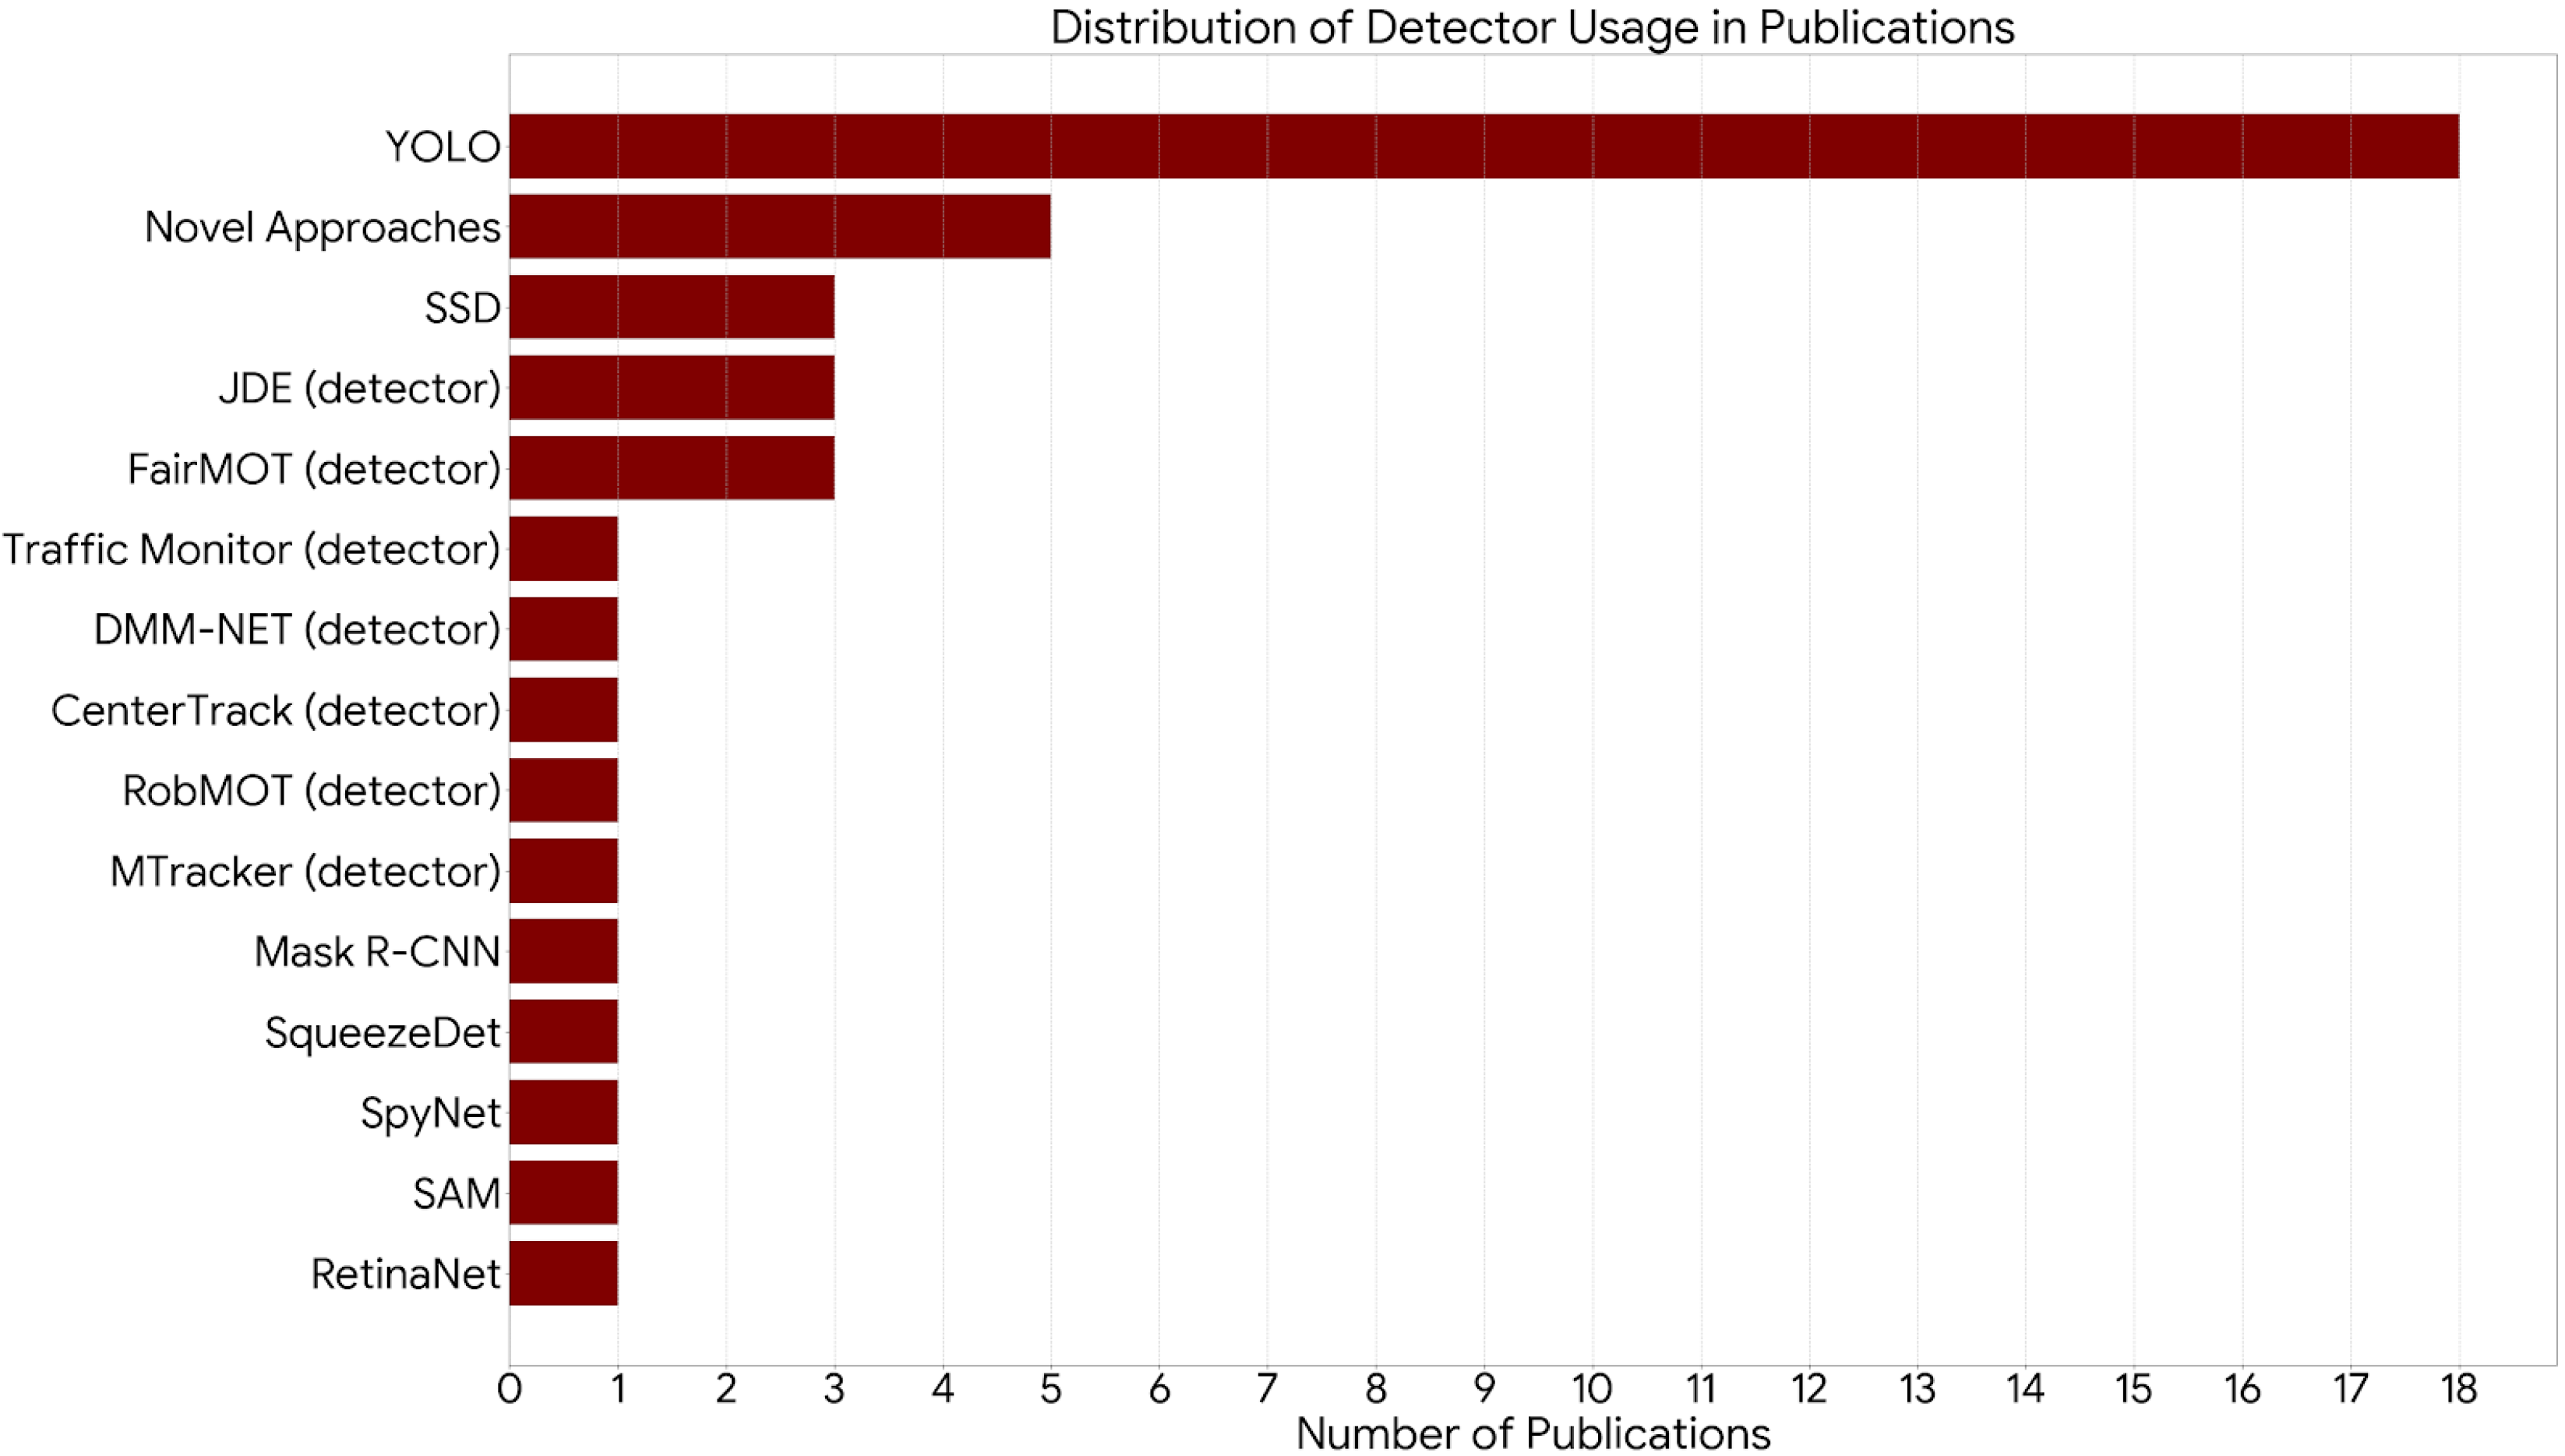
Below, Figure 5 illustrates detector usage, highlighting the popularity of YOLO approaches, which were adopted by 18 of the 29 selected studies in comparison with all the other detectors.
To provide a comprehensive overview of the contributions from the selected studies, three supporting tables are presented in the Appendix A.

3.4. Meta-Analysis

This section presents a structured overview of the extracted results. It begins with an analysis of the UA-DETRAC implementations, highlighting which studies achieved the strongest performance and the methodological nuances that influenced their outcomes. The discussion then broadens to a cross-dataset perspective, examining the main evaluation metrics to capture overall performance trends and provide contextual interpretation.
UA-DETRAC, since it is the most comprehensive dataset with which to examine both detection and tracking performances, was given a separate analysis from all the other approaches. Moreover, the tracking section had enough standardization and provided a sufficient number of articles to proportionate the inclusion of a description on relevant statistics, which would be impossible to make for the detection portion of UA-DETRAC studies (due to insufficient number of results) and for the general analysis (because of excessive heterogeneity in datasets).

3.4.1. UA-DETRAC Analysis

UA-DETRAC was used for evaluation in nine studies. Of them, only You et al. (2024) [50] reported all four of the most standard detection metrics, which include precision, recall, mAP@0.5 and mAP@[0.5:0.95], providing the most comprehensive assessment. According to Figure 6, Ge et al. (2024) [44], while reporting fewer metrics, achieved higher scores for mAP@0.5 than You et al. (2024) [50] and both tied for mAP@[0.5:0.95].
Among the nine studies that reported tracking performance, eight followed the CLEAR-MOT guidelines, with only Nikodem et al. (2020) [67] adopting the HOTA framework. Within the studies based on CLEAR-MOT, MOTA was the only metric consistently reported across all evaluations on the UA-DETRAC dataset, and by analyzing Figure 7, Li et al. (2024) [66] achieved the highest score. In contrast, the MOTP metric was only reported by four studies, with the top result belonging to Reyna et al. (2024) [51]. None of the articles reported MT, IDF1 and ML scores simultaneously, though the best individual values were provided by Lee et al. (2021) [64], Li et al. (2024) [66], and Reyna et al. (2024) [51], respectively, through the examination of Figure 8. Specifically, for the ML metric, lower scores represent better results, so to align with the interpretation of the other metrics, its value is shown on an inverted scale.
Only metrics that could be expressed as percentages are considered in this section since raw counts are heavily biased by subset size, which varied across evaluations.
It is notable from analysis of Table 4 that results are extremely inconsistent across studies. Both MOTA and MOTP demonstrate extremely high standard deviations (18.7% and 22.1%) relative to their mean values (57.3% and 52.7%). This high variability, coupled with such extreme ranges (49.9% and 73.3%), is a direct and statistically powerful confirmation that the field of vehicle tracking, even when subjected only to a UA-DETRAC review, suffers from profound methodological heterogeneity.
Moreover, reporting practices for the UA-DETRAC dataset remain inconsistent and fragmented, with no single study offering a full picture across both detection and tracking evaluations, which restrict interpretability and benchmarking.

3.4.2. General Analysis

In this subsection, the analysis focuses on detection algorithms. Similar to the UA-DETRAC evaluation, only the mAP@0.5, mAP@[0.5:0.95], precision and recall metrics are considered. Results from studies that do not specify mAP or AP thresholds are excluded from the analysis. When multiple detection systems are reported in a single article, the system selected for analysis is the one that is the primary focus of the study. If multiple datasets are used, the most standard dataset is chosen, thus excluding weather-type variations and maintaining fair comparability. In cases of remaining duplicates, the system with the highest reported performance is selected.
As shown in the supporting charts from Figure 9, the highest mAP@0.5 score was reported by Saadeldin et al. (2024) [47], while the best mAP@[0.5:0.95] was achieved by Villa et al. (2024) [52]. For precision, the top-performing study was that by Jin et al. (2023) [53], and for recall, the leading results were shared by Mo et al. (2022) [46] and Shokri et al. (2022) [62]. It is worth noting that several studies conducted evaluations on test subsets that closely resembled their training and validation sets, especially those who employed custom datasets, likely limiting their performance in slightly different conditions. Moreover, none of the reviewed articles reported all four major detection metrics simultaneously, which undermines both interpretability and transparency.
As for the tracking analysis, only three articles conducted evaluations outside the UA-DETRAC dataset, once again demonstrating this dataset’s versatility. The three studies by Wei et al. (2024) [56], Sharma et al. (2021) [65], and Gao et al. (2023) [71] used custom datasets for their experiments; however, only the first two conducted their analysis on a CLEAR-MOT foundation. Even though UA-DETRAC benchmarks were included in the general detection analysis of this subsection, they are excluded from the tracking analysis for simplicity, given that only three non-UA-DETRAC references are available.
From Figure 10 above, Wei et al. (2024) [56] achieved higher scores in the MOTA and MOTP metrics, whereas Sharma et al. (2021) [65] reported four out of the five most commonly used metrics, only missing IDF1, while the first reports only two.
Similarly to the UA-DETRAC analyses, the landscape of reported detection and tracking performance is scattered, often omitting key metrics and lacking rigor in definitions, particularly regarding threshold handling. Many articles also introduce their own metrics, which limits interpretability and makes meta-analysis unnecessarily difficult and less meaningful.

4. Conclusions

This systematic review was set out to provide a comprehensive analysis of vehicle detection and tracking systems, along with the broader ecosystem surrounding these approaches. Several key contributions were achieved while addressing the proposed research questions. For RQ1, a meta-analysis underscored the performance comparability of the different detection and tracking pipelines (RQ1). For RQ2, an extensive examination of different computer vision techniques was conducted throughout the individual summaries of each article (RQ2). For RQ3, the analysis emphasized the distinct dataset’s characteristics and identified UA-DETRAC as the most complete and versatile reference. Finally, for RQ4, rigorous definitions of evaluation metrics were consolidated, providing a consistent basis for the interpretation and contextualization of performance results across the reviewed studies.
However, throughout the studies, several issues were identified. The first relates to inconsistent results for standard metrics (MOTA scores ranging from 29.6% to 79.2%, recall scores from 38.2% to 97.9%) due to widely varying experimental setups, including differences in dataset or subset selection. Second, the introduction of non-standard metrics was frequent, often being repetitive and lacking generalizability. Third, there was excessive heterogeneity in dataset configurations, such as number of images, type of annotations, number of classes, and, especially, scenario diversity, where in custom datasets such heterogeneity frequently inflated performance. Fourth, many references exhibited a lack of methodological rigor in study design and reporting, leading to the exclusion of many promising works from this review, with specific issues including low transparency of results, unclear attribution of results to specific detectors/trackers, and unreported versions of the primary models. Fifth, there was insufficient rigor when presenting results, such as unspecified thresholds and acknowledgment of potential data leakage. Sixth, tracking-related analysis was limited, with only 12 of the 29 studies performing standard CLEAR-MOT or HOTA evaluations.
To address the problems presented above, multiple solutions can be envisioned. First, standardization of metrics not only enables meaningful comparisons with similar studies but also enhances the interpretability of key factors within the detection and tracking ecosystem, such as precision (prediction accuracy), MOTA (tracking accuracy), and HOTA (a balance between detection accuracy and identity preservation). Secondly, creating new or expanding existing datasets to encompass a wider variety of scenarios, large image collections, and additional annotations capable of supporting tracking evaluation (with UA-DETRAC currently the only publicly available dataset fulfilling this role) would mitigate bias from custom datasets. Third, strengthening the peer review process, particularly by clarifying the attribution of results to the specific detection/tracking components, would minimize misinterpretations. Fourth, mandating clear train–validation–test splits with isolated test subsets would improve reproducibility, prevent data leakage, and enhance transparency. Fifth, establishing a flexible platform, inspired by the MOT challenge [72], with diverse, properly annotated datasets and automated CLEAR-MOT/HOTA evaluations would streamline benchmarks, foster collaboration between authors, and standardize results within the community. Collectively, these solutions illuminate the path toward the deployment of computer vision systems in smart cities, particularly for automatic vehicle detection and tracking.
While this review provides a rigorous synthesis of 29 high-quality works, it is not without limitations. The reliance on Scopus and ACM Digital Library as the only source may have excluded relevant studies available in other databases. Additionally, restricting the review to publications from 2020–2024 could have omitted earlier works that illustrate the evolution of detection and tracking systems, as well as 2025 studies exploring state-of-the-art technologies. Similarly, the emphasis on fixed top-view imagery excluded interesting works involving drones and other mobile perspectives. Fragmented reporting across studies also complicated the meta-analysis, reducing its cohesiveness. A meaningful analysis on hardware performance could also have been conducted to ensure real-world practicality comprehension. Finally, by concentrating exclusively on integrated vehicle detection and tracking pipelines, this review did not consider studies addressing only one of the two phases, which might have held valuable insights and offered complementary perspectives.
As a future research direction, we intend to extend the scope of analysis beyond computer vision by integrating data from additional sensors and incorporating other visual perspectives. It is also desirable to conduct a more comprehensive evaluation on hardware performance, extending the meta-analysis to including metrics such as FPS and FLOPS, which is particularly relevant for edge and resource-constrained implementations. In addition, comparing performance across different scenarios, such as rainy, foggy and nighttime conditions, would constitute an interesting complement to the existing meta-analysis by providing further insights into the robustness of detection and tracking systems.
Ultimately, the findings of this work reaffirm the central role of computer vision systems in smart-city developments, particularly in automatic vehicle detection and tracking infrastructures. While multiple problems and limitations were identified, this review also proposed corresponding solutions to enhance the robustness of these systems and guide future implementations. As cities continue to grow and Artificial Intelligence becomes more ubiquitous, vehicle detection and tracking systems may hold the key to unlocking the full potential of smart mobility services.

Author Contributions

Conceptualization, J.M., F.C.P. and P.C.; methodology, J.M. and P.C.; investigation, J.M.; writing—original draft preparation, J.M.; writing—review and editing, J.M. and P.C.; supervision, F.C.P. and P.C. All authors have read and agreed to the published version of the manuscript.

Funding

This research work has been partially funded by the 6G-PATH project through the Smart Networks and Services Joint Undertaking (SNS JU) and cofunded by the European Union (EU) under the EU Horizon Europe research and innovation program (GA no.—101139172). This work was also supported by National Funds by FCT–Portuguese Foundation for Science and Technology, under the projects UID/04033/2025: Centre for the Research and Technology of Agro-Environmental and Biological Sciences (https://doi.org/10.54499/UID/04033/2025, accessed on 13 November 2025) and LA/P/0126/2020 (https://doi.org/10.54499/LA/P/0126/2020, accessed on 13 November 2025).

Acknowledgments

The authors of this research work would like to acknowledge the contributions of 6G-PATH project partners.

Conflicts of Interest

The authors declare no conflict of interest.

Appendix A

Table A1. Support table showing performance for the YOLO family.
Ref.Testing Hardware PlatformTraining/Tuning DatasetTesting DatasetDetection MethodTracking MethodResults
[43]CPU: 11th Gen Intel(R) Core (TM) i7-11800H @ 2.30 GHz
RAM: 16 GB
GPU: NIVIDIA GeForce RTX3070
IStock videos + Open-source dataset by Song et al. 2019 [31] + Custom DatasetCustom DatasetYOLOv5m6DeepSORTAverage Counting Accuracy: 95%
mAP@0.5: 78.7%
[44]CPU: 15 vCPU Intel(R) Xeon(R) Platinum 8358P CPU @ 2.60 GHz. GPU: NVIDIA RTX 3090UA-DETRAC + VeRI datasetUA-DETRACYOLOv5DeepSORTmAP@0.5: 70.3%
mAP@[0.5:0.95]: 51.8%
MOTA: 23.1%
MT: 27.4%
IDSW: 130
DeepSORT + Input Layer Resizing + Removal of the Second Convolutional Layer + Addition of a New Residual Convolutional Layer + Replacement of Fully Connected Layers to an Average Pooling LayermAP@0.5: 70.3%
mAP@[0.5:0.95]: 51.8%
MOTA: 23.9%
MT: 27.5%
IDSW: 110
YOLOv5 + Better Bounding Box Alignment (WIoU) + Multi-scale Feature Extractor (C3_Res2) + Multi-Head Self-Attention Mechanism (MHSA) + Attention Mechanism (SGE)DeepSORTmAP@0.5: 76%
mAP@[0.5:0.95]: 55.4%
MOTA: 28.8%
MT: 31.6%
IDSW: 100
DeepSORT + Input Layer Resizing + Removal of the Second Convolutional Layer + Addition of a New Residual Convolutional Layer + Replacement of Fully Connected Layers to an Average Pooling LayermAP@0.5: 76%
mAP@[0.5:0.95]: 55.4%
MOTA: 29.6%
MT: 32.1%
IDSW: 94
[45]GPU: GeForce RTX 3070Redouane Kachach dataset + GRAM Road-Traffic Monitoring + Open Online CamerasRedouane Kachach dataset + GRAM Road-Traffic Monitoring + Open Online Cameras—good conditionsYOLOv3TrafficSensor (Spatial Proximity Tracker + Kanade–Lucas–Tomasi Feature Tracker)mAP: 89.3%
mAR: 90.1%
DeepSORTmAP: 81.6%
mAR: 86.9%
YOLOv4TrafficSensor (Spatial Proximity Tracker + Kanade–Lucas–Tomasi Feature Tracker)mAP: 90.6%
mAR: 96.7%
Redouane Kachach dataset + GRAM Road-Traffic Monitoring + Open Online Cameras—bad weatherYOLOv3TrafficSensor (Spatial Proximity Tracker + Kanade–Lucas–Tomasi Feature Tracker)mAP: 99%
mAR: 99.3%
DeepSORTmAP: 98%
mAR: 98.2%
YOLOv4TrafficSensor (Spatial Proximity Tracker + Kanade–Lucas–Tomasi Feature Tracker)mAP: 99%
mAR: 99.5%
Redouane Kachach dataset + GRAM Road-Traffic Monitoring + Open Online Cameras—poor qualityYOLOv3TrafficSensor (Spatial Proximity Tracker + Kanade–Lucas–Tomasi Feature Tracker)mAP: 94.4%
mAR: 94.4%
DeepSORTmAP: 88.5%
mAR: 89.1%
YOLOv4TrafficSensor (Spatial Proximity Tracker + Kanade–Lucas–Tomasi Feature Tracker)mAP: 99%
mAR: 99.1%
[46]CPU: Intel Core i5-9400F 2.90 GHz
RAM: 16 GB
MPI Sintel + Custom DatasetCustom DatasetYOLOv3DeepSORTPrecision: 88.6%
Recall: 92.1%
Rt: 82.3%
Rf: 7.1%
Ra: 10.6%
[47]NVIDIA Jetson NanoHighway Vehicle Dataset + Miovision Traffic Camera (MIO-TCD) Dataset + Custom DatasetHighway Vehicle Dataset + Miovision Traffic Camera (MIO-TCD) Dataset + Custom DatasetYOLOv8-Nano + Small Object Detection Layer + CBAMDeepSORTmAP@0.5: 97.5%
Precision: 93.3%
Recall: 92.5%
Average Counting Accuracy: 96.8%
[48]Not describedDRR of Thailand’s Surveillance Camera Images + Custom DatasetCustom DatasetYOLOv3Centroid-Based TrackerPrecision: 88%
Recall: 92%
Overall Accuracy: 90%
YOLOv3-TinyCentroid-Based TrackerPrecision: 88%
Recall: 92%
Overall Accuracy: 90%
YOLOv5-SmallCentroid-Based TrackerPrecision: 85%
Recall: 82%
Overall Accuracy: 83%
YOLOv5-LargeCentroid-Based TrackerPrecision: 96%
Recall: 95%
Overall Accuracy: 95%
Custom Dataset—NoisyYOLOv5-LargeCentroid-Based TrackerPrecision: 84.1%
Recall: 78.8%
Overall Accuracy: 81.4%
Custom Dataset—ClearYOLOv5-LargeCentroid-Based TrackerPrecision: 94%
Recall: 94%
Overall Accuracy: 94%
[49]CPU: AMD Ryzen 9 5950X
GPU: NVIDIA GeForce RTX3090TI
UA-DETRAC + VeRI-776 DatasetUA-DETRACYOLOv8DeepSORTMOTA: 55.6%
MOTP: 70.2%
IDF1: 71.4%
IDSW: 476
YOLOv8 + FasterNet Backbone + Small Target Detection Head + SimAM Attention Mechanism + WIOUv1 Bounding Box LossDeepSORTMOTA: 57.6%
MOTP: 72.6%
IDF1: 73.2%
IDSW: 455
DeepSORT + OS-NET for Appearance Feature ExtractionMOTA: 58.8%
MOTP: 73.2%
IDF1: 73.8%
IDSW: 421
DeepSORT + GIoU MetricMOTA: 58.6%
MOTP: 71.5%
IDF1: 75.4%
IDSW: 414
DeepSORT + OS-NET for Appearance Feature Extraction + GIoU MetricMOTA: 60.2%
MOTP: 73.8%
IDF1: 77.3%
IDSW: 406
[50]GPU: NVIDIA GeForce RTX 4090
CPU: Intel Core i9-9900K @3.60 GHz
UA-DETRACUA-DETRACYOLOv8-SmallByteTrackPrecision: 71.8%
Recall: 58.6%
mAP@0.5: 64.2%
mAP@[0.5:0.95]: 46.6%
mIDF1: 76.9%
IDSW: 855
mMOTA: 67.2%
YOLOv8-Small + Context Guided Module + Dilated Reparam Block + Soft-NMSByteTrackPrecision: 82.4%
Recall: 62.3%
mAP@0.5: 73.2%
mAP@[0.5:0.95]: 55.4%
mIDF1:78.2%
IDSW: 785
mMOTA: 70.6%
ByteTrack + Improved Kalman FilterPrecision: 82.4%
Recall: 62.3%
mAP@0.5: 73.2%
mAP@[0.5:0.95]: 55.4%
mIDF1: 79.7%
IDSW: 717
mMOTA: 73.1%
ByteTrack + Improved Kalman Filter + Gaussian Smooth InterpolationPrecision: 82.4%
Recall: 62.3%
mAP@0.5: 73.2%
mAP@[0.5:0.95]: 55.4%
mIDF1: 80.3%
IDSW: 530
mMOTA: 73.9%
[51]CPU: 8-core Intel Corei7
RAM: 16 GB
GPU: NVidia RTX-3060 card with 12 GB of video memory
UA-DETRACUA-DETRACYOLOv7-W6MEDAVET (Bipartite Graphs Integration + Convex Hull Filtering + QuadTree for Occlusion Handling)MOTA: 58.7%
MOTP: 87%
IDSW: 636
MT: 37.6%
ML: 7.2%
[52]Nvidia
Jetson Orin AGX 64 GB Developer Kit
Custom datasetCustom datasetYOLOv5-NanoDeepSORTPrecision: 98.3%
Recall: 92.9%
mAP@0.5: 95.4%
mAP@[0.5:0.95]: 80%
DAWN—SnowYOLOv5-NanoDeepSORTmAP@[0.5:0.95]: 33.2%
DAWN—FogYOLOv5-NanoDeepSORTmAP@[0.5:0.95]: 40.4%
DAWN—RainYOLOv5-NanoDeepSORTmAP@[0.5:0.95]: 39.7%
[53]Not describedCustom datasetCustom datasetYOLOv4 + Distance IoUIoU-based Tracking + Kalman Filter + OSNetAccuracy: 97.7%
Precision: 99.3%
[54]Not describedCustom DatasetPASCAL VOC 2007YOLOv5-SmallDeepSORTPrecision: 65.7%
Recall: 83.4%
mAP: 81.2%
Custom DatasetYOLOv5-SmallDeepSORTPrecision: 91.3%
Recall: 93.5%
mAP@0.5: 92.2%
[55]CPU: Intel(R) Core(TM) i7-13620H 2.40 GHz
RAM: 48 GB
GPU: NVIDIA GeForce RTX 4060. CUDA cores: 3072. Max-Q Technology
8.188 MB GDDR6
Custom Dataset (including COCO)Custom Dataset—SunnyYOLOR CSP XDeepSORTAverage Accuracy@0.35: 79.9%
Average Accuracy@0.55: 75%
Average Accuracy@0.75: 66.3%
YOLOR CSPDeepSORTAverage Accuracy@0.35: 83.8%
Average Accuracy@0.55: 76.8%
Average Accuracy@0.75: 54.7%
YOLOR P6DeepSORTAverage Accuracy@0.35: 75%
Average Accuracy@0.55: 68.2%
Average Accuracy@0.75:65.4%
Custom Dataset—CloudyYOLOR CSP XDeepSORTAverage Accuracy@0.35: 66.3%
Average Accuracy@0.55: 75.6%
Average Accuracy@0.75:52.9%
YOLOR CSPDeepSORTAverage Accuracy@0.35: 78.9%
Average Accuracy@0.55: 70.2%
Average Accuracy@0.75: 47.6%
YOLOR P6DeepSORTAverage Accuracy@0.35: 56.7%
Average Accuracy@0.55: 77.5%
Average Accuracy@0.75: 46.7%
Custom Dataset—Sunny and Class DroppingYOLOR CSPDeepSORTAverage Accuracy@0.35: 91%
Total Accuracy@0.35: 99.3%
Custom Dataset—Cloudy and Class DroppingYOLOR CSPDeepSORTAverage Accuracy@0.35: 93.6%
Total Accuracy@0.35: 98.5%
Custom Dataset—No Sunlight and Class DroppingYOLOR CSPDeepSORTAverage Accuracy@0.35: 89.6%
Total Accuracy@0.35: 98%
[56]Not describedNo trainingBiT-Vehicle DatasetYOLOv4Kalman Filter + Expanded State Vector + Larger State Matrix + Improved Initialization + Aspect Ratio HandlingmAP: 94.4%
YOLOv4 + Enhanced Feature Fusion (SPP + PANet) + Deep-Separable Convolutions + Improved Loss FunctionKalman Filter + Expanded State Vector + Larger State Matrix + Improved Initialization + Aspect Ratio HandlingmAP: 95.7%
Custom DatasetYOLOv4Kalman Filter + Expanded State Vector + Larger State Matrix + Improved Initialization + Aspect Ratio HandlingMOTA: 85.9%
MOTP: 83.8%
IDS: 45
YOLOv4 + Enhanced Feature Fusion (SPP + PANet) + Deep-Separable Convolutions + Improved Loss FunctionKalman Filter + Expanded State Vector + Larger State Matrix + Improved Initialization + Aspect Ratio HandlingMOTA: 86.9%
MOTP: 84.1%
IDS: 36
Custom Dataset—Daytime and sunnyYOLOv4 + Enhanced Feature Fusion (SPP + PANet) + Deep-Separable Convolutions + Improved Loss FunctionKalman Filter + Expanded State Vector + Larger State Matrix + Improved Initialization + Aspect Ratio HandlingCorrect Identification Rate: 100%
Custom Dataset—Daytime and cloudyYOLOv4 + Enhanced Feature Fusion (SPP + PANet) + Deep-Separable Convolutions + Improved Loss FunctionKalman Filter + Expanded State Vector + Larger State Matrix + Improved Initialization + Aspect Ratio HandlingCorrect Identification Rate: 98.6%
Custom Dataset—Daytime and rainyYOLOv4 + Enhanced Feature Fusion (SPP + PANet) + Deep-Separable Convolutions + Improved Loss FunctionKalman Filter + Expanded State Vector + Larger State Matrix + Improved Initialization + Aspect Ratio HandlingCorrect Identification Rate: 96.1%
Custom Dataset—Nighttime and sunnyYOLOv4 + Enhanced Feature Fusion (SPP + PANet) + Deep-Separable Convolutions + Improved Loss FunctionKalman Filter + Expanded State Vector + Larger State Matrix + Improved Initialization + Aspect Ratio HandlingCorrect Identification Rate: 100%
Custom Dataset—Nighttime and cloudyYOLOv4 + Enhanced Feature Fusion (SPP + PANet) + Deep-Separable Convolutions + Improved Loss FunctionKalman Filter + Expanded State Vector + Larger State Matrix + Improved Initialization + Aspect Ratio HandlingCorrect Identification Rate: 97.7%
Custom Dataset—Nighttime and rainyYOLOv4 + Enhanced Feature Fusion (SPP + PANet) + Deep-Separable Convolutions + Improved Loss FunctionKalman Filter + Expanded State Vector + Larger State Matrix + Improved Initialization + Aspect Ratio HandlingCorrect Identification Rate: 95.4%
[57]NVIDIA Jetson NanoCustom DatasetCustom DatasetYOLOv4-TinyFastMOT (DeepSORT + Kanade–Lucas–Tomasi Optical Flow)mAP: 78.7%
[58]Zynq-7000UA-DETRACUA-DETRACYOLOv3 + Pruning (85%)DeepSORT + RE-ID Module retrainingAP@0.5: 71.1%
YOLOv3-Tiny + Pruning (85% + 30%)DeepSORT + RE-ID Module retrainingAP@0.5: 59.9%
YOLOv3 + Pruning (85%) & YOLOv3-Tiny + Pruning (85% + 30%)DeepSORT + RE-ID Module retrainingMOTA: 59.2%
MOTP: 13.7%
IDF1: 72.1%
IDP: 85.2%
IDR: 64.6%
IDSW: 25
UA-DETRAC—DaytimeYOLOv3 + Pruning (85%)DeepSORT + RE-ID Module retrainingAccuracy Rate: 96.2%
YOLOv3-Tiny + Pruning (85% + 30%)DeepSORT + RE-ID Module retrainingAccuracy Rate: 92.3%
UA-DETRAC—NighttimeYOLOv3 + Pruning (85%)DeepSORT + RE-ID Module retrainingAccuracy Rate: 94%
YOLOv3-Tiny + Pruning (85% + 30%)DeepSORT + RE-ID Module retrainingAccuracy Rate: 92%
UA-DETRAC—RainyYOLOv3 + Pruning (85%)DeepSORT + RE-ID Module retrainingAccuracy Rate: 81.8%
YOLOv3-Tiny + Pruning (85% + 30%)DeepSORT + RE-ID Module retrainingAccuracy Rate: 75.8%
[59]GPU: NVIDIA GeForce GTX 1050 TI 4 GB GDDR5 and NVIDIA GeForce RTX 2080 TI 11 GB GDDR6Custom Dataset—Afternoon. High CameraCustom Dataset—Afternoon. High CameraYOLOv3 + Frame Reduction + Loss Function AdjustmentKalman FilterTotal Accuracy: 77%
Centroid-Based TrackerTotal Accuracy: 84.5%
Custom Dataset—Afternoon. Distant CameraCustom Dataset—Afternoon. Distant CameraYOLOv3 + Frame Reduction + Loss Function AdjustmentKalman FilterTotal Accuracy: 81.7%
Centroid-Based TrackerTotal Accuracy: 88.4%
Custom Dataset—Morning. Low CameraCustom Dataset—Morning. Low CameraYOLOv3 + Frame Reduction + Loss Function AdjustmentKalman FilterTotal Accuracy: 65.8%
Centroid-Based TrackerTotal Accuracy: 78.7%
Custom Dataset—Evening. Close CameraCustom Dataset—Evening. Close CameraYOLOv3 + Frame Reduction + Loss Function AdjustmentKalman FilterTotal Accuracy: 81.9%
Centroid-Based TrackerTotal Accuracy: 88.5%
Custom Dataset—Afternoon. High Angle CameraCustom Dataset—Afternoon. High Angle CameraYOLOv3 + Frame Reduction + Loss Function AdjustmentKalman FilterTotal Accuracy: 70.7%
Centroid-Based TrackerTotal Accuracy: 82.9%
[60]Not describedUA-DETRACUA-DETRACYOLOX + Feature Adaptive Fusion Pyramid Network (FAFPN)DeepSORTAP@0.5: 76.3%
AP@0.75: 65.7%
AP@[0.5:0.95]: 55.7%
Table A2. Support table showing the performance for the other detector’s families.
Ref.Testing Hardware PlatformTraining DatasetTesting DatasetDetection MethodTracking MethodResults
[43]CPU: 11th Gen Intel(R) Core (TM) i7-11800H @ 2.30 GHz 2.30 GHz
RAM: 16 GB
GPU: NIVIDIA GeForce RTX3070
IStock videos from Google + Open-source dataset by Song et al. 2019 [31] + Custom DatasetCustom DatasetSSDDeepSORTAverage Counting Accuracy: 84%
mAP@0.5: 83.2%
Mask R-CNNDeepSORTAverage Counting Accuracy: 91%
mAP@0.5: 76.5%
[61]NVIDIA Jetson Tx2UA-DETRAC + Custom DatasetCustom DatasetSpyNet + Background Subtraction + Fine-Tuning + Human-in-the-LoopSORTmAP: 54.6%
[46]CPU: Intel Core i5-9400F 2.90 GHz
RAM: 16 GB
MPI Sintel + Custom DatasetCustom DatasetMask-SpyNet (SpyNet Optical Flow + Mask-Based Segmentation Branch)DeepSORTPrecision: 95%
Recall: 97.9%
Rt: 93.1%
Rf: 2%
Ra: 4.9%
[45]GPU: GeForce RTX 3070 graphics cardRedouane Kachach dataset + GRAM Road-Traffic Monitoring + Open Online CamerasRedouane Kachach dataset + GRAM Road-Traffic Monitoring + Open Online Cameras—Good ConditionsTraffic MonitormAP: 43.7%
mAR: 59.4%
Redouane Kachach dataset + GRAM Road-Traffic Monitoring + Open Online Cameras—Bad WeatherTraffic MonitormAP: 24.1%
mAR: 31.6%
Redouane Kachach dataset + GRAM Road-Traffic Monitoring + Open Online Cameras—Poor QualityTraffic MonitormAP: 44.8%
mAR: 63%
[51]CPU: 8-core Intel Corei7
RAM: 16 GB
GPU: NVidia RTX-3060 card with 12 GB of video memory.
UA-DETRACUA-DETRACModel2MOTA: 55.1%
MOTP: 85.5%
IDSW: 2311
MT: 47.1%
ML: 6.8%
JDEMOTA: 24.5%
MOTP: 68.5%
IDSW: 994
MT: 28.4%
ML: 41.7%
FairMOTMOTA: 31.7%
MOTP: 82.4%
IDSW: 521
MT: 36.8%
ML: 36.5%
ECCNetMOTA: 55.5%
MOTP: 86.3%
IDSW: 2893
MT: 57.2%
ML: 20.7%
[62]RAM: 16 GB DDR3
CPU: Intel(R) Core (TM) i7-4700HQ CPU @ 2.4 GHz
No trainingQuebec’s Surveillance Cameras’ Images + 2nd NVIDIA AI City Challenge Track 1Segment Anything Model + Manual Region of Interest Selection +
Motion-based Filtering +
Vehicle Segment Merging
DeepSORTPrecision: 89.7%
Recall: 97.9%
F1-Score: 93.6%
[63]CPU: Intel Xeon
E5-2620. RAM: 47 GB
GPU: Single NVIDIA GTX 1080 Ti
MARS DatasetUA-DETRACSSDDeepSORTHOTA: 43.9%
UA-DETRACUA-DETRACSSD + Appearance EmbeddingCosine Distance + Hungarian Algorithm + Kalman Filter + Integrated EmbeddingsHOTA: 43.1%
SSD + Appearance Embedding + Augmentation ModuleCosine Distance + Hungarian Algorithm + Kalman Filter + Integrated EmbeddingsHOTA: 47.2%
SSD + Appearance Embedding + Augmentation ModuleCosine Distance + Hungarian Algorithm + Kalman + Integrated Embeddings + Hyperparameter OptimizationHOTA: 47.4%
DetA: 40.2%
AssA: 56.41%
DetRe: 55.05%
DetPr: 55%
AssRe: 64.61%
AssPr: 75.13%
LocA: 82.42%
SSDSORTHOTA: 42.33%
DetA: 36.35%
AssA: 49.93%
DetRe: 43.82%
DetPr: 61.84%
AssRe: 53.24%
AssPr: 82.77%
LocA: 82.41%
DeepSORTHOTA: 44.20%
DetA: 37.71%
AssA: 52.54%
DetRe: 48.34%
DetPr: 57.08%
AssRe: 57.39%
AssPr: 78.95%
LocA: 81.14%
JDE (576 × 320)HOTA: 35.77%
DetA: 25.18%
AssA: 51.59%
DetRe: 30.09%
DetPr: 54.52%
AssRe: 56.57%
AssPr: 79.56%
LocA: 79.93%
JDE (864 × 480)HOTA: 40.28%
DetA: 28.76%
AssA: 56.9%
DetRe: 34.06%
DetPr: 59.09%
AssRe: 64.05%
AssPr: 79.13%
LocA: 82.37%
RetinaNetSORTHOTA: 56.21%
DetA: 49.86%
AssA: 63.69%
DetRe: 59.63%
DetPr: 70.55%
AssRe: 68.3%
AssPr: 87.05%
LocA: 87.37%
DeepSORTHOTA: 56.65%
DetA: 49.27%
AssA: 65.45%
DetRe: 60.85%
DetPr: 67.38%
AssRe: 71.02%
AssPr: 85.11%
LocA: 86.41%
RetinaNet + Appearance Embedding + Augmentation ModuleCosine Distance + Hungarian Algorithm + Kalman Filter + Integrated Embeddings + Hyperparameter OptimizationHOTA: 58.04%
DetA: 51.82%
AssA: 65.34%
DetRe: 63.98%
DetPr: 68.42%
AssRe: 72.07%
AssPr: 83.18%
LocA: 86.82%
UA-DETRAC—EasySSDSORTHOTA: 49.26%
DeepSORTHOTA: 50.13%
SSD + Appearance Embedding + Augmentation ModuleCosine Distance + Hungarian Algorithm + Kalman + Integrated Embeddings + Hyperparameter OptimizationHOTA: 49.84%
JDE (576 × 320)HOTA: 43.75%
JDE (864 × 480)HOTA: 49.99%
RetinaNetSORTHOTA: 63.74%
DeepSORTHOTA: 62.77%
RetinaNet + Appearance Embedding + Augmentation ModuleCosine Distance + Hungarian Algorithm + Kalman Filter + Integrated Embeddings + Hyperparameter OptimizationHOTA: 61.89%
UA-DETRAC—MediumSSDSORTHOTA: 44.35%
DeepSORTHOTA: 46.24%
SSD + Appearance Embedding + Augmentation ModuleCosine Distance + Hungarian Algorithm + Kalman Filter + Integrated Embeddings + Hyperparameter OptimizationHOTA: 50.09%
JDE (576 × 320)HOTA: 33.93%
JDE (864 × 480)HOTA: 38.66%
RetinaNetSORTHOTA: 58.02%
DeepSORTHOTA: 58.35%
RetinaNet + Appearance Embedding + Augmentation ModuleCosine Distance + Hungarian Algorithm + Kalman Filter + Integrated Embeddings + Hyperparameter OptimizationHOTA: 61.01%
UA-DETRAC—HardSSDSORTHOTA: 31%
DeepSORTHOTA: 33.41%
SSD + Appearance Embedding + Augmentation ModuleCosine Distance + Hungarian Algorithm + Kalman Filter + Integrated Embeddings + Hyperparameter OptimizationHOTA: 35.96%
JDE (576 × 320)HOTA: 16.65%
JDE (864 × 480)HOTA: 18.01%
RetinaNetSORTHOTA: 41.83%
DeepSORTHOTA: 42.74%
RetinaNet + Appearance Embedding + Augmentation ModuleCosine Distance + Hungarian Algorithm + Kalman Filter + Integrated Embeddings + Hyperparameter OptimizationHOTA: 45.53%
[64]CPU: Intel Core i7-10700K (3.80 GHz)
GPU: NVIDIA GeForce RTX 2080 SUPER
UA-DETRACUA-DETRACDMM-NETAP: 20.69%
MOTA: 20.3%
MT: 19.9%
ML: 30.3%
IDSW: 498
FM: 1428
FP: 104,142
FN: 399,586
JDEAP: 63.57%
MOTA: 55.1%
MT: 68.4%
ML: 6.5%
IDSW: 2169
FM: 4224
FP: 128,069
FN: 153,609
FairMOTAP: 67.74%
MOTA: 63.4%
MT: 64%
ML: 7.8%
IDSW: 784
FM: 4443
FP: 71,231
FN: 159,523
PR-MOTA: 22.7%
PR-MT: 23.7%
PR-ML: 10%
PR-IDSW: 347.1
PR-FM: 2992.6
PR-FP: 49,385.4
PR-FN: 123,124.5
UA-DETRAC—EasyDMM-NETAP: 31.21%
JDEAP: 79.84%
FairMOTAP: 81.33%
MOTA: 84.9%
MT: 86%
ML: 1.4%
IDSW: 121
FM: 379
FP: 9276
FN: 9468
PR-MOTA: 30.8%
PR-MT: 32.3%
PR-ML: 5.2%
PR-IDSW: 56.8
PR-FM: 648.3
PR-FP: 10,022.7
PR-FN:14,017.6
UA-DETRAC—MediumDMM-NETAP: 23.6%
JDEAP: 70.46%
FairMOTAP: 73.32%
MOTA: 69.6%
MT: 66.8%
ML: 8%
IDSW: 421
FM: 2056
FP: 27,159
FN: 80,934
PR-MOTA: 25.8%
PR-MT: 24.3%
PR-ML: 9.9%
PR-IDSW: 199
PR-FM: 1613.1%
PR-FP: 21,497.6
PR-FN:64,824.3
UA-DETRAC—HardDMM-NETAP: 14.03%
JDEAP: 49.88%
FairMOTAP: 56.78%
MOTA: 52.2%
MT: 47.9%
ML: 13.5%
IDSW: 294
FM: 1246
FP: 14,309
FN: 56,981
PR-MOTA: 16.2%
PR-MT: 17.6%
PR-ML: 13.4%
PR-IDSW: 123.1
PR-FM: 695.8
PR-FP: 12,420.3
PR-FN: 38,018.9
UA-DETRAC—Cloudy WeatherDMM-NETAP: 26.1%
JDEAP: 76.02%
FairMOTAP: 77.21%
MOTA: 79.5%
MT: 80%
ML: 3.5%
IDSW: 141
FM: 738
FP: 12,272
FN: 27,800
PR-MOTA: 30.9%
PR-MT: 28.7%
PR-ML: 7.6%
PR-IDSW: 76
PR-FM: 925.5
PR-FP: 8481.9
PR-FN: 28,943.4
UA-DETRAC—Rainy WeatherDMM-NETAP: 14.56%
JDEAP: 50.42%
FairMOTAP: 55.46%
MOTA: 57.4%
MT: 54.2%
ML: 14.5%
IDSW: 270
FM: 1413
FP: 17,300
FN: 70,055
PR-MOTA: 20.9%
PR-MT: 19.6%
PR-ML: 14%
PR-IDSW: 122.3
PR-FM: 849.2
PR-FP: 11,493.5
PR-FN:48,182.2
UA-DETRAC—SunnyDMM-NETAP: 36.89%
JDEAP: 73%
FairMOTAP: 75.44%
MOTA: 73.1%
MT: 78.1%
ML: 2.4%
IDSW: 95
FM: 343
FP: 8253
FN: 11,605
PR-MOTA: 22.8%
PR-MT: 29.5%
PR-ML: 5.4%
PR-IDSW: 41.5
PR-FM: 390.4
PR-FP: 9354.7
PR-FN: 10,777.2
UA-DETRAC—NighttimeDMM-NETAP: 15.01%
FAIRAP: 58.92%
FairMOTAP: 69.05%
MOTA: 67.4%
MT: 63.9%
ML: 7.5%
IDSW: 330
FM: 1187
FP: 12,929
FN: 37,923
PR-MOTA: 22.1%
PR-MT: 23.9%
PR-ML: 9.3%
PR-IDSW: 139.2
PR-FM: 792.2
PR-FP: 14,610.5
PR-FN: 28,958
[65]Not describedCustom DatasetCustom DatasetSSD + GAN Image RestorationBEBLID Feature Extraction + MLESAC + Homography TransformationmAP: 84.4%
Precision: 86%
Recall: 88%
MOTA: 36.3%
MOTP: 72.9%
FAF: 1.4%
MT: 13.4%
ML: 33.4%
FP: 140
FN: 304
IDSW: 35
Frag: 28
[66]GPU: 3 NVIDIA RTX 3060 UA-DETRACCOCO DatasetFairMOTAP: 36.4%
AP@50: 53.9%
AP@75: 38.8%
Recall: 35.6%
FairMOT + Swish Activation Function + Multi-Scale Dilated Attention + Block Efficient ModuleAP: 38.1%
AP@50: 56%
AP@75: 40.5%
Recall: 38.2%
UA-DETRACFairMOTMOTA: 77.5%/77.7%
IDF1: 84.2%
MT: 160
ML: 4
IDSW: 48/47
FairMOT + Swish Activation Function + Multi-Scale Dilated Attention + Block Efficient ModuleMOTA: 79.2%
IDF1: 84.8%
MT: 162
ML: 3
IDSW: 50
FairMOT + Joint LossMOTA: 78.4%
IDF1: 84.4%
MT: 160
ML: 4
IDSW: 46
FairMOT + Swish Activation Function + Multi-Scale Dilated Attention + Block Efficient Module + Joint LossMOTA: 79%
IDF1: 84.5%
MT: 159
ML: 4
IDSW: 45
CenterTrackMOTA: 77%
IDF1: 84.6%
MT: 155
ML: 4
IDSW: 50
RobMOTMOTA: 76%
IDF1: 83%
MT: 150
ML: 5
IDSW: 53
MTrackerMOTA: 75.5%
IDF1: 82.7%
MT: 152
ML: 4
IDSW: 54
Table A3. Support table showing the performance of novel approaches.
Ref.Testing Hardware PlatformTraining DatasetTesting DatasetDetection MethodTracking MethodResults
[67]NVIDIA JetsonNot describedCustom DatasetFeature Extraction + Houglass-like CNN + Bounding Box OutputtingTracking-by-DetectionTracking Accuracy: 98.2%
Custom DatasetFeature Extraction + Houglass-like CNN + Bounding Box OutputtingTracking-by-DetectionDetection Accuracy: 96.4%
[68]NVIDIA JetsonNot applicableCustom Dataset—Good VisibilityHorn-Schunck Optical Flow + Shadow Detection and RemovalCAMSHIFTCentroid Errors: 4.2
Target Domain Coverage Accuracy: 69.1%
Kalman FilterCentroid Errors: 3.8
Target Domain Coverage Accuracy: 71.3%
Immune Particle FilterCentroid Errors: 2.1
Target Domain Coverage Accuracy: 93.6%
Custom Dataset—Poor VisibilityHorn-Schunck Optical Flow + Shadow Detection and RemovalCAMSHIFTCentroid Errors: 7.4
Target Domain Coverage Accuracy: 60.8%
Kalman FilterCentroid Errors: 5.9
Target Domain Coverage Accuracy: 67.1%
Immune Particle FilterCentroid Errors: 3.5
Target Domain Coverage Accuracy: 75.3%
[69]CPU: Intel (R) Core(TM) i7-7700 K CPU with a maximum turbo frequency of 4.50 GHz.
RAM: 32 GB
GPU: NVIDIA Titan X GPU with 12.00 GB of memory
UA-DETRAC + PASCAL VOC 2007 + PASCAL VOC 2012UA-DETRACHVD-Net (First 5 DarkNet19 Layers + Dense Connection Block (DCB) and Dense Spatial Pyramid Pooling (DSPP) Multi-scale Processing + Feature Fusion + Detection Head + Loss Calculation)SORTmAP: 80.7%
MOTA: 29.3%
MOTP: 36.2%
PR-IDSW: 191
PR-FP: 18,078
PR-FN: 169,219
UA-DETRAC—Cloudy WeatherHVD-Net (First 5 DarkNet19 Layers + Dense Connection Block (DCB) and Dense Spatial Pyramid Pooling (DSPP) Multi-scale Processing + Feature Fusion + Detection Head + Loss Calculation)SORTmAP: 69.1%
UA-DETRAC—NighttimeHVD-Net (First 5 DarkNet19 Layers + Dense Connection Block (DCB) and Dense Spatial Pyramid Pooling (DSPP) Multi-scale Processing + Feature Fusion + Detection Head + Loss Calculation)SORTmAP: 69.2%
UA-DETRAC—Rainy WeatherHVD-Net (First 5 DarkNet19 Layers + Dense Connection Block (DCB) and Dense Spatial Pyramid Pooling (DSPP) Multi-scale Processing + Feature Fusion + Detection Head + Loss Calculation)SORTmAP: 54.2%
UA-DETRAC—Sunny WeatherHVD-Net (First 5 DarkNet19 Layers + Dense Connection Block (DCB) and Dense Spatial Pyramid Pooling (DSPP) Multi-scale Processing + Feature Fusion + Detection Head + Loss Calculation)SORTmAP: 73.5%
PASCAL VOC 2007 + PASCAL VOC 2012HVD-Net (First 5 DarkNet19 Layers + Dense Connection Block (DCB) and Dense Spatial Pyramid Pooling (DSPP) Multi-scale Processing + Feature Fusion + Detection Head + Loss Calculation)SORTmAP: 92.6%
[64]CPU: Intel Core i7-10700K (3.80 GHz)
GPU: NVIDIA GeForce RTX 2080 SUPER
UA-DETRACUA-DETRACEfficientDet-D0 + Output Feature Fusion + Detection HeadsRe-ID Head for Appearance Embedding Extraction + Hungarian Algorithm + Kalman Filter + Tracklet PoolAP: 69.93%
MOTA: 68.5%
MT: 68.4%
ML: 7.3%
IDSW: 836
FM: 3681
FP: 50,754
FN: 147,383
PR-MOTA: 24.5%
PR-MT: 25.2%
PR-ML: 9.3%
PR-IDSW: 379
PR-FM: 2957.3
PR-FP: 43,940.6
PR-FN: 116,860.7
UA-DETRAC—EasyEfficientDet-D0 + Output Feature Fusion + Detection HeadsRe-ID Head for Appearance Embedding Extraction + Hungarian Algorithm + Kalman Filter + Tracklet PoolAP: 86.19%
MOTA: 82.8%
MT: 81.8%
ML: 1.2%
IDSW: 62
FM: 498
FP: 10,159
FN: 11,304
PR-MOTA: 29.7%
PR-MT: 30.8%
PR-ML: 5.2%
PR-IDSW: 42.7
PR-FM: 644.5
PR-FP: 10,371.5
PR-FN: 15,027.4
UA-DETRAC—MediumEfficientDet-D0 + Output Feature Fusion + Detection HeadsRe-ID Head for Appearance Embedding Extraction + Hungarian Algorithm + Kalman Filter + Tracklet PoolAP: 74.26%
MOTA: 65.3%
MT: 61%
ML: 8.7%
IDSW: 445
FM: 2590
FP: 34,081
FN: 89,466
PR-MOTA: 24.3%
PR-MT: 22.4%
PR-ML: 10.7%
PR-IDSW: 189
PR-FM: 1652.4
PR-FP: 23,031.3
PR-FN: 68,472.9
UA-DETRAC—HardEfficientDet-D0 + Output Feature Fusion + Detection HeadsRe-ID Head for Appearance Embedding Extraction + Hungarian Algorithm + Kalman Filter + Tracklet PoolAP: 59%
MOTA: 42.5%
MT: 46.8%
ML: 14.5%
IDSW: 277
FM: 1355
FP: 26,991
FN: 58,753
PR-MOTA: 12.8%
PR-MT: 17.1%
PR-ML: 15.1%
PR-IDSW: 115.4
PR-FM: 696.7
PR-FP: 15,982.6
PR-FN: 39,624.1
UA-DETRAC—Cloudy WeatherEfficientDet-D0 + Output Feature Fusion + Detection HeadsRe-ID Head for Appearance Embedding Extraction + Hungarian Algorithm + Kalman Filter + Tracklet PoolAP: 79.2%
MOTA: 77%
MT: 71.1%
ML: 3.5%
IDSW: 147
FM: 1216
FP: 12,749
FN: 32,191
PR-MOTA: 29.4%
PR-MT: 25.4%
PR-ML: 7.8%
PR-IDSW: 70.3
PR-FM: 973
PR-FP: 8485.1
PR-FN: 31,822.1
UA-DETRAC—NighttimeEfficientDet-D0 + Output Feature Fusion + Detection HeadsRe-ID Head for Appearance Embedding Extraction + Hungarian Algorithm + Kalman Filter + Tracklet PoolAP: 69.32%
MOTA: 60.3%
MT: 64.2%
ML: 6.6%
IDSW: 308
FM: 1186
FP: 24,880
FN: 37,113
PR-MOTA: 20.7%
PR-MT: 24.5%
PR-ML: 9.6%
PR-IDSW: 135.2
PR-FM: 783.9
PR-FP: 17,365.8
PR-FN: 28,406.3
[70]Not availableNot applicableCustom Dataset—Near a traffic lightBackground Subtraction via MoGs + Shadow Removal + Bounding Box GenerationCentroid-Based Tracking with Euclidean Distance MatchingAverage Accuracy: 96.1%
Custom Dataset—Standard urban roadBackground Subtraction via MoGs + Shadow Removal + Bounding Box GenerationCentroid-Based Tracking with Euclidean Distance MatchingAverage Accuracy: 97.4%
[71]Ultra96Not applicableCustom Dataset—Inbound TrafficREMOT (Event data processing by Attention Units)DetA: 50.9%
AssA: 58%
HOTA: 54.3%
Custom Dataset—Outbound TrafficREMOT (Event data processing by Attention Units)DetA: 39%
AssA: 47.8%
HOTA: 43.1%

References

  1. United Nations, Department of Economic and Social Affairs, Population Division. World Urbanization Prospects: The 2018 Revision (ST/ESA/SER.A/420); United Nations: New York, NY, USA, 2019; pp. 1–126. Available online: https://population.un.org/wup/assets/WUP2018-Report.pdf (accessed on 9 December 2024).
  2. Brook, R.D.; Rajagopalan, S.; Pope, C.A., III; Brook, J.R.; Bhatnagar, A.; Diez-Roux, A.V.; Holguin, F.; Hong, Y.; Luepker, R.V.; Mittleman, M.A.; et al. Particulate Matter Air Pollution and Cardiovascular Disease: An update to the scientific statement from the american heart association. Circulation 2010, 121, 2331–2378. [Google Scholar] [CrossRef]
  3. Schrank, D. 2023 Urban Mobility Report; The Texas A&M Transportation Institute: Bryan, TX, USA, 2024. [Google Scholar]
  4. Taylor, A.H.; Dorn, L. Stress, Fatigue, Health, And Risk of Road Traffic Accidents Among Professional Drivers: The Contribution of Physical Inactivity. Annu. Rev. Public Health 2006, 27, 371–391. [Google Scholar] [CrossRef] [PubMed]
  5. Ritchie, H.; Rosado, P.; Roser, M. Breakdown of Carbon Dioxide, Methane and Nitrous Oxide Emissions by Sector. Our World in Data. 2020. Available online: https://ourworldindata.org/emissions-by-sector (accessed on 9 December 2024).
  6. Ritchie, H. Cars, Planes, Trains: Where do CO2 Emissions from Transport Come from? Our World in Data. 2020. Available online: https://ourworldindata.org/co2-emissions-from-transport (accessed on 9 December 2024).
  7. Bhatt, D.; Patel, C.; Talsania, H.; Patel, J.; Vaghela, R.; Pandya, S.; Modi, K.; Ghayvat, H. CNN Variants for Computer Vision: History, Architecture, Application, Challenges and Future Scope. Electronics 2021, 10, 2470. [Google Scholar] [CrossRef]
  8. Tian, H.; Wang, T.; Liu, Y.; Qiao, X.; Li, Y. Computer vision technology in agricultural automation—A review. Inf. Process. Agric. 2020, 7, 1–19. [Google Scholar] [CrossRef]
  9. Saba, T. Computer vision for microscopic skin cancer diagnosis using handcrafted and non-handcrafted features. Microsc. Res. Tech. 2021, 84, 1272–1283. [Google Scholar] [CrossRef]
  10. MBorowiec, M.L.; Dikow, R.B.; Frandsen, P.B.; McKeeken, A.; Valentini, G.; White, A.E. Deep learning as a tool for ecology and evolution. Methods Ecol. Evol. 2022, 13, 1640–1660. [Google Scholar] [CrossRef]
  11. Djahel, S.; Doolan, R.; Muntean, G.-M.; Murphy, J. A Communications-Oriented Perspective on Traffic Management Systems for Smart Cities: Challenges and Innovative Approaches. IEEE Commun. Surv. Tutorials 2014, 17, 125–151. [Google Scholar] [CrossRef]
  12. Tian, B.; Morris, B.T.; Tang, M.; Liu, Y.; Yao, Y.; Gou, C.; Shen, D.; Tang, S. Hierarchical and Networked Vehicle Surveillance in ITS: A Survey. IEEE Trans. Intell. Transp. Syst. 2014, 16, 557–580. [Google Scholar] [CrossRef]
  13. Liu, D.; Hui, S.; Li, L.; Liu, Z.; Zhang, Z. A Method for Short-Term Traffic Flow Forecasting Based On GCN-LSTM. In Proceedings of the 2020 International Conference on Computer Vision, Image and Deep Learning (CVIDL), Chongqing, China, 10–12 July 2020; pp. 364–368. [Google Scholar]
  14. Zhang, C.; Wang, X.; Yong, S.; Zhang, Y.; Li, Q.; Wang, C. An Energy-Efficient Convolutional Neural Network Processor Architecture Based on a Systolic Array. Appl. Sci. 2022, 12, 12633. [Google Scholar] [CrossRef]
  15. Sun, C.; Shrivastava, A.; Singh, S.; Gupta, A. Revisiting unreasonable effectiveness of data in deep learning era. In Proceedings of the 16th IEEE International Conference on Computer Vision (ICCV), Venice, Italy, 22–29 October 2017. [Google Scholar]
  16. Arif, M.U.; Farooq, M.U.; Raza, R.H.; Lodhi, Z.U.A.; Hashmi, M.A.R. A Comprehensive Review of Vehicle Detection Techniques Under Varying Moving Cast Shadow Conditions Using Computer Vision and Deep Learning. IEEE Access 2022, 10, 104863–104886. [Google Scholar] [CrossRef]
  17. Bisio, I.; Garibotto, C.; Haleem, H.; Lavagetto, F.; Sciarrone, A. A Systematic Review of Drone Based Road Traffic Monitoring System. IEEE Access 2022, 10, 101537–101555. [Google Scholar] [CrossRef]
  18. Dolatyabi, P.; Regan, J.; Khodayar, M. Deep Learning for Traffic Scene Understanding: A Review. IEEE Access 2025, 13, 13187–13237. [Google Scholar] [CrossRef]
  19. Nigam, N.; Singh, D.P.; Choudhary, J. A Review of Different Components of the Intelligent Traffic Management System (ITMS). Symmetry 2023, 15, 583. [Google Scholar] [CrossRef]
  20. Porto, J.V.d.A.; Szemes, P.T.; Pistori, H.; Menyhárt, J. Trending Machine Learning Methods for Vehicle, Pedestrian, and Traffic for Detection and Tracking Task in the Post-Covid Era: A Literature Review. IEEE Access 2025, 13, 77790–77803. [Google Scholar] [CrossRef]
  21. Holla, A.; Pai, M.M.M.; Verma, U.; Pai, R.M. Vehicle Re-Identification and Tracking: Algorithmic Approach, Challenges and Future Directions. IEEE Open, J. Intell. Transp. Syst. 2025, 6, 155–183. [Google Scholar] [CrossRef]
  22. Page, M.J.; McKenzie, J.E.; Bossuyt, P.M.; Boutron, I.; Hoffmann, T.C.; Mulrow, C.D.; Shamseer, L.; Tetzlaff, J.M.; Akl, E.A.; Brennan, S.E.; et al. The PRISMA 2020 statement: An updated guideline for reporting systematic reviews. BMJ 2021, 372, 71. [Google Scholar] [CrossRef] [PubMed]
  23. Haddaway, N.R.; Page, M.J.; Pritchard, C.C.; McGuinness, L.A. PRISMA2020: An R package and Shiny app for producing PRISMA 2020-compliant flow diagrams, with interactivity for optimised digital transparency and Open Synthesis. Campbell Syst. Rev. 2022, 18, e1230. [Google Scholar] [CrossRef]
  24. Everingham, M.; Van Gool, L.; Williams, C.K.I.; Winn, J.; Zisserman, A. The Pascal Visual Object Classes (VOC) Challenge. Int. J. Comput. Vis. 2009, 88, 303–338. [Google Scholar] [CrossRef]
  25. Stiefelhagen, R.; Bernardin, K.; Bowers, R.; Garofolo, J.; Mostefa, D.; Soundararajan, P. The CLEAR 2006 Evaluation. In Lecture Notes in Computer Science (Including Subseries Lecture Notes in Artificial Intelligence and Lecture Notes in Bioinformatics); Springer: Berlin/Heidelberg, Germany, 2007; pp. 1–44. [Google Scholar] [CrossRef]
  26. KBernardin, K.; Stiefelhagen, R. Evaluating Multiple Object Tracking Performance: The CLEAR MOT Metrics. EURASIP J. Image Video Process. 2008, 2008, 1–10. [Google Scholar] [CrossRef]
  27. Wu, B.; Nevatia, R. Tracking of Multiple, Partially Occluded Humans based on Static Body Part Detection. In Proceedings of the 2006 IEEE Computer Society Conference on Computer Vision and Pattern Recognition—Volume 1 (CVPR’06), New York, NY, USA, 17 June 2006; pp. 951–958. [Google Scholar]
  28. Ristani, E.; Solera, F.; Zou, R.; Rita, C.; Carlo, T. Performance measures and a data set for multi-target, multi-camera tracking. In Proceedings of the European Conference on Computer Vision Springer, Amsterdam, The Netherlands, 8–16 October 2016; pp. 17–35. [Google Scholar] [CrossRef]
  29. Luiten, J.; OšeP, A.; Dendorfer, P.; Torr, P.; Geiger, A.; Leal-Taixé, L.; Leibe, B. HOTA: A Higher Order Metric for Evaluating Multi-object Tracking. Int. J. Comput. Vis. 2020, 129, 548–578. [Google Scholar] [CrossRef]
  30. Wen, L.; Du, D.; Cai, Z.; Lei, Z.; Chang, M.C.; Qi, H.; Lim, J.; Yang, M.H.; Lyu, S. UA-DETRAC: A New Benchmark and Protocol for Multi-Object Detection and Tracking. arXiv 2015, arXiv:1511.04136v3. [Google Scholar] [CrossRef]
  31. Song, H.; Liang, H.; Li, H.; Dai, Z.; Yun, X. Vision-based vehicle detection and counting system using deep learning in highway scenes. Eur. Transp. Res. Rev. 2019, 11, 1–16. [Google Scholar] [CrossRef]
  32. Lin, T.-Y.; Maire, M.; Belongie, S.; Hays, J.; Perona, P.; Ramanan, D.; Dollár, P.; Zitnick, C.L. Microsoft Coco: Common Objects in Context. In Proceedings of the Computer Vision—ECCV 2014: 13th European Conference, Zurich, Switzerland, 6–12 September 2014; pp. 740–755. [Google Scholar] [CrossRef]
  33. Everingham, M.; Van-Gool, C.K.I.; Winn, J. The PASCAL Visual Object Classes Challenge 2012 (VOC2012) Results. Pattern Anal. Stat. Model. Comput. Learn. 2011, 8, 2–5. [Google Scholar]
  34. Leibe, B.; Matas, J.; Sebe, N.; Welling, M. (Eds.) A Deep Learning-Based Approach to Progressive Vehicle Re-identification for Urban Surveillance. In Lecture Notes in Computer Science; Springer: Berlin/Heidelberg, Germany, 2016; Volume 9906. [Google Scholar] [CrossRef]
  35. Lou, Y.; Bai, Y.; Liu, J.; Wang, S.; Duan, L. VERI-Wild: A Large Dataset and a New Method for Vehicle Re-Identification in the Wild. In Proceedings of the 2019 IEEE/CVF Conference on Computer Vision and Pattern Recognition (CVPR), Long Beach, CA, USA, 15–20 June 2019; pp. 3230–3238. [Google Scholar]
  36. Kachach, R.; Cañas, J.M. Hybrid three-dimensional and support vector machine approach for automatic vehicle tracking and classification using a single camera. J. Electron. Imaging 2016, 25, 33021. [Google Scholar] [CrossRef]
  37. Guerrero-Gómez-Olmedo, R.; López-Sastre, R.J.; Maldonado-Bascón, S.; Fernández-Caballero, A. Vehicle Tracking by Simultaneous Detection and Viewpoint Estimation. In Proceedings of the International Work-Conference on the Interplay Between Natural and Artificial Computation; Springer: Berlin/Heidelberg, Germany, 2013; pp. 306–316. [Google Scholar]
  38. Luo, Z.; Branchaud-Charron, F.; Lemaire, C.; Konrad, J.; Li, S.; Mishra, A.; Achkar, A.; Eichel, J.; Jodoin, P.-M. MIO-TCD: A New Benchmark Dataset for Vehicle Classification and Localization. IEEE Trans. Image Process. 2018, 27, 5129–5141. [Google Scholar] [CrossRef]
  39. Kenk, M.A.; Hassaballah, M. DAWN: Vehicle Detection in Adverse Weather Nature Dataset. Available online: https://doi.org/10.17632/766ygrbt8y.3 (accessed on 10 April 2025).
  40. Dong, Z.; Wu, Y.; Pei, M.; Jia, Y. Vehicle Type Classification Using a Semisupervised Convolutional Neural Network. IEEE Trans. Intell. Transp. Syst. 2015, 16, 2247–2256. [Google Scholar] [CrossRef]
  41. Naphade, M.; Chang, M.-C.; Sharma, A.; Anastasiu, D.C.; Jagarlamudi, V.; Chakraborty, P.; Huang, T.; Wang, S.; Liu, M.-Y.; Chellappa, R.; et al. The 2018 NVIDIA AI City Challenge. In Proceedings of the 2018 IEEE/CVF Conference on Computer Vision and Pattern Recognition Workshops (CVPRW), Salt Lake City, UT, USA, 18–22 June 2018; pp. 53–537. [Google Scholar]
  42. Butler, D.J.; Wulff, J.; Stanley, G.B.; Black, M.J. A naturalistic open source movie for optical flow evaluation. In European Conference on Computer Vision; Springer: Berlin/Heidelberg, Germany, 2012; pp. 611–625. [Google Scholar]
  43. Ismail, T.S.; Ali, A.M. Vehicle Detection, Counting, and Classification System based on Video using Deep Learning Models. ZANCO J. PURE Appl. Sci. 2024, 36, 27–39. [Google Scholar] [CrossRef]
  44. Ge, X.; Zhou, F.; Chen, S.; Gao, G.; Wang, R. Vehicle detection and tracking algorithm based on improved feature extraction. KSII Trans. Internet Inf. Syst. 2024, 18, 2642–2664. [Google Scholar] [CrossRef]
  45. Fernández, J.; Cañas, J.M.; Fernández, V.; Paniego, S. Robust Real-Time Traffic Surveillance with Deep Learning. Comput. Intell. Neurosci. 2021, 2021, 4632353. [Google Scholar] [CrossRef]
  46. Mo, X.; Sun, C.; Zhang, C.; Tian, J.; Shao, Z. Research on Expressway Traffic Event Detection at Night Based on Mask-SpyNet. IEEE Access 2022, 10, 69053–69062. [Google Scholar] [CrossRef]
  47. Saadeldin, A.; Rashid, M.M.; Shafie, A.A.; Hasan, T.F. Real-time vehicle counting using custom YOLOv8n and DeepSORT for resource-limited edge devices. TELKOMNIKA Telecommun. Comput. Electron. Control. 2024, 22, 104–112. [Google Scholar] [CrossRef]
  48. Neupane, B.; Horanont, T.; Aryal, J. Real-Time Vehicle Classification and Tracking Using a Transfer Learning-Improved Deep Learning Network. Sensors 2022, 22, 3813. [Google Scholar] [CrossRef]
  49. Guo, D.; Li, Z.; Shuai, H.; Zhou, F. Multi-Target Vehicle Tracking Algorithm Based on Improved DeepSORT. Sensors 2024, 24, 7014. [Google Scholar] [CrossRef] [PubMed]
  50. You, L.; Chen, Y.; Xiao, C.; Sun, C.; Li, R. Multi-Object Vehicle Detection and Tracking Algorithm Based on Improved YOLOv8 and ByteTrack. Electronics 2024, 13, 3033. [Google Scholar] [CrossRef]
  51. Reyna, A.R.H.; Farfán, A.J.F.; Filho, G.P.R.; Sampaio, S.; De Grande, R.; Nakamura, L.H.V.; Meneguette, R.I. MEDAVET: Traffic Vehicle Anomaly Detection Mechanism based on spatial and temporal structures in vehicle traffic. J. Internet Serv. Appl. 2024, 15, 25–38. [Google Scholar] [CrossRef]
  52. Villa, J.; García, F.; Jover, R.; Martínez, V.; Armingol, J.M. Intelligent Infrastructure for Traffic Monitoring Based on Deep Learning and Edge Computing. J. Adv. Transp. 2024, 2024, 3679014. [Google Scholar] [CrossRef]
  53. Jin, T.; Ye, X.; Li, Z.; Huo, Z. Identification and Tracking of Vehicles between Multiple Cameras on Bridges Using a YOLOv4 and OSNet-Based Method. Sensors 2023, 23, 5510. [Google Scholar] [CrossRef]
  54. Kumar, S.; Singh, S.K.; Varshney, S.; Singh, S.; Kumar, P.; Kim, B.-G.; Ra, I.-H. Fusion of Deep Sort and Yolov5 for Effective Vehicle Detection and Tracking Scheme in Real-Time Traffic Management Sustainable System. Sustainability 2023, 15, 16869. [Google Scholar] [CrossRef]
  55. Guzmán-Torres, J.A.; Domínguez-Mota, F.J.; Tinoco-Guerrero, G.; García-Chiquito, M.C.; Tinoco-Ruíz, J.G. Efficacy Evaluation of You Only Learn One Representation (YOLOR) Algorithm in Detecting, Tracking, and Counting Vehicular Traffic in Real-World Scenarios, the Case of Morelia México: An Artificial Intelligence Approach. AI 2024, 5, 1594–1613. [Google Scholar] [CrossRef]
  56. Wei, D.; Chen, B.; Lin, Y. Automatic Identification and Tracking Method of Case-Related Vehicles Based on Computer Vision Algorithm. Appl. Math. Nonlinear Sci. 2024, 9, 1–15. Available online: https://amns.sciendo.com/article/10.2478/amns-2024-1522; (accessed on 9 December 2024).
  57. Suttiponpisarn, P.; Charnsripinyo, C.; Usanavasin, S.; Nakahara, H. An Autonomous Framework for Real-Time Wrong-Way Driving Vehicle Detection from Closed-Circuit Televisions. Sustainability 2022, 14, 10232. [Google Scholar] [CrossRef]
  58. Zhai, J.; Li, B.; Lv, S.; Zhou, Q. FPGA-Based Vehicle Detection and Tracking Accelerator. Sensors 2023, 23, 2208. [Google Scholar] [CrossRef]
  59. Azimjonov, J.; Özmen, A.; Varan, M. A vision-based real-time traffic flow monitoring system for road intersections. Multimedia Tools Appl. 2023, 82, 25155–25174. [Google Scholar] [CrossRef]
  60. Du, Z.; Jin, Y.; Ma, H.; Liu, P. A Lightweight and Accurate Method for Detecting Traffic Flow in Real Time. J. Adv. Comput. Intell. Intell. Inform. 2023, 27, 1086–1095. [Google Scholar] [CrossRef]
  61. Cygert, S.; Czyżewski, A. Vehicle Detection with Self-Training for Adaptative Video Processing Embedded Platform. Appl. Sci. 2020, 10, 5763. [Google Scholar] [CrossRef]
  62. Shokri, D.; Larouche, C.; Homayouni, S. Proposing an Efficient Deep Learning Algorithm Based on Segment Anything Model for Detection and Tracking of Vehicles through Uncalibrated Urban Traffic Surveillance Cameras. Electronics 2024, 13, 2883. [Google Scholar] [CrossRef]
  63. Mohamed, I.S.; Chuan, L.K. PAE: Portable Appearance Extension for Multiple Object Detection and Tracking in Traffic Scenes. IEEE Access 2022, 10, 37257–37268. [Google Scholar] [CrossRef]
  64. Lee, Y.; Lee, S.-H.; Yoo, J.; Kwon, S. Efficient Single-Shot Multi-Object Tracking for Vehicles in Traffic Scenarios. Sensors 2021, 21, 6358. [Google Scholar] [CrossRef]
  65. Sharma, D.; Jaffery, Z.A. Categorical Vehicle Classification and Tracking using Deep Neural Networks. Int. J. Adv. Comput. Sci. Appl. 2021, 12. [Google Scholar] [CrossRef]
  66. Li, M.; Liu, M.; Zhang, W.; Guo, W.; Chen, E.; Zhang, C. A Robust Multi-Camera Vehicle Tracking Algorithm in Highway Scenarios Using Deep Learning. Appl. Sci. 2024, 14, 7071. [Google Scholar] [CrossRef]
  67. Nikodem, M.; Słabicki, M.; Surmacz, T.; Mrówka, P.; Dołęga, C. Multi-Camera Vehicle Tracking Using Edge Computing and Low-Power Communication. Sensors 2020, 20, 3334. [Google Scholar] [CrossRef]
  68. Sun, W.; Sun, M.; Zhang, X.; Li, M. Moving Vehicle Detection and Tracking Based on Optical Flow Method and Immune Particle Filter under Complex Transportation Environments. Complexity 2020, 2020, 1–15. [Google Scholar] [CrossRef]
  69. Ashraf, M.H.; Jabeen, F.; Alghamdi, H.; Zia, M.; Almutairi, M.S. HVD-Net: A Hybrid Vehicle Detection Network for Vision-Based Vehicle Tracking and Speed Estimation. J. King Saud Univ. Comput. Inf. Sci. 2023, 35, 101657. [Google Scholar] [CrossRef]
  70. Atouf, I.; Al Okaishi, W.Y.; Zaaran, A.; Slimani, I.; Benrabh, M. A real-time system for vehicle detection with shadow removal and vehicle classification based on vehicle features at urban roads. Int. J. Power Electron. Drive Syst. (IJPEDS) 2020, 11, 2091–2098. [Google Scholar] [CrossRef]
  71. Gao, Y.; Wang, S.; So, H.K.-H. A Reconfigurable Architecture for Real-time Event-based Multi-Object Tracking. ACM Trans. Reconfigurable Technol. Syst. 2023, 16, 1–26. [Google Scholar] [CrossRef]
  72. Leal-Taixé, L.; Milan, A.; Reid, I.; Roth, S.; Schindler, K. MOTChallenge 2015: Towards a Benchmark for Multi-Target Tracking. arXiv 2015, arXiv:1504.01942. [Google Scholar] [CrossRef]
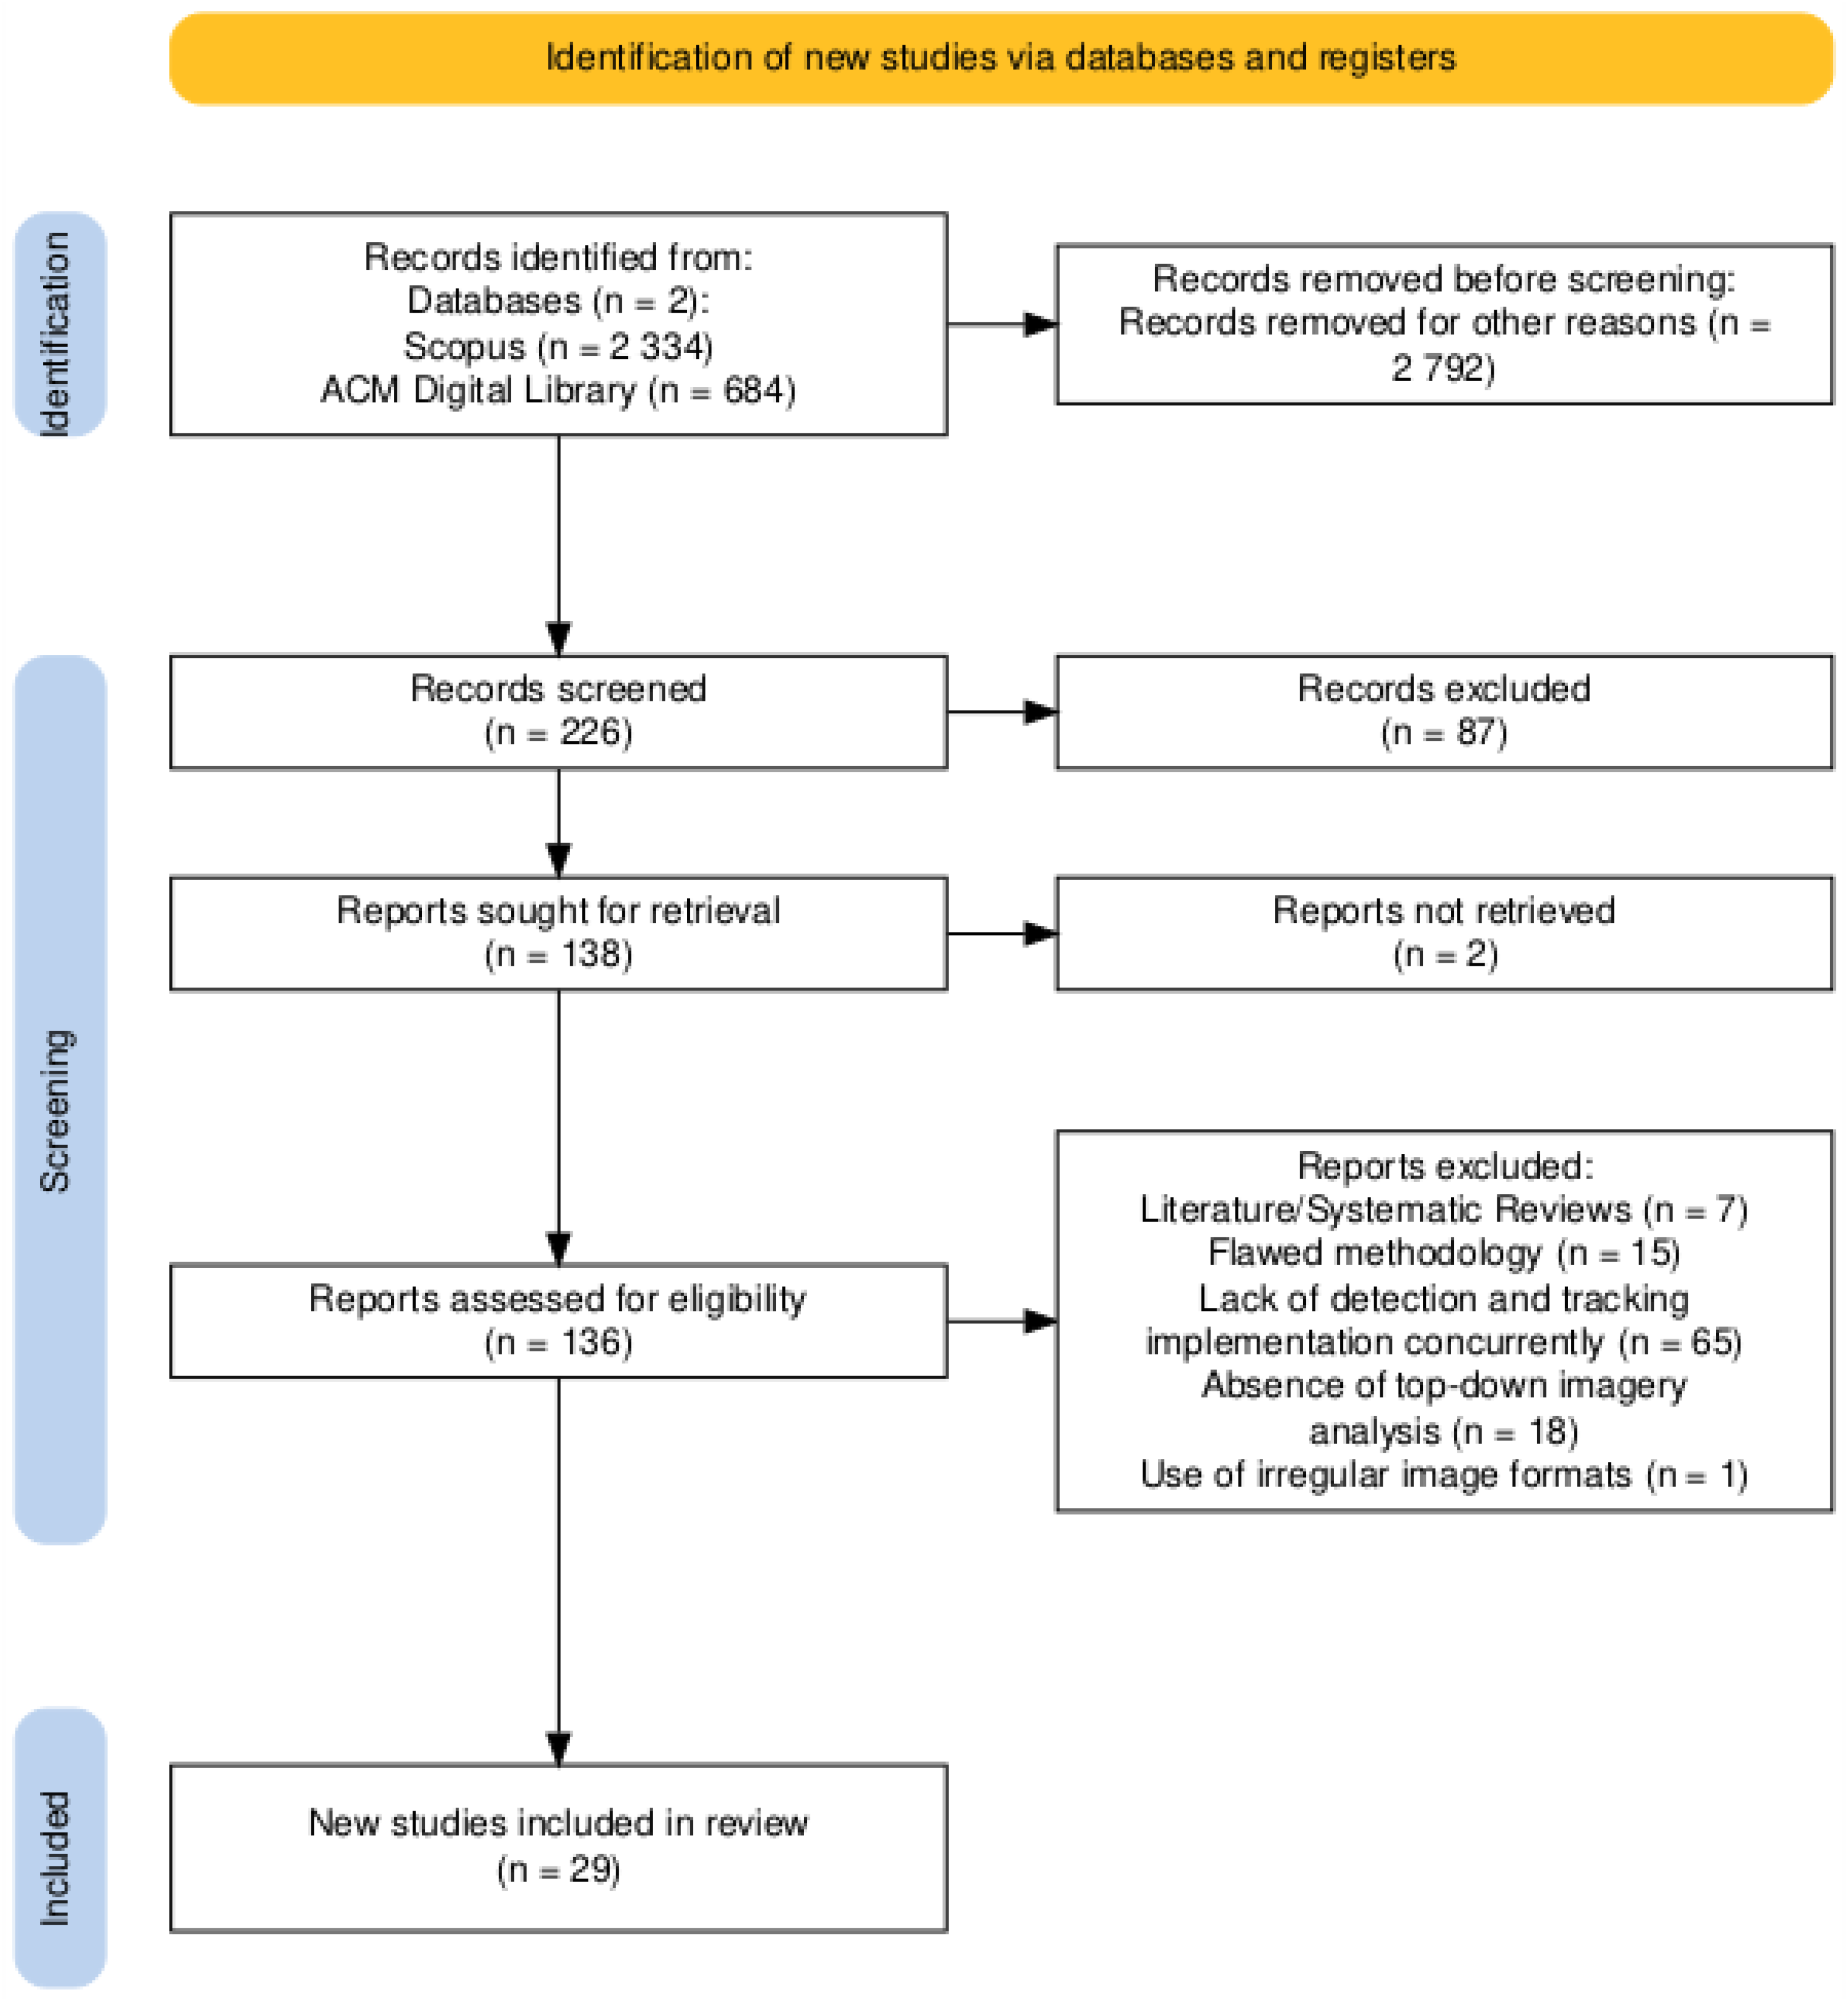
Figure 1. PRISMA flow diagram of the selection process.
Applsci 15 12288 g001
Figure 2. Number of selected articles per year, showing an increasing trend in publications.
Applsci 15 12288 g002
Figure 3. Number of articles retrieved for each journal.
Applsci 15 12288 g003
Figure 4. Dataset occurrences in the reviewed studies [31,36].
Applsci 15 12288 g004
Figure 5. Distribution of the detectors across the reviewed studies.
Applsci 15 12288 g005
Figure 6. Results on detection performance for the UA-DETRAC dataset [44,50].
Applsci 15 12288 g006
Figure 7. Vertically aligned radar charts of MOTA (a) and MOTP (b) scores [44,49,50,51,58,64,66,69] for the UA-DETRAC dataset.
Applsci 15 12288 g007
Figure 8. Results of secondary tracking metrics (MT, IDF1, and ML inverted) for the UA-DETRAC dataset [44,49,50,51,58,64,66].
Applsci 15 12288 g008
Figure 9. Radar charts of evaluation metrics per reference for the general analysis: mAP@0.5 (a), mAP@[0.5:0.95] (b), precision (c) and recall (d) [43,44,46,47,48,50,52,53,54,56,60,62,65,66].
Applsci 15 12288 g009aApplsci 15 12288 g009b
Figure 10. Results for tracking metrics (MOTA, MOTP, MT and ML) for the custom datasets [56,65].
Applsci 15 12288 g010
Table 1. Limitations of existing reviews.
ReferenceLimitations
[16]
  • The article focuses on shadow removal to preprocess images but does not rigorously perform analysis on end-to-end detection systems.
  • Superficial tracking analysis without reporting quantitative metrics.
  • Since the article was published in 2022, recent advances on the topic were not included.
[17]
  • The article focuses on images captured from drones’ perspectives, not top-down fixed cameras.
  • Even though the paper thoroughly analyses detection and tracking metrics, providing additional specific tracking metrics such as fragmentation, ID switches, mostly tracked/lost etc. would provide even more granular insights, improving the meta-analysis.
  • The study included articles from 2015 to 2021, so modern approaches are not explored.
[18]
  • Lacks a comprehensive and in-depth meta-analysis.
  • None of the studies included in the review perform vehicle detection and tracking simultaneously.
  • The study’s broad scope presents an overwhelming amount of information, which may diminish clarity and focus.
[19]
  • The study lacks a rigorous explanation of the selection of the studies, including inclusion/exclusion criteria, year range of analysis, etc. which reduces reproducibility.
  • Even though it presents studies that perform detection–tracking pipelines, it does not analyze them explicitly as integrated systems.
  • The paper lacks a meta-analysis on the different scopes of analysis.
[20]
  • The paper lacks a systematic presentation of quantitative results from the reviewed studies, placing greater emphasis on qualitative observations and trend analysis.
  • Due to the limited reporting of performance metrics, the paper does not include any form of meta-analysis, which weakens the overall empirical rigor of the review.
[21]
  • The article lacks examination of detailed, qualitative insights, focusing primarily on qualitative impressions.
  • Due to the limited analysis of the reported metrics, the paper does not include any form of meta-analysis.
  • This paper does not describe a strong methodology for the article selection process, which weakens reproducibility.
Table 2. Overview of available datasets from the reviewed studies.
ReferenceNameNumber of ImagesImage Size (px)Number of ClassesAvailabilityProblem Domain
[30]UA-DETRACOver 140,000960 × 5404 (car, bus, van and others)AvailableDetection and Tracking
[31]Song et al. 201911,1291920 × 10803 (car, bus and truck)RestrictedDetection and Tracking (limited)
[32]COCOOver 330,000640 × 48091 (including car, bus, bicycle, motorcycle and truck)AvailableDetection
[24]PASCAL VOC 20079963Varying20 (including car, bus, bicycle and motorbike)AvailableDetection
[33]PASCAL VOC 201211,540Varying20 (including car, bus, bicycle and motorbike)AvailableDetection
[34]VeRI-77649,360Varying1 (vehicle)AvailableRe-identification
[35]VeRI-Wild416,314Varying1 (vehicle)AvailableRe-identification
[36]Redouane Kachach et al. 20163460Not available7 (car, motocycle, van, bus, truck, small truck and tank truck)RestrictedDetection and Tracking (limited)
[37]GRAM Road Traffic Monitor40,345Varying (800 × 480/1200 × 720/600 × 360)4 (car, truck, van and big truck)AvailableDetection and Tracking (limited)
[38]Miovision Traffic Camera Dataset (MIO-TCD)786,702Varying11 (including articulated truck, bicycle, bus, car, motorcycle, non-motorized vehicle, pickup truck, single-unit and work van)AvailableDetection and Tracking (limited)
[39]DAWN1000Not available5 (including car, bus, truck and motorcycles + bicycles)AvailableDetection
[40]BiT-Vehicle9850Varying (1600 × 1200/1920 × 1080)6 (bus, microbus, minivan, sedan, SUV and truck)AvailableDetection and Tracking (limited)
[41]2nd NVIDIA AI City Challenge—Track 148,6001920 × 10801 (vehicle)UnavailableDetection and Tracking (limited)
Table 3. Scenario coverage for each available detection and tracking dataset.
NameEnvironmental CoverageUrbanHighway
SunnyNighttimeCloudyRainy
UA-DETRAC 1
GRAM Road-Traffic Monitoring
Miovision Traffic Camera Dataset (MIO-TCD)
BiT-Vehicle
1 Checks whether such scenario is presented in the dataset.
Table 4. Descriptive statistics and performance range for UA-DETRAC metrics.
StatisticMOTAMOTP
Number of articles84
Mean   ( x ¯ )57.3%52.7%
Standard deviation (SD)18.7%22.1%
Range (Min–Max)49.9%73.3%
Disclaimer/Publisher’s Note: The statements, opinions and data contained in all publications are solely those of the individual author(s) and contributor(s) and not of MDPI and/or the editor(s). MDPI and/or the editor(s) disclaim responsibility for any injury to people or property resulting from any ideas, methods, instructions or products referred to in the content.