Article

Control and Decision-Making in Deceptive Multi-Computer Systems Based on Previous Experience for Cybersecurity of Critical Infrastructure

by
Antonina Kashtalian
1,
Łukasz Ścisło
2,*,
Rafał Rucki
2,
Sergii Lysenko
1,
Anatoliy Sachenko
3,4,
Bohdan Savenko
1,
Oleg Savenko
1 and
Andrii Nicheporuk
1
1
Department of Computer Engineering and Information Systems, Information Technologies Faculty, Khmelnytskyi National University, 29016 Khmelnytskyi, Ukraine
2
Faculty of Electrical and Computer Engineering, Cracow University of Technology, 24, Warszawska, 31-155 Cracow, Poland
3
Research Institute for Intelligent Computer Systems, West Ukrainian National University, 46020 Ternopil, Ukraine
4
Department of Informatics and Teleinformatics, Kazimierz Pulaski University of Radom, 26-600 Radom, Poland
*
Author to whom correspondence should be addressed.
Appl. Sci. 2025, 15(22), 12286; https://doi.org/10.3390/app152212286
Submission received: 24 September 2025 / Revised: 11 November 2025 / Accepted: 11 November 2025 / Published: 19 November 2025
(This article belongs to the Special Issue Cyber Security and Software Engineering)

Abstract

The paper presents methods for organizing decision-making and the functioning of deceptive multi-computer systems based on prior operational experience and multiple task execution options. A formal representation of system components and their interconnections is developed, distinguishing between the system center and the decision-making controller. The system center prepares possible task execution options, while the decision-making controller evaluates these options considering past performance and selects one. Analytical expressions are proposed to describe processes within multi-computer systems, enabling autonomous decision-making in task execution. A method is developed for organizing the decision-making controller’s operation to ensure the selection of a task option based on prior experience, component security levels, and system topology. This approach allows for the formation of polymorphic responses to external and internal actions in corporate networks. Additionally, a method for organizing system functioning enables systems to adapt their properties, structure, and interconnections in response to functional and cybersecurity conditions. This can be used especially in cybersecurity of critical infrastructure systems like electrical power grids, smart grid infrastructure, energy plants and industrial control systems. A prototype was developed and tested under two scenarios: choosing among five task options and having only one option. Results showed greater operational stability in the first case, confirming that incorporating prior experience enhances resilience and creates polymorphic responses that hinder attackers’ attempts to study and exploit corporate networks.

1. Introduction

1.1. Motivation

Ensuring cybersecurity and protecting information in corporate networks remains an urgent task for their owners. Attackers are constantly diversifying their means and technologies to penetrate corporate networks. Many different tools have been developed to ensure cybersecurity and protect information in corporate networks and industrial automation systems (SCADA, MES) and other industrial systems like electrical power grid systems. However, attackers investigate their functioning and, based on the information collected, eventually identify vulnerabilities and use them to penetrate corporate networks. Based on the information about vulnerabilities, some attackers achieve their goal of penetrating corporate networks. In this case, attackers can act from outside and inside the corporate network.
One of the main reasons is the typical reaction of intrusion prevention, detection and counteraction systems to the repeated actions of intruders when conducting reconnaissance and attacking corporate network resources. To increase the effectiveness of counteracting malicious actions and impacts on corporate network resources, developers of intrusion prevention, detection and counteraction systems offer systems with bait and traps, as well as more powerful deception systems [1,2]. They are effective for attackers acting from outside and inside the corporate network. Attackers are aware of the existence of such systems and take them into account when carrying out their malicious actions.
To make it difficult for attackers to study systems for preventing, detecting and countering intrusions into corporate networks, it is necessary to constantly improve known systems and develop new ones. The synthesis of such systems should be carried out using methods that provide a difficult-to-understand behavior of systems [3,4] to emerging events, while maintaining their ability to formulate correct responses as a reaction to events. The requirements for such systems are actually focused on their ability to restructure their architecture in corporate networks, at different levels. These can be component levels, system center levels, levels of task execution in different components, etc. Such systems must also be able to respond to emerging events based on previous experience with recurring events. In order to prevent an attacker from investigating the system through repeated actions, the system’s response must be effective each time and also not be repetitive, i.e., the response must be polymorphic. To synthesize such systems, a new method of organizing their functioning is needed, taking into account the previous experience of the systems’ functioning, i.e., taking into account historical data. The development of such a method would make it possible to synthesize systems whose operation in corporate networks would complicate the study of their operation by intruders [3].
In order to form a polymorphic response to events in corporate networks, the system architecture must include appropriate rules. In addition to taking into account the system’s previous experience in responding to events, the system must prepare several responses to respond to an event and select one of them. Thus, it is necessary to ensure that the system is able to generate response options for a particular event and evaluate previously approved and used options for their effective application. Then, from the response options, the system should choose the option that is least expected by the attacker, but it must be one that solves the problem of processing the event that has occurred. To provide such functionality, the system needs to develop rules for preparing response options and a method for organizing the functioning of the part of the system in which the response options will be evaluated, taking into account the previous experience of their application and the selection of one of the options for use.
Thus, the aim of the work is to improve decision-making by multicomputer systems with combined antivirus bait and traps regarding further steps by generating polymorphic responses to events, taking into account previous experience in the use of response options and system operation.

1.2. Previous Works

Multi-computer systems of combined anti-virus baits and traps are effective means [1] of preventing, detecting and counteracting malware and computer attacks. A separate class of such systems was identified in [3]. Its defining characteristic was the presence in the architecture of the systems of the ability to prepare options for responding to events in corporate networks. To implement this functionality, a model was proposed [4] with the division of the system’s decision-making functionality into the system center and the system controller. In the system center, according to the proposed model, response options are formed, and in the decision controller, they are evaluated taking into account previous experience in their use. The decision controller selects one option. This mechanism needs to be detailed and developed in terms of improving decision-making by multi-computer systems with combined antivirus bait and traps regarding further steps by forming polymorphic responses to events, taking into account previous experience in the use of response options and the functioning of systems.
To evaluate the prepared event response options, it is necessary to develop a system for determining security in corporate network nodes. This evaluation system can be part of a general system for evaluating response options so that one of them can be selected. To establish the security levels of corporate network nodes, an evaluation methodology was developed in [5]. It can be used to evaluate answer options in terms of node security levels.

1.3. Related Works

Deceptive systems, including systems with combined anti-virus baits and traps, should be such that their operation in corporate networks is difficult to predict for attackers who can influence the process from both outside and inside the corporate network. Deceptive systems must have the property of adaptability to adapt to a changing environment. Let us consider existing systems of this type and methods of their synthesis.
The deceptive system in [2] creates an environment that simulates the services and content of the real part of the network. The solution is based on intelligent hosts that simulate software, routers, devices, etc. These deceptive objects detect malicious activity on the corporate network. As a result, they provide protection against potential attacks. The solution is based on the intellectualization of system components in computer network nodes.
The Proofpoint Identity Threat Defense system [6] has an agentless architecture and does not allow attackers to detect fraudulent objects. It examines and can detect changes in the operating environment. To do this, it activates deceptive capabilities. The system is preventive, so that an attacker is stopped before he or she gains access to corporate network resources. The modules of the CommVault system [7] combine prevention capabilities with rapid response capabilities. According to the developers, the system detects and neutralizes zero-day attacks and hidden attacks that spread in the network environment. This system offers identification and prevention of attacks before they start. The system is network-based.
The Attivo ThreatProtect Deception and Response Platform [8] can be installed locally, in the cloud, in data centers, or in a hybrid environment. Its deceptive objects are designed to detect intruders trying to gain access to the network and data. This system not only detects access attempts, but also monitors them. The system ensures that the deceptive object interacts with the attacker, simulating the reaction he can expect from real objects. Therefore, simultaneously with network protection, the study of malicious tactics is ensured.
The baits of the CounterCraft Cyber Deception Platform [9] can be deployed as endpoints, servers, or used on online platforms. The system provides online interaction with attackers. The system collects data from agents and manages them.
The Fidelis Deception system [10] contains baits and traps for user applications, services, network connections, integrated active directory credentials, memory, endpoints, and servers. All actions are monitored and available to the administrator to make decisions about studying the actions of intruders, neutralizing attacks, and protecting against them.
The systems under consideration are all networked. The developers did not provide details of their adaptability properties, but all these systems use different technologies and strategies to control their baits. Therefore, the development of this area of research is promising. Let us consider research works on the use and synthesis of systems with baits and traps.
Single deceptive devices allow detecting malware and cyberattacks mainly by a certain type of their behavior, i.e., they are focused on detecting a certain type of malware or cyberattack. With regard to their use, a problem may arise when the attacker, malware and cyberattacks cannot activate such deceptive means. This is also due to their certain isolation in corporate networks. Several single deceptive means can be placed in corporate networks at the same time, but they will not be coordinated with each other. They may be allocated separate computing resources in corporate networks.
In order to ensure the coordination and effective functioning of individual baits in corporate networks, a decoy system should be used to coordinate and interact with them. In this case, individual baits can have different purposes, and the system will determine their involvement in the execution of tasks. Thus, organized baits as part of a system can form entire decoy networks. Their effectiveness will depend on the characteristics of the deceptive systems in which they will operate, the architecture of such systems, the organization of the decision-making center, the level of independence in decision-making, minimization of the involvement of the system administrator and the corporate network, etc.
When using baits, certain compromises must be made. On the one hand, decoy systems and services must be appropriate and attractive to the attacker, while on the other hand, computing and related costs must be consistent with the system’s functional and budgetary limitations. It is impossible to create a single, unchanging decoy configuration for different types of systems and take into account all possible types of attackers. In [11], an approach is proposed that introduces new capabilities to deceptive systems to implement selective decoy placement. This allows the decoy to dynamically introduce resources in accordance with the detected actions of the attacker. Such baits consist of kernel namespaces and virtual machines that are invoked from an inactive state. They are also used to dynamically redirect decoy traffic. This redirection mechanism can be performed without noticeable delay. In addition, an example is given that it is possible to prevent a specific host from being scanned by substituting a decoy instead.
Decoy deception can provide an effective way to counter cyberattacks in computer networks [12]. In [12], the impact of network size on an attacker’s decision to launch cyberattacks using a deception game was evaluated. For attackers, reconnaissance is an important step in collecting network data and selecting vulnerable targets for intrusion [3]. Defensive deception is an important strategy against threats that confuses attackers. Defenses can use baits with low and high levels of interaction.
Ref. [13] discusses a hybrid decoy system that balances the use of two levels of decoy complexity, with high-interaction baits designed to deceive more sophisticated attackers than low-interaction baits.
Combination lures, including front-end and back-end, are widely used in research due to the scalability of the front-end and the high level of interaction of the back-end [14]. However, traditional combination lures have problems with flow control and unrealistic topology modeling. Ref. [14] proposes a new architecture based on a software-configurable network applied to a combined decoy system to model network topology and redirect attack traffic.
Ref. [15] reviews the typical methods used in baits, tokens, and moving target defenses, covering the period from the late 1980s to 2021. Methods from these three fields complement each other and can be used to build a holistic defense based on deception. Ref. [15] investigates the integrated use of these three areas for organized deception. Ref. [16] provides an extended overview of the deception technology environment, as well as an overview of current trends and implementation models in deception-based intrusion detection systems. Recently, deception technology has been viewed as a detection solution with zero percent false positives [17]. However, there is no complete understanding of how to compare deception solutions with existing ones and evaluate their effectiveness. The ref. [17] analyzes the limitations of existing solutions and several areas of open research, including the strategy for developing deceptive solutions and integrating them with a given architecture.
In [18], a deception methodology based on the principles of military deception is proposed to deceive a malicious probe to protect a physical communication network. A network is designed that uses a deception scheme implemented on a smart router that can present a deceptive topology to an attacker.
In [19], a proactive optimized decoy-based intrusion detection system is proposed to detect zero-day attacks at minimal cost. Ref. [20] proposes a decoy-based intrusion detection and prevention system. A decoy server application combined with an IPS is developed for real-time data analysis and efficient operation. A combined decoy system is proposed, taking into account the advantages of low and high interaction baits.
Ref. [21] presents baits of industrial control systems with a high level of interaction and demonstrates that a network of Internet-connected baits can be used to identify and profile targeted attacks.
Intrusion detection systems [22] are a key component of defense capabilities. Since conventional IDSs are not scalable for large company networks and beyond, as well as for massively parallel attacks, collaborative IDSSs have emerged. They consist of several monitoring components that collect and exchange data. Depending on the specific architecture, central or distributed components, they analyze the collected data to detect attacks. The received alerts are correlated between several monitors to create a holistic view of the network monitoring. This ref. [22] first identifies the relevant requirements for such systems. Then the requirements and architecture are proposed. Intrusion detection systems must be able to scale to the needs of large corporate networks and the threat of massive parallel attacks.
Network deception systems [23] allow modifying traffic in almost real time to prevent and stop cyber reconnaissance and attacks and critically need to be evaluated for effectiveness. Ref. [23] proposes metrics for quantifying the effectiveness of network deception in systems based on software-configurable networks.
Ref. [24] presents an adaptive cyber deception system. It provides a unique representation of the virtual network to each host of the corporate network. Thus, the host’s view of its network, including the subnet topology and the assignment of IP addresses to available hosts and servers, does not reflect the configuration of the physical network and differs from the view of any other host on the network.
A significant drawback of baits may be that they are difficult to design in such a way that an attacker cannot distinguish them from a real productive system [25]. Ref. [25] suggests that instead of adding separate deceptive systems to the corporate network, the target systems themselves should be provided with tools for active defense.
Ref. [26] proposes a distributed decoy system designed to monitor Internet scans and attack behavior against industrial control systems. The system can perform clustering and visualization of attacks and provides information about the current security situation of the system. It performs high-level modeling, in-depth data analysis, and has a rich visualization interface.
In [27], a deceptive intrusion detection system is proposed to prevent a fraudulent access point by detecting attacks from internal and external attackers. The combination of intrusion detection systems and baits reduces the proportion of false positives.
The decoy network system [28] was designed to simplify deployment and management, as well as to make the use of baits more secure. The baits used were Kippo, Glasstopf, and Dionaea.
An important task is not only the ability to control a large number of systems [29], but also the ability to respond quickly to events. Ref. [29] proposes an intrusion detection tool based on some of the existing intrusion detection methods and the decoy concept.
Protecting moving targets in corporate networks is one approach that involves constantly shifting system parameters and changing the attack surface of protected systems [30]. The emergence of network function virtualisation and software-defined networking technologies makes it possible to implement highly complex methods of protecting moving targets.
Ref. [31] proposes a new flexible system for managing a virtual decoy network that is dynamically created, configured, and deployed with low- and high-level baits that emulate multiple OSes. Work [32] uses containerization techniques to dynamically create decoy networks that provide a deceptive environment for an attacker and proposes a framework for its use in existing cloud infrastructure. In [33], the dynamic decoy property of the four types of services of the proposed system is used. However, this dynamic property is reflected in the location and identification, indicating that the real or decoy services change in different hosts. Thus, the dynamic properties of the proposed system are different from the dynamic decoy. In addition, a blockchain platform is adapted to decentralize the proposed system and store port access data, providing a private chain.
The ref. [34] examines the function of honeypots as a deception strategy tool for detecting, analysing, and mitigating threats. A new methodology for comparative analysis of honeypots is presented. Seven honeypot solutions are analysed, namely Dionaea, Cowrie, Honeyd, Kippo, Amun, Glasstopf and Thug, covering various categories, including SSH and HTTP honeypots. The solutions are evaluated through network attack simulations and comparative analysis based on established criteria, including detection range, reliability, scalability, and data integrity. The study emphasises the seamless integration of honeypots with current security protocols, including firewalls and incident response strategies, while providing comprehensive information on attacker tactics, techniques, and procedures (TTPs). The results of the study provide a detailed framework for selecting and implementing honeypots that are tailored to organisational requirements.
Many critical infrastructure systems connected to the network are subject to attacks by intruders. A cyber decoy framework was proposed in [35] and described to improve network cybersecurity by using baits to confuse an attacker and distract him from real components. It contains SCADA-compliant baits that can be generated and deployed in critical infrastructure environments.
Interest in automated agents that can make smart decisions and plan countermeasures is growing rapidly. Intelligent cyber deception systems are discussed in [36]. Such systems can dynamically plan a deception strategy and use several pretexts to effectively implement cyber deception measures. The authors also present a prototype framework designed to simplify the development of cyber deception tools for integration with intelligent agents.
In [37], a framework for active cyberwarfare was developed that provides an extensible API and a synthesis mechanism for developing advanced cyberwarfare applications. The API can be used to monitor an attacker’s actions, create multi-strategy deception plans, and deploy quickly by automatically managing network configuration and operational tasks.
Ref. [38] describes a deception network methodology whereby traffic is redirected from the target operational network to a deception network with an identical configuration, minimizing any further data compromise, and allows for the study of attacker tactics and techniques. To conceal the transmission of data from network to network, a sophisticated packet rewriting technique is used using software-defined networking technology. The proposed technique can be applied to various physical/virtual/combined network configurations.
Ref. [39] provides a detailed overview of the main characteristics of deceptive systems, develops a comparative classification, including solutions using artificial intelligence.
A fully interoperable web-based cyber deception system is proposed, which contains a hybrid attack detection module consisting of a classifier and an analyzer [40]. The detection module forwards malicious HTTP requests to a docker-based cyber-manipulation system, which is monitored and controlled by a docker controller. The proposed container-based approach makes the system efficient, reduces latency, and facilitates real-time development. The key feature of attacker profiling allows the proposed system to combat attackers who carry out zero-day attacks.
Critical systems must possess the property of survivability [41], i.e., the ability to continue functioning in the face of attacks, errors, and other incidents. This is usually ensured by four-level protection, which includes prevention, detection, recovery, and adaptation. New generation security systems must be intelligent, adaptive, and stay ahead of the curve. When used in the prevention and detection phases, cyber intelligence allows you to track the intentions, goals, and strategies of attackers, which helps in the development of recovery and adaptation procedures. These procedures allow the system to function in the environment in which the attackers operate. A high-level deployment architecture that uses cyber manipulation for system survivability is presented in [41]. Other aspects of cyber-manipulation-based survivability, such as additional costs, performance, efficiency, and accuracy, are also considered.
The flexibility of virtualization makes the cloud system more dynamic and complex, which increases unpredictable cybersecurity issues [42]. In this case, protection mechanisms that use a static implementation cannot protect the attack surface in a dynamic cloud system in real time. To solve this problem, [42] presents an automated decoy network deployment system for active protection of the cloud environment based on containers, which allows for assessing changes in the structure of the target system and automatically optimize the decoy network deployment strategy.
In [43], a system is developed that is used as a trap for threat actors to believe that it is a real system. Vulnerable web servers are deployed on one server, and a secure web server and database server are deployed on another. The system aims to detect nine different types of attacks. Route checks are used to analyze traffic levels and implement the necessary mitigation strategies.
Incomplete information and the dynamics of computer systems and networks have become central problems [44] in scenarios for protection against network attacks. In real-world network environments, it is often difficult for defenders to fully understand attack behaviour and network states, leading to a high degree of uncertainty in the system. Traditional approaches are inadequate for diversifying attack strategies and dynamically evolving network structures, making it difficult to achieve highly adaptive defence strategies and effective multi-agent coordination. To address these issues, this paper proposes a multi-agent approach to network defence based on joint game modelling, called JG-Defense (Joint Game-based Defence), which aims to improve the efficiency and reliability of defence decision-making in environments characterised by incomplete information. The method combines Bayesian game theory, graph neural networks, and a proximal policy optimisation framework.
Ref. [45] proposed evaluation criteria for selecting centralization options in multicomputer architectures employing traps and baits to improve resilience against cyber threats.
Authors of [46] developed a method and decision rules for dynamically determining the next centralization option, enabling adaptive architectural reconfiguration.
Ref. [47] introduced a botnet detection approach leveraging distributed systems to improve detection efficiency and scalability. These works collectively contribute foundational methods for secure and adaptive distributed system design.
Authors of ref. [48] developed a genetic programming-based symbolic classifier combined with dataset oversampling, which effectively improved classification accuracy by addressing class imbalance issues.
In [49] a static malware detection and classification method using a random forest algorithm, showing that traditional ensemble methods can achieve high accuracy with reduced computational cost was proposed.
In [50], a transductive zero-shot learning framework leveraging malware knowledge graphs for ransomware detection, enabling the identification of previously unseen samples without labeled training data is presented.
Ref. [51] provided a comprehensive survey of transformer-based detection systems, emphasizing their ability to capture complex patterns in malware behavior through attention mechanisms.
Ref. [52] conducted an extensive review of system-level machine learning approaches for automated malware detection, highlighting existing challenges such as data diversity, feature selection, and model generalization.
Ref. [53] proposed an intelligent system for detecting network intrusions, employing advanced data acquisition and computational methods to enhance detection accuracy.
Article [54]. explored the use of (GNS3) to simulate, providing a controlled environment for analyzing network vulnerabilities and testing defense mechanisms. These works contribute foundational approaches for intrusion detection and attack simulation in cybersecurity research.
In Table 1 summarizes the features of deception systems and analyzes the technologies used in the works [3,4,5,6,7,8,9,10,11,12,13,14,15,16,17,18,19,20,21,22,23,24,25,26,27,28,29,30,31,32,33,34,35,36,37,38,39,40,41,42,43,44,45,46,47,48,49,50,51,52,53].
Thus, systems with baits in corporate networks should be able to quickly make decisions on the use of baits without the involvement of an administrator, flexibly change their architecture depending on the state of corporate networks, have tools for managing traps and baits, and be combined intrusion detection systems with baits and traps. The disadvantages of the proposed systems are their one-sidedness, focus on a small number of tasks, lack of clarity on low and high levels of interaction, mostly lack of intelligent data analysis and decision-making based on it, involvement of the administrator in processing the results of work, use of baits separately from traps, poor integration of the system itself, its decision-making center and deceptive means of baits and traps.
The urgent tasks for development in the context of synthesis of deceptive systems, including combined anti-virus bait and traps, are the tasks of developing the organization of functioning of such systems with dynamic changes in their architecture and decision-making in them with the formation of a polymorphic response to events, taking into account the previous experience of system functioning.

2. Materials and Methods

The synthesis of multicomputer systems that will provide fraudulent capabilities for an attacker, including combined antivirus bait and traps, is based on the characteristic properties of the systems. These characteristic properties of multicomputer systems are specified in the conceptual model [3,4] and represented by the corresponding sets. They should be taken into account when organizing the functioning of such systems. In the process of its functioning, when restructuring the architecture, the system can choose the characteristic properties of its architecture for the next stage of its functioning. Thus, the system becomes universal in the context of choosing characteristic properties and can cover all or part of them. Thanks to this approach, the system acquires a high degree of adaptability, which improves the effectiveness of its work in organizing fraudulent actions.
In the conceptual model [3,4] of multi-computer systems, decision-making on further system steps, task execution, etc., is divided into two separate parts: the system center and the decision-making controller. The system center is designed to prepare options for the systems’ response to internal and external events, for further steps of the systems, for the next centralization option in the system architecture, etc. The number of these options should be more than one. The decision-making controller, taking into account the previous experience of the systems’ operation and solving problems in the systems, should decide on the choice of one option from those proposed by the system center. Moreover, for the same impacts, especially when they are equally repeated over a certain period of time, the controller must select a system response option that does not necessarily have to be the same as the one that has already been used for the same impact or event. That is, the decision-making controller must react in a non-standard way to the same events. This must be implemented in class S systems [3,4], given their focus on preventing, detecting, and countering WPD and CA in corporate networks. Attackers, who can act both from inside and outside the corporate network, should not understand the principles of system operation in order to avoid the possibility of studying them to penetrate corporate networks.
The difficulty in implementing class S systems is that when forming a polymorphic response from them to influences, decisions made, actions are the most correct and effective, given the independence in decision-making entrusted to them. Therefore, the organization of their functioning and the work of the decision-making controller require the development of appropriate methods to ensure their correct functioning and avoid learning the principles of their functioning by intruders. Then, such systems would become the basis for implementing multidirectional specialized methods to prevent, detect and counteract IEDs and SCs, including the use of baits and traps.

2.1. Method of Organizing the Functioning of the Decision-Making Controller

The functioning of the decision-making controller in the architecture of class S systems is crucial for this class of systems and requires the development of a method of organizing such functioning, which will include directly internal actions in it, interaction with the system center and interaction with elements and components of systems. Let’s consider the place of the decision controller in the architecture of class S systems and its tasks.
The system center prepares from three to five answer options for certain tasks that it can solve in the system, taking into account the previous experience of the system’s operation, including the possibility of repeating certain options and their diversification. The decision-making controller receives from the system center the response options proposed by it to perform tasks that have arisen during the system’s operation. Further actions of the decision-making controller are to determine only one option to be used in the system when performing the task. In this case, the choice of a single option is made taking into account the previous experience of the system’s operation using this option, if it has already been used before, and the remaining options. The decision-making controller, regardless of the system center, also takes into account the number of active system components and their location in nodes in computer networks, the values of the criteria for evaluating options and the objective function.
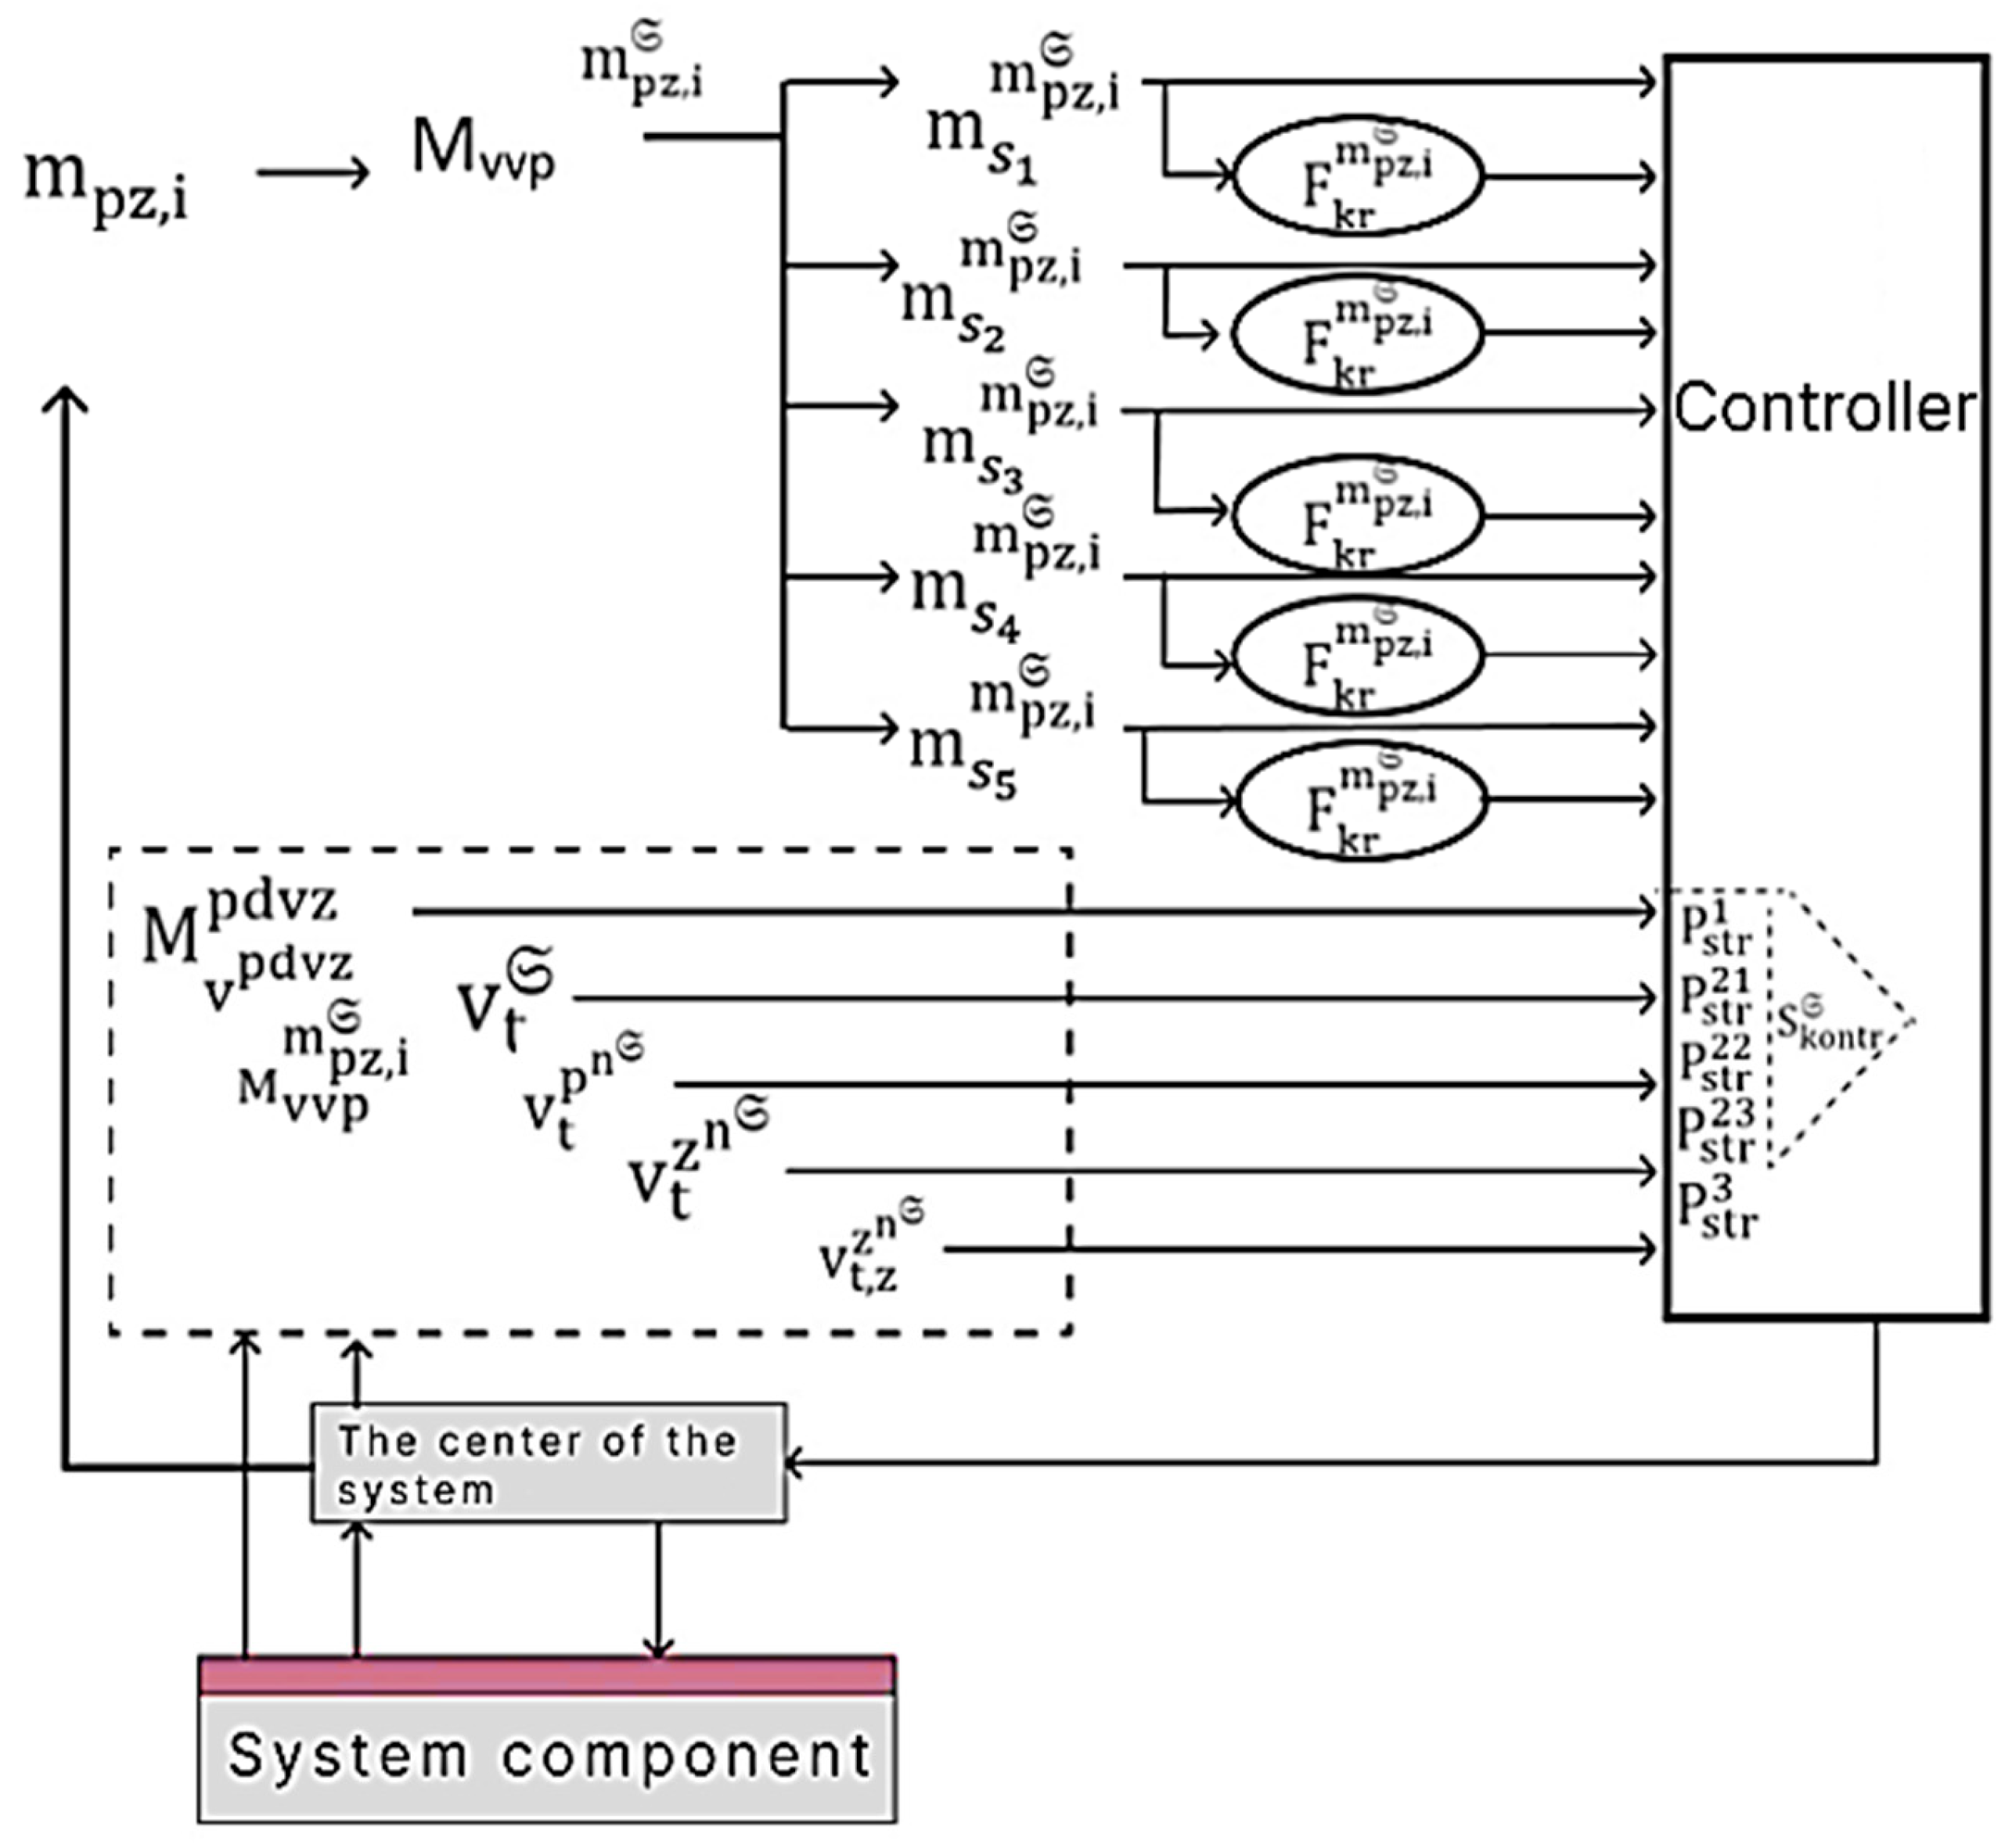
After approving a single option, i.e., the next steps of the system to complete the task, the controller transmits the result to the system center for recording and use in the next step of preparing options for completing the same task. After receiving a response from the controller, the system center starts the task execution process. The system center interacts with the decision-making controller according to the scheme shown in Figure 1.
The tasks that can be performed by systems of the fraktur cap class S are given by the set of tasks of the system M sub pz to the fraktur cap S as follows:
M p z S = m p z , 1 S , m p z , 2 S , , m p z , N M p z S S ,
where m p z , i S i - t h   t a s k ; i = 1 , 2 , , N M p z S ; N M p z S —the number of tasks the system can perform.
Number of tasks for which class systems are organized S , may be changed in the course of their operation. The execution of some tasks may be blocked as a result of external and internal influences on class systems S or as a result of a controlled reduction by the administrator. Also, the number of tasks can be increased by system administrators of the class S . That is, the number of tasks for class systems S is dynamically changing. Here is a detailed list of the main tasks of class systems S without tasks aimed at the initial formation of systems:
(1)
m p z , 1 S planned restructuring of the classroom system architecture S ;
(2)
m p z , 2 S rebuilding the architecture of classroom systems S , which is caused by external influences;
(3)
m p z , 3 S restructuring the architecture of class systems S , which is caused by internal influences;
(4)
m p z , 4 S selecting the next centralization option in the classroom system architecture S ;
(5)
m p z , 5 S processing of events caused by external influences;
(6)
m p z , 6 S processing of events caused by internal influences;
(7)
m p z , 7 S restructuring of connections in system components outside their center;
(8)
m p z , 8 S activation of individual baits and traps in class systems S ;
(9)
m p z , 9 S activation of combined anti-virus baits and traps in class systems S ;
(10)
m p z , 10 S disabling some components in class systems S ;
(11)
m p z , 11 S studying the results of baits and traps in class systems S ;
(12)
m p z , 12 S selection of the following components for the system center;
(13)
m p z , 13 S selection of the following components for the decision-making controller;
(14)
m p z , 14 S processing of events related to emergency shutdown of computer stations with system components;
(15)
m p z , 15 S adding class system components S after turning on computer stations with components and assigning them the appropriate status for performing tasks;
(16)
m p z , 16 S removal of class system components S after the computer stations with components are correctly turned on and their task execution functions are transferred to other components;
(17)
m p z , 17 S formation of a system together with the center and controller in a separate unconnected part of the entire system as a result of its disintegration;
(18)
m p z , 18 S formation of a system with a center and a controller from separate unrelated parts of the entire system as a result of establishing a connection between the parts and its transition to an integral system;
(19)
m p z , 19 S setting the emergency state of the entire system or its parts;
(20)
m p z , 20 S setting the normal operating mode of the entire system or its parts.
At the initial formation of class systems S In corporate networks, the administrator installs components in specific network nodes and assigns one of the components to the system center. At this first stage, the decision controller will be active in the same component as the system center. In the further operation of systems of the class S the controller can be in different components, including active components with the system center.
For each of the tasks that can be performed by the system and are specified by the elements of the system task set M p z S in the Formula (1), several variants of their execution may be generated by the system center. This is due to the fact that a multi-computer system has many components with the same functionality and, when preparing variants of a task, different components may be involved in its execution, and the system may contain different methods of performing the same task. Taking into account the purpose of systems of the class S to ensure the functioning of baits and traps, as well as to create problems for attackers in the context of studying the principles of operation of such systems, to perform the same task, the need to prepare an embodiment for which is caused by periodic repetition, there may be embodiments that differ either in methods of execution and/or involve a different number of components. Therefore, their number will require organizing a selection. To make such a choice, similar to the rules and method for determining the next centralization option in the architecture of class systems S , it is necessary to evaluate each of the options for completing the task, taking into account the previous experience of the classroom systems S , the number of active components at the current time, the effectiveness of repeating variants, and taking into account the security levels in the components.
For each task from the set of tasks of the system, let’s enter M p z S (Formula (1)), with the set of potential embodiments as follows:
M v v p m p z , i S = m 1 m p z , i S , m 2 m p z , i S , , m N M v v p m p z , i S S m p z , i S ,
where m p z , i S i - t h   t a s k ; i = 1 , 2 , , N M p z S ; N M p z S —the number of tasks the system can perform; m j m p z , i S j - t h   o p t i o n   f o r   p e r f o r m i n g   t h e   i - t h   t a s k   m p z , i S ; j = 1 , 2 , , N M v v p m p z , i S S ; N M v v p m p z , i S S —is the total number of options for performing the i-th task m p z , i S .
Then, the total number of K v v z S all options for performing all tasks of class systems S is defined as follows:
K v v z S = i = 1 N M p z S N M v v p m p z , i S S ,
where m p z , i S i - t h   t a s k ; i = 1 , 2 , , N M p z S ; N M p z S —the number of tasks the system can perform; m j m p z , i S j - t h   o p t i o n   f o r   p e r f o r m i n g   t h e   i - t h   t a s k   m p z , i S ; j = 1 , 2 , , N M v v p m p z , i S S ; N M v v p m p z , i S S —is the total number of options for performing the i-th task m p z , i S (Formula (1)).
Total number of K v v z S all options for performing all tasks of class systems S will determine the potential number of states to which systems will transition, taking into account their increase due to the changing number of components at the current moment of system operation and the possibility of involving different active components each time.
When approving the final task execution option from the proposed options by the system center, the decision-maker should take into account the previous experience of applying task execution options or the lack thereof in the event that the option under consideration has not been used for approval even once. Certain task execution options could be applied multiple times, and each time their application could bring different results for the task execution and impact directly on the system itself. Let’s set the previous experience of using the option that is set for each task from the task set M p z S (Formula (1)) by the set M v v p m p z , i S of potential options for performing the task according to Formula (2), performing the task with a vector v m j m p z , i S p d v z options for completing the task as follows:
v m j m p z , i S p d v z = v m j m p z , i S , 1 p d v z , v m j m p z , i S , 2 p d v z , , v m j m p z , i S , N v m j m p z , i S p d v z S p d v z ,
where m p z , i S i - t h   t a s k ;   i = 1 , 2 , , N M p z S ; N M p z S —the number of tasks the system can perform; m j m p z , i S j - t h   o p t i o n   f o r   p e r f o r m i n g   t h e   i - t h   t a s k m p z , i S ; j = 1 , 2 , , N M v v p m p z , i S S ; N M v v p m p z , i S S —is the total number of options for performing the i-th task m p z , i S ; v m j m p z , i S , k p d v z k - t h   i n d i c a t o r ,   w h i c h   c h a r a c t e r i z e s   t h e   p r e v i o u s   e x p e r i e n c e   o f   u s i n g   t h e   o p t i o n   m j m p z , i S task fulfillment m p z , i S ; k = 1 , 2 , , N v m j m p z , i S p d v z S ; N v m j m p z , i S p d v z S —the total number of indicators characterizing the previous experience of using the option m j m p z , i S task fulfillment m p z , i S .
All indicators that are specified by the coordinates of the vector v m j m p z , i S p d v z (Formula (4)), we set with numerical values from the interval [0,1]. Of any two different values of one of the indicators, we will take the higher value to be the best of the two values in the context of the indicator. Then, the value of the indicator that is closest to one will characterize the achievement of the appropriate level for the indicator. Let’s introduce such indicators in the context of assessing the previous experience of the options proposed for approval for the decision-maker:
(1)
v m j m p z , i S , 1 p d v z —reliability of the system center during the operation of the considered variant of the task;
(2)
v m j m p z , i S , 1 p d v z —reliability of the entire system during the operation of the considered variant of the task;
(3)
v m j m p z , i S , 1 p d v z —assessment of the quality of the task using the option under consideration for the event that prompted the use of this option;
(4)
v m j m p z , i S , 1 p d v z —assessment of the quality of all tasks performed by the system during the time of using the option under consideration for the event that prompted the use of this task option.
Also, the number of indicators for assessing the previous experience of using a task variant can be increased.
For the i-th task from the set of tasks of the system M p z S (Formula (1)) the set M v M v v p m p z , i S p d v z p d v z vectors of variants of the i-th task m p z , i S as follows:
M v M v v p m p z , i S p d v z p d v z = v m 1 m p z , i S p d v z , v m 2 m p z , i S p d v z , , v m N M v v p m p z , i S S m p z , i S p d v z ,
where m p z , i S i - t h   t a s k ; i = 1 , 2 , , N M p z S ; N M p z S —the number of tasks the system can perform; m j m p z , i S —j-th option for performing the i-th task m p z , i S ; j = 1 , 2 , , N M v v p m p z , i S S ; N M v v p m p z , i S S —is the total number of options for performing the i-th task m p z , i S ; v m j m p z , i S , k p d v z –k-th indicator, which characterizes the previous experience of using the option m j m p z , i S task fulfillment m p z , i S ; k = 1 , 2 , , N v m j m p z , i S p d v z S ; N v m j m p z , i S p d v z S —the total number of indicators characterizing the previous experience of using the option m j m p z , i S task fulfillment m p z , i S .
According to Formulas (1) and (5), we define the set M v M v v p m p z S p d v z p d v z previous experience in using all the options that are set for each task from the set of tasks M p z S (Formula (1)), as follow:
M v M v v p m p z S p d v z p d v z = i = 1 N M p z S M v M v v p m p z , i S p d v z p d v z ,
where m p z , i S i - t h   t a s k ;   i = 1 , 2 , , N M p z S ; N M p z S —the number of tasks the system can perform; M v M v v p m p z , i S p d v z p d v z – is a set of vectors of options for performing the i-th task m p z , i S .
Thus, the resulting set M v M v v p m p z S p d v z p d v z (Formula (6)) contains information about the previous experience of using task execution options that were already approved by the decision-making controller during the system operation.
Each of the tasks, which are set by the set of tasks of the system M p z S (Formula (1)), can have variants of execution given by the set M v v p m p z , i S potential options for implementation. In addition to considering previous experience with them, these options should also be evaluated before the decision-maker selects one option from those suggested by the system center. Some or even all of the proposed options may not have been used before. In this case, it is impossible to take into account previous experience. If some of the options have been used before, i.e., the system has numerical data on the results of functioning with such options, then there may be options that have not been used before. In this case, they will not have any estimated values and are difficult for the controller to evaluate. To take into account such variants, as well as all variants at the initial stages of system operation, where there is no previous experience for the variants, we introduce an objective function for evaluating each task variant, taking into account the criteria that will be decisive in the context of certain task variants.
We will define the objective functions for evaluating task options so that the best value of two values is the smaller value and all values obtained when calculating the objective function will belong to the interval [0,1]. Let’s define the objective functions as follows:
F k r m p z , i S f 1 , k r m p z , i S p 1 , k r m p z , i S , f 2 , k r m p z , i S p 2 , k r m p z , i S , , f N F k r m p z , i S , k r m p z , i S p N F k r m p z , i S , k r m p z , i S m i n ,
where m p z , i S i - t h   t a s k ; i = 1 , 2 , , N M p z S ; N M p z S —the number of tasks the system can perform; f j , k r m p z , i S p j , k r c e n t r j -th function that specifies the calculation of the value of the j-th criterion j —of that criterion; j = 1 , 2 , , N F k r m p z , i S ; p j , k r m p z , i S —a vector whose coordinates are the parameters j —of the criterion and the option of performing the task; N F k r m p z , i S —number of function arguments F k r m p z , i S and the number of vectors p j , k r m p z , i S .
Let’s look at the definition of each of the criteria. Let’s define the criteria in general as follows:
f j , k r m p z , i S p 1 , j , k r m p z , i S , p 2 , j , k r m p z , i S , , p N p j , k r m p z , i S , j , k r m p z , i S 0 , 1 ,
where p k , j , k r m p z , i S k - t h   c o o r d i n a t e   o f   t h e   v e c t o r   p j , k r m p z , i S indicators for the criterion f j , k r m p z , i S ; k = 1 , 2 , , N p j , k r m p z , i S ; N p j , k r m p z , i S —number of vector coordinates p j , k r m p z , i S indicators for the criterion f j , k r m p z , i S .
The criteria will include important indicators in the context of evaluating the next options for the system’s performance. Such criteria may include criteria for system security, decision-making efficiency, system integrity, system stability, system center stability, system center integrity, etc.
The numerical values calculated for each of these criteria will belong to the numerical interval [0,1]. For each option under consideration, the objective function of evaluating the following options for performing the task to select one of the options will be minimized by the parameters available in the criteria.
Thus, the resulting objective functions are F k r m p z , i S (Formula (7)) for evaluating subsequent task execution options will determine the values for the options that the decision controller will consider.
To ensure the execution of tasks by multicomputer systems, it is necessary to take into account, before starting to execute tasks or in the process of selecting options for executing tasks, the state of individual components and the state of the system as a whole, as well as the presence of active system components in it at the current time.
The state of an individual component will be considered in the context of the functional and cybersecurity of the particular computer station in which it is installed. Functional security will be considered as part of the overall security of components in computer stations that form a multi-computer system and its definition will be based on the level of properly functioning system and its components in the face of equipment failures and environmental changes. Cybersecurity of a particular computer station will be considered as a state of protection of electronic data from unauthorized use or malicious actions with this data. Let’s introduce the set M k o m p f b k b indicators that will characterize the functional and cybersecurity of computer stations and system components in them as follows:
M k o m p f b k b = m k o m p , 1 f b k b , m k o m p , 2 f b k b , , m k o m p , N M k o m p f b k b f b k b f b k b ,
where m k o m p , k f b k b k -th indicator that characterizes the state of functional and cybersecurity of the computer station and system components in it; k = 1 , 2 , , N M k o m p f b k b f b k b ; N M k o m p f b k b f b k b —the total number of indicators characterizing the state of functional and cybersecurity of the computer station and the system components in it.
The indicators that characterize the state of functional and cybersecurity of the computer station and the system components in it include the following: type of operating system; RAM occupancy as a percentage; total RAM; type of intrusion detection systems; type of antivirus software; hard disk occupancy; total hard disk; presence of connected peripherals; CPU load by permanent processes; type of CPU, etc.
Let’s introduce a set of functions M f f b k b to determine the level of functional and cybersecurity of the computer station and the system components in it according to the indicators (Formula (9)) as follows:
M f f b k b = f f , 1 f b k b , f f , 2 f b k b , , f f , N M f f b k b f b k b f b k b ,
where f f , k f b k b k -th function, which characterizes the level of functional and cybersecurity of the computer station and system components in it according to the k-th indicator (Formula (8)); k = 1 , 2 , , N M f f b k b f b k b ; N M f f b k b f b k b —is the total number of functions that characterize the state of functional and cybersecurity of the computer station and system components in it according to the indicators determined by Formula (9).
Each of the functions defined in the set of functions M f f b k b (Formula (10)) produces a value belonging to the interval [0,1], taking into account a specific indicator in a particular computer station and normalizes it with the rest of the values for the same indicator from all computer stations in which the system components are installed. Let’s define the functions as follows:
p n S = f f , k f b k b m k o m p , k f b k b , n S ,
where m k o m p , k f b k b k -th indicator that characterizes the state of functional and cybersecurity of the computer station and system components in it; k = 1 , 2 , , N M k o m p f b k b f b k b ; N M k o m p f b k b f b k b —the total number of indicators characterizing the state of functional and cybersecurity of the computer station and system components in it; f f , k f b k b k -th function, which characterizes the level of functional and cybersecurity of the computer station and system components in it according to the k-th indicator (Formula (9)); k = 1 , 2 , , N M f f b k b f b k b ; N M f f b k b f b k b —is the total number of functions that characterize the state of functional and cybersecurity of the computer station and system components in it according to the indicators determined by Formula (9); n S —system component number; p n S —the level of functional and cybersecurity that characterizes the component with the number n S .
Then, the systems of the class S taking into account Formulas (9)–(11) will be characterized by a vector of levels of functional and cybersecurity of all components. Let’s set this vector taking into account the current time from the beginning of the system’s operation and the value of the levels of functional and cybersecurity of computer stations of the system components in it as follows:
v t p n S = t , p 1 S , p 2 S , , p n S ,
where t —current time of receiving all values p i S ; i S = 1 , 2 . , n S ; n S —number of system components; p i S —the value of the level of functional and cybersecurity of the computer station and i S —of the system component in it.
Let us define the state of functional and cybersecurity of the system by the vector v t S as follow:
v t S = t , i = 1 n S p i S n S ,
where t —current time of receiving all values p i S ; i S = 1 , 2 . , n S ; n S —number of components in the system; p i S —the value of the level of functional and cybersecurity of the computer station and i S —of the system component in it.
Thus, for the decision-maker to approve the next variant of the task, the levels of functional and cybersecurity of the computer station are determined and i S —of each component of the system in it and the system as a whole according to Formulas (12) and (13).
In addition to the value of the system security level, which is given by Formula (13), we will introduce the level of communication between components in the system, which will be characterized by the state of communication. Let us define it by the vector v z S connection of components in the system as follows:
v z S = t , i = 1 n S z i S 2 n S ,
where t —current time of receiving all values p i S ; i S = 1 , 2 . , n S ; n S —number of system components; z S —the number of connections between components in the system according to the current topology established in it; z i S —number of connections i S —of that component of the system with the rest of the components.
The meaning of Formula (14) for the value characterizing the state of communication between the system components is that in the presence of all the specified connections, we obtain a normal mode of communication in which v t S = t , 1 . If certain connections are lost between components, then the value of the second coordinate of the vector v t S will be less than one. To complete the representation of the connections for each component, we set the vector:
v t z n S = t , z 1 S , z 2 S , , z n S ,
where t —current time of receiving all values z i S ; i S = 1 , 2 . , n S ; n S —number of system components; z i S —number of connections i S —of that component of the system with the rest of the components.
To determine the completeness of the links, we introduce a vector v t , z z n S , in which the coordinates of the values will be displayed p z i S , that will express the ratio of existing connections i S -oї components to the number of connections defined for it by the system. Let’s define the vector v t , z z n S as follow:
v t , z z n S = t , p z 1 S , p z 1 , , p z n S ,
where t —current time of receiving all values p z i S ; i S = 1 , 2 . , n S ; n S —number of system components; p z i S —the ratio of existing connections i S -th component to the number of connections defined for it by the system
If the value p z i S = 1 , then the available number of connections for the component coincides with the number set by the system. If p z i S < 1 , then the available number of links for the component is less than the defined number set by the system, and such an event requires investigation by the system. If p z i S > 1 , then the available number of links for the component is greater than the defined number set by the system, and such an event requires special investigation by the system. The loss of links or their increase from the specified number will affect the work of the decision controller, since such an event will require a separate task to determine the causes and eliminate the problem.
To select one of the five options for completing a task, the decision-maker needs to specify a certain list of strategies that will be used to select one option for approval. All five options may have different numerical characteristics. Also, it may be that some of them have already been applied before and the results of such application are available in a set M v M v v p m p z S p d v z p d v z previous experience (Formula (6)). Or none of the options has yet been used to perform tasks during the entire time of the system’s operation. When the system is operating in the first days of its operation, the options offered to the controller for consideration may also be those that have not yet been applied and, accordingly, there is no previous experience of their application. There may be cases of multiple applications of certain options and different results of evaluation of such applications. In addition, in order to confuse a possible attacker who carries out repetitive impacts on the corporate network that generate the same events to which the system sensors respond and, accordingly, the system must perform tasks to process such events. With frequent repetition of such events, the controller must approve a variant that does not repeat the same events, thereby forming a polymorphic response from the system. Therefore, to implement the controller, it must contain strategies for choosing a task execution option, taking into account all the initial conditions in the system at the time of option selection.
Let’s set a set of strategies S k o n t r S selecting the next option for the task by the decision-making controller as follows:
S k o n t r S = s k o n t r , 1 S , s k o n t r , 2 S , , s k o n t r , N S k o n t r S s t r S ,
where N S k o n t r S s t r —the total number of strategies in the set of strategies S k o n t r S selecting the next option for completing the task by the decision-maker; s k o n t r , k S k -th strategy for selecting the next option for completing the task by the decision-maker; k = 1 , 2 , , N S k o n t r S s t r .
For example, the decision-maker’s strategies for choosing the next option for completing a task may include the following:
(1)
s k o n t r , 1 S —selecting the option with the highest value of the objective function F k r m p z , i S (Formula (6));
(2)
s k o n t r , 2 S —selecting the option with the lowest value of the objective function F k r m p z , i S (Formula (6));
(3)
s k o n t r , 3 S —selecting the option with the second value after the minimum value of the objective function F k r m p z , i S (Formula (7));
(4)
s k o n t r , 4 S —selecting the option with the third value after the minimum value of the objective function F k r m p z , i S (Formula (7));
(5)
s k o n t r , 5 S —selecting a task option that has already been repeated more times than the rest of the options under consideration according to the data from the set M v M v v p m p z S p d v z p d v z of previous experience (Formula (6)) using all options;
(6)
s k o n t r , 6 S —selecting the option of performing the task that has already been repeated the least number of times compared to the rest of the options under consideration according to the data from the set M v M v v p m p z S p d v z p d v z of previous experience (Formula (6)) using all options;
(7)
s k o n t r , 7 S —choosing the option of performing the task that has already been repeated second in number from the option with the largest number of times compared to the rest of the options under consideration according to the data from the set M v M v v p m p z S p d v z p d v z of previous experience (Formula (5)) using all options;
(8)
s k o n t r , 8 S —randomly selecting a task option from two options that have already been repeated the same least number of times compared to the rest of the options under consideration according to the data from the set M v M v v p m p z S p d v z p d v z previous experience (Formula (6)) using all options;
(9)
s k o n t r , 9 S —randomly selecting a task option from two options that have already been repeated the same number of times compared to the rest of the options under consideration according to the data from the set M v M v v p m p z S p d v z p d v z previous experience (Formula (6)) using all options;
(10)
s k o n t r , 10 S —selection of a task variant in which it is planned to involve components with a security level that is higher than the system security level (Formulas (12) and (13));
(11)
s k o n t r , 11 S —selection of a task variant in which it is planned to involve components with a security level that is higher than the system security level (Formulas (12) and (13)) and that is less than the system security level by no more than 10%;
(12)
s k o n t r , 12 S —selecting a task variant in which it is planned to involve components with communication states for which the corresponding values are determined by the vector coordinates v t , z z n S by Formula (16) fully correspond to those determined by the system;
(13)
s k o n t r , 13 S —selecting a task variant in which it is planned to involve components with communication states for which the corresponding values are determined by the vector coordinates v t , z z n S according to Formula (16) are less than the values determined by the system, but contain at least two links defined in the corresponding coordinates of the vector;
(14)
s k o n t r , 14 S —selecting a task variant in which it is planned to involve components with communication states for which the corresponding values are determined by the vector coordinates v t , z z n S according to Formula (16) are less than the values determined by the system, but contain at least half of the links defined in the corresponding coordinates of the vector.
The list of strategies is not exhaustive. Also, these strategies can be basic and can be used separately or by combining several of them. According to the basic strategies, the controller can apply a rule for forming complex strategies from basic strategies. Let’s set the rules for forming a strategy for choosing the next option for completing the task by the decision controller as follows:
P s t r 1 : s k o n t r , i S s k o n t r , j S s k o n t r , k S , i = 1 , 2 , 3 , 4 , j = 5 , 6 , 7 , 8 , 9 , 10 , k = 11 , 12 , 13 , 14 ;   P s t r 21 : s k o n t r , i S s k o n t r , j S , i = 1 , 2 , 3 , 4 , j = 5 , 6 , 7 , 8 , 9 , 10 ;   P s t r 22 : s k o n t r , i S s k o n t r , k S , i = 1 , 2 , 3 , 4 , k = 11 , 12 , 13 , 14 ;   P s t r 23 : s k o n t r , k S s k o n t r , j S , j = 5 , 6 , 7 , 8 , 9 , 10 , k = 11 , 12 , 13 , 14 ;   P s t r 3 : s k o n t r , i S , i = 1 , 2 , , 14 .
According to the list of strategies for selecting the next option for performing the task, the decision controller randomly selects the rule given by Formula (18) and applies it to the five options prepared by the system center. Scheme with data for the decision controller and the relationship between the main components of class systems S is shown in Figure 2.
Thus, as a result of processing the input data by the decision-making controller, we get a variant of the task, which forms a polymorphic response of the system to an event caused by internal and external influences in the corporate network. To organize the functioning, it is necessary to develop a method according to which the decision-making controller would function in multi-computer systems.
Let us define the method of organizing the functioning of the decision-making controller by the main steps, taking into account the input data for processing and rules, as follows:
(1)
Formation of the decision-making controller in certain components of the system;
(2)
Restructuring the architecture of the decision controller;
(3)
Moving the decision-making controller to certain system components;
(4)
Establishing a connection between the components containing the current decision controller and the rest of the system components;
(5)
Receiving input data from the system center and other system components in the format of the i-th task m p z , i S ( i = 1 , 2 , , N M p z S ; N M p z S —is the number of tasks that the system can perform) (Formula (1)), j-th option m j m p z , i S fulfillment of the i-th task m p z , i S ( j = 1 , 2 , , N M v v p m p z , i S S ; N M v v p m p z , i S S —is the total number of options for performing the i-th task m p z , i S ) (Formula (3)), k - t h   i n d i c a t o r   v m j m p z , i S , k p d v z characteristics of previous experience with the variant m j m p z , i S task fulfillment m p z , i S ( k = 1 , 2 , , N v m j m p z , i S p d v z S ; N v m j m p z , i S p d v z S —the total number of indicators characterizing the previous experience of using the option m j m p z , i S task fulfillment m p z , i S ) (Formula (5)), the sets M v M v v p m p z S p d v z p d v z of previous experience (Formula (6)), the value of the objective function F k r m p z , i S (Formula (7)) for the considered variants of the task, the vector v t p n S taking into account the current time from the beginning of the system operation and the value of the levels of functional and cybersecurity of computer stations of the system components (Formula (12)), vector v t S of the state of functional and cybersecurity of the system (Formula (13)), vector v t z n S representation of connections for each component (Formula (15)), vector v t , z z n S of the completeness of the links (Formula (16)), the k-th strategy s k o n t r , k S selecting the next option for completing the task by the decision-maker ( k = 1 , 2 , , N S k o n t r S s t r ; N S k o n t r S s t r —the total number of strategies in the set of strategies S k o n t r S of choosing the next option for performing the task by the decision-maker) (Formula (17));
(6)
Random selection and application of one of the rules for forming a strategy for selecting the next option for completing the task by the decision-maker (Formula (18));
(7)
Transmitting the result of selecting the next option for completing the task to the system center and the rest of the system components.
Thus, a method for organizing the functioning of the decision-making controller has been developed, the essence of which is to ensure the selection of one task execution option from the options prepared and proposed for consideration by the system center, taking into account the previous experience of the system in applying task execution options, security levels of system components, the number of components and connections between them, which makes it possible to form a polymorphic system response to an event caused by external and internal influences in corporate networks.

2.2. Method of Organizing the Functioning of Multi-Computer Systems

Conceptual model A M , S class systems S [3,4] takes into account the multiplicity of elements that are in relations and connections with each other and form a certain integrity and unity of parts. The given relationships between the parts of the system and its internal organization have specific properties that change in accordance with external and internal influences and the purpose of using class systems S . In order to organize the functioning of such systems, it is necessary to take into account not only the rules of internal organization between elements and components and the rules of interaction between them, but also to ensure that their defining properties change. That is, in the process of functioning of the class system S must change the set of defining characteristics. These sets of defining characteristics are defined by sets [3,4] and allow for a large number of variants. Thus, systems of the class S in the course of their functioning in corporate networks change their properties many times and, therefore, taking into account such features, it is necessary to develop a method of organizing the functioning of systems, the feature of which would be the ability of systems to independently change their properties, organize elements and components and establish links between them. Organization of centralization in class systems S and the presence of a decision controller are detailed and specified by appropriate methods. At the same time, they are integral parts of systems of the S and, therefore, should be taken into account when organizing the interaction of all parts of the systems. The purpose of systems of the class S can be specified by the relevant specialized functionality, which will be decisive in the context of the purpose and assignment to a certain class of systems. Since such systems should contain a set of baits and traps for ASW and spacecraft, as well as their combinations, and given that they are distributed, the organization of such systems should provide for the selection of components for performing tasks and multivariate in the context of performing a specific task.
Let’s set the class systems S so that their definition includes all components, elements, and relationships between them. Let’s use the class system definition S their components as a set A S [4]. Let’s divide the components of the class systems S into two subsets: active components, i.e., components in enabled computer stations; inactive components. The subset of inactive components of systems of the S include those that are in shutdown computer stations or are deleted or blocked by the system at a certain point in time. Then, the set A S taking into account this division, we define it as follows:
A S = A 1 S , a A 2 S , p ,
where A 1 S , a —a subset of active system components A S ; A 2 S , p —a set of system components that are currently in shutdown computer stations or are removed or blocked by the system at a certain point in time.
Let us denote the class systems S as a set A S according to Formula (19) takes into account all components of the system in the context of active components of the system center and those that are not active at the current moment. That is, both tasks by the set A S class systems S cover all components, but are different due to the combination of different subsets. From Formula (19), we obtain the following consequences:
A 1 S , a A 1 S ;   A 2 S A 2 S , p .
From the consequence given by Formula (20), it follows that the number of components containing the functionality of the system center covers the entire number of system components. This is necessary in the context of choosing a centralization option in the system architecture, for example, with a decentralized type, in which all components are involved in performing the functions of the system center. Or for other types of centralization in the system architecture, this requirement increases the number of options for placing the system center in active components. Thus, systems of the class S will be characterized by the total number of components, the number of active components, the number of active components of the system center, the number of components in disabled computer stations, the number of components removed by the system itself. Then, according to the values of the number of components of each type, the system will be determined by them and will be in a certain state. Let’s set the vector v t , s t , k S , which will characterize the state of class S systems by component types at the current moment of time of the systems functioning as follows:
v t , s t , k S = t ,   k s t , 1 S ,   k s t , 2 S ,   k s t , 3 S ,   k s t , 4 S ,   k s t , 5 S ,
where t —current system operation time; k s t , 1 S —the total number of components in the system, which is determined when it is formed by the system administrator; k s t , 2 S —the number of active system components at the current time t ; k s t , 3 S —number of active components of the system center at the current time t ; k s t , 4 S —the number of system components in the disabled computer stations at the current time t ; k s t , 5 S —is the number of components that the system has removed on its own at the current time t.
If k s t , 2 S = k s t , 3 S , then the system at the current time t has a decentralized architecture type. Also, the ratio k s t , 2 S + k s t , 4 S + k s t , 5 S = k s t , 1 S characterizes the completeness of the system in terms of distribution by component type and can be used for self-control in the system. If k s t , 5 S > k s t , 2 S , then the system is in a critical state and its security level is such that it is necessary to investigate the ability to perform tasks. If k s t , 4 S > k s t , 2 S then the system does not have sufficient completeness to perform the task. The analysis of similar ratios regarding the number of components of different types at the current time t allows the system to independently determine the ability to perform tasks and the correctness of its architecture in the context of the division of components according to Formula (21).
Let’s enter a vector v T , s t , k S are the characteristics of the system during the entire time of its operation according to the setting of all vectors, which are determined by Formula (20) as follows:
v T , s t , k S = v t 1 , s t , k S , v t 2 , s t , k S , , v t N v T , s t , k S , s t , k S ,
where t i —is the current system operation time for the i-th vector v t i , s t , k S ; i = 1 , 2 , , N v T , s t , k S ; N v T , s t , k S —number of vector coordinates v T , s t , k S , that is, the amount of data obtained for the vectors v t i , s t , k S .
Thus, the vector v T , s t , k S will contain the characteristics of the system throughout its operation at certain time intervals, and the system will use information about its previous versions when performing tasks. To detail information about components in the architecture of systems of the class S let’s introduce a vector for each component v T , k , i S (i—component number) the functioning of the component throughout the entire period of system operation. Such information will provide the system center with information to prepare options for performing tasks, in particular, to select the components in which tasks will be performed. Let’s set the vector v T , k , i S (i—component number) functioning of the component as follows:
v T , k , i S = t ,   t i ,   s a , i ,   t i , 1 ,   t i , 2 ,   t i , 3 ,   t i , 4 ,   t i , 5 ,
where t —current system operation time; t i — the current operating time of the system component, i.e., the maximum time the component has been in the active state; s a , i —active (value “1”)/inactive (value “0”) state of the component at the current time t of the system operation; t i , 1 —is the total time the component is in the active state during the time t of system operation; t i , 2 —the time the component is in the active state as part of the system center; t i , 3 —time spent by the component in the active state outside the system center; t i , 4 —the time the component is turned off in the computer station; t i , 5 —time spent by the component among the components that are removed by the system on its own; i = 1 , 2 , , N A S ; N A S —number of components in the system A S .
Then, the set of all vectors given by Formula (23) at i = 1 , 2 , , N A S ( N A S —number of components in the system A S ) will contain the time characteristics of all system components and will be used when selecting the next components to perform tasks. Using Formula (23), you can set the time ratio for individual components. For example, the following ratios must be fulfilled when i = 1 , 2 , , N A S ( N A S —number of components in the system A S ): t i , 1 = t i , 2 + t i , 3 + t i , 4 + t i , 5 ; s a , i = 1 , if t = t i etc. Such correlations allow the system to make decisions about the next steps in the execution of tasks in certain components.
Let’s also consider the time to establish communication between different components of the system. Information about it is necessary for systems of the class S , since they are distributed and, therefore, this parameter is critical for their performance. Let’s introduce the matrix M T , k S the maximum time spent on establishing communication between two system components as follows:
M T , k S = t 1 , 1 M T , k S t 1 , N A S M T , k S t N A S , 1 M T , k S t N A S , N A S M T , k S ,
where t i , j M T , k S —is the maximum time spent on establishing a connection between the i-th component and the j-th component; i = 1 , 2 , , N A S ; j = 1 , 2 , , N A S ; N A S —number of components in the system A S .
The time taken to establish a connection between the i-th component and the j-th component may differ from the time taken to establish a connection between the j-th component and the i-th component. That is, the matrix M T , k S is not symmetric about the main diagonal. Also, let us assume t i , j M T , k S = 1 in the absence of a connection between the i-th component and the j-th component. Such a connection may be absent due to the execution of tasks without the need for such a connection, due to the existing topology in the system that does not provide for such a connection, due to the loss of the connection. Information about the connections between components is contained in the vector v z S connection of components in the system (Formula (14)), vector v t z n S of the completeness of the representation of relations for each component (Formula (15)), vector v t , z z n S the ratio of the existing connections of a component to the number of connections defined for it by the system (Formula (16)). Thus, for systems of the class S established, in addition to information about the links, the time spent on their establishment. This allows systems to independently evaluate components for the appropriateness of their involvement in tasks, as well as identify problematic components.
Let’s enter the matrix M T , k , s S average time spent on establishing communication between two system components as follows:
M T , k , s S = t 1 , 1 M T , k , s S t 1 , N A S M T , k , s S t N A S , 1 M T , k , s S t N A S , N A S M T , k , s S ,
where t i , j M T , k , s S —is the average time spent on establishing a connection between the i-th component and the j-th component; i = 1 , 2 , , N A S ; j = 1 , 2 , , N A S ; N A S —number of components in the system A S .
Determining the next value t i , j M T , k , s S the average time to establish a connection between components, if there is a previous value, is calculated as their arithmetic mean. It is possible to determine the value based on weighted coefficients, as well as with the introduction of certain conditions. The average time spent on establishing a connection between the i-th component and the j-th component may differ from the average time spent on establishing a connection between the j-th component and the i-th component, so the matrix M T , k , s S is not symmetrical about the main diagonal. In the absence of a connection between the i-th component and the j-th component, we take the value t i , j M T , k , s S = 2 . This case characterizes the connection that may be absent due to the performance of tasks without the need for such a connection, due to the existing topology in the system that does not provide for such a connection, or due to the technical loss of the connection.
To organize the functioning of multicomputer systems, taking into account the components and connections between them, we will define the main steps of the method as follows:
(1)
The current formation of the system (Formula (19)) from active components that are in the newly turned on computer stations or were in the previously turned on computer stations;
(2)
Constant acquisition of data on the time of operation of the system and its components to form a vector v t p n S taking into account the current time from the beginning of the system’s operation and the value of the levels of functional and cybersecurity of computer stations of the system components (Formula (12)), the vector v T , s t , k S will contain the characteristics of the system during the entire time of its operation at certain time intervals (Formula (22)), the vector v T , k , i S (i—component number) functioning of the component (Formula (23)) during the entire period of system operation ( i = 1 , 2 , , N A S ; N A S —number of components in the system A S ), matrices M T , k S the maximum time spent on establishing a connection between two system components (Formula (24)), the matrix M T , k , s S the average time spent on establishing communication between two system components (Formula (25));
(3)
Obtaining data for the execution of instructions from the system center and the decision-making controller to form a vector v t p n S taking into account the current time from the beginning of the system’s operation and the value of the levels of functional and cybersecurity of computer stations of the system components (Formula (12)) and the vector v t S the state of functional and cybersecurity of the system (Formula (13));
(4)
Obtaining data for the execution of instructions from the system center and the decision-making controller to form a vector v t z n S representation of connections for each component (Formula (15)), vector v t , z z n S completeness of connections (Formula (16));
(5)
Detection of an event in the corporate network caused by external and internal influences, its identification and selection of tasks from the set of system tasks M p z S (Formula (1)) to respond to the event;
(6)
Launching the system center to prepare response options for the task of performing the event from clause 5;
(7)
Launching the decision-making controller to approve the option for performing the task from clause 6;
(8)
Transfer for execution and execution of the approved variant of the task from clause 7;
(9)
Removal by the system of a part of the components in which the value of the levels of functional and cybersecurity of the computer stations of the system components (Formula (12)) and the state of functional and cybersecurity of the system (Formula (13)) exceeds the permissible values;
(10)
Fulfillment of clauses 1 to 9 for each unconnected part of the system when it is divided;
(11)
Repeated execution of clauses 6 to 8 in case of failure to fulfill clause 8;
(12)
Execution of steps 1 to 4 in case of successful execution of step 8.
Thus, a method for organizing the functioning of multi-computer systems has been developed, the feature of which was to ensure the ability of systems to independently change their properties, organize elements and components and establish links between them, taking into account the state of functional and cybersecurity, as well as to separate the decision-maker and the center of the system, which made it possible to provide multivariability in processing the response to an event caused by external and internal influences on the system in the corporate network.

3. Case Study

3.1. Methodology

Since the purpose of the work was to improve the decision-making of multi-computer systems with combined antivirus decoys and traps regarding subsequent steps by generating polymorphic responses to events, we will focus the experimental setup on studying the following indicators taking into account the previous experience of using response variants and system functionality:
  • Consideration of the system’s previous operating experience and the use of execution variants when forming polymorphic responses to events;
  • System stability;
  • System responsiveness;
  • System integrity;
  • System security;
  • Evaluation of the adopted decisions.
The indicators for system stability, responsiveness, integrity, and security are generally accepted when studying systems in corporate networks. In particular, the stability criterion will reflect the ability of the system to operate for a long time without significant degradation of its components under external and internal influences. Because the system is distributed, checking the conformity of the responsiveness criterion for decision-making and task execution in the system components and as a whole is an important characteristic. During system operation in a corporate network, the system must maintain its integrity, which is affected not only by the failure of certain components but also by the loss of connections between them. Therefore, ensuring system integrity is an important characteristic in the context of systems’ operation and task performance. The system’s security requires evaluation and consideration because the system is aimed at preventing, detecting, and counteracting malicious software and computer attacks. The values of the indicators for stability, responsiveness, integrity, and security will be defined according to Formula (8) as the criterion values.
Given the specifics of synthesizing multi-computer systems regarding decision-making, it is necessary to study the consideration of the system’s previous operating experience and the use of execution variants when forming polymorphic responses to events. These features in the architecture of the systems should ensure their stable operation and mislead attackers when examining systems in corporate networks. Based on the experiment results, it is necessary to determine the volume of the system’s previous operating experience taken into account and its impact on the change in the variants of task execution by the system. Also, it is necessary to determine the system’s ability to form task execution variants and evaluate them based on the previously accumulated experience of their application.
The decisions adopted by the system and implemented as completed tasks must be evaluated. That is, as a result of the entire experiment, an evaluation of the adopted decisions must be performed. This evaluation will be carried out by the system itself. They will form the prior experience regarding the use of task execution variants and will take into account the indicators of stability, responsiveness, security, and integrity. According to such an evaluation, a forecast of the adopted decisions can be obtained. The evaluation of the task execution variants will be calculated as the value of the evaluation objective function according to Formula (9).
Experimental Setup. To investigate the compliance of the indicators according to the proposed solutions, separate experiments will be conducted with a prototype of the multi-computer system. The experiments will be carried out for two cases: one variant of the system in which a decision-making controller is implemented; and a variant of the system with a single center without a decision-making controller.
In the first case, the system’s center will prepare five task execution variants. After preparation, they will be evaluated by the decision-making controller taking into account the previous experience of their application, and one variant will be chosen.
In the second case, the system’s center will choose one task execution variant. This variant of task execution will always be the same. The remaining execution variants for the same task will not be used. At the end, the chosen task execution variant will be evaluated according to the same criteria, and the value of the evaluation objective function will be calculated each time. In this case, the same set of static data as in the first case will be obtained. They can be compared with regard to the evaluation of the adopted decisions.
In both cases, malicious actions will be repeated—that is, they will be identical. In addition, the system will execute its operational tasks, meaning that the trajectory of its states will be formed based on its operation. With the repetition of malicious actions, an important difference between the first and second cases should be different variants of response and the time intervals between them. These indicators need to be compared for both cases.

3.2. Conducting the Experiment

The description of the system is given in the ref. [4]. The developed system is installed in the computer stations of the corporate network. A distributed architecture was used to combine the components into a cluster. Cluster members exchange messages over the network, maintaining a defined state of the system. Every minute all hosts send messages. The system has components that contain full functionality that allows migration of the system center and the decision controller to ensure the restructuring of the system architecture.
For the experiment, a corporate network was chosen which contains seventy-five computer stations, two servers, a demilitarized zone with four computer stations, and eight segments. The system components were installed on each computer station, i.e., there were seventy-five system components. At the start of the system operation, all computer stations were switched on. During the experiment, in both cases, the number of active computer stations (i.e., the presence of components in the system) changed, but in both cases equally in terms of quantity and time.
Thus, the experiment was conducted in a typical corporate network. The duration of the experiment in the two separate cases was ninety days each. The system’s computed results for the evaluation of the task execution variants along with intermediate data were recorded in a separate log file of the system’s operation. They included the number of components at the current operating time, the component numbers with the center in the current time periods, the task numbers for execution, the variant numbers of task execution.

3.3. Experiment Results

Table 2 presents data as a fragment of the experiment results for the first case and a general summary in Table 3. In Table 2, the following characteristic indicators are collected:
  • Event number requiring the system’s response (column 1);
  • Time of selection of task execution variants for responding to an event (column 2);
  • Task completion time (column 3);
  • Execution time (column 4);
  • Task number that is called upon to respond to the specified event (column 5);
  • Task execution variants determined for processing the event (column 6);
  • Value of the function for the stability criterion (column 7);
  • Value of the function for the responsiveness criterion (column 8);
  • Value of the function for the integrity criterion (column 9);
  • Value of the function for the security criterion (column 10);
  • Value of the evaluation objective function for the task execution variants determined to process the event (column 11);
  • Variant number of the chosen task execution variant (column 12);
  • Repeat number of the task execution variant when processing repeated events over certain time intervals during system operation (column 13);
  • Previous value of the objective function for the same task execution variant that recurred upon repeated occurrence of the same event (column 14);
  • Execution time of the repeated task execution variant on the previous step relative to the current selection of that same variant (column 15);
  • Strategy number applied to the chosen task execution variant (column 16);
  • Rule number applied to the chosen task execution variant (column 17).
In Table 2, a fragment of the system’s operation results is presented, along with the summarized results for all events that occurred during the studied period. Column 5 contains data on the number of task repetitions when they are triggered for event processing. For instance, Task 1 was called 22 times, Task 2—8 times, Task 3—16 times, Task 4—14 times, Task 5—24 times, Task 6—9 times, and Task 7—7 times.
Column 12 provides the variant number approved by the decision-making controller when choosing one of the five variants prepared by the system’s center for selection. That is, for each task, one of the five possible variants is selected.
Columns 13–15 contain information about the previous task execution variants that were already used when the same event occurred during the system’s operation. This information in columns 13–15 is a part of the data on the previous operating experience of the system for making a decision regarding its next step.
Column 17 shows the rule number that was applied for selecting the next task execution variant.
The stability criterion is given by the values in column 7, the responsiveness criterion in column 8, the integrity criterion in column 9, and the security criterion in column 10. The value of the evaluation objective function is given in column 11. According to the values of the objective function for different task execution variants, the decision-making controller selected the variant considering the previous operating experience of the system and the use of execution variants when forming polymorphic responses to events. For example, for step 100, the objective function values for all five variants were different, and the controller selected a value that was neither the smallest nor the largest; the chosen value was 0.0424.
Also, repeated events require the invocation of the same tasks for their processing. Each task has five variants for processing events. The computed values of the objective function at each repeated event step for the same task execution variants are different. For example, in Task 1 the variant numbers repeated (as shown in Table 2) 18 times.
The graphs of the discrete functions for all four criteria (stability, responsiveness, integrity, security) are depicted in Figure 3, Figure 4, Figure 5 and Figure 6 covering the entire system operation period. The criterion function values are indicated by points. Based on them, a theoretical trend curve was determined.
During the system operation, its ability to continue in the conditions of internal and external influences was studied. To research this ability, the entire operating period of the system was divided into five approximately equal intervals. In the first interval, the system operated in a normal mode. In the second interval, an influence was applied to the value of the stability criterion, which was significantly deviated from its normal mode value, i.e., its value was in the critical zone. Similarly, in the following intervals: the third interval—the responsiveness criterion; the fourth interval—the integrity criterion; the fifth interval—the security criterion.
The graph of the objective function for the first case is depicted in Figure 7.
On all graphs (Figure 3, Figure 4, Figure 5, Figure 6 and Figure 7), the largest deviations from zero can be considered as critical values. The larger the values, the more critical the system’s performance. Conversely, if the function values are close to zero, then the system’s operation is better. For each graph based on points from the real experiment, a theoretical trend curve was built for evaluating the system in the next steps and for comparing them with one another.
Comparison of the theoretical trend curves confirms the system’s ability to operate in normal mode regardless of internal and external influences.
In other words, the presence of a decision-making controller, which takes into account the previous operating experience of the system, allows the system to maintain a proper operating state.
Similarly to the first case with the decision-making controller, an experiment was conducted for the second case without the decision-making controller in the system. Table 4 presents data from the experiment results for the second case.
In Table 4, similarly to Table 2, the data is presented in seventeen columns. In Table 4, for each task that can be performed by the system there is only one task execution variant (see Table 5). In the first case (Table 2), there are five such variants for each task.
Similarly to the first case for the second case, graphs of the function for the stability, responsiveness, integrity, and security criteria were constructed and are shown in Figure 8, Figure 9, Figure 10 and Figure 11, respectively. For all criteria, similarly to the first case, the operating period of the system was divided into five-time intervals and influences were introduced for each criterion separately so as to avoid overlapping influences on two or more criteria during the same time period.
This ensured the quality of the experiment. For some criteria, an influence on the parameters of one criterion does lead to an effect on the parameters of another criterion, but such shared parameters are few. Moreover, each criterion was developed taking into account a large number of parameters to avoid high correlation among them. Therefore, the influence on the common parameters is insignificant. This was confirmed by the graphs in Figure 3, Figure 4, Figure 5 and Figure 6. The influence on one criterion in a certain time interval was not visible on the rest of the graphs as a significant deviation from zero.
The results for the second case reflect a deterioration in the function values for the criteria and the objective function in particular.
That is, in the case of the system operating without the decision-making controller and with only one variant chosen for event processing, the system’s performance deteriorates and degrades over a certain period.
The consideration of the previous operating experience of the system when choosing the task execution variants is shown in Table 2, columns 13–15.
For the considered data, the values of the evaluation objective function in the subsequent steps of the system’s operation are less than the value of the previously used variant, which indicates the system’s ability to improve its performance through the consideration of previous operating experience.
General analysis of the experimental results. Thus, it was established that the functioning of the multicomputer system in the first case has improved. This is confirmed by the values of the results of calculating the objective function of evaluating the task execution options. The values of the objective function for the first case are within the interval [0;0.07], which correspond to its target goal. In the second case, the values of the objective function, which are calculated without taking into account the previous experience of the system functioning, for the task execution options without choosing from them, are in the interval [0.12;0.27]. Such values significantly deviate from the target value, which should be close to zero. Also, these values significantly differ from the values for the first case, which is approximately 15 percent. This affects the stability of the system functioning in the second case. The stability of the system in the second case is better.
The previous experience of the system’s functioning in terms of the choice of task execution options is shown in Table 2 in columns 13–15. For the data considered, the value of the evaluation objective function at the next steps of the system’s functioning is less than the value of the previously used option, which indicates the system’s ability to improve its functioning by taking into account the previous experience of functioning.
As a result of the conducted research during the experiment, it was established that the developed analytical expressions for the criteria regarding stability, responsiveness, integrity, security, and the objective function adequately describe the processes and objects in the developed system and can be used for selecting the variants of task execution for evaluating responsiveness, stability, security, and integrity in multi-computer systems and corporate networks.
Table 5 summarizes the indicators from Table 4.
The graph of the objective function for the second case is shown in Figure 12. On Figure 8, Figure 9, Figure 10, Figure 11 and Figure 12, the theoretical trend curve is also shown.

4. Discussion

The method for organizing the operation of multi-computer systems enables the development of deceptive systems that can independently make decisions regarding their subsequent actions and event processing in corporate systems without the involvement of system administrators. The peculiarity of the proposed solution is that the center is divided into two parts. In one part, called the system center, events are processed and the task number that can process the event caused by external and internal influences is determined. In the other part, called the decision-making controller, one of the five task execution variants proposed by the system center is chosen based on the system’s previous operating experience and taking into account various variant selection strategies. This made it possible to develop and implement various response variants by such systems to repeated malicious actions and evaluate their impact on system performance for consideration in subsequent system steps. In addition, this construction in the system architecture is aimed at ensuring the continued stability of its operation.
According to the experimental research, it has been established that the dispersion of deviations between the two experimental cases is approximately 60%. Therefore, the separation of the decision-making controller and the inclusion of previous operating experience in its mechanism provide for improved system performance.

5. Conclusions and Future Research

A formal representation of the system components and their interconnections has been provided, with the system center and decision-making controller being separately identified in the architecture of the multi-computer systems. Analytical expressions for the processes in multi-computer systems, which provide the systems with the ability to independently make decisions regarding the tasks performed, have been obtained.
A method for organizing the operation of the decision-making controller was developed. Its peculiarity is that it ensures the selection of one task execution variant from those prepared and proposed for consideration by the system center, taking into account the system’s previous operating experience, the levels of component security, the number of components, and the connections between them. This made it possible to generate polymorphic responses to events caused by external and internal influences in corporate networks.
A method for organizing the operation of multi-computer systems was developed, which provides the systems with the ability to independently change their properties, organize elements and components, and establish interconnections between them while taking into account the state of functional and cybersecurity. It considers the separation of the decision-making controller and the system center. This ensured multivariant processing in response to events caused by external and internal influences in the corporate network.
Experimental research was conducted with a system prototype in which, in the first case, the decision-making controller and the system center were separated, and in the second case, the decision-making controller was not present. As a result of the experiment, an improvement in the efficiency of the system’s operation in terms of the stability of its functioning under internal and external influences was confirmed.
Future research directions include the development of an architecture for deceptive means that will complement the developed deceptive multi-computer system. These deceptive means will form a network of combined antivirus decoys and traps that will interact closely with protection objects and will operate covertly. All of them will be controlled by the developed deceptive system.

Author Contributions

Conceptualization, A.K., O.S. and A.S.; methodology, A.K., A.N. and A.S.; software, B.S.; validation, A.K., Ł.Ś. and R.R.; formal analysis, A.K., Ł.Ś. and R.R.; investigation, A.K.; resources, A.K.; data curation, A.K.; writing—original draft preparation, A.K. and S.L.; writing—review and editing, A.K. and S.L.; visualization, S.L.; supervision, O.S. and S.L.; project administration, A.K., O.S. and S.L.; funding acquisition, Ł.Ś. and R.R. All authors have read and agreed to the published version of the manuscript.

Funding

This research received no external funding.

Institutional Review Board Statement

Not applicable.

Informed Consent Statement

Not applicable.

Data Availability Statement

The dataset used for this study is publicly available at [3,4,5].

Conflicts of Interest

The authors declare no conflicts of interest.

Abbreviations

The following denominations and meaning are used in this manuscript:
DenominationMeaning
M p z S set of system tasks
M v v p m p z , i S Set of potential options for the implementation of the I task
K v v z S the total number of all options for performing all tasks by the system
v m j m p z , i S p d v z a vector of previous experience in using a task execution option, which is given for each task from a set of tasks by a set of potential task options M p z S M v v p m p z , i S
M v M v v p m p z , i S p d v z p d v z set of vectors of options for performing the -that task i m p z , i S
M v M v v p m p z S p d v z p d v z a set of previous experience in using all the options that are given for each task from the set of tasks M p z S
F k r m p z , i S target function for evaluating options for completing tasks
f j , k r m p z , i S Definition of criterion i
M k o m p f b k b a set of indicators that characterize the functional and cybersecurity of computer stations and system components in them
M f f b k b a set of functions to determine the level of functional and cybersecurity of a computer station and the components of the system in it
p n S Determining the values of functions from the set M f f b k b
v t p n S vector of functional and cybersecurity levels of all components
v t S Functional and Cybersecurity Status Vector of the System
v z S Vector of the level of communication between components in the system
v t z n S completeness vector of the relationship representation for each component
v t , z z n S vector for determining the completeness of connections, in which will be reflected by the coordinates of the values that will express the ratio of the existing connections of the th component to the number of connections determined for it by the system p z i S i S
S k o n t r S A set of strategies for choosing the next option for the task of the decision controller
P s t r 1 , , , , P s t r 21 P s t r 22 P s t r 23 P s t r 3 Designation of rules
v t , s t , k S vector characteristics of the system during the entire time of its operation according to the definition of all vectors
v T , s t , k S vector characteristics of the system during the entire time of its operation according to the definition of all vectors
v T , k , i S vector (—number of components) functioning of components during the entire time of system operation i i
M T , k S matrix of the extreme time spent establishing communication between two components of the system
M T , k , s S Matrix of the average time taken to establish communication between two components of the system

References

  1. Breeden, J. 5 Top Deception Tools and How They Ensnare Attackers. CSO Online 2025. Retrieved 6 February 2025. Available online: https://www.csoonline.com/article/570063/5-top-deception-tools-and-how-they-ensnare-attackers.html (accessed on 12 September 2025).
  2. Labyrinth Deception Platform. Labyrinth Tech 2025. Retrieved 6 February 2025. Available online: https://labyrinth.tech/platform (accessed on 12 September 2025).
  3. Kashtalian, A.; Lysenko, S.; Savenko, B.; Sochor, T.; Kysil, T. Principle and method of deception systems synthesizing for malware and computer attacks detection. Radioelectron. Comput. Syst. 2023, 4, 112–151. [Google Scholar] [CrossRef]
  4. Kashtalian, A.; Lysenko, S.; Savenko, O.; Nicheporuk, A.; Sochor, T.; Avsiyevych, V. Multi-computer malware detection systems with metamorphic functionality. Radioelectron. Comput. Syst. 2024, 2024, 152–175. [Google Scholar] [CrossRef]
  5. Savenko, B.; Kashtalian, A.; Lysenko, S.; Savenko, O. Malware detection by distributed systems with partial centralization. In Proceedings of the 2023 IEEE 12th International Conference on Intelligent Data Acquisition and Advanced Computing Systems: Technology and Applications (IDAACS), Dortmund, Germany, 7–9 September 2023; pp. 265–270. [Google Scholar] [CrossRef]
  6. Proofpoint Identity Threat Defense. Proofpoint 2025. Retrieved 6 February 2025. Available online: https://www.proofpoint.com/us/illusive-is-now-proofpoint (accessed on 12 September 2025).
  7. The Commvault Data Protection Platform. Commvault 2025. Retrieved 6 February 2025. Available online: https://www.commvault.com/ (accessed on 12 September 2025).
  8. SentinelOne. SentinelOne 2025. Retrieved 6 February 2025. Available online: https://www.sentinelone.com/surfaces/identity/ (accessed on 12 September 2025).
  9. Counter Craft Security. CounterCraft 2025. Retrieved 26 January 2025. Available online: https://www.countercraftsec.com/ (accessed on 12 September 2025).
  10. Fidelis Security. Fidelis Security 2025. Retrieved 6 February 2025. Available online: https://fidelissecurity.com/fidelis-elevate/ (accessed on 12 September 2025).
  11. Acosta, J.C.; Basak, A.; Kiekintveld, C.; Kamhoua, C. Lightweight on-demand honeypot deployment for cyber deception. Lect. Notes Inst. Comput. Sci. Soc. Inform. Telecommun. Eng. 2022, 441, 294–312. [Google Scholar] [CrossRef]
  12. Katakwar, H.; Aggarwal, P.; Maqbool, Z.; Dutt, V. Influence of network size on adversarial decisions in a deception game involving honeypots. Front. Psychol. 2020, 11, 535803. [Google Scholar] [CrossRef]
  13. Anwar, A.H.; Zhu, M.; Wan, Z.; Cho, J.-H.; Kamhoua, C.A.; Singh, M.P. Honeypot-based cyber deception against malicious reconnaissance via hypergame theory. In Proceedings of the IEEE GLOBECOM, Rio de Janeiro, Brazil, 4–8 December 2022; pp. 3393–3398. [Google Scholar] [CrossRef]
  14. Wang, H.; Wu, B. SDN-based hybrid honeypot for attack capture. In Proceedings of the 2019 IEEE 3rd Information Technology, Networking, Electronic and Automation Control Conference (ITNEC), Chengdu, China, 15–17 March 2019; pp. 1602–1606. [Google Scholar] [CrossRef]
  15. Zhang, L.; Thing, V.L.L. Three decades of deception techniques in active cyber defense—Retrospect and outlook. Comput. Secur. 2021, 106, 102288. [Google Scholar] [CrossRef]
  16. Oluoha, U.O.; Yange, T.S.; Okereke, G.E.; Bakpo, F.S. Cutting edge trends in deception-based intrusion detection systems—A survey. J. Inf. Secur. 2021, 12, 250–269. [Google Scholar] [CrossRef]
  17. Han, X.; Kheir, N.; Balzarotti, D. Deception techniques in computer security. ACM Comput. Surv. (CSUR) 2018, 51, 1–36. [Google Scholar] [CrossRef]
  18. Trassare, S.T. A Technique for Presenting a Deceptive Dynamic Network Topology. Semantic Scholar 2023. Available online: https://www.semanticscholar.org/paper/A-Technique-for-Presenting-a-Deceptive-Dynamic-Trassare-Monterey/2d976496fff27f6b7d3fdd4076a353070be12342 (accessed on 12 September 2025).
  19. Sharma, S.; Kaul, A. A survey on intrusion detection systems and honeypot-based proactive security mechanisms in VANETs and VANET Cloud. Veh. Commun. 2018, 12, 138–164. [Google Scholar] [CrossRef]
  20. Baykara, M.; Das, R. A novel honeypot-based security approach for real-time intrusion detection and prevention systems. J. Inf. Secur. Appl. 2018, 41, 103–116. [Google Scholar] [CrossRef]
  21. Rajendran, P.; Thakur, R.S. Design and implementation of intelligent security framework using hybrid intrusion detection and prevention system. Comput. Electr. Eng. 2016, 56, 456–473. [Google Scholar]
  22. Parveen, S.; Khan, M.A.; Mirza, A.H. A comprehensive survey of honeypot-based cybersecurity threat detection and mitigation tools: A taxonomy and future directions. J. Netw. Comput. Appl. 2021, 182, 103036. [Google Scholar]
  23. Zhu, Y.; Yu, L.; Liu, Y.; Xu, Z. Honeypot-based moving target defense mechanism for industrial internet of things. IEEE Trans. Ind. Inform. 2023, 19, 2174–2183. [Google Scholar]
  24. Mitchell, R.; Chen, R. A survey of intrusion detection techniques for cyber-physical systems. ACM Comput. Surv. (CSUR) 2014, 46, 55. [Google Scholar] [CrossRef]
  25. Zarpelão, J.; Miani, R.; Kawakani, C.; de Alvarenga, S. A survey of intrusion detection in Internet of Things. J. Netw. Comput. Appl. 2017, 84, 25–37. [Google Scholar] [CrossRef]
  26. Modi, K.; Patel, U.; Borisaniya, B.; Patel, A.; Rajarajan, M. A survey of intrusion detection techniques in cloud. J. Netw. Comput. Appl. 2013, 36, 42–57. [Google Scholar] [CrossRef]
  27. Modi, S.; Dave, V.; Shinde, S. A survey of intrusion detection techniques using machine learning. Int. J. Sci. Res. Comput. Sci. Eng. Inf. Technol. 2018, 3, 670–675. [Google Scholar]
  28. Zhang, Y.; Zheng, Z.; Chen, X. A survey on anomaly detection methods in industrial control systems. Comput. Secur. 2021, 106, 102280. [Google Scholar]
  29. Scalas, M.; Gasparini, M.; Cencetti, G.; Bondavalli, A. A review of anomaly detection systems in networked embedded systems. Sensors 2020, 20, 6490. [Google Scholar]
  30. Jalowski, Ł.; Zmuda, M.; Rawski, M. A Survey on Moving Target Defense for Networks: A Practical View. Electronics 2022, 11, 2886. [Google Scholar] [CrossRef]
  31. Vakilinia, A.; Sharif, R.; Liu, D. Modeling and analysis of deception games using dynamic Bayesian networks. In Proceedings of the 2017 IEEE 2nd International Conference on Connected and Autonomous Driving (MetroCAD), Brussels, Belgium, 3–4 April 2017; pp. 86–91. [Google Scholar]
  32. Wu, K.; Tan, L.; Xia, Y.; Xie, M. Cyber deception-based defense against DDoS attack: A game theoretical approach. Comput. Secur. 2019, 87, 101580. [Google Scholar]
  33. Liang, X.; Xiao, Y. Game theory for network security. IEEE Commun. Surv. Tutor. 2013, 15, 472–486. [Google Scholar] [CrossRef]
  34. Morić, Z.; Dakić, V.; Regvart, D. Advancing Cybersecurity with Honeypots and Deception Strategies. Informatics 2025, 12, 14. [Google Scholar] [CrossRef]
  35. Liu, C.; Wang, W.; Zhang, Y.; Chen, J.; Guan, X. Moving target defense for web applications using Bayesian Stackelberg game model. Comput. Netw. 2022, 209, 108914. [Google Scholar]
  36. Hu, H.; Cao, L.; Liu, Y.; Wang, J. Defending against DDoS attacks based on cyber deception and game theory. IEEE Access 2020, 8, 170174–170184. [Google Scholar]
  37. Fu, X.; Qin, Y.; Yang, B. Cyber deception-based DDoS defense mechanism using Bayesian game theory. J. Netw. Comput. Appl. 2021, 177, 102949. [Google Scholar]
  38. Naghmouchi, M.; Boudriga, H.; Laurent, M. Cyber deception and defense modeling in a cloud environment: A game-theoretic approach. In Proceedings of the 2019 International Conference on Cyber Security and Protection of Digital Services (Cyber Security), Oxford, UK, 3–4 June 2019; pp. 1–6. [Google Scholar]
  39. Han, Z.; Marina, N.; Debbah, M.; Hjørungnes, A. Game Theory in Wireless and Communication Networks: Theory, Models, and Applications; Cambridge University Press: Cambridge, UK, 2011. [Google Scholar] [CrossRef]
  40. Alpcan, T.; Başar, T. Network Security: A Decision and Game Theoretic Approach. Cambridge University Press: Cambridge, UK, 2010; p. 332. [Google Scholar]
  41. Manshaei, M.; Zhu, Q.; Alpcan, T.; Başar, T.; Jean-Pierre, H. Game theory meets network security and privacy. ACM Comput. Surv. (CSUR) 2013, 45, 25. [Google Scholar] [CrossRef]
  42. QLiu, C.; Li, X. Game-theoretic analysis of cyber deception: Evidence-based strategies and implications. IEEE Access 2018, 6, 60101–60110. [Google Scholar]
  43. Yang, K.; Wu, H.; Sun, J. A survey on cyber deception: Motivation, taxonomy, and challenges. IEEE Access 2020, 8, 229555–229578. [Google Scholar]
  44. Wang, Y.; Liu, X.; Yu, X. Research on Joint Game-Theoretic Modeling of Network Attack and Defense Under Incomplete Information. Entropy 2025, 27, 892. [Google Scholar] [CrossRef]
  45. Kashtalian, A.; Lysenko, S.; Sachenko, A.; Savenko, B.; Savenko, O.; Nicheporuk, A. Evaluation criteria of centralization options in the architecture of multicomputer systems with traps and baits. Radioelectron. Comput. Syst. 2025, 1, 264–297. [Google Scholar] [CrossRef]
  46. Kashtalian, A.; Lysenko, S.; Kysil, T.; Sachenko, A.; Savenko, O.; Savenko, B. Method and Rules for Determining the Next Centralization Option in Multicomputer System Architecture. Int. J. Comput. 2025, 24, 35–51. [Google Scholar] [CrossRef]
  47. Savenko, O.; Sachenko, A.; Lysenko, S.; Markowsky, G.; Vasylkiv, N. Botnet detection approach based on the distributed systems. Int. J. Comput. 2020, 19, 190–198. [Google Scholar] [CrossRef]
  48. Anđelić, N.; Baressi Šegota, S.; Car, Z. Improvement of Malicious Software Detection Accuracy through Genetic Programming Symbolic Classifier with Application of Dataset Oversampling Techniques. Computers 2023, 12, 242. [Google Scholar] [CrossRef]
  49. Kamdan; Pratama, Y.; Munzi, R.S.; Mustafa, A.B.; Kharisma, I.L. Static Malware Detection and Classification Using Machine Learning: A Random Forest Approach. Eng. Proc. 2025, 107, 76. [Google Scholar] [CrossRef]
  50. Wang, P.; Li, H.-C.; Lin, H.-C.; Lin, W.-H.; Xie, N.-Z. A Transductive Zero-Shot Learning Framework for Ransomware Detection Using Malware Knowledge Graphs. Information 2025, 16, 458. [Google Scholar] [CrossRef]
  51. Alshomrani, M.; Albeshri, A.; Alturki, B.; Alallah, F.S.; Alsulami, A.A. Survey of Transformer-Based Malicious Software Detection Systems. Electronics 2024, 13, 4677. [Google Scholar] [CrossRef]
  52. Gyamfi, N.K.; Goranin, N.; Ceponis, D.; Čenys, H.A. Automated System-Level Malware Detection Using Machine Learning: A Comprehensive Review. Appl. Sci. 2023, 13, 11908. [Google Scholar] [CrossRef]
  53. Komar, M.; Golovko, V.; Sachenko, A.; Bezobrazov, S. Intelligent system for detection of networking intrusion. In Proceedings of the 6th IEEE International Conference on Intelligent Data Acquisition and Advanced Computing Systems, Prague, Czech Republic, 15–17 September 2011; pp. 374–377. [Google Scholar] [CrossRef]
  54. Balyk, A.; Karpinski, M.; Naglik, A.; Shangytbayeva, G.; Romanets, I. Using Graphic Network Simulator 3 for Ddos Attacks Simulation. Int. J. Comput. 2017, 16, 219–225. [Google Scholar] [CrossRef]
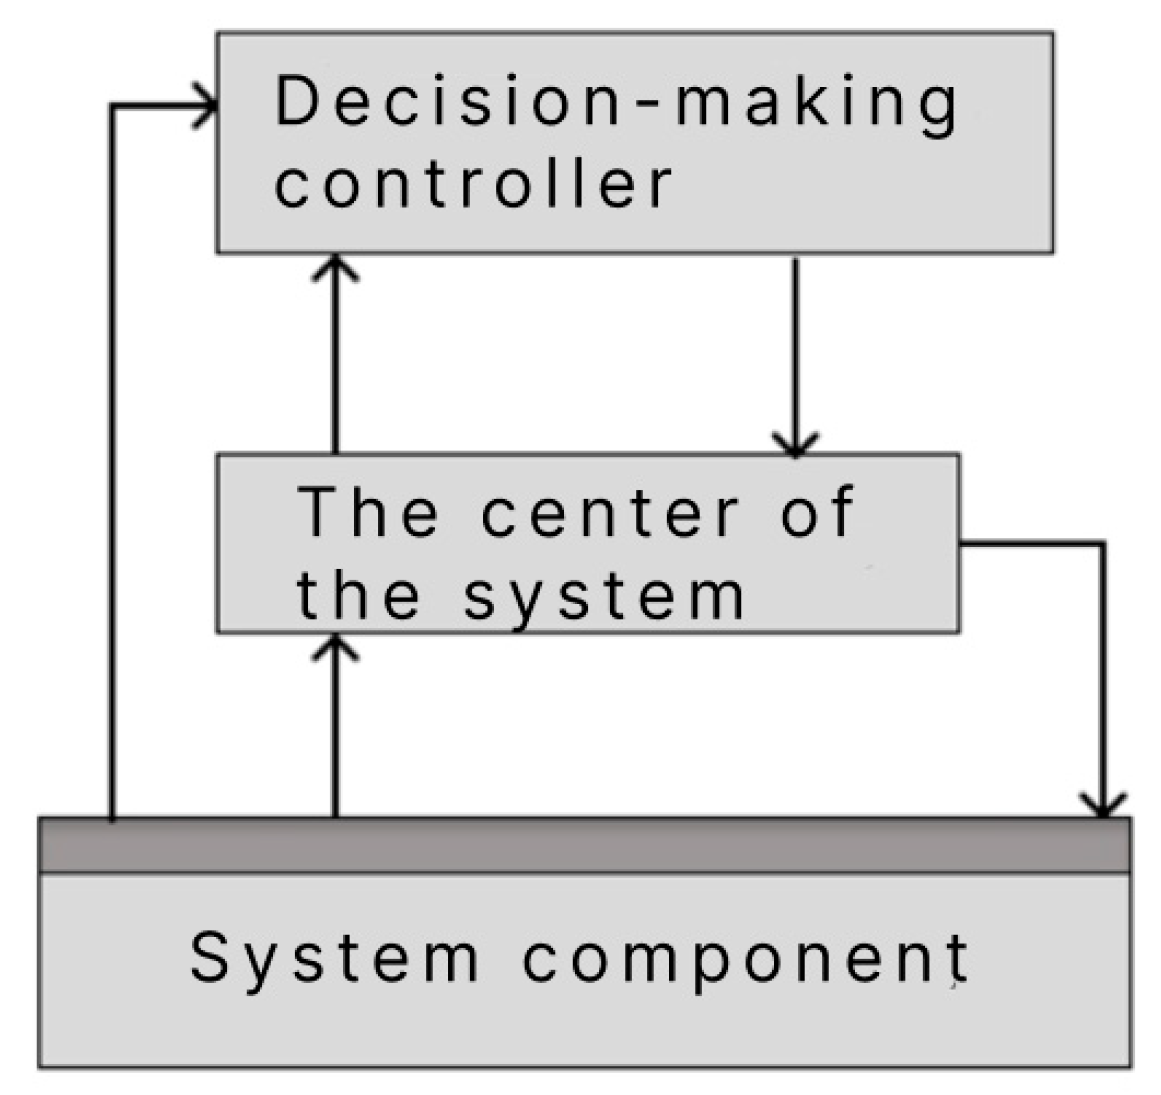
Figure 1. Scheme of interaction between the decision controller and the system center.
Applsci 15 12286 g001
Figure 2. Scheme of input data supply to the decision controller.
Applsci 15 12286 g002
Figure 3. Graph of the function for the stability criterion.
Applsci 15 12286 g003
Figure 4. Graph of the function for the responsiveness criterion for the first case.
Applsci 15 12286 g004
Figure 5. Graph of the function for the integrity criterion for the first case.
Applsci 15 12286 g005
Figure 6. Graph of the function for the security criterion for the first case.
Applsci 15 12286 g006
Figure 7. Graph of the objective function for the first case.
Applsci 15 12286 g007
Figure 8. Graph of the function for the stability criterion for the second case.
Applsci 15 12286 g008
Figure 9. Graph of the function for the responsiveness criterion for the second case.
Applsci 15 12286 g009
Figure 10. Graph of the function for the integrity criterion for the second case.
Applsci 15 12286 g010
Figure 11. Graph of the function for the security criterion for the second case.
Applsci 15 12286 g011
Figure 12. Graph of the objective function for the second case.
Applsci 15 12286 g012
Table 1. Connection: features of deception technologies in works [3,4,5,6,7,8,9,10,11,12,13,14,15,16,17,18,19,20,21,22,23,24,25,26,27,28,29,30,31,32,33,34,35,36,37,38,39,40,41,42,43,44,45,46,47,48,49,50,51,52,53].
No. s/pFeatures of Deception TechnologiesSource
common network technologies that are implemented in deception systems[1,2,13,16,17,25,27,28,33,36,37,39,44,45,46,51,52,53]
Use of historical data in deception systems[3,4]
providing different options for responding to repetitive actions of intruders in the architecture of systems[3,4]
providing polymorphic responses to repetitive actions of intruders in the architecture of systems[3]
use of deceptive systems of baits and traps[3]
imitation of services and context of the real part of the network[2]
Dynamic traffic redirection[11,23,38]
using the game of deception[12,50]
combined lures (high and low levels of interaction)[14,19,20]
protection of moving targets[15]
Misleading topology[18]
Industrial Control Systems Baits[21,26,35,41]
virtual network for each host of the corporate network[24,31,34]
Intelligent decoy network based on software-configured networks[30]
Containerization Techniques for Dynamically Creating Decoy Networks[32]
web-based cyber deception system (based on Docker)[40,43]
Automated decoy network deployment system for active protection of container-based cloud environments[42]
Table 2. Fragment of the experiment results for the first case.
Time for Choosing Options for Completing Tasks, sTask Completion Time, sExecution Time, sTask NumberOptions for Completing the Task Criterion   f j , k r m p z , i S The Importance of the target
Assessment Function F k r m p z , i S
Option Number 1–5Variant Replay NumberPrevious Value of the Target FunctionExecution TimeStrategyRule
System StabilitySystem ResponsivenessSystem IntegritySystem Security
1234567891011121314151617
10.1540.5990.445110.00030.06570.04840.01490.032381.1
0.1900.3460.15620.02940.03910.00110.04290.028153.1
0.1560.5680.41230.06720.02940.02890.05510.0451342.3
0.1680.3630.19540.06960.06330.01610.00560.0386112.3
0.1530.3500.19750.04020.02340.01620.06250.035622.2
340.1360.5930.457310.02940.05630.03530.04180.04070.02810.22632.1
0.1540.5190.36520.01810.03040.00310.02260.018520.03980.30362.2
0.1270.5590.43230.01430.01540.02370.03680.022630.04270.17342.3
0.1840.4730.28940.04370.00050.06730.03900.03760.02380.35082.3
0.1470.4360.28950.04970.02270.00900.04190.03080.03640.40842.3
1000.1430.5450.402710.05360.04370.03520.03710.042410.02430.263143.1
0.1020.4600.35820.03000.03970.04730.06700.04600.01070.34681.1
0.1660.5490.38330.00110.00290.05630.01520.01880.03080.39552.2
0.1040.3670.26340.05030.01130.05800.01220.033040.03050.17711.1
0.1340.4350.30150.05250.00140.03550.00820.02440.03300.21532.3
Table 3. Generalized indicators from Table 2.
Average Execution Time, sTask Number-NumberAverage Value of StabilityAverage Value of EfficiencyAverage Value of IntegrityAverage Value of SecurityAverage Value of Objective FunctionVariant Number 1–5Repeat Number of the VariantNumber of Selected RulesNumber of Selected Strategies -Number
1561–22
2–8
3–16
4–14
5–24
6–9
7–7
6-3-5-2-6
0-3-1-2-2
4-1-6-3-2
5-2-0-4-3
7-3-5-2-7
1-3-1-1-3
0-2-1-3-1
0.06830.03680.03890.03610.03591–18
2–22
3–35
4–5
5–20
1–18
2–22
3–34
4–5
5–20
1–47
2–33
3–39
4–28
5–42
6–55
7–36
8–31
9–24
10–38
11–41
12–29
13–19
14–37
Note: the record format 1-2-3-4-5 means for the i-th task the distribution of the number of selected options 1,…,5 in this task.
Table 4. Fragment of the experiment results for the second case.
Time to Choose Options for Completing Tasks, sTime to Complete Tasks, sTime of Execution, sTask Number, sOptions for Completing a Task
Criterion   f j , k r m p z , i S
The   Value   of   the   Evaluation   Objective   Function   F k r m p z , i S
Variant Number 1–5Variant Repeat NumberPrevious Value of the Objective FunctionExecution TimeStrategyRule
System StabilitySystem ResponsivenessSystem IntegritySystem Security
1234567891011121314151617
10.1090.3120.203110.19010.24630.12560.17270.1837142.1
340.1450.3170.172610.20240.12070.19320.19800.1786110.173337.8122.1
1000.1560.4710.315710.21640.15720.16590.25360.1983110.122734.163.1
Table 5. Generalized indicators in Table 4.
Average Execution Time, sTask NumberAverage Value of StabilityAverage Value of EfficiencyAverage Value of IntegrityAverage Value of SafetyAverage Value of Objective FunctionVariant Number 1–5Variant Repetition NumberNumber of Selected RulesNumber of Selected Strategies
0.2481–18
2–12
3–15
4–13
5–20
6–11
7–11
0.20490.19660.19640.19160.19741–1001–991–8
2–6
3–9
4–4
5–7
6–10
7–8
8–6
9–4
10–7
11–9
12–5
13–3
14–13
1.1–13
2.1–11
2.2–14
2.3–9
3.1–16
3.2–37
Disclaimer/Publisher’s Note: The statements, opinions and data contained in all publications are solely those of the individual author(s) and contributor(s) and not of MDPI and/or the editor(s). MDPI and/or the editor(s) disclaim responsibility for any injury to people or property resulting from any ideas, methods, instructions or products referred to in the content.