Systematic Review

Artificial Intelligence Algorithms for Epiretinal Membrane Detection, Segmentation and Postoperative BCVA Prediction: A Systematic Review and Meta-Analysis

by
Eirini Maliagkani
1,†,
Petroula Mitri
1,†,
Dimitra Mitsopoulou
2,
Andreas Katsimpris
3,
Ioannis D. Apostolopoulos
4,
Athanasia Sandali
5,
Konstantinos Tyrlis
1,
Nikolaos Papandrianos
6,* and
Ilias Georgalas
1
1
1st Department of Ophthalmology, National and Kapodistrian University of Athens, G. Gennimatas General Hospital of Athens, 11527 Athens, Greece
2
Eye Unit, University Hospital Southampton, Southampton SO16 6HU, UK
3
Princess Alexandra Eye Pavilion, University of Edinburgh, Edinburgh EH3 9HA, UK
4
ACTA Lab, Department of Energy Systems, University of Thessaly, Gaiopolis Campus, 41500 Larisa, Greece
5
Department of Medicine, Aristotle University of Thessaloniki, 54124 Thessaloniki, Greece
6
Department of Energy Systems, University of Thessaly, Gaiopolis Campus, 41500 Larisa, Greece
*
Author to whom correspondence should be addressed.
These authors contributed equally to this work.
Appl. Sci. 2025, 15(22), 12280; https://doi.org/10.3390/app152212280
Submission received: 17 October 2025 / Revised: 12 November 2025 / Accepted: 18 November 2025 / Published: 19 November 2025

Abstract

Epiretinal membrane (ERM) is a common retinal pathology associated with progressive visual impairment, requiring timely and accurate assessment. Recent advances in artificial intelligence (AI) have enabled automated approaches for ERM detection, segmentation, and postoperative best corrected visual acuity (BCVA) prediction, offering promising avenues to enhance clinical efficiency and diagnostic precision. We conducted a comprehensive literature search across MEDLINE (via PubMed), Scopus, CENTRAL, ClinicalTrials.gov, and Google Scholar from the inception to 31 December 2023. A total of 42 studies were included in the systematic review, with 16 eligible for meta-analysis. Risk of bias and reporting quality were assessed using the QUADAS-2 and CLAIM tools. Meta-analysis of 16 studies (533,674 images) showed that deep learning (DL) models achieved high diagnostic accuracy (AUC = 0.97), with pooled sensitivity and specificity of 0.93 and 0.97, respectively. Optical coherence tomography (OCT)-based models outperformed fundus-based ones, and although performance remained high under external validation, the positive predictive value (PPV) declined—highlighting the importance of testing model generalizability. To the best of our knowledge, this is the first systematic review and meta-analysis to critically evaluate the role of AI in the detection, segmentation, and postoperative BCVA prediction of ERM across various ophthalmic imaging modalities. Our findings provide a clear overview of current evidence supporting the continued development and clinical adoption of AI tools for ERM diagnosis and management.

1. Introduction

Epiretinal membrane (ERM), alternatively known as cellophane maculopathy or macular pucker, can be defined as a thin, semi-transparent layer of avascular tissue that covers the retina’s inner surface, overlying the internal limiting membrane (ILM), mainly in the macula area [1]. The presenting symptoms usually include distorted central vision, such as metamorphopsias, which worsen as the thickness and contractility of the ERM increase [2]. The prevalence of ERM ranges between 6% and 11.8% in Western populations and 2.2% to 7.9% in Asian populations [3], with increasing age being the most important risk factor [4]. Although the majority of the patients with ERM remain asymptomatic and no intervention is required, surgical treatment, such as pars plana vitrectomy with ERM and ILM peeling, may be required in cases of significant visual impairment affecting quality of life [3].
ERMs are typically classified as either idiopathic or secondary, with the former being more common in adults over 50 years old, and the latter developing following inflammation, trauma, or previous surgery [5]. The main pathophysiological mechanism of ERM development involves the transdifferentiation of precursor cells, such as retinal glial cells, hyalocytes, retinal pigment epithelial (RPE) cells, and fibroblasts, into myofibroblasts. These transdifferentiated cells migrate to the inner retinal surface and secrete an extracellular matrix containing collagens I–VI [4].
Despite the high prevalence of ERM, diagnosis, monitoring, and management remain challenging. Technological advances in ophthalmic imaging techniques, including optical coherence tomography (OCT) and fundus photography, have contributed to the early diagnosis and monitoring of ERM. OCT is a non-contact, non-invasive imaging technique that generates cross-sectional tissue images of high resolution, enabling detailed visualization of all retinal layers and macular architecture. The ERM on OCT appears either as irregular wrinkling on the retinal surface or as a hyperreflective layer beneath the ILM [6]. Another advantage of OCT is the ability to assess features that could be used as prognostic factors of postoperative visual outcomes, including the central foveal thickness, the integrity of the ellipsoid zone and cone outer segment, the photoreceptor outer segment length, and the integrity of RPE [7]. Therefore, OCT is considered the gold standard for ERM diagnosis and for monitoring disease progression and postoperative outcomes. Another useful imaging modality that demonstrates retinal abnormalities in two dimensions is fundus photography. It is useful in identifying ERM characteristics, such as retinal folds, although it lacks the detailed structural analysis provided by OCT [8].
In recent years, artificial intelligence (AI) has introduced a new era in healthcare through early disease detection, personalized treatment planning, and predictive analytics. Advances in Deep Learning (DL) and the availability of large datasets have enabled AI to enhance medical imaging in various specialties, including Ophthalmology [9]. In this field, AI applications have been developed for the diagnosis and management of retinal disorders, ocular surface diseases, and glaucoma [10]. Modern AI algorithms are computational mathematical models that learn from data samples to recognize patterns. By training on the datasets provided, these algorithms adjust their parameters to predict outcomes or categorize new data based on previously observed patterns [11]. Machine learning (ML)—a subfield of AI—as well as DL and convolutional neural networks (CNNs), have gained significant attention over the past decade. CNN is an advanced type of artificial neural network (ANN) architecture that automatically extracts features from the input images. DL architectures, such as CNNs, excel in complex image analysis tasks because they have the capacity to recognize and generate images by combining convolutional, attention, and pooling layers to hierarchically detect and extract image features. Consequently, their application in medical imaging can assist in the diagnosis of many diseases [12].
The selection and the quality of the datasets used for the development of AI models are of paramount importance. Diverse and large datasets are necessary for robust training and evaluation of AI models. In the literature, publicly available datasets such as MESSIDOR, OCTID, and the RFMiD are widely used in retinal image analysis. In addition to internal validation datasets, external validation has been advocated as necessary and may improve the validity of the model, as it demonstrates higher methodological rigor and is more likely to produce clinically generalizable results [13].
In this systematic review, we summarize the current applications of AI in ERM assessment and quantify the performance of AI models. To the best of our knowledge, this is the first review to examine AI applications in ERM diagnosis, segmentation, and postoperative best corrected visual acuity (BCVA) prediction, providing a broad perspective on AI’s role in ERM management. To complement this review, we also conducted a meta-analysis to quantitatively synthesize the diagnostic performance of AI models for ERM detection across different imaging modalities and validation strategies. While current results are promising, further research is needed to enhance model performance and address existing limitations.

2. Materials and Methods

2.1. Eligibility Criteria

This systematic review and meta-analysis were aligned with Preferred Reporting Items for Systematic Reviews and Meta-Analyses (PRISMA) recommendations [14], with the PRISMA checklist provided in Supplementary Table S1. To clarify the research question and define the inclusion and exclusion criteria, a protocol was developed based on the Population, Intervention, Comparison, Outcomes, and Study Design (PICOS) framework [15] and was registered in the International Prospective Register of Systematic Reviews (PROSPERO; registration number CRD42024495723). This review included studies that used OCT or fundus images from adult human participants, applying AI techniques for ERM detection, segmentation, and postoperative BCVA prediction. Commonly used metrics to report the effectiveness and performance of the AI-based models included accuracy, specificity, sensitivity, positive predictive value (PPV), negative predictive value (NPV), F1 score, Dice coefficient, and the area under the receiver operating characteristic (ROC) curve (AUC). Systematic reviews, meta-analyses, narrative reviews, scoping reviews, opinion pieces, surveys, editorials, commentary letters, case reports, book chapters, conference abstracts, animal or in vitro studies, studies in children and adolescents, and non-English articles were excluded. Preprints and non-peer-reviewed studies were also excluded. No specific comparator was used, as the review included multiple AI systems for ERM evaluation.

2.2. Information Sources, Search Strategy and Study Selection

The systematic literature search on Medline (via Pubmed), Scopus, CENTRAL databases, ClinicalTrials.gov, World Health Organization’s (WHO) International Clinical Trials Registry Platform (ICTRP) and Google Scholar was conducted up to 31 December 2023. All retrieved articles were imported into EndNote (Clarivate PLC, London, UK), which was used for the initial screening phase, primarily to remove duplicates. Two independent authors (D.M. and P.M.) screened titles and abstracts for eligibility, with discrepancies resolved by consensus after discussion. Full-text screening was also performed independently by the same reviewers (D.M. and P.M.), and only reports without overlapping populations were included. Disagreements were resolved by a third reviewer (E.M.). A snowball search was not conducted.

2.3. Data Extraction

Data extraction was performed by two independent authors (D.M. and P.M.) using a predefined Microsoft Excel spreadsheet. Each study was reviewed, and a customized form was completed with the corresponding predefined data. Specifically, extracted data included study details (author, year, country); dataset and annotation methods (disease type, dataset source, imaging modality, sample size, reference standard); AI model characteristics and validation strategy (AI task, AI type, AI architecture, explainable AI (XAI), internal validation method, external validation); and model performance evaluation metrics (accuracy, specificity, sensitivity, PPV, NPV, AUC for both internal and external test sets). Disagreements regarding the extracted items were resolved by a senior reviewer (E.M.).

2.4. Quality Assessment

The Quality Assessment of Diagnostic Accuracy Studies (QUADAS-2) [16] and the Checklist for Artificial Intelligence in Medical Imaging (CLAIM) [17] tools were used to assess the risk of bias in the included studies, following full-text screening. QUADAS-2 is an 18-item scale divided into four categorical criteria: patient selection, index test, reference standard, and flow and timing. Each domain is evaluated for risk of bias, with the first three domains also assessed for applicability concerns. The CLAIM checklist consists of a structured set of 44 items designed to evaluate the completeness and transparency of claims made in the studies. The combination of these tools facilitated a reliable and standardized evaluation of study quality. Two reviewers (P.M. and A.S.) performed the quality assessment independently, and any conflicts were resolved through consensus with a senior investigator (E.M.).

2.5. Statistical Analysis

We performed a meta-analysis to quantify the diagnostic performance of DL algorithms for the detection of ERM. For every included study, we reconstructed the 2 × 2 contingency table of true positives (TP), false positives (FP), true negatives (TN), and false negatives (FN). From these data, we calculated study-specific sensitivity, specificity, PPV, NPV, accuracy, and the diagnostic odds ratio (DOR).
Pooled point estimates and 95% confidence intervals (CIs) were derived using a random-effects logistic regression model for proportions, fitted on the logit scale. This bivariate random-effects model accounts for both within- and between-study variability. For the DOR, we used a random-effects inverse-variance model with restricted maximum likelihood estimation. Between-study heterogeneity was evaluated using τ2 (tau-squared) and the I2 statistic. An I2 value between 25% and 50% was interpreted as indicating low to moderate heterogeneity, whereas values exceeding 75% reflected substantial heterogeneity.
To evaluate global diagnostic performance, we constructed a hierarchical summary receiver operating characteristic (SROC) curve. We report the AUC as well as the normalized partial AUC (pAUC), which restricts the analysis to the observed range of false-positive rates.
Subgroup analyses were pre-specified to explore potential sources of heterogeneity. These included a comparison of studies based on imaging modality (fundus photography versus OCT) and an assessment of whether the DL models were evaluated using external validation datasets versus internal-only evaluations.
All analyses were conducted in R (v4.4.0; R Core Team 2024) using the mada and metafor packages. A two-sided p-value of less than 0.05 was considered statistically significant.

3. Results

3.1. Study Selection

We conducted a systematic search of the literature using a predefined search strategy from the inception to 31 December 2023 (Figure 1). The database search identified 468 citations: PubMed (n = 76), Scopus (n = 392), Central (n = 6), ClinicalTrials (n = 1), and WHO ICTRP (n = 1). After automatic duplicate removal by EndNote, 402 citations remained for title and abstract screening. Of these, 337 were excluded by the two authors (D.M. and P.M.), leaving 65 studies for full-text screening. A supplementary gray literature search using Google Scholar identified an additional 179 citations. Finally, following double independent full-text screening, 42 studies [1,2,5,6,7,10,18,19,20,21,22,23,24,25,26,27,28,29,30,31,32,33,34,35,36,37,38,39,40,41,42,43,44,45,46,47,48,49,50,51,52,53] were included in the systematic review and 16 studies [1,20,21,24,25,28,31,34,35,37,39,41,43,44,46,51] in the meta-analysis.

3.2. Study Quality Assessment

The results of the QUADAS-2 assessment are presented in Figure 2. Overall, the risk of bias among the included studies was considered low. In greater detail, within the patient selection domain, 12 studies [1,6,18,19,20,22,26,38,39,40,43,45] were rated as having an “unclear risk”, and only one [41] was characterized as “high risk”. For the index test domain, 30 studies [1,2,7,18,19,20,22,24,25,26,27,28,29,30,31,32,33,38,39,40,41,42,43,44,45,46,49,50,52,53] were rated as “high risk” and one as “unclear risk” [21]. An “unclear risk” of bias was also identified in four studies [1,19,27,45] in the reference standard domain and in two studies in the flow and timing domain, with only one study [20] in this category rated as “high risk”. Applicability concerns were present in two studies [38,45] with a “high risk” in the patient selection domain, while all other studies were rated as having a “low risk”.
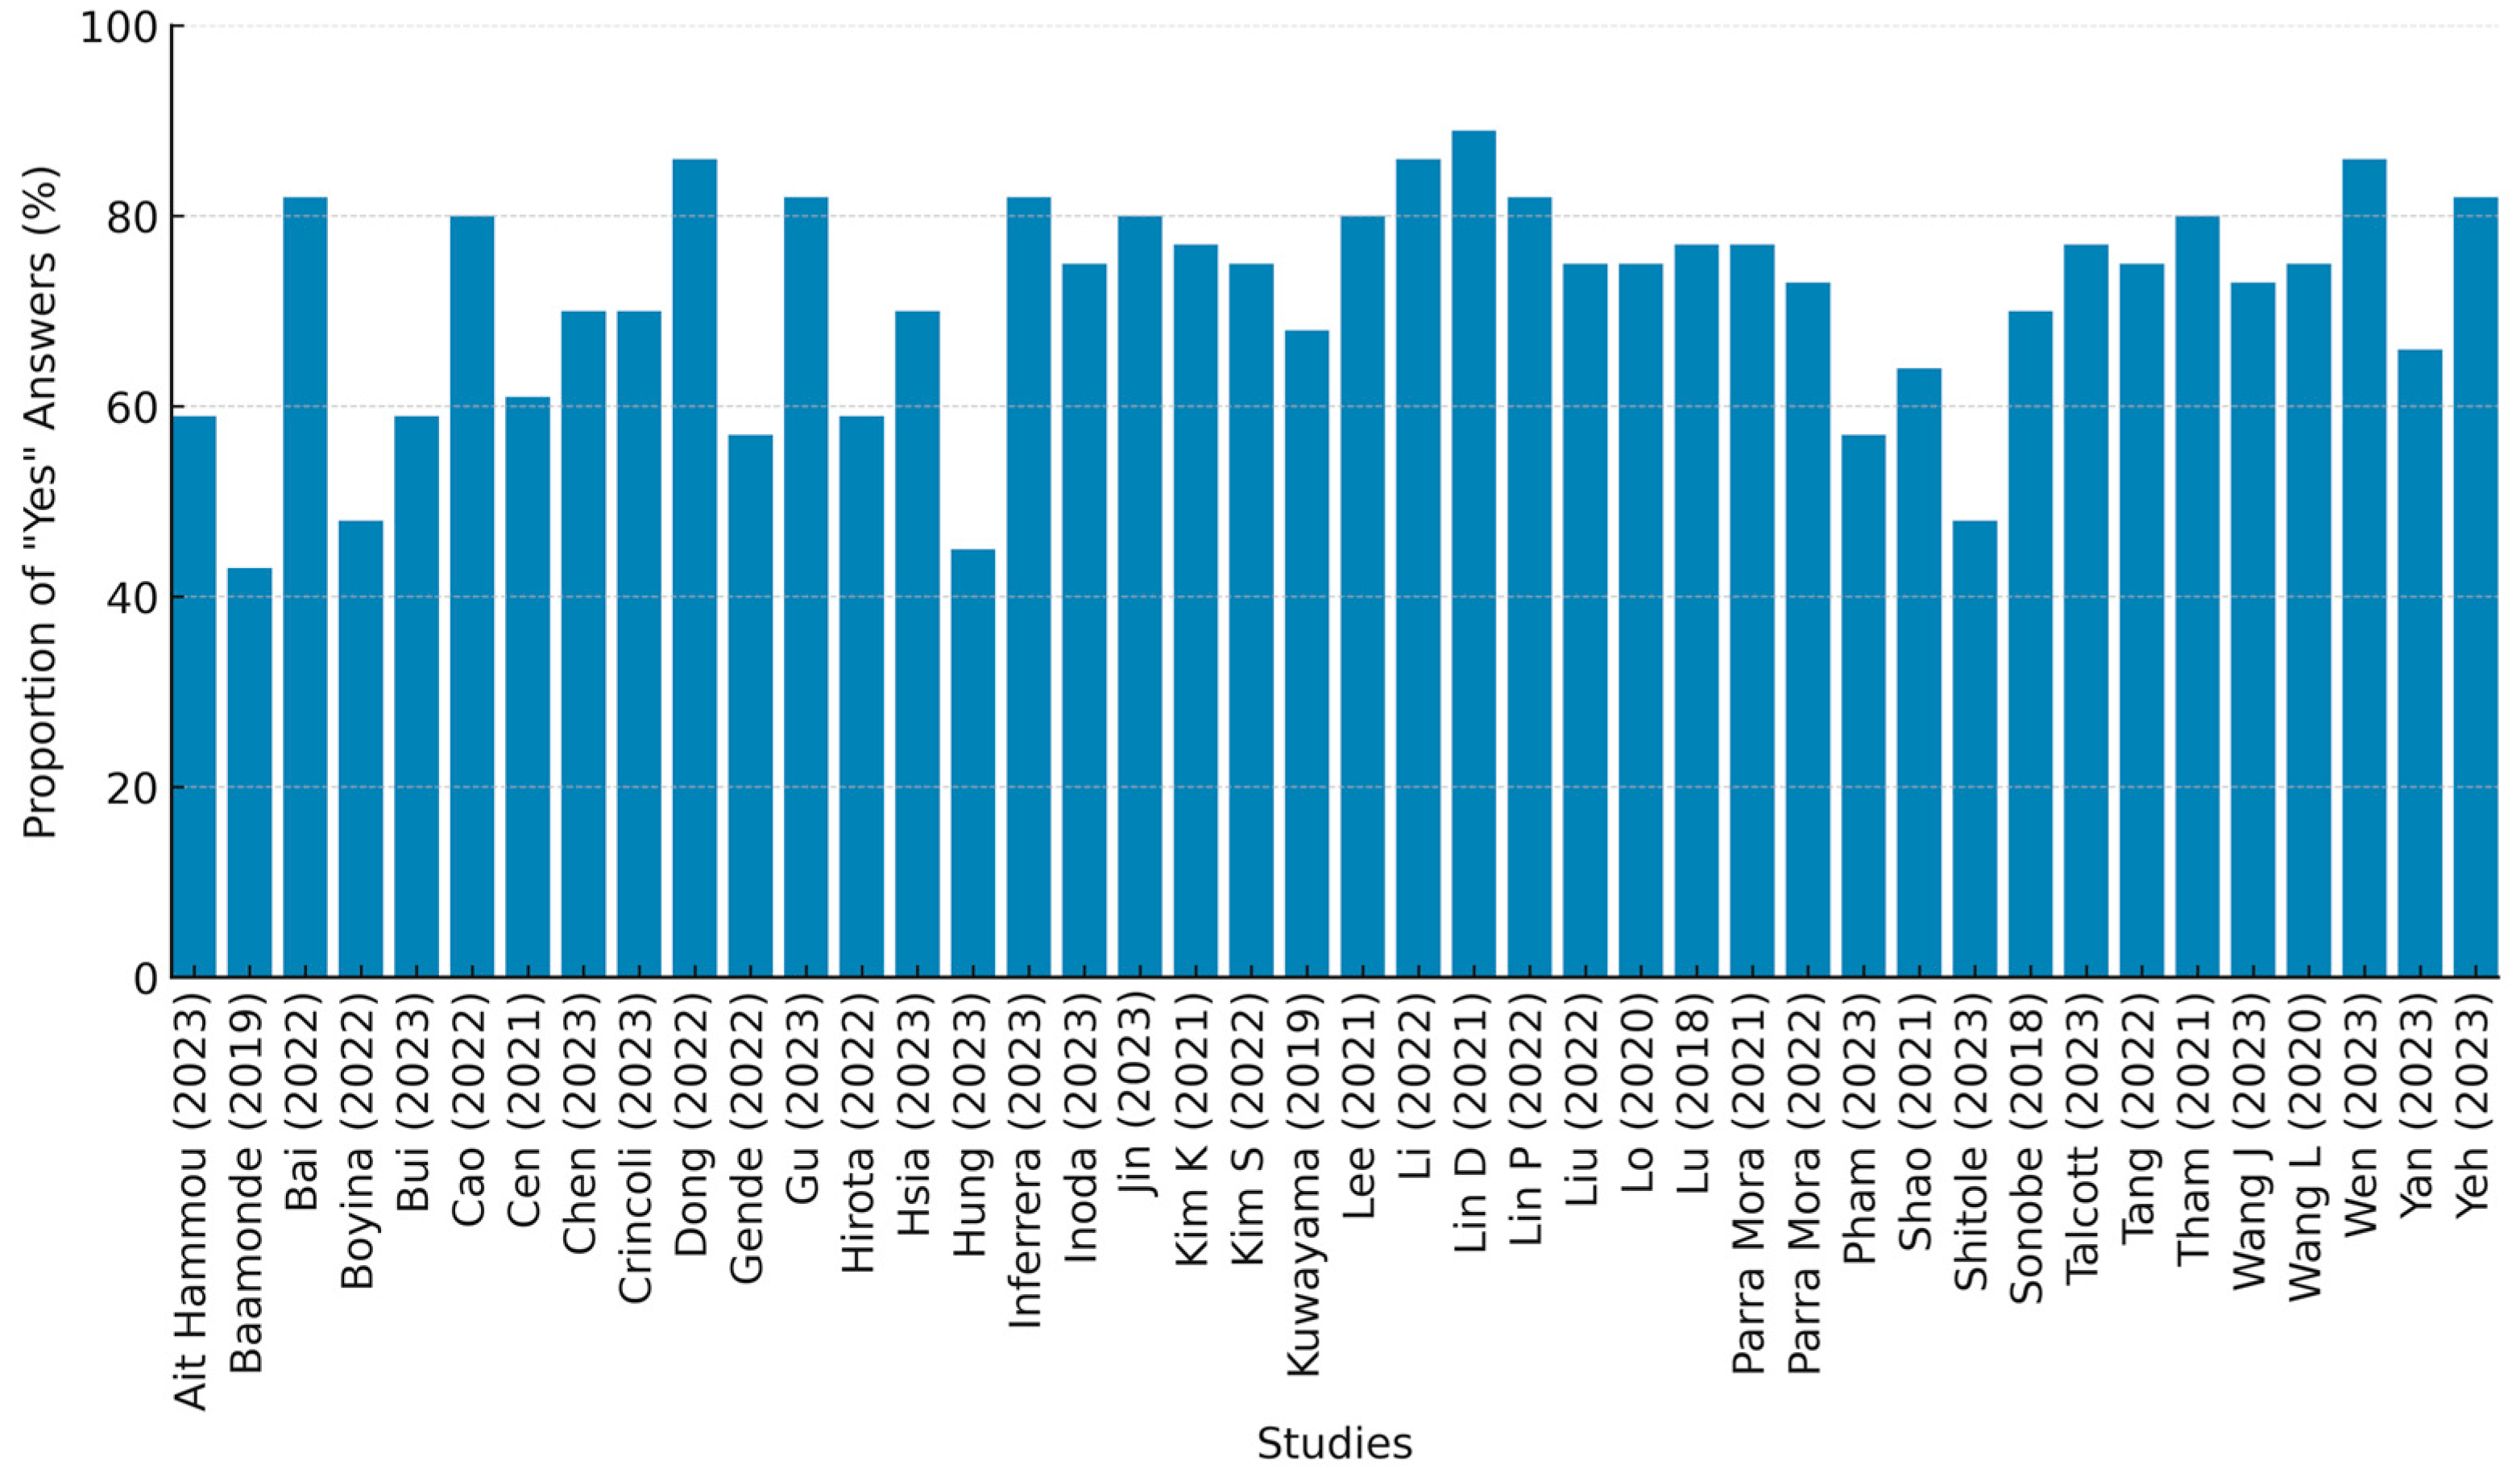
The results of the CLAIM assessment are summarized in Figure 3. The proportion of “Yes” responses varied considerably among the included studies, ranging from 43% to 89%. Nine studies [1,6,18,19,20,26,27,43,45] scored below 60%, while 13 studies [7,10,21,24,25,28,30,34,35,36,37,49,52] achieved a high compliance rate above 80%. No articles were excluded based on these assessments. Publication bias assessment was not performed.

3.3. Study Characteristics

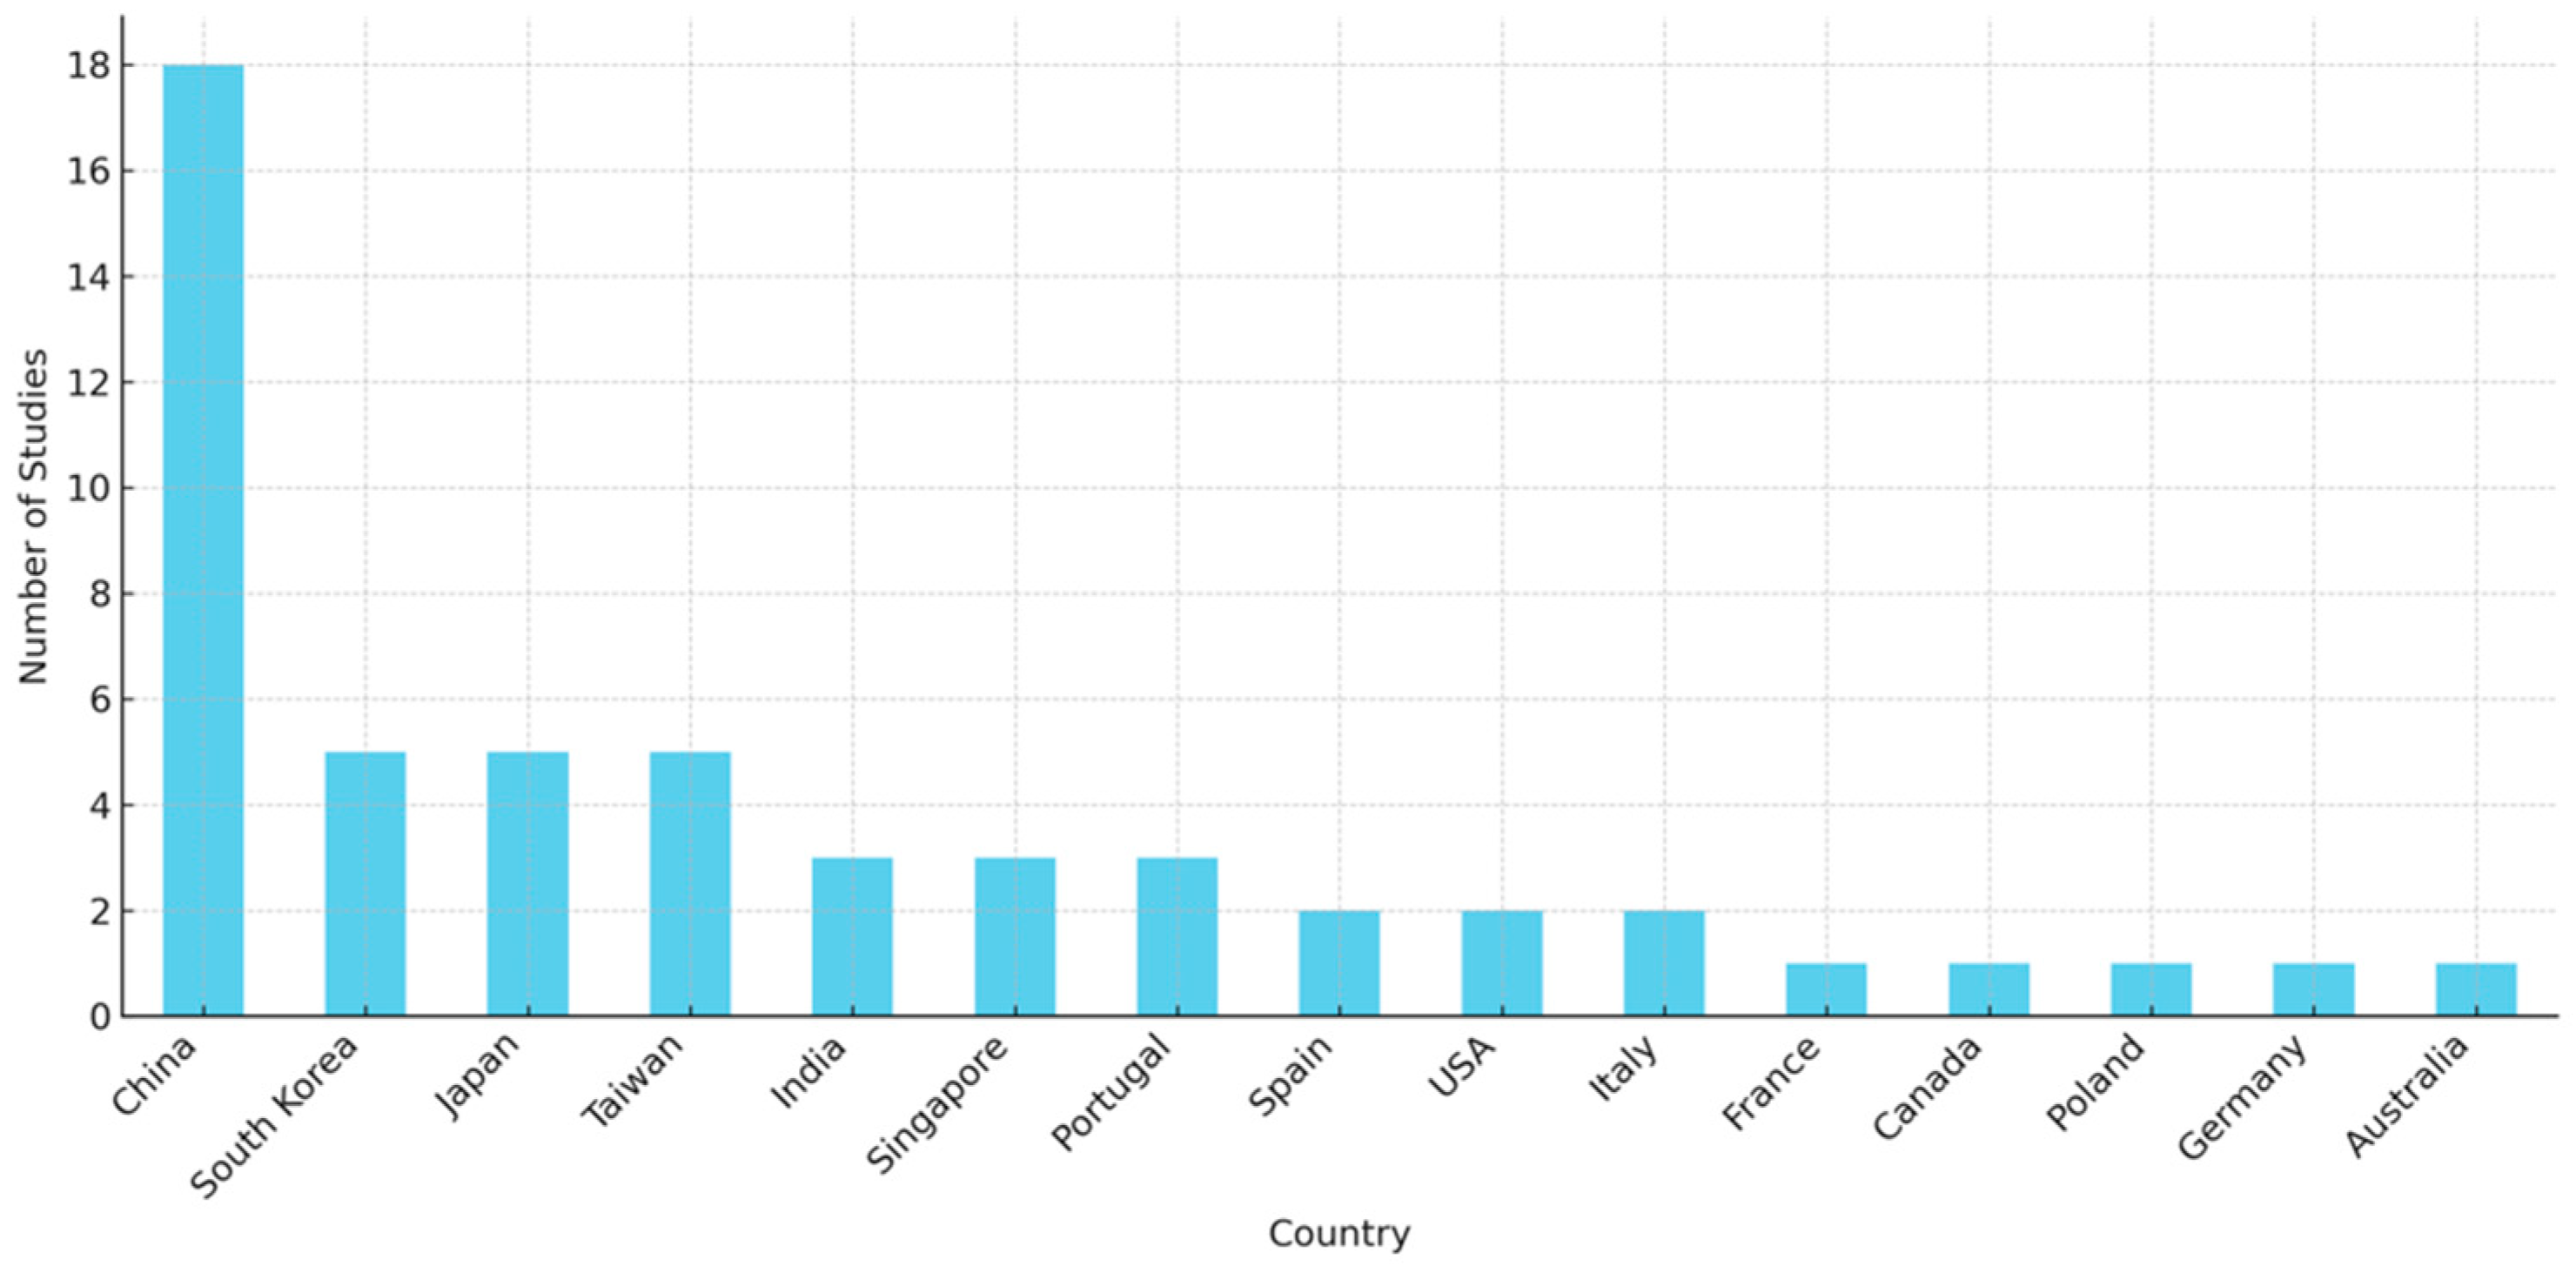
The 42 included studies (Table 1) were published between 2018 and 2023 and were conducted in 15 countries (Figure 4), with the largest contribution coming from China (18 studies) [10,21,22,23,24,25,30,35,36,38,40,44,48,49,50,51,52,53].
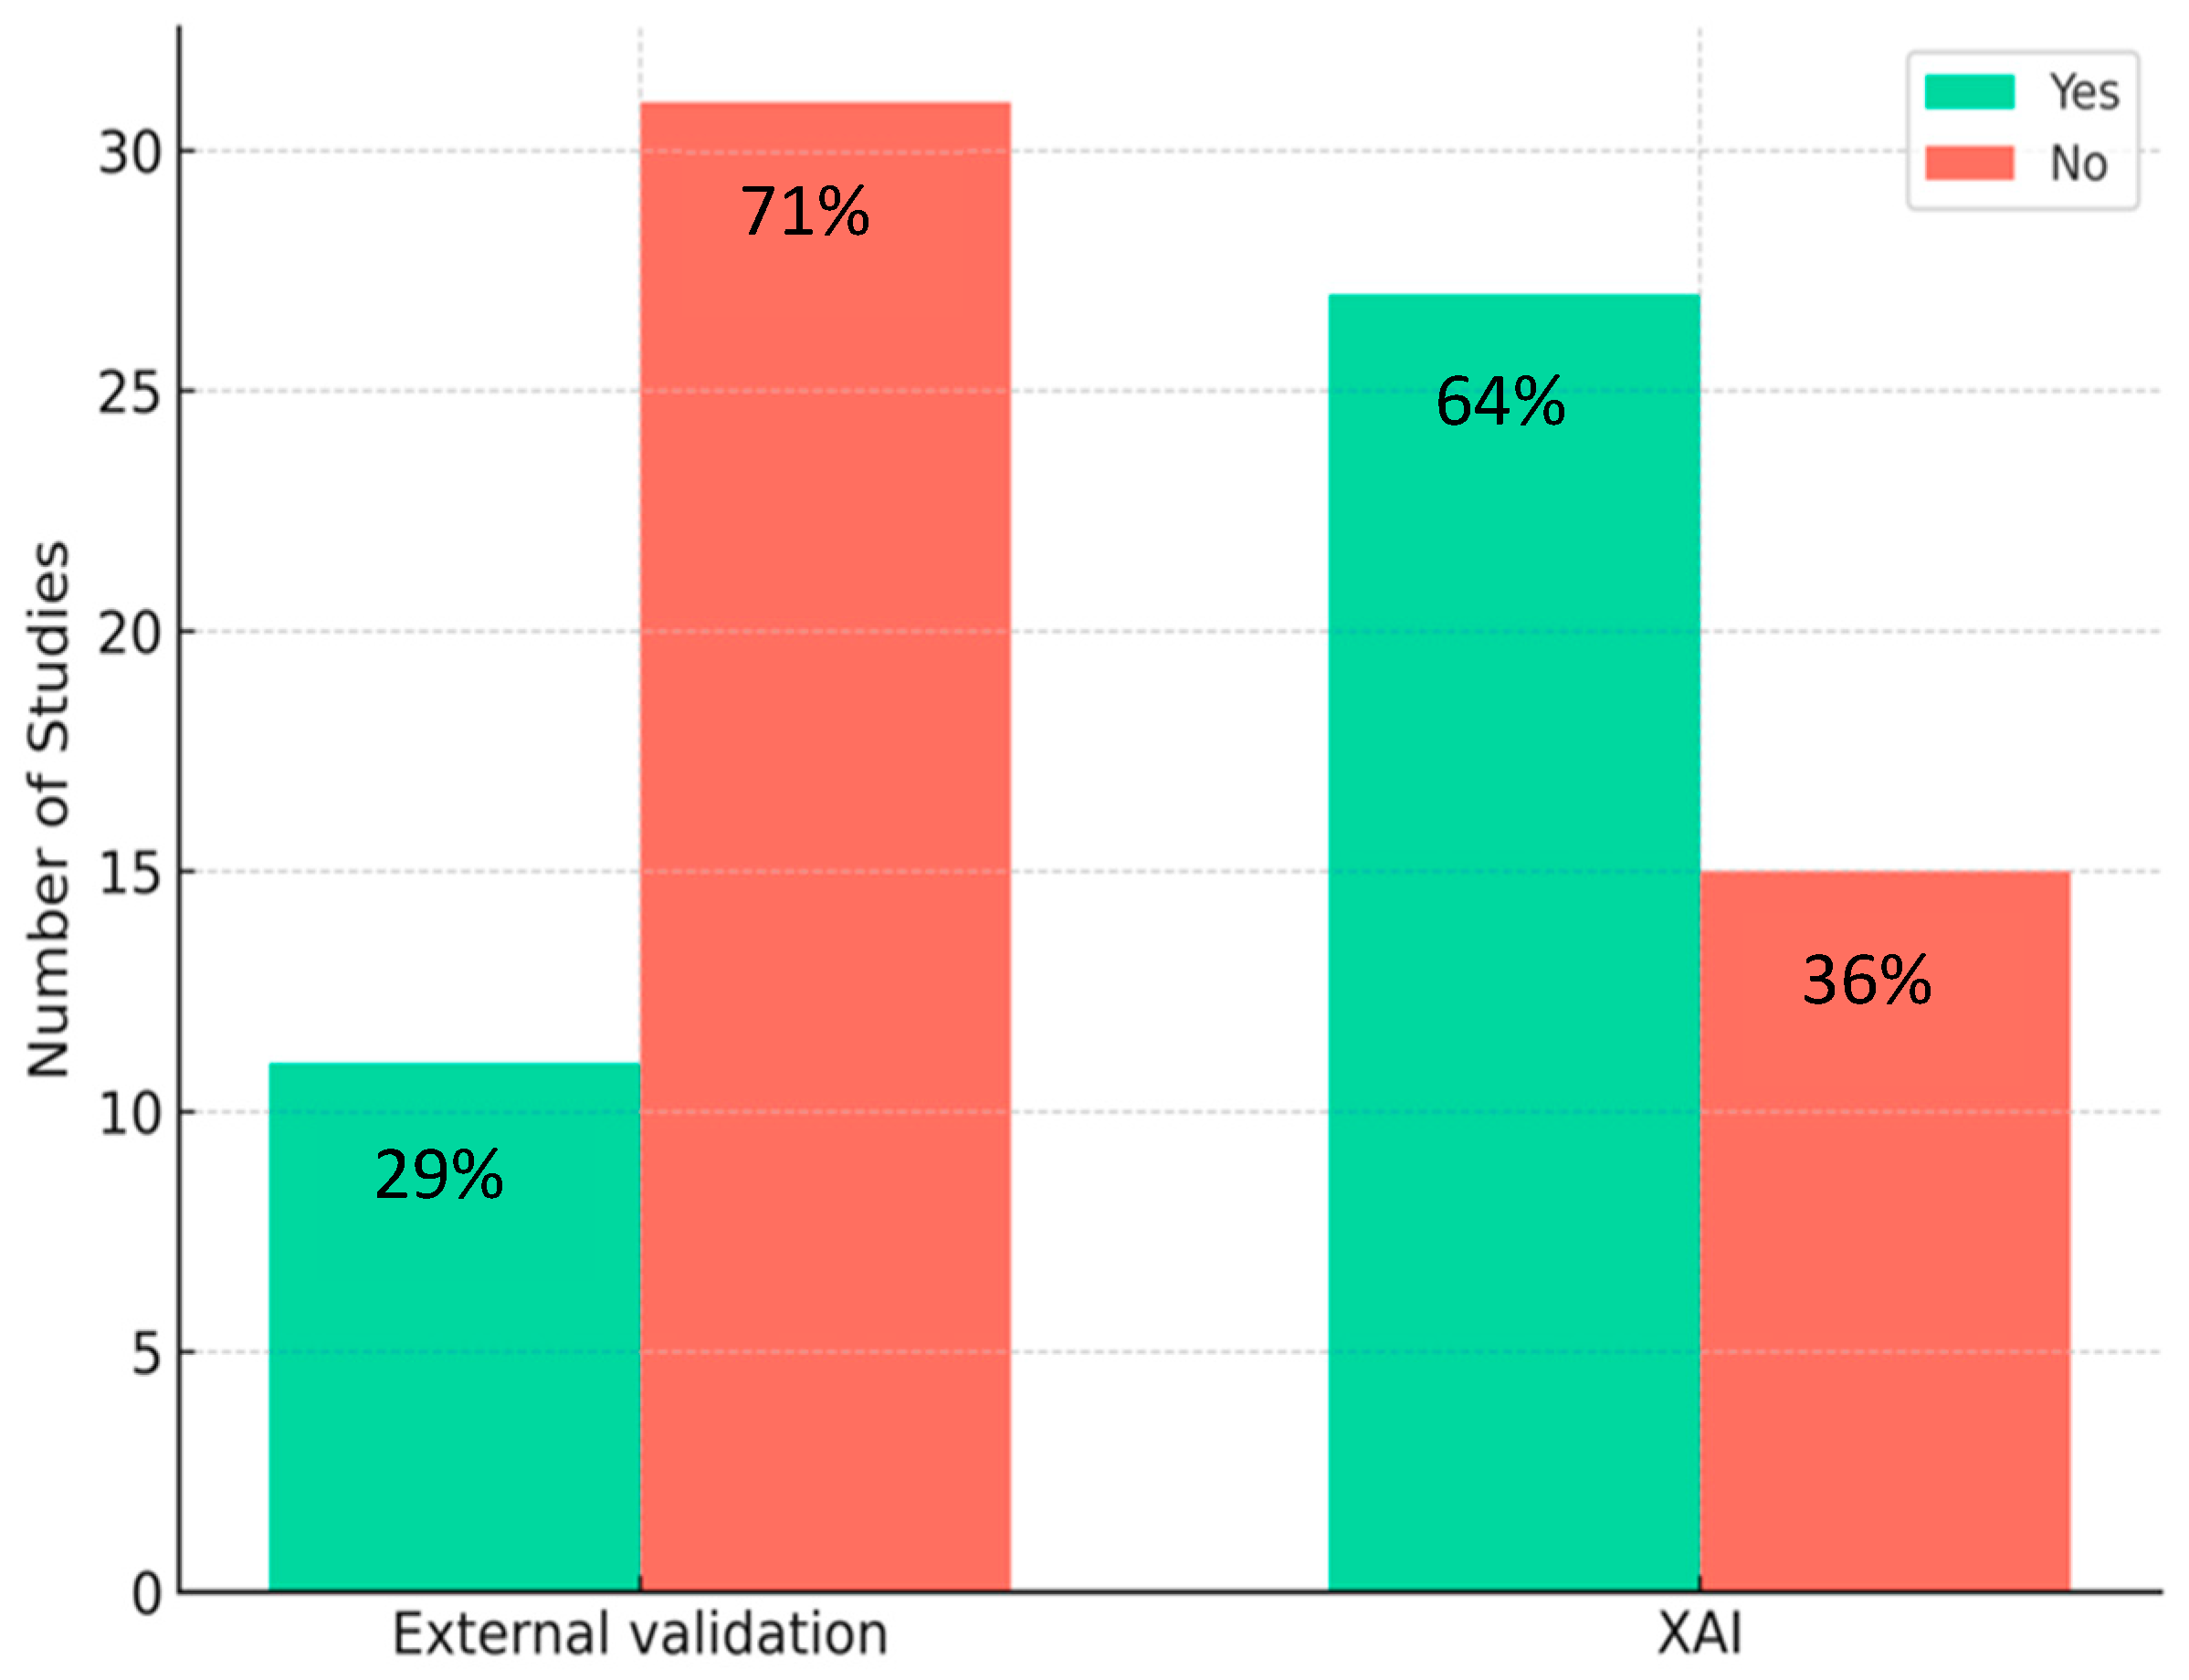
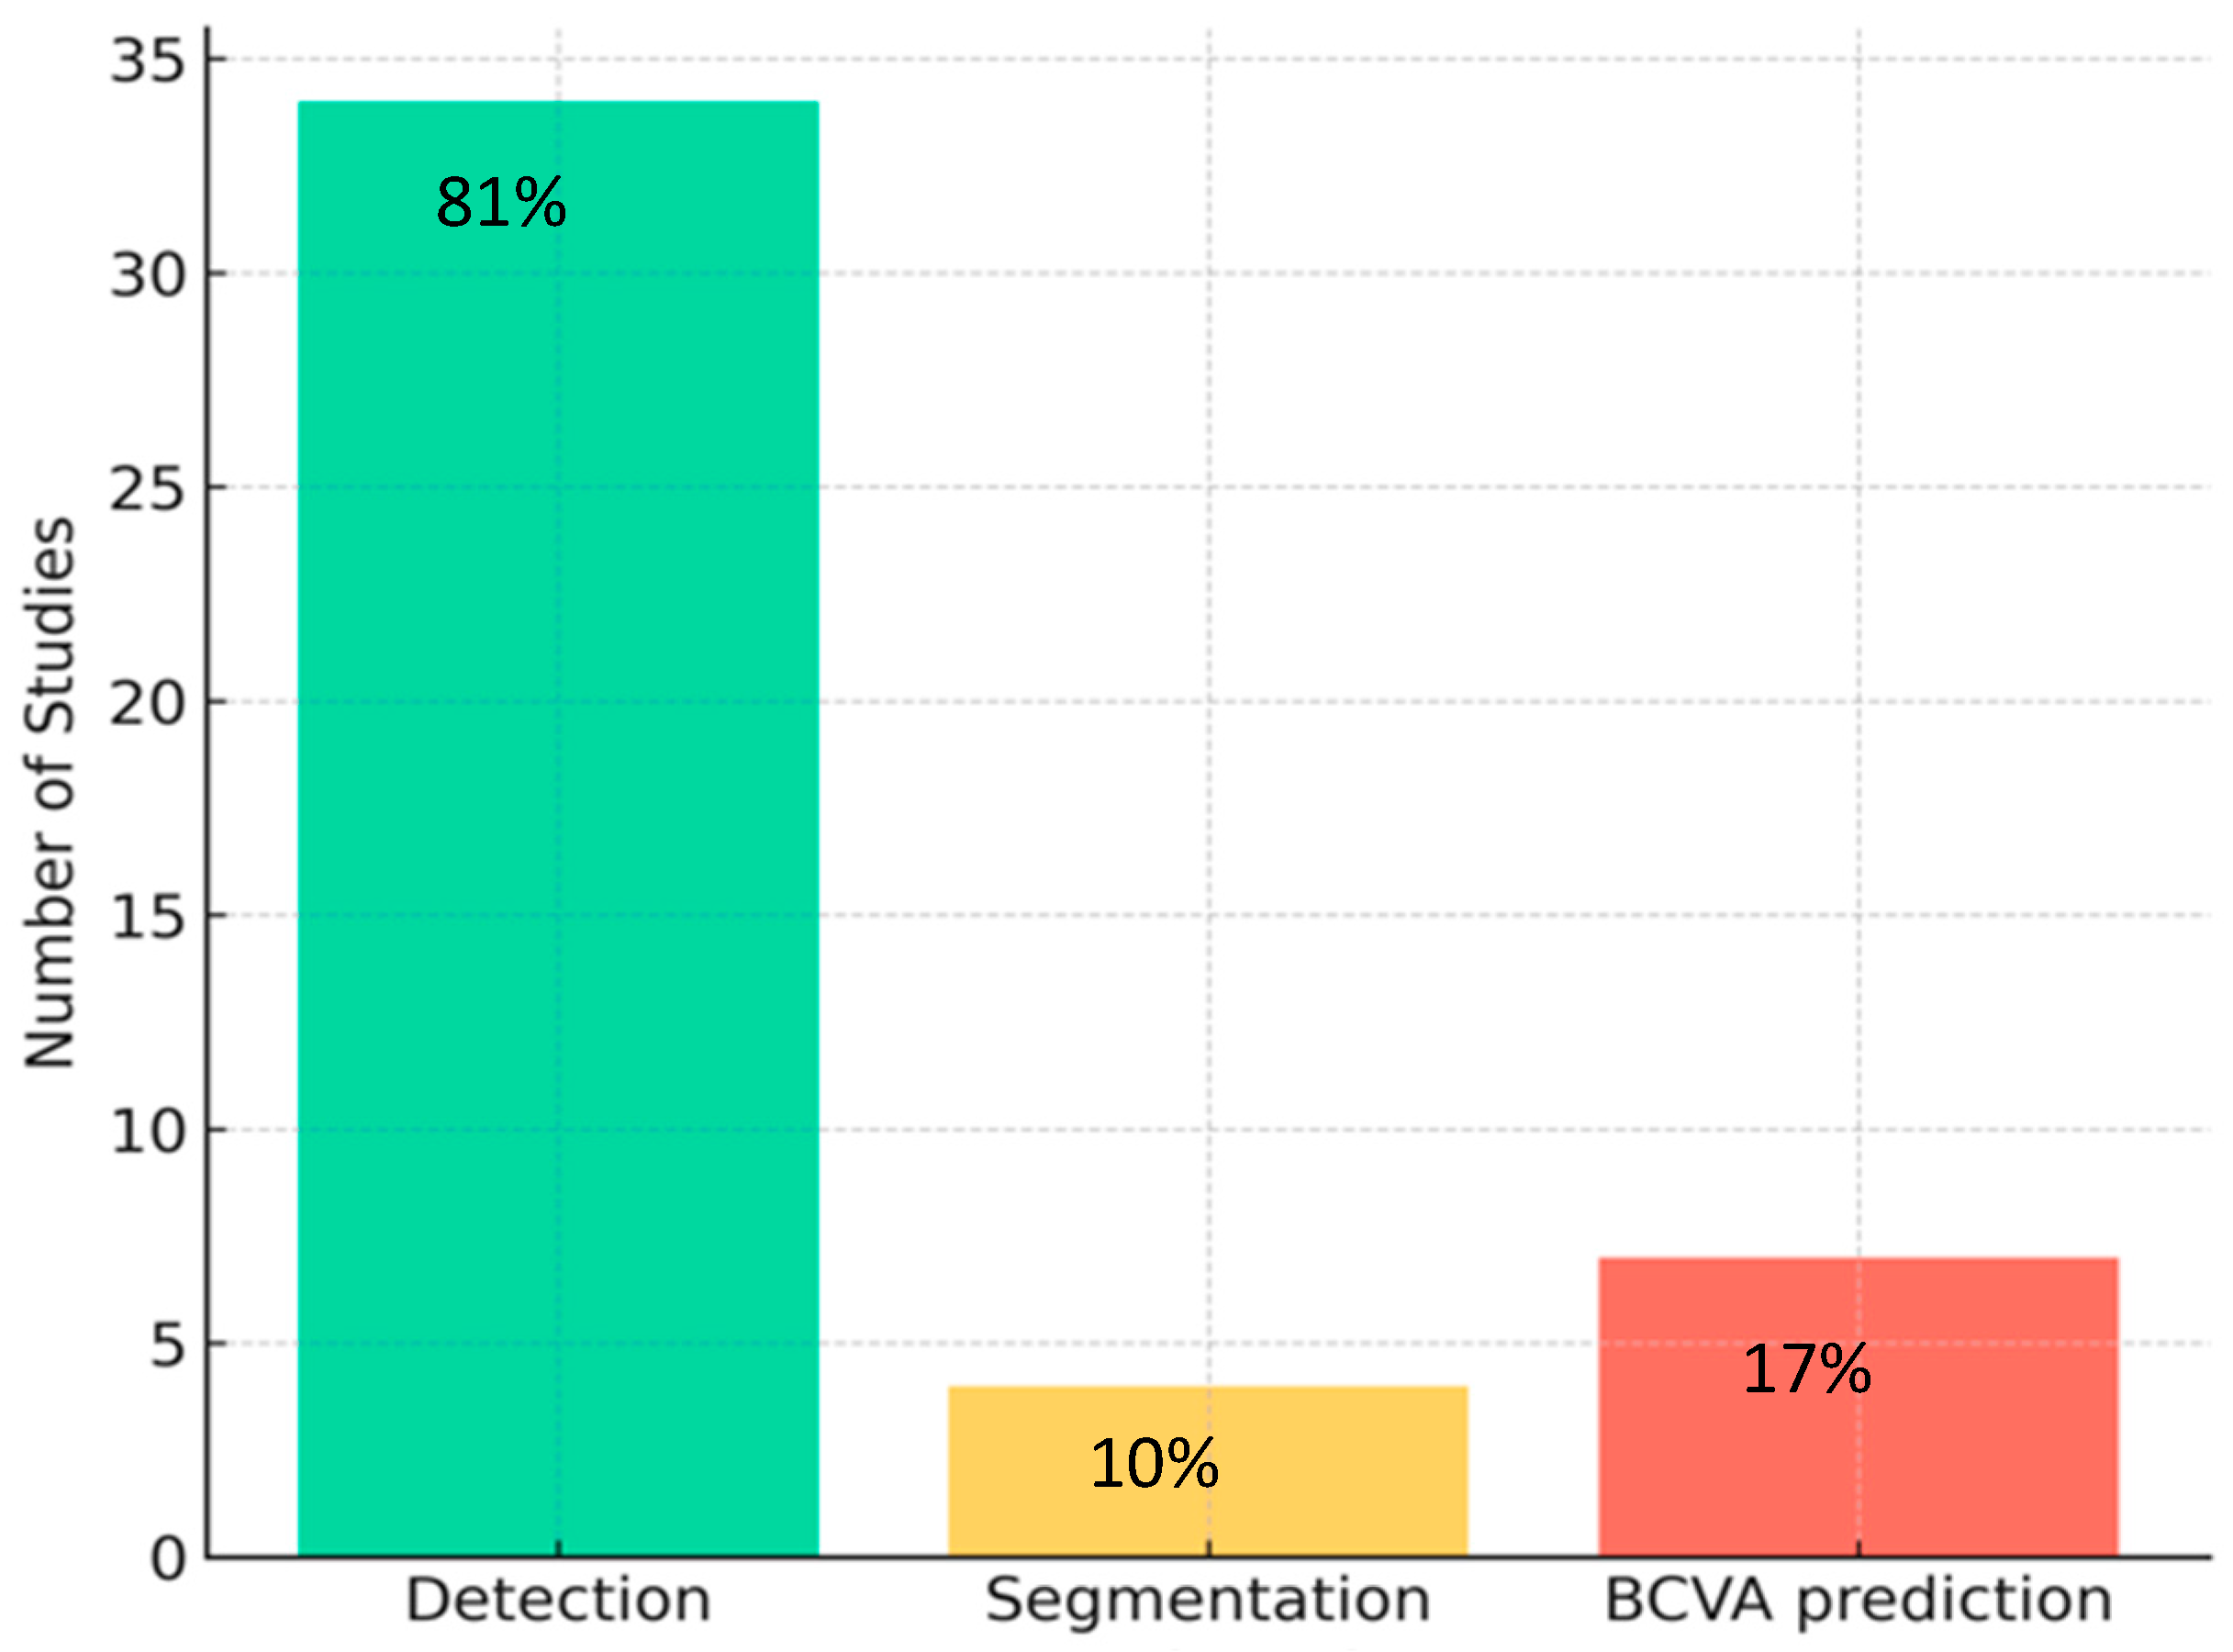
Most of the included studies used self-built datasets, whereas others used institutional databases, publicly available datasets, or subsets from other studies. In 26,2% of the studies, AI models were trained on datasets featuring ERM, either exclusively or in combination with images from normal eyes. The remaining studies used datasets that included multiple retinal diseases. The imaging modalities employed included OCT (SD, SS, HD, or other) in 28 studies [1,2,5,6,7,10,18,20,23,26,27,28,29,30,32,33,38,39,40,41,42,46,47,48,50,51,52,53] and color fundus images (CFI) in 14 studies [19,21,22,24,25,31,34,35,36,37,43,44,45,49]. DL was the most commonly used approach, applied in 98% of the studies, with CNNs being the predominant architecture. Regarding XAI techniques, 64% of the studies incorporated them into their models, while external validation was performed in 29% of the studies (Figure 5). Of the included studies, 81% focused on ERM detection, 10% on segmentation, and 17% on postoperative BCVA prediction, with some studies addressing more than one task (Figure 6).

3.4. Meta-Analysis

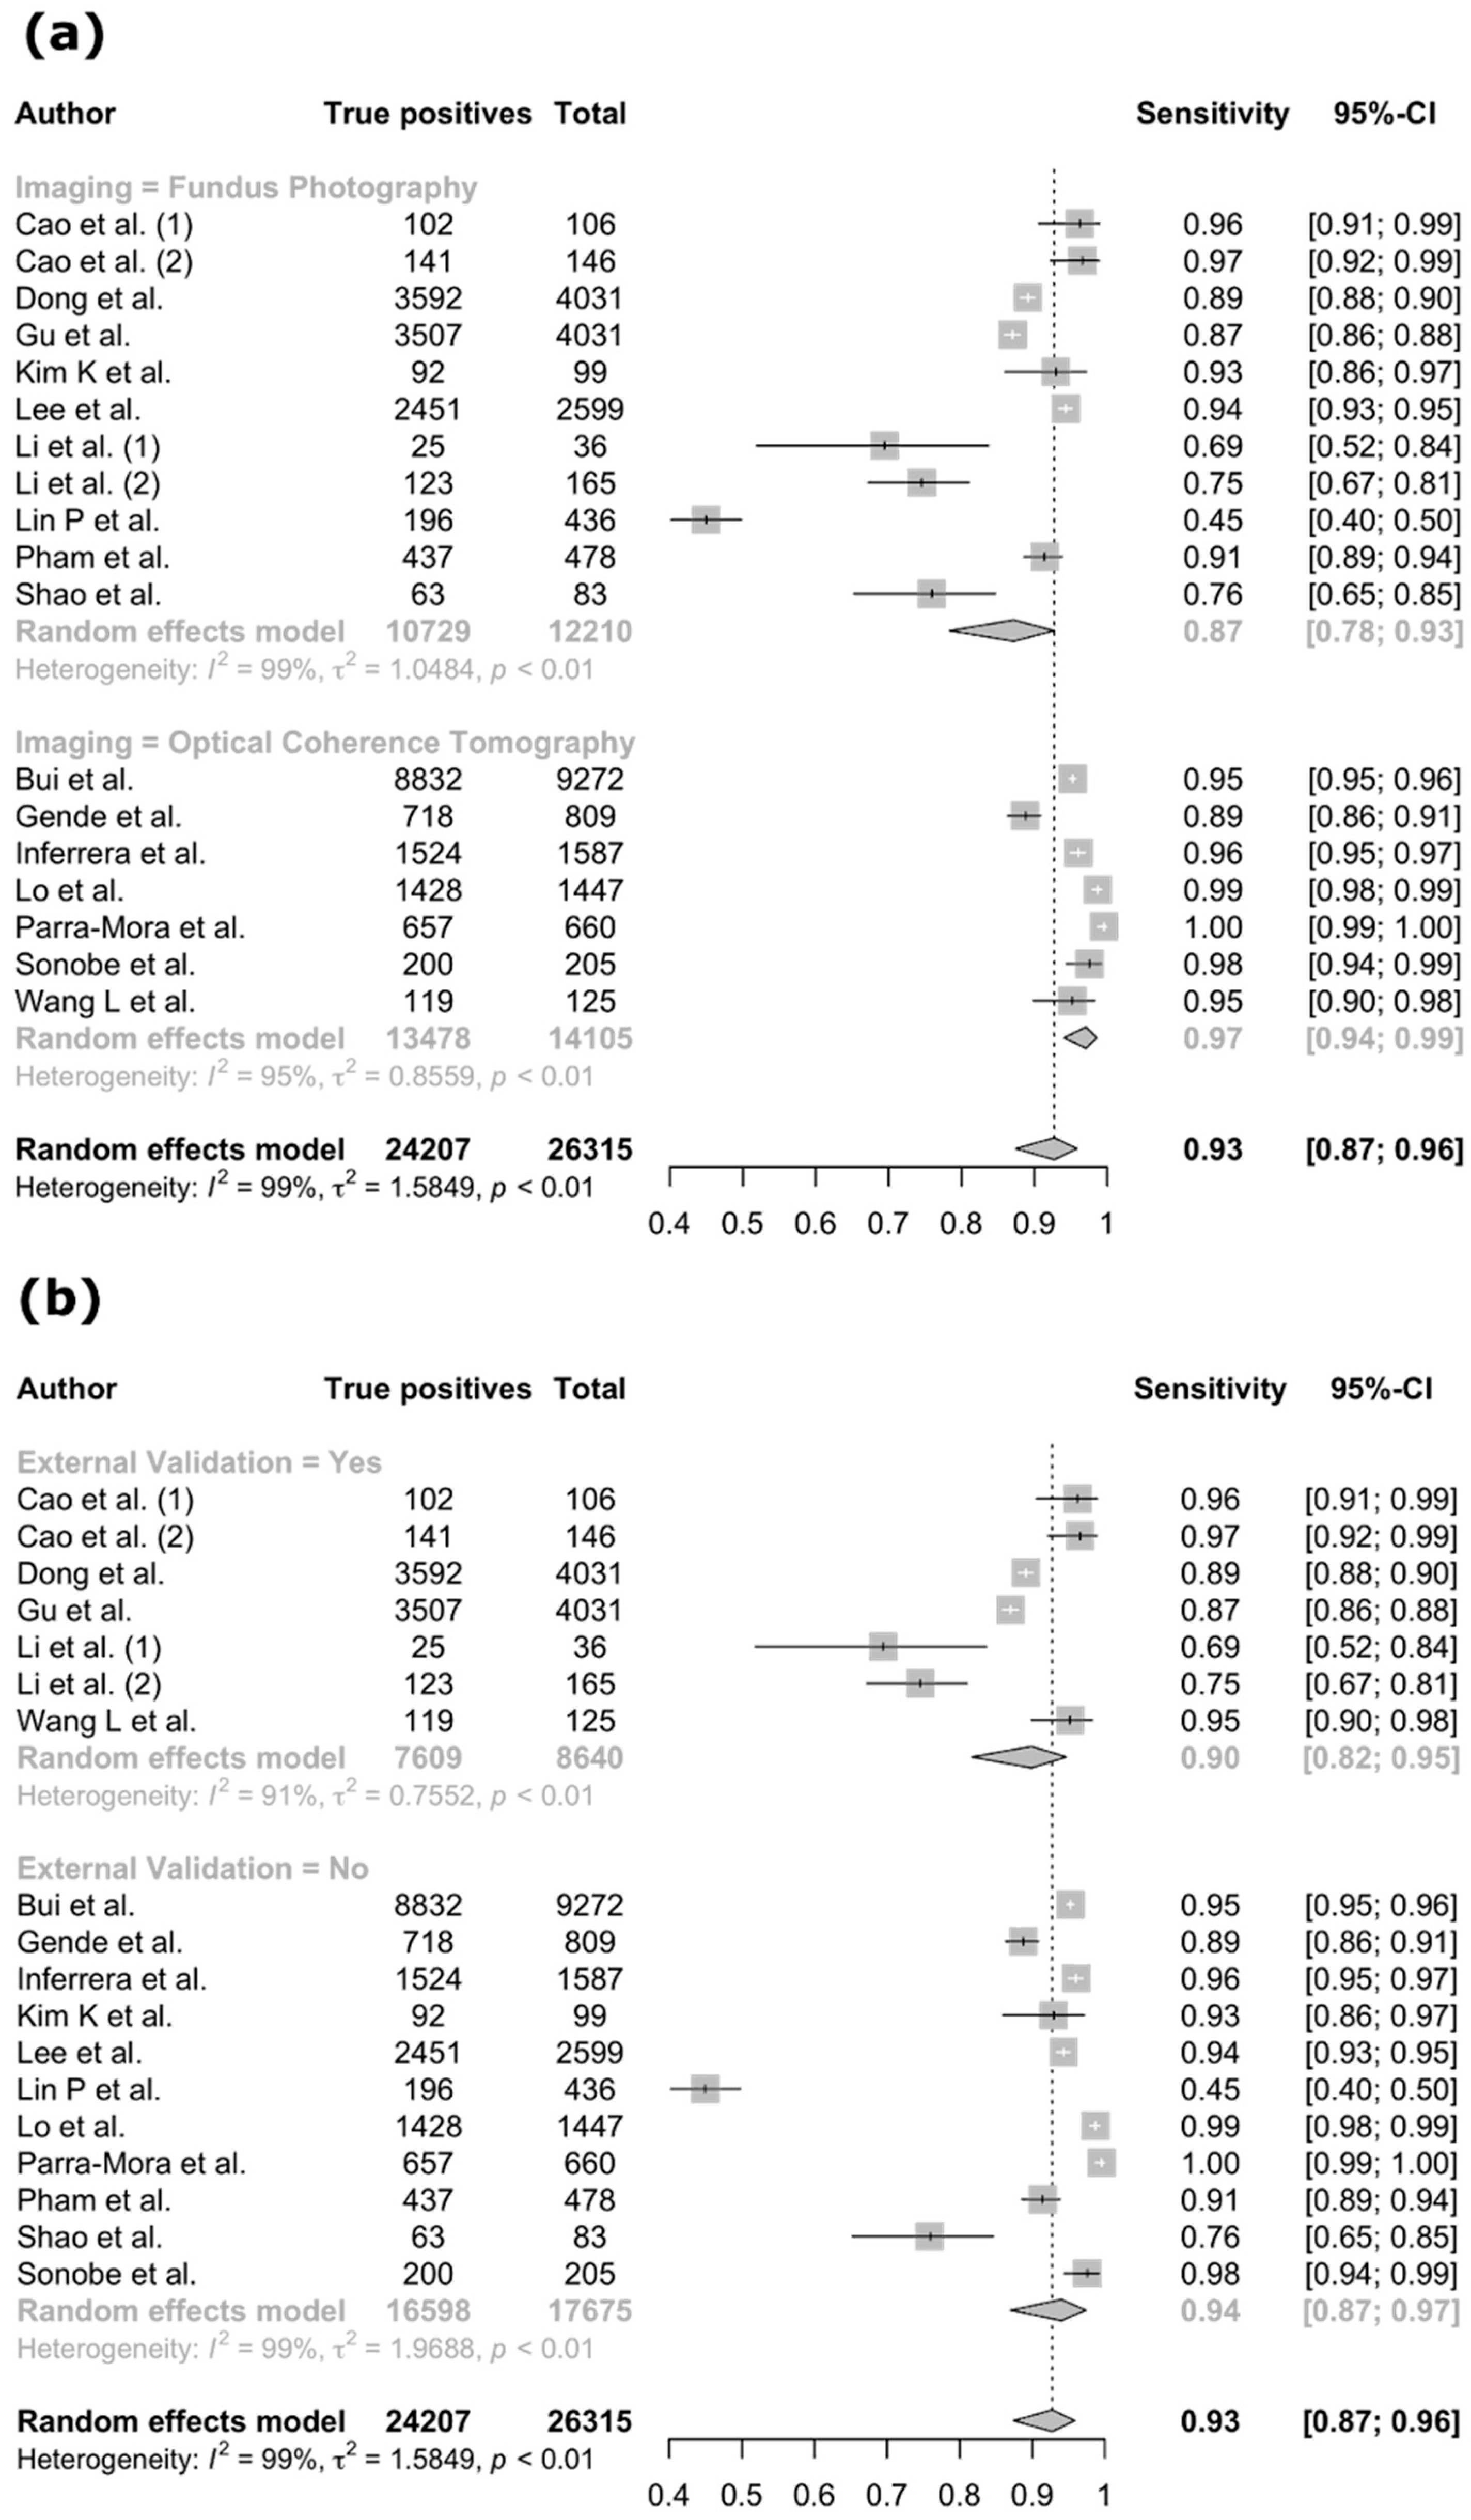
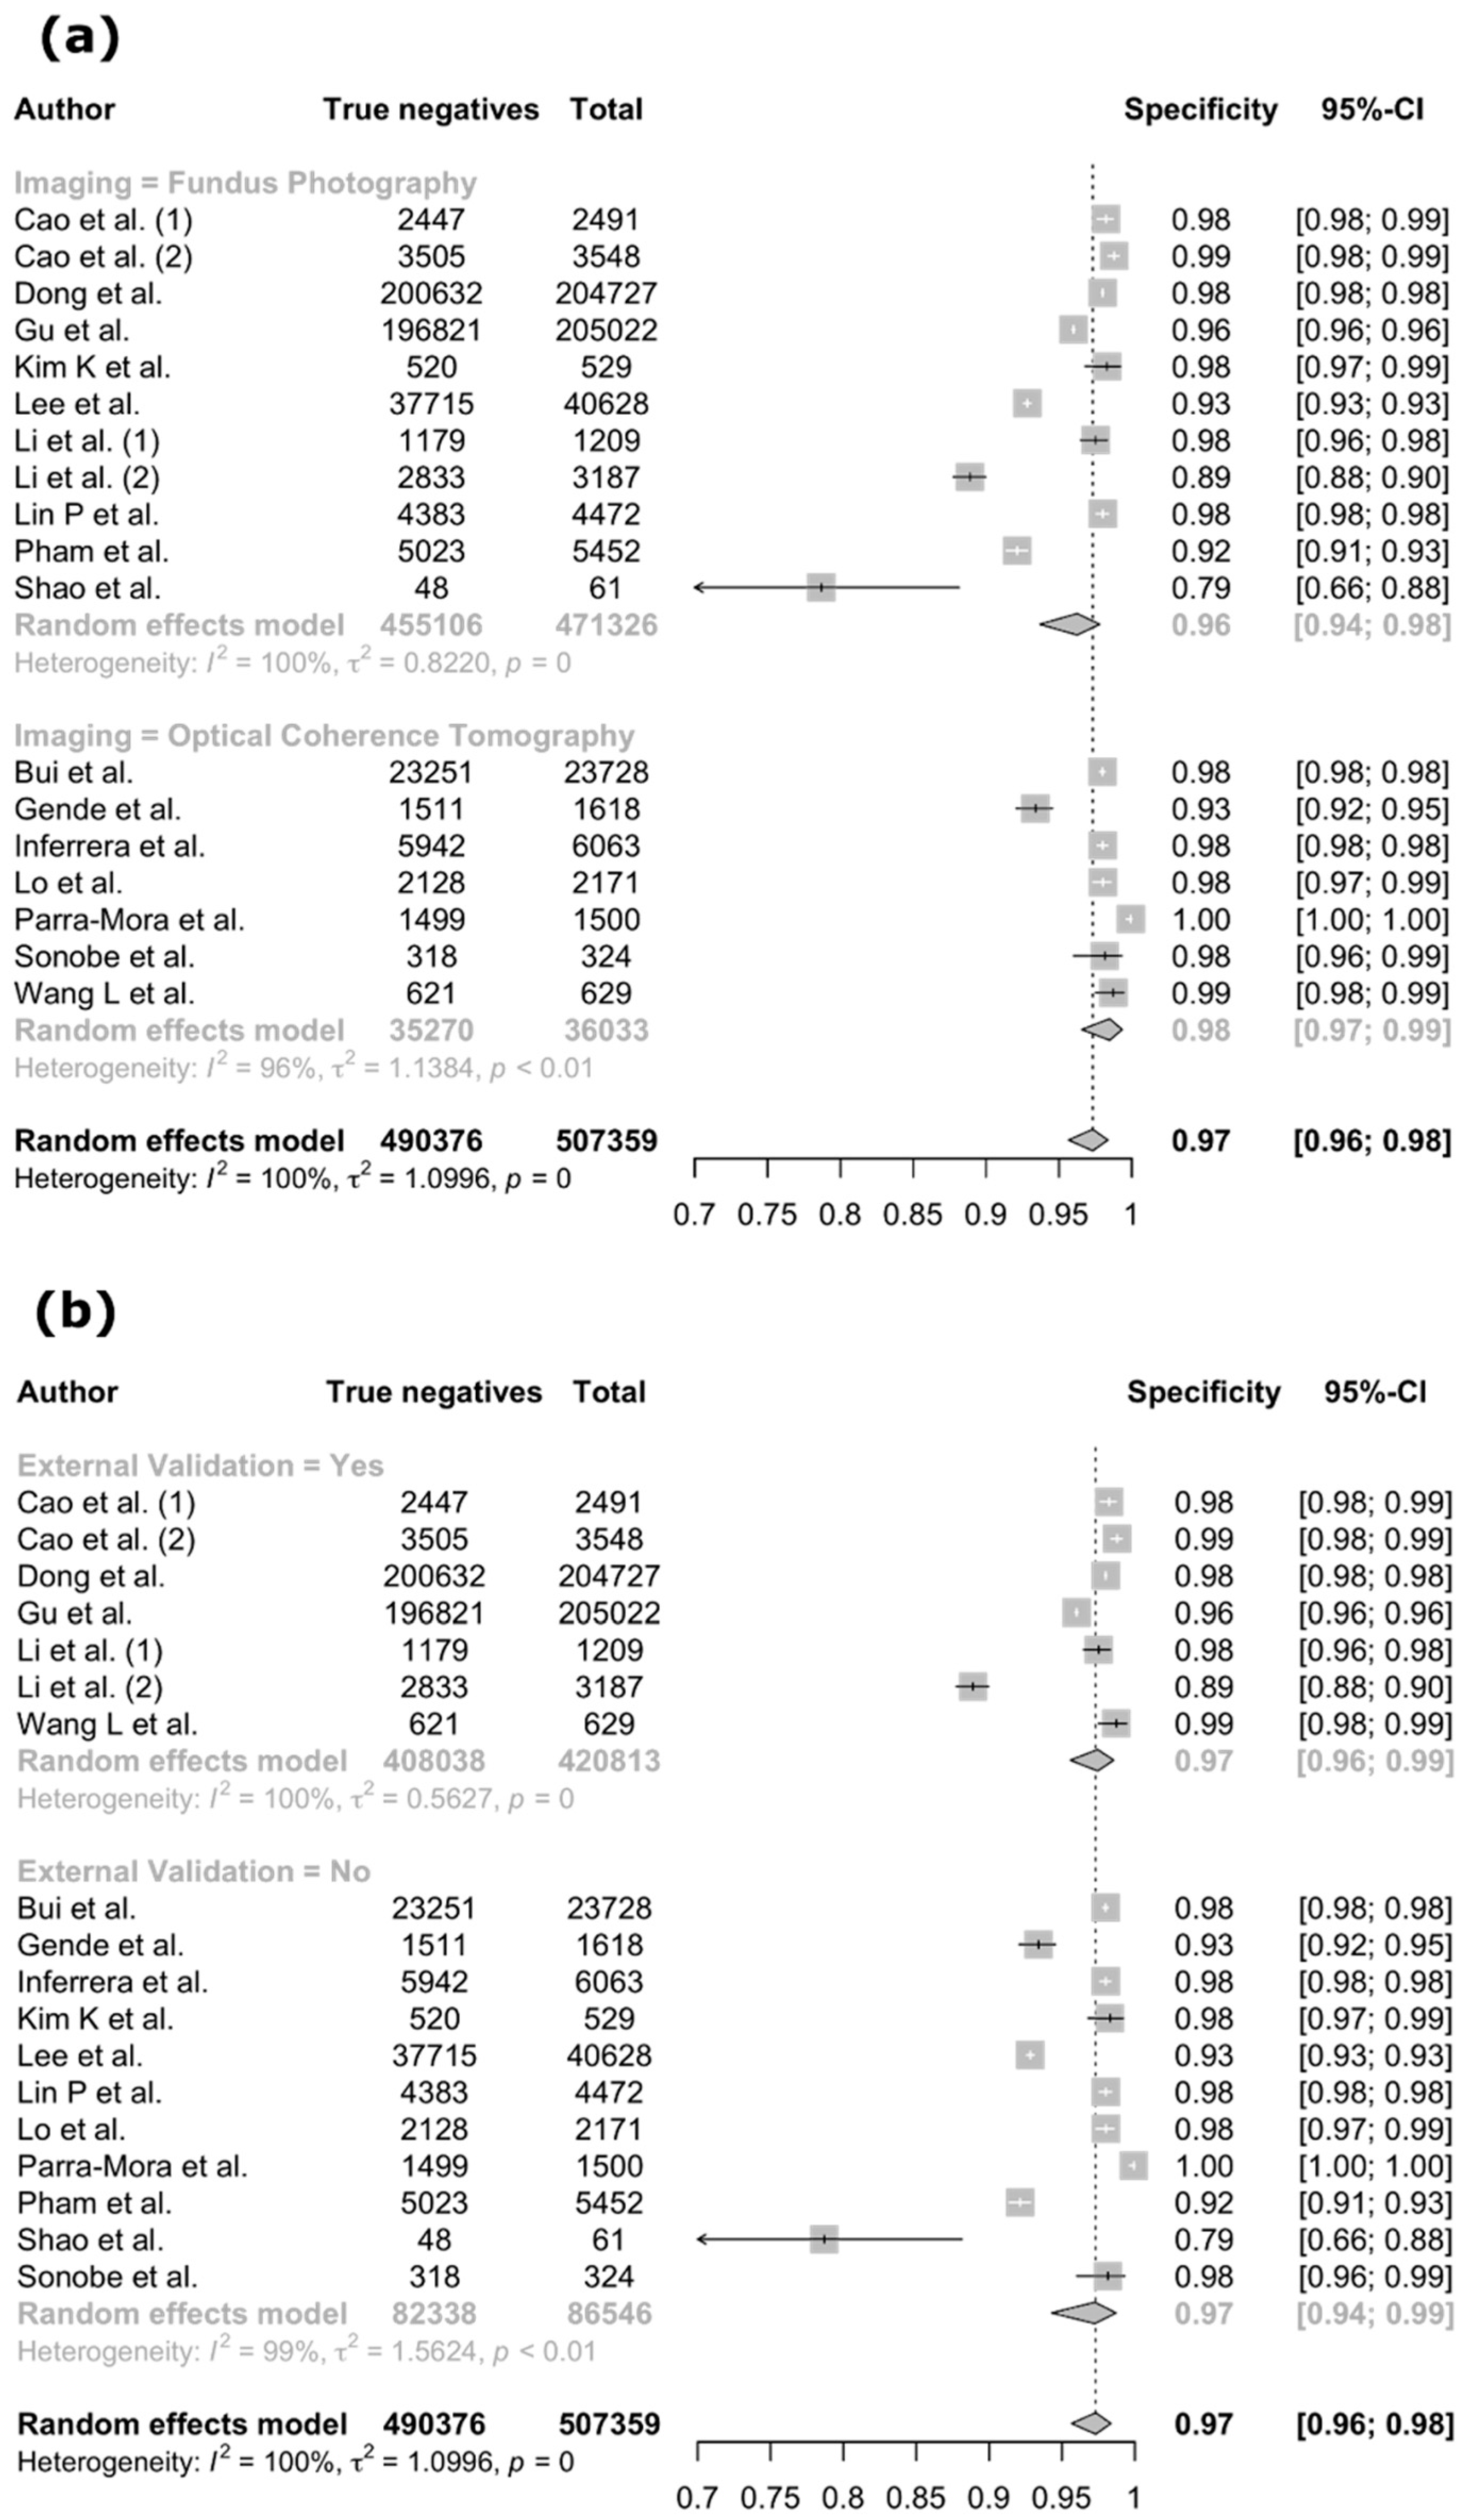
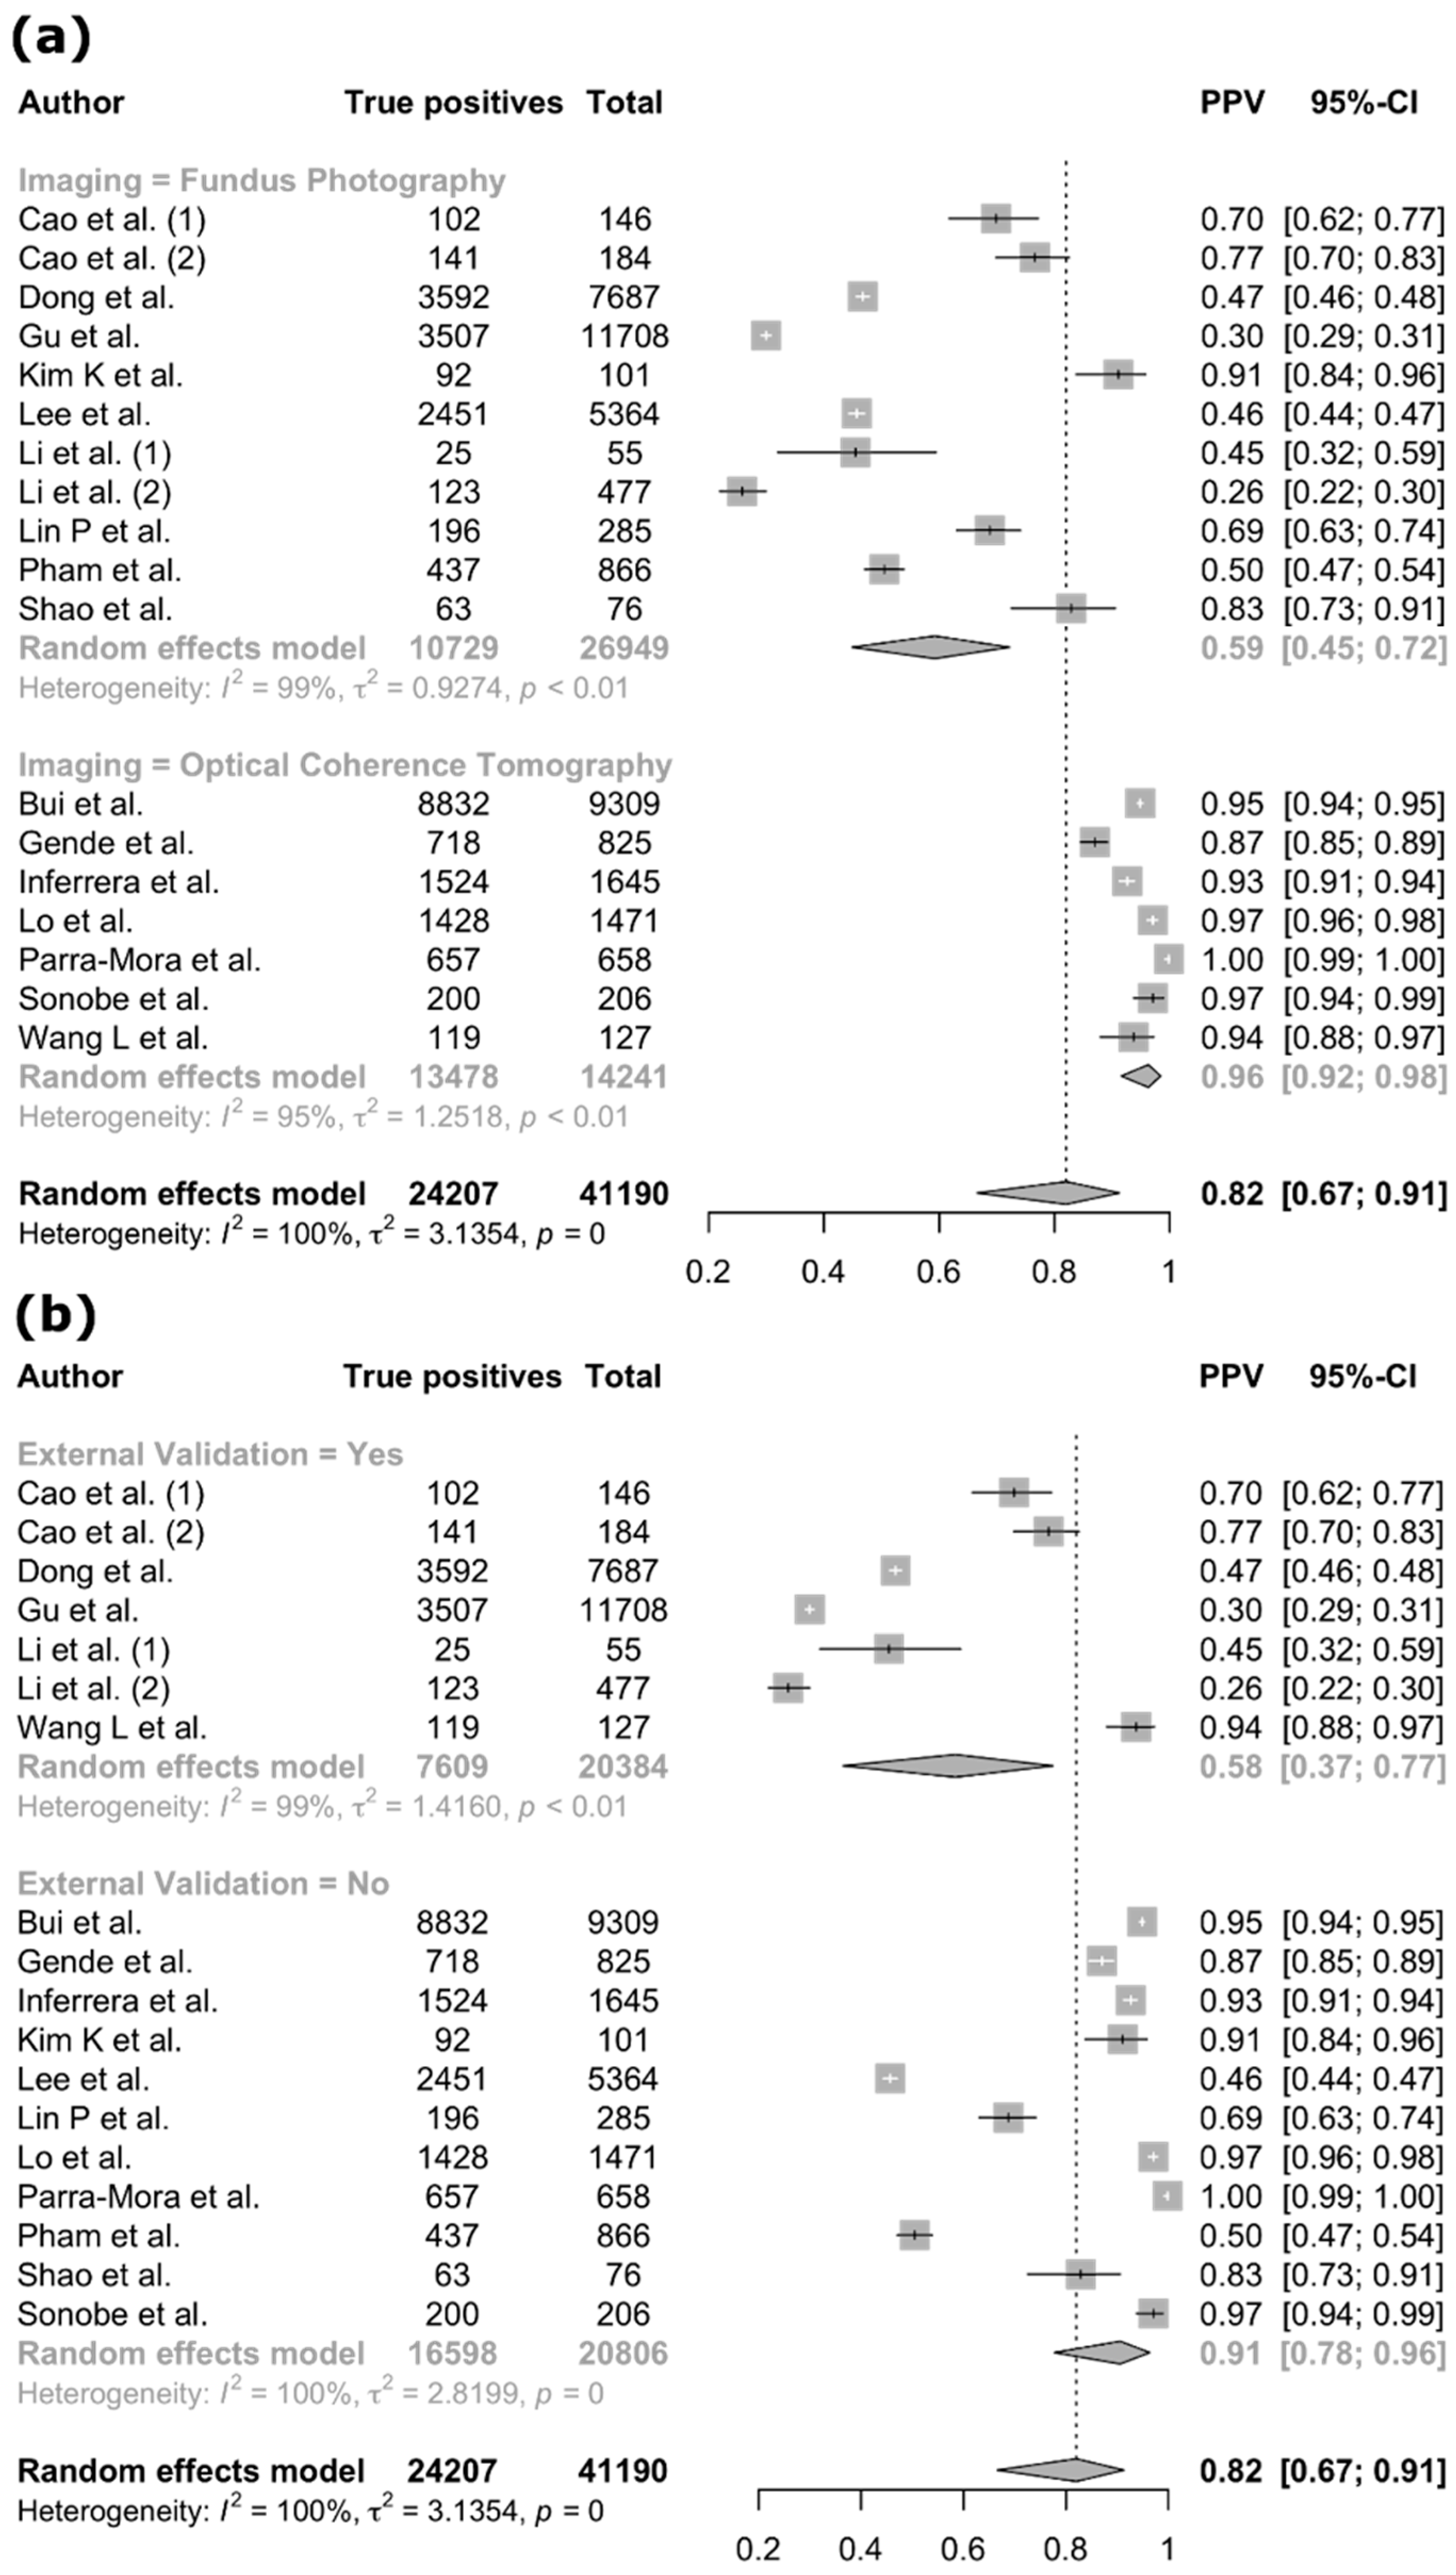
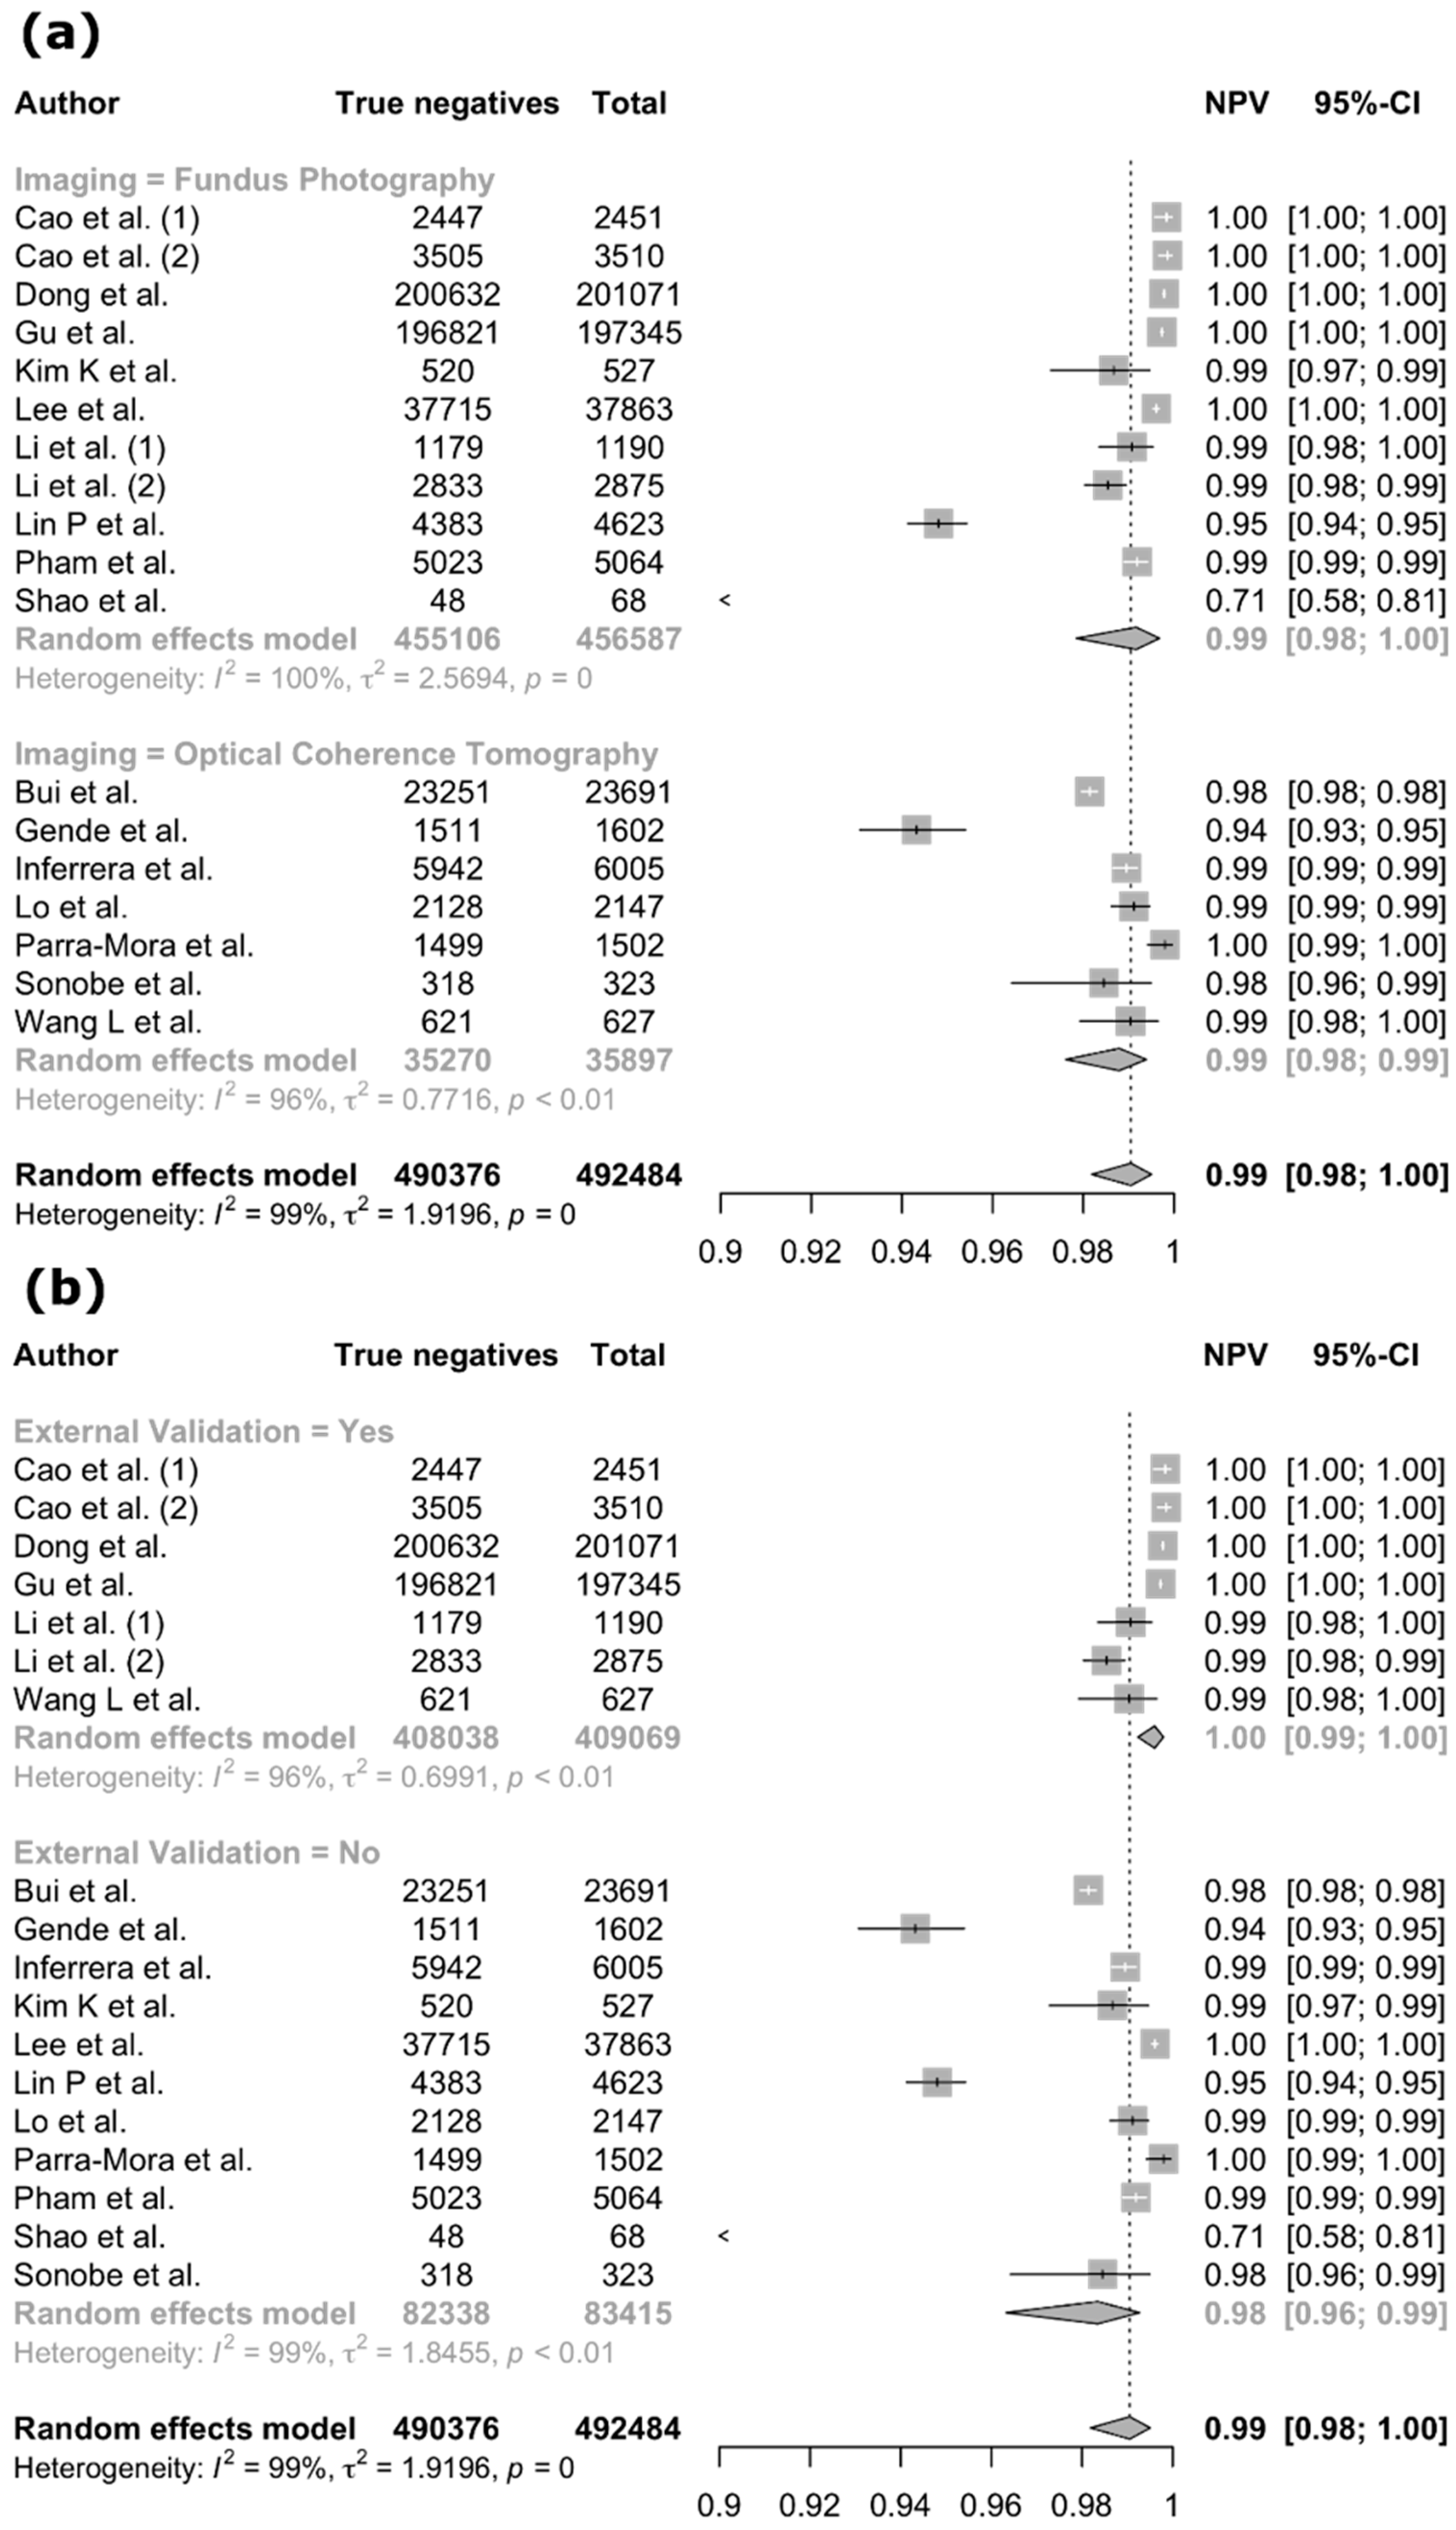
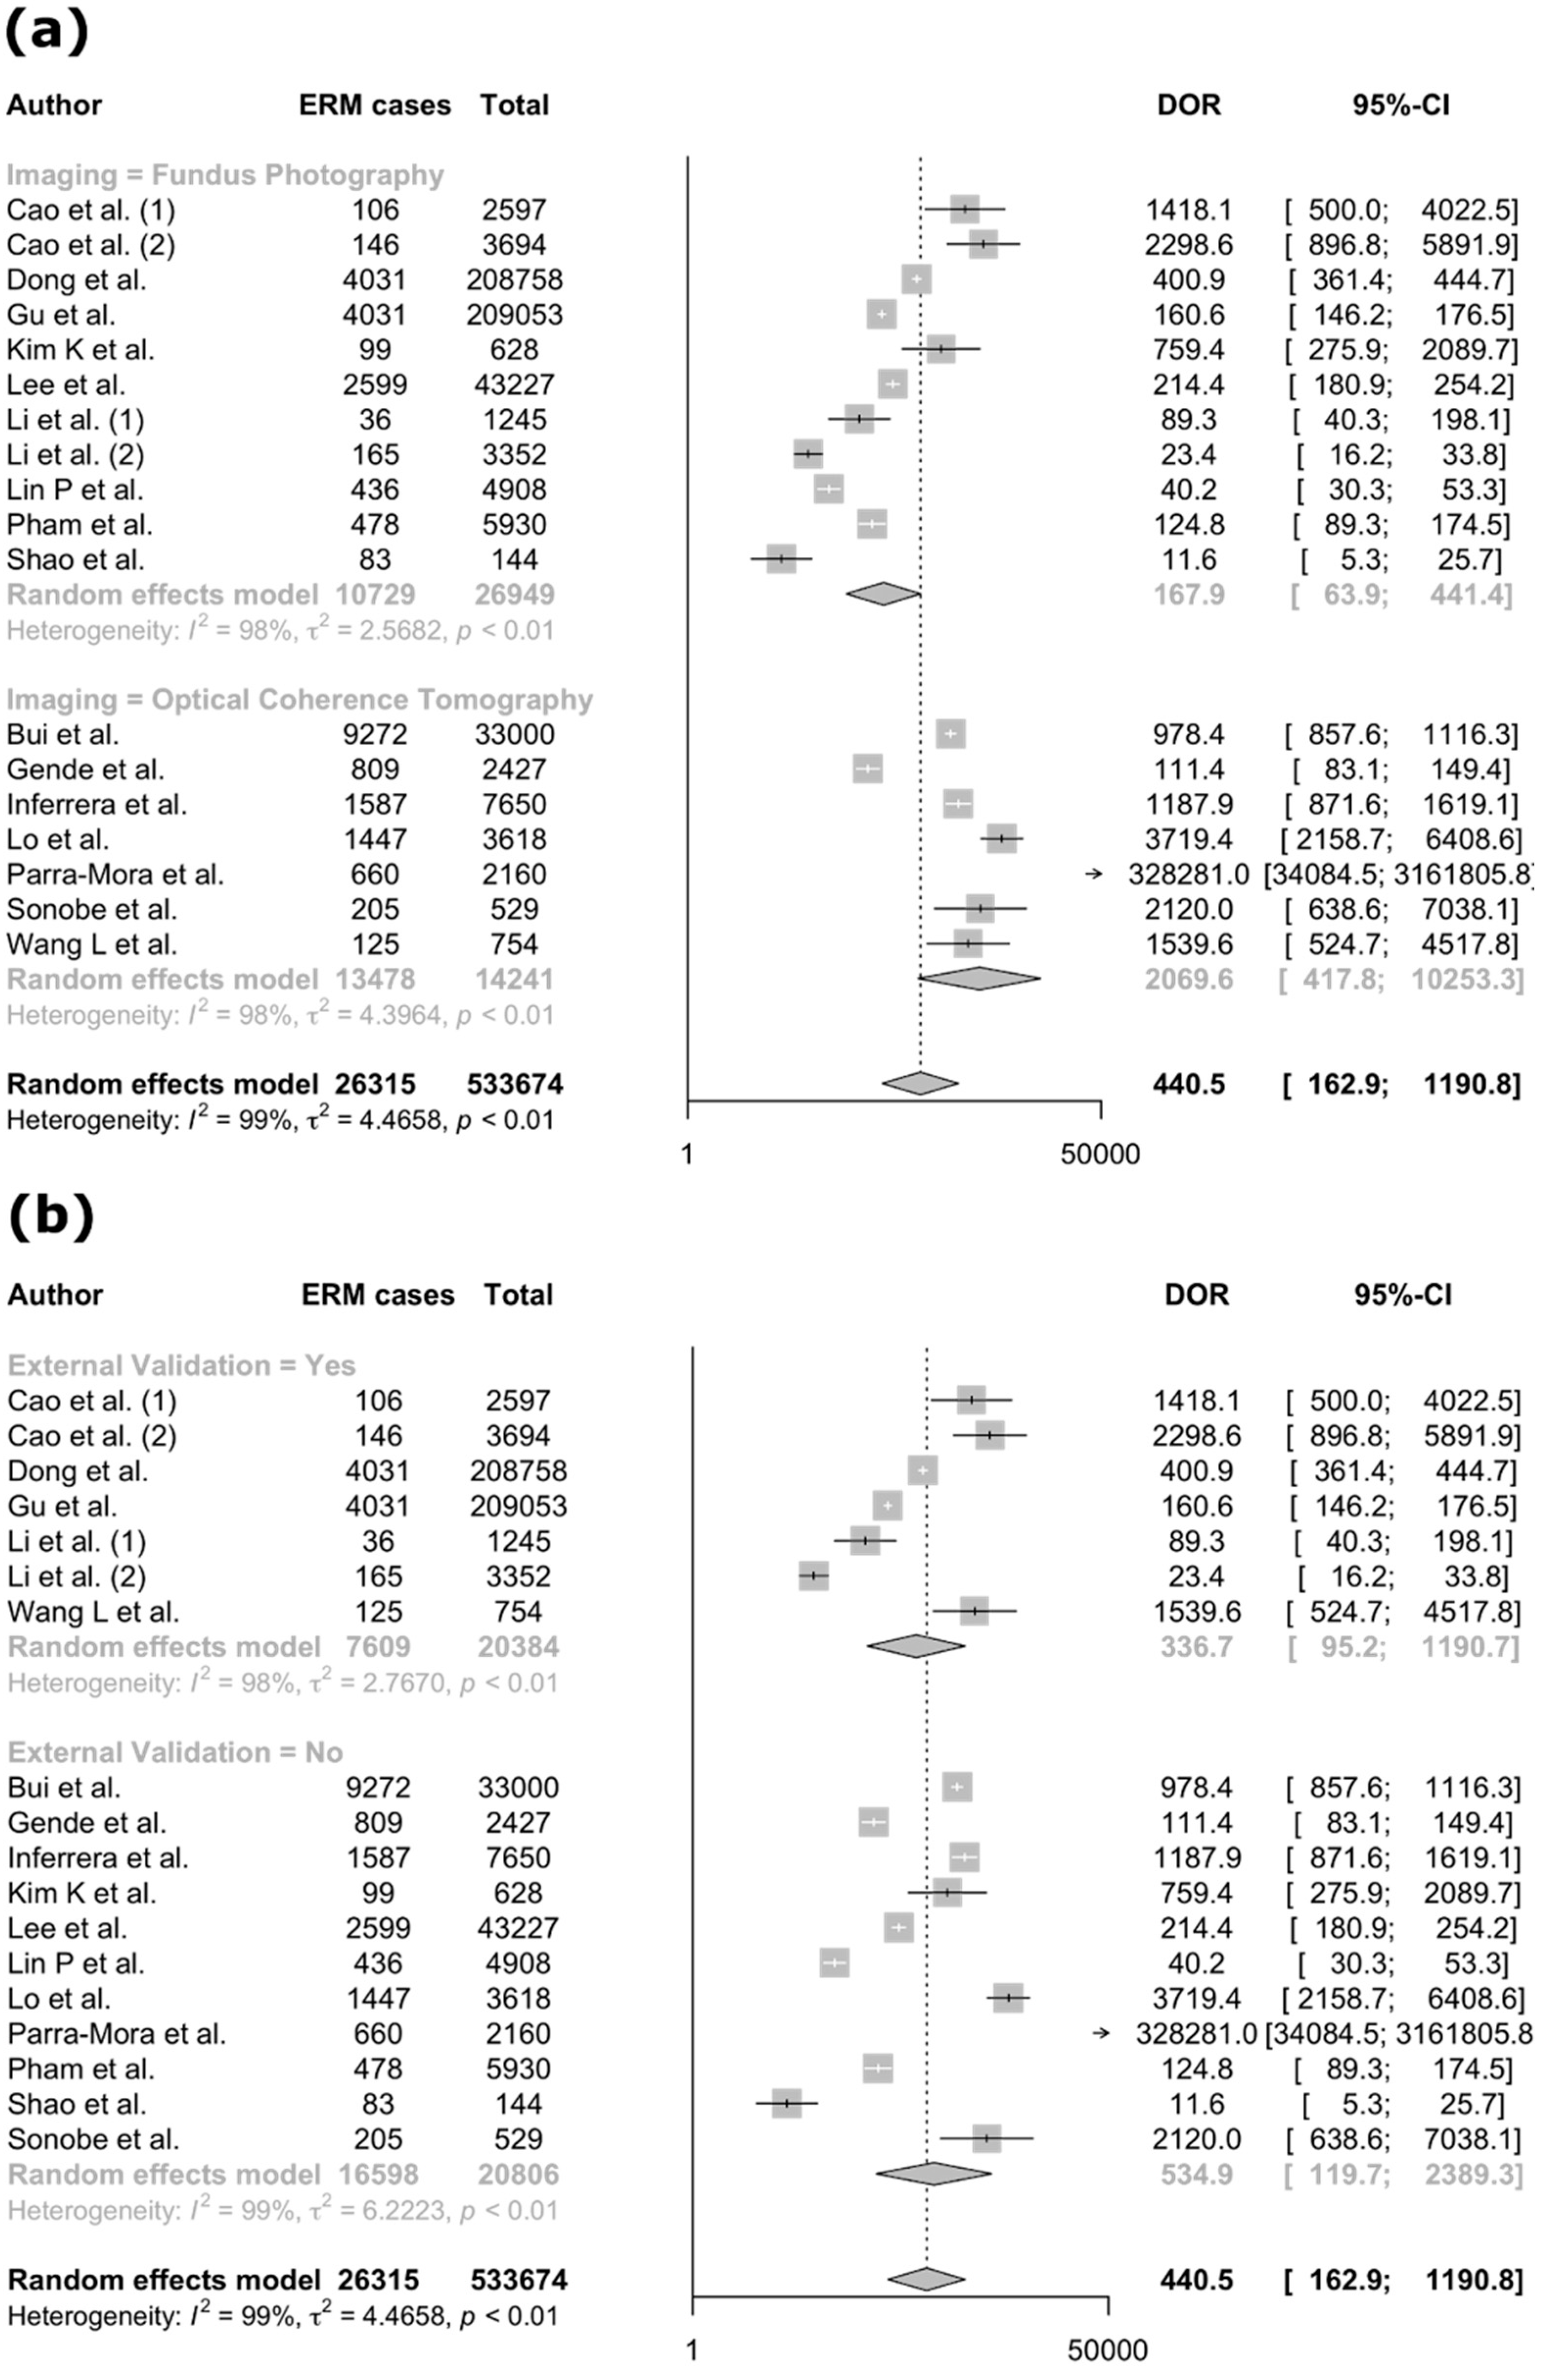
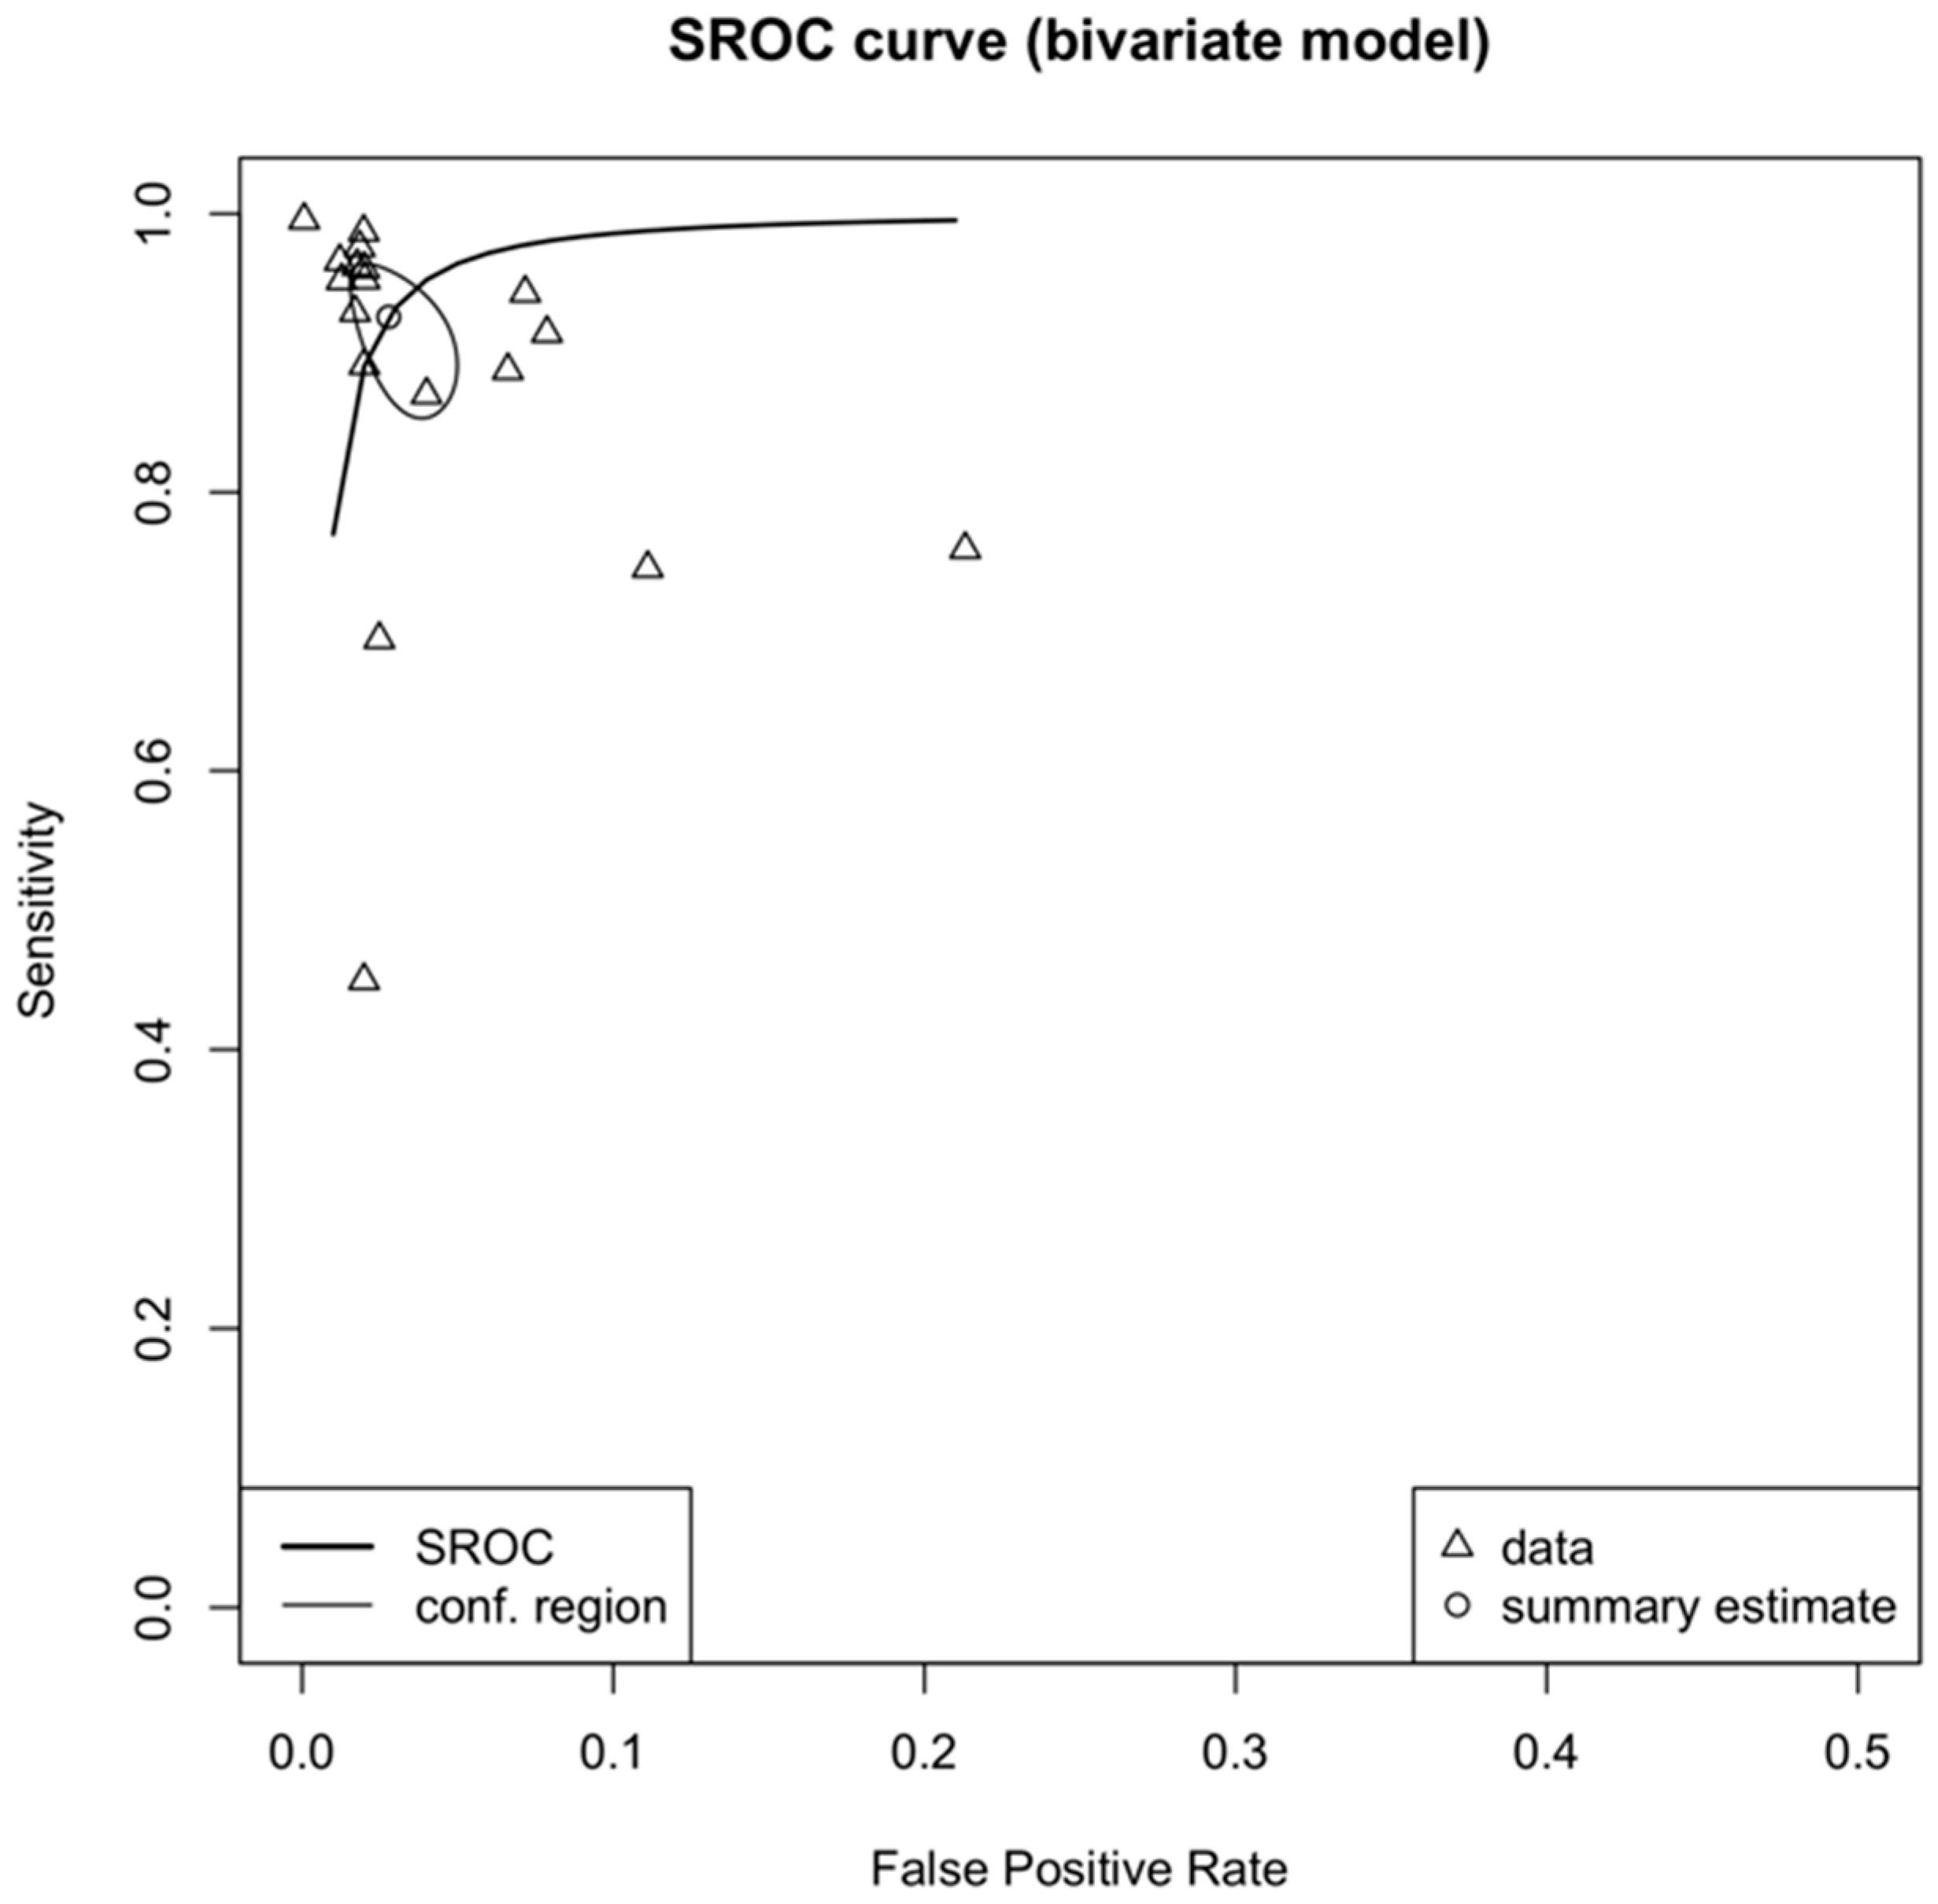
Sixteen studies [1,20,21,24,25,28,31,34,35,37,39,41,43,44,46,51] comprising a total of 533,674 images—of which 26,315 were positive for ERM—were included in the meta-analysis (Supplementary Table S2). DL algorithms demonstrated high diagnostic performance across all pooled metrics (Figure 7, Figure 8, Figure 9, Figure 10, Figure 11, Figure 12 and Figure 13). The overall pooled sensitivity was 0.927 (95% CI: 0.875 to 0.958), while the pooled specificity was 0.973 (95% CI: 0.957 to 0.983). Positive and negative predictive values were also favorable, with pooled PPV and NPV of 0.820 (95% CI: 0.666 to 0.913) and 0.991 (95% CI: 0.982 to 0.995), respectively. The overall diagnostic accuracy was 0.967 (95% CI: 0.948 to 0.979), and the DOR was 440.5 (95% CI: 162.9 to 1190.8). Heterogeneity was substantial across all metrics, with I2 values exceeding 98% for each, indicating considerable between-study variability. The SROC yielded an AUC of 0.983 and a normalized pAUC of 0.963, reflecting excellent overall discriminative ability.
Subgroup analysis based on the use of external validation datasets revealed important differences in diagnostic performance. In studies that used external validation, the pooled sensitivity was 0.90 (95% CI: 0.82 to 0.95) and the specificity was 0.97 (95% CI: 0.96 to 0.99). However, the PPV was substantially lower at 0.58 (95% CI: 0.37 to 0.77), while the NPV remained very high at 1.00 (95% CI: 0.99 to 1.00). In contrast, studies that relied solely on internal validation reported a higher sensitivity of 0.94 (95% CI: 0.87 to 0.97) and a similar specificity of 0.97 (95% CI: 0.94 to 0.99). The PPV in this subgroup was markedly higher at 0.91 (95% CI: 0.78 to 0.96), while the NPV was 0.98 (95% CI: 0.96 to 0.99). These findings suggest that while DL models retain high sensitivity and NPV under external validation conditions, their PPV—and thus their ability to correctly identify true positives—declines when evaluated on previously unseen data.
When stratified by imaging modality, DL algorithms using OCT images demonstrated superior diagnostic performance compared to those using fundus photographs. For models trained on fundus photography, the pooled sensitivity was 0.87 (95% CI: 0.78 to 0.93), and the specificity was 0.96 (95% CI: 0.94 to 0.98). The PPV and NPV in this group were 0.59 (95% CI: 0.45 to 0.72) and 0.99 (95% CI: 0.98 to 1.00), respectively. In contrast, models developed and tested using OCT images achieved a pooled sensitivity of 0.97 (95% CI: 0.94 to 0.99) and a specificity of 0.98 (95% CI: 0.97 to 0.99). The PPV for OCT-based models was 0.96 (95% CI: 0.92 to 0.98), and the NPV was 0.99 (95% CI: 0.98 to 0.99). Accuracy and DOR followed the same pattern, with OCT models achieving a DOR of 2069.6 (95% CI: 417.8 to 10,253.3), significantly higher than the 167.9 (95% CI: 63.9 to 441.4) observed in fundus-based models.
Together, these results confirm that DL systems are capable of achieving near-expert performance in detecting ERM, particularly when applied to OCT data. However, the reduced PPV observed under external validation highlights the importance of evaluating models on truly independent datasets to ensure generalizability before clinical implementation.

4. Discussion

4.1. Overview and Comparison with Previous Work

Existing systematic reviews have investigated the performance of AI models in the detection of ophthalmic diseases, such as age-related macular degeneration (AMD) [54], retinal detachment (RD) [55], and pathological myopia [56]. ERM can cause significant visual disturbances and a decrease in visual acuity. Therefore, AI may play a key role in early diagnosis and in predicting postoperative outcomes. To the best of our knowledge, only one recent systematic review and meta-analysis has focused on ERM detection using AI models [57]. Our work expands on this by also including studies that employed AI for segmentation of ERM-related features and prediction of postoperative BCVA.
Segmentation studies demonstrated promising performance, suggesting that AI could help identify ERM and related retinal layers to support diagnosis and surgical planning. Quantitative segmentation outputs, such as AI-assisted ERM thickness measurements, may also assist clinicians in surgical decision-making, although this aspect was beyond the primary scope of our review. Four studies [1,30,42,53] applying segmentation-based approaches reported consistently strong results, indicating that feature-level segmentation can enhance diagnostic precision and clinical interpretability. This is in line with evidence from other retinal diseases, such as geographic atrophy, where AI segmentation models have shown excellent performance [58]. Similarly, studies that investigated postoperative BCVA prediction showed encouraging preliminary results, indicating that AI could potentially support clinicians in estimating visual outcomes after surgery. However, due to the limited number of studies—seven focusing on BCVA prediction [2,5,7,29,32,49,52] and four on segmentation [1,30,42,53]—and the substantial heterogeneity in their reported performance metrics, these studies were not included in our quantitative synthesis. Further robust, standardized research is needed to better establish the role of AI in predicting postoperative outcomes.
Our meta-analysis included 16 studies [1,20,21,24,25,28,31,34,35,37,39,41,43,44,46,51] and assessed the diagnostic performance of AI algorithms for ERM detection based on OCT images and fundus photographs. The results confirmed the high performance of AI models in ERM detection. When stratified by imaging modality, models trained on OCT scans demonstrated superior diagnostic performance compared to those trained on fundus photographs. These findings contrast with those of Mikhail et al. [57], who reported that OCT-based models showed lower accuracy and specificity than fundus-based ones. Although OCT-based models were clearly superior in pooled sensitivity (0.97) and PPV (0.96), fundus-based models retained high specificity (0.96) and very high NPV, making them attractive for triage, screening, and primary-care deployments where OCT is not available. Fundus photography also offers advantages in low-resource or community settings due to its lower cost, portability, and widespread accessibility. Optimizing AI algorithms for fundus-based ERM detection could therefore support early identification of cases in underserved populations and help reduce healthcare disparities in access to retinal diagnostics.
Furthermore, our subgroup analysis based on the use of external validation sets revealed that sensitivity and NPV remained high when external datasets were used, whereas PPV tended to decrease when models were applied to previously unseen data. In addition, the sharp decline in PPV that we observed under external validation suggests that ERM models should undergo site-specific recalibration. Practical options include simple threshold resetting to local prevalence, post hoc probability calibration (e.g., temperature scaling), or lightweight domain adaptation to account for OCT-device and demographic shifts. Reporting such recalibration procedures will improve real-world transportability. Overall, these results suggest that AI-based models are reliable tools for ERM detection, though their performance may vary depending on image quality, patient demographics, and dataset characteristics.
The clinical value of this review lies in demonstrating how AI-based systems can streamline the diagnosis and management of ERM. Automated detection and segmentation can reduce interobserver variability and save time in clinical workflows, while postoperative BCVA prediction models may assist in patient counseling and surgical planning. Integrating such tools into routine image analysis could therefore enhance diagnostic precision, improve efficiency, and support more personalized management strategies for patients with ERM.

4.2. AI Architecture and Model Characteristics

In this systematic review, the majority of the included studies employed DL. More specifically, CNNs were the predominant model architecture, including various versions of pretrained architectures such as AlexNet, ResNet, DenseNet, and Inception v3. The introduction of ensemble models [23,26] and hybrid architectures has also enhanced the diagnostic accuracy of the models. Interestingly, only one study [6] exclusively employed classical ML models such as Multilayer Perceptron, Naive Bayes, K-Nearest Neighbors, and Random Forest, whereas a few others integrated a combination of both DL and ML approaches [18,21,26,37,46,51]. This architectural diversity reflects ongoing efforts in retinal imaging research to identify the most effective and accurate AI-based models for diagnosing ERM and other retinal diseases. This approach is supported by previous research, as ensemble mechanisms can extract diverse image features and achieve higher performance. They have also been shown to outperform human graders, and they can be trained for predictive modeling [59].

4.3. Model Explainability

Most ML and DL models are neither inherently interpretable nor explainable. Post hoc explainability-enhancing algorithms are a complementary AI tool that facilitates the interpretation of black box models [60]. Among the 42 included studies, 64% had applied some form of XAI, reflecting not only the evolution of more reliable AI models but also the increasing importance of interpretability in clinical decision-making. Gradient-weighted Class Activation Mapping (Grad-CAM) was the most widely used method, featured in 74% of the XAI-enabled studies. Grad-CAM generates visual heatmaps highlighting regions of the image influencing the outcome [61]. Some studies incorporated Local Interpretable Model-Agnostic Explanations (LIME), attention-based heatmaps, saliency maps, other Class Activation Maps (CAM), and feature importance metrics to increase explainability. Despite the substantial role of XAI tools, concerns remain regarding their reliability. Several studies have shown that these visualizations can compromise consistency, sometimes highlighting irrelevant image features and potentially jeopardizing clinical decisions, particularly when the explanation provided by the saliency map does not align with the prediction [62]. From this point of view, future research should emphasize the development of either inherently interpretable models or more reliable post hoc methods to maximize the potential of XAI in ERM detection.

4.4. Strengths and Limitations

This study has several strengths. We calculated pooled performance metrics, including PPV and NPV, to assess the diagnostic accuracy of AI models. This may reflect the models’ practical use in clinical settings and shift the focus of current research toward the application of AI models on real-world data. Another strength is the stratification based on the use of an external dataset and imaging modality. We showed that the PPV of the models decreases when tested on external datasets, highlighting the need for external validation to ensure reliability and generalizability. We also showed that models trained and tested on OCT images demonstrated higher performance, which aligns with the use of OCT as the gold standard in ERM diagnosis. Furthermore, although we could not quantify the applicability of prognostic AI models for predicting postoperative outcomes in ERM, such as the BCVA, we identified existing studies in the literature and highlighted the need for further research in this area.
Despite the promising results, several important limitations can be identified. First, although the results regarding models’ performance were encouraging, there was high heterogeneity, indicating variability between studies and suggesting cautious interpretation of the findings.
Secondly, the majority of studies used retrospective data from single institutions (self-built datasets). While these datasets are readily available and convenient for model development, they inherently limit the generalizability of AI models. Among the 42 studies included in this systematic review, 52% used data from single institutions, and only 19% engaged private or public datasets collected from broader networks, highlighting the predominance of limited-scope data. Single-center datasets often reflect narrow patient demographics, localized disease prevalence, and institution-specific diagnostic or labeling practices. We did not collect or analyze specific demographic characteristics of the population, such as age, sex, or ophthalmic history, which limits the generalizability of our results. Additionally, the size of these datasets poses a further limitation in evaluating models’ performance and reliability [63].
It is worth noting that many of the included AI models were not trained and tested on ERM-only datasets, but also on a broader range of retinal conditions, such as AMD, DR, macular hole, myopia, and branch retinal vein occlusion (BRVO). While this multi-disease approach enhances the applicability in real-world practice [10], it may limit the model’s ability to accurately detect ERM, particularly when ERM cases represent a small proportion of the overall dataset. In such cases, multi-label classification models may exhibit reduced performance in detecting ERM specifically. Enhancing accuracy and generalizability requires the use of larger and enriched datasets and the adoption of transfer learning strategies [33].
Another important limitation is the limited use of external and real-world clinical validation. Although internal validation techniques such as hold-out and cross-validation were routinely performed, only a limited number of studies advanced beyond this phase and tested their algorithms on truly independent datasets, which is essential for improving model generalizability and robustness. This represents a critical gap, as algorithm performance can be negatively affected when applied to broader or more heterogeneous patient populations, highlighting the need for external validation using datasets that differ in device type, patient demographics, and disease presentation.
An additional limitation of this review is the potential noise introduced in ground truth labeling due to the use of mixed graders across many studies, which affects both the reliability of the models and contributes to heterogeneity [64]. While some articles clearly stated that annotations were performed by experienced retinal specialists [25], others involved graders with varying levels of expertise [34] or did not report grader qualifications at all [7]. For example, one study [51] reported interrater variability in ERM labeling using the kappa statistic, highlighting the challenge of consistent annotation even among experts. This reflects the need for standardized grading protocols or adjudication procedures to ensure consistency in expert labeling and annotation. It should also be noted that we did not compare the performance between human graders and AI models due to limited data availability.
Among the included studies, one [6] used a methodological variation in ERM classification, employing both a two-class and three-class classification approach. The majority of studies employed a binary approach (ERM versus normal), which simplifies model training and usually achieves higher overall accuracy. However, this may not correspond to the real-world clinical data, where the ERM stage varies. Therefore, while multi-class classification can provide wider and more detailed diagnostic information, it also poses challenges such as increased complexity and reduced model performance. There is also a lack of studies focusing on the monitoring and management of ERM using AI-based models, highlighting an important gap that future research should address.
Another potential limitation of this review is the exclusion of non-English publications and preprints, which may have introduced selection bias. Given the global nature of AI research in ophthalmology, relevant studies published in other languages or as preprints—particularly from rapidly advancing research communities in Asia—might not have been captured. Although this decision ensured methodological consistency and quality control, it may have limited the comprehensiveness of the included evidence.

4.5. QUADAS-2 and CLAIM Assessments

The risk of bias assessment using only the QUADAS-2 tool was challenging. To address the limitations of the QUADAS-2 tool, which is not specifically designed for evaluating AI-based diagnostic studies, we incorporated the CLAIM guideline. Thus, we combined the assessment of methodological bias with AI-specific quality evaluation. According to the QUADAS-2 assessment, most of the studies showed low risk of bias in the domains of patient selection, reference standard, and flow/timing. However, a high risk of bias was observed in the index test domain, probably due to the lack of a pre-specified threshold. Several of the included studies used mixed graders or did not fully report grader qualifications, introducing potential inter-grader variability in the reference standard. One study explicitly reported inter-rater agreement, confirming that label noise is not negligible in ERM datasets. Additionally, differences in annotation methods across studies may have further introduced annotation noise, potentially inflating diagnostic accuracy and leading to overestimated sensitivity and specificity. Similar overestimations could also stem from high or “unclear risk” in the index test domain, particularly in single-center studies. Collectively, these sources of bias likely contributed to the substantial heterogeneity (I2 > 98%) observed across pooled metrics. Because most original studies did not provide re-estimates under alternative reference standards, we could only discuss—rather than recompute—the quantitative impact. This underscores the need for detailed reporting of the model development process, with regard to classification cut-offs and standardization methods.
On the other hand, the CLAIM assessment revealed moderate variability in reporting quality across the studies, with the proportion of “Yes” answers ranging from below 50% to above 85%. While several studies clearly defined the AI model design and transparency, others lacked important methodological disclosures, such as dataset composition, explainability techniques, or performance metrics. These findings underline the importance of bias reduction strategies to ensure the reliability and reproducibility of AI tools intended for clinical integration in ERM detection.

4.6. Approach for Future Studies

In addition to the technical advancements already discussed—such as multicenter prospective data collection, external and real-world clinical validation, interrater reliability, and the development of clinically explainable AI models—future studies should also focus on ethical and regulatory compliance. The recent implementation of the EU AI Act [65], in conjunction with frameworks such as the General Data Protection Regulation (GDPR) [66], underscores the importance of preserving patient anonymity. To align with these regulations, future AI models for ERM assessment must incorporate robust de-identification strategies. Such practices will not only protect sensitive medical data but also enhance the transparency, accountability, and overall quality of AI model reporting.
In practical terms, compliance with regulatory and ethical frameworks such as the EU AI Act and GDPR requires technical and procedural safeguards. These include de-identification at the DICOM or OCT volume level, local or on-premise model training to minimize patient data exposure, and the adoption of model-card style documentation to ensure transparency regarding model design and limitations. Continuous post-deployment monitoring and auditing are also essential to maintain safety and accountability throughout the model’s clinical lifecycle.

5. Conclusions

In conclusion, this systematic review and meta-analysis highlight the promising performance of AI applications in the assessment of ERM, with a particular emphasis on DL models using OCT and color fundus images. Despite ongoing algorithmic advances, critical limitations in the current literature remain, including limited external validation, insufficient explainability techniques, and scarce real-world clinical testing. Future research should focus on multicenter data collection, external benchmarking, standardized labeling protocols, and prospective clinical validation. Privacy-preserving approaches, such as federated or swarm learning, where model parameters rather than patient images are exchanged across sites, may enable training on heterogeneous OCT devices and demographics, while maintaining compliance with GDPR and EU AI Act requirements.

Supplementary Materials

The following supporting information can be downloaded at: https://www.mdpi.com/article/10.3390/app152212280/s1, Table S1: PRISMA 2020 checklist; Table S2: Performance metrics of selected studies.

Author Contributions

Conceptualization, P.M., D.M. and E.M.; methodology, P.M. and D.M.; validation, P.M., A.S. and E.M.; formal analysis, A.K. and E.M.; investigation, P.M., D.M. and K.T.; writing—original draft preparation, P.M. and D.M.; writing—review and editing E.M., I.D.A. and N.P.; visualization, E.M. and A.K.; supervision, E.M. and I.G.; project administration, E.M. All authors have read and agreed to the published version of the manuscript.

Funding

This research received no external funding.

Data Availability Statement

Data supporting this systematic review and meta-analysis are available in the published studies included in the review.

Conflicts of Interest

The authors declare no conflicts of interest.

Abbreviations

The following abbreviations are used in this manuscript:
AIArtificial Intelligence
AMDAge-related Macular Degeneration
ANNArtificial Neural Network
AUCArea Under the Curve
BCVABest Corrected Visual Acuity
BRVOBranch Retinal Vein Occlusion
CAMClass Activation Map
CFIColor Fundus Images
CIConfidence Interval
CLAIMChecklist for Artificial Intelligence in Medical Imaging
CNNConvolutional Neural Network
DLDeep Learning
DORDiagnostic Odds Ratio
ERMEpiretinal Membrane
EUEuropean Union
FNFalse Negative
FPFalse Positive
GDPRGeneral Data Protection Regulation
Grad-CAMGradient-weighted Class Activation Mapping
HDHigh-Definition
ICTRPInternational Clinical Trials Registry Platform
ILMInternal Limiting Membrane
LIMELocal Interpretable Model-agnostic Explanations
MLMachine Learning
NPVNegative Predictive Value
OCTOptical Coherence Tomography
pAUCPartial Area Under the Curve
PICOSPopulation Intervention Comparator Outcome Study Design
PPVPositive Predictive Value
PRISMAPreferred Reporting Items for Systematic Reviews and Meta-Analyses
QUADAS-2Quality Assessment of the Diagnostic Accuracy Studies-2
RDRetinal Detachment
ROCReceiver Operating Characteristics
RPERetinal Pigment Epithelium
SDSpectral-Domain
SROCSummary Receiver Operating Characteristics
SSSwept-Source
TNTrue Negative
TPTrue Positive
WHOWorld Health Organization
XAIExplainable Artificial Intelligence

References

  1. Gende, M.; Moura, J.D.; Novo, J.; Ortega, M. End-to-End Multi-Task Learning Approaches for the Joint Epiretinal Membrane Segmentation and Screening in OCT Images. Comput. Med. Imaging Graph. 2022, 98, 102068. [Google Scholar] [CrossRef] [PubMed]
  2. Hsia, Y.; Lin, Y.-Y.; Wang, B.-S.; Su, C.-Y.; Lai, Y.-H.; Hsieh, Y.-T. Prediction of Visual Impairment in Epiretinal Membrane and Feature Analysis: A Deep Learning Approach Using Optical Coherence Tomography. Asia-Pac. J. Ophthalmol. 2023, 12, 21–28. [Google Scholar] [CrossRef]
  3. Kim, J.; Chin, H.S. Deep Learning-Based Prediction of the Retinal Structural Alterations after Epiretinal Membrane Surgery. Sci. Rep. 2023, 13, 19275. [Google Scholar] [CrossRef] [PubMed]
  4. Fung, A.T.; Galvin, J.; Tran, T. Epiretinal Membrane: A Review. Clin. Exp. Ophthalmol. 2021, 49, 289–308. [Google Scholar] [CrossRef] [PubMed]
  5. Crincoli, E.; Savastano, M.C.; Savastano, A.; Caporossi, T.; Bacherini, D.; Miere, A.; Gambini, G.; De Vico, U.; Baldascino, A.; Minnella, A.M.; et al. New artificial intelligence analysis for prediction of long-term visual improvement after epiretinal membrane surgery. Retina 2023, 43, 173–181. [Google Scholar] [CrossRef]
  6. Baamonde, S.; De Moura, J.; Novo, J.; Charlón, P.; Ortega, M. Automatic Identification and Characterization of the Epiretinal Membrane in OCT Images. Biomed. Opt. Express 2019, 10, 4018. [Google Scholar] [CrossRef]
  7. Yeh, T.-C.; Chen, S.-J.; Chou, Y.-B.; Luo, A.-C.; Deng, Y.-S.; Lee, Y.-H.; Chang, P.-H.; Lin, C.-J.; Tai, M.-C.; Chen, Y.-C.; et al. Predicting visual outcome after surgery in patients with idiopathic epiretinal membrane using a novel convolutional neural network. Retina 2023, 43, 767–774. [Google Scholar] [CrossRef]
  8. Saleh, G.A.; Batouty, N.M.; Haggag, S.; Elnakib, A.; Khalifa, F.; Taher, F.; Mohamed, M.A.; Farag, R.; Sandhu, H.; Sewelam, A.; et al. The Role of Medical Image Modalities and AI in the Early Detection, Diagnosis and Grading of Retinal Diseases: A Survey. Bioengineering 2022, 9, 366. [Google Scholar] [CrossRef]
  9. Pinto-Coelho, L. How Artificial Intelligence is Shaping Medical Imaging Technology: A Survey of Innovations and Applications. Bioengineering 2023, 10, 1435. [Google Scholar] [CrossRef]
  10. Bai, J.; Wan, Z.; Li, P.; Chen, L.; Wang, J.; Fan, Y.; Chen, X.; Peng, Q.; Gao, P. Accuracy and Feasibility with AI-Assisted OCT in Retinal Disorder Community Screening. Front. Cell Dev. Biol. 2022, 10, 1053483. [Google Scholar] [CrossRef]
  11. Karamanli, K.-E.; Maliagkani, E.; Petrou, P.; Papageorgiou, E.; Georgalas, I. Artificial Intelligence in Decoding Ocular Enigmas: A Literature Review of Choroidal Nevus and Choroidal Melanoma Assessment. Appl. Sci. 2025, 15, 3565. [Google Scholar] [CrossRef]
  12. Shamshirband, S.; Fathi, M.; Dehzangi, A.; Chronopoulos, A.T.; Alinejad-Rokny, H. A Review on Deep Learning Approaches in Healthcare Systems: Taxonomies, Challenges, and Open Issues. J. Biomed. Inform. 2021, 113, 103627. [Google Scholar] [CrossRef] [PubMed]
  13. Cabitza, F.; Campagner, A.; Soares, F.; García de Guadiana-Romualdo, L.; Challa, F.; Sulejmani, A.; Seghezzi, M.; Carobene, A. The Importance of Being External. Methodological Insights for the External Validation of Machine Learning Models in Medicine. Comput. Methods Programs Biomed. 2021, 208, 106288. [Google Scholar] [CrossRef]
  14. Page, M.J.; McKenzie, J.E.; Bossuyt, P.M.; Boutron, I.; Hoffmann, T.C.; Mulrow, C.D.; Shamseer, L.; Tetzlaff, J.M.; Akl, E.A.; Brennan, S.E.; et al. The PRISMA 2020 Statement: An Updated Guideline for Reporting Systematic Reviews. Syst. Rev. 2021, 10, 89. [Google Scholar] [CrossRef] [PubMed]
  15. Methley, A.M.; Campbell, S.; Chew-Graham, C.; McNally, R.; Cheraghi-Sohi, S. PICO, PICOS and SPIDER: A Comparison Study of Specificity and Sensitivity in Three Search Tools for Qualitative Systematic Reviews. BMC Health Serv. Res. 2014, 14, 579. [Google Scholar] [CrossRef]
  16. Whiting, P.F.; Rutjes, A.W.S.; Westwood, M.E.; Mallett, S.; Deeks, J.J.; Reitsma, J.B.; Leeflang, M.M.G.; Sterne, J.A.C.; Bossuyt, P.M.M.; the QUADAS-2 Group. QUADAS-2: A Revised Tool for the Quality Assessment of Diagnostic Accuracy Studies. Ann. Intern. Med. 2011, 155, 529–536. [Google Scholar] [CrossRef]
  17. Tejani, A.S.; Klontzas, M.E.; Gatti, A.A.; Mongan, J.T.; Moy, L.; Park, S.H.; Kahn, C.E., Jr.; for the CLAIM 2024 Update Panel. Checklist for Artificial Intelligence in Medical Imaging (CLAIM): 2024 Update. Radiol. Artif. Intell. 2024, 6, e240300. [Google Scholar] [CrossRef]
  18. Ait Hammou, B.; Antaki, F.; Boucher, M.-C.; Duval, R. MBT: Model-Based Transformer for Retinal Optical Coherence Tomography Image and Video Multi-Classification. Int. J. Med. Inform. 2023, 178, 105178. [Google Scholar] [CrossRef]
  19. Boyina, L.; Boddu, K.; Tankasala, Y.; Vani, K.S. Classification of Uncertain ImageNet Retinal Diseases Using ResNet Model. Int. J. Intell. Syst. Appl. Eng. 2022, 10, 35–42. [Google Scholar]
  20. Bui, P.-N.; Le, D.-T.; Bum, J.; Kim, S.; Song, S.J.; Choo, H. Multi-Scale Learning with Sparse Residual Network for Explainable Multi-Disease Diagnosis in OCT Images. Bioengineering 2023, 10, 1249. [Google Scholar] [CrossRef]
  21. Cao, J.; You, K.; Zhou, J.; Xu, M.; Xu, P.; Wen, L.; Wang, S.; Jin, K.; Lou, L.; Wang, Y.; et al. A Cascade Eye Diseases Screening System with Interpretability and Expandability in Ultra-Wide Field Fundus Images: A Multicentre Diagnostic Accuracy Study. eClinicalMedicine 2022, 53, 101633. [Google Scholar] [CrossRef] [PubMed]
  22. Cen, L.-P.; Ji, J.; Lin, J.-W.; Ju, S.-T.; Lin, H.-J.; Li, T.-P.; Wang, Y.; Yang, J.-F.; Liu, Y.-F.; Tan, S.; et al. Automatic Detection of 39 Fundus Diseases and Conditions in Retinal Photographs Using Deep Neural Networks. Nat. Commun. 2021, 12, 4828. [Google Scholar] [CrossRef] [PubMed]
  23. Chen, X.; Xue, Y.; Wu, X.; Zhong, Y.; Rao, H.; Luo, H.; Weng, Z. Deep Learning-Based System for Disease Screening and Pathologic Region Detection From Optical Coherence Tomography Images. Trans. Vis. Sci. Tech. 2023, 12, 29. [Google Scholar] [CrossRef]
  24. Dong, L.; He, W.; Zhang, R.; Ge, Z.; Wang, Y.X.; Zhou, J.; Xu, J.; Shao, L.; Wang, Q.; Yan, Y.; et al. Artificial Intelligence for Screening of Multiple Retinal and Optic Nerve Diseases. JAMA Netw. Open 2022, 5, e229960. [Google Scholar] [CrossRef] [PubMed]
  25. Gu, C.; Wang, Y.; Jiang, Y.; Xu, F.; Wang, S.; Liu, R.; Yuan, W.; Abudureyimu, N.; Wang, Y.; Lu, Y.; et al. Application of Artificial Intelligence System for Screening Multiple Fundus Diseases in Chinese Primary Healthcare Settings: A Real-World, Multicentre and Cross-Sectional Study of 4795 Cases. Br. J. Ophthalmol. 2024, 108, 424–431. [Google Scholar] [CrossRef]
  26. Hirota, M.; Ueno, S.; Inooka, T.; Ito, Y.; Takeyama, H.; Inoue, Y.; Watanabe, E.; Mizota, A. Automatic Screening of the Eyes in a Deep-Learning–Based Ensemble Model Using Actual Eye Checkup Optical Coherence Tomography Images. Appl. Sci. 2022, 12, 6872. [Google Scholar] [CrossRef]
  27. Hung, C.-L.; Lin, K.-H.; Lee, Y.-K.; Mrozek, D.; Tsai, Y.-T.; Lin, C.-H. The Classification of Stages of Epiretinal Membrane Using Convolutional Neural Network on Optical Coherence Tomography Image. Methods 2023, 214, 28–34. [Google Scholar] [CrossRef]
  28. Inferrera, L.; Borsatti, L.; Miladinovic, A.; Marangoni, D.; Giglio, R.; Accardo, A.; Tognetto, D. OCT-Based Deep-Learning Models for the Identification of Retinal Key Signs. Sci. Rep. 2023, 13, 14628. [Google Scholar] [CrossRef]
  29. Inoda, S.; Takahashi, H.; Arai, Y.; Tampo, H.; Matsui, Y.; Kawashima, H.; Yanagi, Y. An AI Model to Estimate Visual Acuity Based Solely on Cross-Sectional OCT Imaging of Various Diseases. Graefes Arch. Clin. Exp. Ophthalmol. 2023, 261, 2775–2785. [Google Scholar] [CrossRef]
  30. Jin, K.; Yan, Y.; Wang, S.; Yang, C.; Chen, M.; Liu, X.; Terasaki, H.; Yeo, T.-H.; Singh, N.G.; Wang, Y.; et al. iERM: An Interpretable Deep Learning System to Classify Epiretinal Membrane for Different Optical Coherence Tomography Devices: A Multi-Center Analysis. J. Clin. Med. 2023, 12, 400. [Google Scholar] [CrossRef]
  31. Kim, K.M.; Heo, T.-Y.; Kim, A.; Kim, J.; Han, K.J.; Yun, J.; Min, J.K. Development of a Fundus Image-Based Deep Learning Diagnostic Tool for Various Retinal Diseases. J. Clin. Med. 2021, 11, 321. [Google Scholar] [CrossRef]
  32. Kim, S.H.; Ahn, H.; Yang, S.; Soo Kim, S.; Lee, J.H. Deep learning-based prediction of outcomes following noncomplicated epiretinal membrane surgery. Retina 2022, 42, 1465–1471. [Google Scholar] [CrossRef] [PubMed]
  33. Kuwayama, S.; Ayatsuka, Y.; Yanagisono, D.; Uta, T.; Usui, H.; Kato, A.; Takase, N.; Ogura, Y.; Yasukawa, T. Automated Detection of Macular Diseases by Optical Coherence Tomography and Artificial Intelligence Machine Learning of Optical Coherence Tomography Images. J. Ophthalmol. 2019, 2019, 6319581. [Google Scholar] [CrossRef] [PubMed]
  34. Lee, J.; Lee, J.; Cho, S.; Song, J.; Lee, M.; Kim, S.H.; Lee, J.Y.; Shin, D.H.; Kim, J.M.; Bae, J.H.; et al. Development of Decision Support Software for Deep Learning-Based Automated Retinal Disease Screening Using Relatively Limited Fundus Photograph Data. Electronics 2021, 10, 163. [Google Scholar] [CrossRef]
  35. Li, B.; Chen, H.; Zhang, B.; Yuan, M.; Jin, X.; Lei, B.; Xu, J.; Gu, W.; Wong, D.C.S.; He, X.; et al. Development and Evaluation of a Deep Learning Model for the Detection of Multiple Fundus Diseases Based on Colour Fundus Photography. Br. J. Ophthalmol. 2021, 106, 1079–1086. [Google Scholar] [CrossRef]
  36. Lin, D.; Xiong, J.; Liu, C.; Zhao, L.; Li, Z.; Yu, S.; Wu, X.; Ge, Z.; Hu, X.; Wang, B.; et al. Application of Comprehensive Artificial Intelligence Retinal Expert (CARE) System: A National Real-World Evidence Study. Lancet Digit. Health 2021, 3, e486–e495. [Google Scholar] [CrossRef]
  37. Lin, P.-K.; Chiu, Y.-H.; Huang, C.-J.; Wang, C.-Y.; Pan, M.-L.; Wang, D.-W.; Mark Liao, H.-Y.; Chen, Y.-S.; Kuan, C.-H.; Lin, S.-Y.; et al. PADAr: Physician-Oriented Artificial Intelligence-Facilitating Diagnosis Aid for Retinal Diseases. J. Med. Imag. 2022, 9, 044501. [Google Scholar] [CrossRef]
  38. Liu, X.; Zhao, C.; Wang, L.; Wang, G.; Lv, B.; Lv, C.; Xie, G.; Wang, F. Evaluation of an OCT-AI–Based Telemedicine Platform for Retinal Disease Screening and Referral in a Primary Care Setting. Trans. Vis. Sci. Technol. 2022, 11, 4. [Google Scholar] [CrossRef]
  39. Lo, Y.-C.; Lin, K.-H.; Bair, H.; Sheu, W.H.-H.; Chang, C.-S.; Shen, Y.-C.; Hung, C.-L. Epiretinal Membrane Detection at the Ophthalmologist Level Using Deep Learning of Optical Coherence Tomography. Sci. Rep. 2020, 10, 8424. [Google Scholar] [CrossRef]
  40. Lu, W.; Tong, Y.; Yu, Y.; Xing, Y.; Chen, C.; Shen, Y. Deep Learning-Based Automated Classification of Multi-Categorical Abnormalities From Optical Coherence Tomography Images. Trans. Vis. Sci. Technol. 2018, 7, 41. [Google Scholar] [CrossRef]
  41. Parra-Mora, E.; Cazanas-Gordon, A.; Proenca, R.; Da Silva Cruz, L.A. Epiretinal Membrane Detection in Optical Coherence Tomography Retinal Images Using Deep Learning. IEEE Access 2021, 9, 99201–99219. [Google Scholar] [CrossRef]
  42. Parra-Mora, E.; Da Silva Cruz, L.A. LOCTseg: A Lightweight Fully Convolutional Network for End-to-End Optical Coherence Tomography Segmentation. Comput. Biol. Med. 2022, 150, 106174. [Google Scholar] [CrossRef] [PubMed]
  43. Pham, V.-N.; Le, D.-T.; Bum, J.; Kim, S.H.; Song, S.J.; Choo, H. Discriminative-Region Multi-Label Classification of Ultra-Widefield Fundus Images. Bioengineering 2023, 10, 1048. [Google Scholar] [CrossRef] [PubMed]
  44. Shao, E.; Liu, C.; Wang, L.; Song, D.; Guo, L.; Yao, X.; Xiong, J.; Wang, B.; Hu, Y. Artificial Intelligence-Based Detection of Epimacular Membrane from Color Fundus Photographs. Sci. Rep. 2021, 11, 19291. [Google Scholar] [CrossRef]
  45. Shitole, A.; Kenchappagol, A.; Jangle, R.; Shinde, Y.; Chadha, A.S. Enhancing Retinal Scan Classification: A Comparative Study of Transfer Learning and Ensemble Techniques. Int. J. Recent Innov. Trends Comput. Commun. 2023, 11, 520–528. [Google Scholar] [CrossRef]
  46. Sonobe, T.; Tabuchi, H.; Ohsugi, H.; Masumoto, H.; Ishitobi, N.; Morita, S.; Enno, H.; Nagasato, D. Comparison between Support Vector Machine and Deep Learning, Machine-Learning Technologies for Detecting Epiretinal Membrane Using 3D-OCT. Int. Ophthalmol. 2019, 39, 1871–1877. [Google Scholar] [CrossRef]
  47. Talcott, K.E.; Valentim, C.C.S.; Perkins, S.W.; Ren, H.; Manivannan, N.; Zhang, Q.; Bagherinia, H.; Lee, G.; Yu, S.; D’Souza, N.; et al. Automated Detection of Abnormal Optical Coherence Tomography B-Scans Using a Deep Learning Artificial Intelligence Neural Network Platform. Int. Ophthalmol. Clin. 2024, 64, 115–127. [Google Scholar] [CrossRef]
  48. Tang, Y.; Gao, X.; Wang, W.; Dan, Y.; Zhou, L.; Su, S.; Wu, J.; Lv, H.; He, Y. Automated Detection of Epiretinal Membranes in OCT Images Using Deep Learning. Ophthalmic Res. 2023, 66, 238–246. [Google Scholar] [CrossRef]
  49. Tham, Y.-C.; Anees, A.; Zhang, L.; Goh, J.H.L.; Rim, T.H.; Nusinovici, S.; Hamzah, H.; Chee, M.-L.; Tjio, G.; Li, S.; et al. Referral for Disease-Related Visual Impairment Using Retinal Photograph-Based Deep Learning: A Proof-of-Concept, Model Development Study. Lancet Digit. Health 2021, 3, e29–e40. [Google Scholar] [CrossRef]
  50. Wang, J.; Zong, Y.; He, Y.; Shi, G.; Jiang, C. Domain Adaptation-Based Automated Detection of Retinal Diseases from Optical Coherence Tomography Images. Curr. Eye Res. 2023, 48, 836–842. [Google Scholar] [CrossRef]
  51. Wang, L.; Wang, G.; Zhang, M.; Fan, D.; Liu, X.; Guo, Y.; Wang, R.; Lv, B.; Lv, C.; Wei, J.; et al. An Intelligent Optical Coherence Tomography-Based System for Pathological Retinal Cases Identification and Urgent Referrals. Trans. Vis. Sci. Technol. 2020, 9, 46. [Google Scholar] [CrossRef]
  52. Wen, D.; Yu, Z.; Yang, Z.; Zheng, C.; Ren, X.; Shao, Y.; Li, X. Deep Learning-Based Postoperative Visual Acuity Prediction in Idiopathic Epiretinal Membrane. BMC Ophthalmol. 2023, 23, 361. [Google Scholar] [CrossRef] [PubMed]
  53. Yan, Y.; Huang, X.; Jiang, X.; Gao, Z.; Liu, X.; Jin, K.; Ye, J. Clinical Evaluation of Deep Learning Systems for Assisting in the Diagnosis of the Epiretinal Membrane Grade in General Ophthalmologists. Eye 2024, 38, 730–736. [Google Scholar] [CrossRef] [PubMed]
  54. Cheung, R.; Chun, J.; Sheidow, T.; Motolko, M.; Malvankar-Mehta, M.S. Diagnostic Accuracy of Current Machine Learning Classifiers for Age-Related Macular Degeneration: A Systematic Review and Meta-Analysis. Eye 2022, 36, 994–1004. [Google Scholar] [CrossRef] [PubMed]
  55. Senapati, A.; Tripathy, H.K.; Sharma, V.; Gandomi, A.H. Artificial Intelligence for Diabetic Retinopathy Detection: A Systematic Review. Inform. Med. Unlocked 2024, 45, 101445. [Google Scholar] [CrossRef]
  56. Prashar, J.; Tay, N. Performance of Artificial Intelligence for the Detection of Pathological Myopia from Colour Fundus Images: A Systematic Review and Meta-Analysis. Eye 2024, 38, 303–314. [Google Scholar] [CrossRef]
  57. Mikhail, D.; Gao, A.; Farah, A.; Mihalache, A.; Milad, D.; Antaki, F.; Popovic, M.M.; Shor, R.; Duval, R.; Kertes, P.J.; et al. Performance of Artificial Intelligence-Based Models for Epiretinal Membrane Diagnosis: A Systematic Review and Meta-Analysis. Am. J. Ophthalmol. 2025, 277, 420–432. [Google Scholar] [CrossRef]
  58. Chatzara, A.; Maliagkani, E.; Mitsopoulou, D.; Katsimpris, A.; Apostolopoulos, I.D.; Papageorgiou, E.; Georgalas, I. Artificial Intelligence Approaches for Geographic Atrophy Segmentation: A Systematic Review and Meta-Analysis. Bioengineering 2025, 12, 475. [Google Scholar] [CrossRef]
  59. Moradi, M.; Chen, Y.; Du, X.; Seddon, J.M. Deep Ensemble Learning for Automated Non-Advanced AMD Classification Using Optimized Retinal Layer Segmentation and SD-OCT Scans. Comput. Biol. Med. 2023, 154, 106512. [Google Scholar] [CrossRef]
  60. Hassija, V.; Chamola, V.; Mahapatra, A.; Singal, A.; Goel, D.; Huang, K.; Scardapane, S.; Spinelli, I.; Mahmud, M.; Hussain, A. Interpreting Black-Box Models: A Review on Explainable Artificial Intelligence. Cogn. Comput. 2024, 16, 45–74. [Google Scholar] [CrossRef]
  61. Selvaraju, R.R.; Cogswell, M.; Das, A.; Vedantam, R.; Parikh, D.; Batra, D. Grad-CAM: Visual Explanations from Deep Networks via Gradient-Based Localization. Int. J. Comput. Vis. 2020, 128, 336–359. [Google Scholar] [CrossRef]
  62. Wong, C.Y.T.; Antaki, F.; Woodward-Court, P.; Ong, A.Y.; Keane, P.A. The Role of Saliency Maps in Enhancing Ophthalmologists’ Trust in Artificial Intelligence Models. Asia-Pac. J. Ophthalmol. 2024, 13, 100087. [Google Scholar] [CrossRef]
  63. Arora, A.; Alderman, J.E.; Palmer, J.; Ganapathi, S.; Laws, E.; McCradden, M.D.; Oakden-Rayner, L.; Pfohl, S.R.; Ghassemi, M.; McKay, F.; et al. The Value of Standards for Health Datasets in Artificial Intelligence-Based Applications. Nat. Med. 2023, 29, 2929–2938. [Google Scholar] [CrossRef]
  64. Yang, F.; Zamzmi, G.; Angara, S.; Rajaraman, S.; Aquilina, A.; Xue, Z.; Jaeger, S.; Papagiannakis, E.; Antani, S.K. Assessing Inter-Annotator Agreement for Medical Image Segmentation. IEEE Access 2023, 11, 21300–21312. [Google Scholar] [CrossRef]
  65. Aboy, M.; Minssen, T.; Vayena, E. Navigating the EU AI Act: Implications for Regulated Digital Medical Products. npj Digit. Med. 2024, 7, 237. [Google Scholar] [CrossRef]
  66. European Union General Data Protection Regulation (GDPR). Available online: https://gdpr.eu (accessed on 6 October 2025).
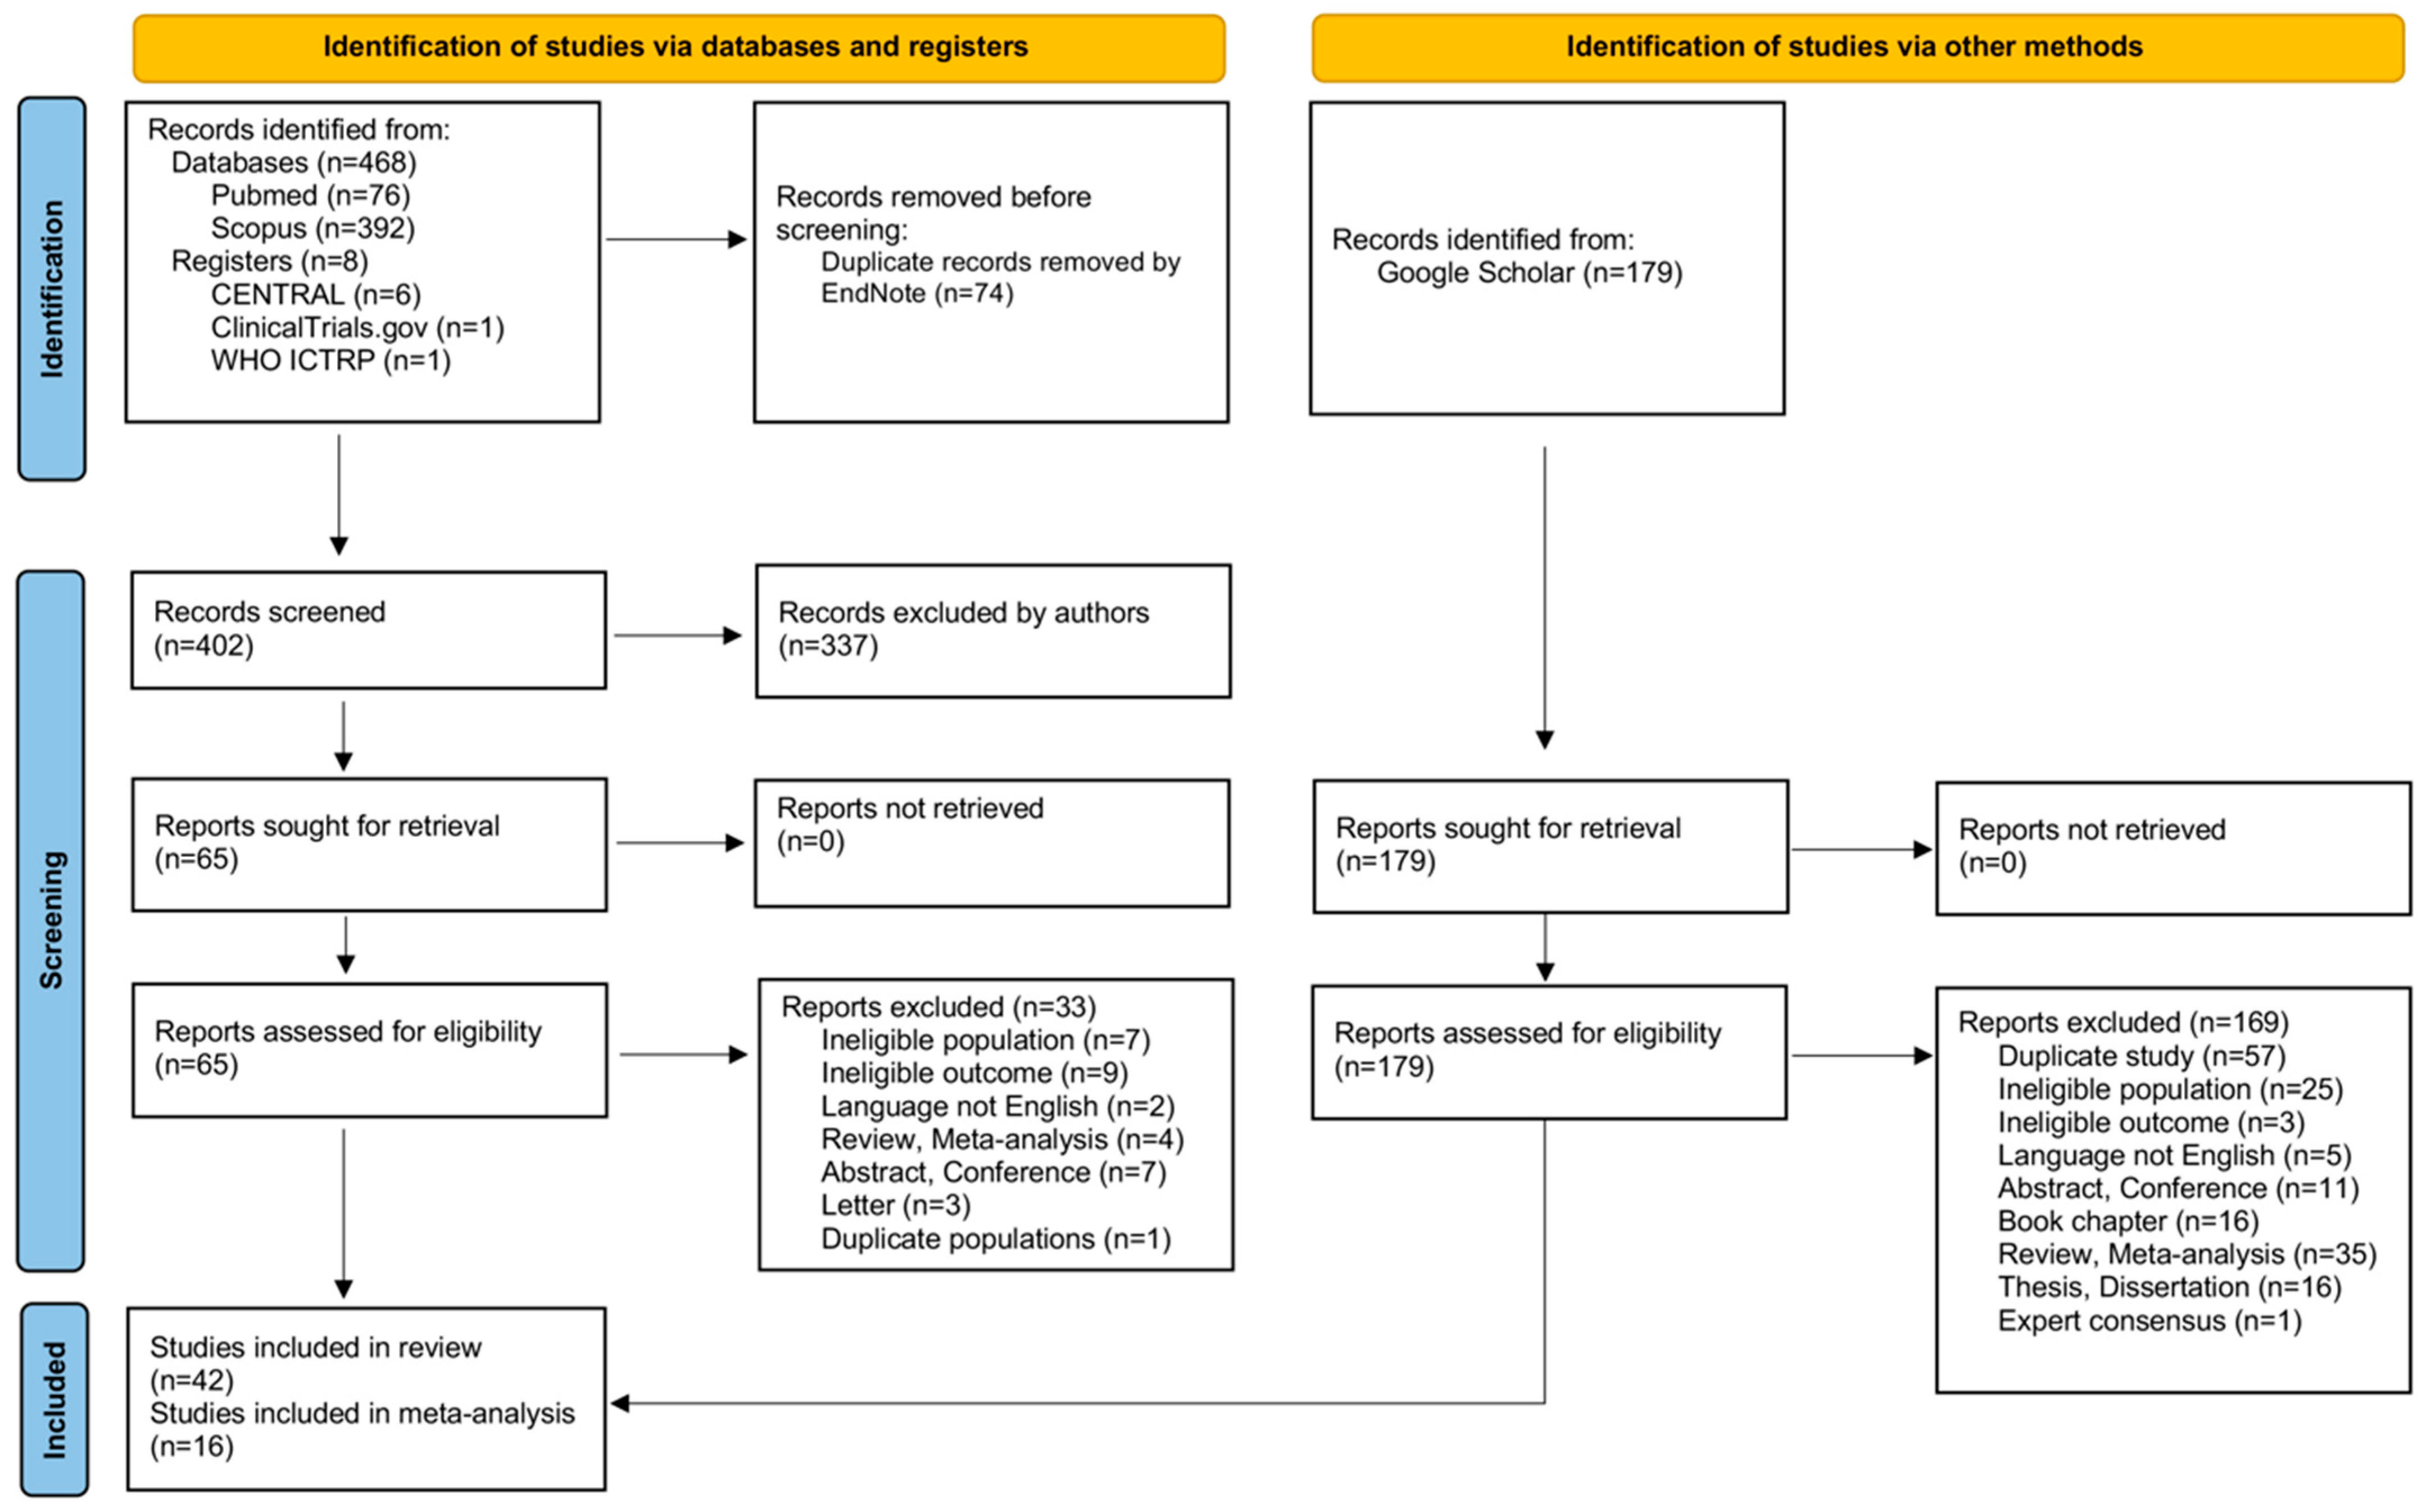
Figure 1. PRISMA flowchart.
Applsci 15 12280 g001
Figure 2. QUADAS-2 traffic light plot [1,2,5,6,7,10,18,19,20,21,22,23,24,25,26,27,28,29,30,31,32,33,34,35,36,37,38,39,40,41,42,43,44,45,46,47,48,49,50,51,52,53]. Low risk is indicated by a green ‘+’, unclear risk by a yellow ‘?’, and high risk by a red ‘−’.
Applsci 15 12280 g002
Figure 3. CLAIM checklist compliance [1,2,5,6,7,10,18,19,20,21,22,23,24,25,26,27,28,29,30,31,32,33,34,35,36,37,38,39,40,41,42,43,44,45,46,47,48,49,50,51,52,53].
Applsci 15 12280 g003
Figure 4. Publication trends by country.
Applsci 15 12280 g004
Figure 5. Studies reporting external validation and XAI use.
Applsci 15 12280 g005
Figure 6. Distribution of studies by task.
Applsci 15 12280 g006
Figure 7. Pooled diagnostic accuracy of deep learning models for ERM detection, stratified by (a) imaging modality (fundus photography vs. optical coherence tomography) and (b) use of external validation [1,20,21,24,25,28,31,34,35,37,39,41,43,44,46,51]. Each horizontal line represents the accuracy of an individual study with its corresponding 95% CI. The two subgroup diamonds indicate the pooled accuracy within each category, while the bottom diamonds represent the overall pooled estimate across all studies. The column “TP and TN” shows the total number of correctly classified images (both true positives and true negatives), and “Total” refers to all images analyzed in that study. Accuracy reflects the overall proportion of correctly classified images (both ERM and non-ERM) among all evaluated cases.
Applsci 15 12280 g007
Figure 8. Pooled sensitivity of deep learning models for ERM detection, stratified by (a) imaging modality (fundus photography vs. optical coherence tomography) and (b) use of external validation [1,20,21,24,25,28,31,34,35,37,39,41,43,44,46,51]. Each horizontal line represents the sensitivity of an individual study with its corresponding 95% confidence interval (CI). The two subgroup diamonds indicate the pooled sensitivity within each category, while the bottom diamonds represent the overall pooled estimate across all studies. The column “True positives” indicates the number of ERM cases correctly identified by the model, and “Total” represents all confirmed ERM cases in that study. Sensitivity reflects the proportion of ERM cases correctly detected by the model.
Applsci 15 12280 g008
Figure 9. Pooled specificity of deep learning models for ERM detection, stratified by (a) imaging modality (fundus photography vs. optical coherence tomography) and (b) use of external validation [1,20,21,24,25,28,31,34,35,37,39,41,43,44,46,51]. Each horizontal line represents the specificity of an individual study with its corresponding 95% confidence interval (CI). The two subgroup diamonds indicate the pooled specificity within each category, while the bottom diamonds represent the overall pooled estimate across all studies. The column “True negatives” shows the number of non-ERM images correctly classified as not having ERM by the algorithm, while “Total” refers to the total number of non-ERM images included in each study. Specificity quantifies the model’s ability to correctly exclude non-ERM cases.
Applsci 15 12280 g009
Figure 10. Pooled PPV of deep learning models for ERM detection, stratified by (a) imaging modality (fundus photography vs. optical coherence tomography) and (b) use of external validation [1,20,21,24,25,28,31,34,35,37,39,41,43,44,46,51]. Each horizontal line represents the PPV of an individual study with its corresponding 95% confidence interval (CI). The two subgroup diamonds indicate the pooled PPV within each category, while the bottom diamonds represent the overall pooled estimate across all studies. The “True positives” column indicates the number of images correctly classified as ERM by the model, and “Total” refers to the total number of images the model predicted as ERM. PPV represents the probability that an image classified as ERM by the model truly had ERM.
Applsci 15 12280 g010
Figure 11. Pooled NPV of deep learning models for ERM detection, stratified by (a) imaging modality (fundus photography vs. optical coherence tomography) and (b) use of external validation [1,20,21,24,25,28,31,34,35,37,39,41,43,44,46,51]. Each horizontal line represents the NPV of an individual study with its corresponding 95% confidence interval (CI). The two subgroup diamonds indicate the pooled NPV within each category, while the bottom diamonds represent the overall pooled estimate across all studies. The “True negatives” column shows correctly identified non-ERM cases, and “Total” represents the total number of images the model predicted as not having ERM. NPV indicates the probability that an image classified as non-ERM by the model was truly free of ERM.
Applsci 15 12280 g011
Figure 12. Pooled DOR of deep learning models for ERM detection, stratified by (a) imaging modality (fundus photography vs. optical coherence tomography) and (b) use of external validation [1,20,21,24,25,28,31,34,35,37,39,41,43,44,46,51]. Each horizontal line represents the DOR of an individual study with its corresponding 95% confidence interval (CI). The two subgroup diamonds indicate the pooled DOR within each category, while the bottom diamonds represent the overall pooled estimate across all studies. The “ERM cases” column shows the total number of images that had ERM, and “Total” represents the total number of images evaluated in that study. The DOR summarizes the overall discriminative ability of each model; higher values indicate stronger differentiation between ERM and non-ERM cases.
Applsci 15 12280 g012
Figure 13. SROC curve summarizing the overall diagnostic performance of deep learning models for ERM detection [1,20,21,24,25,28,31,34,35,37,39,41,43,44,46,51]. Each circle shows a study’s sensitivity–specificity pair, with size reflecting study weight. The solid line represents the pooled ROC curve from the bivariate random-effects model, and the shaded area shows its 95% confidence region.
Applsci 15 12280 g013
Table 1. Study characteristics.
Author (Year)CountryDiseasesImaging ModalityDatasetReference StandardAI TaskAI TypeAI ArchitectureInternal
Validation Method
External
Validation
Explainable AI
Ait Hammou
(2023) [18]
CanadaERM; normal;
5 other retinal
diseases
OCT public (one dataset);
private (one image and one video
dataset)
experienced
fellowship trained retina specialist
detectionDL MLSwin Transformer; Vision Transformer; Multiscale Vision Transformer; EfficientNetB0; NasNetLarge; NasNetMobile; Xceptioncross
validation
nosaliency maps
Baamonde
(2019) [6]
SpainERMSD-OCT private one expert
clinician
detectionMLMultilayer Perceptron; Naive Bayes; K-Nearest Neighbors; Random Forest10-fold cross
validation
nono
Bai
(2022) [10]
ChinaERM; 13 other
retinal diseases
SD-OCTprivate (4 local
communities)
3 retina
professors with more than 12 yoe
detectionDLCascade-RCNN6:2:2 holdout validationnono
Boyina
(2022) [19]
IndiaERM; normal;
6 other ocular
diseases
CFIpublic (one dataset) ophthalmologistsdetectionDLResNet7:2:1 holdout validationnono
Bui
(2023) [20]
South
Korea
ERM; normal;
2 other retinal
diseases
OCT private (one
hospital)
annotated by a junior doctor and verified by a senior doctordetectionDLSparse Residual Network (multi-scale)holdout validation; train–test split (80%-20%)noGrad-CAM
Cao
(2022) [21]
ChinaERM; 23 other ocular diseasesUWFI Private (3 hospitals)expert
ophthalmologists
detectionDL, MLChannel-attention feature pyramid network; ResNetXt-50;train–test-validation splityeslesion atlas; Grad-CAM
Cen
(2021) [22]
China, USAERM; 29 other ocular diseasesCFIpublic (7 datasets);
private (3 hospitals)
expert
ophthalmologists
detectionDLcustom CNN; (based on Inception-V3; Xception; InceptionResNet-V2)splityesGrad-CAM; DeepSHAP
Chen
(2023) [23]
ChinaERM; 10 other retinal diseasesOCT private (one
hospital)
two certified
ophthalmologists
detectionDLResNet50; YOLOv3; AlexNet; VGG16; DenseNet; InceptionV3 (ensemble learning approach)4:1:1 holdout validationnoGrad-CAM
Crincoli (2023) [5]Italy
France
ERM stage IIOCT private (2 hospitals)2 expert graderspostoperative BCVA
prediction
DLInception-ResNet-V2holdout validationnoLIME
Dong
(2022) [24]
ChinaERM; normal;
8 other ocular diseases
CFIprivate (10 healthcare centers and one hospital)3 examiners of a group of 40 certified
ophthalmologists, discrepancies
resolved by 6 senior specialists
detectionDLYolov3holdout validationyesGrad-CAM
Gende
(2022) [1]
SpainERM; normalHD-OCT privateone expertdetection and segmentationDLMulti-scale feature pyramid network (with DenseNet-121; ResNet-18; Inception-v4)4-fold cross-validation (eye level)nono
Gu
(2023) [25]
ChinaERM; normal;
13 other ocular
diseases
CFIprivate (6 primary healthcare settings)2 retina specialists with 5–10 yoedetectionDLYolov3; EfficientNet-B35:1 holdout validationyesattention heatmap
Hirota
(2022) [26]
JapanERM; 9 other retinal diseasesOCT private (3 hospitals)2ophthalmologists at each hospitaldetectionDL MLResNet-152; DenseNet-201; EfficientNet-B7; Ensemble model using Random Forest3-fold cross validationnoGrad-CAM
Hsia
(2023) [2]
TaiwanERMSD-OCT private (one hospital)2 retina specialists postoperative BCVA
prediction
DLResNet-50; ResNet-18 9:1 holdout validationnoGrad-CAM
Hung
(2023) [27]
Taiwan
Poland
ERMSD-OCTprivate (one hospital)expert-labeled ERM staging by
ophthalmologists
detectionDLFusion network including ResNet; MobileNet; EfficientNet; Swin Transformer; MLP-Mixer5-fold cross validationnoGrad-CAM
Inferrera
(2023) [28]
ItalyERM; normal;
7 other retinal diseases
SD-OCT private (one hospital)2 experienced
retina specialists
detectionDLVGG-169:1 holdout validation; 5-fold cross validation for training and validationnoGrad-CAM
Inoda
(2023) [29]
JapanERM; normal; other retinal
diseases
SS-OCT private (one hospital)one ophthalmologist and one retina
specialist; BCVA by an optometrist
postoperative BCVA
prediction
DLGoogLeNet (Inception Net)10-fold cross validationyesno
Jin
(2023) [30]
China
Japan
Singapore
ERM classified into 6 severity stages (normal is the stage 0)OCT private (9 international medical centers and one hospital) expert-labeled images by 4 experienced
retina specialists
detection and segmentationDLiERM with two-stage deep learning architecture; ResNet-34 backbone; Segmentation model based on U-Nettrain–validation-test split (7:1:2 ratio)yesCAM and segmentation-based feature analysis
Kim K
(2021) [31]
South
Korea
ERM; 6 other retinal diseasesCFIprivate (one hospital)one retina specialistdetectionDLResNet-50; VGG-19; Inception v35-fold cross validationnoGrad-CAM
Kim S
(2022) [32]
South
Korea
ERMSD-OCT private (one hospital)ophthalmologistspostoperative BCVA
prediction
DLVGG-167:1.5:1.5 holdout validationnoattention maps
Kuwayama
(2019) [33]
JapanERM; normal; other retinal
diseases
HD-OCT private (one hospital)one ophthalmologistdetectionDLcustom CNN9:1 holdout validationnono
Lee
(2021) [34]
South
Korea
ERM; 4 other retinal diseasesCFIprivate (one hospital)2 retina specialists and three residents with third to fourth year trainingdetectionDLResNet-50stratified bootstrappingyesGrad-CAM
Li
(2022) [35]
ChinaERM; 10 other ocular diseasesCFIprivate (3 hospitals)17 senior
board-certified
ophthalmologists
detectionDLSeResNext504:1 holdout validationyesGrad-CAM
Lin D
(2021) [36]
ChinaERM; normal;
13 other ocular diseases
CFIprivate (16 clinical
settings)
40 ophthalmologists; 6 retina specialistsdetectionDLInceptionResNetV2 CNN Comprehensive AI Retinal Expert—CARE system8:2 holdout validationyesattention heatmaps
Lin P
(2022) [37]
TaiwanERM; normal;
3 other retinal diseases
CFIprivate (one hospital)expert-labeled fundus images detectionDL MLVGG-168:2 holdout validationnoGrad-CAM++
Liu
(2022) [38]
ChinaERM; other
ocular diseases
SD-OCT private (4 primary care stations)2 ophthalmologists with more than 15yoedetectionDLDeep and Shallow Feature Fusion Network nono
Lo
(2020) [39]
TaiwanERM; normal; other ocular
diseases
SD-OCT private (one hospital)senior retinal
specialist with more than 18 yoe
detectionDLResNet-1018:2 holdout validationnoGrad-CAM
Lu
(2018) [40]
ChinaERM; normal;
3 other retinal diseases
HD-OCT private (one hospital)17 licensed retina
experts
detectionDLResNet10-fold cross validationnono
Parra Mora
(2021) [41]
PortugalERM; non-ERMSD-OCT private (one hospital)medical
ophthalmology
specialists
detectionDLAlexNet; SqueezeNet; ResNet; VGGNet10-fold cross validationnoGrad-CAM
Parra Mora
(2022) [42]
PortugalERM; non-ERMSD-OCT public (2 datasets);
private (one dataset)
2 graderssegmentationDLLOCTSeg (Fully Convolutional Network)equal split; 6-fold cross-validation; even–odd patient splitnono
Pham
(2023) [43]
South
Korea
ERM; 5 other retinal diseasesUWFI private (one hospital)annotated by
experienced
ophthalmologists
detectionDLXception; ResNet50; MobileNetV3, EfficientNetB3train–validation split (9:1 ratio)nono
Shao
(2021) [44]
ChinaERM; non-ERMCFIprivate (one hospital)3 ophthalmologists (resident doctor,
attending, retina
specialist)
detectionDLcombination of Inception-Resnet-v2 and Xceptionnot reportednoGrad-CAM
Shitole
(2023) [45]
IndiaERM; other
ocular diseases
CFIpublic (one dataset)annotated by
ophthalmologists
detectionDLDenseNet-201; ResNet152V2; XceptionNet; EfficientNet-B7; MobileNetV2; EfficientNetV2M + Ensemble Modeltrain–validation-test split (60%-20%-20%)nono
Sonobe
(2018) [46]
JapanERM; non-ERM3D-OCT private (one hospital)2 ophthalmologistsdetectionDL MLSupport Vector Machine; custom CNN8:2 holdout validationnono
Talcott
(2023) [47]
USA
Germany
Portugal
Singapore
ERM; normal; other ocular
diseases
HD-OCT private (9 hospitals)2 ophthalmologistsdetectionDLModified ResNet-505-fold cross validationyesno
Tang
(2022) [48]
ChinaERMHD-OCTprivate (one hospital)one expert with more than 20 yoedetectionDLU-net9:1 holdout validationnono
Tham
(2021) [49]
Singapore China
India
Australia
ERM; other
ocular diseases
CFIpublic (6 datasets)trained
ophthalmologists
postoperative BCVA
prediction
DLResNet-508:2 holdout validationyesGrad-CAM
Wang J
(2023) [50]
ChinaERM; normal; other ocular
diseases
OCTprivate (2 hospitals)2 specialistsdetectionDLCustom modelrandom train–test split (target data)noGrad-CAM
Wang L
(2020) [51]
ChinaERM; normal; other ocular
diseases
SD-OCT private (2 hospitals)2 ophthalmologists and one senior retina specialistdetectionDL MLFeature pyramid network; Random Forest 8:2 holdout validationyesfeature importance
Wen
(2023) [52]
ChinaERMSD-OCT private (one hospital) postoperative BCVA
prediction
DLInception-Resnet-v26:2:2 holdout validationnoGrad-CAM
Yan
(2023) [53]
ChinaERM; normalSD-OCT private (3 hospitals)4 experienced retina specialists with more than 10 yoedetection and segmentationDLSegNet; ResNet9:1 holdout validationnono
Yeh
(2023) [7]
TaiwanERMSD-OCT private (one hospital)expertspostoperative BCVA
prediction
DLHeterogeneous Data Fusion Net (HDF-Net)9:1 holdout validation; 10-fold cross validationnoGrad-CAM
AI (artificial intelligence); BCVA (best corrected visual acuity); CAM (class activation mapping); CFI (color fundus imaging); CNN (convolutional neural network); DeepSHAP (Deep SHapley Additive exPlanations); DL (deep learning); ERM (epiretinal membrane); Grad-CAM (gradient-weighted-class activation mapping); HD-OCT (high-definition optical coherence tomography); LIME (local interpretable model-agnostic explanations); ML (machine learning); OCT (optical coherence tomography); SD-OCT (spectral-domain optical coherence tomography); SS-OCT (swept-source optical coherence tomography); UWFI (ultra-wide-field imaging); yoe (years of experience); 3D-OCT (3-dimensional optical coherence tomography).
Disclaimer/Publisher’s Note: The statements, opinions and data contained in all publications are solely those of the individual author(s) and contributor(s) and not of MDPI and/or the editor(s). MDPI and/or the editor(s) disclaim responsibility for any injury to people or property resulting from any ideas, methods, instructions or products referred to in the content.