Article

Non-Invasive Study of Gold Nanoparticles in Famille rose and Ruby-Back Qing Porcelain by Luminescence, Low-Wavenumber Raman Scattering and pXRF

1
Laboratoire ‘De la Molécule au Nano-Objet: Réactivité, Interaction et Spectroscopies’ (MONARIS UMR8233), Sorbonne Université, CNRS, Campus P.-et-M. Curie, 4 Place Jussieu, 75005 Paris, France
2
Independent Researcher, 75014 Paris, France
3
Department of Metallurgical and Materials Engineering, Istanbul Gedik University, Cumhuriyet Mah. İlkbahar Sok. No:1 Kartal, 34876 Istanbul, Türkiye
*
Author to whom correspondence should be addressed.
Appl. Sci. 2025, 15(22), 12265; https://doi.org/10.3390/app152212265
Submission received: 16 October 2025 / Revised: 27 October 2025 / Accepted: 18 November 2025 / Published: 19 November 2025
(This article belongs to the Special Issue Cultural Heritage: Restoration and Conservation)

Abstract

Comprehensive studies of Famille rose porcelains, particularly ruby-back pieces, are rare and have generally not addressed the vibrational signatures arising from gold nanoparticles. Due to the high cultural and material value of these artifacts, a strictly non-invasive approach combining X-ray fluorescence (XRF) and Raman (micro-)spectrometry must be employed. If the conservation of porcelain does not pose any difficulties, fakes exist and they must be identified. Preliminary studies show that the presence of metal nanoparticles generates plasmon-related fluorescence. Our results confirm that plasmon fluorescence is more effective than pXRF for detecting colloidal gold, whereas pXRF efficiently identifies associated elements such as arsenic, tin, and, newly observed, antimony; the presence of iron is difficult to demonstrate due to its ubiquitous occurrence. Yellow and green hues, distinct from those produced by Cu2+ ions alone, are mainly due to simple tin yellow (PbSnO3), while the cobalt used originates from a mixture of European smalt (rich in arsenic and potassium) and Asian ores (rich in manganese). Minimal variability was observed among egg-shell porcelains with similar decorations and dimensions, suggesting a common workshop or standardized raw materials and procedures. Two other egg-shell plates employ a different gold preparation technique (addition of Sn and Sb rather than As), which is visually evident in the ruby color.

1. Introduction

Seduced by the brilliance, polychrome richness, and the possibility of creating realistic decorations on metal, glass, or ceramic in Western artifacts, similar to what pastel and oil paint allowed in the creation of portraits, flowers, and landscapes, the Kangxi Emperor requested the help of Jesuit missionaries present at the Manchu court in the Bureau of Astronomy to develop the manufacture of enameled objects and optical glasses [1,2,3,4]. The court already had a workshop for the production of polychrome cloisonné enamels on metal, and limited polychromy had been produced on porcelain since the end of the Yuan Dynasty [5,6]. However, the coloring of cloisonné enamels was less sophisticated than that of painted enamels. The layer of colored glass between partitions is thick, typically several millimeters. Coloring similar to that of solid glass, obtained through the ‘dissolution’ of transition metal ions, was sufficient. This method allowed only five colors (hence the name wucai): the ‘transparent’ colors obtained by Cu2+ ions (green), Co2+ (blue), and Mn2+ (purple) [3,7,8], plus a red obtained either from the hematite pigment (α-Fe2O3) [7,8] or from the formation of metallic copper nanoparticles (Cu°) [9,10,11], and a yellow obtained from tin yellow. These last three pigments were opaque. Conversely, the thickness of painted enamels is low, between a few dozen and up to one or two hundred microns. Therefore, more effective coloring agents than transition metal ions were essential.
Because it was nearly impossible to mix transitions ions to produce intermediate shades, the decoration technique was limited to effects resembling watercolor, esthetically similar to Chinese graphic works. Thus, the traditional techniques for obtaining underglaze blue or red decorations were supplemented by overglaze lead enamels, green, red, or black (and later blue), fired at relatively low temperatures. This type of porcelain was named Famille verte by Albert Jacquemart, the first European classifier of various Chinese ceramic productions, in his 1862 work [12]. From the 1720s onward, the Canton Customs workshops exported this type of porcelain in large quantities to Europe (England, Holland, France, etc.). Albert Jacquemart distinguished a second family, the Famille rose, characterized by the use of a new color, pink, obtained from a dispersion of gold nanoparticles (Au° colloids) in the glass constituting the enamel layer. This technique was first developed in 17th century France (in Blois and later Paris, after the French royal court moved there) for the gold enameling of pocket watches [7,13,14] and the coloring of sophisticated glass objects [15,16]. It is likely that, like red coloring with copper nanoparticles, the technique of coloring with gold nanoparticles was developed earlier by Roman glassmakers [11,17].
This process first requires obtaining colloidal gold with particles small enough to generate colors from ruby to violet, depending on size, but sufficiently large or agglomerated to avoid chemical degradation in the molten enamel. The gold is first dissolved in aqua regia (a mixture of nitric acid (1 volume), and hydrochloric acid (2 to 4 volumes)) to produce AuCl4 ions, then precipitated by electrochemical reduction through the addition of a solution containing arsenic, tin, or iron ions, which can be oxidized. The arsenic-based method was used by King Louis XIV’s glassmaker, Bernardo Perrotti, naturalized as Bernard Perrot [15,16]. The tin-based method was popularized in the book by Johannes Kunckel von Löwenstern (1630?–1703), director of the Silver Mine Control Laboratories of the Prince-Elector of Saxony, Georg IV, and later under his successor Friedrich August I (August the Strong, King of Poland and Grand Duke of Lithuania), who entrusted him with the management of several glassworks [18,19]. The color obtained is known as ‘Cassius purple’ [20,21]. A third method, widely practiced in the Meissen factory (Saxony) during the third quarter of 18th century and after, used iron sulfate and sodium nitrite, the so-called Hungarian vitriol method [22,23,24].
The objective of this work is to non-invasively study a group of Famille rose Qing porcelains decorated with colors ranging from pink to purple and violet, likely obtained using gold nanoparticles, particularly those with a ruby-back reverse in order to be able to distinguish the different productions and, in particular, the copies or fakes. This gold-based enamel introduced to China in the early 18th century via European/Jesuit influence was known for its unprecedented soft pink hue [25,26,27,28]. The term “ruby back” thus describes the lustrous rose-pink enamel applied to the underside of Yongzheng dishes, which was usually paired with very fine Famille rose decoration on the front. Although all Chinese porcelain bodies were kiln-fired at Jingdezhen, the delicate overglaze enameling on Yongzheng ruby-back wares could be executed at different locations. A significant portion of ruby-back dishes, particularly those made for export, were enameled in Guangzhou (Canton) after the porcelain was fired in Jingdezhen [29]. Although many studies address Famille rose more broadly, ruby-back dishes have seldom been examined as a distinct technological group. Our aim is to assess whether discernible differences in materials among these pieces and to evaluate, in a preliminary way, whether such differences (or their absence) might be informative about production in the same workshop. Given the high value of the studied artifacts, the analytical approach will be entirely non-invasive, employing mobile instrumentation that can be brought to the objects’ conservation sites. X-ray fluorescence (XRF) and Raman (micro-) spectrometry will be used. The primary aim of this exploratory study is to develop a non-invasive analytical procedure that can be performed in situ on metal, porcelain and glass decorated with enamels colored by metallic nanoparticles. If proven effective, this procedure will then be applied to imperial masterpieces whose exceptional value, often reaching several million euros, imposes strict analytical constraints.
While extensive research exists on metallic nanoparticles isolated or self-assembled through organic spacers for photonic or magnetic applications [30,31,32,33,34,35,36] spectroscopic studies of nanoparticles dispersed, either ordered or disordered, within inorganic matrices such as glass are extremely rare. Most of the existing work originates from our laboratory and concerns glass and glaze [10,11,14,25,37,38]. The synthesis of glasses containing controlled dispersions of gold, silver, or copper nanoparticles is complex and has historically been reserved for exceptional creations, luster ceramics [11], porcelains with pigeon’s blood enamels [10], or flashed stained glass glasses [37] produced for elite patrons such as imperial or royal courts, princely khalifates, or for specialized military applications (e.g., laser-flash protection), for which virtually no detailed information is available. The few existing studies on nanoparticle dispersions in inorganic matrices rely on ion beam methods and therefore limited to very small surface areas [38,39,40,41,42], unlike analyses routinely conducted on enamels and heritage glass.
The objective of this work is to identify the method used for preparing gold colloids by detecting the possible presence of arsenic, tin, or iron in the enamel layer. Preliminary studies have shown that metallic nanoparticles generate fluorescence associated with the plasmon (electron gas) formed at the nanoparticle-dielectric matrix interface [43,44,45,46]. The presence these nanoparticles also gives rise to very-low-energy vibrational modes [11,45] and may induce a volume-enhanced Raman scattering (VERS) effect, analogous to the well-known surface-enhanced Raman scattering (SERS) phenomenon [46].
Studies focusing on Famille rose porcelains, particularly those featuring ruby-back glazes, remain scarce and have generally been limited to elemental analysis, without addressing the vibrational signatures resulting from gold nanoparticles [47,48,49]. Developing a spectroscopic “photonic fingerprint” for such objects could therefore provide a new approach for classifying and distinguishing different production types and identifying copies or fakes.

2. Materials and Methods

2.1. Optical Microscopy

The artifacts were observed without any sample preparation using an independent Olympus BX51 microscope equipped with 5× (NA: 0.15) and 10× (NA: 0.30) objectives (Olympus, Tokyo, Japan). A similar microscope coupled to the Raman spectrometer was also used to select areas that were perfectly homogeneous in color or exhibited visible defects.

2.2. Portable X-Ray Fluorescence Spectroscopy (pXRF)

XRF analysis was performed using a portable Elio instrument (Bruker AXS GmbH, Berlin, Germany) featuring a Rh-anode X-ray tube, a ~1 mm2 collimator, and a large-area Silicon Drift Detector (energy resolution < 140 eV for Mn Kα; detection range: 1.3–43 keV in air). The instrument was mounted on a dedicated, very stable photographic tripod, and measurements were taken in point mode for 180 s at 50 kV and 80 μA, with no filter between tube and sample. The analytical protocol followed methods described in previous studies [9,14,22,44]. The analysis depth, estimated using the Beer–Lambert law (defined as the layer from which 90% of the fluorescence originates), was approximately 6 μm for Si Kα, 170 μm for Cu Kα, 300 μm for Au Lα—comparable to glaze thicknesses—but 3 mm for Sn Kα [50]. Accuracy was verified using reference metal, glass, and stone materials. X- and Y-motorized stages allowed precise positioning. Focusing along the third (Z) direction (e.g., Figure 1) was performed manually, using micrometric displacement of the instrument stage and/or adjustment of the artifact. For this, the artifact was positioned horizontally on a ream of an A4-sized paper whose height could be adjusted by adding or removing sheets. Alternatively, the plate could be positioned vertically on a box and secured with adhesive tape, which could be gently fixed and later removed.
Since the intensity of electronic transition peaks (Kα, Kβ, Mα, Mβ, Lα, Lβ, Lγ, and associated peaks) depends on both elemental identity and concentration, peaks for trace elements like Pb and Rb can appear more intense than those for major components like Si. In air, aluminum is weakly detected, but lighter elements are not. Therefore, and due to topological variation in the 3D distribution of colorants, calculating a “composition” is not meaningful. Instead, a clustering analysis method developed by our group was used. This involved plotting normalized peak areas (calculated with Artax 7.4.0.0, Bruker AXS GmbH, Berlin, Germany) in ternary and biplot scatter diagrams. Normalization was performed relative to the Rh tube peak, and for blue-decorated samples, also to the Co or Si signal depending on the pXRF instrument used in other studies for comparative purposes across chronologies and technologies. Thus, the measured intensities define clusters if the compositions (major, minor, and trace elements detected by XRF) are identical or similar.

2.3. Raman Microspectroscopy

Raman analysis was conducted using a Labram HR800 spectrometer (HORIBA Scientific Jobin-Yvon, Palaiseau, France), with excitation provided by an Ar+ ion plasma laser (Innova I90C 6UV, Coherent Inc., Santa Clara, CA, USA). The 457.9 and 514.5 nm lines were used with laser powers ranging from ~0.3 mW (for colored enamels) to 8 mW (for paste) at the sample surface. The confocal hole diameter was set to ~180 µm to achieve good separation of the low-wavenumber modes from the Rayleigh peak while maintaining adequate scattered signal intensity. Spectra were acquired using a 50× long working distance objective (LWD = 13 mm, NA = 0.45; Olympus, Tokyo, Japan). Each analyzed spot measured ~5 × 5 µm2, consistent with the expected mean pigment grain size. The penetration depth was about 5 µm in colorless glazes, but much lower in dark-colored zones.
Spectral windows ranged from −200 to 4000 cm−1, with accumulation times varying from a few minutes to several tens of minutes. At least three accumulations were performed per spot to suppress cosmic ray noise. Three measurements were taken per area. Using a 600 lines/mm grating, the uncertainty in peak position was about ±2 cm−1. Background subtraction was performed using linear segments.

2.4. Artifacts

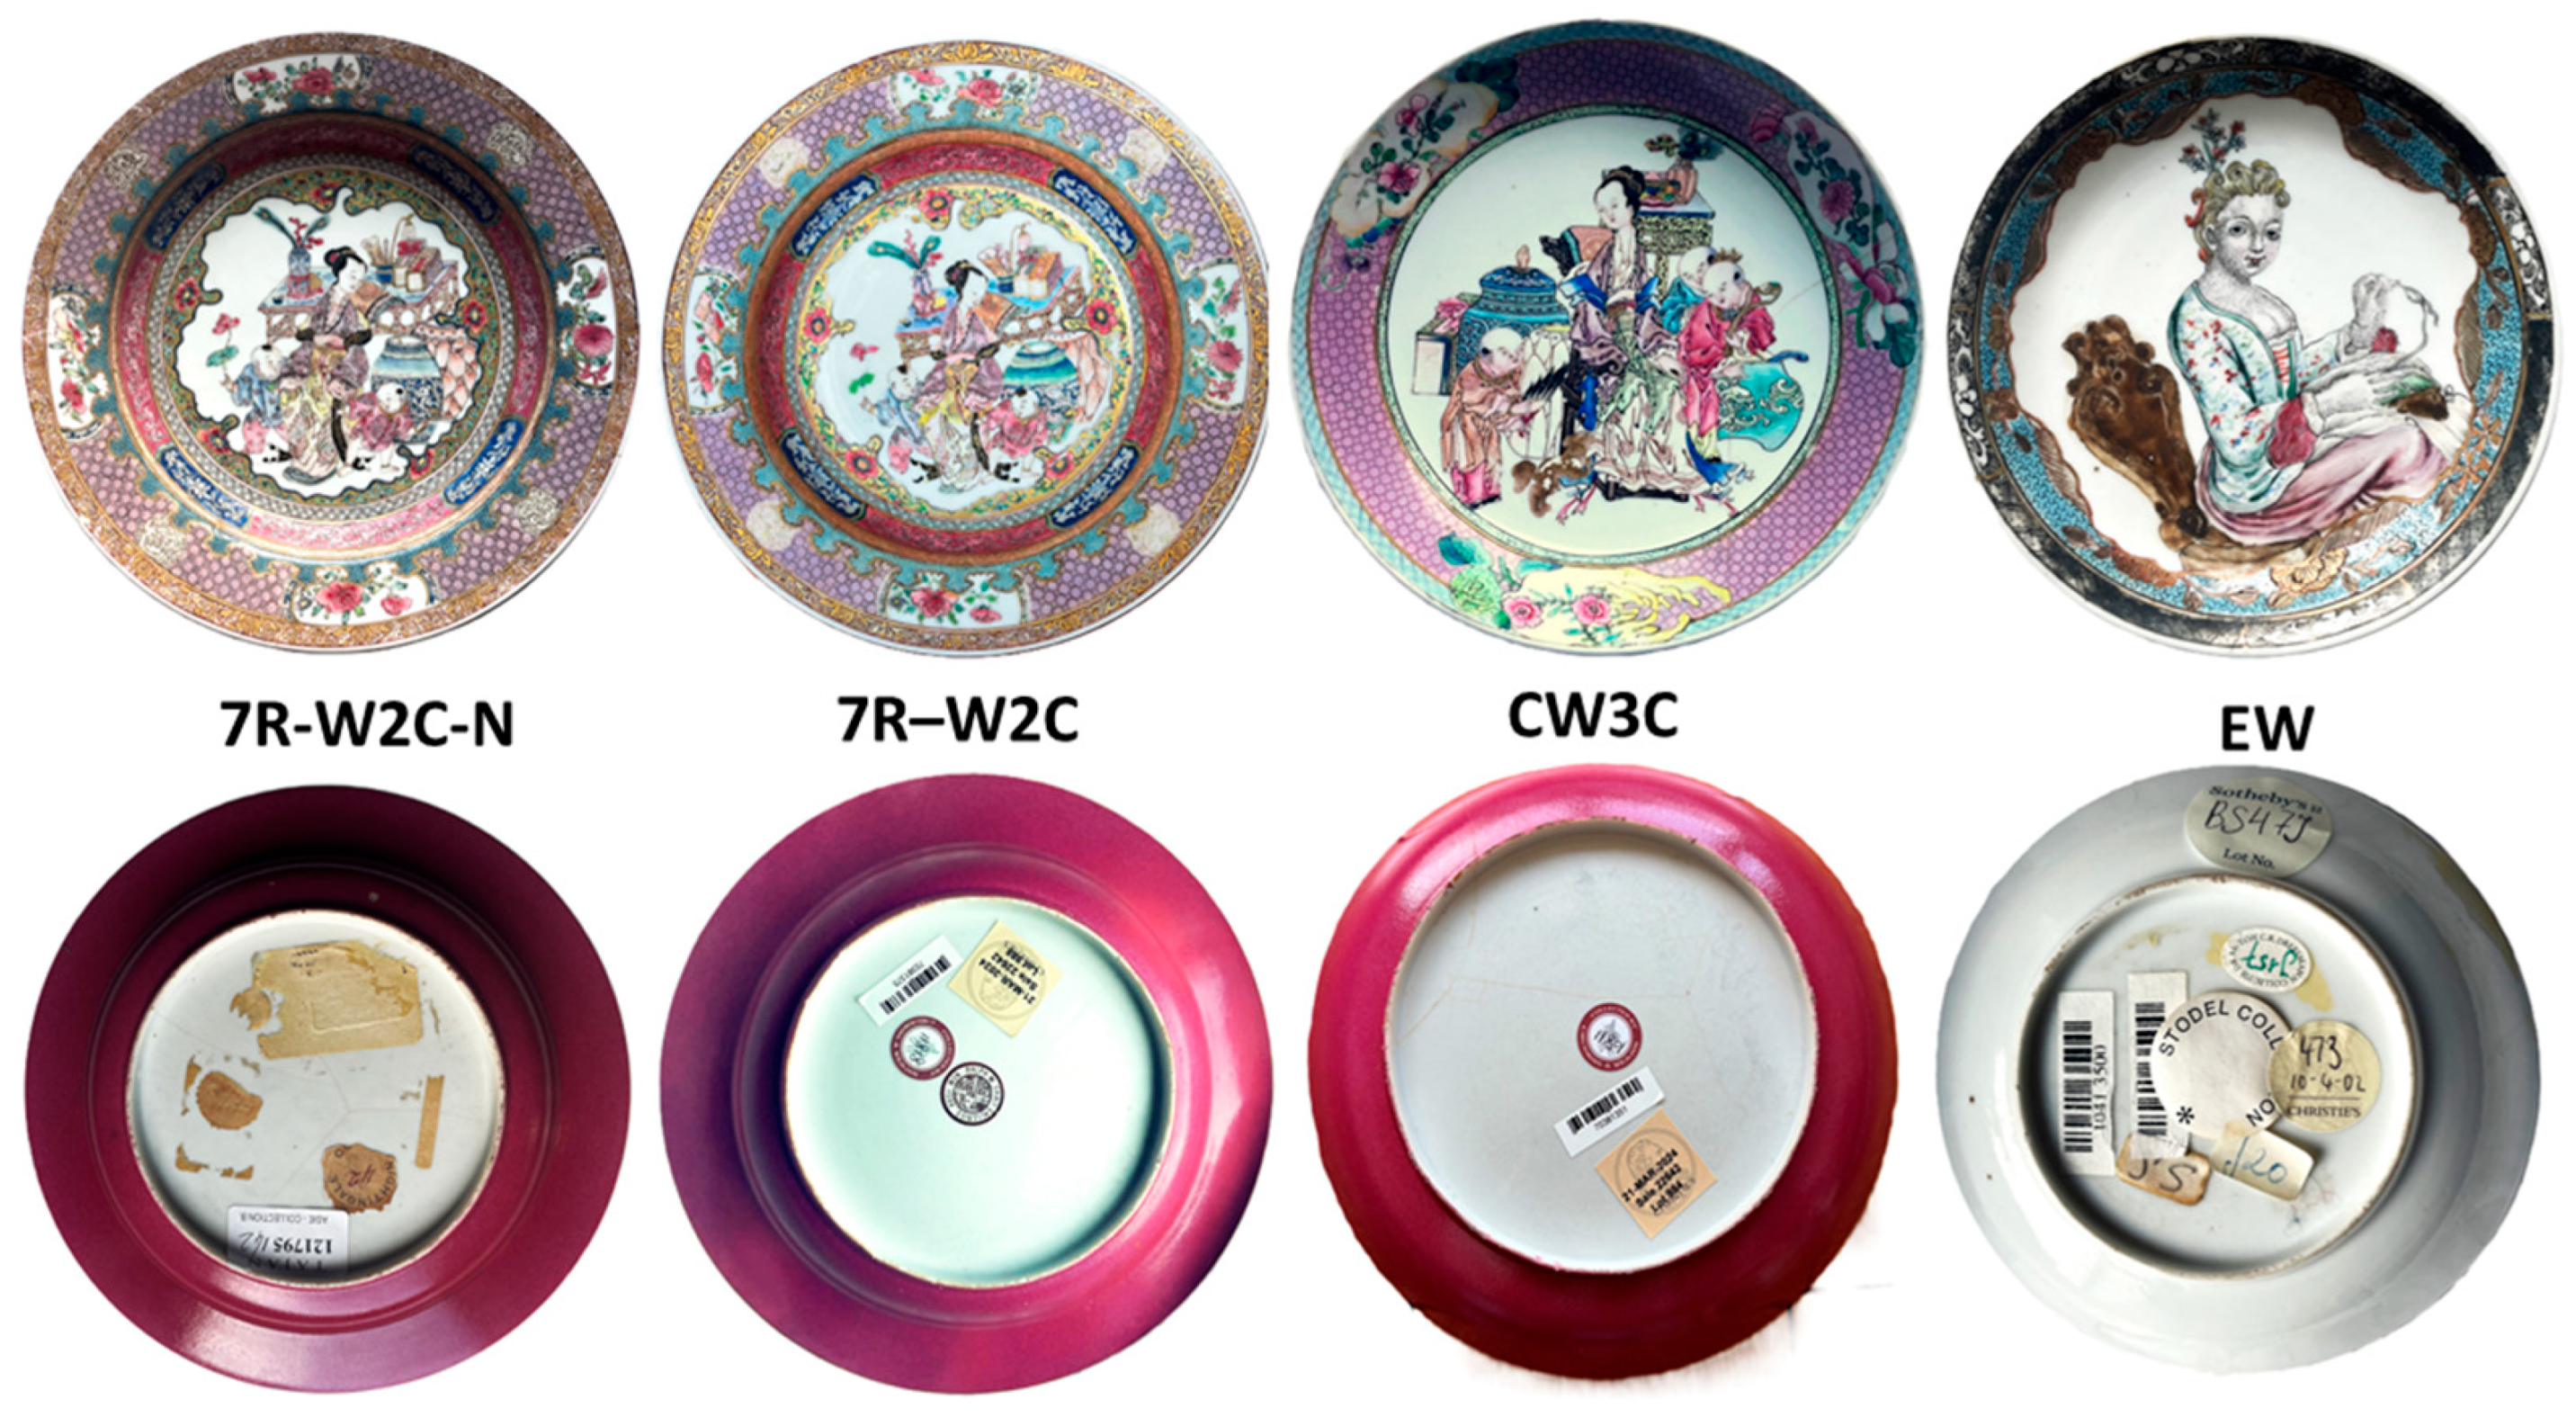
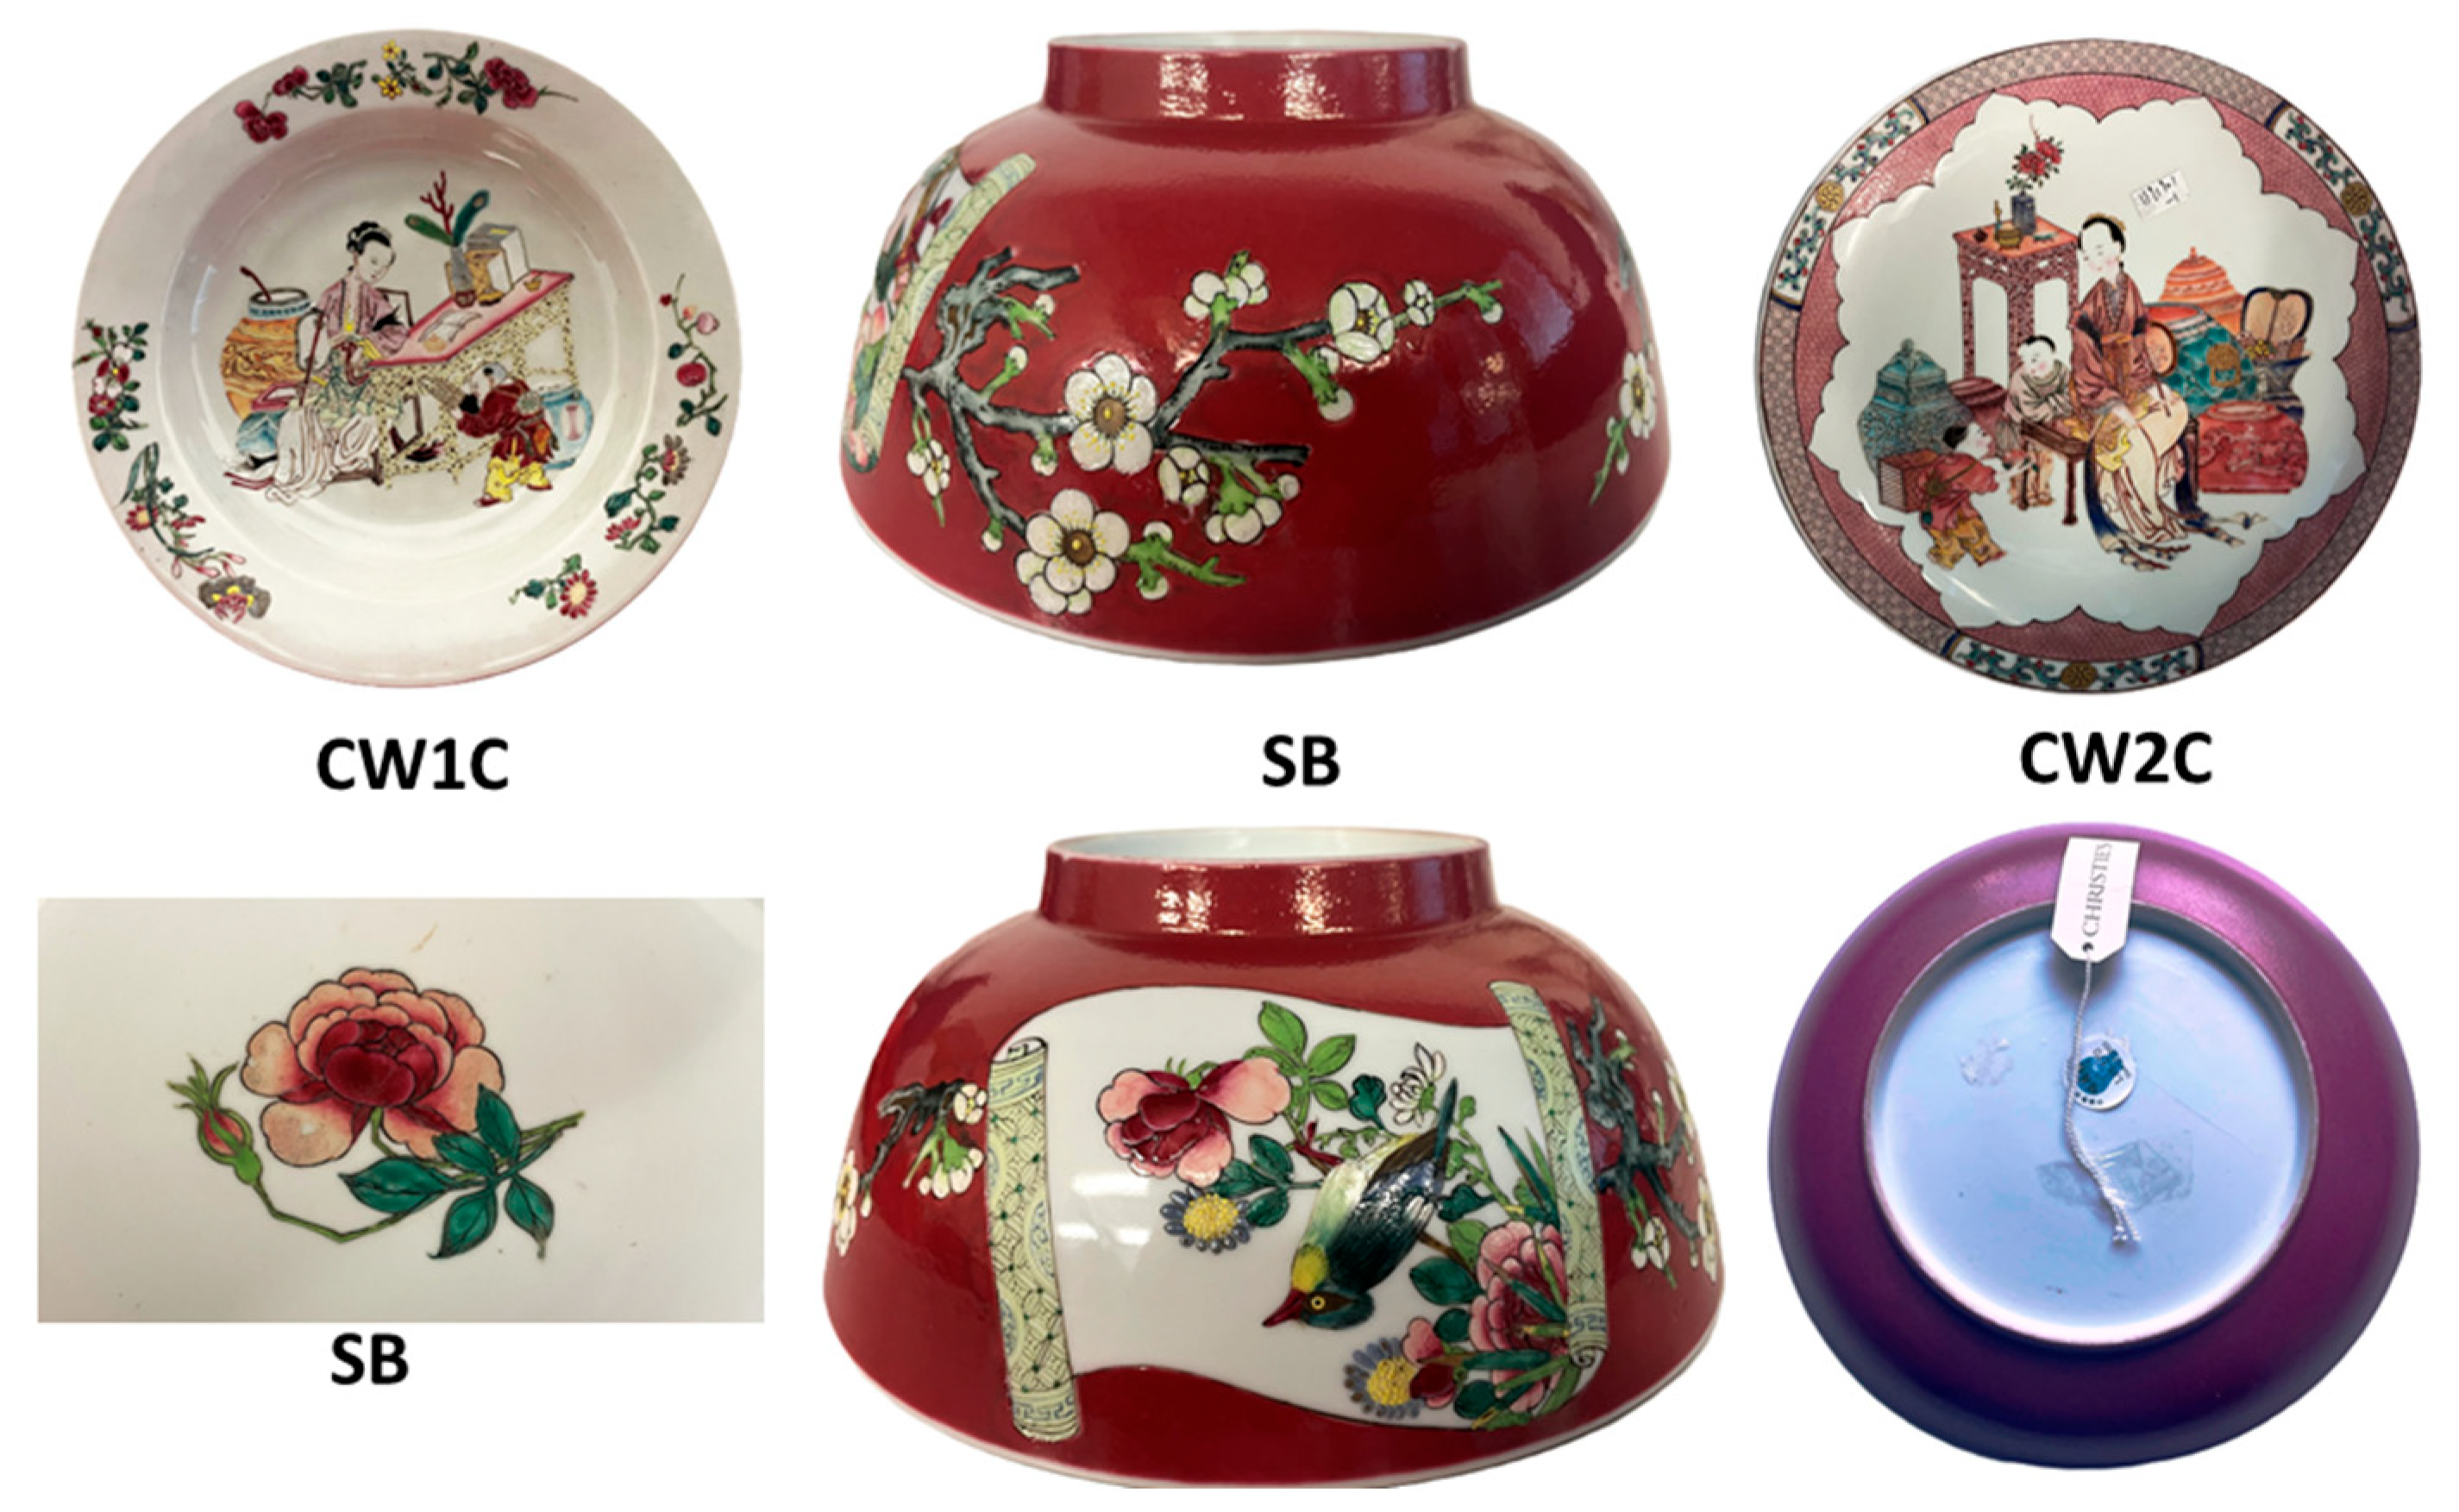
The studied artifacts from a private collection are shown in Figure 2 and Figure 3, and their main characteristics are listed in Table 1. All artifacts are typical of productions from the Yongzheng reign, except for one, which has been identified as a copy made by Maison Samson (SM) in the 19th century. This factory [51,52,53] is known for producing pieces imitating major masterpieces of ceramic art and for creating similar objects during the last quarter of the 19th century and thereafter. We will attempt to identify the objective criteria that allow us to characterize Samson’s production.
The eggshell plates examined here are representative of ruby-back Qing porcelain plates exported to Europe during the Yongzheng reign and afterward [26,27,28,29,54,55,56,57,58]. Representative spectra were recorded on colorless glaze (appearing white), blue enamel, and ruby-colored regions on the reverse side.
Artifacts are labeled according to the depicted design. The plates represent either a Chinese (CW) or a European woman (EW) with one (1C), two (2C) or three (3C) children; the final character (T or none) refers to the respective auction company. Most of the plates belong to the so-called group of egg-shell porcelains, characterized by extremely thin bodies with seven-ring decoration (label 7R) and a ruby-back. Achieving such thinness requires precise and delicate turning of the paste, followed by machining after drying, as well as great care in handling before firing. However, the homogeneous fineness of the entire piece is advantageous during enameling firings. The uniform thinness makes the object less sensitive to thermal shock, thereby facilitating enameling firings in rapid cycles.
Seven objects were studied (Table 1; Figure 2 and Figure 3).
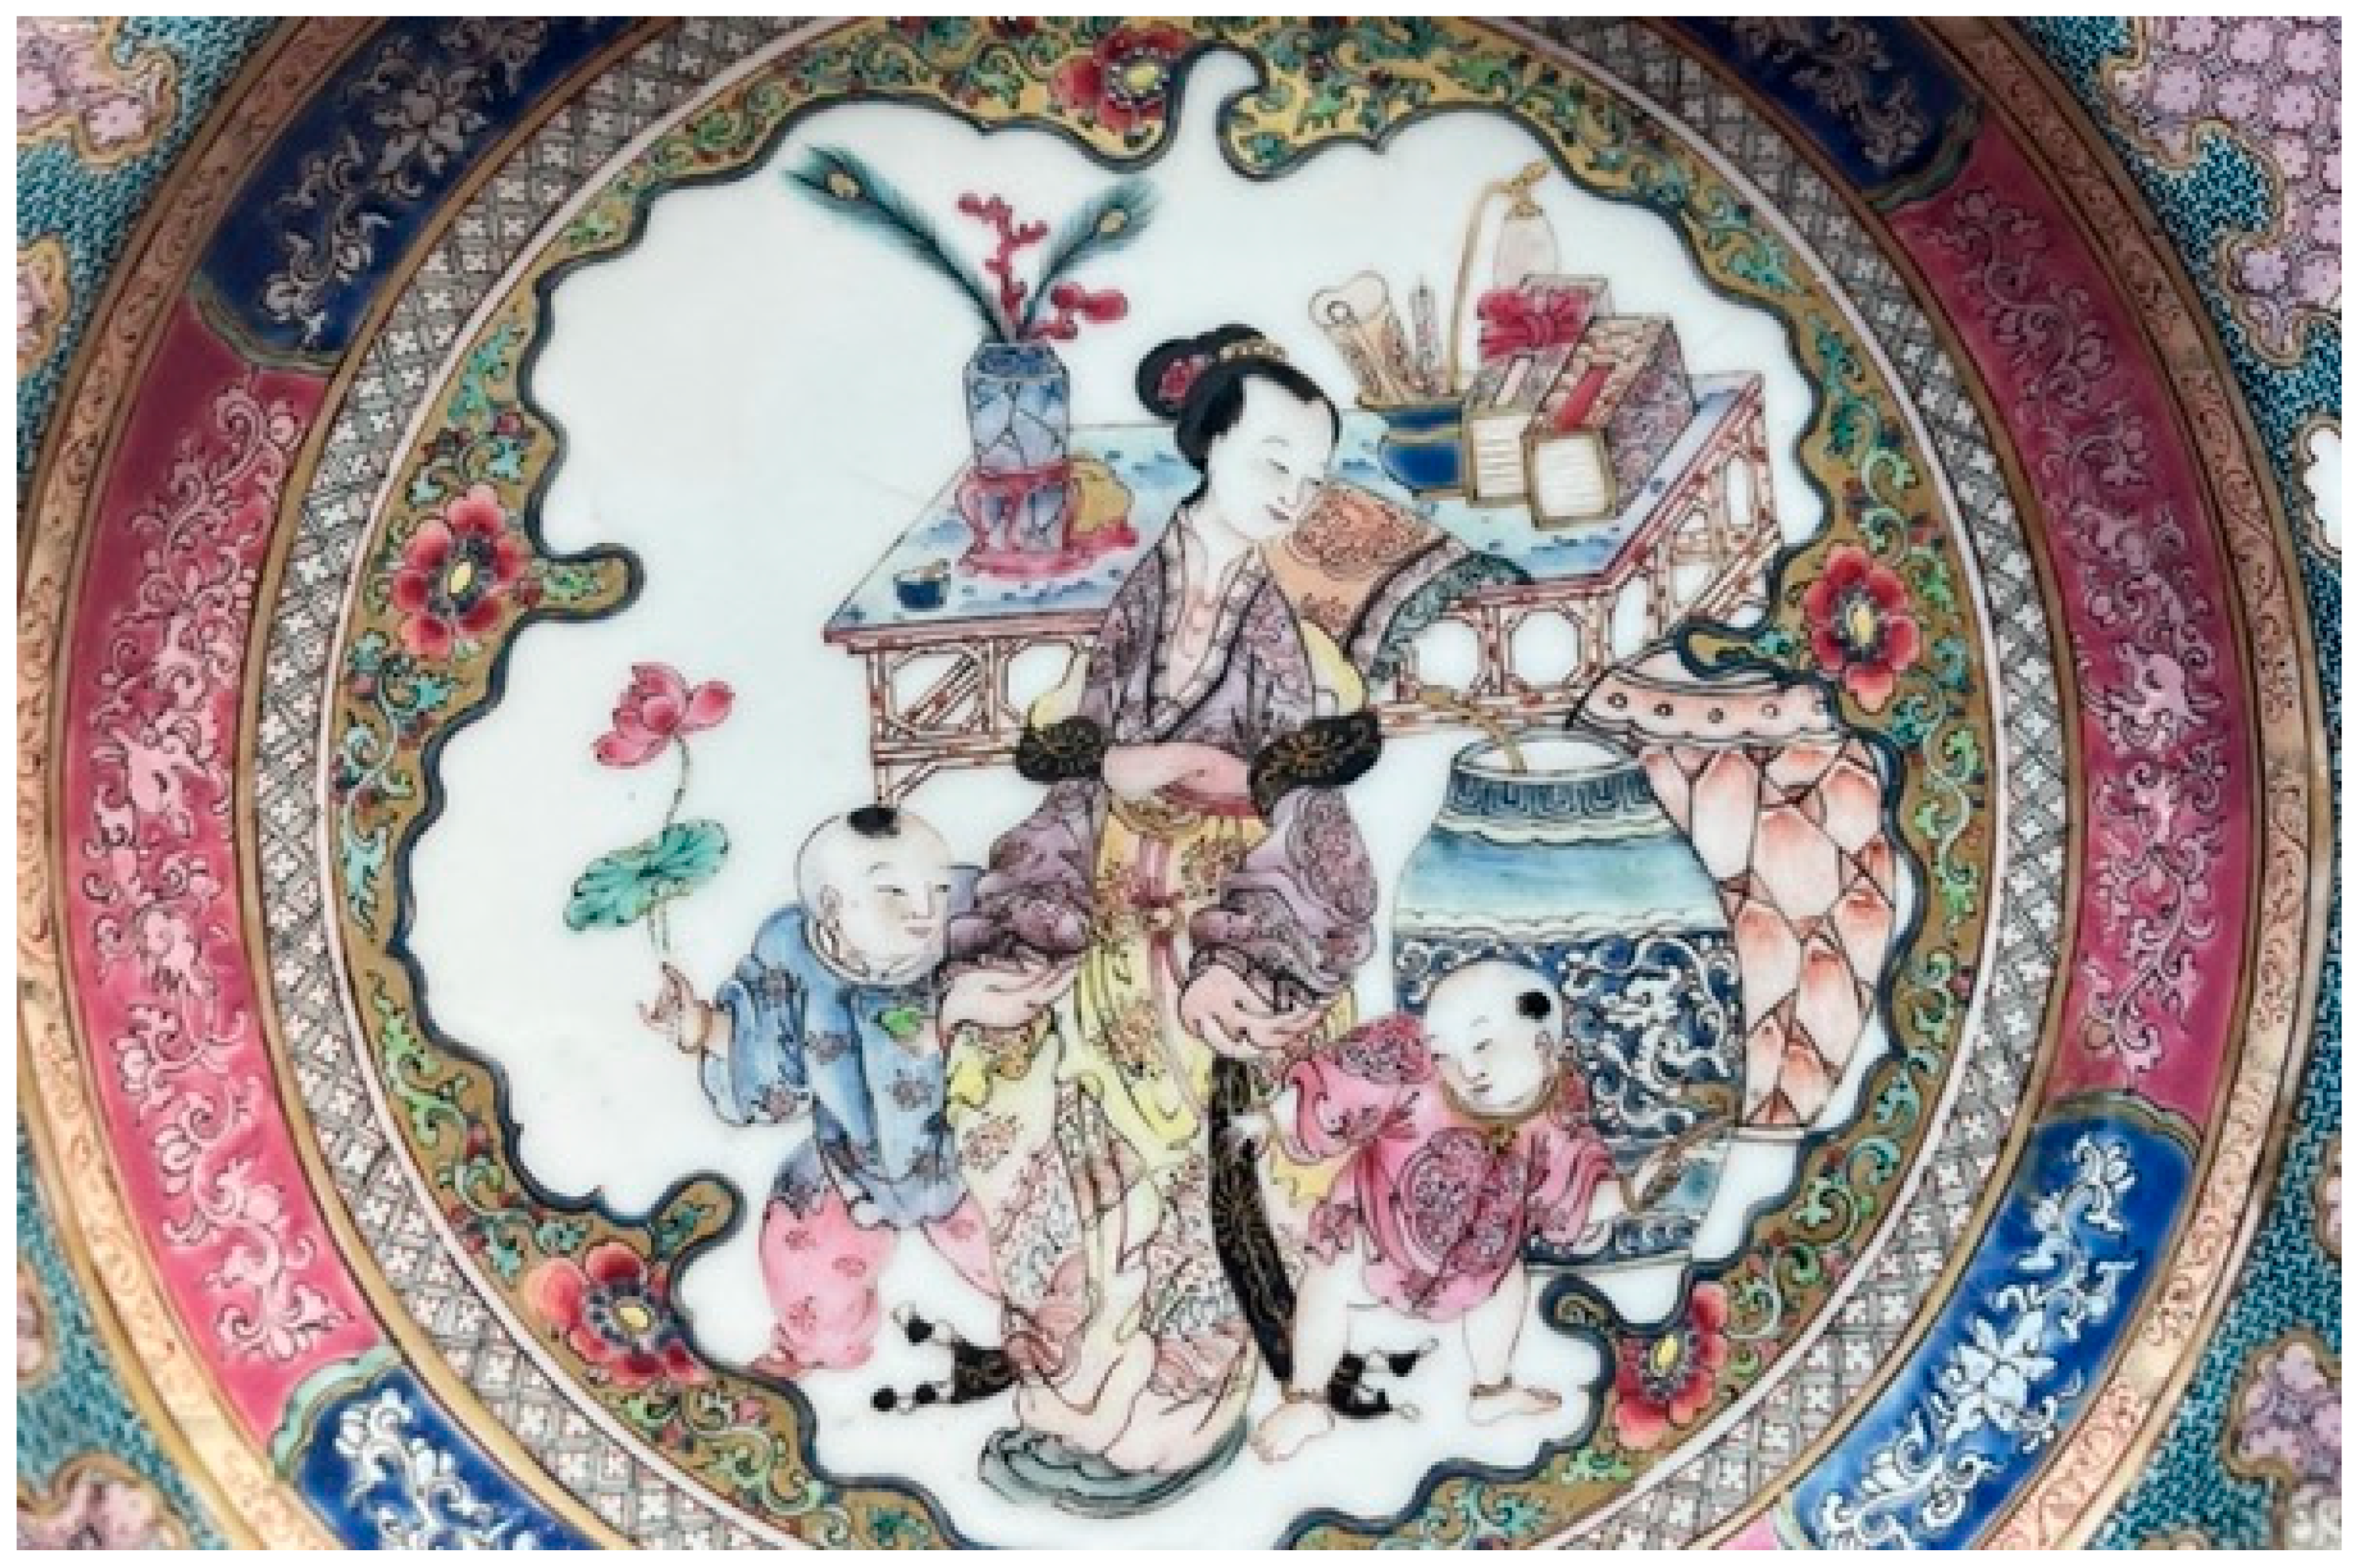
7R-W2C-T and 7R-W2C: A pair of egg-shell plates painted in overglaze enamels with a leaf-shaped central panel depicting a lady in embroidered robes with two boys—one holding a lotus flower, the other a ruyi scepter—beside a bamboo table set with scholars’ items. The design is reserved on a gilt ground with floral borders (arranged in seven rings) and medallions of mythical beasts; the reverse is enameled in ruby ground.
CW3C: This egg-shell plate is enameled at the center with a medallion showing a seated lady in a richly decorated robe, attended by three boys holding precious objects beside a bamboo table, jars, and a vase. The rim is painted with foliate cartouches enclosing floral blossoms reserved against a pink diaper ground, and the exterior is enameled in ruby ground.
CW2C: This egg-shell plate is decorated in overglaze enamels in soft pink tones. The design depicts a lady seated on a stool, accompanied by two boys—one presenting a peach—amid large storage jars and a tall bamboo table. The scene is framed within a flower-shaped medallion reserved on a pink diaper ground, with a cell-diaper band containing three floral scrollwork vignettes at the rim, and the underside covered in ruby enamel.
CW1C: This egg-shell plate is painted in overglaze enamels with a scene of a lady listening to a boy playing a musical instrument beside a bamboo table and a vase. The border is decorated with sprays of flowers, and the reverse is enameled in ruby ground.
EW: This egg-shell saucer depicts a seated lady embroidering a canvas stretched on a small frame resting on her knee. The border İS decorated with a blue enamel ‘Y’-pattern enriched with gilt floral scrollwork, while the rim is painted with a black enamel band; the reverse is enameled in white.
SM: The bowl is decorated in overglaze enamels with handscroll-shaped panels, each enclosing a brightly colored bird on a peony branch, reserved against a ruby-red ground from which gnarled blossoming prunus branches emerge at either end of the scrolls. The interior is centered with a leafy peony spray and bud.
Examining the dimensions already provides a classification tool: plates with exactly the same diameter can be attributed to the same workshop. This is the case for the first three egg-shell plates listed in Table 1.

3. Results and Discussion

3.1. Fluorescence and Raman Signatures of Eggshell Plates

Acquisition conditions were identical (30 min per wide spectral domain, 10 min for Stokes/anti-Stokes windows; three accumulations each). The ruby-back spectrum is the most intense, due to strong fluorescence around 1800 cm−1 (563.5 nm), matching the plasmon energy of gold nanoparticles [11,59,60,61,62]. The gold plasmon absorption shifts from ~520 nm for 20 nm particles to ~650 nm for 400 nm particles [11,59,60,61,62]; the associated fluorescence band follows the same trend. Comparable behavior is observed for Ag and Cu nanoparticles [11,63].
The blue spectrum (Figure 4) is weak because blue enamel strongly absorbs the red emission under green-laser excitation. Two broad, weak fluorescence components are, however, visible at ~2000 and ~3500 cm−1 (576.8 and 620.7 nm). It is difficult to propose an attribution for these weak fluorescence bands The symmetric As-O stretching band at 812 cm−1 indicates the use of European cobalt [7,8,9,22,64,65,66,67,68,69,70], typical of Qing high-quality overglaze enamels. The SiO4 stretching doublet (965–1070 cm−1) and bending band (~440 cm−1) reflect the vitreous silicate network with the addition of lead oxide [51,71].
Background subtraction (Figure 5a) highlights the signatures of the deformation and stretching modes of the glazes but introduces some uncertainty in the shape of broad bands. The presence of the As-O stretching mode at 815 cm−1 is consistent with the formation of lead and calcium/potassium arsenates [64,69], the small shift compared to the spectrum in Figure 4 results from background correction. This band is not observed in the ruby glaze, indicating that the gold nanoparticles were not prepared using arsenic. The spectrum of the colorless glaze, characterized by a doublet at 960 and 1020 cm−1, is typical of a lead-alkaline composition [71]. The characteristic doublet of a glaze containing both lead and alkali/alkaline-earth fluxes shows slight differences for the ruby-back glaze and the blue overglaze, which may be attributed either to compositional variations or to the VERS effect [46], whereby the Raman spectrum reflects the nanostructure of the glassy matrix surrounding the nanoparticles.
At first examination, the results appear similar among the different Chinese plates. The spectrum of the glaze is typical of a glaze co-fired with the body at high temperature, i.e., a lead-free glaze [72,73] containing residual, incompletely dissolved quartz grains. Its contribution is mainly a broad SiO4 bending band at ~490 cm−1, while the SiO4 stretching modes are extremely weak, as is usual for refractory aluminosilicate glasses [72,73].
The ratio between the areas of the band around 500 cm−1 (corresponding to the deformation modes of the SiO4 tetrahedron) and that near 1000 cm−1 (SiO4 stretching mode) provides insight into the degree of polymerization of the SiO4 tetrahedra [72,73]. This ratio is high for the colorless glaze, consistent with its co-firing with the ceramic body at high temperature. In contrast, for the enamels, the band around 1000 cm−1 is the most intense, indicating a significant degree of depolymerization resulting from the addition of lead oxide, which facilitates low-temperature firing.
Figure 5b shows the shift in the center of gravity of the fluorescence band according to the color, as well as a change in its profile when measurements are taken on ‘visual defects’, as expected when the average particle diameter varies [11,59,60,61,62,63].

3.2. Boson Peak and/or Lamb’s Mode?

Examination of the spectral region near the Rayleigh elastic peak using green (Figure 4b and Figure 5c) or blue (Figure 5d) laser excitation reveals a clear contrast between ruby and non-ruby regions. A broad and intense Stokes band, together with its anti-Stokes counterpart, is observed, with a center of gravity varying between 35 and 65 cm−1. At certain analysis points corresponding to visually identified defects, light absorption is extremely strong, occasionally affecting even the Rayleigh line itself. It should be noted that spectra obtained with green excitation employed three supernotch filters, which absorb strongly between –6 and +6 cm−1; minor misalignments in filter centering can render the cut-off slightly asymmetrical.
When elastic peak rejection is performed with a single supernotch filter (blue excitation), the cutoff occurs near 60 cm−1, and instead of a distinct band, only a pronounced ‘Rayleigh wing’ is observed (Figure 5d). The intensity of this wing is particularly high for the ruby glaze.
For colorless glaze, the low-wavenumber features are weak, consistent with the vibrational behavior of a glassy phase. The broad feature corresponds to the so-called Boson peak, characteristic of a glassy phase, which can be described as the energy projection of the librational and translational vibrational components of SiO4 tetrahedra within the glass network [74,75,76,77].
By contrast, in regions containing metal nanoparticles, another type of vibrational mode can arise-the acoustic modes of nanoparticles, known as Lamb modes [78,79,80,81]. The wavenumber of these modes depends on nanoparticle shape and symmetry. In the simplest case of a spherical nanoparticle, the most intense mode is the symmetric ‘breathing’ mode, whose frequency is proportional to the sound velocity in the metal and inversely proportional to the nanoparticle diameter [78,79,80]. For very small nanoparticles (5–10 nm), this mode typically appears between 8 and 15 cm−1, often accompanied by weaker modes at higher frequencies. When spectral resolution is limited, the superposition of several modes can produce a broad band resembling a Rayleigh wing.
The similarity of the spectra obtained from colorless and ruby glazes suggests that, in both cases, the dominant contribution arises from the Boson peak, with its intensity enhanced in ruby glaze by the presence of nanoparticles through the VERS effect [46]. Given that the green excitation wavelength lies close to the plasmon resonance, the broad and intense band between 35 and 65 cm−1 is best interpreted as a convolution of Boson and Lamb modes, both amplified by VERS.

3.3. Variability

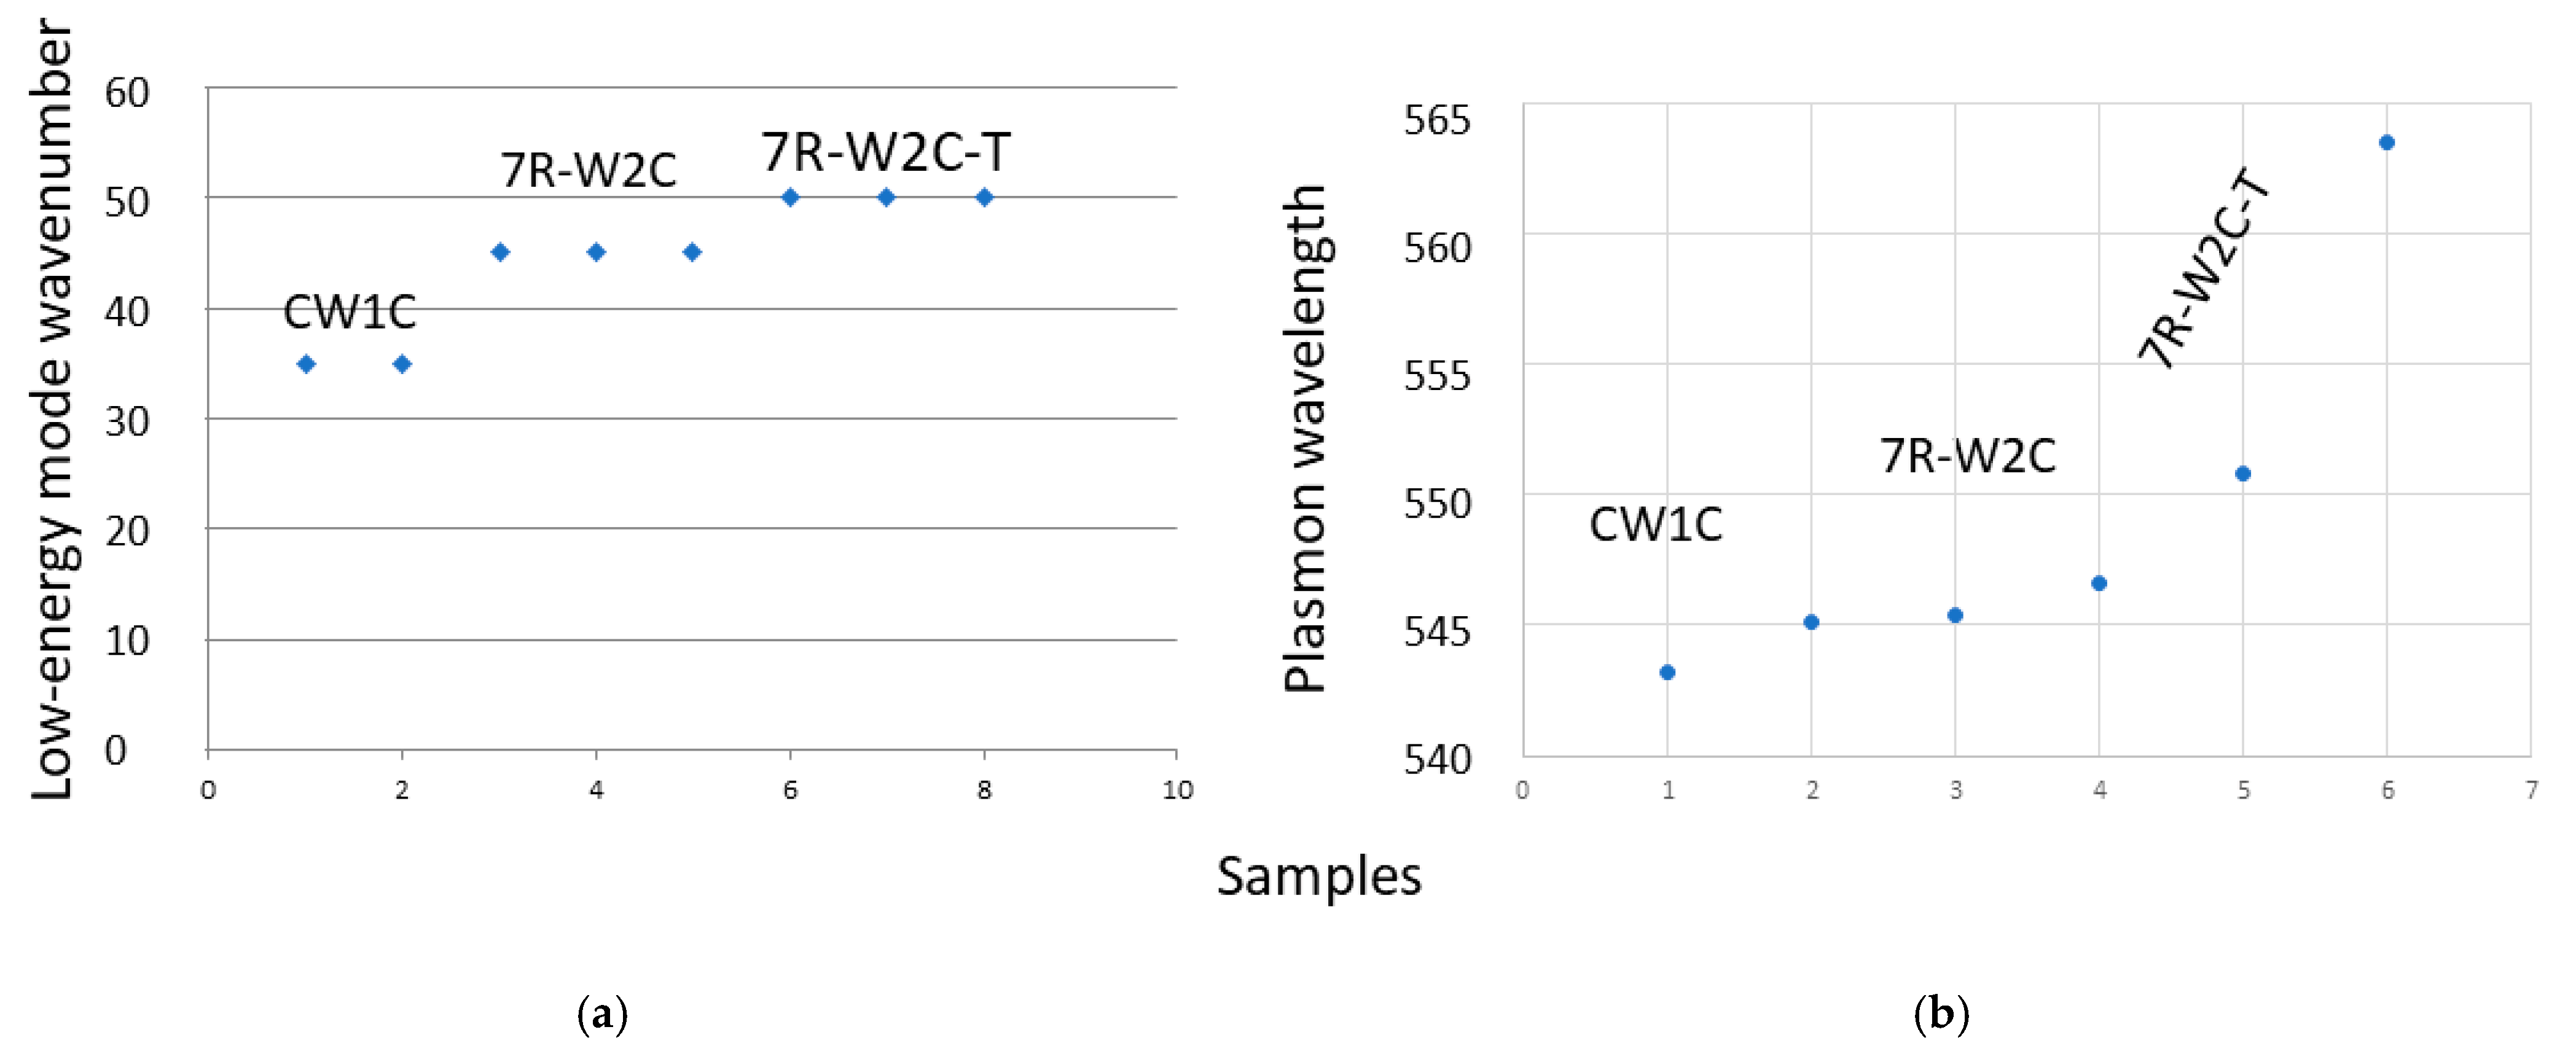
Some variability is observed both in the position of the ‘low wavenumber peak’ (Figure 6a) and in the plasmon-related fluorescence maximum (Figure 6b). The former shifts between 35 and 50 cm−1, and occasionally to values exceeding 70 cm−1. According to the relationship between the dominant Lamb (acoustic) mode and nanoparticle diameter (D) [78,79,80]:
n = [S × V]/[D × c] where S is a dimensionless mode constant, V the speed of sound in the metal, and c the speed of light in vacuum, the wavenumber shift reflects variations in the mean diameter of the gold nanoparticles. Measurements across individual plates yield comparable values (Figure 6a), suggesting that the mean diameter of gold nanoparticles is homogeneous within the glaze, consistent with the uniformity of color. It can be noted that the results for the low-energy band appear more homogeneous than those for the plasmon peaks, which tend to shift, particularly when measurements are taken on areas that visually appear as coloring defects.
Since the exact particle diameter cannot be determined (only Transmission Electron Microscopy, a destructive method, can provide this information) and the precise nature of the observed low-wavenumber mode cannot be firmly established (Boson peak, breathing, or other Lamb mode), direct calculation of nanoparticle size is not possible. Nevertheless, the relationship indicates that larger particles (expected to be more stable in the molten enamel) would shift toward lower frequencies, outside the observable window. Comparable low-wavenumber modes (~50 cm−1) have been reported for luster ceramics [45]. To resolve individual Lamb modes more clearly, higher-resolution techniques such as Brillouin spectroscopy or pump–probe methods would be required.
Fluorescence maxima of the ruby glazes are generally centered near 545 nm, consistent with their similar visual color. In plates with distinct hues (e.g., CW1C) or in areas showing visible defects (e.g., 7R-W2C-T), shifts in the fluorescence maximum are observed. These shifts are more pronounced in pink regions of painted enamels. It is well established that increasing nanoparticle size produces both a red-shift and a broadening of the plasmon band [11,59,60,61,62,63]. The modest dispersion observed here in fluorescence maxima is therefore most likely related to minor variations in nanoparticle size or morphology.
To our knowledge, no studies have examined the variation in position and shape of the luminescence band for gold nanoparticles in a glass matrix. The literature reports only the absorption bands as a function of average particle diameter, ranging from a few nanometers up to 300–400 nm. In our case, the plasmon luminescence peak is well defined, whereas the literature shows that the absorption band broadens significantly for particles larger than ~100 nm [59,60,61,62]. Our TEM study of red porcelain glaze [10] where red color arises from copper plasmon indicates copper nanoparticle diameters typically between 10 and 50 nm, with a wide size distribution including both nanometric particles and some reaching the micron scale.
We can reasonably assume a similar distribution for the ruby and pink glazes. Furthermore, careful inspection with a magnifying glass or binoculars sometimes allows the detection of gold flakes measuring a few microns.

3.4. Detection of Au° NPs Content by pXRF

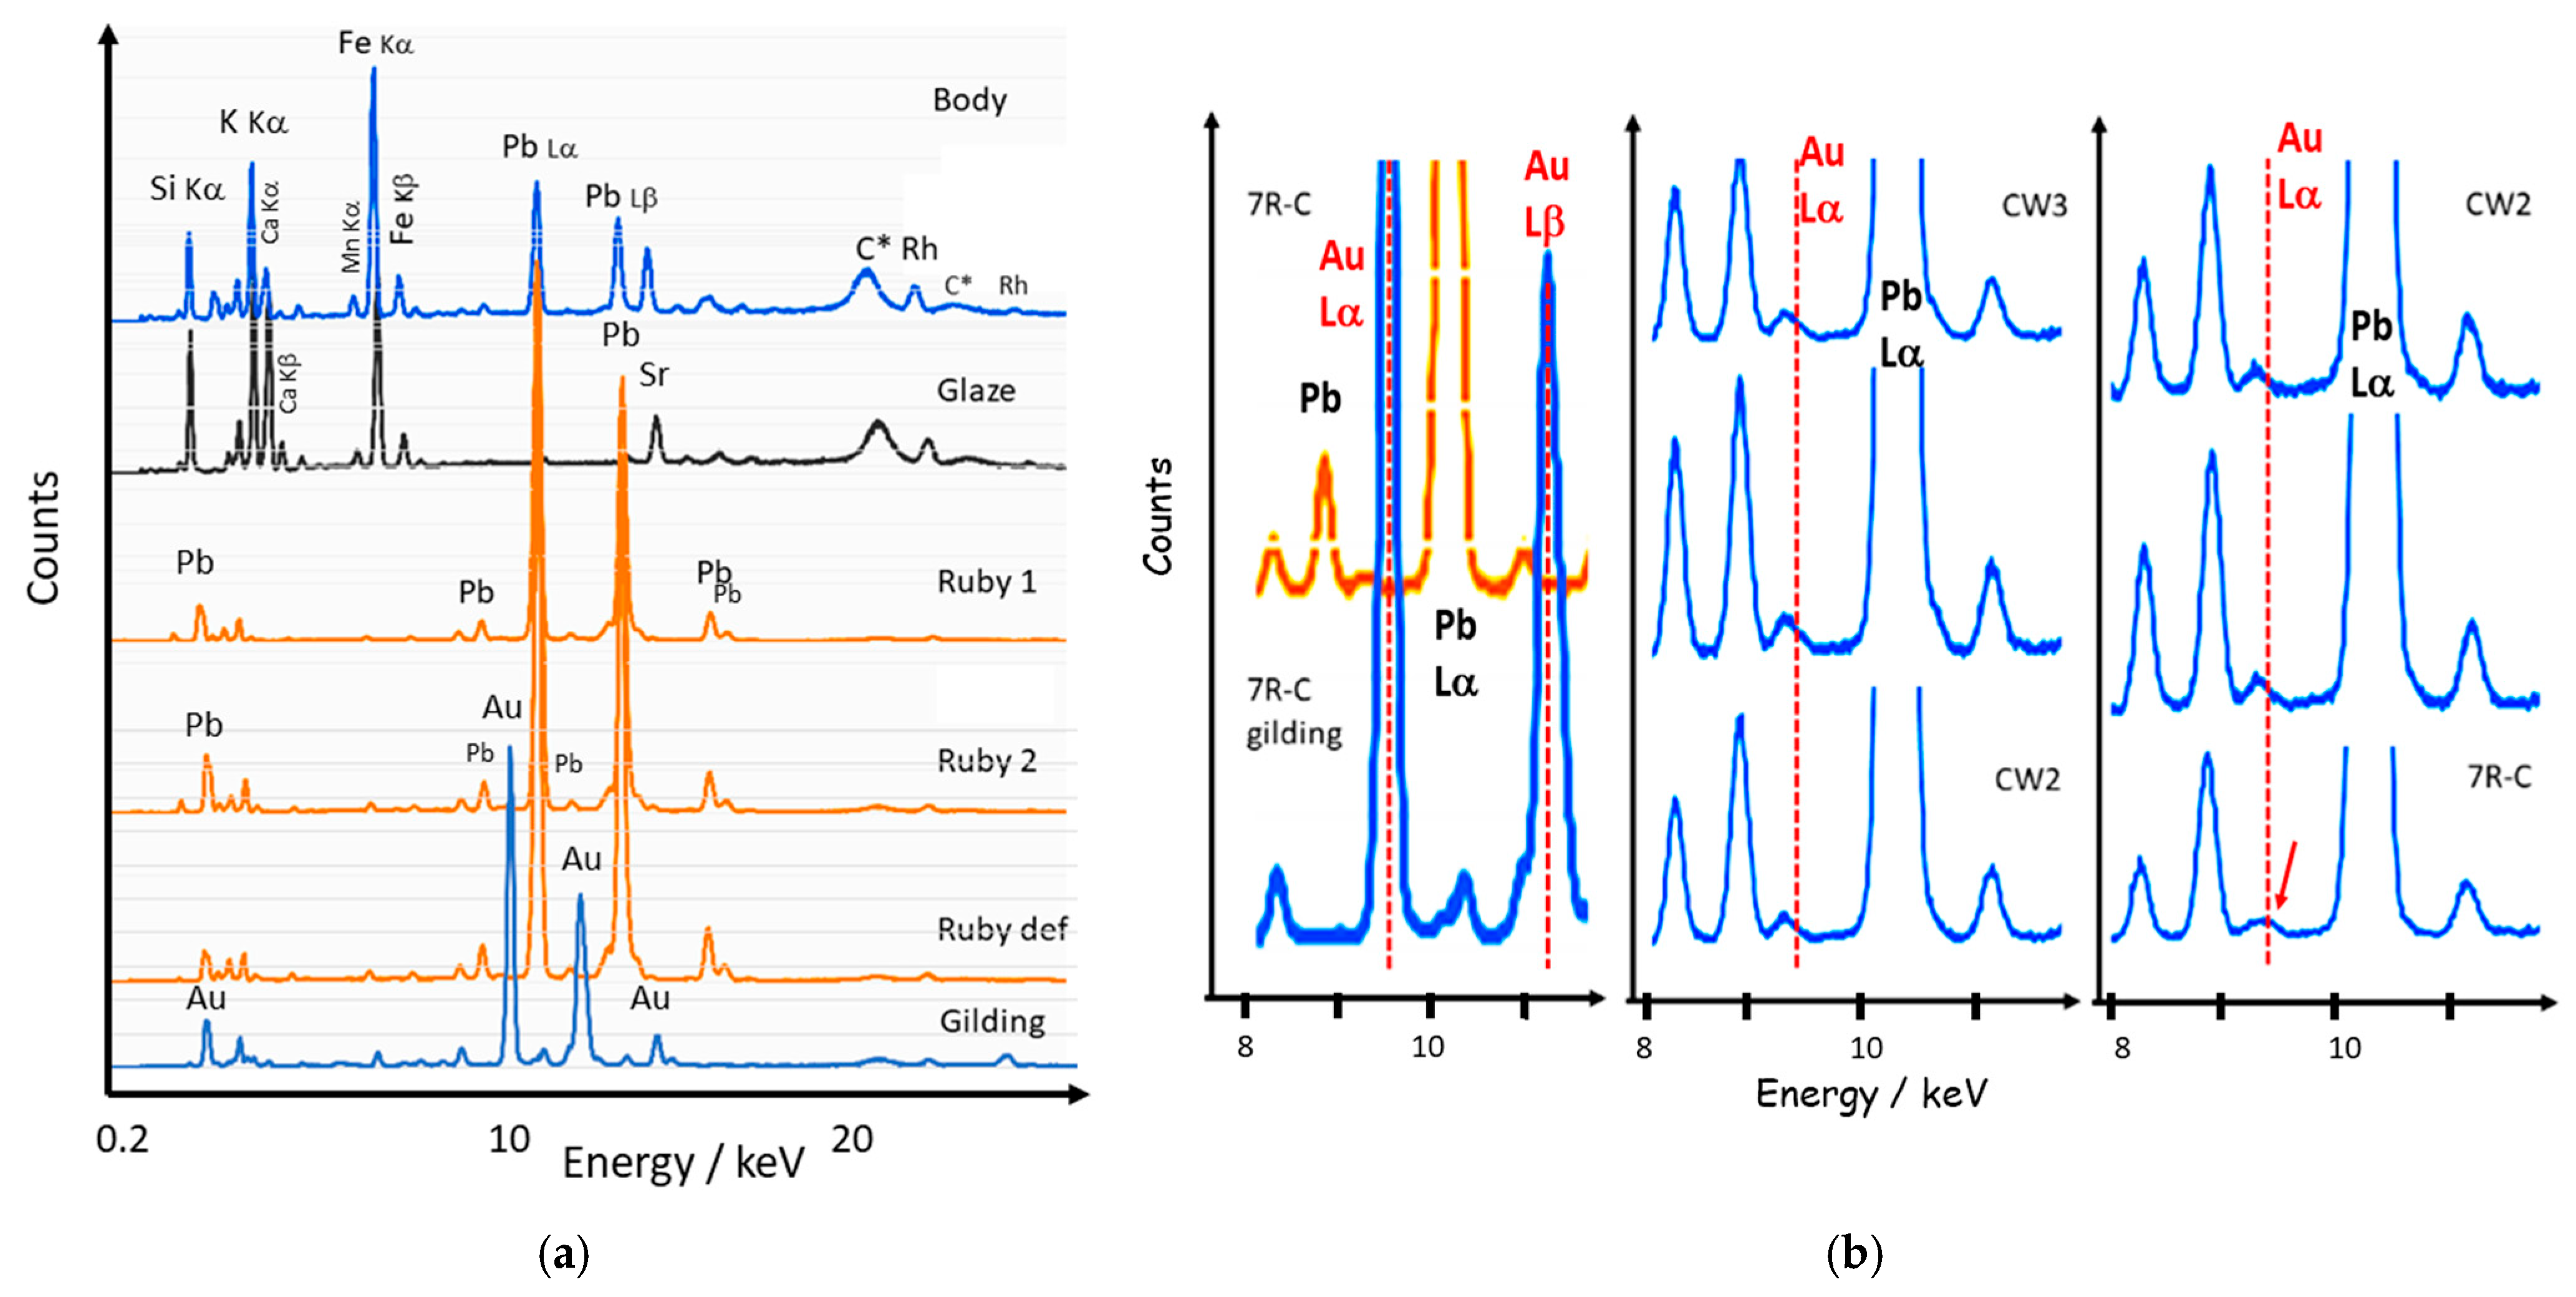
Figure 7 presents representative XRF spectra. Measurements at the surface of the porcelain body show weak traces of lead, attributable to surface contamination from the volatilization of lead oxide—an essential constituent of overglaze—during the firing of the decoration. Subsequent kiln pollution can also contribute to surface contamination. The presence of a relatively intense potassium peak is typical of porcelain [22]. As usual for a porcelain body, the iron peak also appears intense, but it corresponds to a low content. The same applies to the spectrum of the colorless glaze, for which the calcium peak is as intense as that of potassium, which is also typical for porcelain [22].
The spectra recorded on the ruby zone on the reverse show the dominance of lead transitions: the ruby glaze hosting gold nanoparticles is lead-rich; this is consistent with the Raman spectrum in Figure 4a. The spectrum recorded on the gilded area shows the gold XRF signature. The main Au peak (Lα transition) occurs at 9.71 keV, i.e., at the same position as a minor Pb transition, often not listed in standard XRF transition tables.
The signature of gold can only be detected from the asymmetry of the minor peak, as shown in Figure 7; for instance, the most obvious evidence is observed in the 7R-CW2C-T spectrum. In most cases, the measured XRF spectrum does not make it possible to detect peaks characteristic of gold, despite a ruby color. Note that preliminary measurements, not reported in this work, carried out with more efficient fixed instruments (M4 or, better, M4 plus Bruker), where a primary vacuum can be applied, slightly improve detection. Calculations using Artax software allow us to compare the gold content even in cases where visually only an asymmetry of the small peak is observable. Obviously, optical spectroscopy, fluorescence, or low-wavenumber Raman scattering are much more efficient for detecting the presence of metal nanoparticles.
Figure 8 compares the spectra in the approximately 25–30 keV energy range, where minor heavy elements that can be used for the precipitation of gold colloids are observed. Silver, which can potentially be associated with gold [22], either independently or alloyed, is also detected in this range (Figure 9). Unexpectedly, not only tin but also antimony are detected together in the ruby-back decoration. Tin (Sn+/Sn2+) is used for the precipitation of gold colloids (Kunckel’ method), but the use of both tin and antimony has not been reported. Since antimony has two valence states (Sb3+/Sb5+), it can promote the precipitation of gold via a redox reaction. The traces of cadmium revealed are attributed to impurities in the lead used.

3.5. Gilding, Blue, and Other Colors

Figure 9 shows a detailed view of the complexity of painted enamels. We will compare the XRF spectra recorded on gilded, blue, and yellow areas.
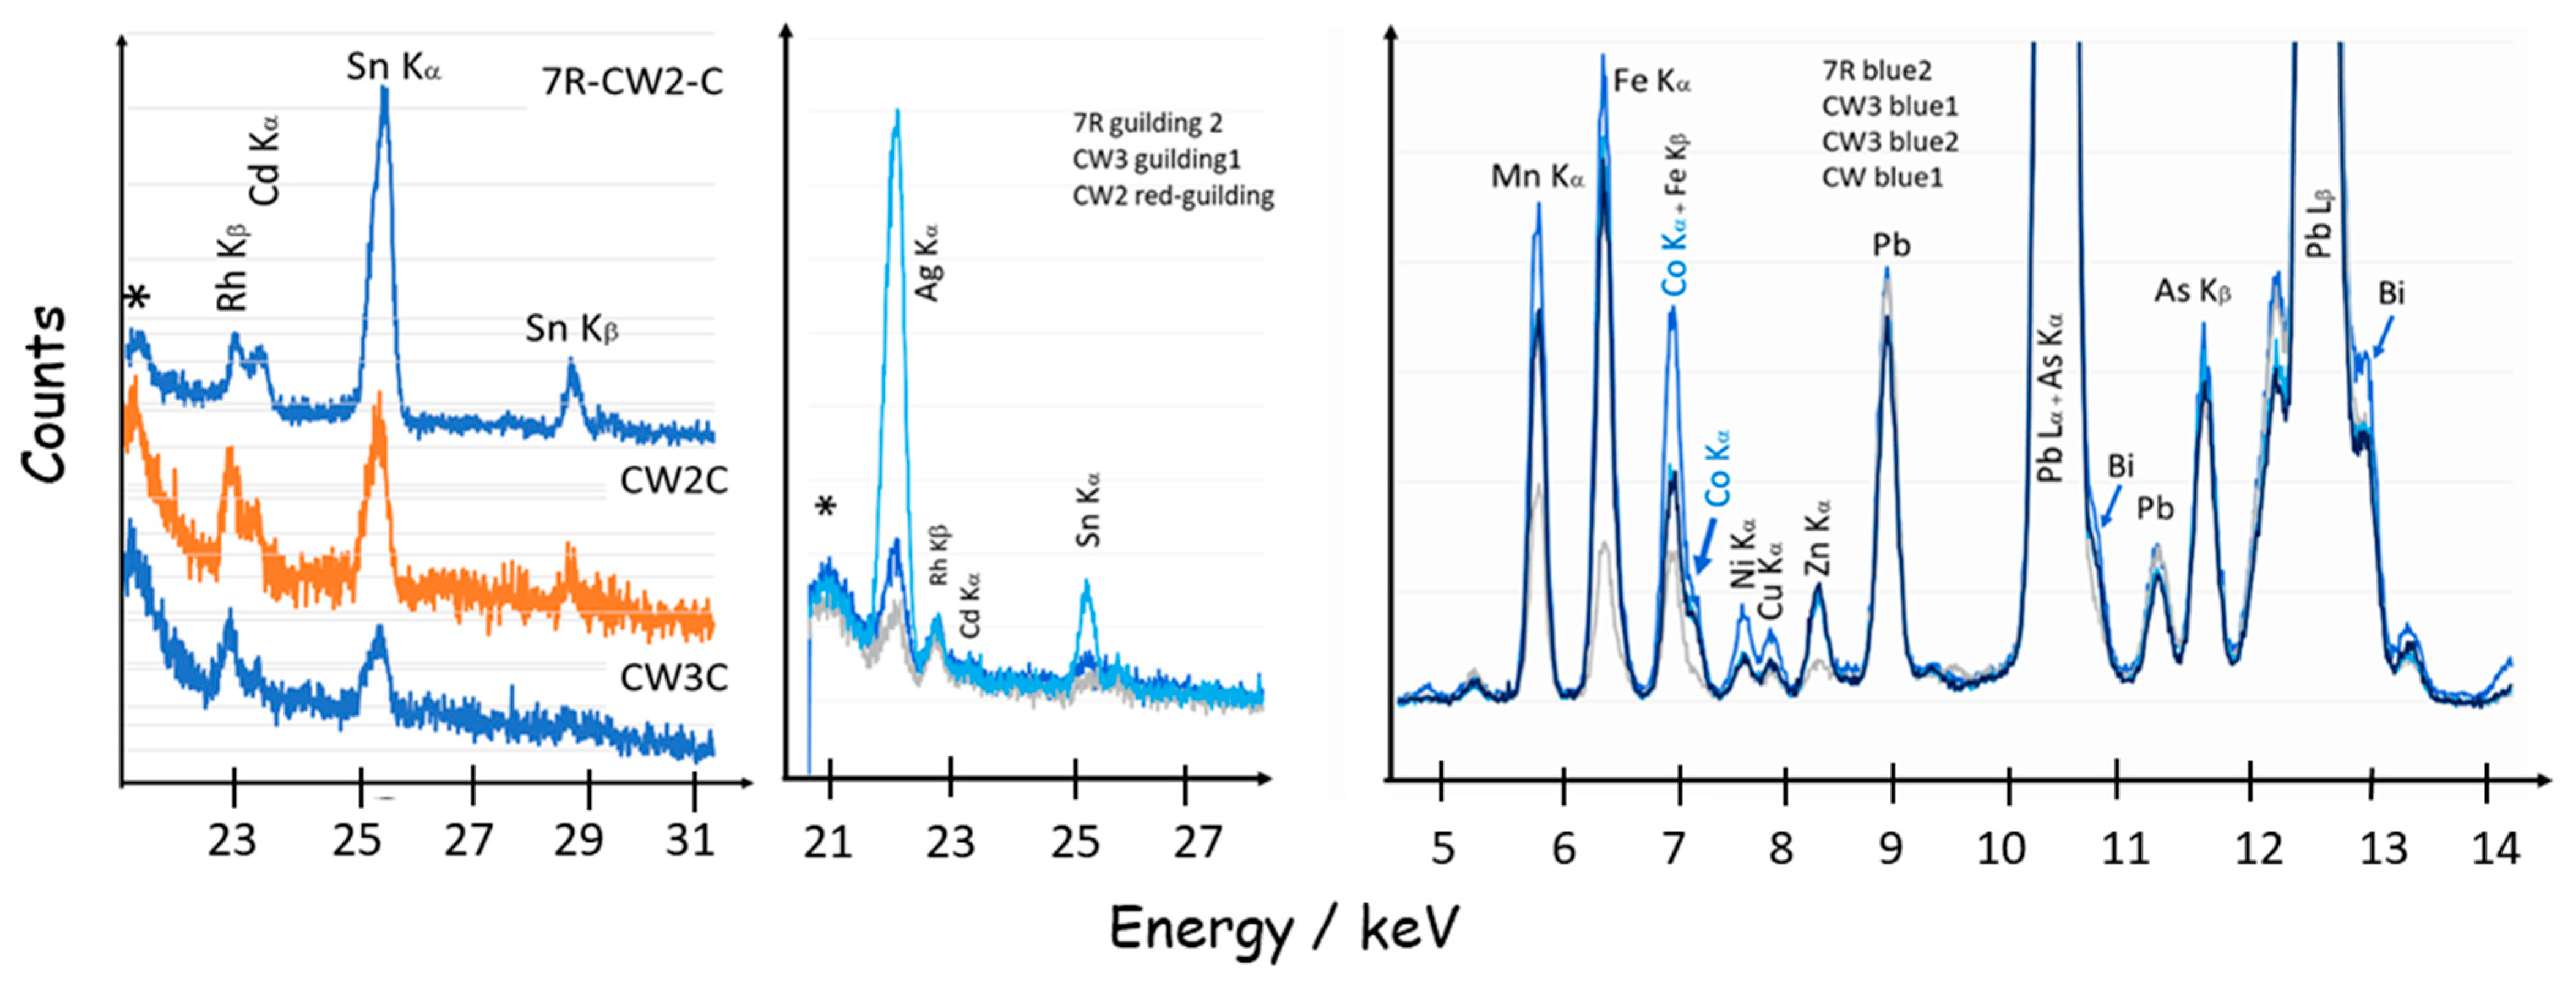
Figure 10 compares XRF spectra in the approximately 22–28 keV range, where Ag, Cd, and Sn peaks are located. Alloying small amounts of silver with gold is common in gilded ceramics and glass, and the addition of silver is considered to promote adhesion of the gold layer. The observation of tin and cadmium is new; cadmium and tin were already detected in the ruby glaze (Figure 8). This is rather surprising and suggests that all plates originate from the same workshop, or from workshops using the same raw materials.
Comparison of the XRF spectra recorded on blue enamel shows that both manganese and arsenic are associated with cobalt. Similar features were measured for other Qianlong reign artifacts [9,25,65,70] and this was attributed to the use of a mixture of European smalt (a cobalt source rich in arsenic and potassium) and Asian cobalt ores (rich in manganese and iron). The mixture is attributed to the desire to save on the use of European cobalt, which is more expensive than cobalt from Chinese or Asian mines. These latter cobalts contain a large quantity of manganese; their quantity must not exceed a certain proportion in order not to degrade the color during firing in an oxidizing atmosphere.
Figure 11 compares Fe, As and Sn signals in the glazes: some dispersion is observed, but a certain level of Sn is detected in all plates. This is rather surprising and suggests that all plates originate from the same workshop, or from workshops using the same raw materials.
The ternary diagram comparing the peak intensities of Fe, As, and Sn (normalized to the Au peak) confirms that gold nanoparticles in the ruby glaze were prepared using arsenic (Perrot route), and that pink enamels were also prepared in the same way, except for the CW1C plate, for which gold was precipitated using tin (Kunckel’ route). The preparation of the red enamel (CW2C plate) appears more complex, since both tin and arsenic are detected.
Figure 12 confirms that the same cobalt ‘mixture’ was used; the nickel content appears slightly lower for the CW2C plate. Comparison of yellow enamels (and the associated orange and brown colors, Figure 8) shows that tin is associated with some antimony, but not with zinc.
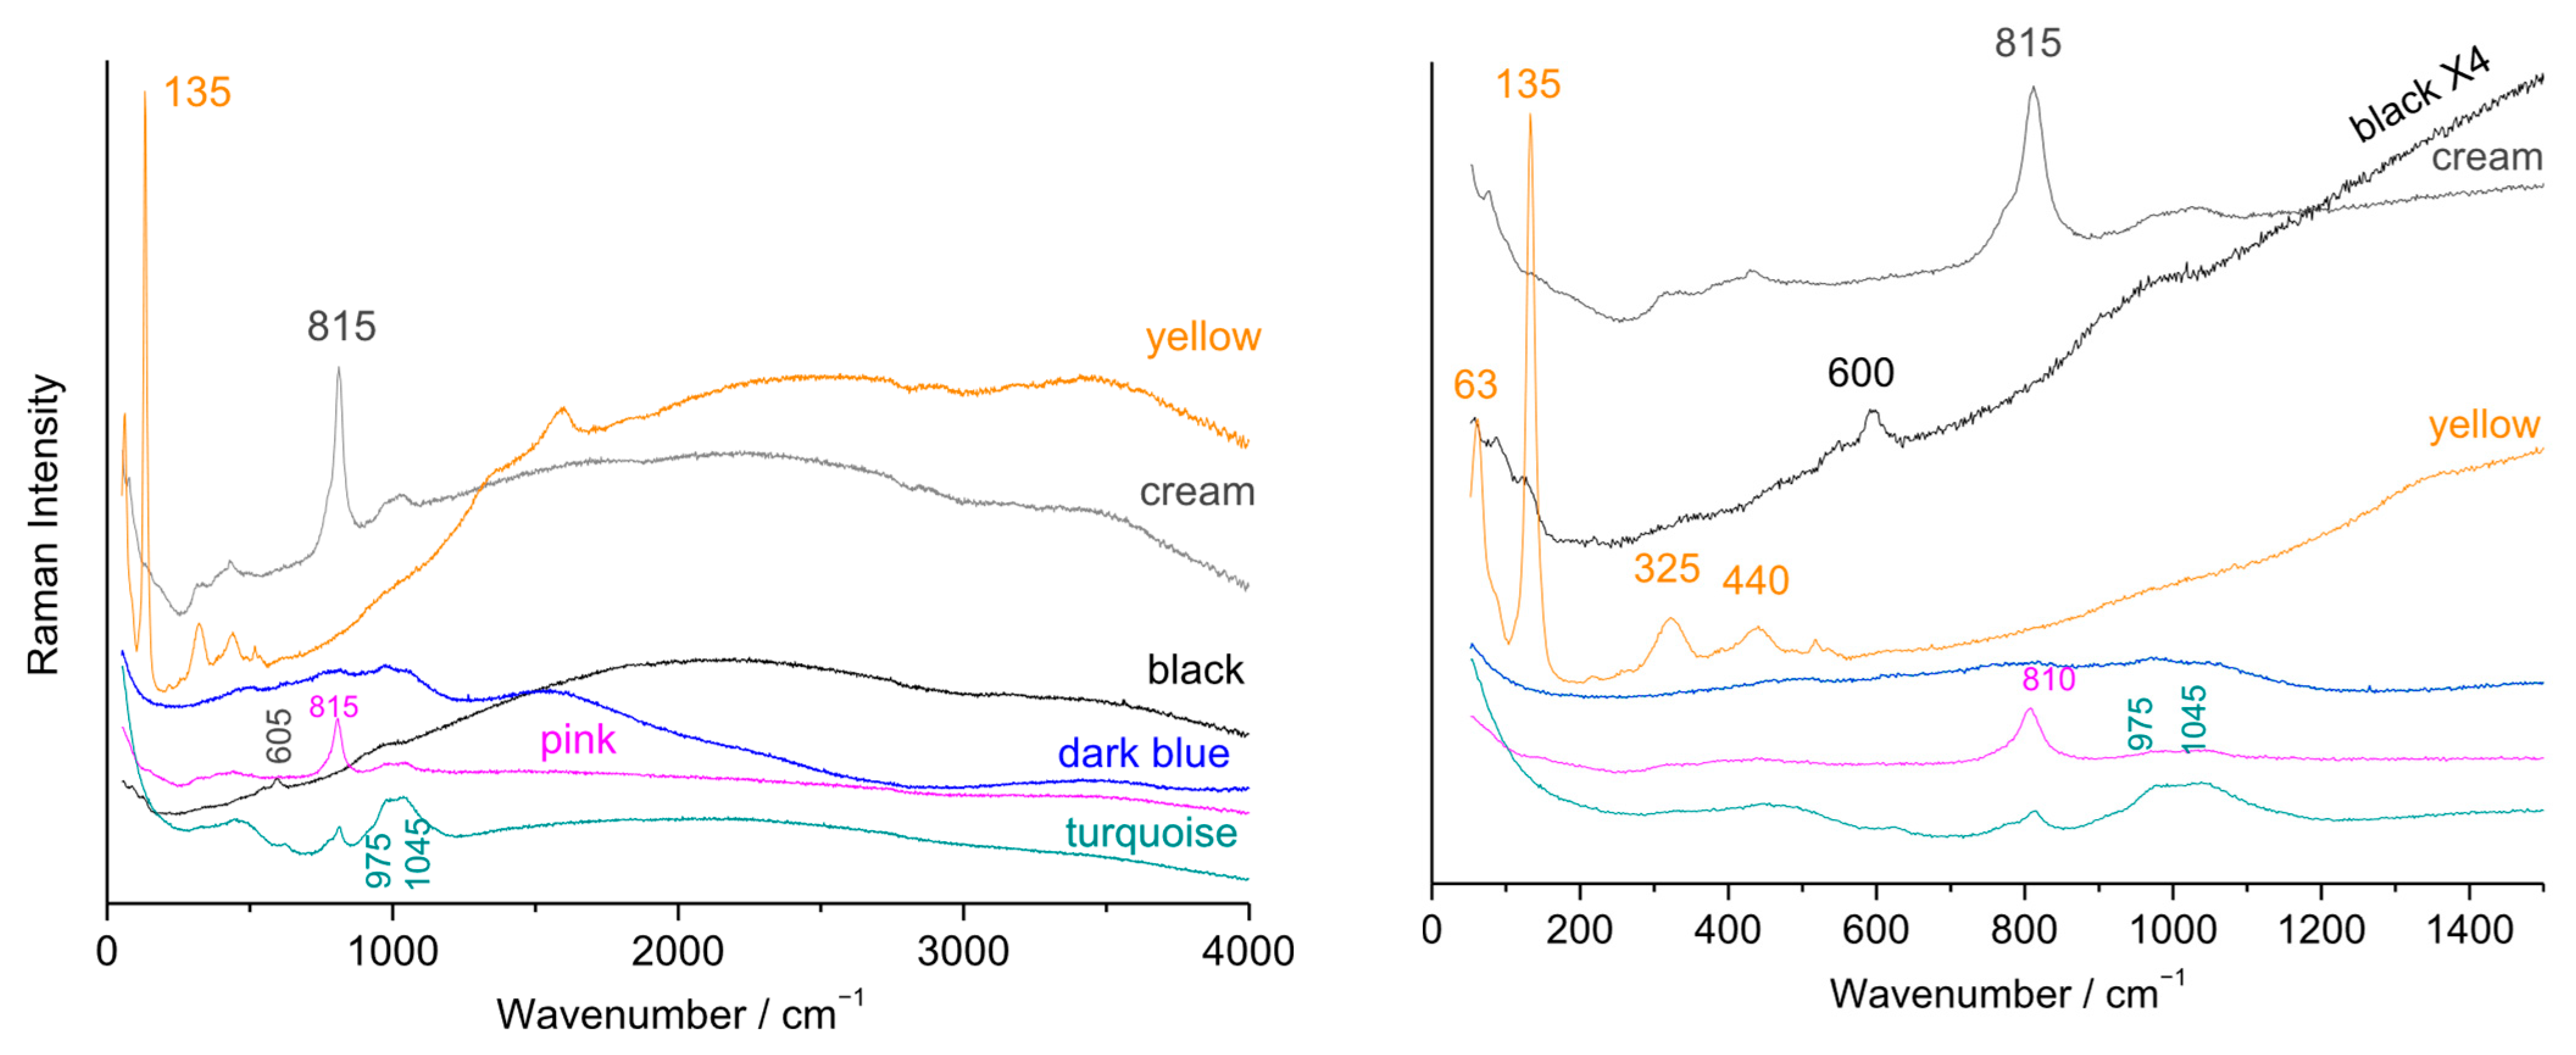
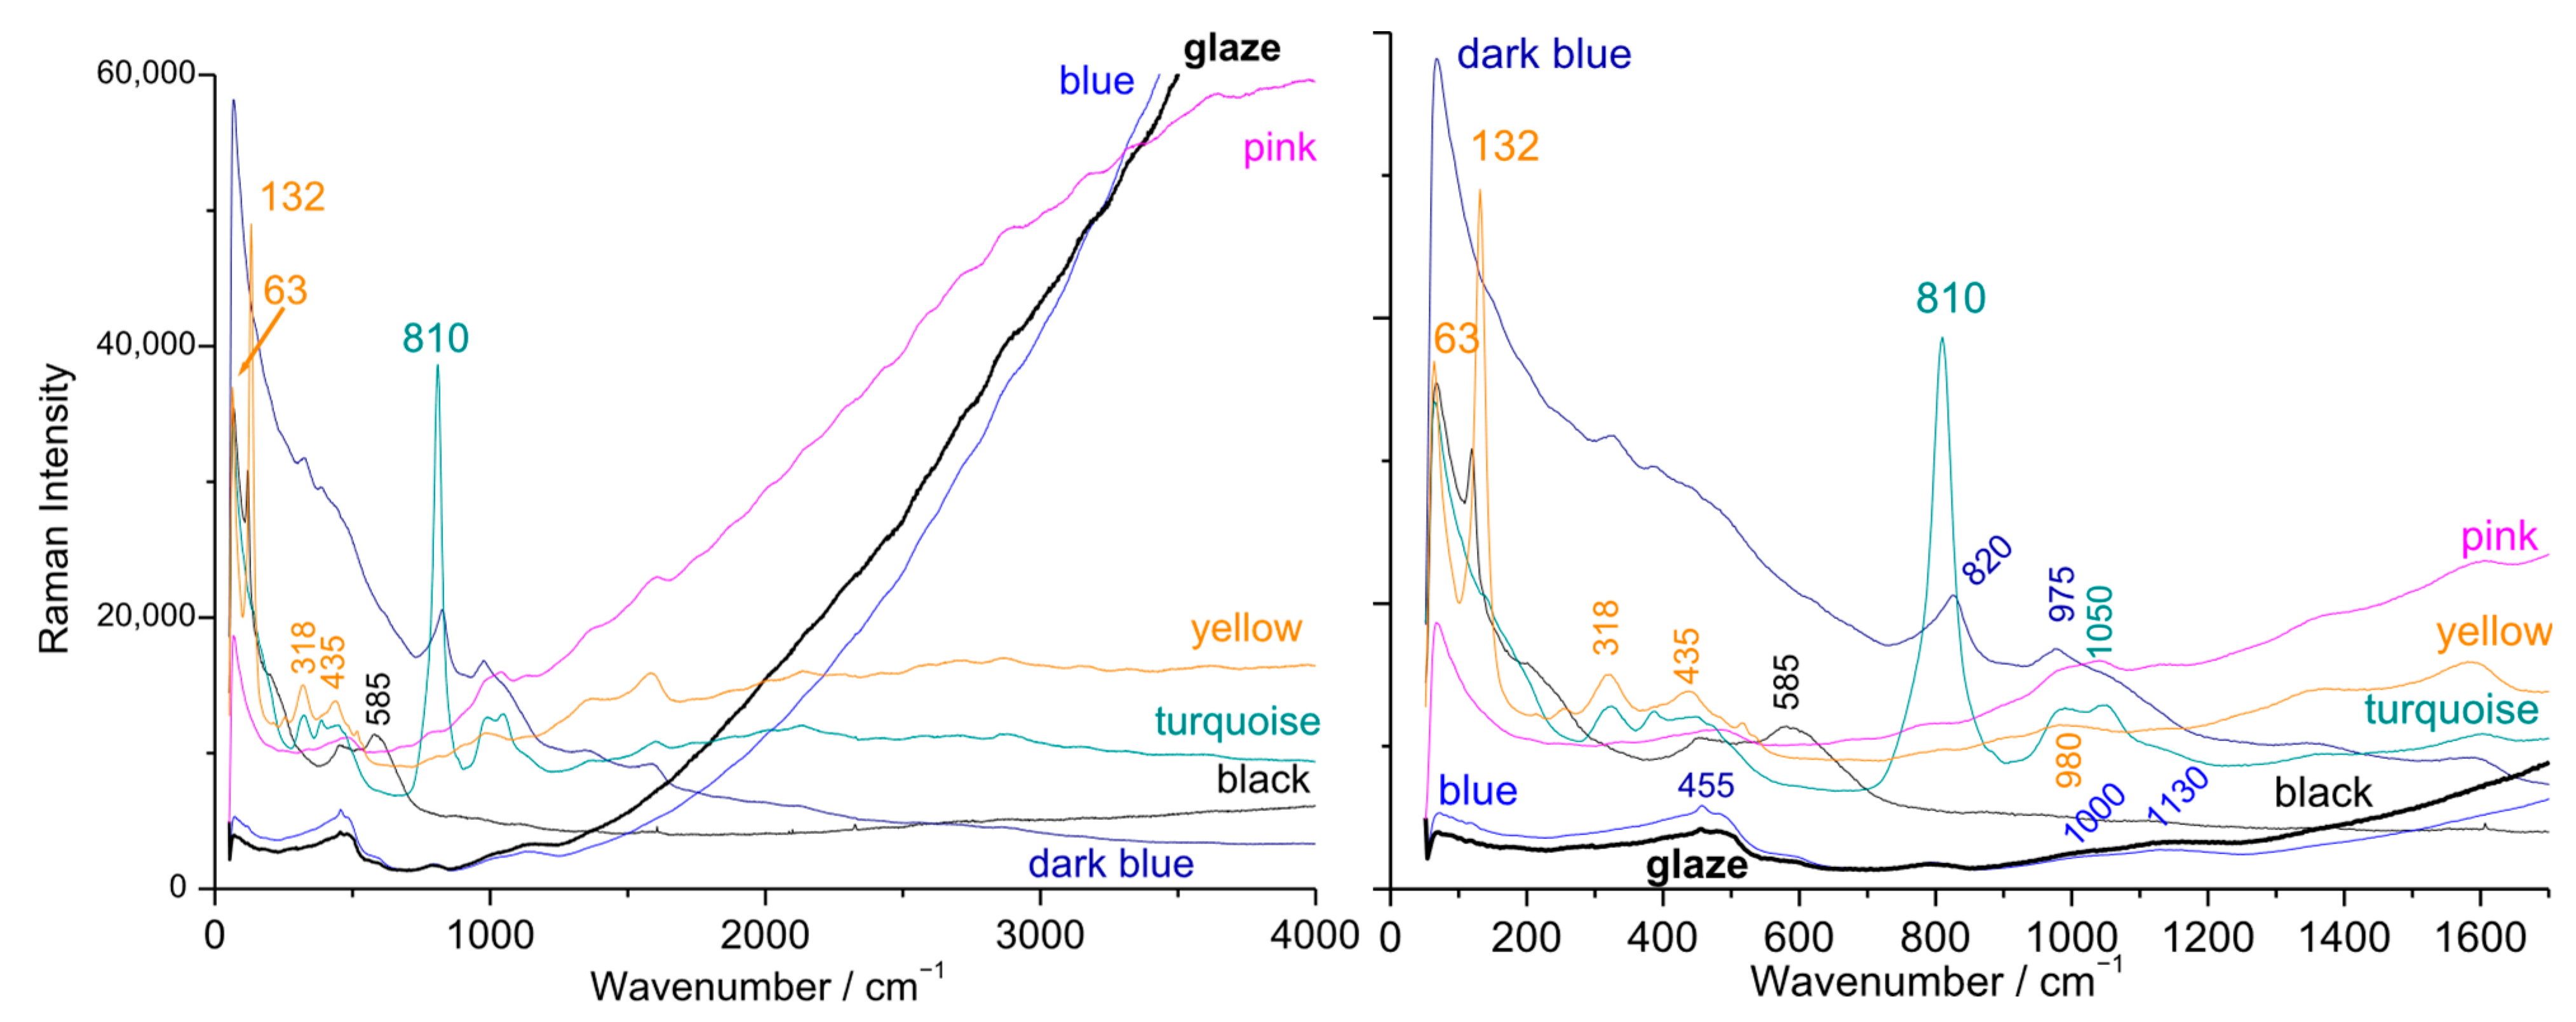
The coloring agents identified by their Raman spectra (Figure 13, Figure 14, Figure 15 and Figure 16) are similar to those identified in other Qing enameled porcelain [9,25,66,67,69]: white opacification by lead-and-alkali arsenate (main peak at 815 cm−1, although the width of the peak is variable due to structural distortions, disorders, or variations in crystallinity [56]); black by spinel (main peak at ~605 cm−1); blue using a small amount of European cobalt (the associated arsenate peak is weak or absent); tin-lead yellow with the formula PbSnO3 (only the peaks at ~63, 135, 325, and 440 cm−1) are intense [82,83,84,85,86] sometimes weakly substituted (peaks at 200 and 505 cm−1 weakly visible), in agreement with the XRF measurements.
The technical solutions used by Maison Samson are quite similar: white opacification is achieved with arsenate, and yellow and yellow-green hues with lead-tin, sometimes with the addition of antimony (peaks at 200 and 505 cm−1). Pink coloration is also achieved using gold, but without exhibiting the vibrational signature of lead arsenate. In contrast, black and colorless or lightly colored glazes exhibit very strong fluorescence when excited by a green laser. This intense fluorescence has been previously observed in the analysis of other Samson objects [25]. We can assume that it may originate from 19th-century grinding techniques using steel balls instead of quartz pebbles, which required acid treatment of the enamel powder prior to use.

4. Conclusions

The demonstration of plasmon fluorescence of gold nanoparticles is much more effective than pXRF analysis for identifying the use of colloidal gold, whereas pXRF is particularly effective for detecting the elements associated with gold preparation, such as arsenic, tin, or, in new results, antimony. It is difficult to demonstrate the use of iron since this element is always present. Yellow and green hues, different from those obtained by Cu2+ ions alone, mainly result from the use of simple tin yellow (PbSnO3). The cobalt used is a mixture of European sources (glass smalt rich in arsenic and potassium) and Asian sources (rich in manganese).
Little variability was observed in the egg-shell porcelains with similar decorations and dimensions/weight (7R plates), suggesting either the same workshop or at least the same raw materials and procedures. CW1C exhibits rather similar characteristics than 7R plates. CW2C employs a different technique of gold preparation (addition of Sn rather than only As), which is visible to the eye in the ruby color. This difference in the preparation of the gold nanoparticles may indicate the origin of different workshops. If the analysis of the low-wavenumber spectrum requires fixed instrumentation available only laboratories dedicated to solid-state spectroscopies and fundamental studies, the fluorescence spectrum can be recorded with less expensive mobile devices and at the place of conservation of the objects. This therefore offers the possibility of categorizing objects based on their production process and, in the future, distinguishing genuine artifacts, copies or fakes. For example, several notable differences in the fluorescence signals, along with the absence of a lead arsenate signature in the pink glazes, allow the identification of Maison Samson porcelains.
The strictly non-invasive approach necessary to preserve the integrity of the objects, limits the amount of information that can be obtained. Elemental analysis via X-ray fluorescence and measurement of plasmon luminescence positions can be performed using mobile instruments. However, a low-wavenumber Raman spectra cannot yet be acquired with mobile Raman spectrometers: the filters in such instruments impose a cut-off around 60 cm−1, whereas high-resolution fixed Raman spectrometers can reach cut-offs close to or below 10 cm−1. Access to very low-energy vibrations is instead possible using Brillouin spectrometers or pump-probe systems.
The arrangement of sherds to allow stratigraphic examination, combined with the use of scanning or transmission electron microscopy, should make it possible to answer questions such as: Is the layer containing the gold particles covered by a transparent enamel free of particles? What is the size distribution of the particles, and do they form aggregates? However, it is shown that measuring the low-energy mode and the position (and probably the shape) of the plasmon luminescence peak categorizes coloring agents from pink to purple colors. The position of the low-energy mode, correlated to the plasmon peak, is characteristic of each ‘pink’ color, which is an argument to attribute the mode either to a Lamb mode of the gold NPs (it varies with the object but not much), or to an enhancement by resonance of the Boson peak (VERS Effect), the intensity of the peak being very much greater than that of the uncolored glaze. A study coupled with (destructive) measurements in transmission electron microscopy is necessary to establish the relationships between the position of the vibration and luminescence modes and the size of the grains. This work demonstrates that the study of art objects involves complex challenges in understanding light-matter interactions, with materials as intricate as those used in modern photonic devices. These challenges are compounded by the requirement that analytical techniques be entirely non-invasive and, ideally, mobile, as transporting exceptional objects to the laboratory is often impractical due to cost, packaging, and insurance constraints.

Author Contributions

Conceptualization, P.C.; methodology, P.C. and G.S.-F.; investigation, P.C. and H.T.; data curation, P.C. and G.S.-F.; writing—original draft preparation, P.C., H.T. and G.S.-F.; writing—review and editing, P.C., H.T. and G.S.-F.; visualization, P.C. and G.S.-F. All authors have read and agreed to the published version of the manuscript.

Funding

This research received no external funding.

Institutional Review Board Statement

Not applicable.

Informed Consent Statement

Not applicable.

Data Availability Statement

The data presented in this study are available in the article.

Acknowledgments

The authors gratefully acknowledge the Collector for the possibility of analyzing artifacts.

Conflicts of Interest

The authors declare no conflicts of interest.

References

  1. Landry-Deron, I. Les Mathématiciens envoyés en Chine par Louis XIV en 1685. Arch. Hist. Exact Sci. 2001, 55, 423–463. [Google Scholar] [CrossRef]
  2. Shih, C.-F. The Arrival of a New Colour Palette in Eighteenth-century Jingdezhen. In Le Secret des Couleurs, Céramiques de Chine et d’Europe du XVIIIe Siècle à nos Jours; d’Abrigeon, P., Ed.; Fondation Baur-Musée des Arts d’Extrême Orient -5 Continents: Genève, Switzerland, 2022; pp. 21–59. [Google Scholar]
  3. Bellemare, J. A New Palette: Reassessing the Development of Enamel Colors in Early-Eighteenth-Century China. J. Glass Stud. 2022, 64, 147–167. Available online: https://www.jstor.org/stable/48703407 (accessed on 3 March 2025).
  4. Curtis, E.B. A Plan of the Emperor’s Glassworks. Arts Asiat. 2001, 56, 81–90. [Google Scholar] [CrossRef]
  5. Kırmızı, B.; Colomban, P.; Quette, B. On-site analysis of Chinese Cloisonné enamels from fifteenth to nineteenth centuries. J. Raman Spectrosc. 2010, 41, 780–790. [Google Scholar] [CrossRef]
  6. Quette, B. Cloisonné: Chinese Enamels from the Yuan, Ming and Qing Dynasties; Yale University Press: New York, NY, USA, 2011. [Google Scholar]
  7. Colomban, P. The Quest for the Western Colors in China Under the Qing Emperors. Journal18 2024, 17, 7219. Available online: https://www.journal18.org/7219 (accessed on 15 September 2025).
  8. Colomban, P. Tracer l’utilisation de recettes et/ou d’ingrédients européens dans les objets émaillés: Stratégie et premiers résultats. Artefact. Tech. Hist. Sci. Hum. 2023, 18, 161–193. [Google Scholar] [CrossRef]
  9. Colomban, P.; Gironda, M.; Simsek Franci, G.; d’Abrigeon, P. Distinguishing genuine imperial Qing dynasty porcelain from ancient replicas by on-site non-invasive XRF and Raman spectroscopy. Materials 2022, 15, 5747. [Google Scholar] [CrossRef]
  10. Sciau, P.; Noé, L.; Colomban, P. Metal nanoparticles in contemporary potters’ master pieces: Lustre and red “pigeon blood” potteries as models to understand the ancient pottery. Ceram. Int. 2016, 42, 15349–15357. [Google Scholar] [CrossRef]
  11. Colomban, P. The use of metal nanoparticles to produce yellow, red and iridescent colour, from bronze age to present times in lustre pottery and glass: Solid state chemistry, spectroscopy and nanostructure. J. Nano Res. 2009, 8, 109–132. [Google Scholar] [CrossRef]
  12. Jacquemart, A. Histoire Artistique, Industrielle et Commerciale de la Porcelaine: Sujets et Emblèmes Qui La Décorent, Marques et Inscriptions; Qui Font Reconnaître les Fabriques D’où elle Sort, les Variations de Prix Qu’ont Obtenus les Principaux Objets Connus & Les Collections où Ils Sont Conservés Aujourd’hui; J. Techener: Paris, France, 1862. [Google Scholar]
  13. Cardinal, C. Les Montres et Horloges de Table du Musée du Louvre; RMN: Paris, France, 2000. [Google Scholar]
  14. Colomban, P.; Kırmızı, B.; Gougeon, C.; Gironda, M.; Cardinal, C. Pigments and glassy matrix of the 17th–18th century enamelled French watches: A non-invasive on-site Raman and pXRF study. J. Cul. Herit. 2020, 44, 1–14. [Google Scholar] [CrossRef]
  15. Geyssant, J. (Ed.) Bernard Perrot (1640–1709), Secrets et Chefs d’œuvre des Verreries Royales d’Orléans; Catalogue, Musée des Beaux-Arts d’Orléans—SOMOGY Editions d’Arts: Paris, France, 2013. [Google Scholar]
  16. Colomban, P.; Kırmızı, B. Non-invasive on-site Raman study of polychrome and white enamelled glass artefacts in imitation of porcelain assigned to Bernard Perrot and his follower. J. Raman Spectrosc. 2020, 51, 133–146. [Google Scholar] [CrossRef]
  17. Ricciardi, P.; Colomban, P.; Tournié, A.; Macchiarola, M.; Ayed, N. A non-invasive study of Roman Age mosaic glass tesserae by means of Raman spectroscopy. J. Archaeol. Sci. 2009, 36, 2551–2559. [Google Scholar] [CrossRef]
  18. Spiegl, W.; Johann Kunckel und die Erfindung des Goldrubins. Weltkunst 1988. Available online: https://www.uni-wittenberg.de/wp-content/uploads/application/pdf/Spiegl-1988_Kunckel-und-die-Erfindung-des-Goldrubins.pdf (accessed on 5 September 2025).
  19. Heimann, R.R. Semidiaphanam Tremuli Narcissuli Ideam Lacteam: Ehrenfried Walther von Tschirnhaus (1651–1708) and His Determined Search for the Porcelain Principle. Archaeometry, 2025; in press. [Google Scholar] [CrossRef]
  20. Casadio, F.; Bezur, A.; Domoney, K.; Eremin, K.; Lee, L.; Mass, J.L.; Shortland, A.; Zumbulyadis, N. X-ray fluorescence applied to overglaze enamel decoration on eighteenth-and nineteenth-century porcelain from central Europe. Stud. Conserv. 2012, 57 (Suppl. S1), S61–S72. [Google Scholar] [CrossRef]
  21. Maggetti, M.; D’Albis, A. Phase and compositional analysis of a Sèvres soft paste porcelain plate from 1781, with a review of early porcelain techniques. Eur. J. Mineral. 2017, 29, 347–367. [Google Scholar] [CrossRef]
  22. Colomban, P.; Simsek Franci, G.; Gerken, M.; Gironda, M.; Mesqui, V. Non-Invasive On-Site XRF and Raman classification and dating of ancient ceramics: Application to 18th and 19th Century Meissen Porcelain (Saxony) and Comparison with Chinese Porcelain. Ceramics 2023, 6, 2178–2212. [Google Scholar] [CrossRef]
  23. Hunt, L.B. Gold in the pottery industry: The history and technology of gilding processes. Gold Bull. 1979, 12, 116–127. [Google Scholar] [CrossRef]
  24. Domoney, K.; Shortland, A.J.; Kuhn, S. Characterization of 18th-century Meissen porcelain using SEM–EDS. Archaeometry 2012, 54, 454–474. [Google Scholar] [CrossRef]
  25. Colomban, P.; Ngo, A.-T.; Fournery, N. Non-invasive Raman analysis of 18th Century Chinese export/armorial overglazed porcelain: Identification of the different enameling techniques. Heritage 2022, 5, 233–259. [Google Scholar] [CrossRef]
  26. Williamson, G.C. The Book of Famille Rose; Methuen and Co.: London, UK, 1927. [Google Scholar]
  27. Garner, H. The Origins of Famillie Rose. Trans. Orient. Ceram. Soc. 1967–1969, 37, 1–16. [Google Scholar]
  28. Kerr, R. What were the Origins of Chinese famille rose? Orientations 2000, 31, 53–60. [Google Scholar]
  29. Guo, X. The Origin and Early Features of Canton Enamels. In Sparkle and Charm: Canton Enamels of the Qing Dynasty; Xu, X., Ed.; The Chinese University of Hong Kong: Hong Kong, China, 2023; pp. 41–112. [Google Scholar]
  30. von Freymann, G.; Kitaev, V.; Lotsch, B.V.; Ozin, G.A. Bottom-up assembly of photonic crystals. Chem. Soc. Rev. 2013, 42, 2528–2554. [Google Scholar] [CrossRef]
  31. Bandaru, S.; Arora, D.; Ganesh, K.M.; Umrao, S.; Thomas, S.; Bhaskar, S.; Chakrabortty, S. Recent advances in research from nanoparticle to nano-assembly: A review. Nanomaterials 2024, 14, 1387. [Google Scholar] [CrossRef]
  32. Parviz, B.A.; Ryan, D.; Whitesides, G.M. Using self-assembly for the fabrication of nano-scale electronic and photonic devices. IEEE Trans. Adv. Packag. 2003, 26, 233–241. [Google Scholar] [CrossRef]
  33. Cai, Z.; Li, Z.; Ravaine, S.; He, M.; Song, Y.; Yin, Y.; Zheng, H.; Teng, J.; Zhang, A.O. From colloidal particles to photonic crystals: Advances in self-assembly and their emerging applications. Chem. Soc. Rev. 2021, 50, 5898–5951. [Google Scholar] [CrossRef]
  34. Pileni, M.P. Self-assembly of inorganic nanocrystals: Fabrication and collective intrinsic properties. Acc. Chem. Res. 2007, 40, 685–693. [Google Scholar] [CrossRef]
  35. Blanco-Formoso, M.; Pazos-Perez, N.; Alvarez-Puebla, R.A. Fabrication of plasmonic supercrystals and their SERS enhancing properties. ACS Omega 2020, 5, 25485–25492. [Google Scholar] [CrossRef]
  36. Courty, A.; Lisiecki; Pileni, M.P. Vibration of self-organized silver nanocrystals. J. Chem. Phys. 2002, 116, 8074–8078. [Google Scholar] [CrossRef]
  37. Courty, A.; Bayle, M.; Carles, R. Plasmon-enhanced inelastic scattering by 2 D and 3 D superlattices made of silver nanocrystals. J. Raman Spectrosc. 2019, 50, 74–84. [Google Scholar] [CrossRef]
  38. Colomban, P.; Tournie, A.; Ricciardi, P. Raman spectroscopy of copper nanoparticle-containing glass matrices: Ancient red stained-glass windows. J. Raman Spectrosc. 2009, 40, 1949–1955. [Google Scholar] [CrossRef]
  39. Li, R.; Pang, C.; Li, Z.; Chen, F. Plasmonic nanoparticles in dielectrics synthesized by ion beams: Optical properties and photonic applications. Adv. Opt. Mater. 2020, 8, 1902087. [Google Scholar] [CrossRef]
  40. Stepanov, A.L. Synthesis of silver nanoparticles in dielectric matrix by ion implantation: A review. Rev. Adv. Mater. Sci. 2010, 26, 1–29. [Google Scholar]
  41. Quandt, A.; Ferrari, M.; Righini, G.C. Advancement of glass-ceramic materials for photonic applications. In Sol-Gel Based Nanoceramic Materials: Preparation, Properties and Applications; Springer International Publishing: Cham, Switzerland, 2016; pp. 133–155. [Google Scholar]
  42. Wei, Y.; Ebendorff-Heidepriem, H.; Zhao, J. Recent advances in hybrid optical materials: Integrating nanoparticles within a glass matrix. Adv. Opt. Mater. 2019, 7, 1900702. [Google Scholar] [CrossRef]
  43. Colomban, P.; Ambrosi, F.; Ngo, A.T.; Lu, T.A.; Feng, X.L.; Chen, S.; Choi, C.L. Comparative analysis of wucai Chinese porcelains using mobile and fixed Raman microspectrometers. Ceram Int. 2017, 43, 14244–14256. [Google Scholar] [CrossRef]
  44. Colomban, P.; Simsek Franci, G.; Gallet, X. Non-Invasive Mobile Raman and pXRF Analysis of Armorial Porcelain with the Coat of Arms of Louis XV and Others Enamelled in Canton: Analytical Criteria for Authentication. Heritage 2024, 7, 4881–4913. [Google Scholar] [CrossRef]
  45. Colomban, P.; Truong, C. Non-destructive Raman study of the glazing technique in lustre potteries and faience (9–14th centuries): Silver ions, nanoclusters, microstructure and processing. J. Raman Spectrosc. 2004, 35, 195–207. [Google Scholar] [CrossRef]
  46. Colomban, P.; Schreiber, H.D. Raman signature modification induced by copper nanoparticles in silicate glass. J. Raman Spectrosc. 2005, 36, 884–890. [Google Scholar] [CrossRef]
  47. Norris, D.; Braekmans, D.; Domoney, K.; Shortland, A. The composition and technology of polychrome enamels on Chinese ruby-backed plates identified through nondestructive micro-X-ray fluorescence. X-Ray Spectrom. 2020, 49, 502–510. [Google Scholar] [CrossRef]
  48. Duan, H.; Zhang, X.; Kang, B.; Wang, G.; Qu, L.; Lei, Y. Non-destructive analysis and deterioration study of a decorated Famille Rose porcelain bowl of Qianlong Reign from the Forbidden City. Stud. Conserv. 2019, 64, 311–322. [Google Scholar] [CrossRef]
  49. Kingery, W.D.; Vandiver, P.B. The eighteenth-century change in technology and style from the famille-verte palette to the famille-rose palette. In Proceedings of the Technology and Style: Proceedings of a Symposium on Ceramic History and Archaeology at the 87th Annual Meeting of the American Ceramic Society, Cincinnati, OH, USA, 6 May 1985; The American Ceramic Society: Westerville, OH, USA, 1985; Volume 2, pp. 363–381. [Google Scholar]
  50. Bruker. Available online: https://xrfcheck.bruker.com/InfoDepth (accessed on 9 August 2025).
  51. Slitine, F. C’est un vrai Samson! Sèvres. Rev. Société Amis Musée Natl. Céramique 1998, 7, 66–80. [Google Scholar] [CrossRef]
  52. Albis, A.D. Saint-Cloud ou King-Te-Tchen? Sèvres. Rev. Société Amis Musée Natl. Céramique 2007, 16, 46–50. [Google Scholar] [CrossRef]
  53. Antikeo. Available online: https://www.antikeo.com/magazine/la-manufacture-samson-une-histoire-de-famille/ (accessed on 9 July 2024).
  54. Bushell, S.W. Chinese Eggshell Porcelain with’ Marks,’ from the Collection of the Late Hon. Sir Robert Meade, GCB Part II (Conclusion). Burlingt. Mag. Connoiss. 1906, 9, 393–395. [Google Scholar]
  55. Ming, C.; Yang, Y.; Zhu, J.; Guan, L.; Fan, C.; Xu, C.; Yao, Z.; Kenoyer, J.M.; Song, G.; Wang, C. Archaeometric investigation of the relationship between ancient egg-white glazed porcelain (Luanbai) and bluish white glazed porcelain (Qingbai) from Hutian Kiln, Jingdezhen, China. J. Archaeol. Sci. 2014, 47, 78–84. [Google Scholar] [CrossRef]
  56. Fang, L. Ceramics of the Qing Dynasty. In The History of Chinese Ceramics; Springer Nature Singapore: Singapore, 2023; pp. 807–1072. [Google Scholar]
  57. Yan, C. Elegance of Porcelain from the Yongzheng Reign. In A Brief History of Chinese Imperial Porcelain: From Song Dynasty to Qing Dynasty; Springer Nature Singapore: Singapore, 2024; pp. 291–316. [Google Scholar]
  58. Li, Y.; Zhu, J.; Ji, L.; Shan, Y.; Jiang, S.; Chen, G.; Sciau, P.; Wang, W.; Wang, C. Study of arsenic in Famille rose porcelain from the Imperial Palace of Qing Dynasty, Beijing, China. Ceram. Int. 2018, 44, 1627–1632. [Google Scholar] [CrossRef]
  59. Link, S.; El-Sayed, M.A. Size and temperature dependence of the plasmon absorption of colloidal gold nanoparticles. J. Phys. Chem. B 1999, 103, 4212–4217. [Google Scholar] [CrossRef]
  60. Ghosh, S.K.; Pal, T. Interparticle coupling effect on the surface plasmon resonance of gold nanoparticles: From theory to applications. Chem. Rev. 2007, 107, 4797–4862. [Google Scholar] [CrossRef]
  61. Mustafa, D.E.; Yang, T.; Xuan, Z.; Chen, S.; Tu, H.; Zhang, A. Surface plasmon coupling effect of gold nanoparticles with different shape and size on conventional surface plasmon resonance signal. Plasmonics 2010, 5, 221–231. [Google Scholar] [CrossRef]
  62. Peng, S.; McMahon, J.M.; Schatz, G.C.; Gray, S.K.; Sun, Y. Reversing the size-dependence of surface plasmon resonances. PNAS 2010, 107, 14530–14534. [Google Scholar] [CrossRef] [PubMed]
  63. Susman, M.D.; Feldman, Y.; Bendikov, T.A.; Vaskevich, A.; Rubinstein, I. Real-time plasmon spectroscopy study of the solid-state oxidation and Kirkendall void formation in copper nanoparticles. Nanoscale 2017, 9, 12573–12589. [Google Scholar] [CrossRef]
  64. Colomban, P.; Arberet, L.; Kırmızı, B. On-site Raman analysis of 17th and 18th century Limoges enamels: Implications on the European cobalt sources and the technological relationship between Limoges and Chinese enamels. Ceram. Int. 2017, 43, 10158–10165. [Google Scholar] [CrossRef]
  65. Colomban, P.; Kırmızı, B.; Simsek Franci, G. Cobalt and Associated Impurities in Blue (and Green) Glass, Glaze and Enamel: Relationships between Raw Materials, Processing, Composition, Phases and International Trade. Minerals 2021, 11, 633. [Google Scholar] [CrossRef]
  66. Colomban, P.; Simsek Franci, G.; Gironda, M.; d’Abrigeon, P.; Schumacher, A.-C. pXRF Data Evaluation Methodology for On-Site Analysis of Precious Artifacts: Cobalt Used in the Blue Decoration of Qing Dynasty Overglazed Porcelain Enameled at Customs District (Guangzhou), Jingdezhen and Zaobanchu (Beijing) Workshops. Heritage 2022, 5, 1752–1778. [Google Scholar] [CrossRef]
  67. Colomban, P.; Simsek Franci, G.; Burlot, J.; Gallet, X.; Zhao, B.; Clais, J.-B. Non-Invasive On-Site pXRF Analysis of Coloring Agents, Marks and Enamels of Qing Imperial and Non-Imperial Porcelain. Ceramics 2023, 6, 447–474. [Google Scholar] [CrossRef]
  68. Kissin, S.A. Five-element (Ni-Co-As-Ag-Bi) veins. Geosci. Can. 1992, 19, 113–124. Available online: https://journals.lib.unb.ca/index.php/gc/article/view/3768/4282 (accessed on 4 September 2025).
  69. Van Pevenage, J.; Lauwers, D.; Herremans, D.; Verhaeven, E.; Vekemans, B.; De Clercq, W.; Vincze, L.; Moens, L.; Vandenabeele, P. A combined spectroscopic study on Chinese porcelain containing Ruan-Cai colors. Anal. Methods 2014, 6, 387–394. [Google Scholar] [CrossRef]
  70. Giannini, R.; Freestone, I.C.; Shortland, A.J. European cobalt sources identification in the production of Chinese Famille Rose porcelain. J. Archaeol. Sci. 2016, 80, 27–36. [Google Scholar] [CrossRef]
  71. Colomban, P.; Simsek Franci, G. Timurid, Ottoman, Safavid and Qajar ceramics: Raman and composition classification of the different types of glaze and pigments. Minerals 2023, 13, 977. [Google Scholar] [CrossRef]
  72. Colomban, P.; Milande, V. On-site Raman analysis of the earliest known Meissen porcelain and stoneware. J. Raman Spectrosc. 2006, 37, 606–613. [Google Scholar] [CrossRef]
  73. Colomban, P. Polymerization degree and Raman identification of ancient glasses used for jewelry, ceramic enamels and mosaics. J. Non-Crystall. Solids 2003, 323, 180–187. [Google Scholar] [CrossRef]
  74. Malinovsky, V.K.; Sokolov, A.P. The nature of boson peak in Raman scattering in glasses. Solid State Comm. 1986, 57, 757–761. [Google Scholar] [CrossRef]
  75. Schroeder, J.; Wu, W.; Apkarian, J.L.; Lee, M.; Hwa, L.G.; Moynihan, C.T. Raman scattering and Boson peaks in glasses: Temperature and pressure effects. J. Non-Crystall. Solids 2004, 349, 88–97. [Google Scholar] [CrossRef]
  76. Duval, E.; Mermet, A.; Saviot, L. Boson peak and hybridization of acoustic modes with vibrations of nanometric heterogeneities in glasses. Phys. Rev. B 2007, 75, 024201. [Google Scholar] [CrossRef]
  77. Duval, E.; Boukenter, A.; Champagnon, B. Vibration eigenmodes and size of microcrystallites in glass: Observation by very-low-frequency Raman scattering. Phys. Rev. Lett. 1986, 56, 2052. [Google Scholar] [CrossRef] [PubMed]
  78. Girard, A.; Lermé, J.; Gehan, H.; Margueritat, J.; Mermet, A. Mechanisms of resonant low frequency Raman scattering from metallic nanoparticle Lamb modes. J. Chem. Phys. 2017, 146, 194201. [Google Scholar] [CrossRef]
  79. Palpant, B.; Portales, H.; Saviot, L.; Lermé, J.; Prével, B.; Pellarin, M.; Duval, E.; Perez, A.; Broyer, M. Quadrupolar vibrational mode of silver clusters from plasmon-assisted Raman scattering. Phys. Rev. B 1999, 60, 17107. [Google Scholar] [CrossRef]
  80. Tamura, A.; Higeta, K.; Ichinokawa, T. Lattice vibrations and specific heat of a small particle. J. Phys. C Solid State Phys. 1982, 15, 4975. [Google Scholar] [CrossRef]
  81. Ivanda, M.; Furić, K.; Musić, S.; Ristić, M.; Gotić, M.; Ristić, D.; Tonejc, A.M.; Djerdj, I.; Mattarelli, M.; Montagna, M.; et al. Low wavenumber Raman scattering of nanoparticles and nanocomposite materials. J. Raman Spectrosc. 2007, 38, 647–659. [Google Scholar] [CrossRef]
  82. Burlot, J.; Vangu, D.; Bellot-Gurlet, L.; Colomban, P. Raman identification of pigments and opacifiers: Interest and limitation of multivariate analysis by comparison with solid state spectroscopical approach—I. Lead-tin and Naples Yellow. J. Raman Spectrosc. 2024, 55, 161–183. [Google Scholar] [CrossRef]
  83. Sakellariou, K.; Miliani, C.; Morresi, A.; Ombelli, M. Spectroscopic investigation of yellow majolica glazes. J. Raman Spectrosc. 2004, 35, 61–67. [Google Scholar] [CrossRef]
  84. Sandalinas, C.; Ruiz-Moreno, S.; Lopez-Gil, A.; Miralles, J. Experimental confirmation by Raman spectroscopy of a Pb-Sn-Sb triple oxide yellow pigment in sixteenth-century Italian pottery. J. Raman Spectrosc. 2006, 37, 1146–1153. [Google Scholar] [CrossRef]
  85. Rosi, F.; Manuali, V.; Miliani, C.; Brunetti, B.G.; Sgamellotti, A.; Grygar, T.; Hradil, D. Raman scattering features of lead pyroantimonate compounds. Part I: XRD and Raman characterization of Pb2Sb2O7 doped with tin and zinc. J. Raman Spectrosc. 2009, 40, 107–111. [Google Scholar] [CrossRef]
  86. Pelosi, C.; Agresti, G.; Santamaria, U.; Mattei, E. Artificial yellow pigments: Production and characterization through spectroscopic methods of analysis. E-Preserv. Sci. 2010, 7, 108–115. Available online: http://www.morana-rtd.com/e-preservationscience/2010/Pelosi-10-05-2010.pdf (accessed on 25 May 2025).
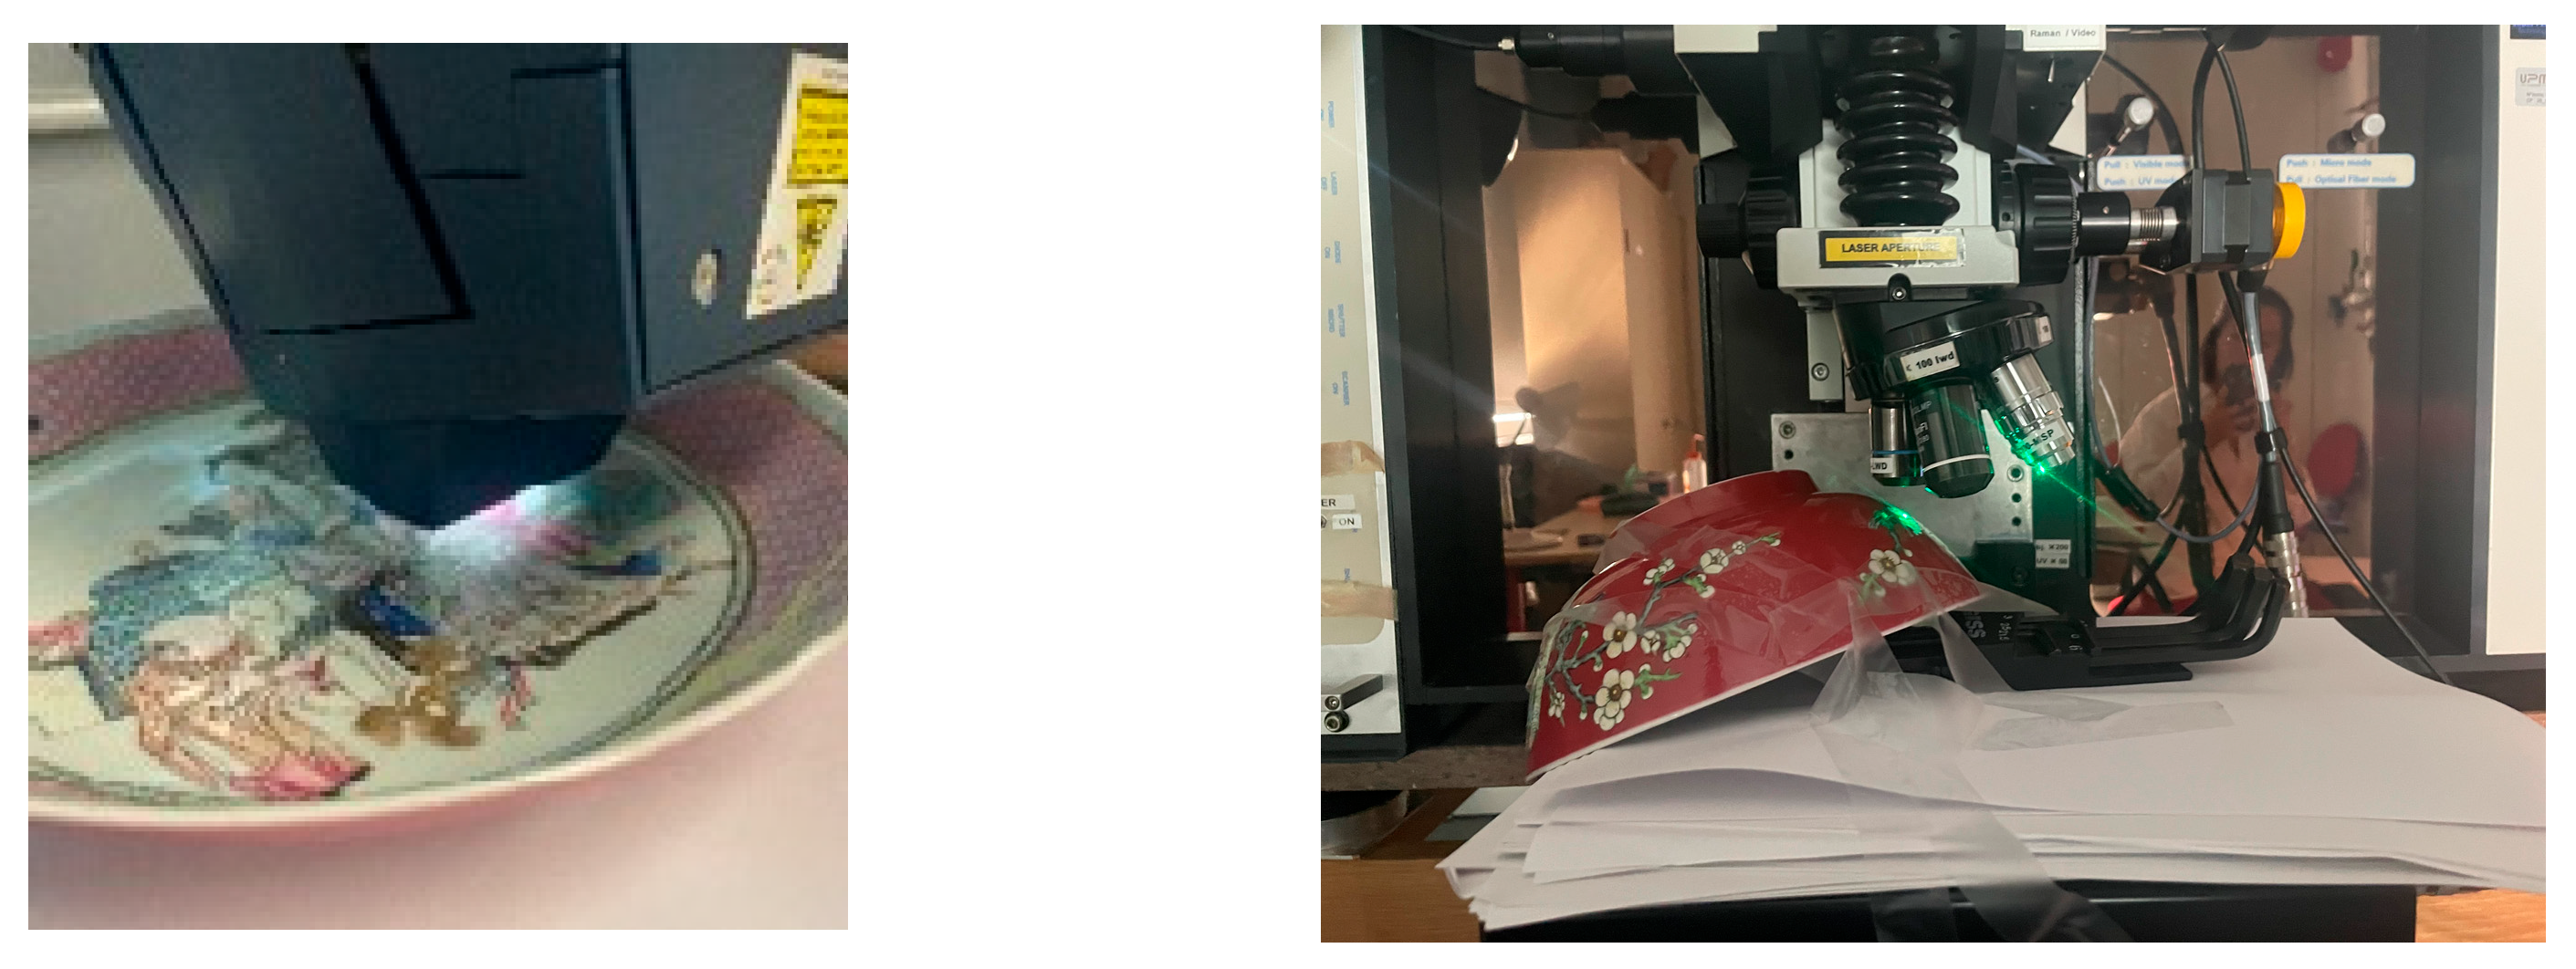
Figure 1. Example of the positioning of a plate for pXRF examination (left) and a bowl for micro-Raman analysis (right). The analyzed surface must be positioned perpendicular to the analytical device.
Applsci 15 12265 g001
Figure 2. Front and back views of the plates. See Table 1 for details.
Applsci 15 12265 g002
Figure 3. Views of the CW1C and CW2C-C plates, and of the Samson factory bowl (SB). See Table 1 for details.
Applsci 15 12265 g003
Figure 4. As-recorded spectra obtained with 514.5 nm excitation on the blue (spectrum multiplied by ×25 in (a)), white and ruby zones of the eggshell plate 7R-CW2C-T: (a) overall spectrum; (b) low energy anti-Stokes and Stokes range. Note the strong absorption of the ruby zone at one defect point (excitation 514.5 nm).
Applsci 15 12265 g004
Figure 5. Spectra from Figure 4 (7R-CW2C-T plate, different colored zones) after ‘background’ subtraction: (a) recorded using 514.5 nm excitation; (b) spectra of colorless glaze (multiplied by 10 times), ruby (defects), and green zones under 514.5 nm; (c) low-wavenumber Stokes/anti-Stokes spectra recorded with 457.8 nm excitation for glaze, green, and ruby zones; (d) Qing porcelain plate (ref. [25]) depicting a pink rose flower, recorded with 457.8 nm line.
Applsci 15 12265 g005
Figure 6. Distribution of the center of gravity of the low-wavenumber band ((a), in cm−1) and of plasmon peak ((b), in nm) for different spots/artifacts of the ruby glaze.
Applsci 15 12265 g006
Figure 7. Representative XRF spectra recorded for different areas of the 7R-CW2C-T eggshell plate (a); (b) shows a zoom of the approximately 9–11 keV energy range measured on different artifacts and spots; the dashed red line indicates the position of the main XRF peak of gold (Lα line) for 7R-CW2C-T (7R-C), CW3C (CW3), and CW22C (CW2); the red arrow shows the broadening of the Pb peak due to the tiny Au Lα contribution; C*: Compton Effect bands.
Applsci 15 12265 g007
Figure 8. XRF spectra recorded on the ruby-glazed backs of different plates (for other spectral range see Figure 7) in the approximately 20–30 keV energy range, showing transitions of Cd, Sn, Sb, and Rh (anti-cathode source) elements as well as the Compton Effect band) (*).
Applsci 15 12265 g008
Figure 9. View of the decoration of the 7R-W2C-T plate.
Applsci 15 12265 g009
Figure 10. Zoom on the XRF spectra of yellow (left), gilded (center), and blue (right) enamels for different artifacts in the energy range where characteristic peaks (labeled) are present.
Applsci 15 12265 g010
Figure 11. Comparison of Fe, As, and Sn peak intensities normalized to the Au peak for colorless glaze, ruby-back glaze, and red or pink painted enamels (see Table 1 for artifacts symbols).
Applsci 15 12265 g011
Figure 12. Comparison of the peak intensities of As, Mn, Ni and Ni, Mn, and Fe, normalized to the Co peak for blue enamels (top), and of Zn, Sn, and Sb, normalized to the Rh peak for yellow enamels (bottom); see Table 1 for artifacts symbols.
Applsci 15 12265 g012
Figure 13. Characteristic spectra obtained under excitation with a green laser (514.5 nm) on the dark blue, yellow, turquoise, black, cream, and pink zones of the CW2C-C plate: on the (left), the overall spectrum; on the (right), the fundamental modes.
Applsci 15 12265 g013
Figure 14. Characteristic spectra obtained under excitation with a blue laser (458 nm) on the blue, dark blue, yellow, turquoise, black, ruby, and cover zones of the 7R-W2CN plate: on the (left), overall (Stokes) spectrum; on the (right), the fundamental modes.
Applsci 15 12265 g014
Figure 15. Characteristic spectra obtained under excitation with a green laser (514.5 nm) on the dark blue, yellow, turquoise, black, cream, and rose/pink zones of the CW1C plate: on the (left), the overall spectrum; on the (right), the fundamental modes.
Applsci 15 12265 g015
Figure 16. Characteristic spectra obtained under excitation with a green laser (514.5 nm) on the colorless, white, yellow, green, black, cream and rose/red zones of the SB: on the (left), overall spectrum; on the (right), the fundamental modes.
Applsci 15 12265 g016
Table 1. Studied artifacts and their characteristics.
LabelViewFigureDecorPeriodDiameter
(cm)
Weight
(g)
7R-W2C-TApplsci 15 12265 i001
Applsci 15 12265 i002
27 borders,
Chinese women
with 2 children
Yongzheng
(1723–1735)
21180
7R-W2CApplsci 15 12265 i003
Applsci 15 12265 i004
27 borders
Chinese women
with 2 children
Yongzheng
(1723–1735)
21197
CW1CApplsci 15 12265 i005
Applsci 15 12265 i006
3Chinese women
with 1 child
Yongzheng
(1723–1735)
21168
CW2CApplsci 15 12265 i007
Applsci 15 12265 i008
3Chinese women
with 2 children
Yongzheng
(1723–1735)
20.5221
CW3CApplsci 15 12265 i009
Applsci 15 12265 i010
2Chinese women
with 3 children
Yongzheng
(1723–1735)
20207
EWApplsci 15 12265 i011
Applsci 15 12265 i012
2European womenYongzheng
(1723–1735)
1144
SMApplsci 15 12265 i013
Applsci 15 12265 i014
3Bird and flowers19th century19.7332
Disclaimer/Publisher’s Note: The statements, opinions and data contained in all publications are solely those of the individual author(s) and contributor(s) and not of MDPI and/or the editor(s). MDPI and/or the editor(s) disclaim responsibility for any injury to people or property resulting from any ideas, methods, instructions or products referred to in the content.