1. Introduction
With the rapid expansion of underground space utilization in urban areas, interchange structures have been increasingly constructed as essential nodes that connect multiple traffic lines and redistribute flow [
1,
2]. Unlike ordinary tunnels or subway stations, underground interchanges are characterized by large spans, multiple connections, and irregular layouts [
3,
4], which makes their structural systems considerably more complex. When subjected to seismic ground motions, this complexity often results in uneven stress distribution and localized damage, posing risks of severe social and economic consequences [
5]. In earthquake-prone regions such as China, where such facilities are widely constructed, the need for reliable seismic performance assessment is particularly critical, especially when they are located on weak soils.
Early investigations into the seismic behavior of underground structures primarily relied on analytical methods. These approaches are efficient and provide clear theoretical insights and thus have been widely used to derive closed-form solutions for tunnels and shafts [
6,
7,
8]. For example, unified solutions for circular and rectangular tunnels and analytical models considering isolation layers have advanced the theoretical understanding of soil–structure interaction [
9]. However, such methods usually rely on idealized assumptions—such as homogeneous ground conditions and simplified boundary constraints—which limit their applicability to large-scale and irregular underground structures.
To overcome these limitations, numerical simulation methods have been increasingly employed in recent decades. Finite element and finite difference analyses enable the modeling of nonlinear soil–structure interaction, heterogeneous ground conditions, and complex geometries [
10,
11,
12]. Numerous studies have successfully examined the seismic response of subway stations, shield tunnels, and frame-type underground structures [
13,
14,
15]. These works have revealed mechanisms such as liquefaction-induced deformation, dynamic soil–structure interaction, and progressive damage patterns [
16,
17]. Nevertheless, most of these investigations remain concentrated on relatively regular underground facilities. Comprehensive studies focusing on large underground interchanges with asymmetric, multi-span, and unequal-span configurations, particularly under traveling-wave excitations, are still scarce.
Beyond general seismic response analyses, several approaches have been proposed to evaluate structural performance at the level of seismic resistance. Methods such as the response displacement method, pushover analysis, and strain transfer techniques, as well as the seismic coefficient and free-field deformation methods, have been applied under various ground motion intensities [
18,
19,
20,
21,
22]. These simplified approaches provide practical insights, but their reliability for highly irregular interchange structures remains limited.
In parallel, seismic fragility analysis has gained increasing attention as a probabilistic framework to quantify structural vulnerability. Previous studies have demonstrated that stratified soils generally lead to higher fragility than homogeneous sites [
23]. Intensity measures such as peak ground acceleration (PGA) and peak ground velocity (PGV) have been suggested as effective indicators of tunnel fragility in loess areas [
24], while weak strata, voids, and liquefiable soils have been shown to exacerbate seismic damage [
25]. Burial depth and soil stiffness have also been identified as critical factors influencing vulnerability [
26]. Despite these advances, fragility assessments explicitly addressing large underground interchanges, particularly under traveling-wave seismic inputs, remain very limited.
On this basis, two major research gaps can be identified. First, seismic analyses seldom target underground interchanges with asymmetric and unequal-span configurations, despite their growing prevalence in modern transportation networks. Second, the influence of traveling-wave effects on fragility evaluation has rarely been systematically addressed, even though such effects can significantly modify deformation patterns, internal force distribution, and stress concentrations. These gaps are especially critical when interchanges are constructed in weak soil conditions.
Based on the aforementioned gaps, this paper proposes the following explicit hypothesis: “We hypothesize that in weak soil sites, the traveling wave effect will cause significant amplification of internal forces at critical nodes of asymmetrical underground overpasses, with peak increments potentially exceeding tenfold those under uniform seismic loading.”
To validate this hypothesis, this study develops a two-dimensional finite element model that incorporates the multi-linear kinematic–dynamic interaction constitutive law to capture nonlinear material behavior. Incremental dynamic analysis (IDA) is combined with probabilistic fragility assessment to systematically investigate damage evolution, displacement patterns, internal force variations, and stress concentrations under both uniform and non-uniform seismic inputs. This integrated framework highlights the role of traveling-wave effects and identifies the most vulnerable structural components, thereby providing both methodological innovation and practical reference for the seismic evaluation and reinforcement of underground interchanges in weak strata.
The remainder of this paper is organized as follows.
Section 2 introduces the research methods and numerical simulation framework, including the incremental dynamic analysis, probabilistic vulnerability assessment, and the derivation of seismic dynamic equations.
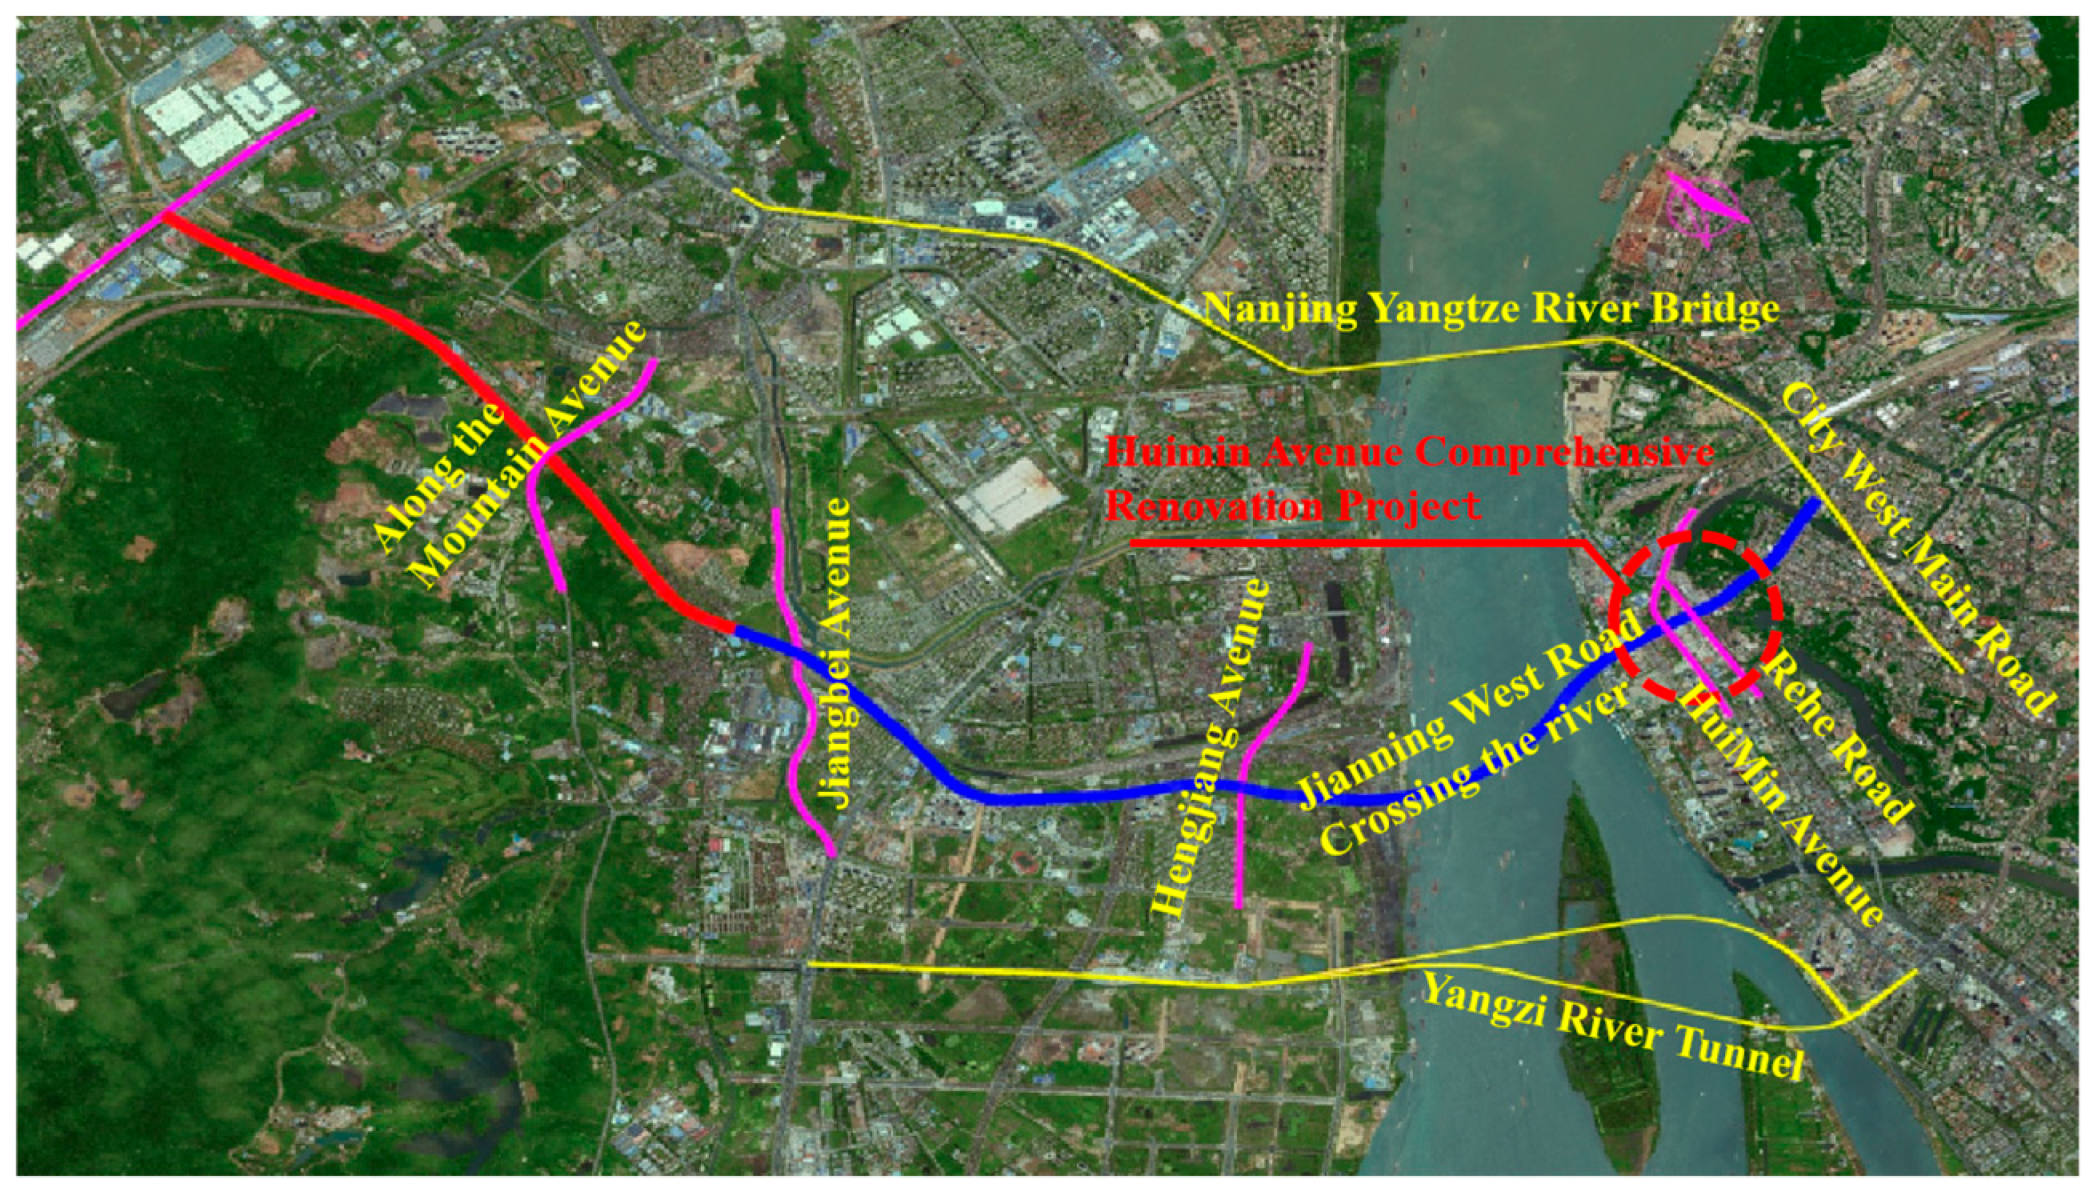
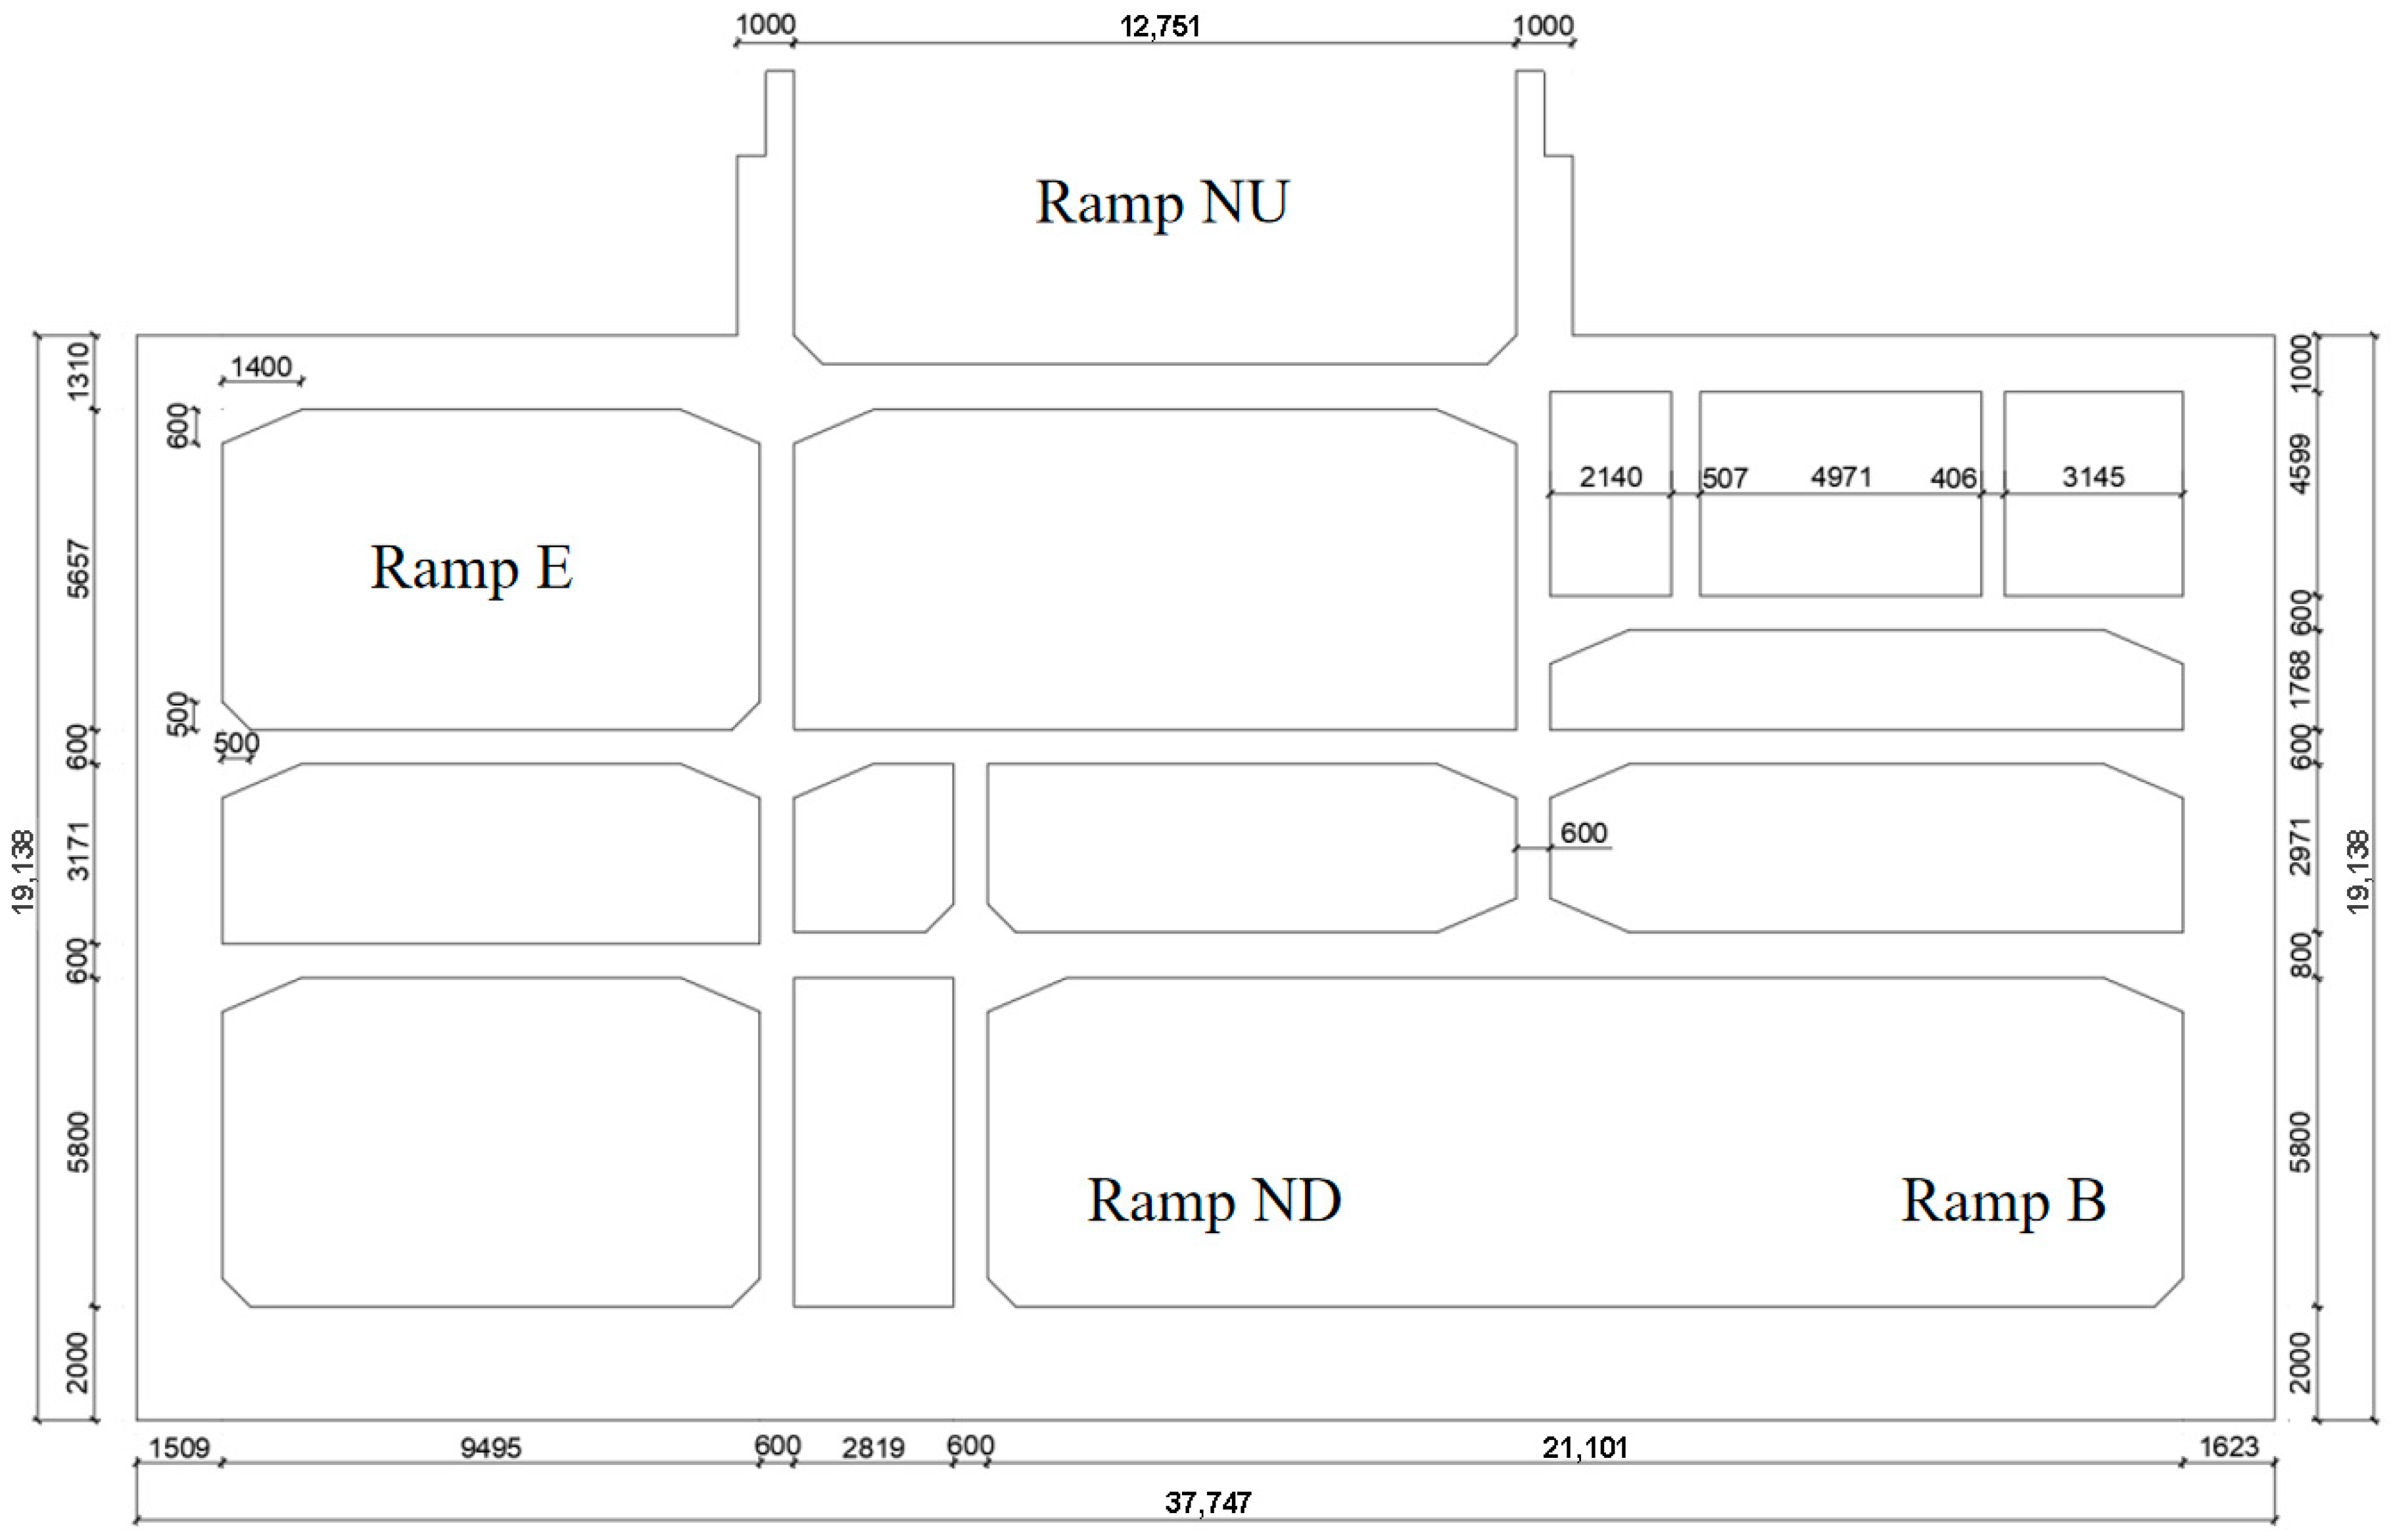
Section 3 provides an overview of the Nanjing Huimin Avenue project as the case study.
Section 4 describes the development of the finite element model, including soil parameters, seismic inputs, and constitutive models.
Section 5 presents the structure vulnerability analysis, focusing on damage evolution, vulnerability indicators, and fragility assessment.
Section 6 investigates the influence of traveling-wave effects on the seismic dynamic response, examining displacement, internal force, and stress distributions. Finally,
Section 7 summarizes the main findings and discusses their engineering implications.
5. Structure Vulnerability Analysis
5.1. Structure Damage Analysis
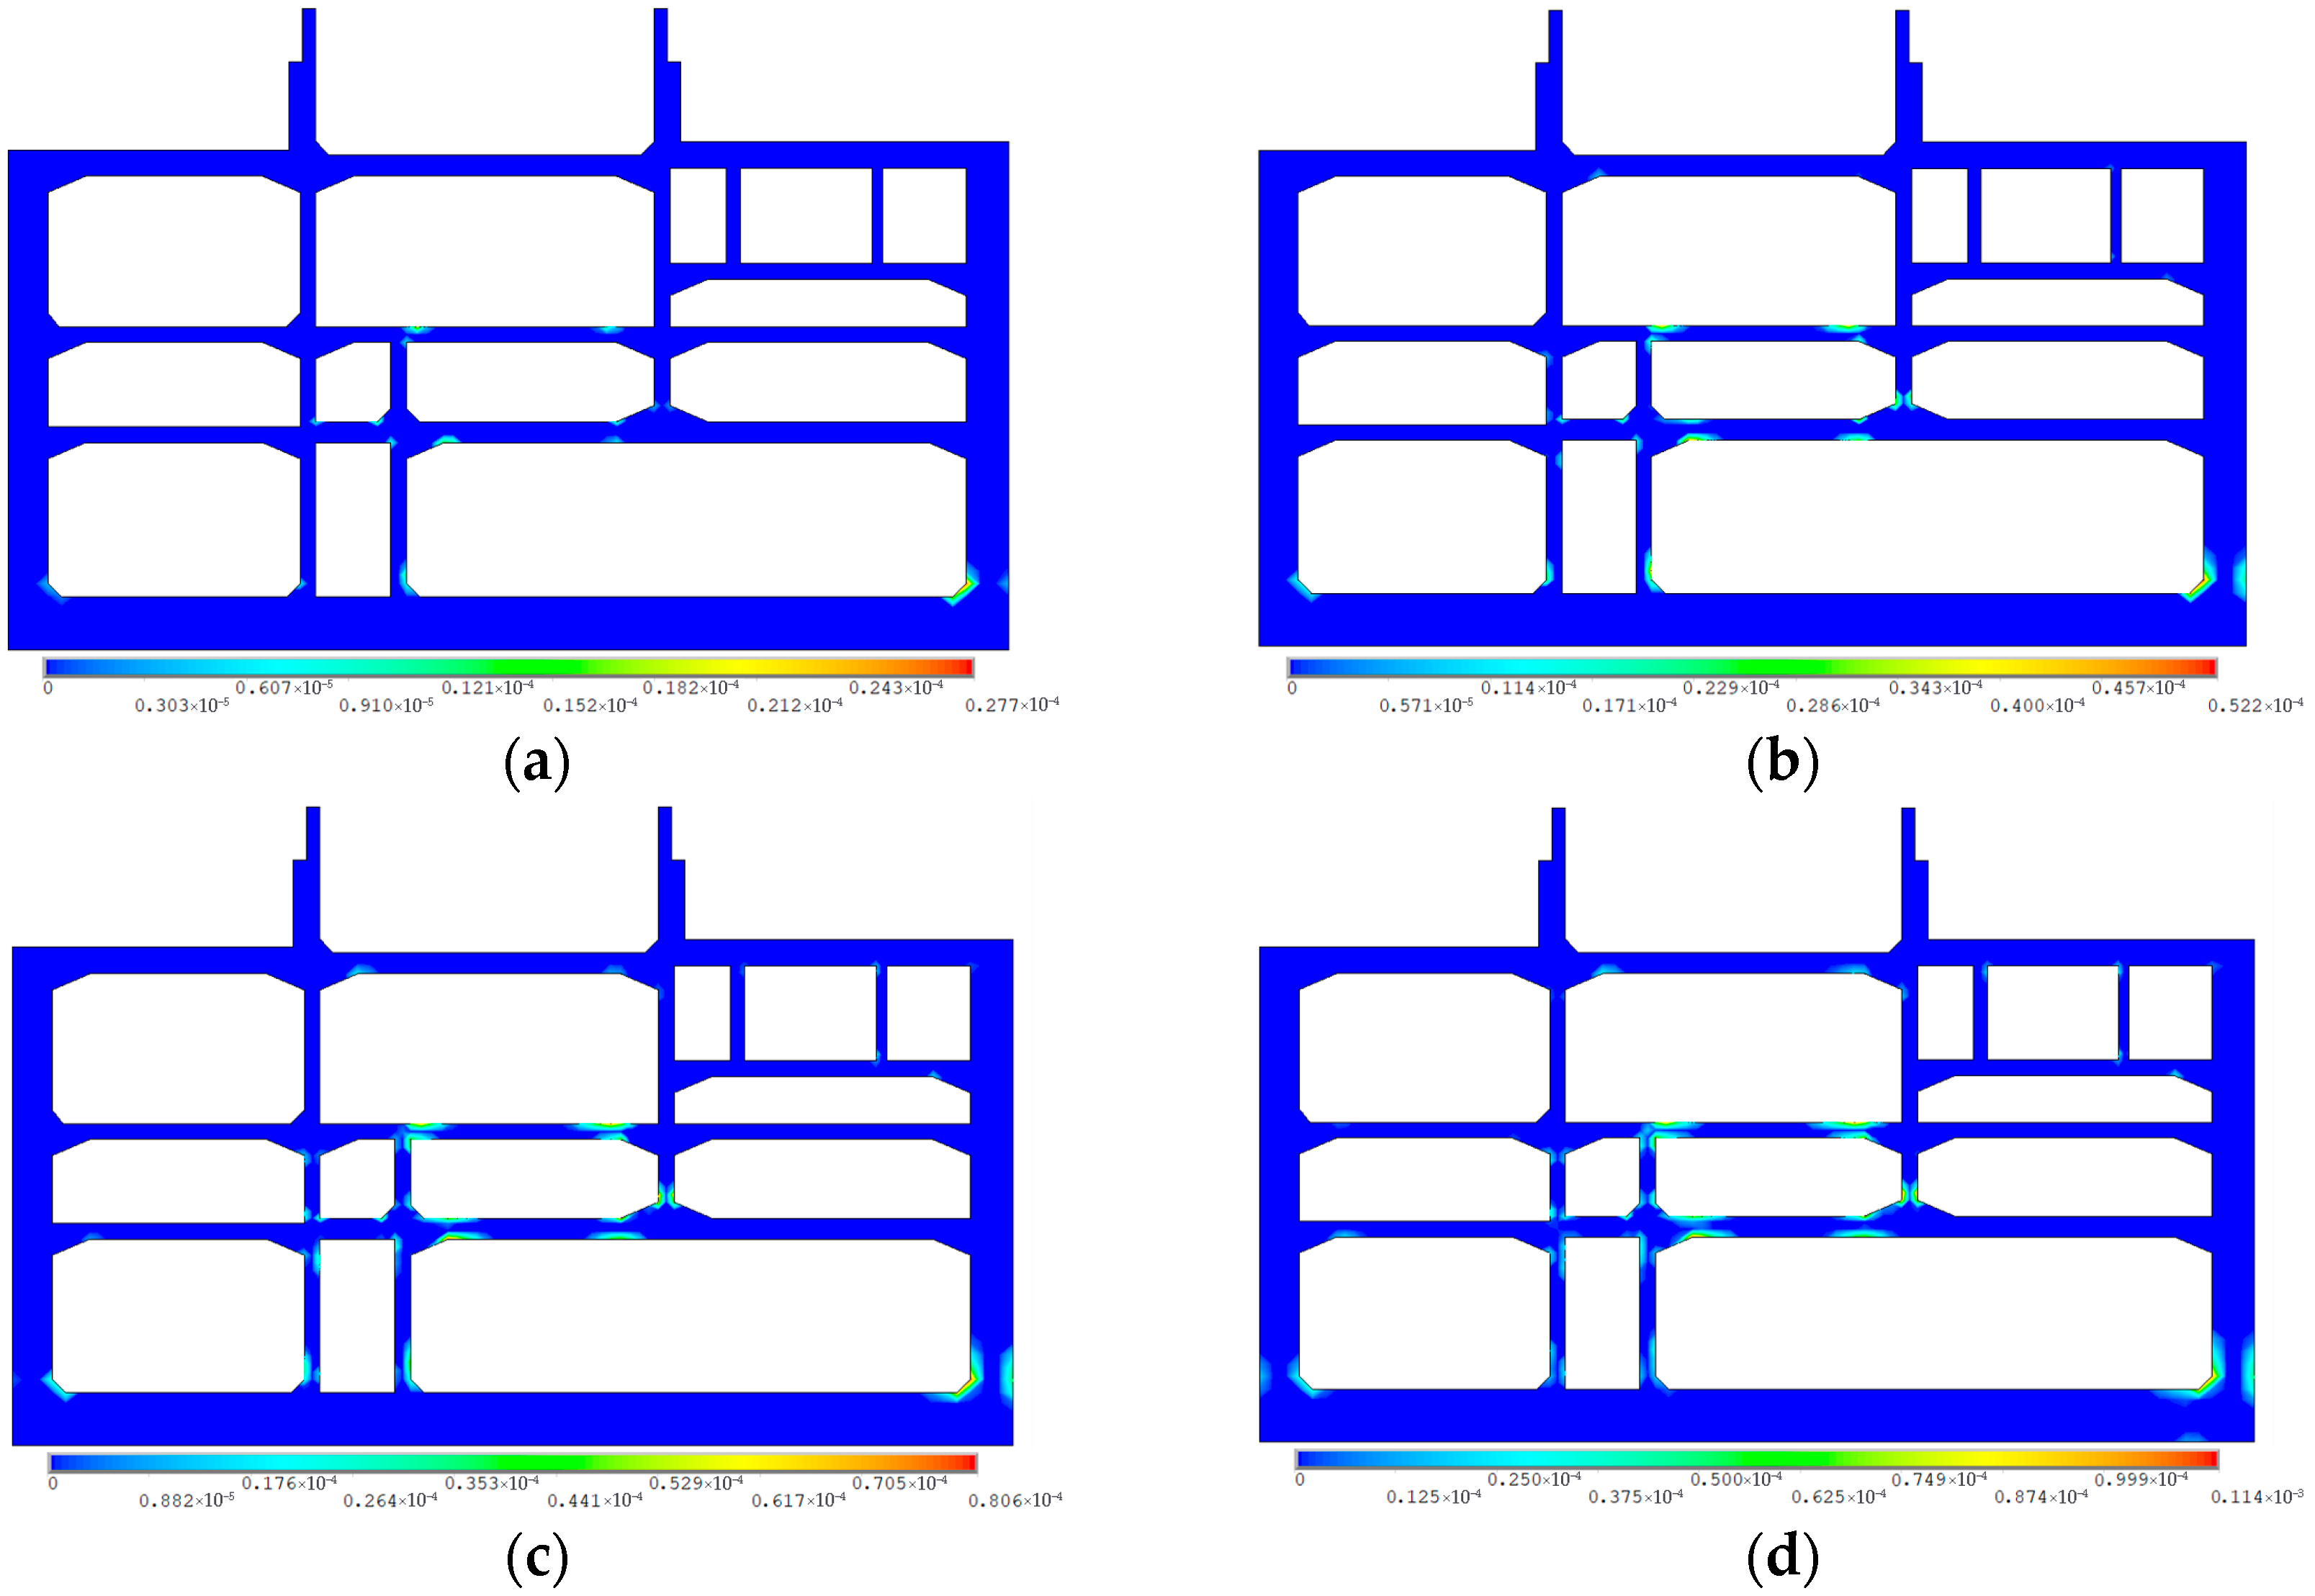
Based on the consistent input analysis of RSN983 seismic motion, the evolution law of the structure damage under seismic intensities of 0.1 g to 0.8 g was studied (
Figure 7).
The development of damage exhibits a distinct three-stage characteristic. Under low-intensity ground motion (0.1 g to 0.2 g), the overall structure remains largely intact, with minor damage occurring in localized areas. The damage is primarily concentrated on the side walls, the bottom of the central wall, and near monitoring points #7, #8, #12, and #13. Under moderate-intensity earthquakes (0.3 g to 0.5 g), the damage area significantly expands, forming distinct plastic hinges at critical nodes. Moderate damage occurs in some areas (such as the structure base plate and right side wall), but overall stability remains relatively good. Under high-intensity earthquakes (0.6 g to 0.8 g), the damage area continues to expand, with critical components experiencing severe plastic deformation. The weak points of the underground interchange structure (the frame structure formed by monitoring points #7, #8, #12, and #13 and the bottom of the right-side wall) are severely damaged, potentially leading to structure failure. Damage intensifies at earthquake intensities of moderate strength or higher. At an earthquake intensity of 0.1 g, the maximum plastic strain of the structure is 2.77 × 10⁻⁵. When the earthquake intensity increases to 0.8 g, the maximum plastic strain of the structure is 4.29 × 10⁻⁴, approximately 15.5 times that at 0.1 g.
The damage exhibits progressive expansion centered on key nodes, with significant nonlinear characteristics. It is recommended that weak areas (bottom of side walls, beam end nodes, bottom plate) be reinforced.
5.2. Determination of Vulnerability Indicators
Based on existing research [
27,
31,
32], the seismic performance of underground interchange structures is classified into four grades (
Table 4).
Based on the characteristics of Section JD-36 and referring to the research [
32] the inter-story drift angle was selected as the damage metric (DM), and corresponding quantification standards were established (
Table 5).
In terms of selecting intensity indicators, this study comprehensively considered the research conclusions of Wang [
33] and Chen et al. [
34], and others. Given that PGA (peak ground acceleration) has good computational stability for shallow underground structures, this study used PGA as the seismic intensity indicator (IM).
5.3. Earthquake Probability Demand Analysis
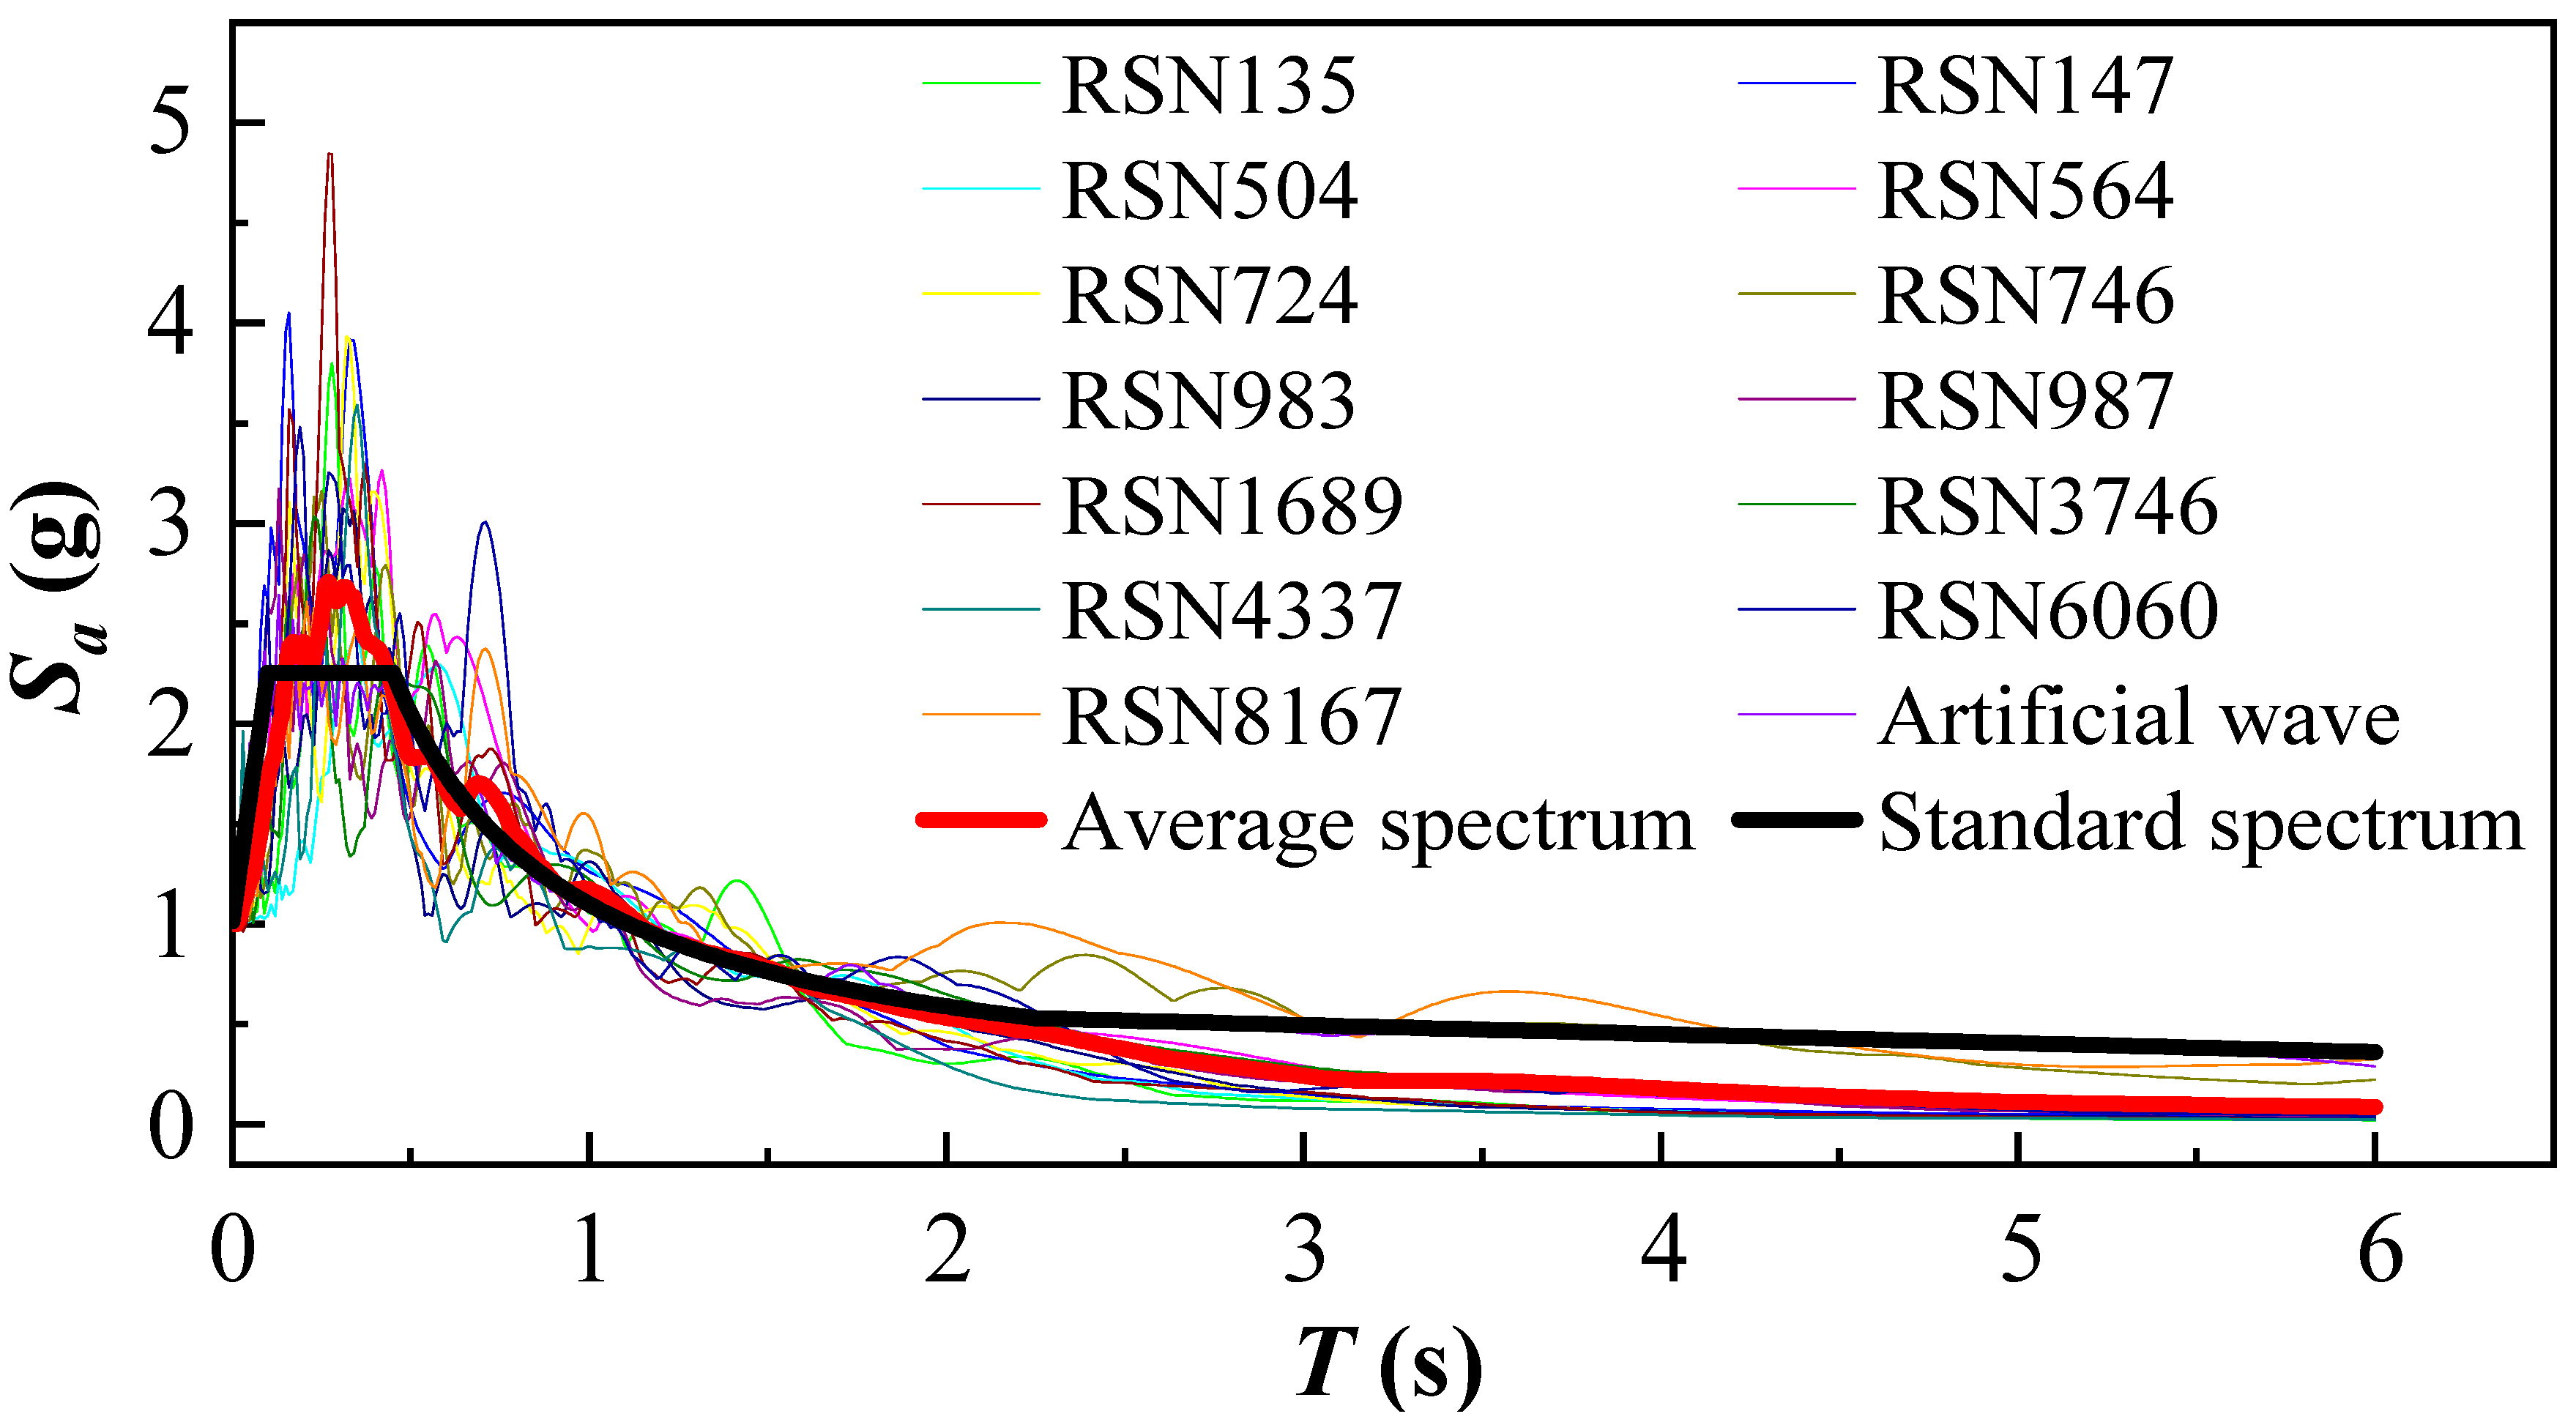
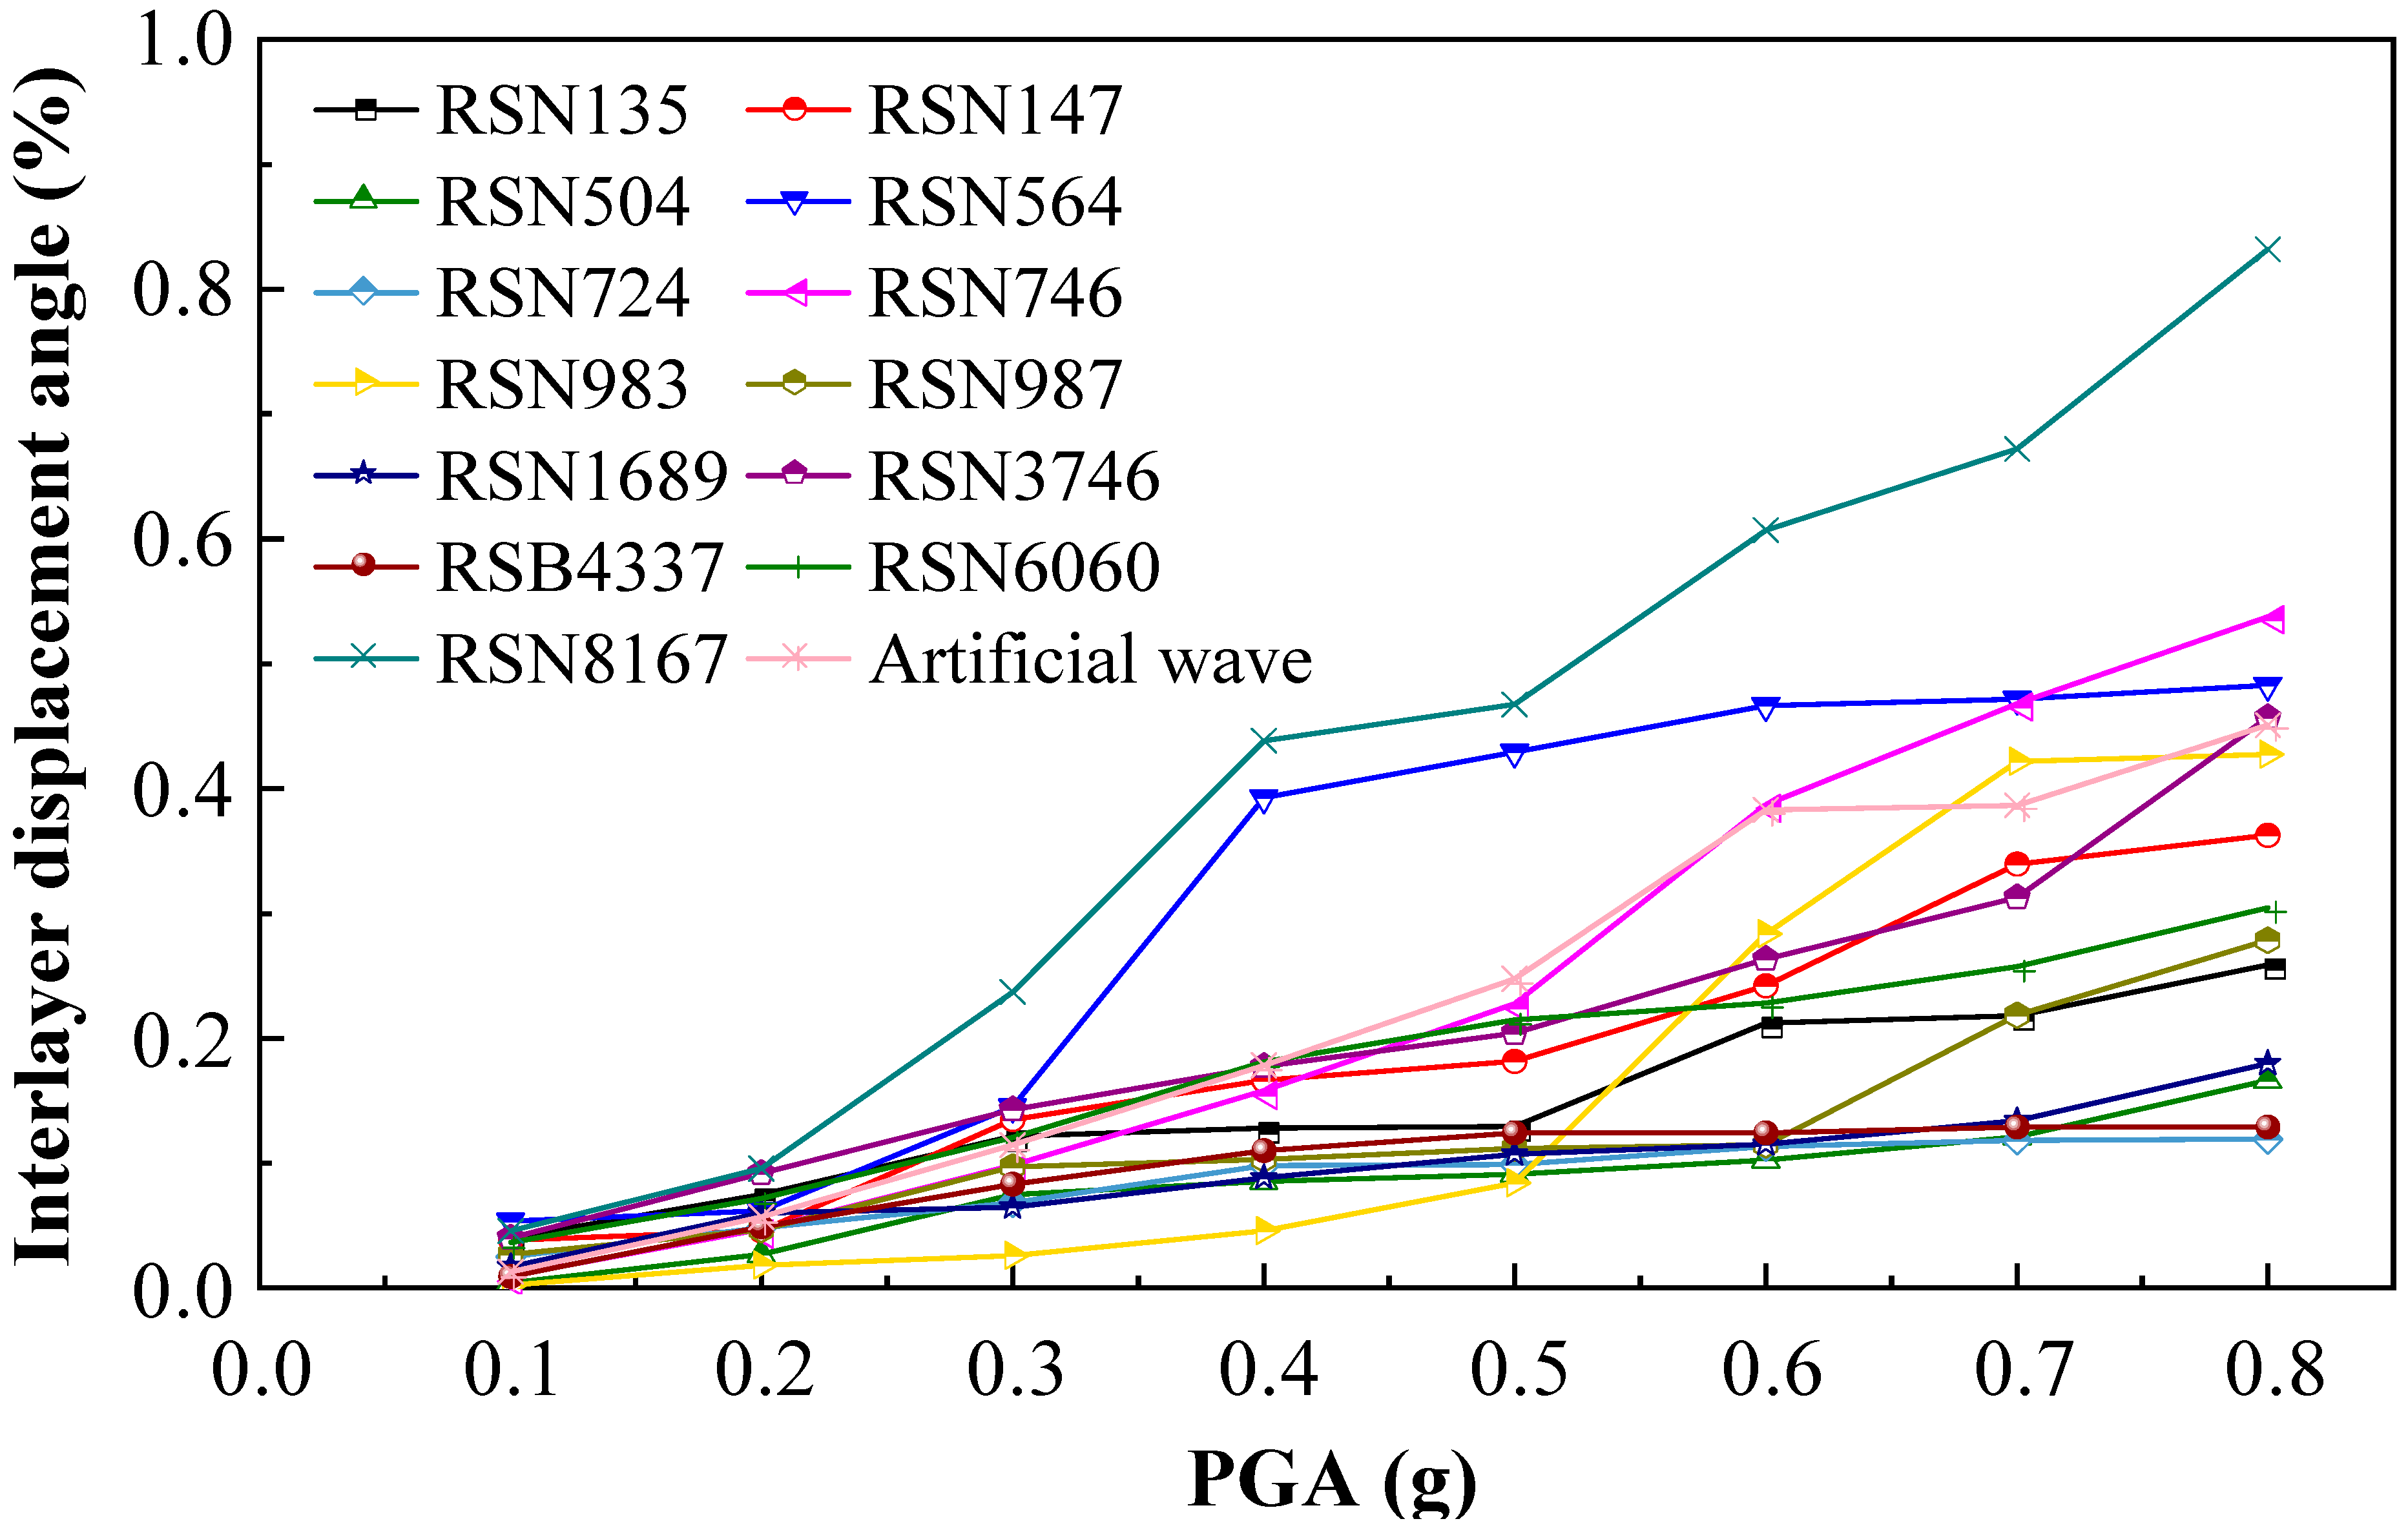
This study selected 13 natural seismic waves and 1 artificial wave, adjusting their peak accelerations to 8 levels within the range of 0.1 to 0.8 g. Through nonlinear dynamic time history analysis of the Section JD-36, structure response data was obtained with PGA as the variable.
Figure 8 shows the analysis results with maximum understory displacement angle (DM) and PGA (IM) as parameters.
The analysis results indicate that the interlayer displacement angle response range is significant, with a minimum value of 0.00237944 (RSN983, 0.1 g) with a maximum value of 0.831742787 (RSN8167, 0.8 g). The displacement angle increases with increasing PGA, but there are notable differences in response to different seismic waves. At low PGA (0.1 to 0.3 g), the increase is approximately linear, while at high PGA (≥0.4 g), it exhibits significant nonlinear characteristics. RSN8167 and RSN564 exhibit greater destructive potential.
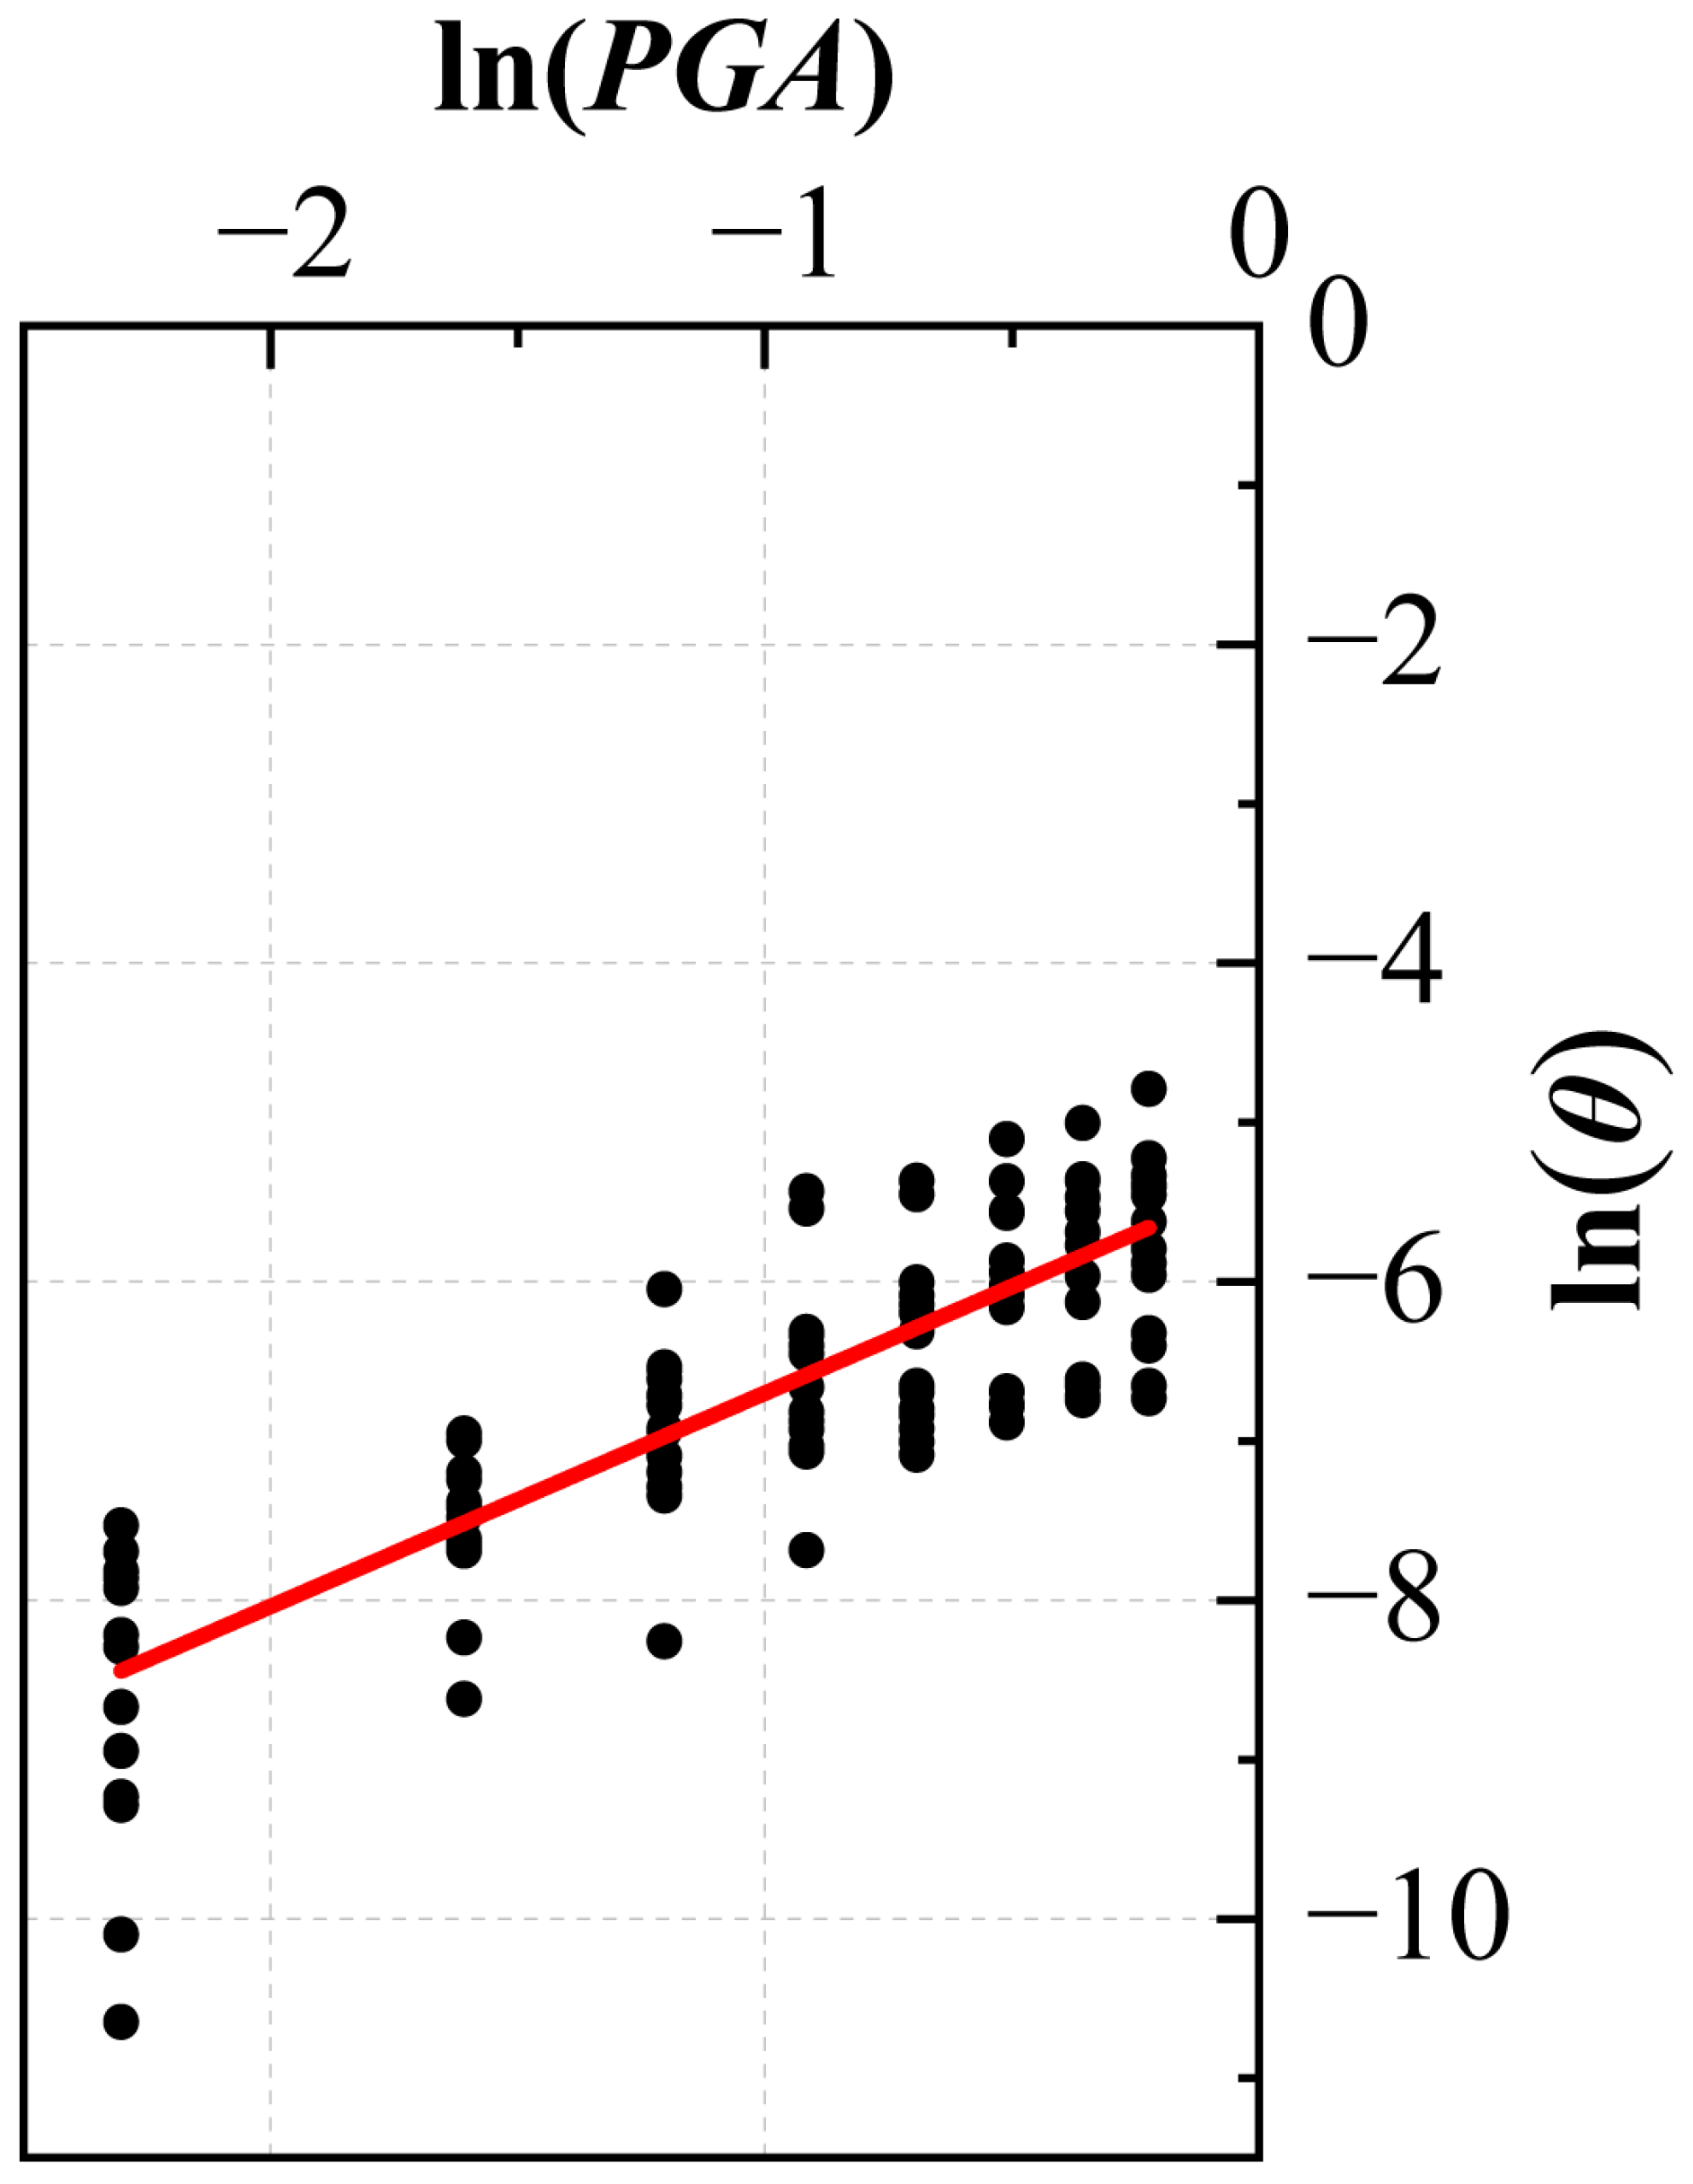
When performing incremental dynamic analysis, due to the large dispersion of the obtained inter-story displacement angle data, it is necessary to fit the data. Substituting the seismic intensity index (PGA) and structure damage index (inter-story displacement angle
θ) selected in this section, we obtain:
Taking the logarithm on both sides:
According to Equation (15), the interlayer displacement angle data was fitted, and the results are shown in
Figure 9. The coefficients
a = 1.33907,
b = −5.36045. Therefore, the linear regression equation under seismic motion is
5.4. Structure Vulnerability
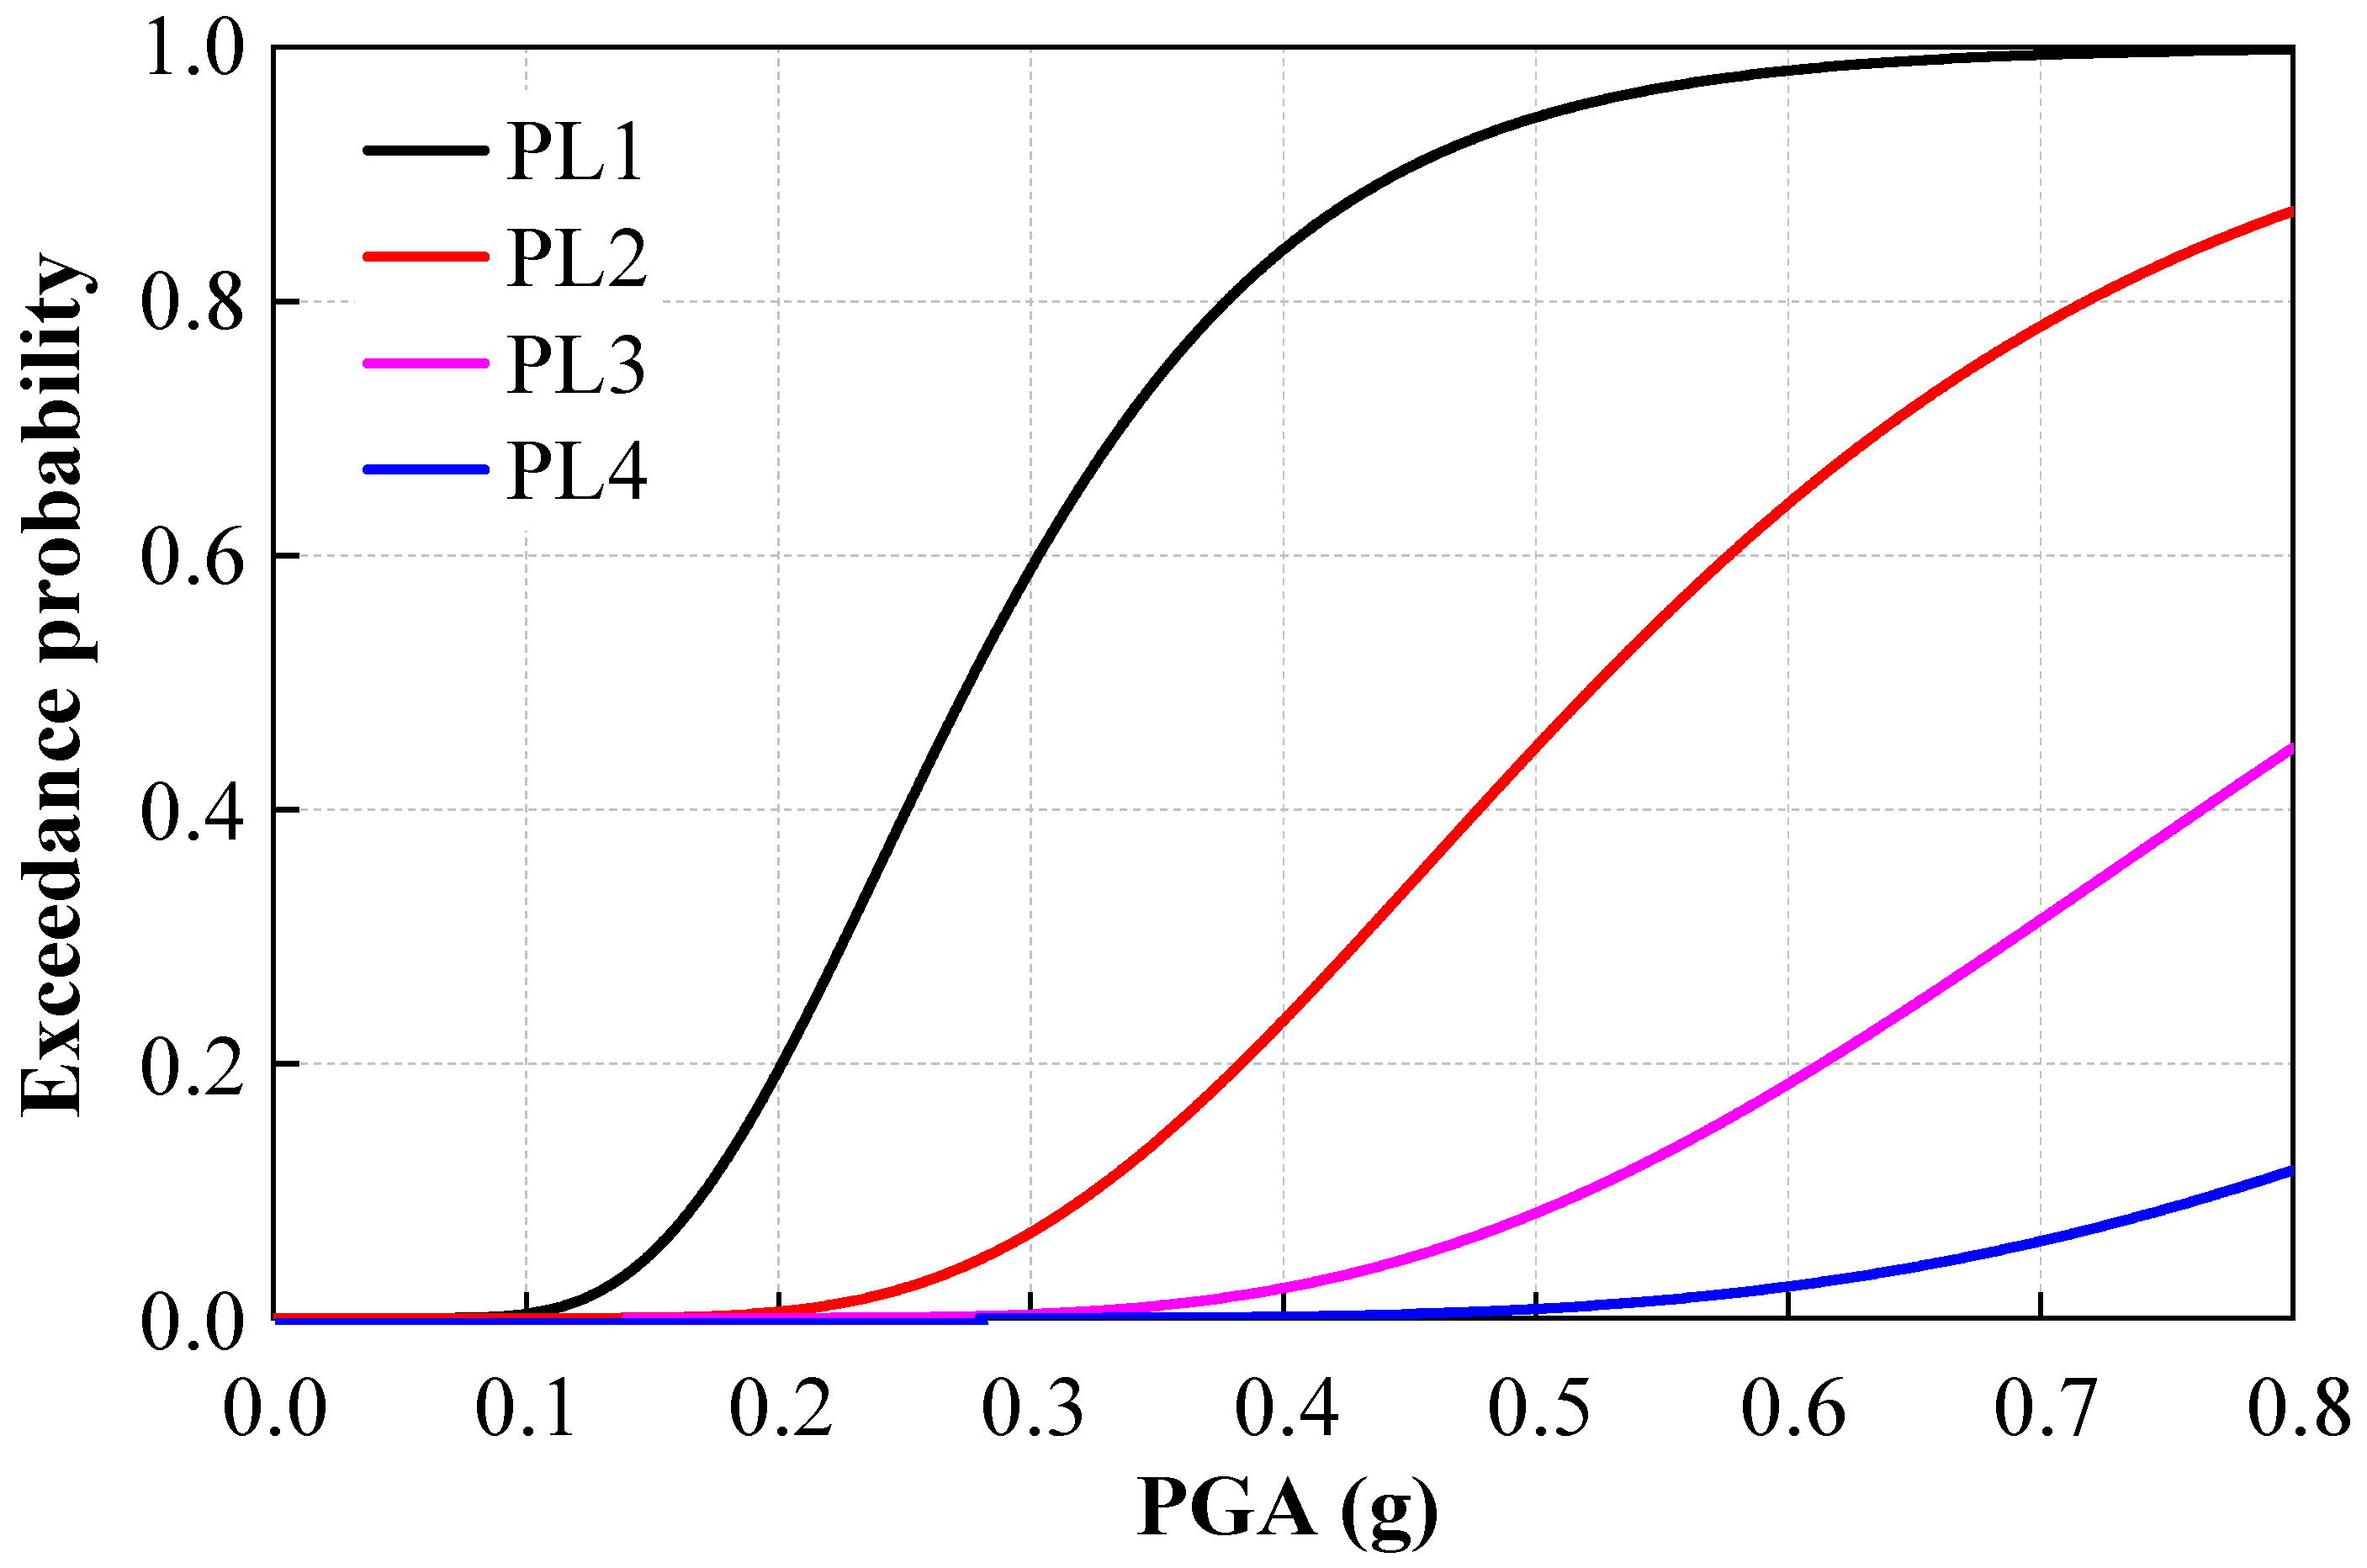
Based on the probability demand analysis structure, combined with Equation (1), the probability of the structure exceeding four performance levels under different seismic intensities is obtained, and a vulnerability curve is plotted, as shown in
Figure 10.
Figure 10 indicates that as the peak ground acceleration (PGA) increases from 0.1 to 0.8 g, the probability of exceeding each performance level of the structure increases monotonically. When PGA = 0.1 g, the probability of exceeding PL1 is only 3.31%, and the building remains largely intact. When PGA increases to 0.2 to 0.3 g, the probability of exceeding PL1 reaches 19.51 and 58.96%, respectively; PL2 probability rises to 0.49%. At 0.5 g, the PL1 exceedance probability reaches 84.06 to 94.46%, PL2 rises to 23.4 to 44.9%, and PL3 first appears (8.26%), indicating crack propagation accompanied by plastic hinge formation. When PGA increases to 0.6 g, the PL2 exceedance probability exceeds 64.06%, and the PL4 probability reaches 2.48%, indicating the structure has entered a significantly nonlinear stage. At PGA = 0.8 g, all components exceed PL1, with PL3 and PL4 probabilities reaching 44.86 and 11.64%, respectively, indicating the structure has developed multiple plastic hinges and poses a significant risk of failure. This series of data clearly reveals the progressive failure process of the structure, from micro-cracks to overall damage, as seismic shaking intensifies. In summary, the probability of the structure exceeding PL3 is low, meeting seismic design requirements.
5.5. Structure Damage Probability Assessment
The probability of a structure damage state
P(
DS) can be denoted as the interpolation of the adjacent state transition probability [
27], as shown in the following equation:
where
N is the number of structure performance levels divided, which is 5 in this section.
N + 1 is the number of structure failure states.
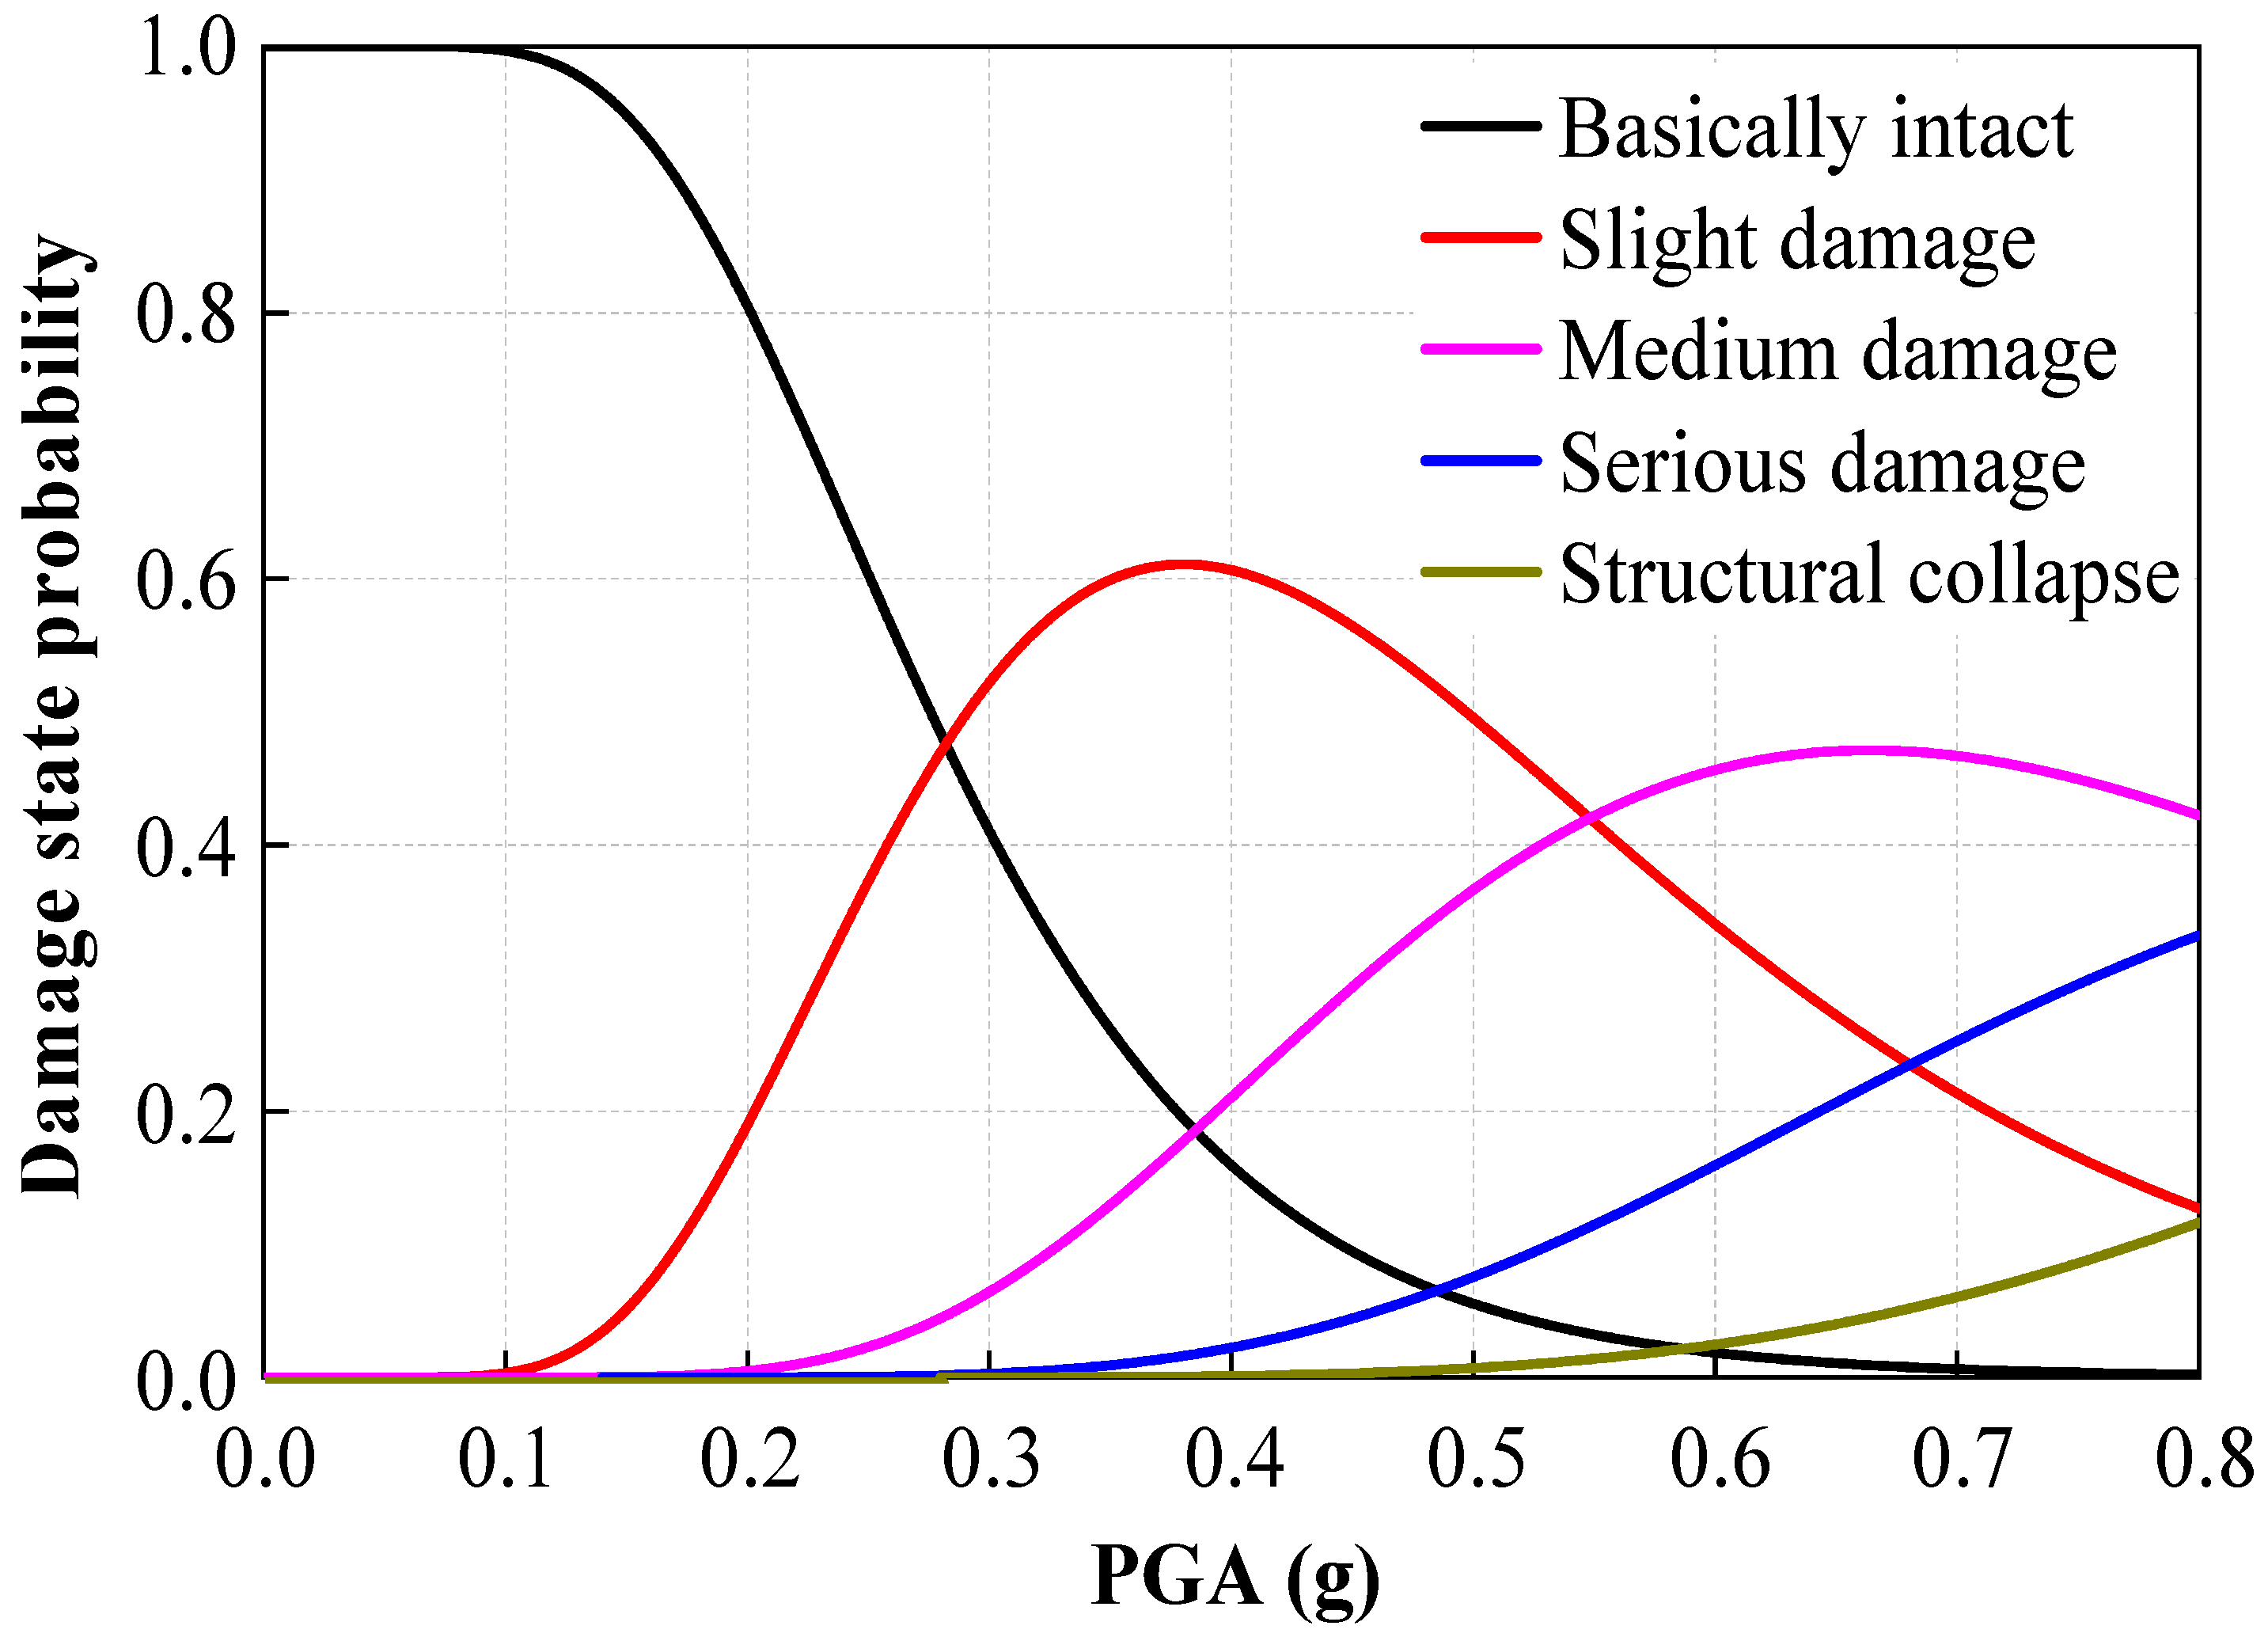
Based on the structure vulnerability analysis results, combined with Equation (17), the probability of damage to the underground interchange structure is obtained, as shown in
Figure 11.
Figure 11 shows the probability distribution characteristics of structure damage states under different earthquake intensities. The curve for the structurally intact state exhibits a clear monotonically decreasing trend, indicating that as earthquake intensity increases, the probability of the structure remaining intact gradually decreases. In contrast, the curves for minor and moderate damage states exhibit typical non-monotonic variation characteristics, with probability values first showing an upward trend, reaching a peak, and then gradually decreasing. Notably, the curves for severe damage and structure collapse exhibit a sustained monotonous increase, clearly reflecting the significant rise in the probability of such extreme damage states occurring as earthquake intensity increases.
To better analyze the structure damage state under earthquakes of different intensities, the design standards corresponding to the probability are used to analyze the probability of damage to the structure under frequent earthquakes (0.08 g), design earthquakes (0.23 g), rare earthquakes (0.5 g), and extremely rare earthquakes (0.72 g), as shown in
Table 6.
As shown in
Table 6, for frequent earthquakes (0.08 g), the probability of remaining intact is 99.94%. for design earthquakes (0.23 g), the probability of minor damage is 30.02%, and the probability of moderate damage is 1.34%. For rare earthquakes (0.5 g), 49.56% of structures sustain minor damage, and 36.64% sustain moderate damage. for extremely rare earthquakes (0.72 g), 46.15% of structures sustain moderate damage, 27.04% sustain severe damage, and 7% collapse. The development trend shows that the extent of structure damage increases progressively with earthquake intensity, evolving from minor damage to severe damage.
5.6. Structure Vulnerability Index
The vulnerability index can be quantified by the probability of structure damage and the seismic hazard index, as shown below:
where
n is the number of structure failure states.
P(
DSi|PGA) is the probability of the
i-th failure state.
DFi is the seismic damage index of the failure state, as shown in
Table 7.
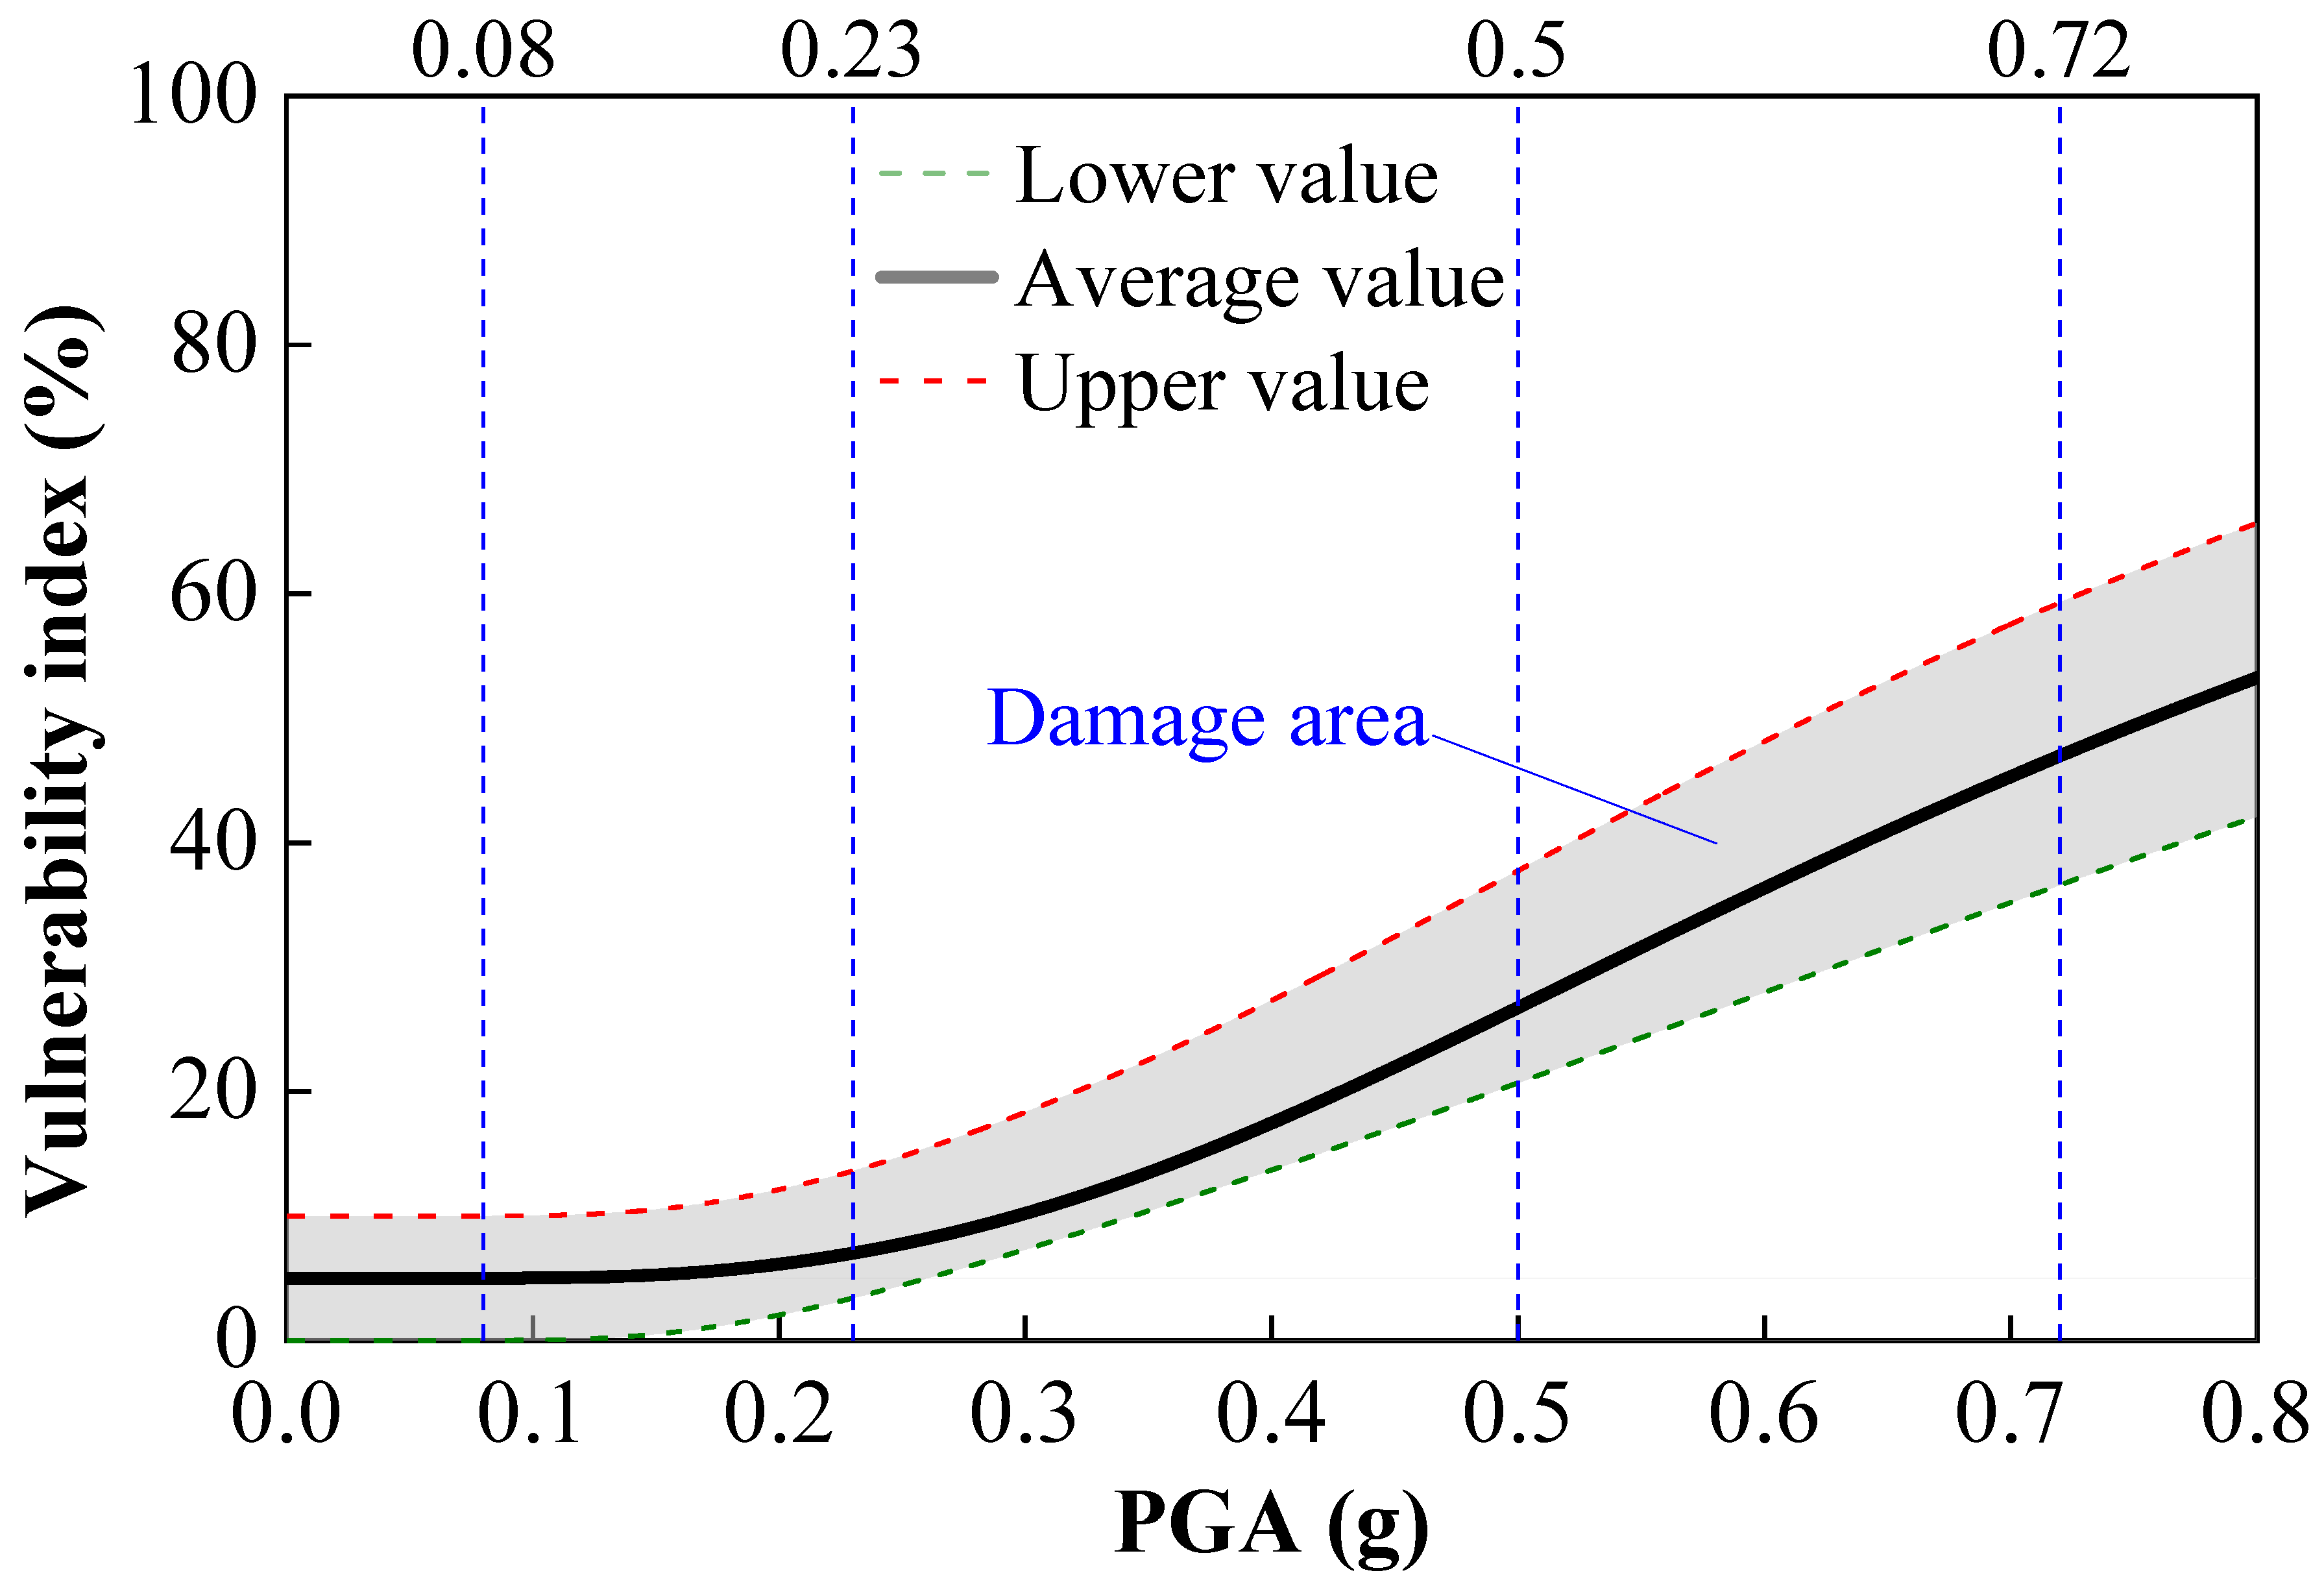
The structure vulnerability index curve calculated based on Equation (18) is shown in
Figure 12, where the vertical lines of different colors correspond to the seismic actions at each design level.
Under frequent and design seismic actions, the vulnerability index values of the structure are all less than 15%, indicating good seismic performance. However, under rare seismic actions, the upper limit value of the vulnerability index reaches 37.74%. This relatively high vulnerability index indicates a significant risk of moderate damage to the structure. Under extremely rare earthquake effects, the upper and lower limits of the structure vulnerability index are 59.27% and 36.60%, respectively. This indicates a prominent risk of severe damage to the structure under extremely rare earthquake effects. Such damage may include moderate damage or even more severe damage, further highlighting the structure’s vulnerability under extreme earthquake effects. Overall, the structure’s safety is assured under conventional earthquakes, but moderate or higher damage must be prioritized for prevention under extreme earthquakes, providing a quantitative basis for seismic optimization design.
6. Influence of Traveling Wave Effect on Seismic Dynamic Response of Structure
As shown in
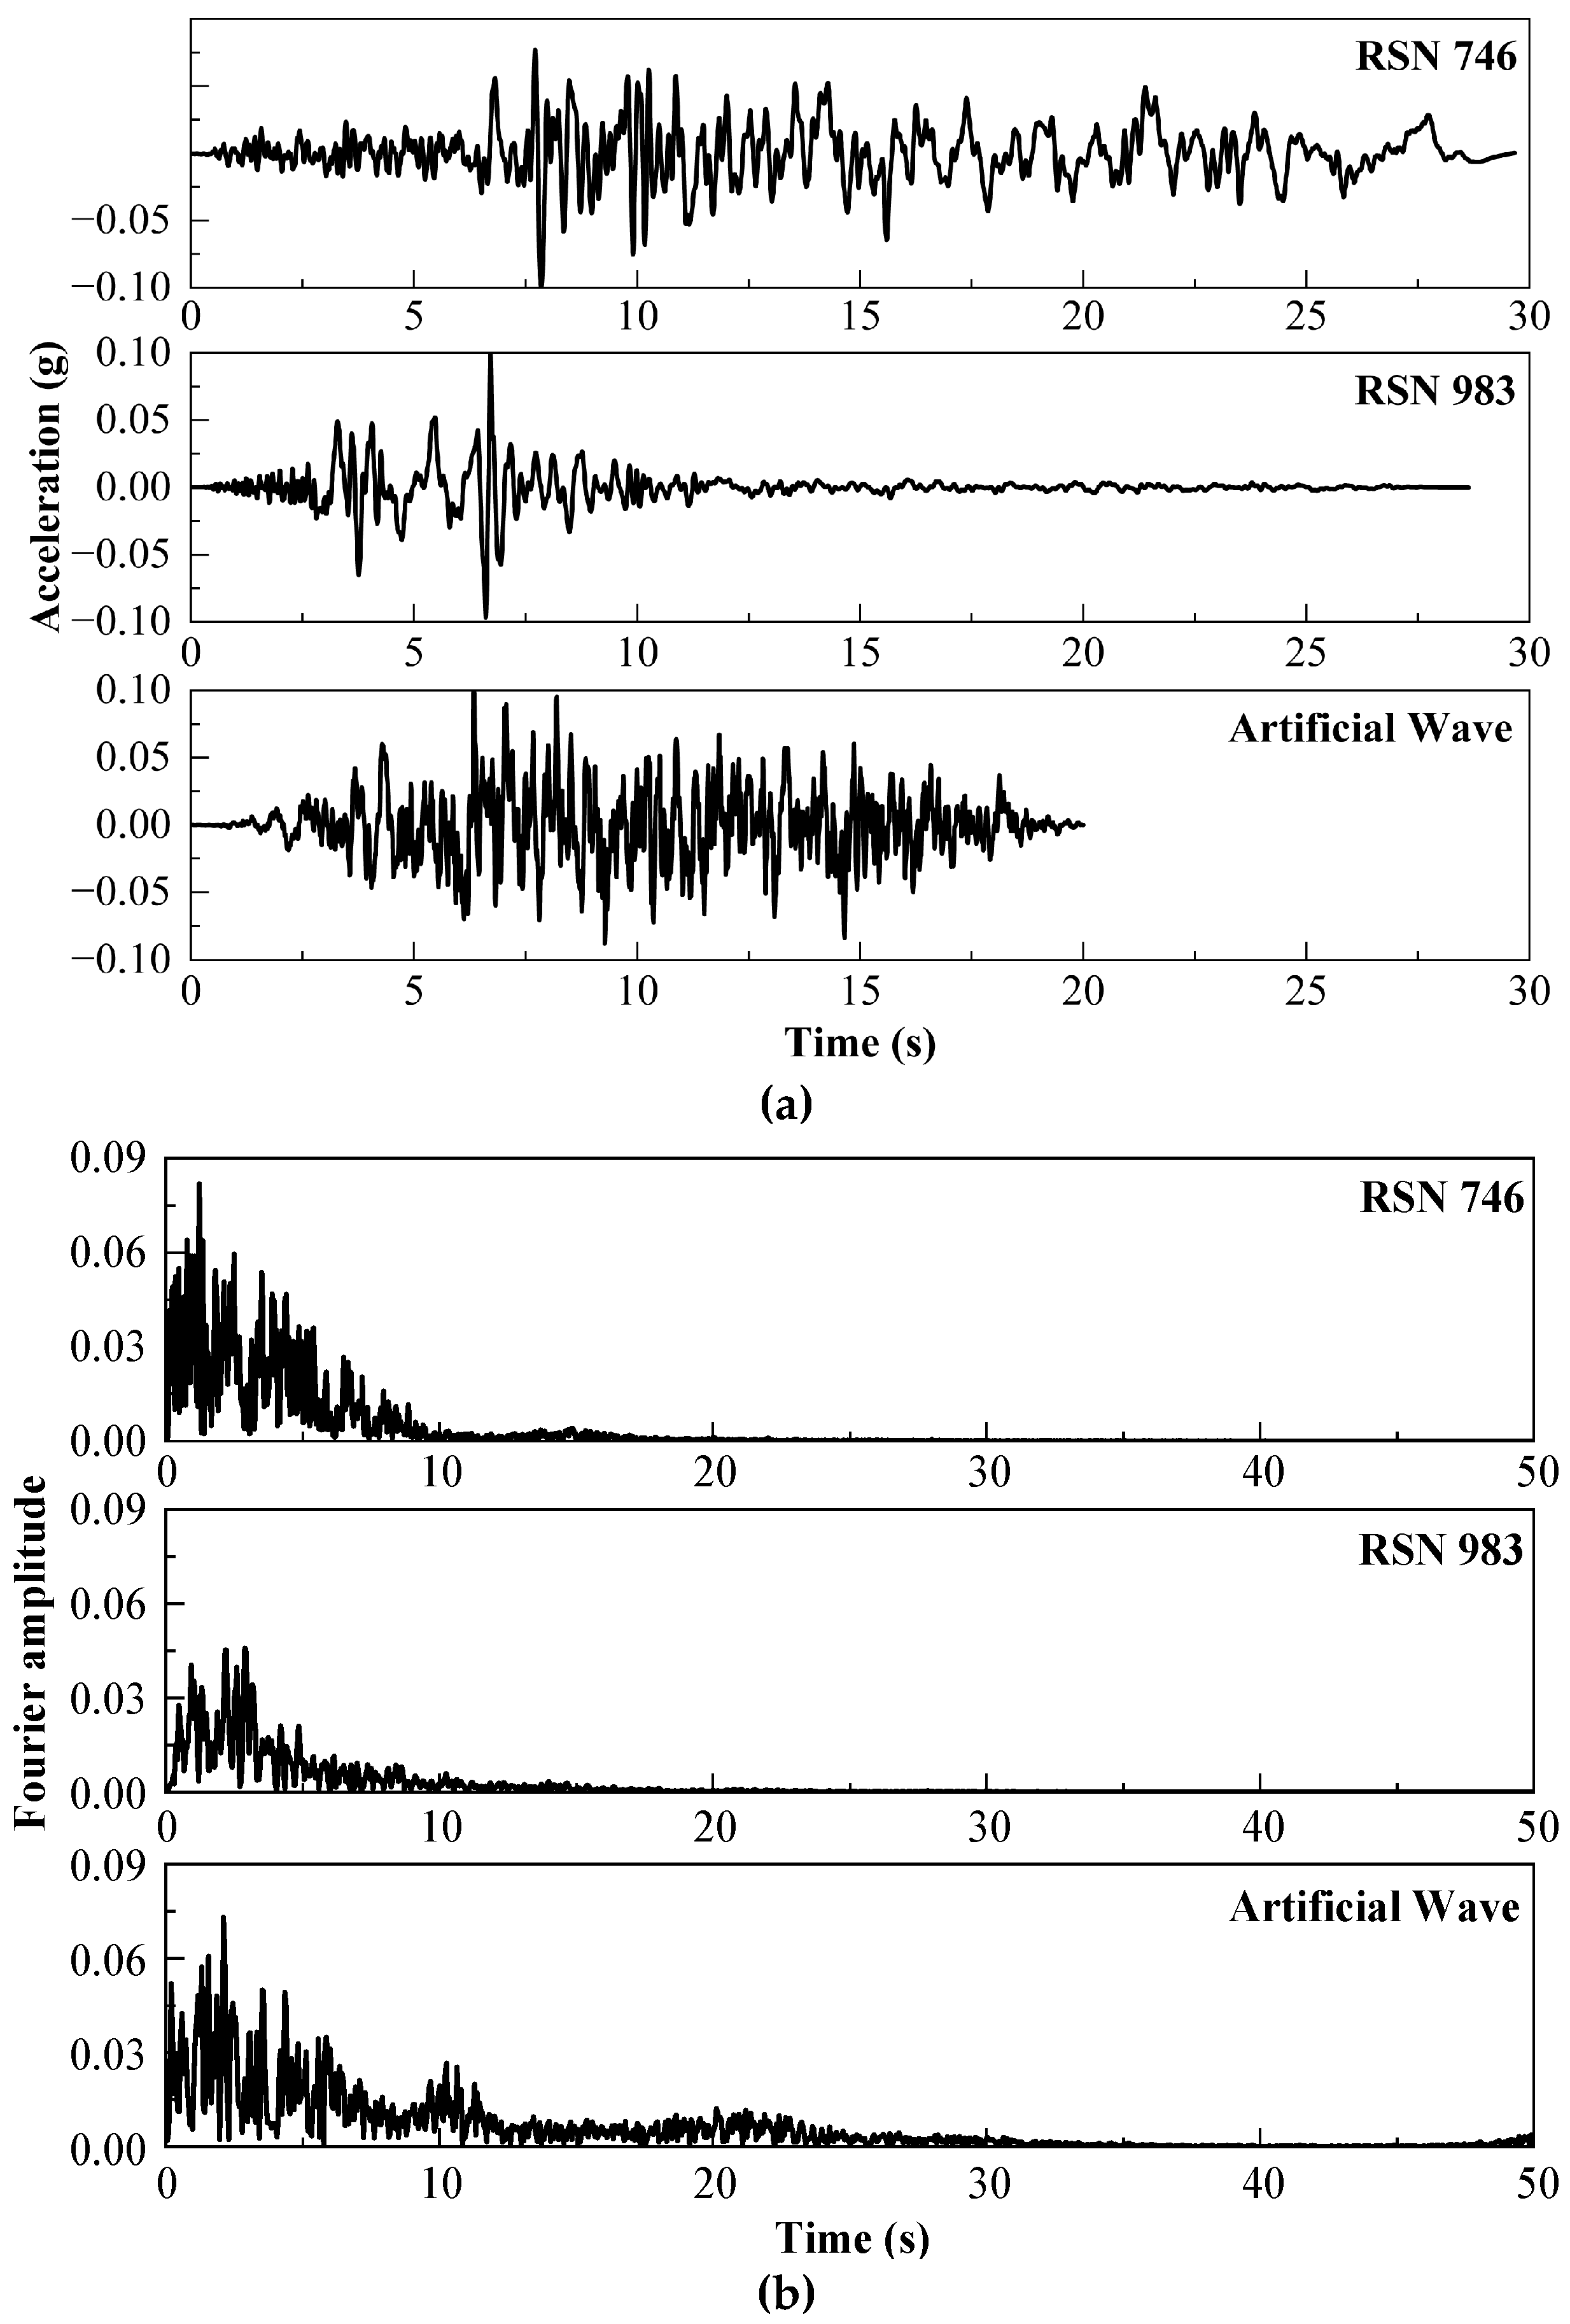
Table 3, two measured seismic waves and one artificial wave (measured waves accounting for 2/3) were selected, and adjusted the PGA to 0.1 g. The acceleration curves and Fourier spectra of the input seismic waves are shown in
Figure 13.
To investigate the effects of traveling waves, three wave velocities (500 m/s, 1000 m/s, and 1500 m/s) were set. By inputting x-direction seismic waves at the bottom of the model, the horizontal traveling wave propagation effects were simulated.
6.1. The Influence of Traveling Wave Effect on Structure Displacement
The maximum overall displacement in the x-direction at 24 monitoring points under the influence of RSN746, RSN983, and artificial waves, considering the traveling wave effect, as shown in
Figure 14.
Under the influence of the RSN746 wave, the displacement magnitude of the monitoring points remains relatively stable within the propagation speed range of 500 to 1500 m/s, with fluctuations less than 5%. When the input is consistent, the maximum displacement is concentrated at 26.32 to 26.53 cm. The RSN983 wave exhibits different characteristics, with an increase in propagation speed leading to an overall decrease in displacement, with a reduction of 15 to 20%. The displacement range under consistent input is 3.95 to 4.29 cm. Artificial waves are most significantly affected by the traveling wave effect, with displacement decreasing by 28% at a propagation speed of 500 m/s compared to consistent input, but recovering by approximately 18% when the speed increases to 1500 m/s.
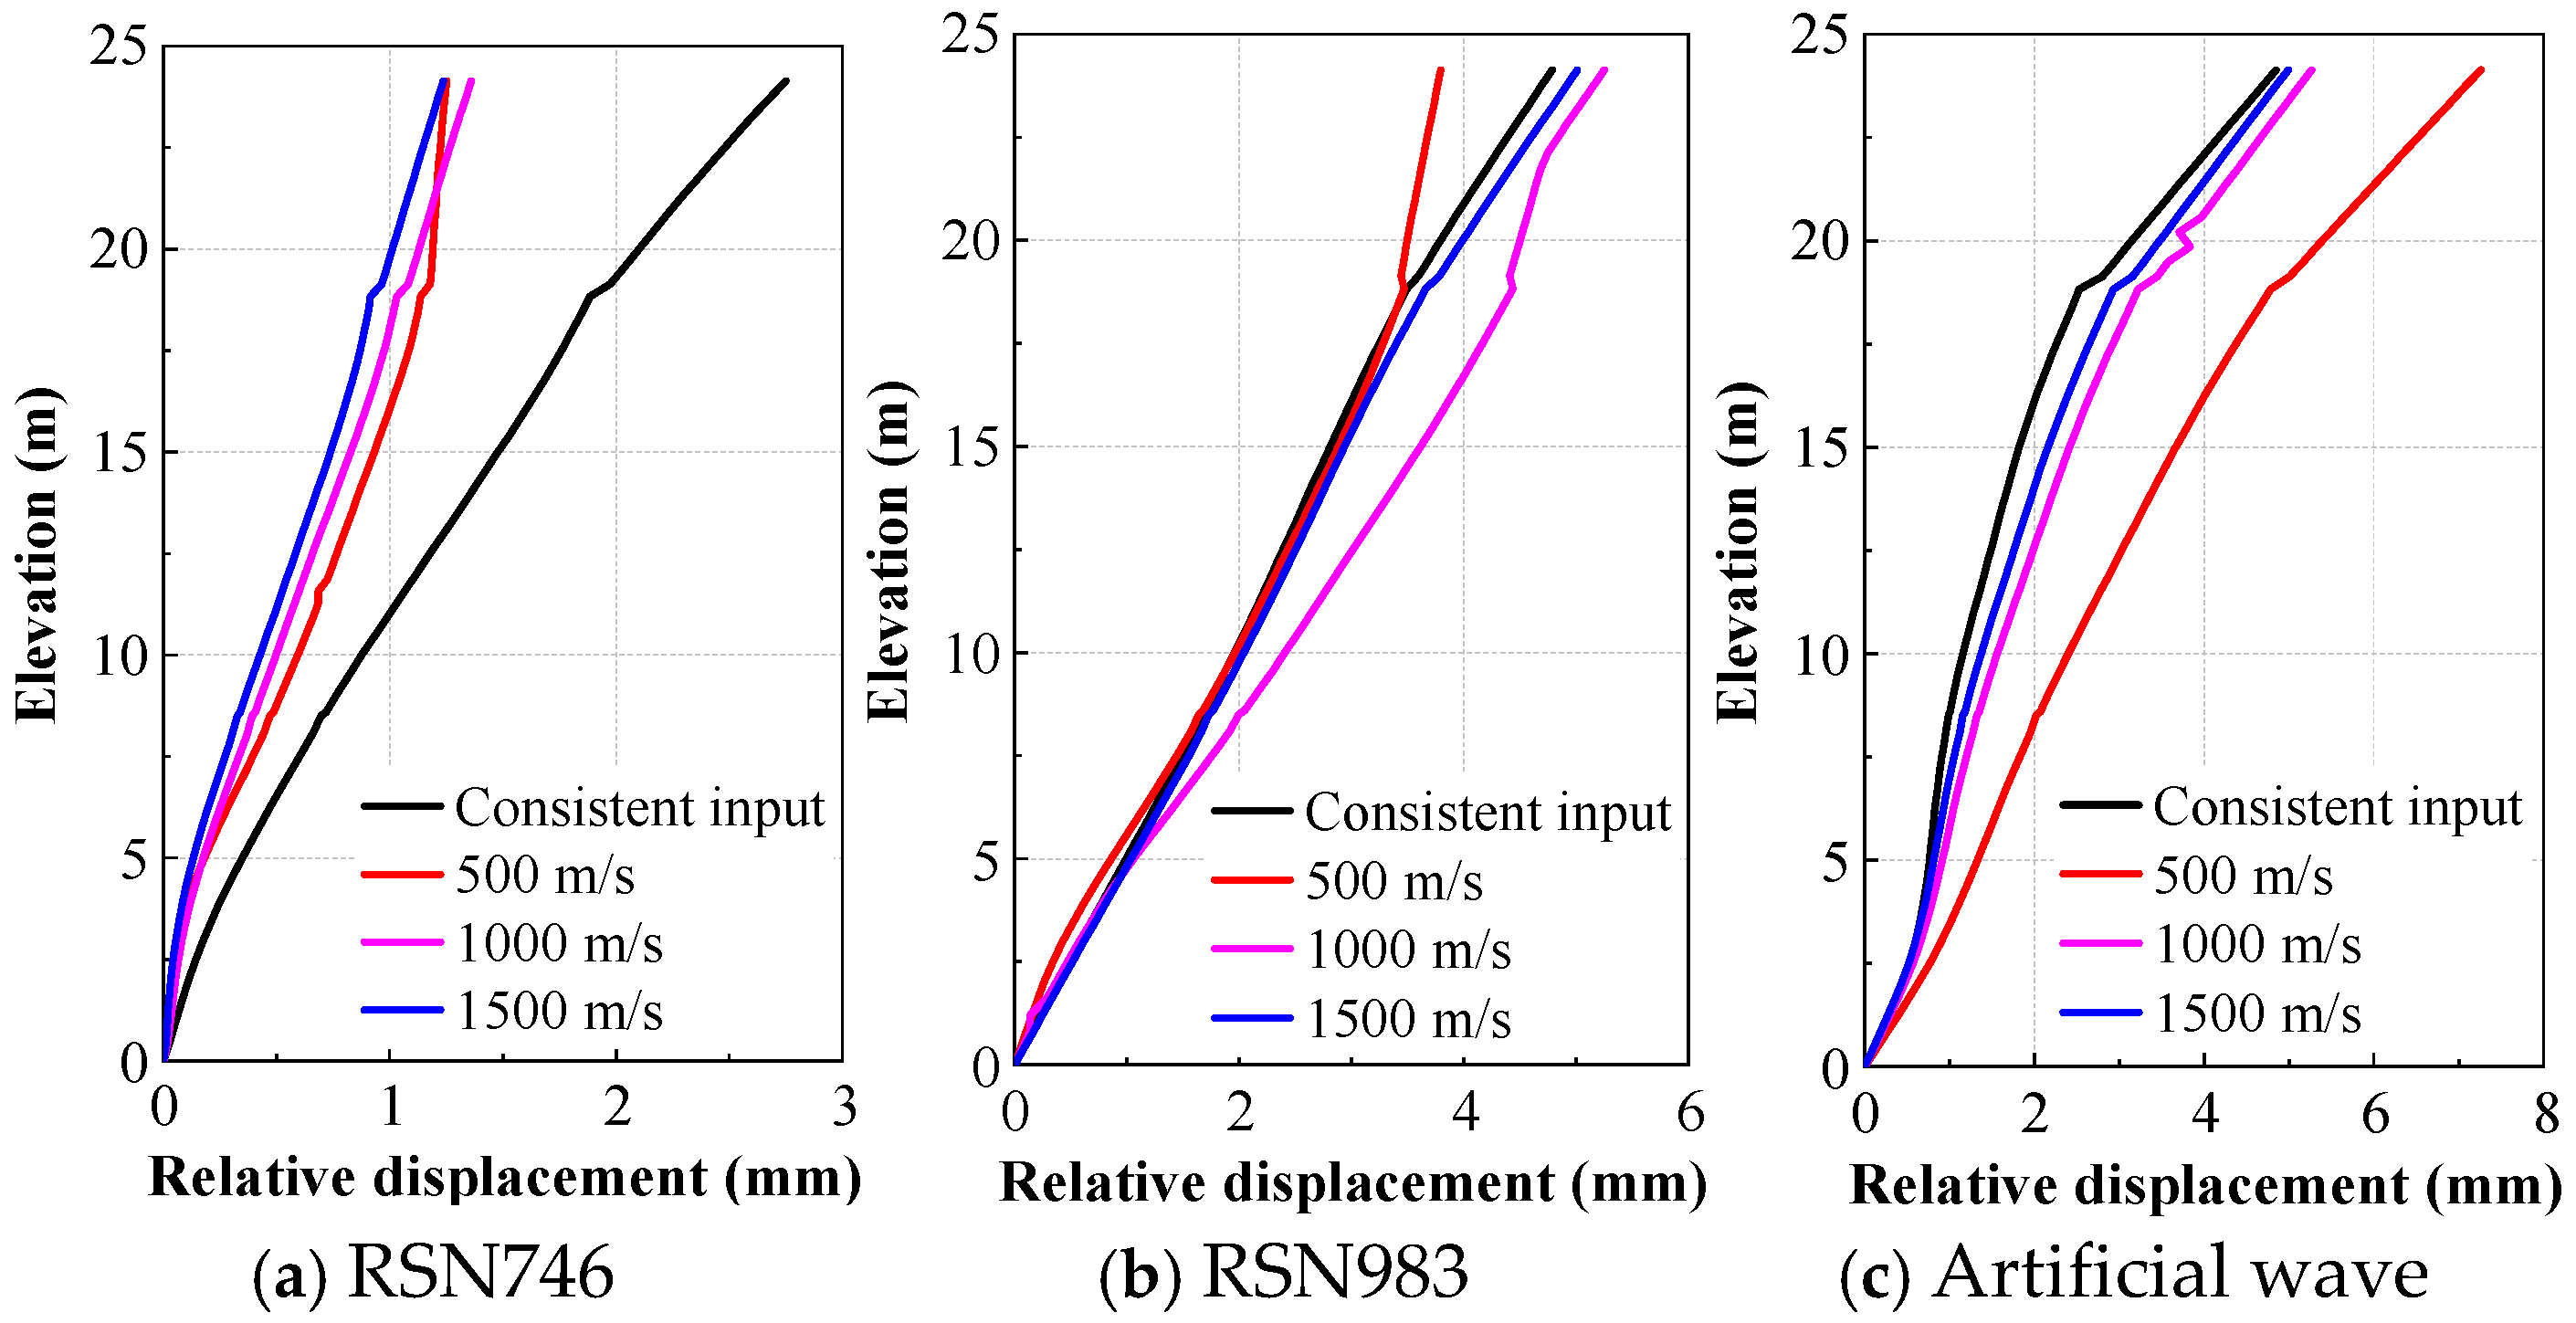
The displacement changes in the lower half of the structure (monitoring points #1 to #9) are significantly greater than those in the upper half (monitoring points #10 to #24), which may be related to resonance effects and changes in energy distribution caused by changes in wave velocity. The displacement differences between monitoring points in each layer are less than 5%, so the nodes on the left wall were selected to establish the elevation-displacement relationship (
Figure 15).
The comparison between uniform and non-uniform input reveals that uniform excitation produces larger global displacements due to synchronous deformation of the entire structure, whereas traveling waves introduce phase delays that suppress global drift but significantly amplify relative displacement between structural segments. This mechanism explains the coexistence of reduced absolute displacement and increased deformation concentration under traveling wave excitation.
6.2. The Influence of Traveling Wave Effects on the Internal Force of Structure
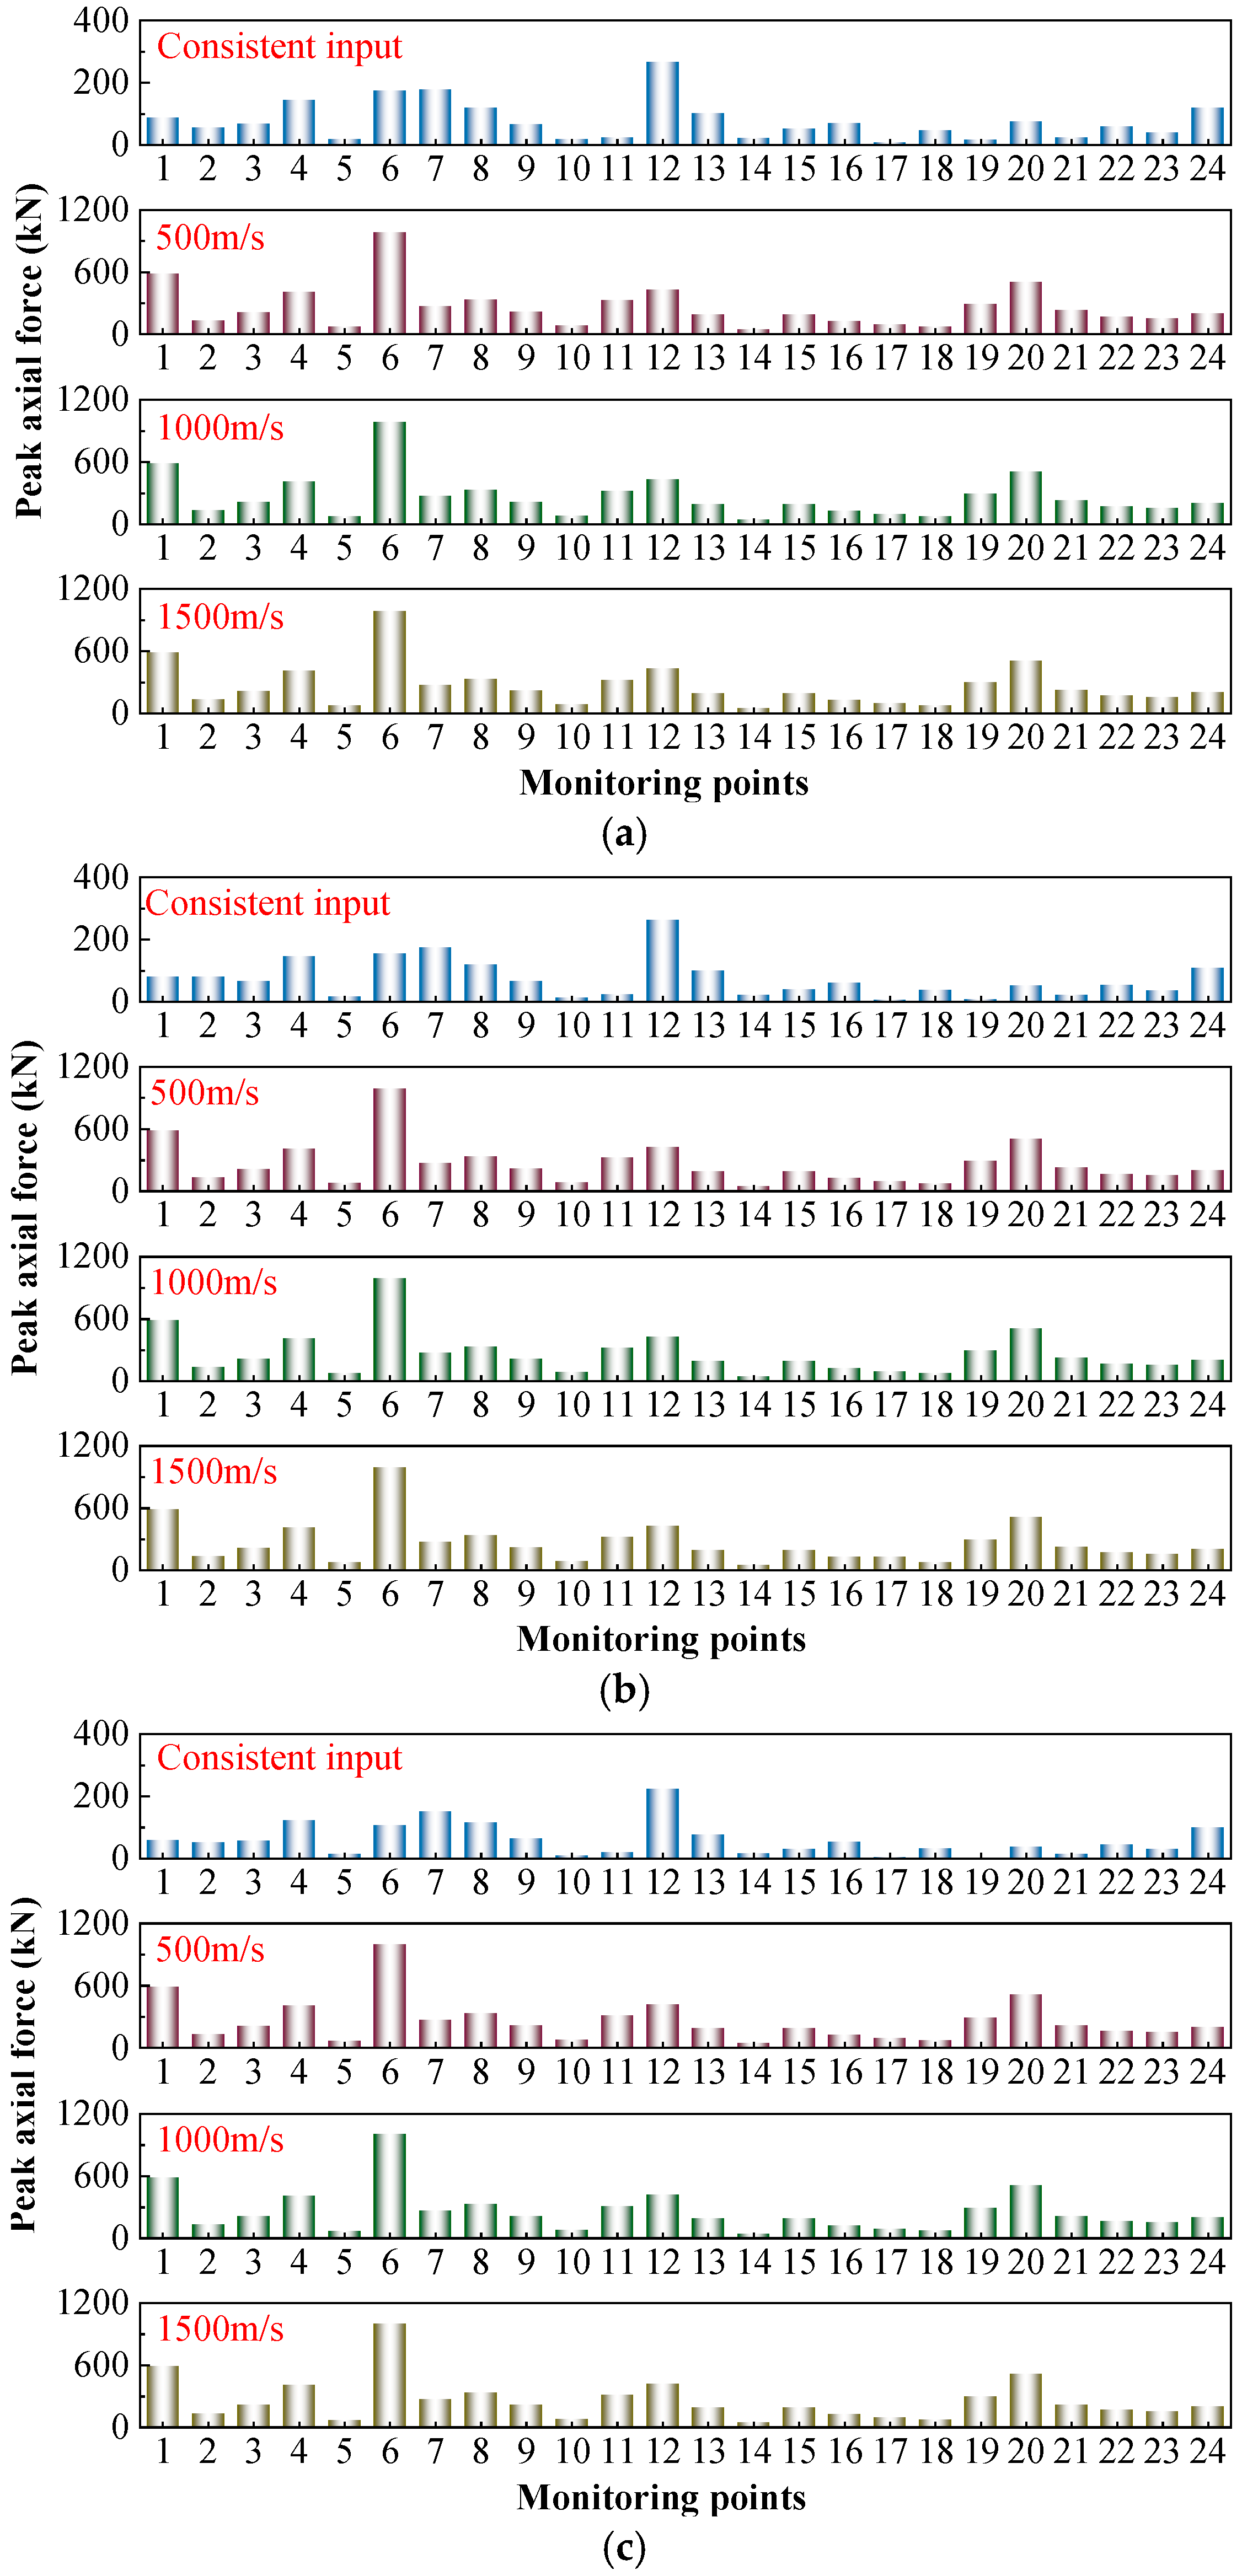
Figure 16 shows the results of peak axial force affected by traveling wave effects at 24 monitoring points under the influence of RSN746, RSN983, and artificial waves. The axial force response is significantly affected by non-uniform input but is less sensitive to seismic wave type and propagation velocity. At the same propagation velocity, the difference in peak axial force at monitoring points caused by different seismic waves is less than 3%. Therefore, the focus is on examining the effects of non-uniform input. This indicates that the influence of the waveform characteristics (e.g., RSN746 vs. RSN983) is secondary, whereas the transition from uniform input to traveling-wave input governs the magnitude of force amplification.
As shown in
Figure 16, when the propagation speed increases to 500 m/s, the peak axial force significantly increases. Monitoring point #19 shows the largest increase (16.9 times), while monitoring point #24 shows the smallest increase (1.68 times). Under the 500 m/s condition, the axial force at monitoring point #6 reaches 983.7706 kN, indicating that this point is most prone to tensile-compressive failure. Monitoring points #7, #11, and #12 (mid-structure) within the same frame also exhibit high peak internal forces, indicating that this area is highly susceptible to damage. The axial forces at monitoring points #1 and #4 at the bottom of the side walls are 853.9005 kN and 406.4394 kN, respectively, significantly higher than those at other side wall monitoring points, suggesting that this area is prone to tensile-compressive failure.
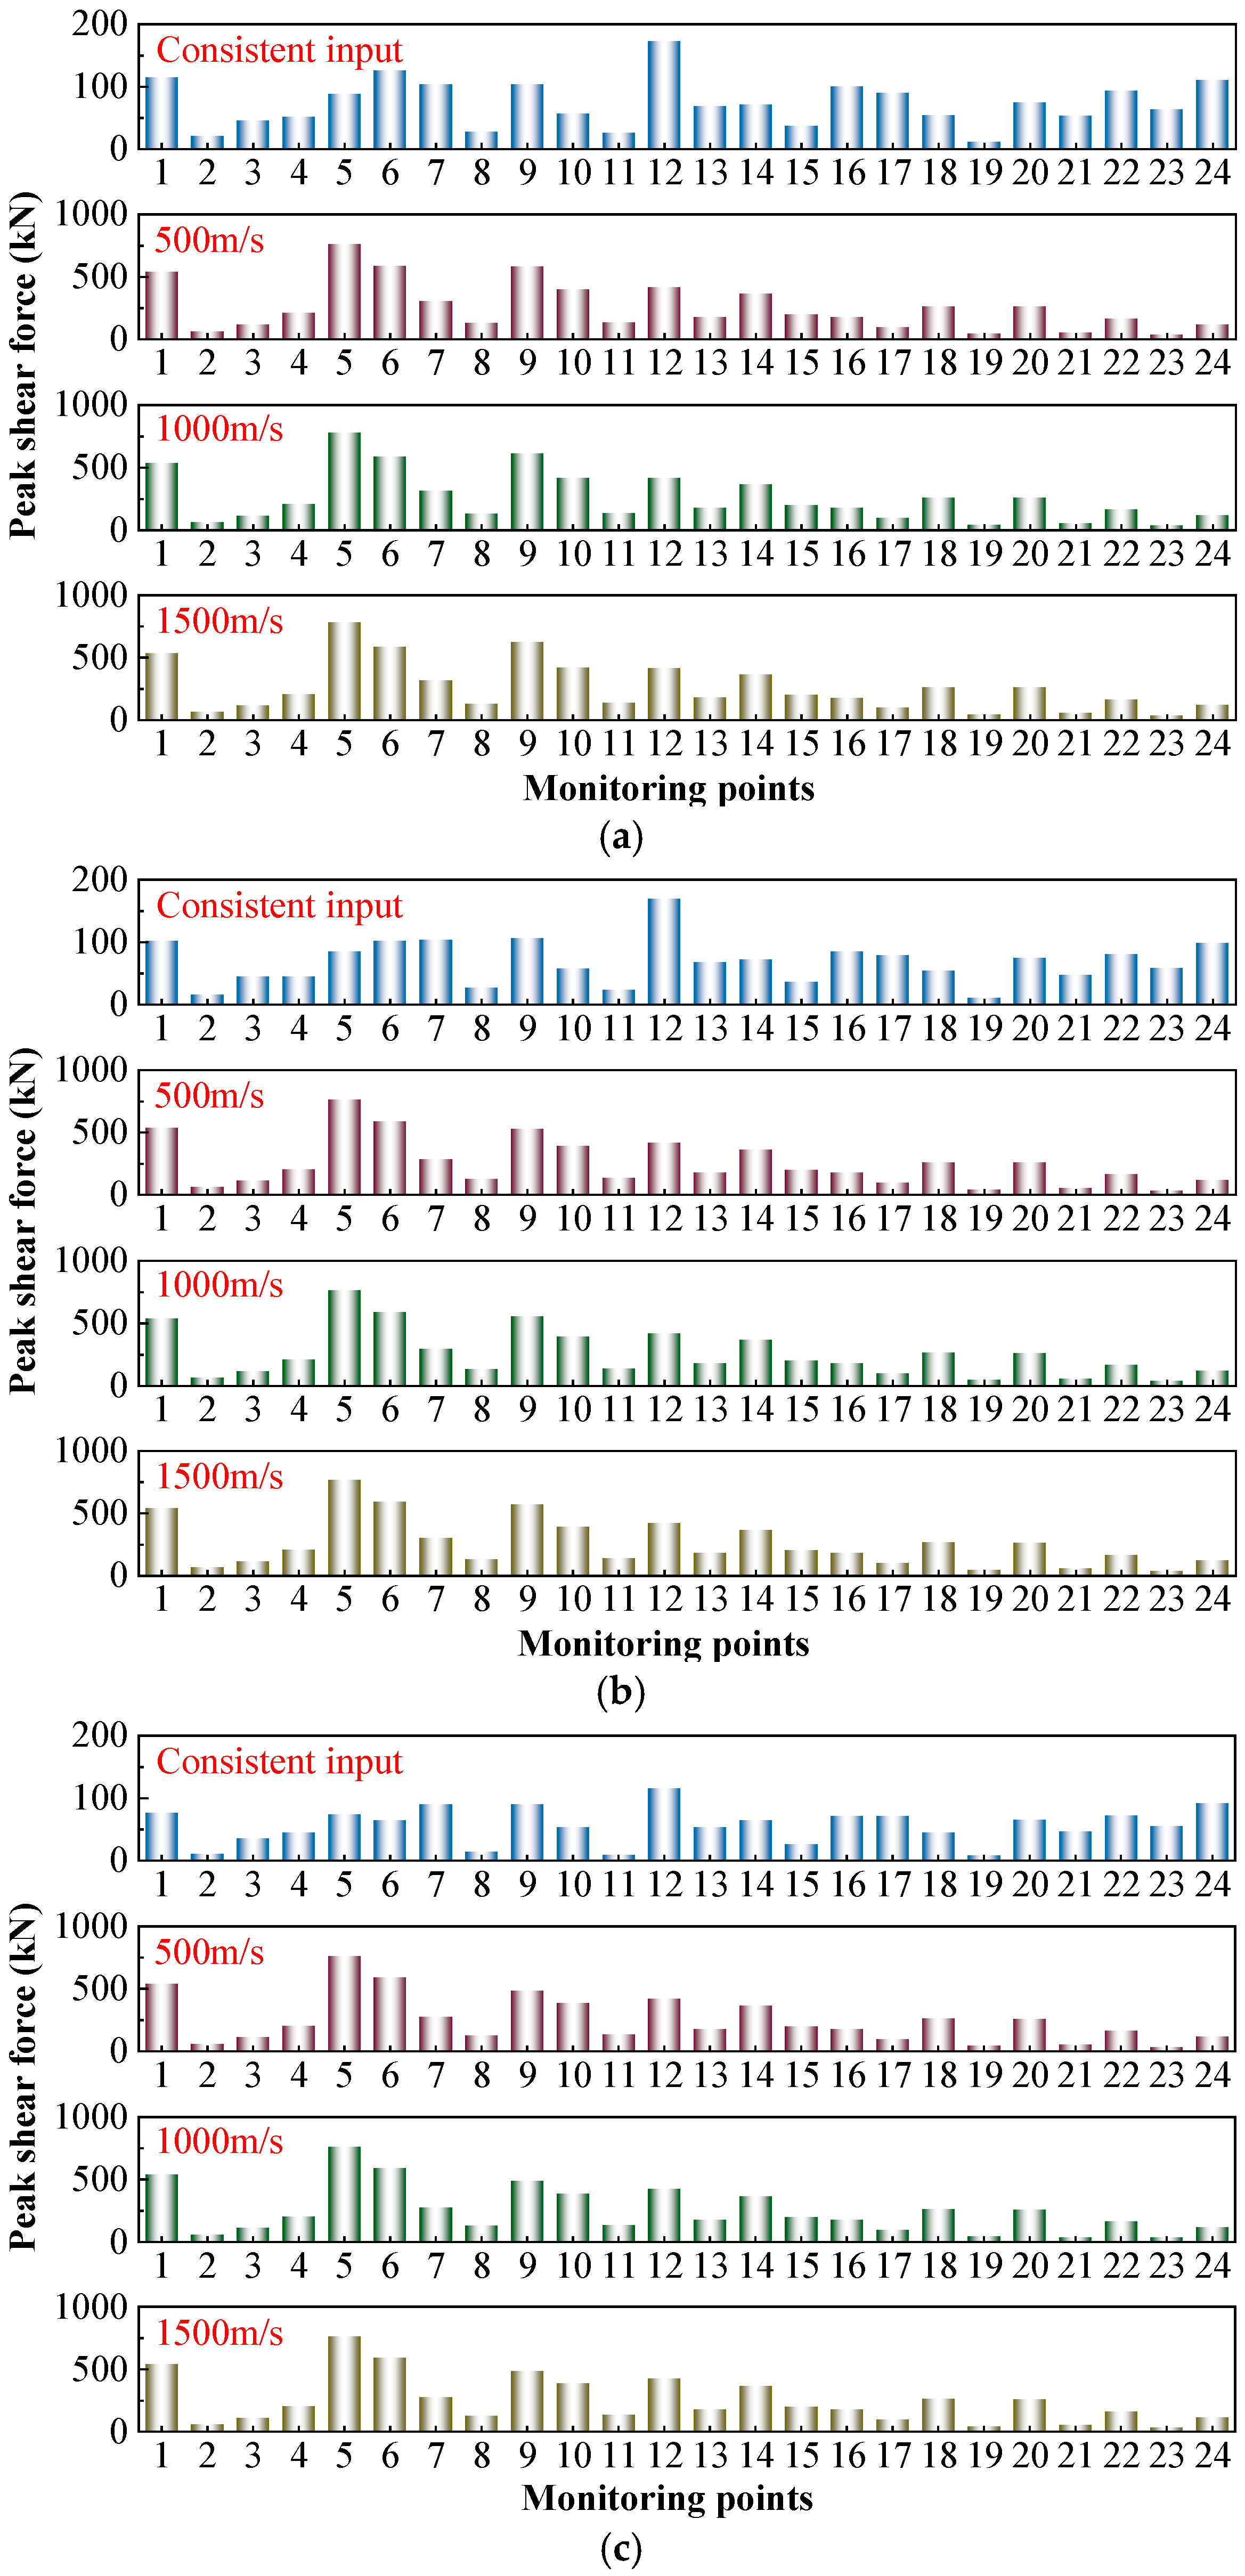
Figure 17 lists the peak shear forces of traveling wave effects under the influence of RSN746, RSN983, and artificial waves.
The pattern of shear force affected by non-uniform input is consistent with that of axial force, significantly influenced by traveling wave effects but less affected by seismic waves and propagation velocity. Under different seismic waves, when the propagation velocity is the same, the peak shear force differences among monitoring points are within 3%. Therefore, the following analysis focuses on the impact of non-uniform input on monitoring points. Again, this confirms that the primary source of internal force amplification is the input non-uniformity rather than the specific seismic waveform.
Under the 500 m/s condition, the peak shear forces at all monitoring points except points 21 and 23 significantly increased compared to the consistent input. Among these, point 5 showed the largest increase, with a shear force of 8.6 times that of the consistent input under the 500 m/s condition. The monitoring point #17 showed the smallest increase, only 1.07 times that of the consistent input. Under the 500 m/s condition, the monitoring point #5 exhibited the highest shear response (760.7008 kN), indicating that this point is most prone to shear failure. Monitoring points #6, #7, and #9 at the same elevation also exhibited high peak shear values, suggesting that the slab in this layer is prone to shear failure. Monitoring point 1 also exhibited a high peak shear value, indicating that the bottom of the left wall is also prone to shear failure.
In summary, axial force and shear force are less affected by propagation velocity and seismic waves. However, when transitioning from consistent input to inconsistent input, both values significantly increase, with the maximum increase in axial force reaching 16.9 times. This highlights that the determining factor of internal force variation is the input mode (uniform vs. traveling wave), rather than the wave type or velocity. This change is primarily attributed to seismic waves propagating along the X-axis direction. Analysis indicates that the concrete frame structure formed by the monitoring points #6, #7, #11, and #12 is prone to tensile-compressive failure, and the intermediate slab in the first layer is susceptible to shear failure. Additionally, monitoring point 1 at the bottom of the left-side wall exhibits relatively high axial force and shear force, necessitating enhanced reinforcement measures in these areas.
6.3. The Influence of Traveling Wave on the Structure Stress
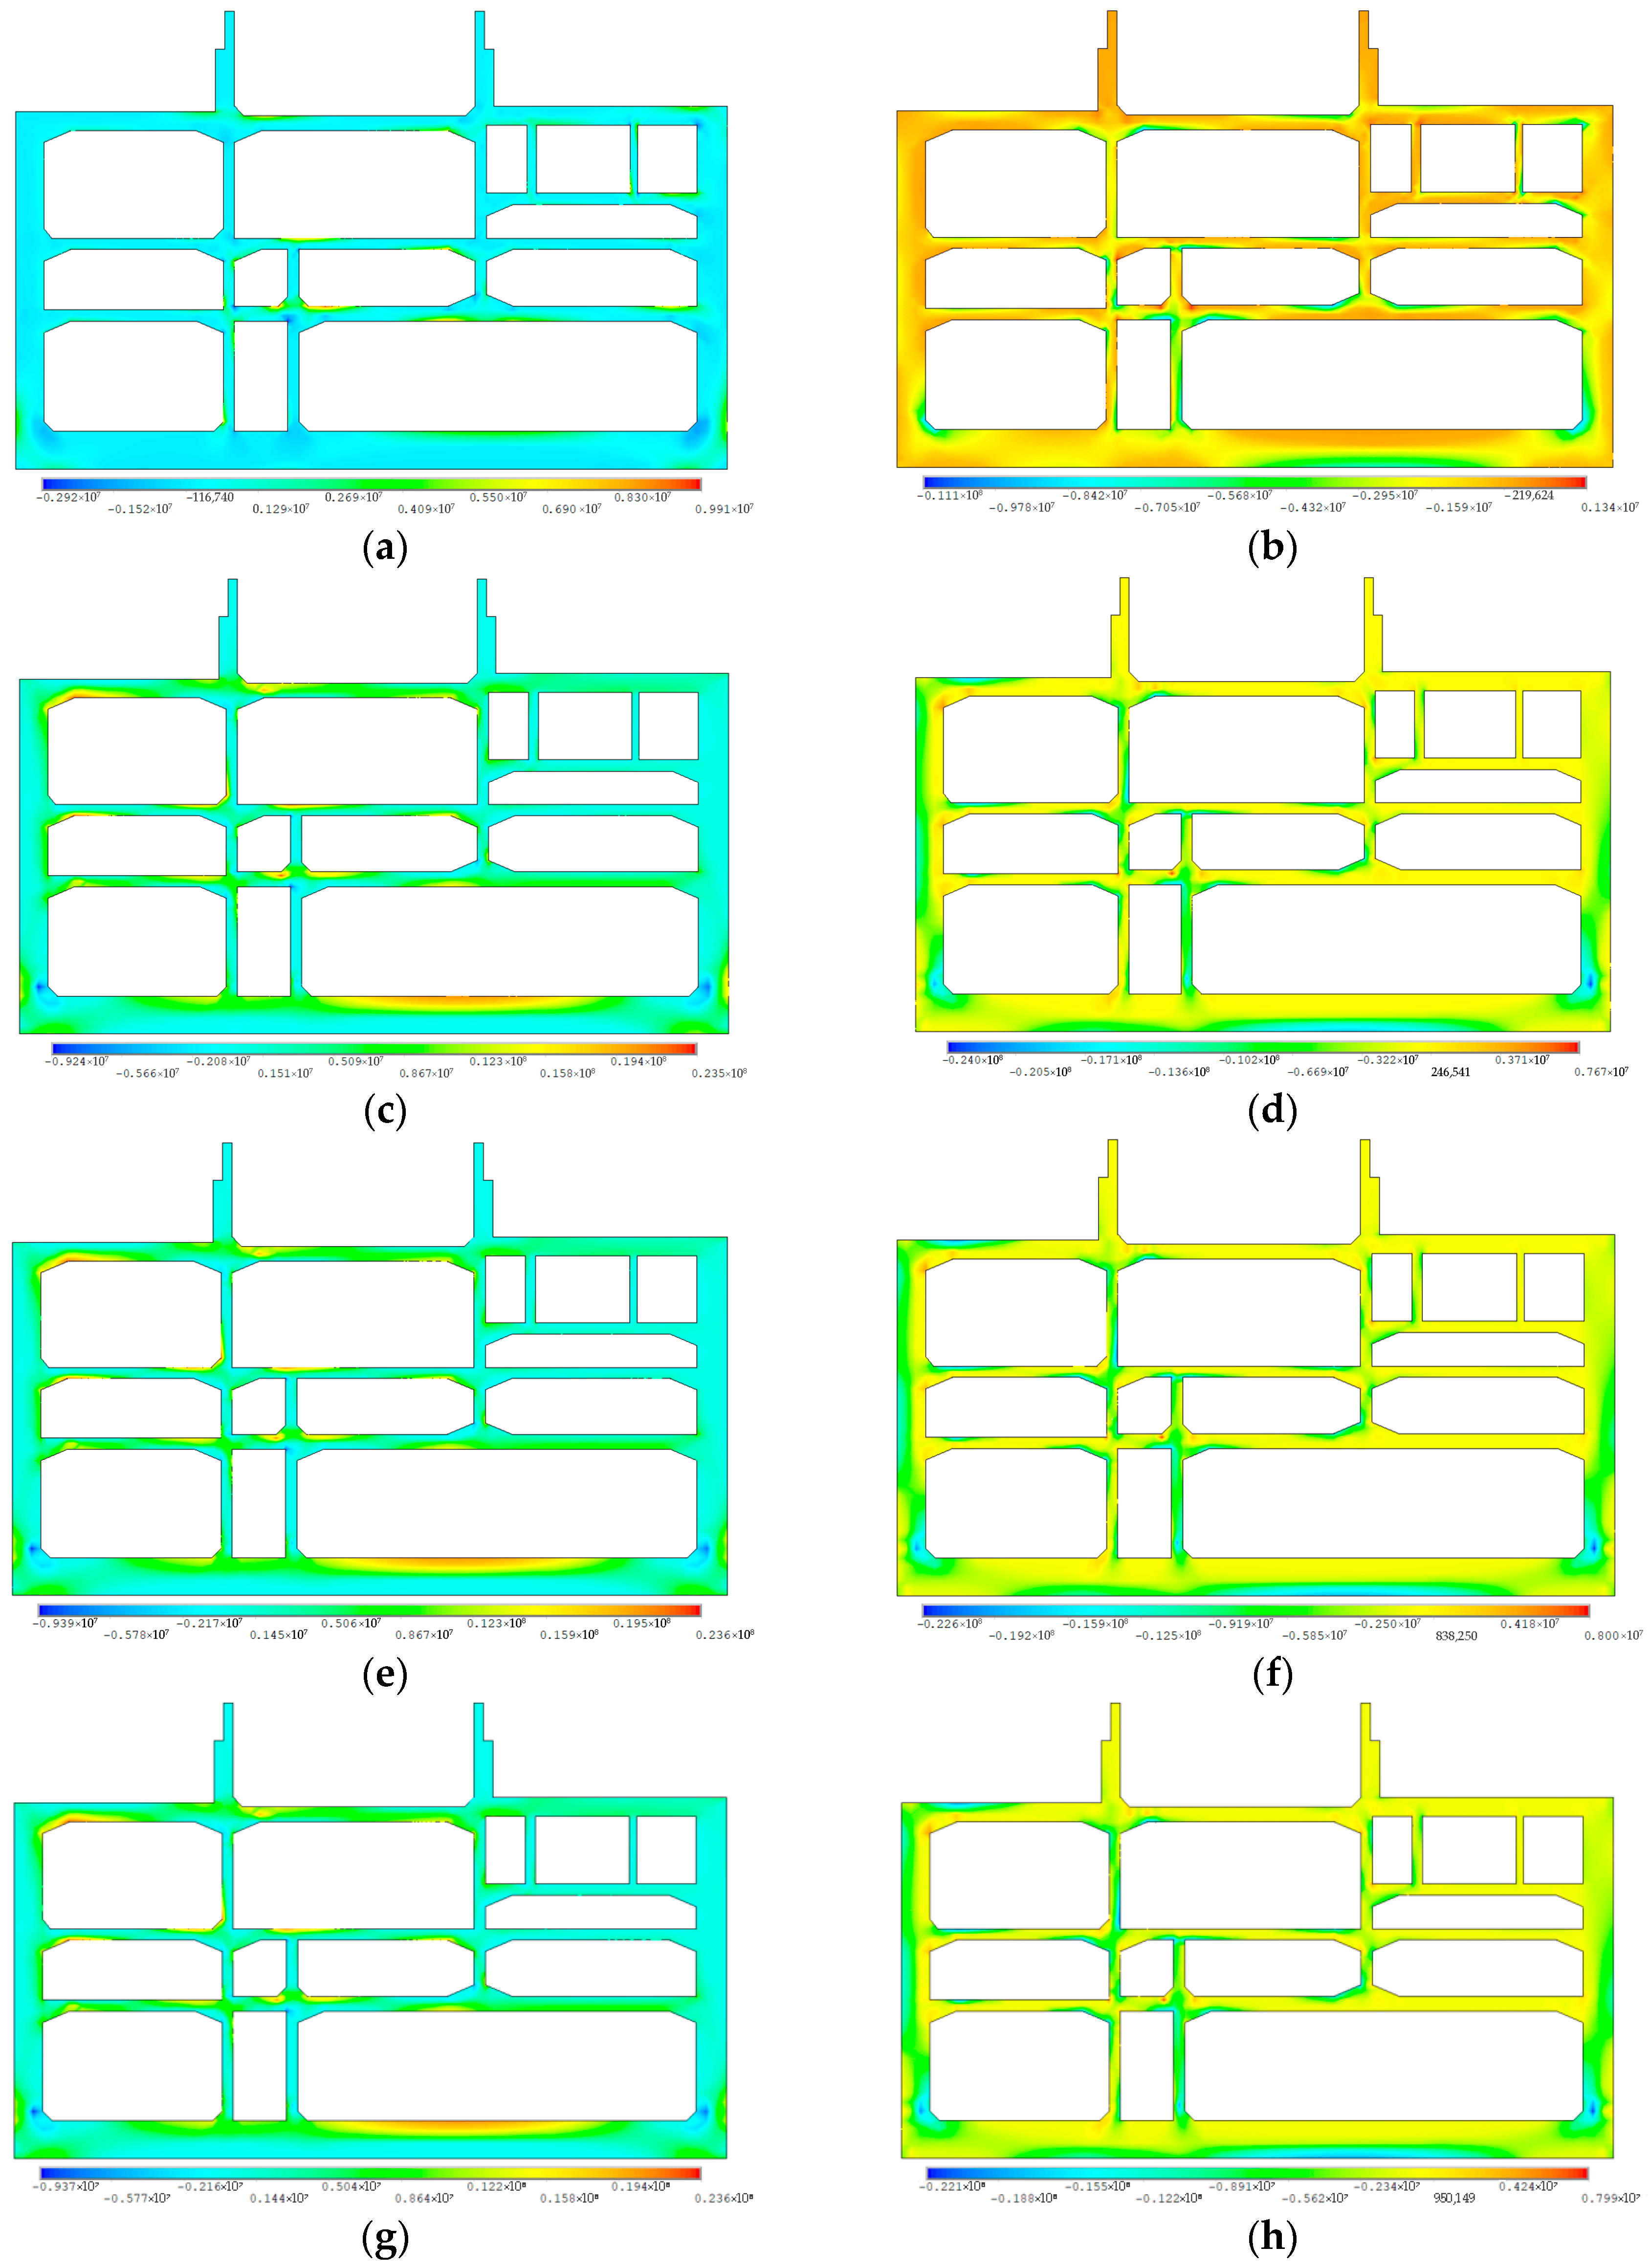
The input seismic peak time is defined as the time corresponding to the peak acceleration of the seismic wave (7.86 s for RSN746, 6.71 s for RSN983, and 6.34 s for the artificial wave). Analysis of stress distribution maps under three seismic waves with different propagation speeds reveals that the patterns of maximum/minimum principal stress changes are similar. Therefore, RSN746 is selected for typical analysis.
Figure 18 shows that when the propagation velocity increases from the consistent input to 500 m/s, the maximum principal stress peak increases from 9.91 to 23.5 MPa (an increase of 137%), and the minimum principal stress peak increases from 11.1 to 24 MPa (an increase of 116%). When the propagation speed is further increased to 1500 m/s, the maximum principal stress remains stable, while the minimum principal stress peak gradually decreases from 24 to 22.1 MPa. The stress cloud diagram indicates that under non-uniform input conditions, the stress concentration zones significantly expand. Except for the first span structure, stress concentration is evident in all other frames, with particularly pronounced stress concentration at the bottom of the side walls and the bottom plates of ramps ND and B. The stress responses at monitoring points #7 and #11 are the most significant.
The doubling of the principal stress under traveling wave excitation indicates a marked increase in stress concentration intensity. Such high gradients of tensile and compressive stress increase the likelihood of crack initiation, local brittleness, and stiffness degradation in the concrete components of underground structures, particularly in regions with geometric discontinuities or abrupt stiffness transitions.
Stress differences among different seismic waves remain below 10%, confirming that the dominant factor influencing stress distribution is the non-uniformity of seismic excitation rather than the specific waveform or propagation velocity. Monitoring points #7, #11, and #12 (located within the frame formed by the first- and second-floor intermediate slabs and the first- and second-intermediate columns) consistently exhibit the highest stress demands and constitute the primary weak zones of the structure.
7. Conclusions
This study is based on the JD-36 section of the Nanjing Huimin Avenue Comprehensive Reconstruction Project, where seismic fragility and traveling-wave effects were analyzed. The research outcomes have been practically applied in the engineering project, providing guidance for local reinforcement design and material selection at critical locations such as the bottom of sidewalls and the connections of the middle slabs. These applications also validate the scientific soundness and rationality of the proposed methodology. The developed model and analytical framework can offer reliable technical support for seismic performance evaluation and the optimization design of complex underground interchange structures in weak foundation conditions. The main findings are as follows:
(1) The structure has a low probability of exceeding PL3 damage. Under the action of multiple earthquakes and defense earthquakes, only cracks are produced, and the possibility of the development of a nonlinear state is low. moderate damage occurs under rare earthquakes. The probability of moderate damage under very rare earthquakes reaches 46.15%. Damage in underground structures under strong earthquakes is often concentrated at structure discontinuities, consistent with the plastic hinges observed in JD-36’s frame joints. The frame structure, composed of monitoring points #7, #8, #12, and #13, and the bottom of the right-side wall, are most prone to plastic damage, and it is recommended to use high-toughness and high-strength materials to carry out local reinforcement in order to slow down the development of damage.
(2) In terms of overall displacement, the displacement value of the consistent input condition is generally larger than that of the traveling wave input, and the displacement change in the lower half of the structure (monitoring points #1 to #9) is more significant than that of the upper half (monitoring points #10–#24). In terms of relative displacement, different propagation velocities at elevations over 18.8 m caused a change in the trend of displacement growth, with the most obvious change under the condition of 500 m/s. The maximum relative displacement of the traveling wave effect during RSN983 wave action was 1.2 times that of the consistent input, and it could be up to 1.5 times that of the artificial wave action.
(3) The axial force and shear force are less affected by the propagation velocity and seismic wave, but the value increases significantly when the input is not consistent, and the maximum increase in axial force is 16.9 times. The concrete frame composed of monitoring points #6, #7, #11, and #12 is prone to tensile and compressive damage, and the center plate of the first floor is prone to shear damage. Monitoring point #1 (bottom of the left wall) has large values of axial force and shear force, and it is necessary to focus on strengthening the structure in this area.
(4) The extreme value of the structure stress response for non-uniform inputs is twice that of uniform inputs. Under different seismic waves, the increase in propagation velocity caused changes in the stress extremes, but the difference is less than 10%. The most significant stress response is observed at monitoring points #7, #11, and #12 (located in the frame structure composed of the first and second floor center plates and the first and second center columns), which indicates that this area is prone to stress concentration.
Although the analysis framework demonstrates good applicability, certain methodological limitations should be acknowledged. The use of a two-dimensional plane-strain model and the assumption of a rigid ground–structure connection may restrict the ability to capture torsional responses, out-of-plane effects, and nonlinear contact phenomena. These simplifications may introduce uncertainties in the evaluation of stress concentration and internal force redistribution under highly heterogeneous ground motions.
Future research may therefore focus on (i) extending the numerical framework to three-dimensional modeling to capture complex spatial vibration modes, (ii) incorporating nonlinear soil–structure contact behavior such as slippage and separation, and (iii) performing experimental or full-scale monitoring verification using additional underground infrastructure to further validate the generality of the findings.
