Article

Numerical Analysis of Seismic Vulnerability and Dynamic Response of Underground Interchange Structures Under Traveling Wave Effects

1
School of Civil Engineering and Architecture, Anhui University of Science and Technology, Huainan 232001, China
2
Engineering Research Institute, China Construction Eighth Engineering Division Co., Ltd., Shanghai 200122, China
3
College of Civil Engineering, Tongji University, Shanghai 200092, China
4
China Construction Eighth Engineering Division Rail Transit Construction Co., Ltd., Nanjing 210008, China
*
Author to whom correspondence should be addressed.
Appl. Sci. 2025, 15(22), 12264; https://doi.org/10.3390/app152212264
Submission received: 30 October 2025 / Revised: 17 November 2025 / Accepted: 17 November 2025 / Published: 19 November 2025
(This article belongs to the Special Issue Advances in Tunnel Excavation and Underground Construction)

Abstract

The underground interchange structure is a crucial component of urban underground construction facilities. Its seismic performance in soft ground under the influence of traveling-wave effects has not yet been studied. If not addressed in a timely manner, it will pose serious construction safety risks. This study develops a two-dimensional finite element model of a representative underground interchange, employing the multi-linear kinematic–dynamic interaction model to capture nonlinear material behavior. Incremental dynamic analysis is integrated with probabilistic fragility assessment to examine damage evolution, deformation, internal forces, and stress responses under both uniform and non-uniform seismic inputs. Results indicate that the overall seismic performance is satisfactory, with a low probability of exceeding moderate damage. Plastic damage is concentrated in the central frame and the base of the right-hand wall. Compared with traveling-wave excitations, uniform inputs generally produce larger displacements, particularly in the lower structure. Although axial and shear forces show limited sensitivity to wave type or propagation velocity, they increase significantly under non-uniform input, with axial forces reaching up to 16.9 times those under uniform excitation. Non-uniform input also doubles stress extremes and intensifies stress concentrations at frame nodes. These findings underscore the need to incorporate traveling-wave effects into seismic evaluation and offer methodological insights for the design and reinforcement of underground interchanges in weak soils.

1. Introduction

With the rapid expansion of underground space utilization in urban areas, interchange structures have been increasingly constructed as essential nodes that connect multiple traffic lines and redistribute flow [1,2]. Unlike ordinary tunnels or subway stations, underground interchanges are characterized by large spans, multiple connections, and irregular layouts [3,4], which makes their structural systems considerably more complex. When subjected to seismic ground motions, this complexity often results in uneven stress distribution and localized damage, posing risks of severe social and economic consequences [5]. In earthquake-prone regions such as China, where such facilities are widely constructed, the need for reliable seismic performance assessment is particularly critical, especially when they are located on weak soils.
Early investigations into the seismic behavior of underground structures primarily relied on analytical methods. These approaches are efficient and provide clear theoretical insights and thus have been widely used to derive closed-form solutions for tunnels and shafts [6,7,8]. For example, unified solutions for circular and rectangular tunnels and analytical models considering isolation layers have advanced the theoretical understanding of soil–structure interaction [9]. However, such methods usually rely on idealized assumptions—such as homogeneous ground conditions and simplified boundary constraints—which limit their applicability to large-scale and irregular underground structures.
To overcome these limitations, numerical simulation methods have been increasingly employed in recent decades. Finite element and finite difference analyses enable the modeling of nonlinear soil–structure interaction, heterogeneous ground conditions, and complex geometries [10,11,12]. Numerous studies have successfully examined the seismic response of subway stations, shield tunnels, and frame-type underground structures [13,14,15]. These works have revealed mechanisms such as liquefaction-induced deformation, dynamic soil–structure interaction, and progressive damage patterns [16,17]. Nevertheless, most of these investigations remain concentrated on relatively regular underground facilities. Comprehensive studies focusing on large underground interchanges with asymmetric, multi-span, and unequal-span configurations, particularly under traveling-wave excitations, are still scarce.
Beyond general seismic response analyses, several approaches have been proposed to evaluate structural performance at the level of seismic resistance. Methods such as the response displacement method, pushover analysis, and strain transfer techniques, as well as the seismic coefficient and free-field deformation methods, have been applied under various ground motion intensities [18,19,20,21,22]. These simplified approaches provide practical insights, but their reliability for highly irregular interchange structures remains limited.
In parallel, seismic fragility analysis has gained increasing attention as a probabilistic framework to quantify structural vulnerability. Previous studies have demonstrated that stratified soils generally lead to higher fragility than homogeneous sites [23]. Intensity measures such as peak ground acceleration (PGA) and peak ground velocity (PGV) have been suggested as effective indicators of tunnel fragility in loess areas [24], while weak strata, voids, and liquefiable soils have been shown to exacerbate seismic damage [25]. Burial depth and soil stiffness have also been identified as critical factors influencing vulnerability [26]. Despite these advances, fragility assessments explicitly addressing large underground interchanges, particularly under traveling-wave seismic inputs, remain very limited.
On this basis, two major research gaps can be identified. First, seismic analyses seldom target underground interchanges with asymmetric and unequal-span configurations, despite their growing prevalence in modern transportation networks. Second, the influence of traveling-wave effects on fragility evaluation has rarely been systematically addressed, even though such effects can significantly modify deformation patterns, internal force distribution, and stress concentrations. These gaps are especially critical when interchanges are constructed in weak soil conditions.
Based on the aforementioned gaps, this paper proposes the following explicit hypothesis: “We hypothesize that in weak soil sites, the traveling wave effect will cause significant amplification of internal forces at critical nodes of asymmetrical underground overpasses, with peak increments potentially exceeding tenfold those under uniform seismic loading.”
To validate this hypothesis, this study develops a two-dimensional finite element model that incorporates the multi-linear kinematic–dynamic interaction constitutive law to capture nonlinear material behavior. Incremental dynamic analysis (IDA) is combined with probabilistic fragility assessment to systematically investigate damage evolution, displacement patterns, internal force variations, and stress concentrations under both uniform and non-uniform seismic inputs. This integrated framework highlights the role of traveling-wave effects and identifies the most vulnerable structural components, thereby providing both methodological innovation and practical reference for the seismic evaluation and reinforcement of underground interchanges in weak strata.
The remainder of this paper is organized as follows. Section 2 introduces the research methods and numerical simulation framework, including the incremental dynamic analysis, probabilistic vulnerability assessment, and the derivation of seismic dynamic equations. Section 3 provides an overview of the Nanjing Huimin Avenue project as the case study. Section 4 describes the development of the finite element model, including soil parameters, seismic inputs, and constitutive models. Section 5 presents the structure vulnerability analysis, focusing on damage evolution, vulnerability indicators, and fragility assessment. Section 6 investigates the influence of traveling-wave effects on the seismic dynamic response, examining displacement, internal force, and stress distributions. Finally, Section 7 summarizes the main findings and discusses their engineering implications.

2. Research Methods and Numerical Simulation Framework

2.1. Incremental Dynamic Analysis and Probabilistic Vulnerability Assessment Method

To address the complexity of assessing the seismic performance of large underground interchange structures in weak strata, this paper employs a systematic research approach combining Incremental Dynamic Analysis with Probabilistic Vulnerability Assessment. This method quantitatively characterizes structural response patterns and failure probabilities under varying seismic intensities through nonlinear time-history analyses with multiple seismic inputs, thereby enabling a comprehensive assessment from structural response to seismic risk. In the analysis process, representative seismic records are first scaled to multiple intensity levels. Peak ground acceleration serves as the seismic intensity metric (IM), while the structure’s maximum inter-story drift ratio is adopted as the damage metric (DM). By progressively scaling input motions, the relationship between seismic intensity and structural response is established, forming a database of dynamic responses under various ground motions. Subsequently, based on IDA results, a log-normal distribution function is employed to fit the exceedance probability of structures reaching or exceeding each performance level at different seismic intensity levels, thereby constructing a seismic vulnerability model. Its probabilistic expression is as follows:
P ( L S ) = Φ b + a ln ( I M ) ln ( D c ) β D | I M 2 + β c 2
where a and b are the linear regression coefficients. IM is the seismic intensity index. Dc is the structure resistance, which is the limit value for each failure state indicator. Φ is normal distribution function. βD|IM, βc are the logarithmic standard deviations of structure demand and structure seismic resistance, respectively. According to the study [27], β D | I M 2 + β c 2 = 0.5 .
Compared with traditional deterministic analysis methods, the integrated approach of IDA and vulnerability assessment fully incorporates seismic motion uncertainties and material nonlinearities, thereby enabling a consistent transition from response analysis to probabilistic evaluation. In this study, the method is applied to investigate the seismic performance of large underground interchange structures on soft foundations. The approach more accurately captures the nonlinear dynamic characteristics and failure evolution of complex underground systems, thereby providing a theoretical basis and methodological guidance for seismic design and risk control of such structures.

2.2. Derivation of the Seismic Dynamic Equation Under the Influence of Traveling Wave Effects

The dynamic equilibrium equation under structurally consistent excitation, established based on D’Alembert’s principle, is expressed as shown in Equation (2):
m u ¨ ( t ) + c u ˙ ( t ) + k u ( t ) = p ( t ) = m x ¨ g ( t )
In the equation, xg represents the horizontal ground displacement caused by the earthquake. By grouping the nodes of the structural system into free nodes and supported nodes, the equation can be rewritten as follows:
m s m s b m s b T m b u ¨ s u ¨ b + c s c s b c s b T c b u ˙ s u ˙ b + k s k s b k s b T k b u s u b = p s p b
where p s is the external load acting on the free nodes of the system, which equals zero under seismic excitation; p b denotes the force applied at the supports; u ¨ , u ˙ , and u are the absolute acceleration, velocity, and displacement vectors of the non-support nodes in the global coordinate system, respectively; and u ¨ g , u ˙ g , and u g represent the ground motion acceleration, velocity, and displacement vectors in the global coordinate system.
By letting p s = 0 , the first line of Equation (3) can be expanded as follows:
m s u ¨ s + c s u ˙ s + k s u s = m s b u ¨ b c s b u ˙ b k s b u b
The absolute displacement of the structure u s can be decomposed into a quasi-static displacement w s and a quasi-dynamic displacement w d :
u s u b = w s u b + w d   0  
Substituting Equation (4) into Equation (5) and neglecting the dynamic term, the quasi-static displacement can be obtained as follows:
w s = k s 1 k s b u b = α u b
where [ α ] = [ k s ] 1 [ k s b ] is the quasi-static mode matrix. Substituting Equation (5) into Equation (6) yields the following:
m s w ¨ d + c s w ˙ d + k s w d = m s w ¨ s c s w ˙ s k s w s
Then, substituting Equation (6) into Equation (7) gives the following:
m s w ¨ d + c s w ˙ d + k s w d = m s w ¨ s c s w ˙ s m s b u ¨ b c s b u ˙ b
In Equations (4) and (6), the damping force is assumed to be proportional to the dynamic relative velocity, replacing w ˙ d   0   with u ˙ s u ˙ b , we obtain the following:
m s w ¨ d + c s w ˙ d + k s w d = m s w ¨ s m s b u ¨ b
Substituting Equation (8) into Equation (9) yields the following:
m s w ¨ d + c s w ˙ d + k s w d = m s [ α ] + m s b u ¨ b
where M s b denotes the mass contribution of the internal nodes of the structure to the ground nodes. For a lumped mass matrix, M s b = 0 , and Equation (10) can be rewritten as follows:
m s w ¨ d + c s w ˙ d + k s w d = m s [ α ] u ¨ b
Equation (11) represents the fundamental dynamic equation of a structure under multiple-support excitations, in which u ¨ b is the known ground motion acceleration vector. When only the horizontal vibration in one direction (assumed to be the x -direction) is considered, u ¨ b can be expressed as follows:
u ¨ b ( t ) = u ¨ b 1 ( t )   0   0   u ¨ b 2 ( t )   0   0     u ¨ b i ( t )   0   0     u ¨ b n ( t )   0   0 T
where u ¨ b i ( t ) is the ground acceleration at the i -th support in the x -direction, and m is the total number of support nodes. Considering the wave-propagation effect, assuming that the arrival time of the seismic wave at the first support is zero, Equation (12) can be rewritten as follows:
u ¨ b ( t ) = u ¨ b 1 ( t )   0   0   u ¨ b 2 ( t d 2 v )   0   0     u ¨ b i ( t d i v )   0   0     u ¨ b n ( t d m v )   0   0
where d i is the projection distance of the i -th support from the first support along the propagation direction of the seismic wave, and v is the apparent propagation velocity of the seismic wave.

2.3. Modification and Parameter Determination of Multilinear Adaptive Reinforcement Models

To accurately capture the nonlinear behavior of concrete under seismic cyclic loading, this study adopts the Multilinear Kinematic Hardening (KINH) model in numerical simulations to describe the stress response of structural members. The model captures the stress–strain relationship and stiffness degradation of concrete during cyclic loading by approximating material nonlinearity with multi-segment linearized yield curves. However, for underground structures subjected to strong earthquakes, the traditional KINH model often produces excessively high post-yield stiffness and inadequate hysteresis loop closure at large strain levels, thereby failing to accurately capture the energy dissipation capacity of concrete.
In ANSYS2022, the model allows the definition of up to 20 points, and the stress–strain relation at the first point must correspond to the elastic modulus. Accordingly, the first point requires appropriate adjustment. The modified model adopts a multi-segment linear hardening curve controlled by equivalent plastic strain, allowing the yield stress to vary as plastic strain increases. This more accurately represents the asymmetric behavior of concrete during compression–unloading–reloading cycles. Based on the uniaxial compression stress–strain relationship of C40 concrete, the strengthening segment intervals were redefined, and the yield stress–strain values of each segment were adjusted. These modifications improved the agreement between the model curve, the code-recommended curve, and experimental results, making the curvature changes in the yield and hardening segments more consistent with measured data. The modified KINH model thus better captures the nonlinear cumulative damage process of concrete under seismic loading, enhancing the precision and reliability of numerical simulations.

3. Project Overview

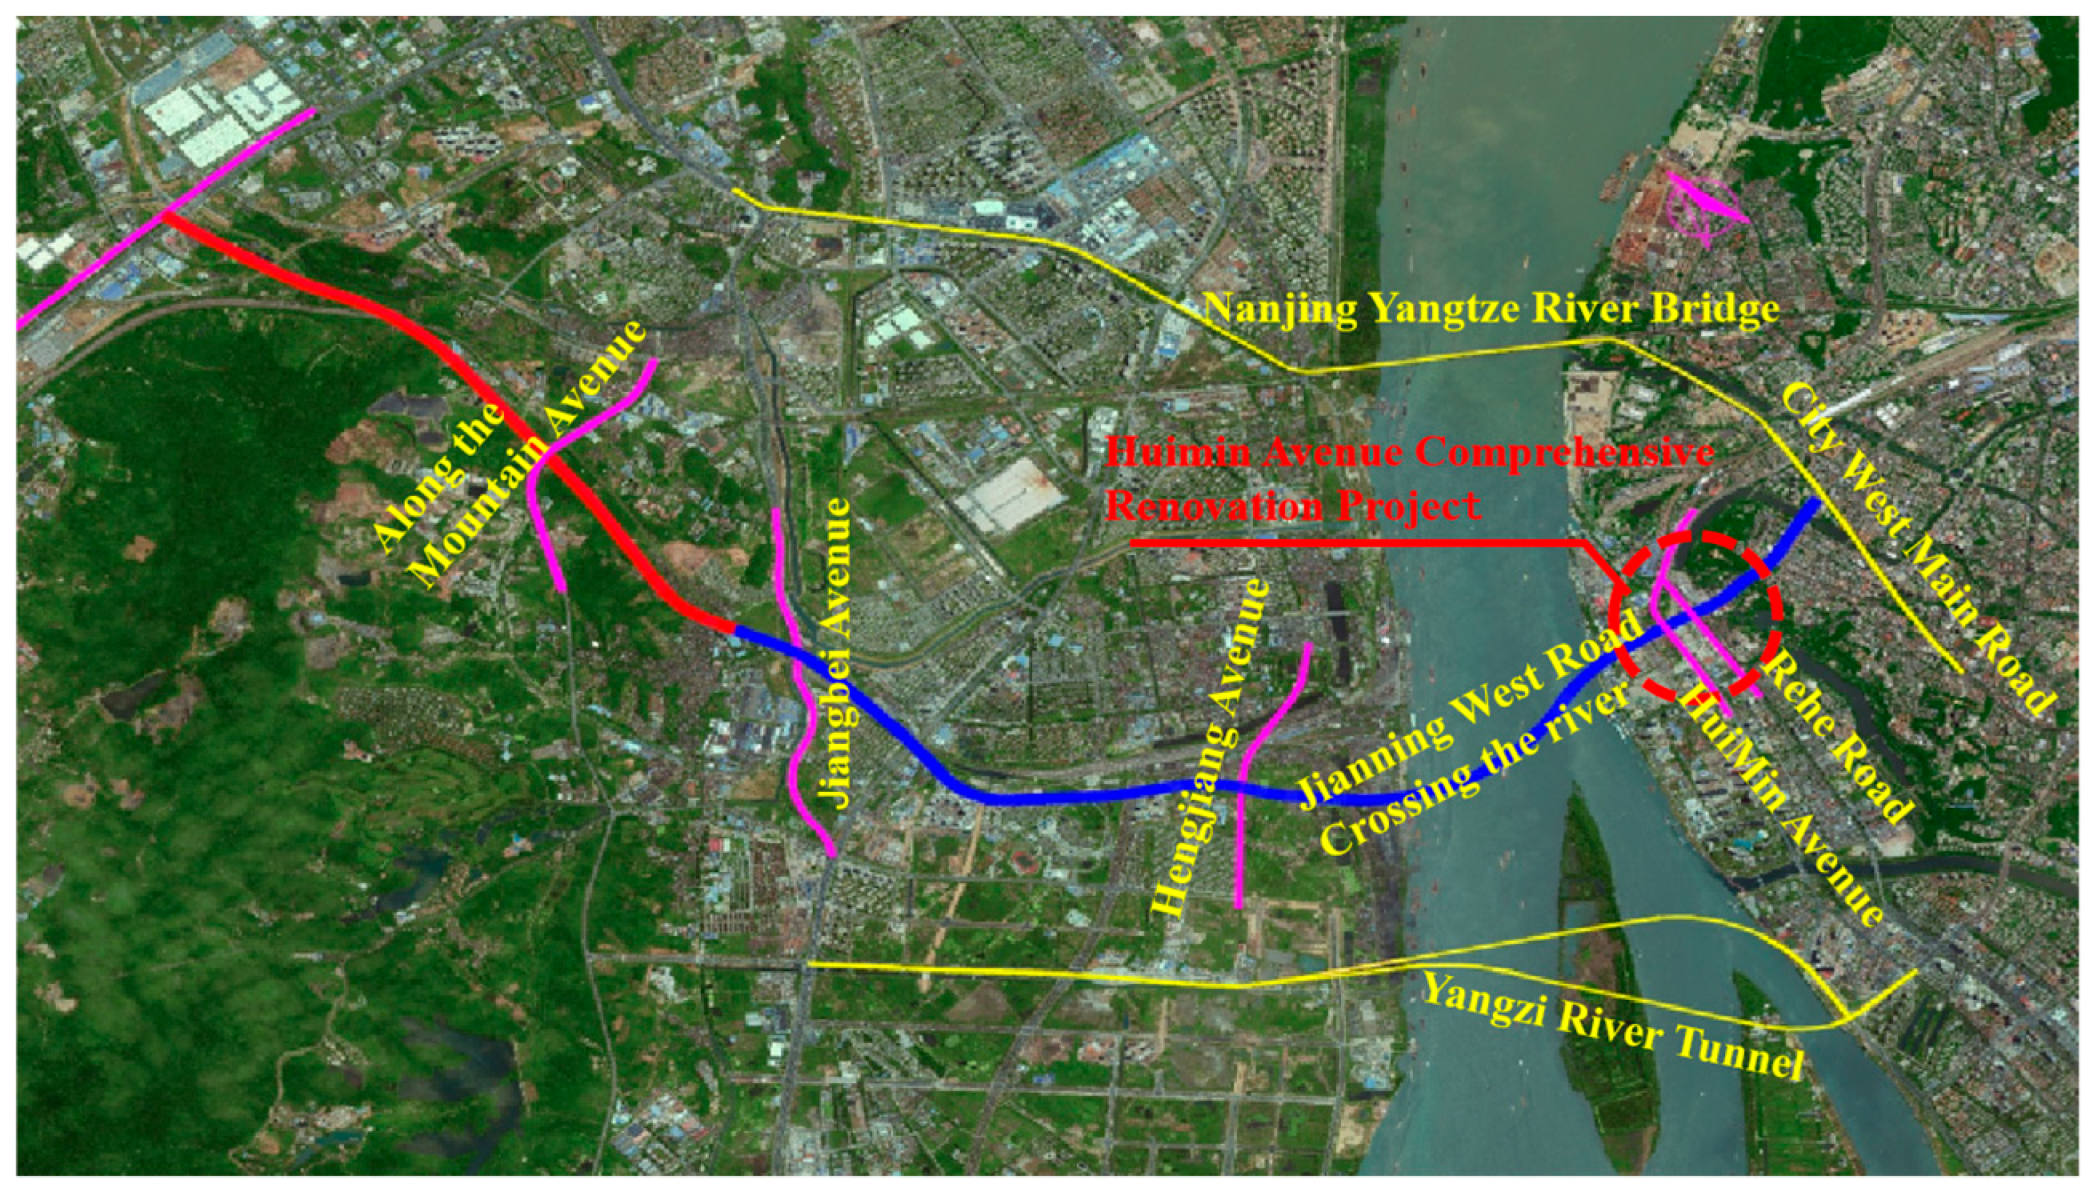
The model studied in this paper is based on the comprehensive renovation project of Huimin Avenue in Nanjing. According to research conducted by the design unit, the project involves complex renovation work, mainly including the demolition of the original old bridge and the construction of a new underground interchange tunnel and a comprehensive utility tunnel. The geographical location and rendering of the project are shown in Figure 1.
The main structure of this project is a four-level underground interchange, including the main line’s upward NU, the main line’s downward ND, B/G ramps, E/F ramps, and a comprehensive utility tunnel. The construction involves numerous three-dimensional intersections and is highly challenging. The structure has multiple floor separations and dense compartments (up to 21 box room channels), making the construction organization complex. Figure 2 shows the 3D model of the driving tunnel and the schematic diagram of the research object, Section JD-36.
As shown in Figure 2, Section JD-36 comprises 13 compartment channels, with three layers on the left and four on the right, arranged in a non-symmetrical configuration. The channel width varies across layers, with a maximum of five spans per layer, forming a multi-span, uneven-span structure. Therefore, the main structure of the Section JD-36 is an asymmetrical, multi-span, and uneven-span structure. This type of asymmetrical, multi-span, and uneven-span structure has multiple stress concentration points, which are prone to cracking and damage under seismic loads. To ensure Structure safety, vulnerability analysis and traveling wave effect response studies must be conducted on it.

4. Numerical Model

4.1. Model Parameters

ANSYS’s geotechnical material models include the M-C model, D-P model, and others. Different models have different characteristics and applications. The D-P constitutive model was selected as the soil simulation model due to its excellent applicability [28]. Based on field survey data, the soil layer parameters are shown in Table 1.
Referring to the research [27] on the damage mechanism of subway stations in the Hanshin earthquake, the study shows that Structure collapse is mainly caused by excessive compressive stress. Since the cross-section of the underground interchange structure studied in this paper is similar to that of a subway station, the concrete constitutive model in this paper only considers the compressive stress–strain relationship.
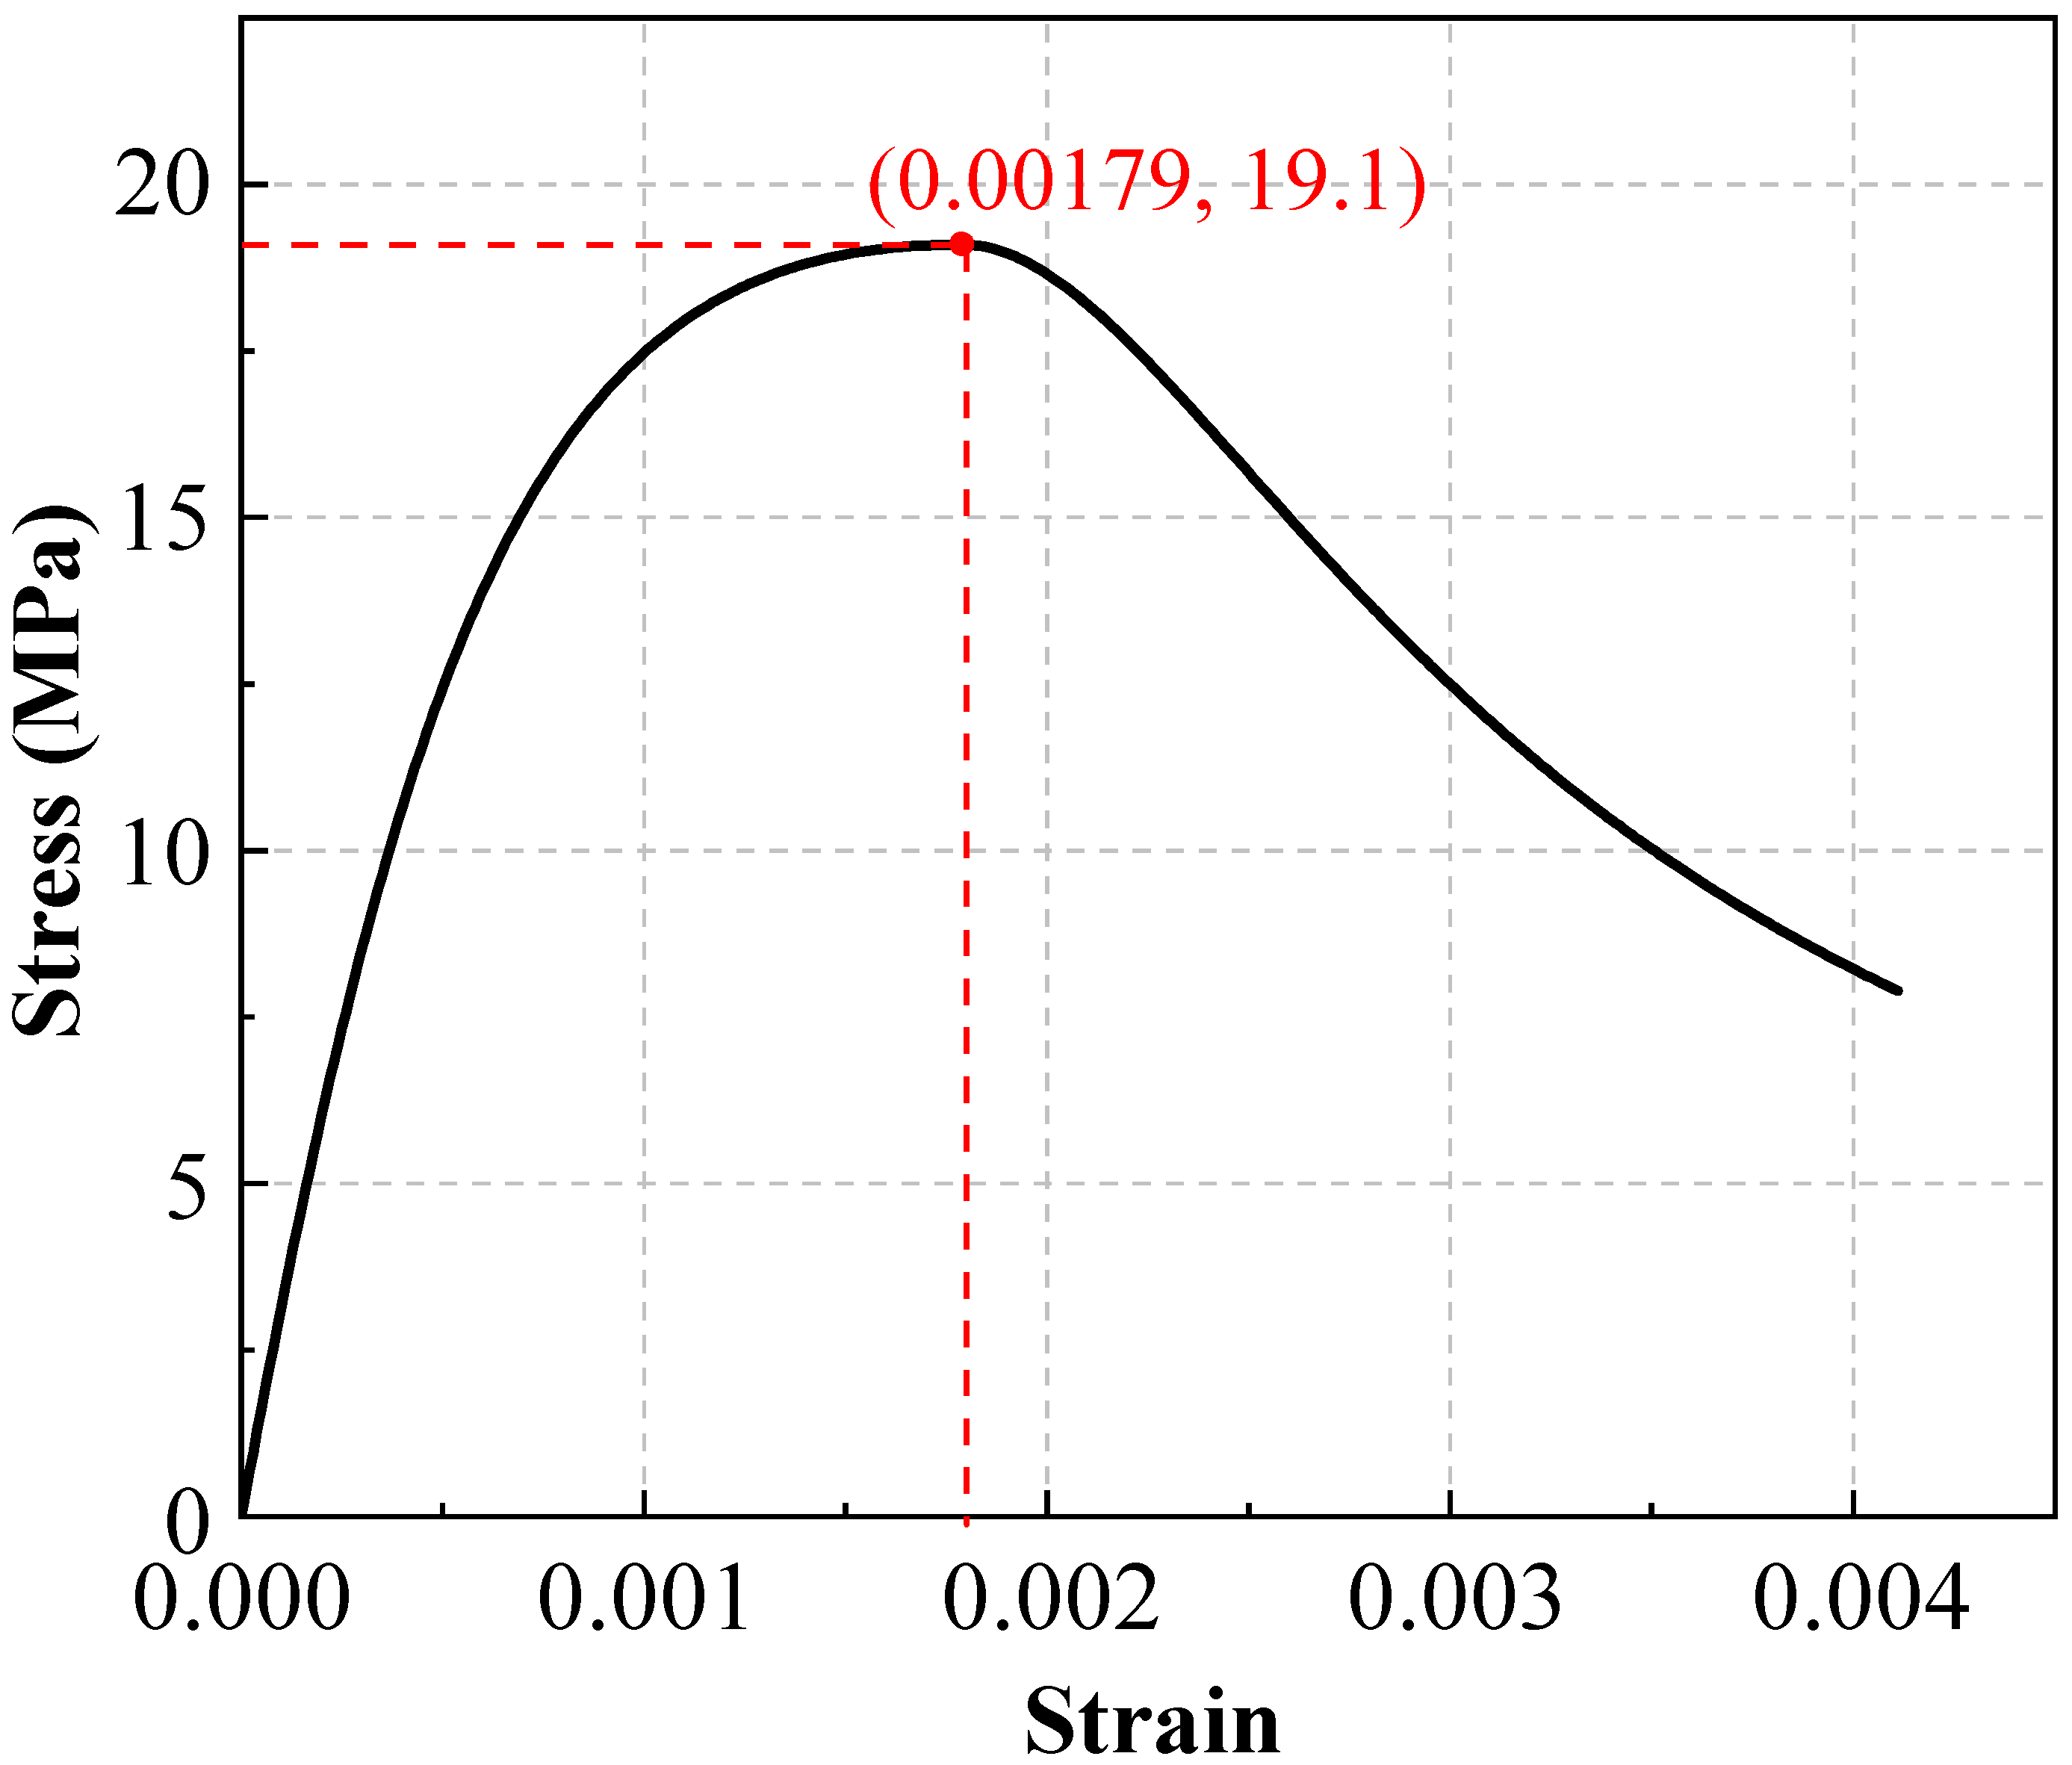
The uniaxial compression constitutive curve (Figure 3) for C40 concrete is adopted, with the following key parameters: Sc = 19.1 MPa, Ec = 32,500 MPa, εc= 1790 × 10−6, αc = 1.94.
Based on Zhang’s research [27], the multi-linear adaptive reinforcement model (KINH) was selected to define the material properties of concrete. This model requires that the initial stress–strain relationship conforms to the elastic modulus of the material. Table 2 lists the corrected data for the 20 characteristic points.

4.2. Seismic Wave

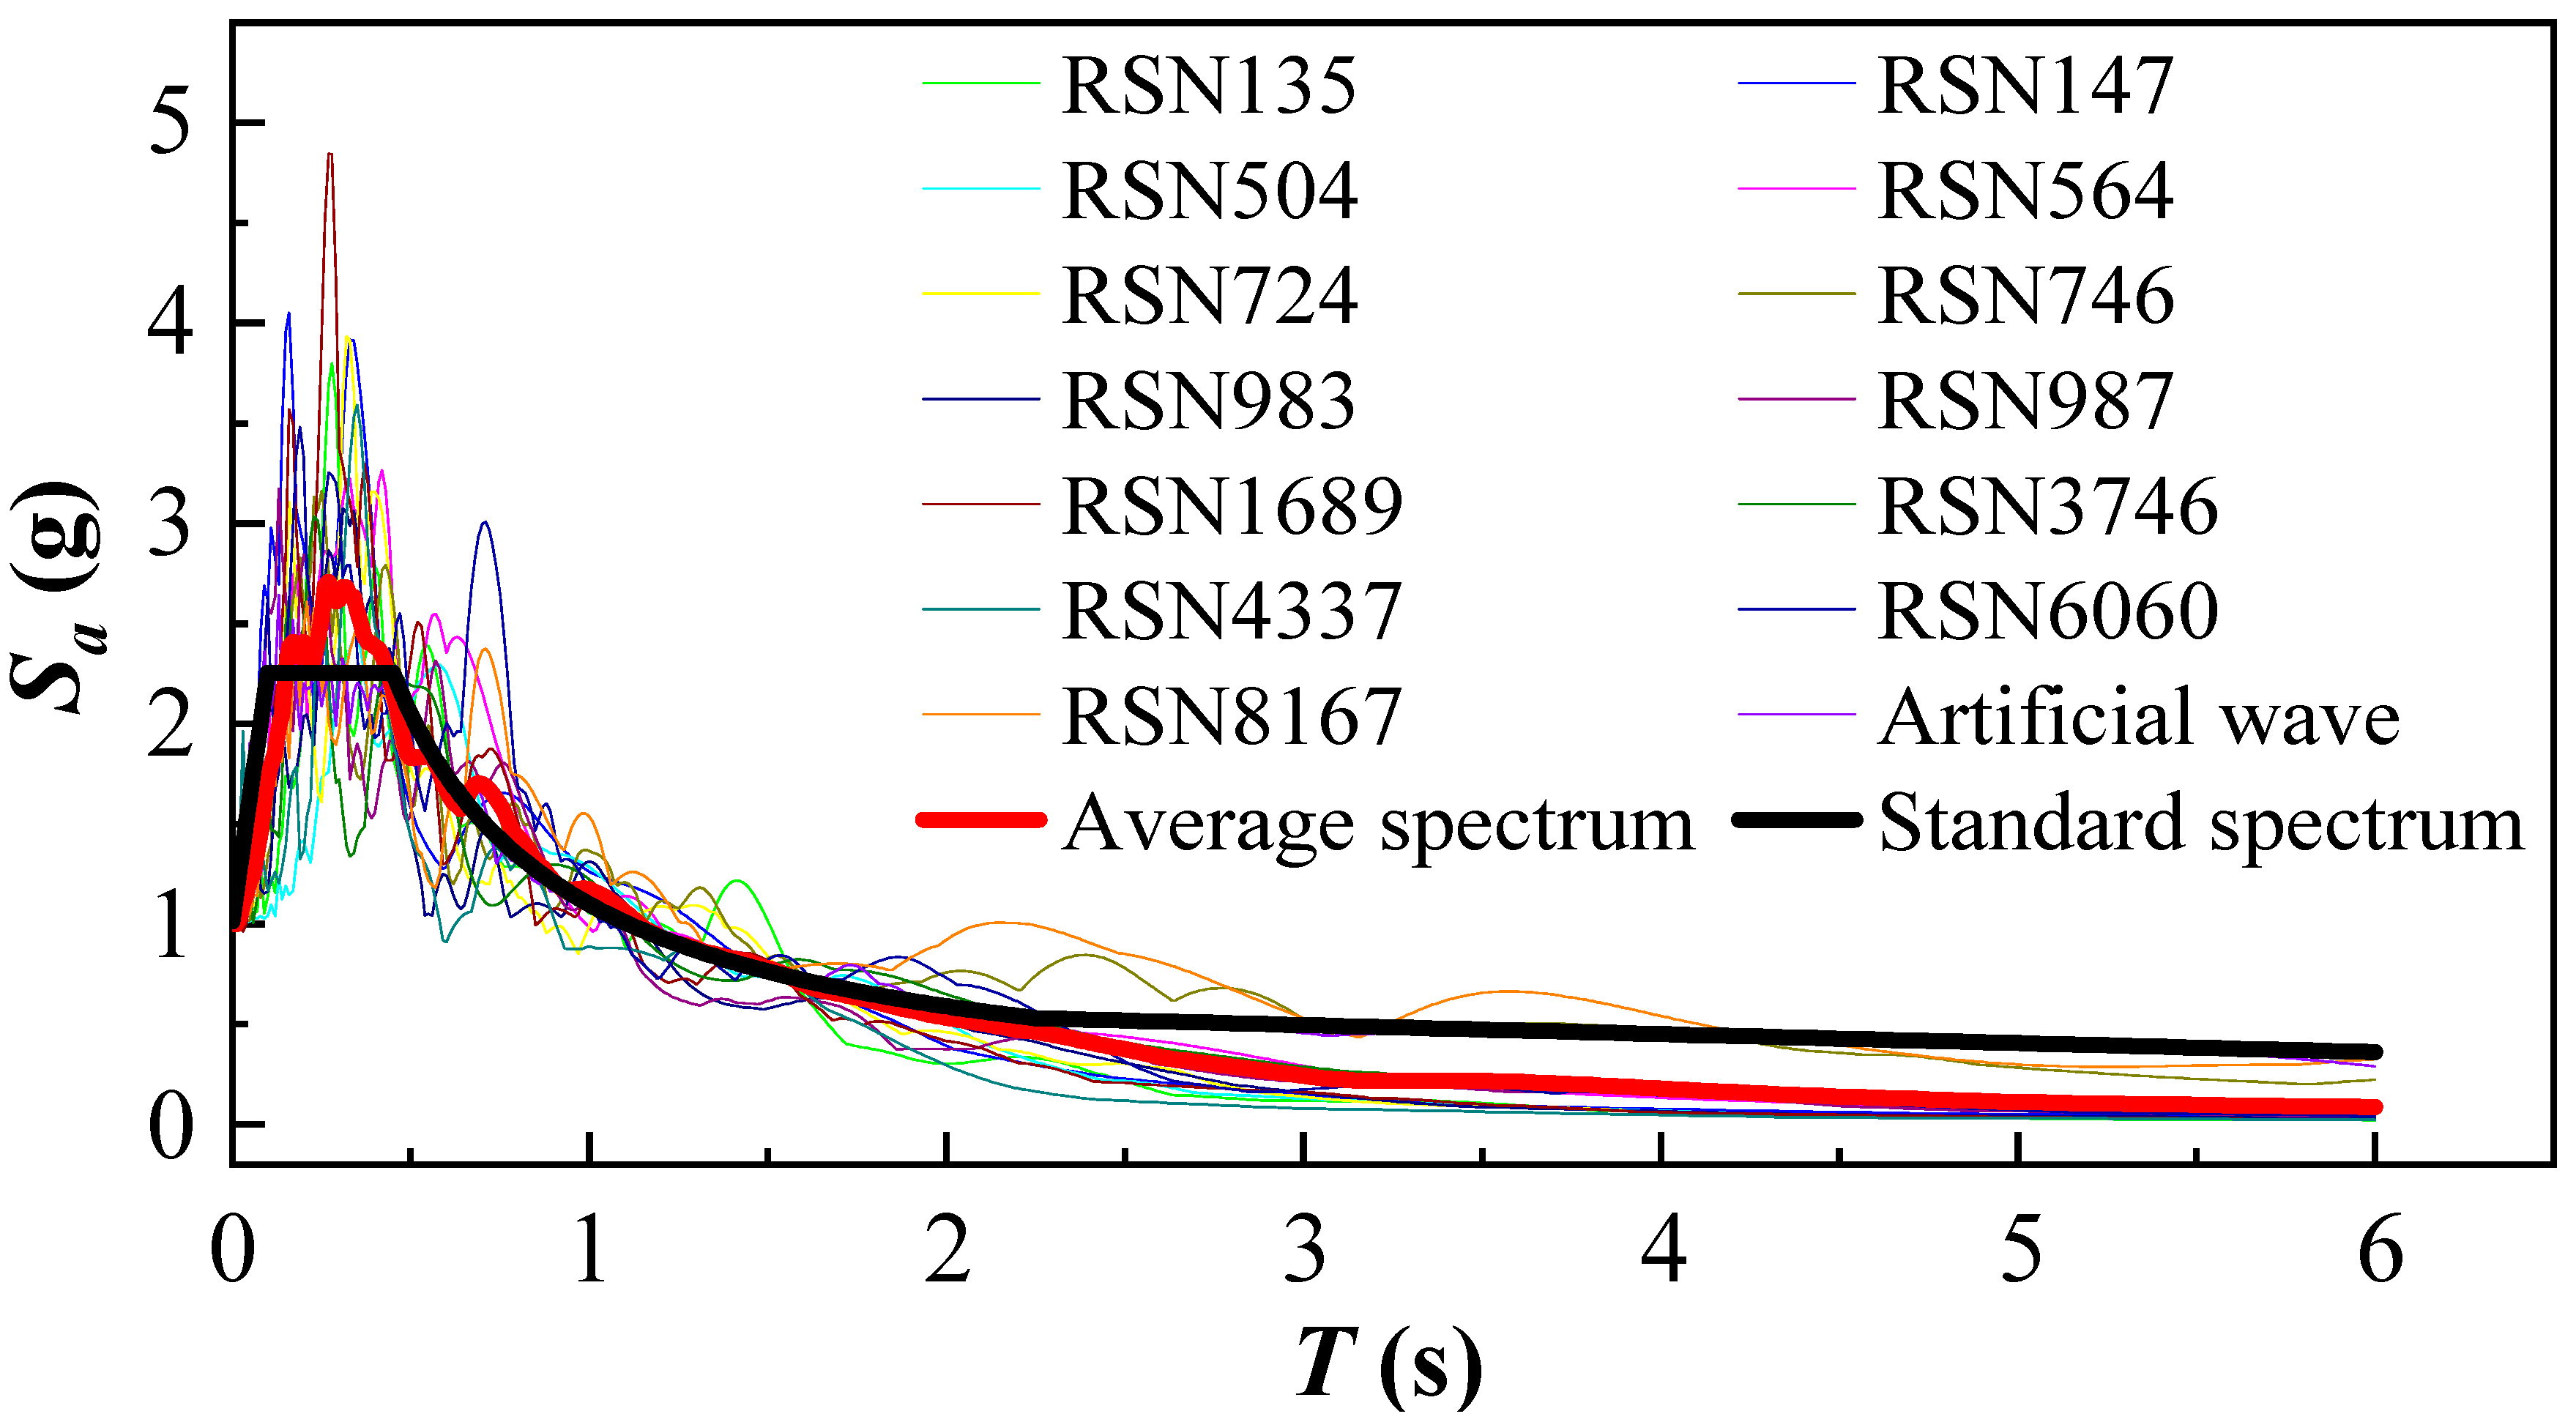
The project site is located in Xiaguan Street, Gulou District, Nanjing City, with a seismic fortification intensity of 7 degrees (0.1 g), a first-class design earthquake, and a Class III site (characteristic period of 0.45 s). As shown in Table 3, thirteen measured earthquake waves were selected from the PEER database, and one artificial wave was generated.
The acceleration response spectrum and average spectrum curve calculated based on seismic waves are shown in Figure 4.

4.3. Finite Element Model

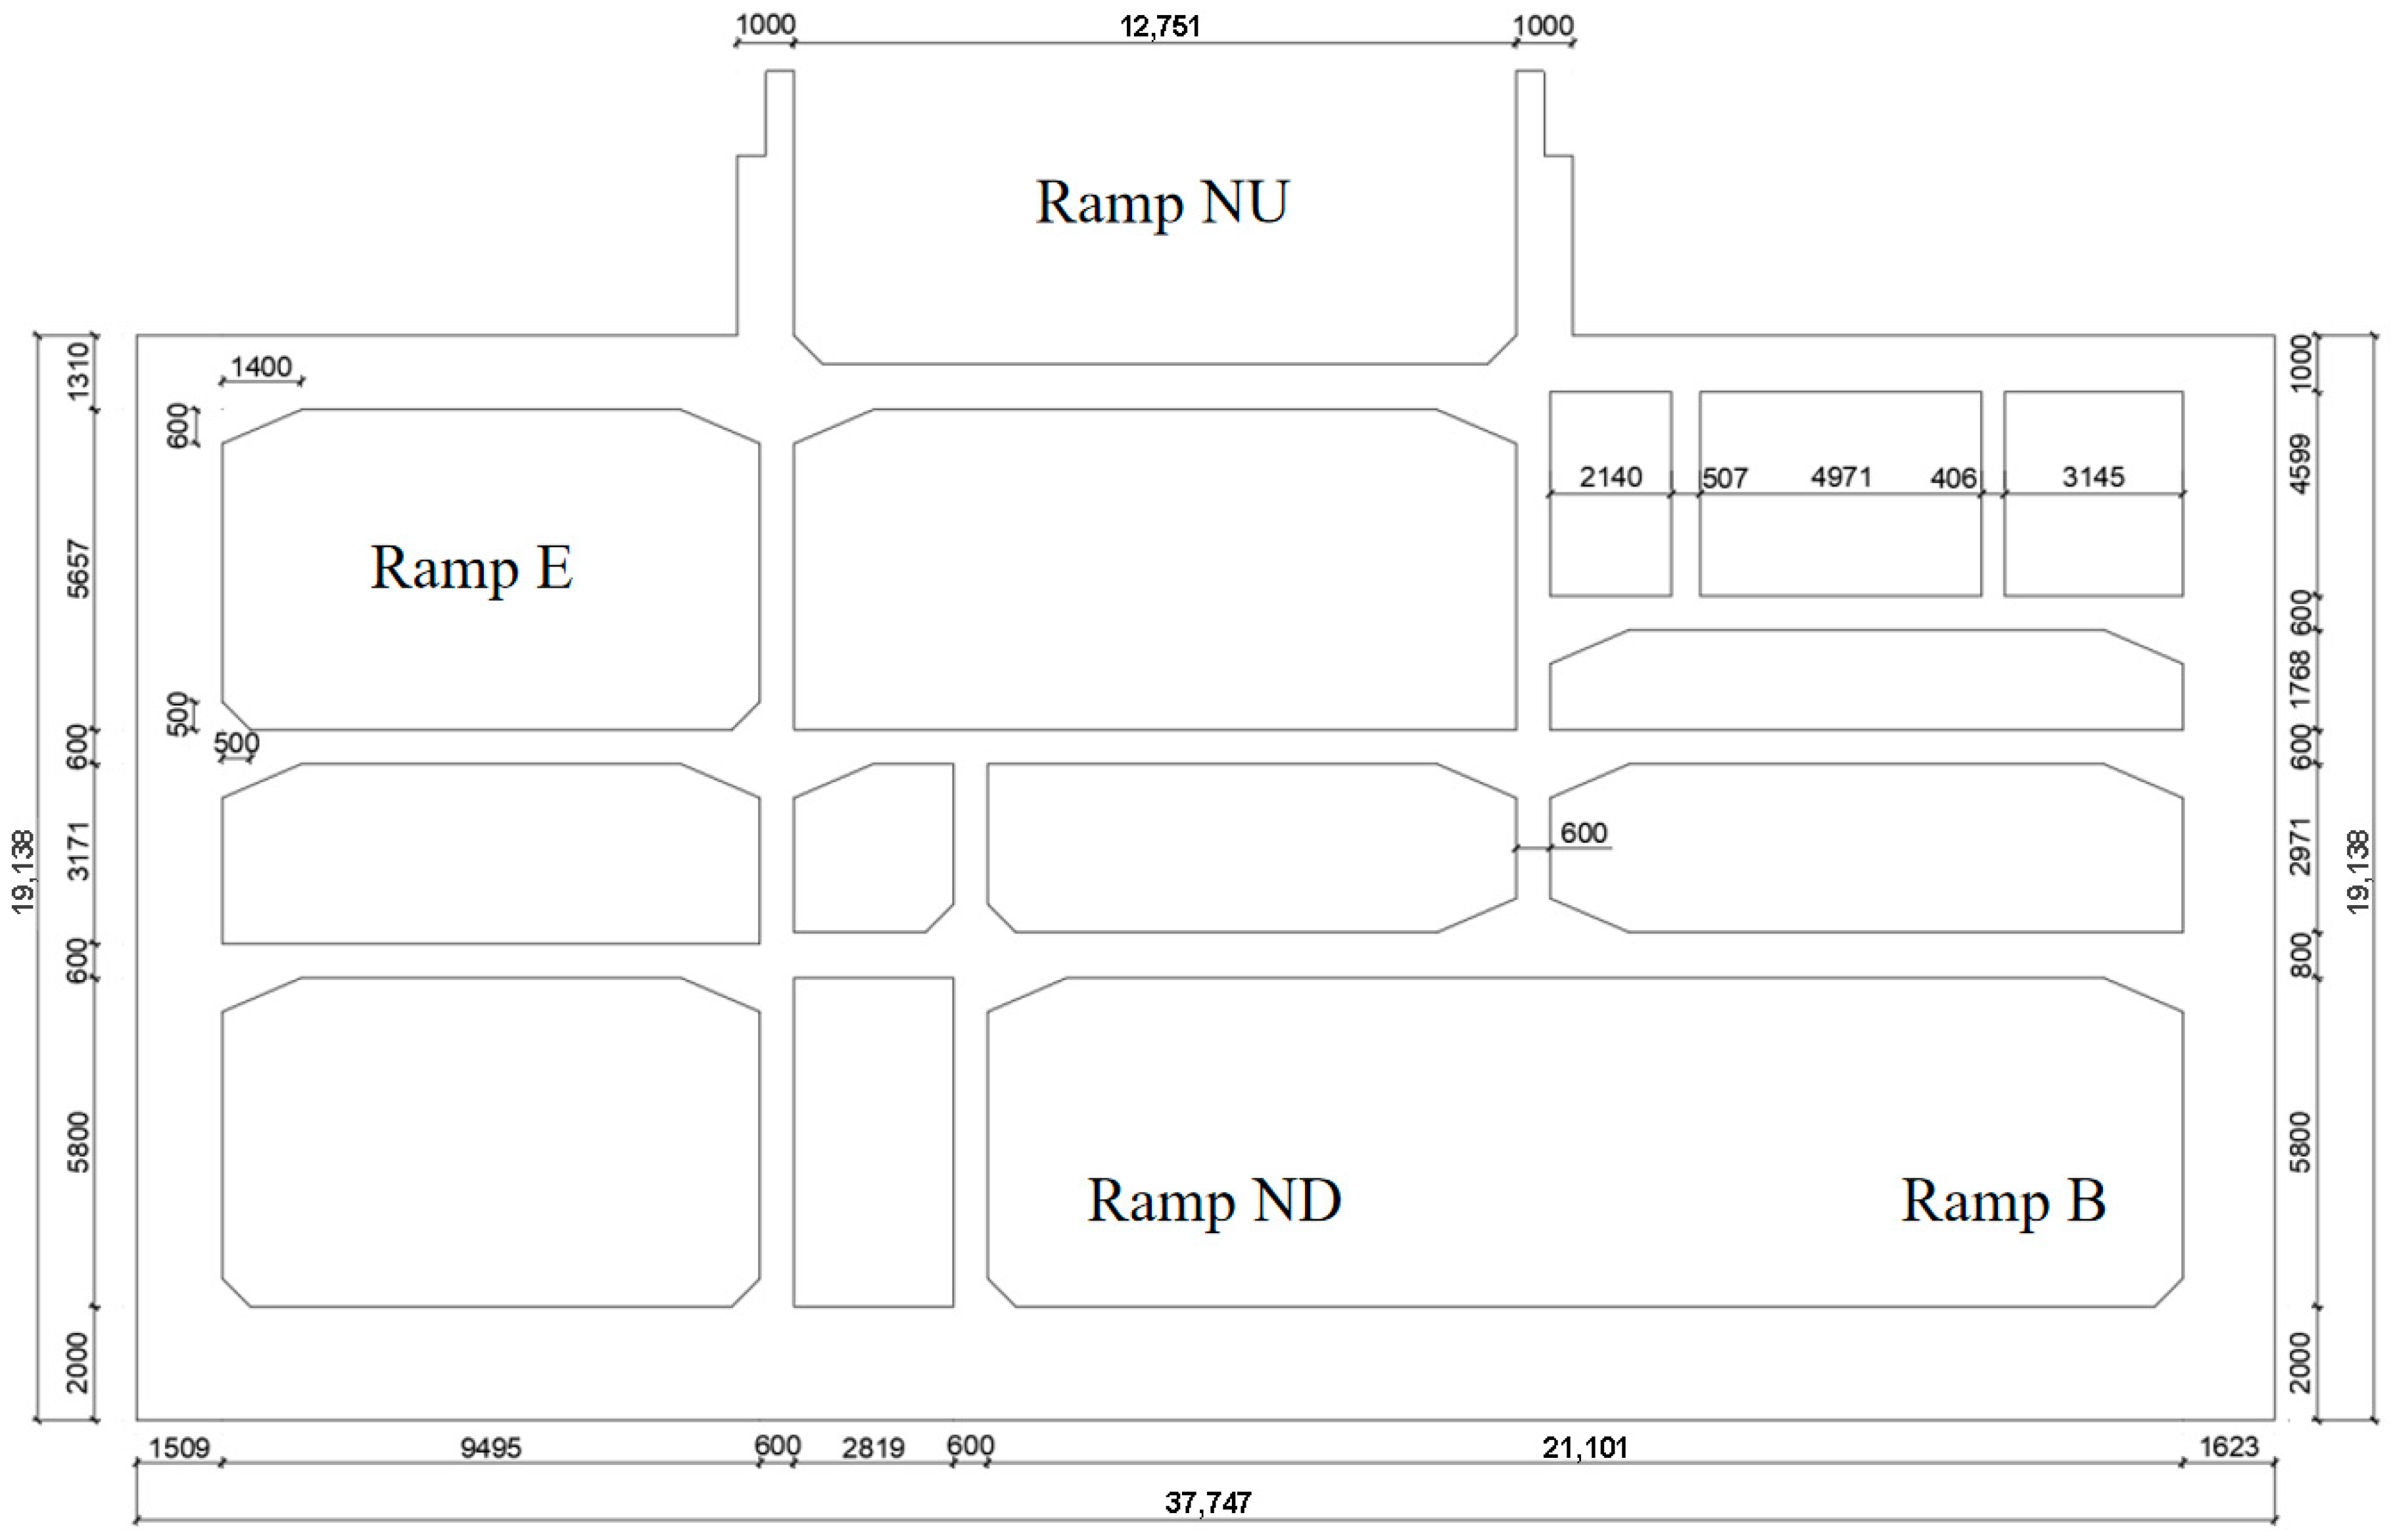
The Section JD-36 has a width of 37.747 m and a height of 19.138 m, and includes 13 channels. The specific configuration is shown in Figure 5.
In this study, a two-dimensional (2D) finite element model was adopted instead of a three-dimensional (3D) model to simulate the seismic response of the underground interchange structure. Although a 3D model can theoretically capture the full spatial interaction and torsional effects, it requires extremely high computational cost due to the large geometric scale, complex boundary conditions, and numerous nonlinear soil–structure interfaces. More importantly, the underground interchange investigated in this study extends continuously along its longitudinal direction with nearly uniform cross-sectional characteristics, allowing its dominant deformation behavior to be reasonably approximated as a plane strain problem. Thus, the adoption of a 2D model is not merely a simplification for efficiency, but a rational choice that captures the primary transverse deformation and stress distribution under seismic loading. Nevertheless, it is acknowledged that 2D analysis cannot fully represent torsional or longitudinal effects; a full 3D analysis would be required to capture these behaviors and will be considered in future studies.
A two-dimensional model with dimensions of 200 m (width) × 61.2 m (height) was established using the PLANE82 element, as shown in Figure 6a. The soil was modeled using the D-P constitutive model, and the structure was modeled using the KINH model. In accordance with the requirements of wave theory [29], the element size was controlled to be less than 2 m (1/4–1/8 of the wavelength). The soil and structure are connected using a common-node approach, and mesh refinement is applied in the surrounding area of the structure. The soil and structure are connected using a common-node approach. It should be clarified that, although this method enforces displacement compatibility and thus incorporates a simplified form of soil–structure interaction (SSI), only a rigid ground–structure connection is considered. Nonlinear interface phenomena such as slippage, gapping, contact separation, and other complex SSI effects are not included. This assumption is consistent with the objective of this study, which focuses on the internal force variation in the structure rather than on detailed soil–structure interaction mechanisms.
For studies requiring more sophisticated contact modeling or deeper investigation of wave propagation effects, the nonlinear SSI framework proposed by Diao et al. [30], which accounts for multi-point non-uniform seismic inputs, can be adopted in future work. Considering the characteristics of this multi-span asymmetric structure, all intersection nodes of the structure are selected as monitoring points, and the mesh division and numbering scheme are shown in Figure 6b.

5. Structure Vulnerability Analysis

5.1. Structure Damage Analysis

Based on the consistent input analysis of RSN983 seismic motion, the evolution law of the structure damage under seismic intensities of 0.1 g to 0.8 g was studied (Figure 7).
The development of damage exhibits a distinct three-stage characteristic. Under low-intensity ground motion (0.1 g to 0.2 g), the overall structure remains largely intact, with minor damage occurring in localized areas. The damage is primarily concentrated on the side walls, the bottom of the central wall, and near monitoring points #7, #8, #12, and #13. Under moderate-intensity earthquakes (0.3 g to 0.5 g), the damage area significantly expands, forming distinct plastic hinges at critical nodes. Moderate damage occurs in some areas (such as the structure base plate and right side wall), but overall stability remains relatively good. Under high-intensity earthquakes (0.6 g to 0.8 g), the damage area continues to expand, with critical components experiencing severe plastic deformation. The weak points of the underground interchange structure (the frame structure formed by monitoring points #7, #8, #12, and #13 and the bottom of the right-side wall) are severely damaged, potentially leading to structure failure. Damage intensifies at earthquake intensities of moderate strength or higher. At an earthquake intensity of 0.1 g, the maximum plastic strain of the structure is 2.77 × 10⁻⁵. When the earthquake intensity increases to 0.8 g, the maximum plastic strain of the structure is 4.29 × 10⁻⁴, approximately 15.5 times that at 0.1 g.
The damage exhibits progressive expansion centered on key nodes, with significant nonlinear characteristics. It is recommended that weak areas (bottom of side walls, beam end nodes, bottom plate) be reinforced.

5.2. Determination of Vulnerability Indicators

Based on existing research [27,31,32], the seismic performance of underground interchange structures is classified into four grades (Table 4).
Based on the characteristics of Section JD-36 and referring to the research [32] the inter-story drift angle was selected as the damage metric (DM), and corresponding quantification standards were established (Table 5).
In terms of selecting intensity indicators, this study comprehensively considered the research conclusions of Wang [33] and Chen et al. [34], and others. Given that PGA (peak ground acceleration) has good computational stability for shallow underground structures, this study used PGA as the seismic intensity indicator (IM).

5.3. Earthquake Probability Demand Analysis

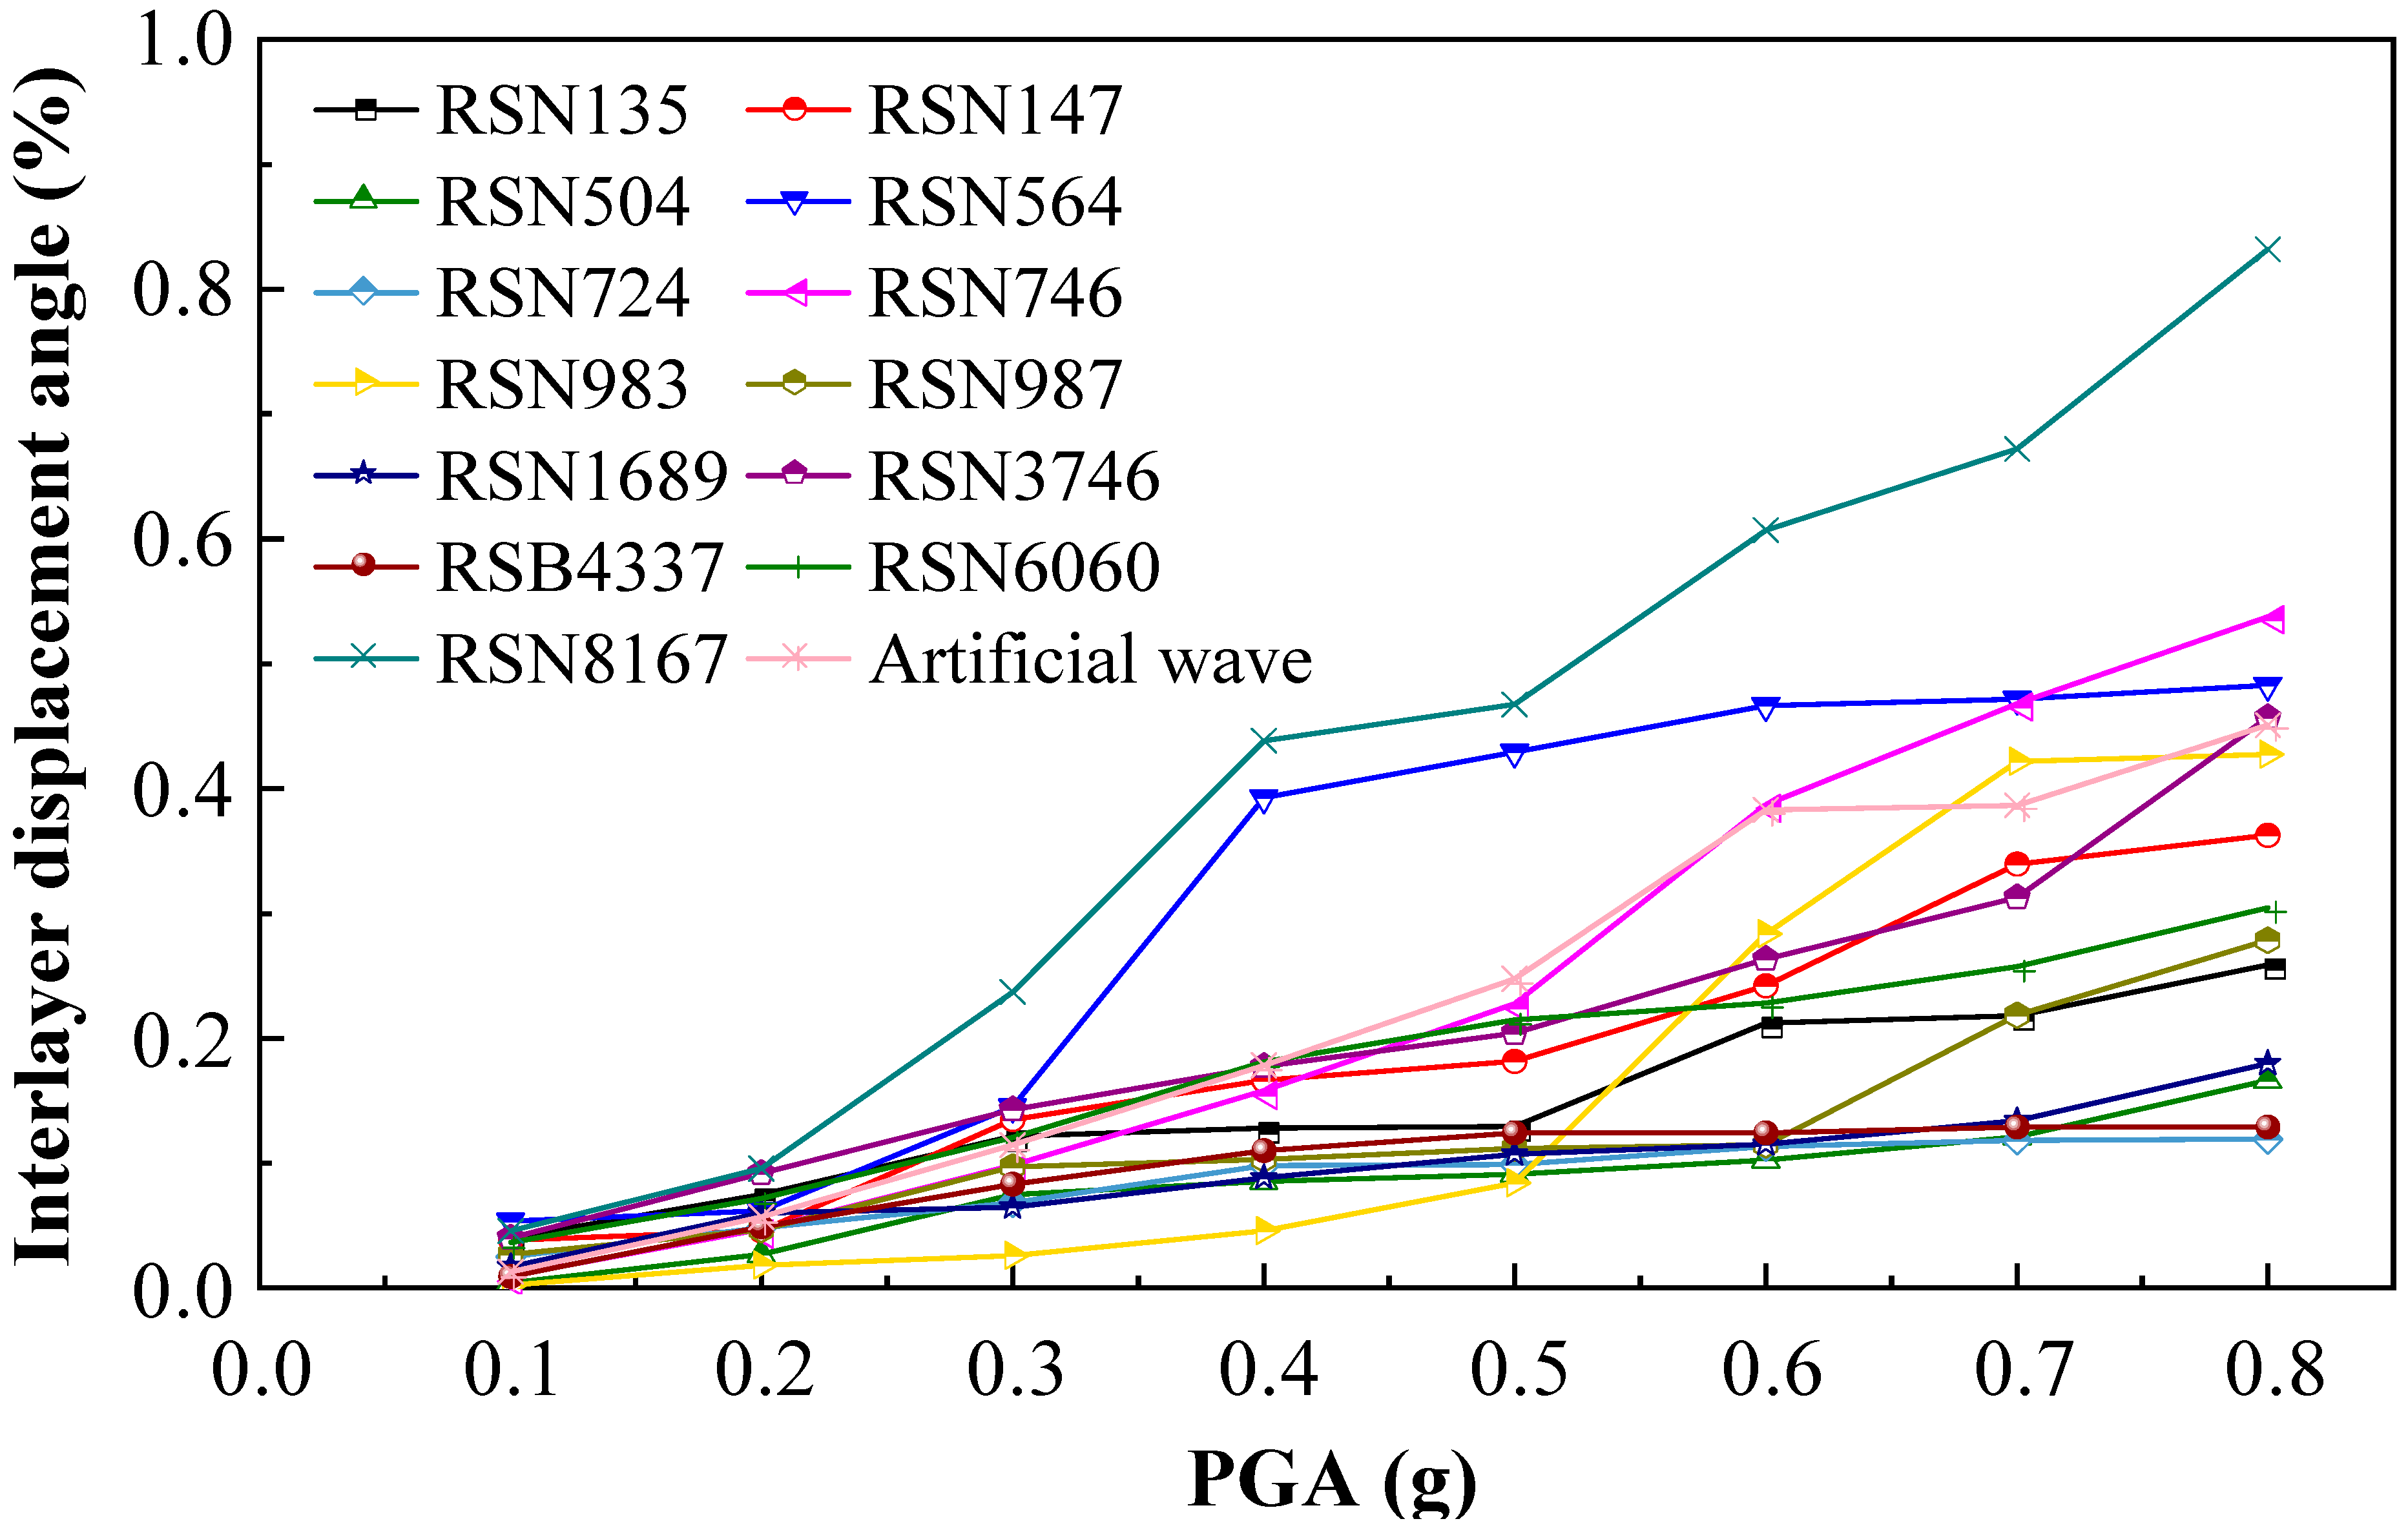
This study selected 13 natural seismic waves and 1 artificial wave, adjusting their peak accelerations to 8 levels within the range of 0.1 to 0.8 g. Through nonlinear dynamic time history analysis of the Section JD-36, structure response data was obtained with PGA as the variable. Figure 8 shows the analysis results with maximum understory displacement angle (DM) and PGA (IM) as parameters.
The analysis results indicate that the interlayer displacement angle response range is significant, with a minimum value of 0.00237944 (RSN983, 0.1 g) with a maximum value of 0.831742787 (RSN8167, 0.8 g). The displacement angle increases with increasing PGA, but there are notable differences in response to different seismic waves. At low PGA (0.1 to 0.3 g), the increase is approximately linear, while at high PGA (≥0.4 g), it exhibits significant nonlinear characteristics. RSN8167 and RSN564 exhibit greater destructive potential.
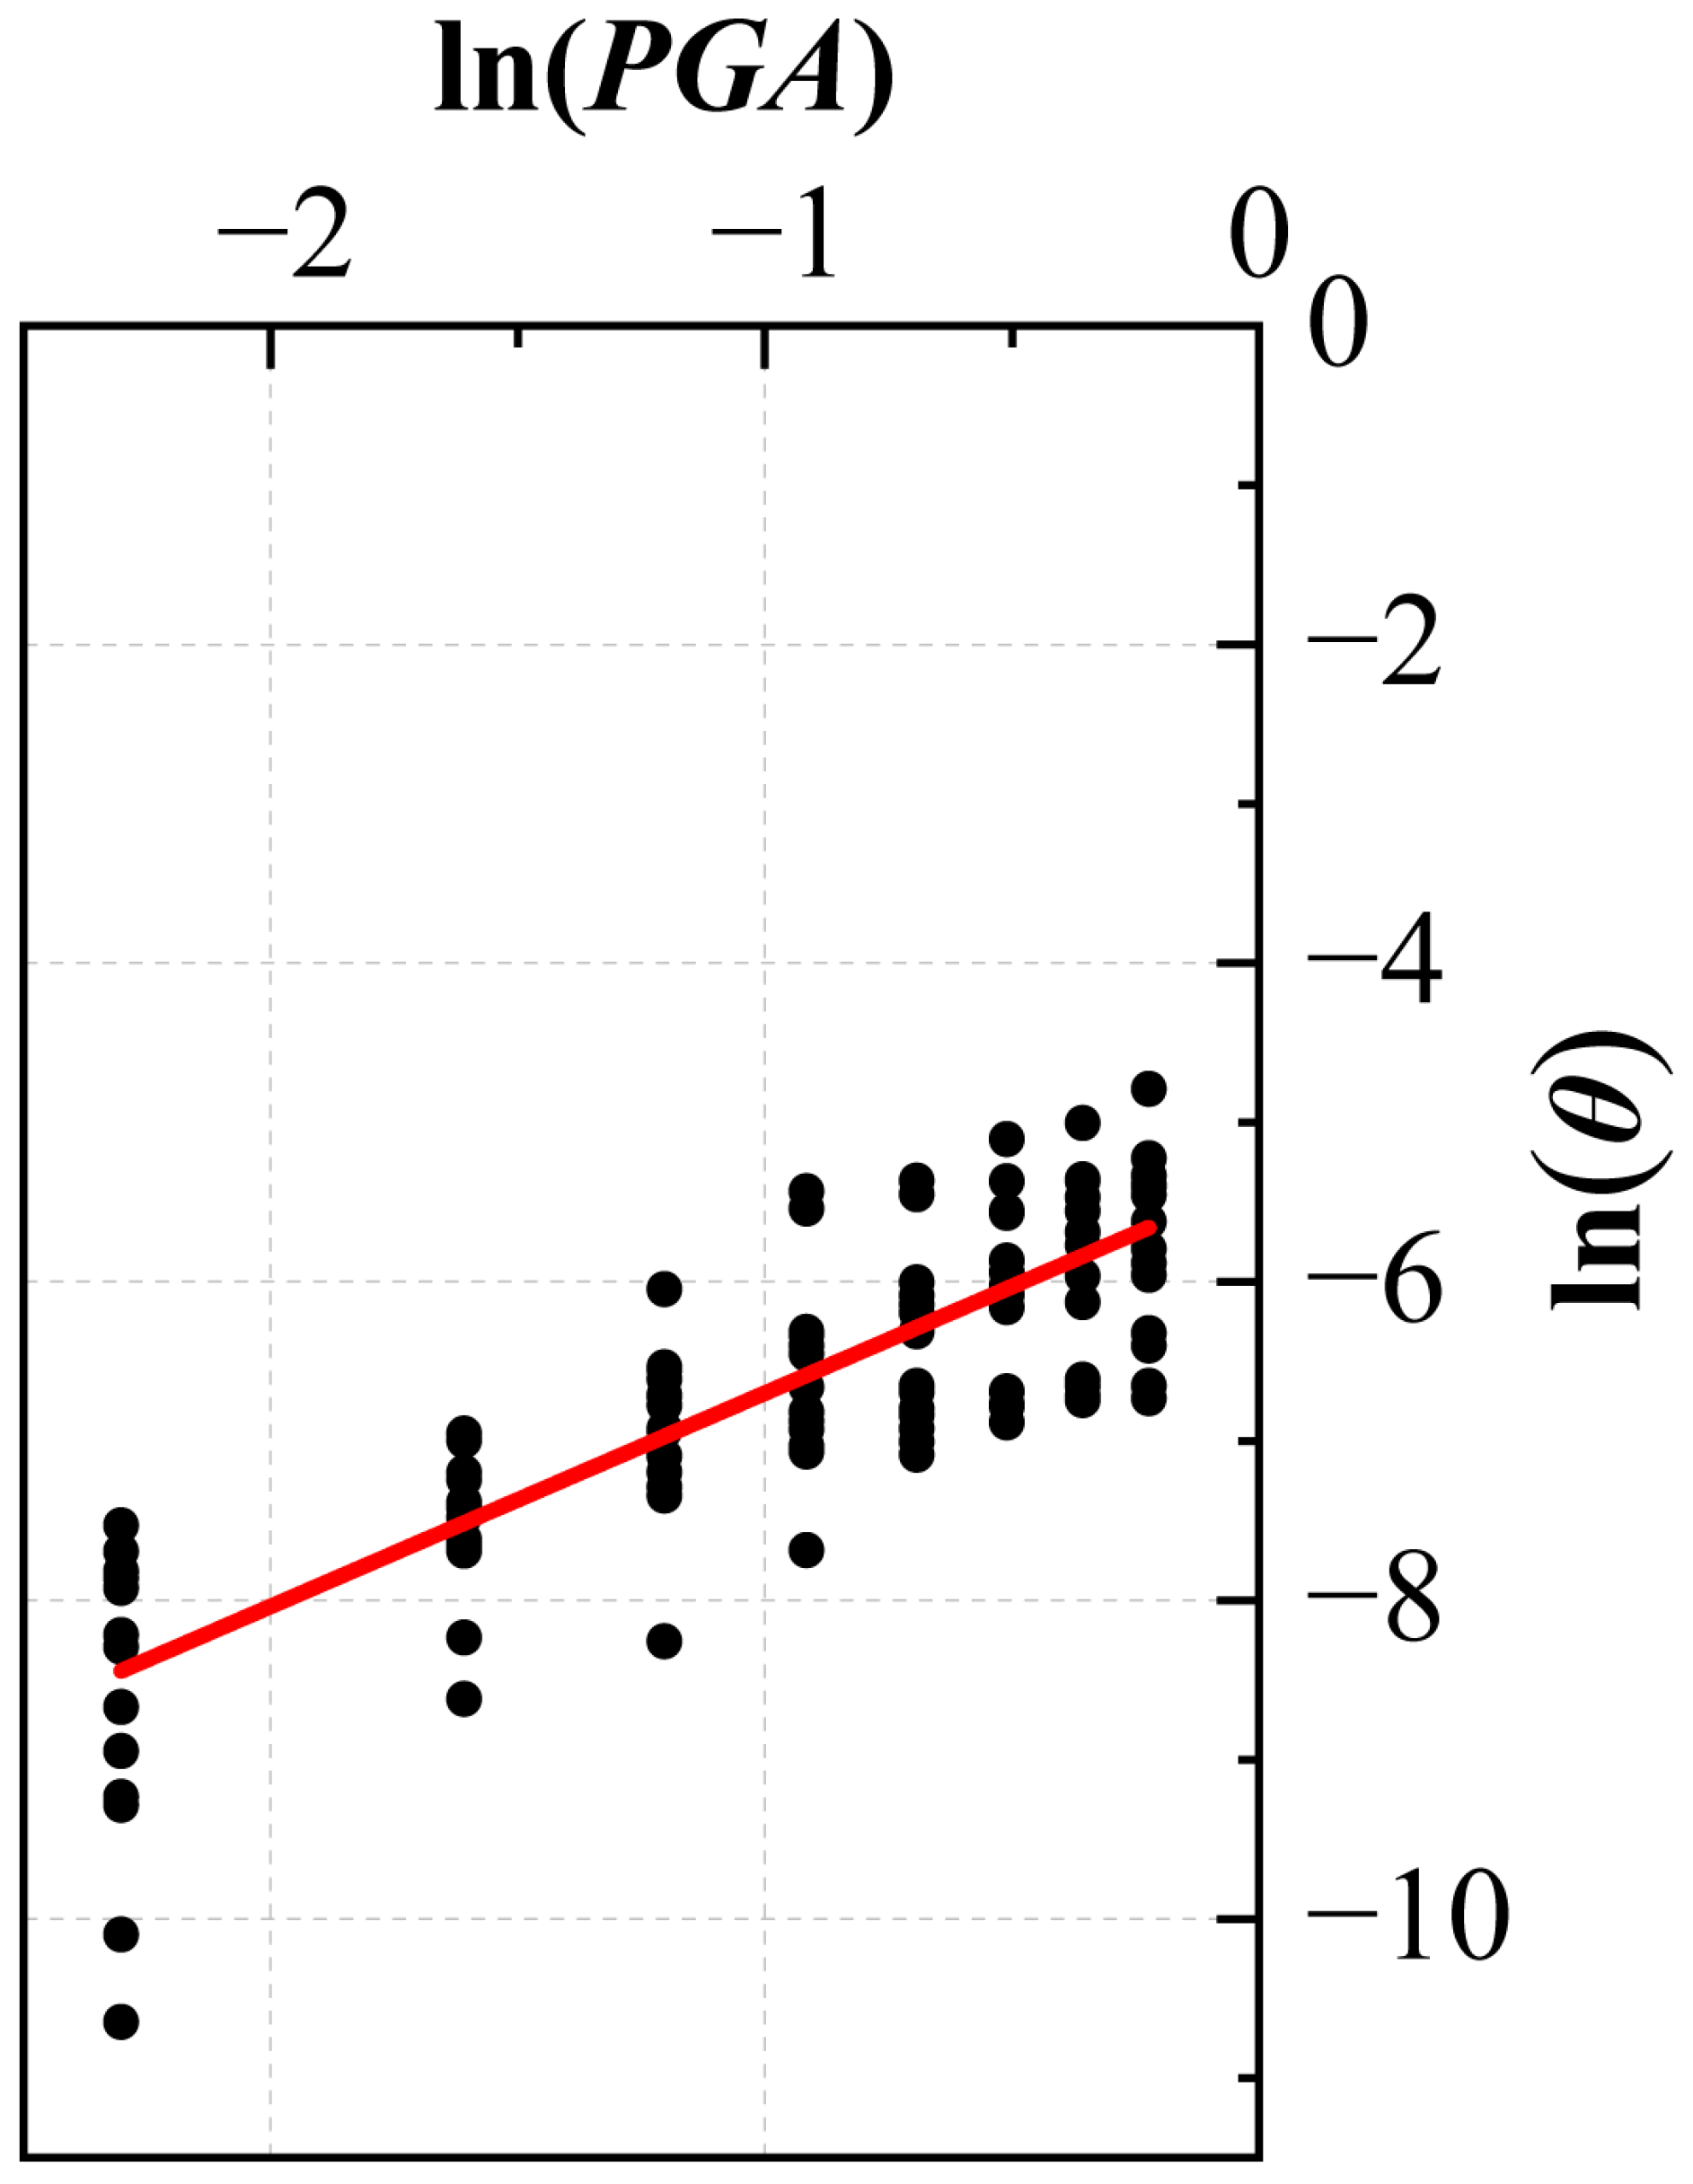
When performing incremental dynamic analysis, due to the large dispersion of the obtained inter-story displacement angle data, it is necessary to fit the data. Substituting the seismic intensity index (PGA) and structure damage index (inter-story displacement angle θ) selected in this section, we obtain:
θ = a ( P G A ) b
Taking the logarithm on both sides:
ln ( θ ) = a ln ( P G A ) + b
According to Equation (15), the interlayer displacement angle data was fitted, and the results are shown in Figure 9. The coefficients a = 1.33907, b = −5.36045. Therefore, the linear regression equation under seismic motion is
ln ( θ ) = 1.33907 ln ( P G A ) 5.36045

5.4. Structure Vulnerability

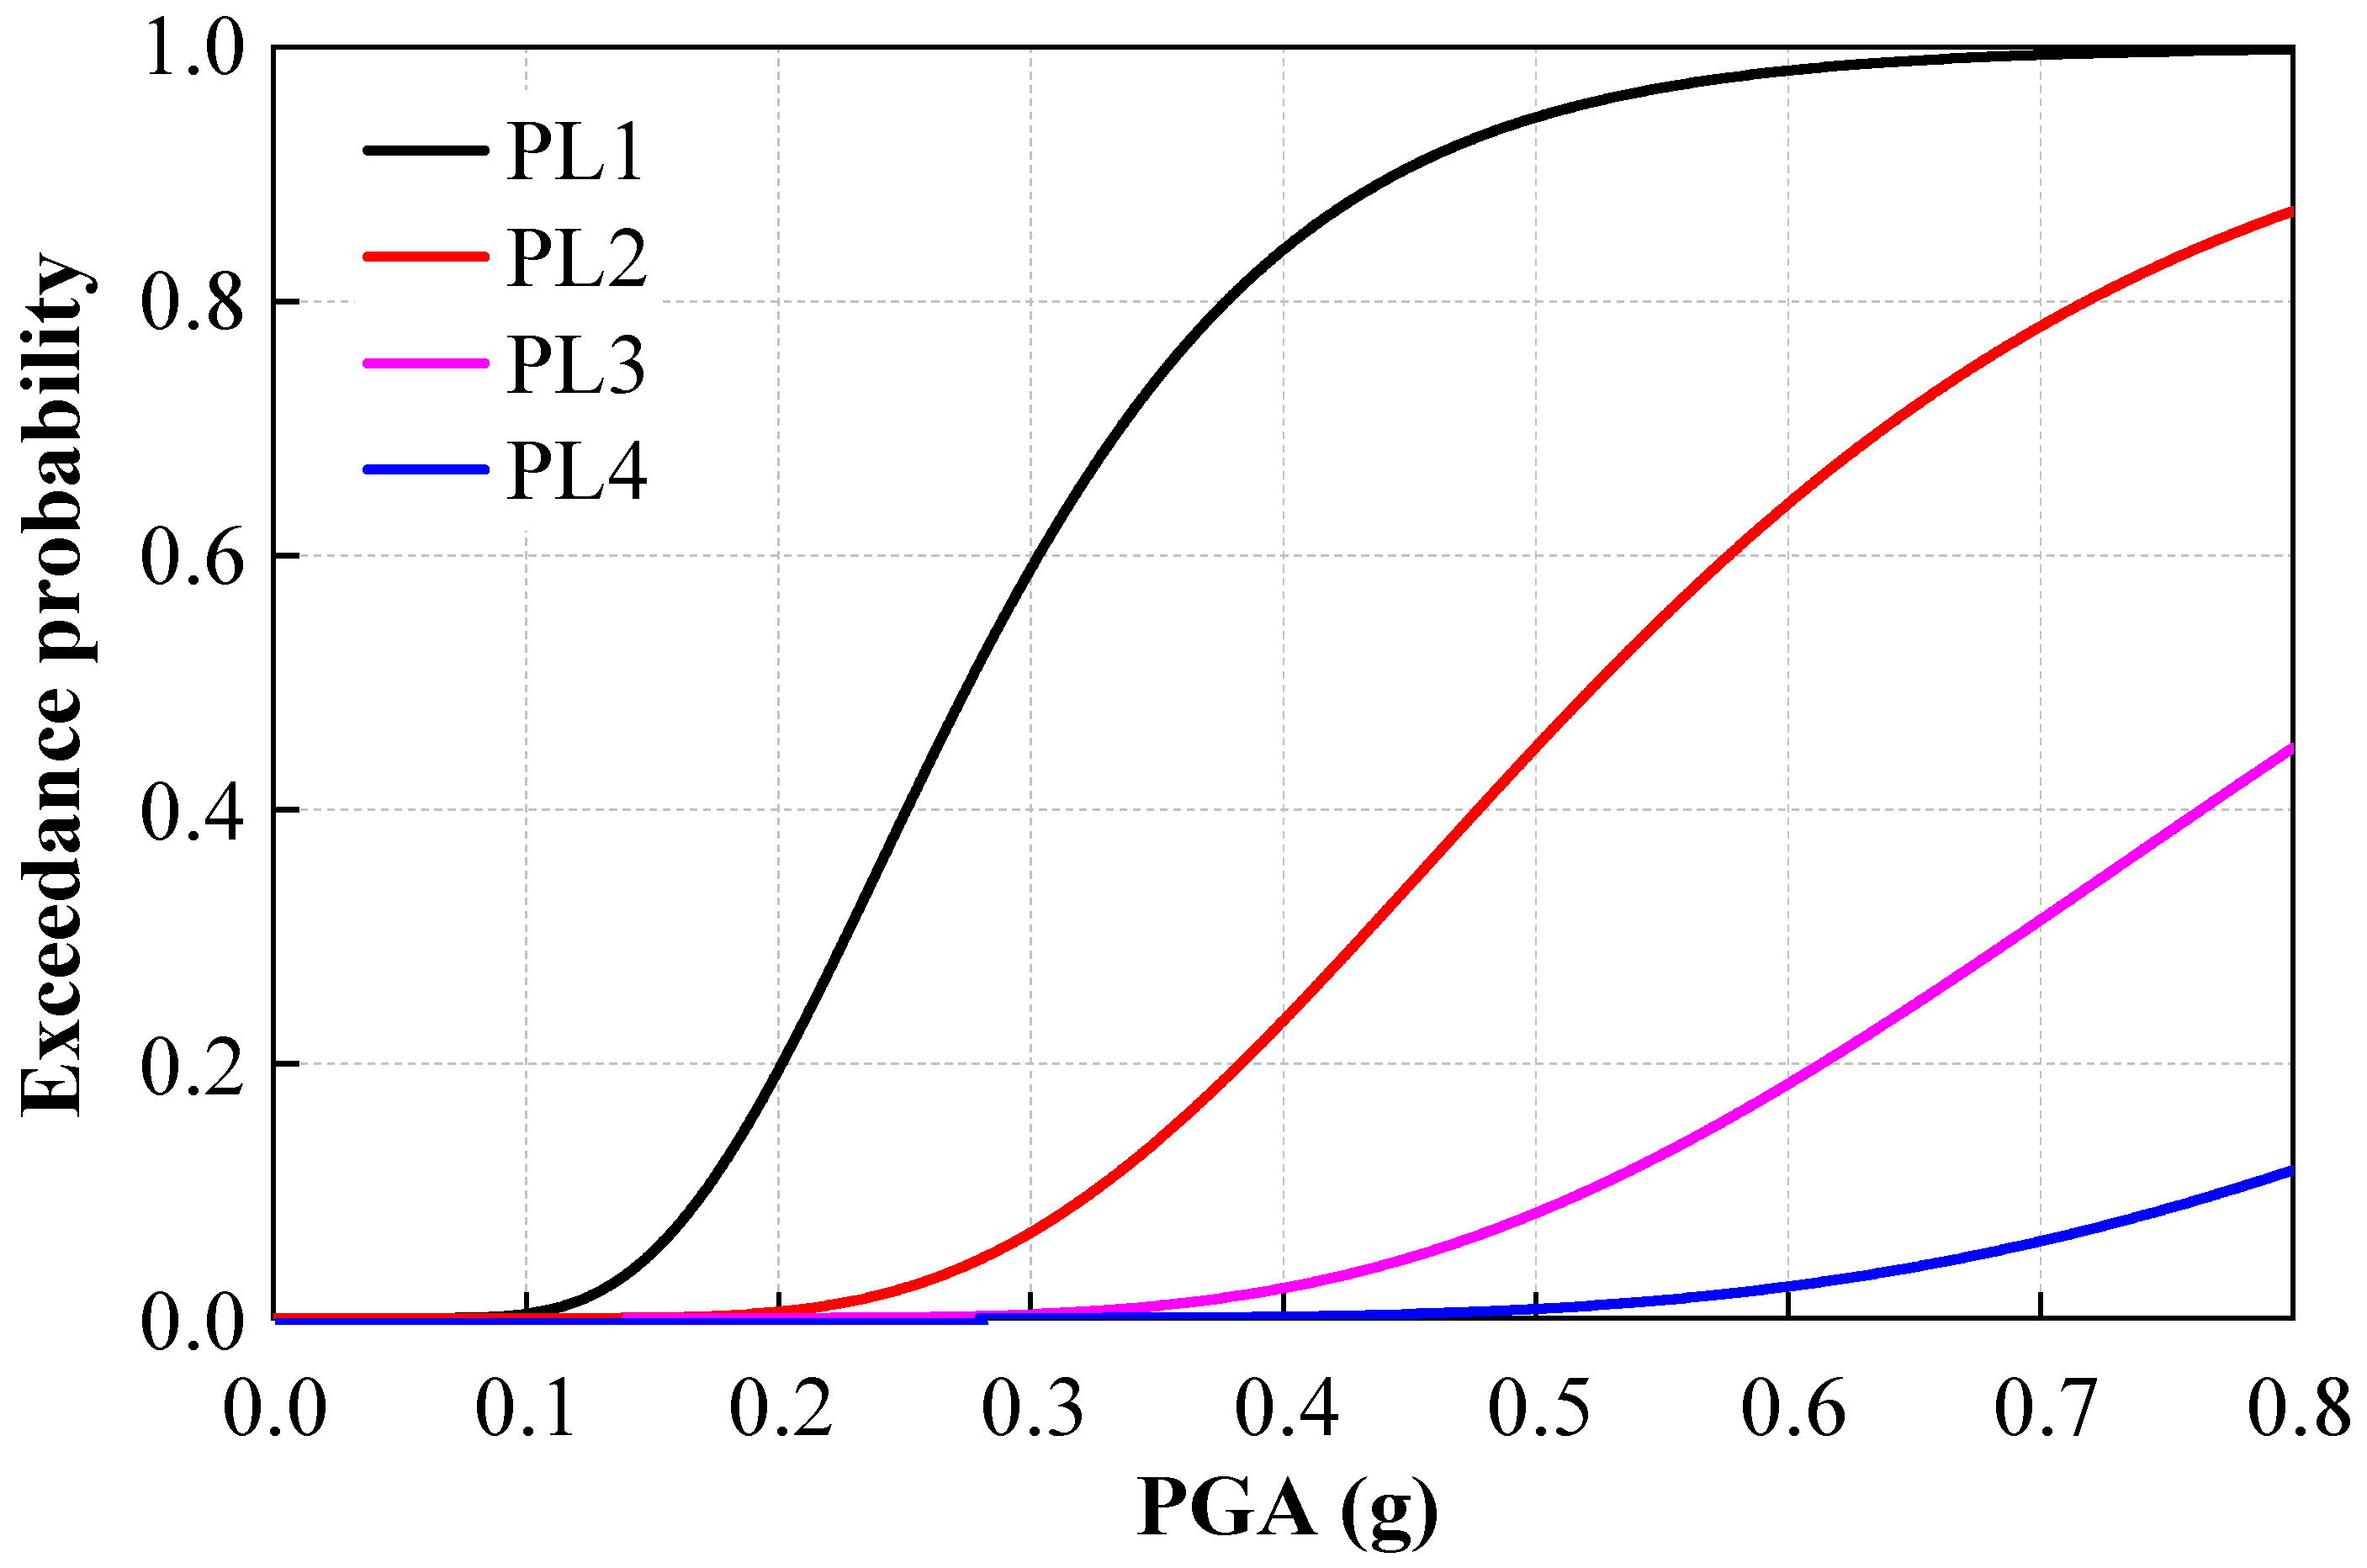
Based on the probability demand analysis structure, combined with Equation (1), the probability of the structure exceeding four performance levels under different seismic intensities is obtained, and a vulnerability curve is plotted, as shown in Figure 10.
Figure 10 indicates that as the peak ground acceleration (PGA) increases from 0.1 to 0.8 g, the probability of exceeding each performance level of the structure increases monotonically. When PGA = 0.1 g, the probability of exceeding PL1 is only 3.31%, and the building remains largely intact. When PGA increases to 0.2 to 0.3 g, the probability of exceeding PL1 reaches 19.51 and 58.96%, respectively; PL2 probability rises to 0.49%. At 0.5 g, the PL1 exceedance probability reaches 84.06 to 94.46%, PL2 rises to 23.4 to 44.9%, and PL3 first appears (8.26%), indicating crack propagation accompanied by plastic hinge formation. When PGA increases to 0.6 g, the PL2 exceedance probability exceeds 64.06%, and the PL4 probability reaches 2.48%, indicating the structure has entered a significantly nonlinear stage. At PGA = 0.8 g, all components exceed PL1, with PL3 and PL4 probabilities reaching 44.86 and 11.64%, respectively, indicating the structure has developed multiple plastic hinges and poses a significant risk of failure. This series of data clearly reveals the progressive failure process of the structure, from micro-cracks to overall damage, as seismic shaking intensifies. In summary, the probability of the structure exceeding PL3 is low, meeting seismic design requirements.

5.5. Structure Damage Probability Assessment

The probability of a structure damage state P(DS) can be denoted as the interpolation of the adjacent state transition probability [27], as shown in the following equation:
P ( D S i ) = 1 P ( L S i ) , i = 1 P ( L S i 1 ) P ( L S i ) , i = 2 , 3 , , N P ( L S N ) , i = N + 1
where N is the number of structure performance levels divided, which is 5 in this section. N + 1 is the number of structure failure states.
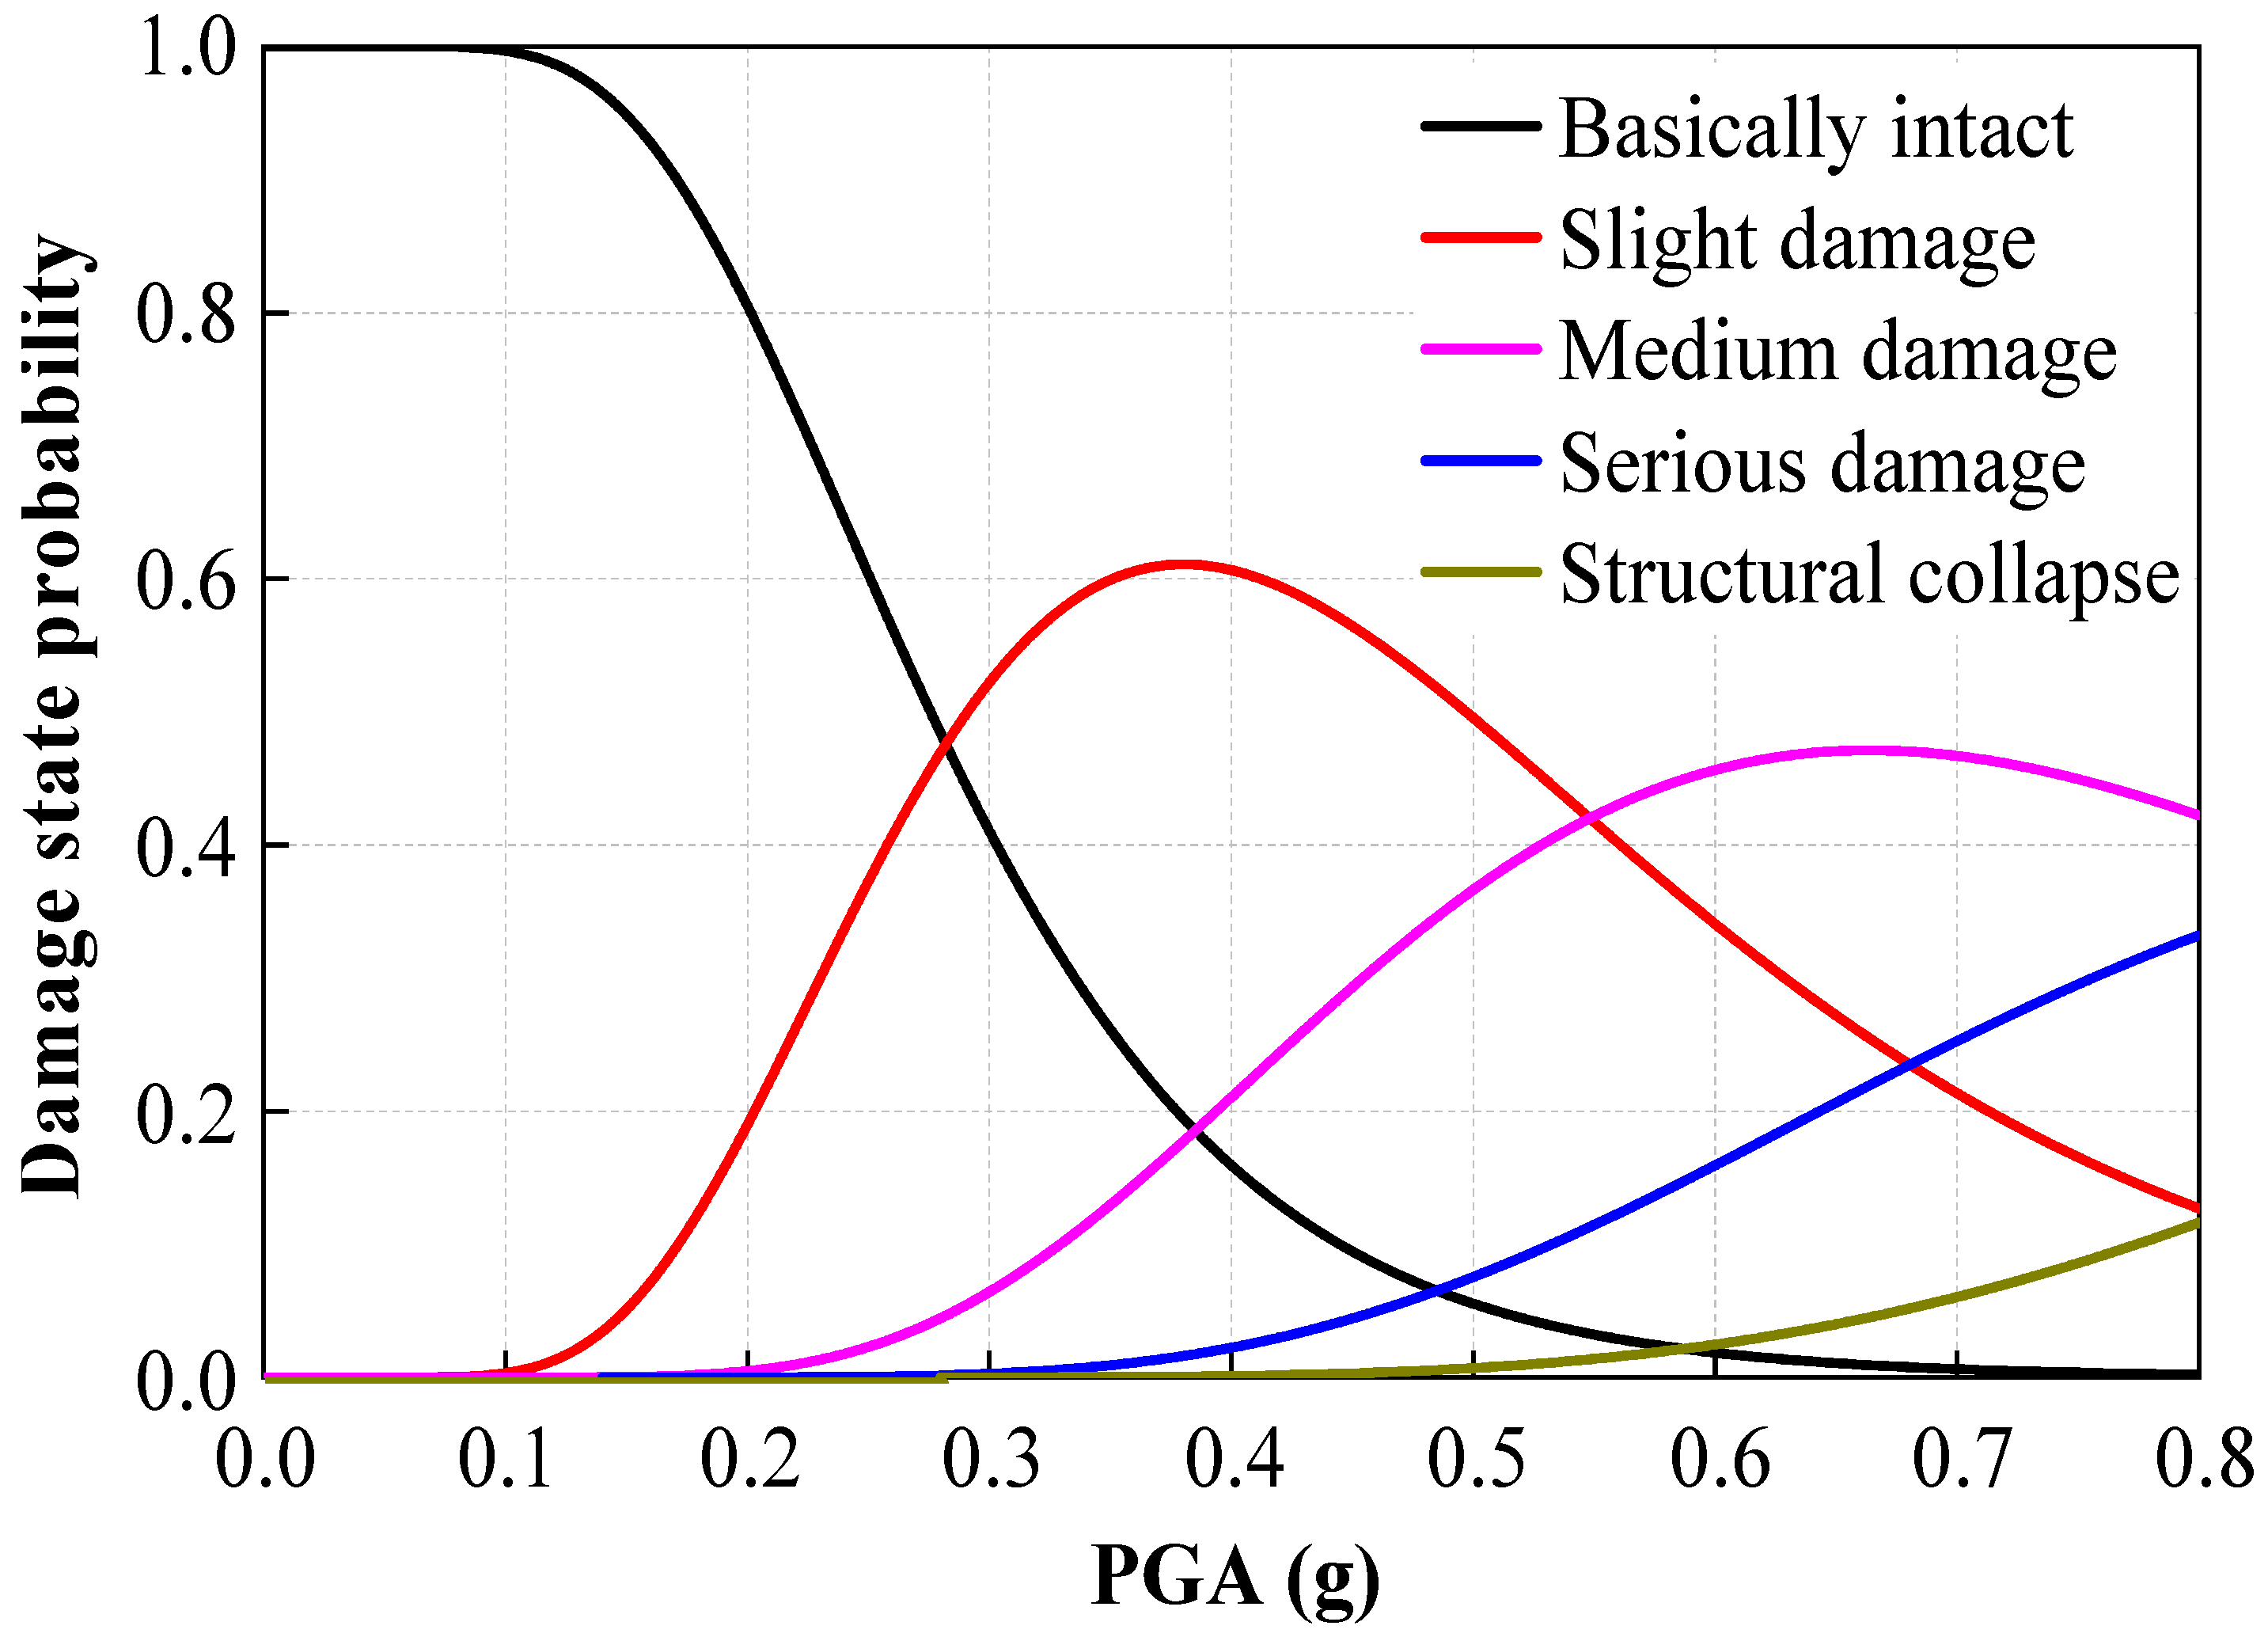
Based on the structure vulnerability analysis results, combined with Equation (17), the probability of damage to the underground interchange structure is obtained, as shown in Figure 11.
Figure 11 shows the probability distribution characteristics of structure damage states under different earthquake intensities. The curve for the structurally intact state exhibits a clear monotonically decreasing trend, indicating that as earthquake intensity increases, the probability of the structure remaining intact gradually decreases. In contrast, the curves for minor and moderate damage states exhibit typical non-monotonic variation characteristics, with probability values first showing an upward trend, reaching a peak, and then gradually decreasing. Notably, the curves for severe damage and structure collapse exhibit a sustained monotonous increase, clearly reflecting the significant rise in the probability of such extreme damage states occurring as earthquake intensity increases.
To better analyze the structure damage state under earthquakes of different intensities, the design standards corresponding to the probability are used to analyze the probability of damage to the structure under frequent earthquakes (0.08 g), design earthquakes (0.23 g), rare earthquakes (0.5 g), and extremely rare earthquakes (0.72 g), as shown in Table 6.
As shown in Table 6, for frequent earthquakes (0.08 g), the probability of remaining intact is 99.94%. for design earthquakes (0.23 g), the probability of minor damage is 30.02%, and the probability of moderate damage is 1.34%. For rare earthquakes (0.5 g), 49.56% of structures sustain minor damage, and 36.64% sustain moderate damage. for extremely rare earthquakes (0.72 g), 46.15% of structures sustain moderate damage, 27.04% sustain severe damage, and 7% collapse. The development trend shows that the extent of structure damage increases progressively with earthquake intensity, evolving from minor damage to severe damage.

5.6. Structure Vulnerability Index

The vulnerability index can be quantified by the probability of structure damage and the seismic hazard index, as shown below:
V I = i = 1 n D F i × P ( D S i | P G A )
where n is the number of structure failure states. P(DSi|PGA) is the probability of the i-th failure state. DFi is the seismic damage index of the failure state, as shown in Table 7.
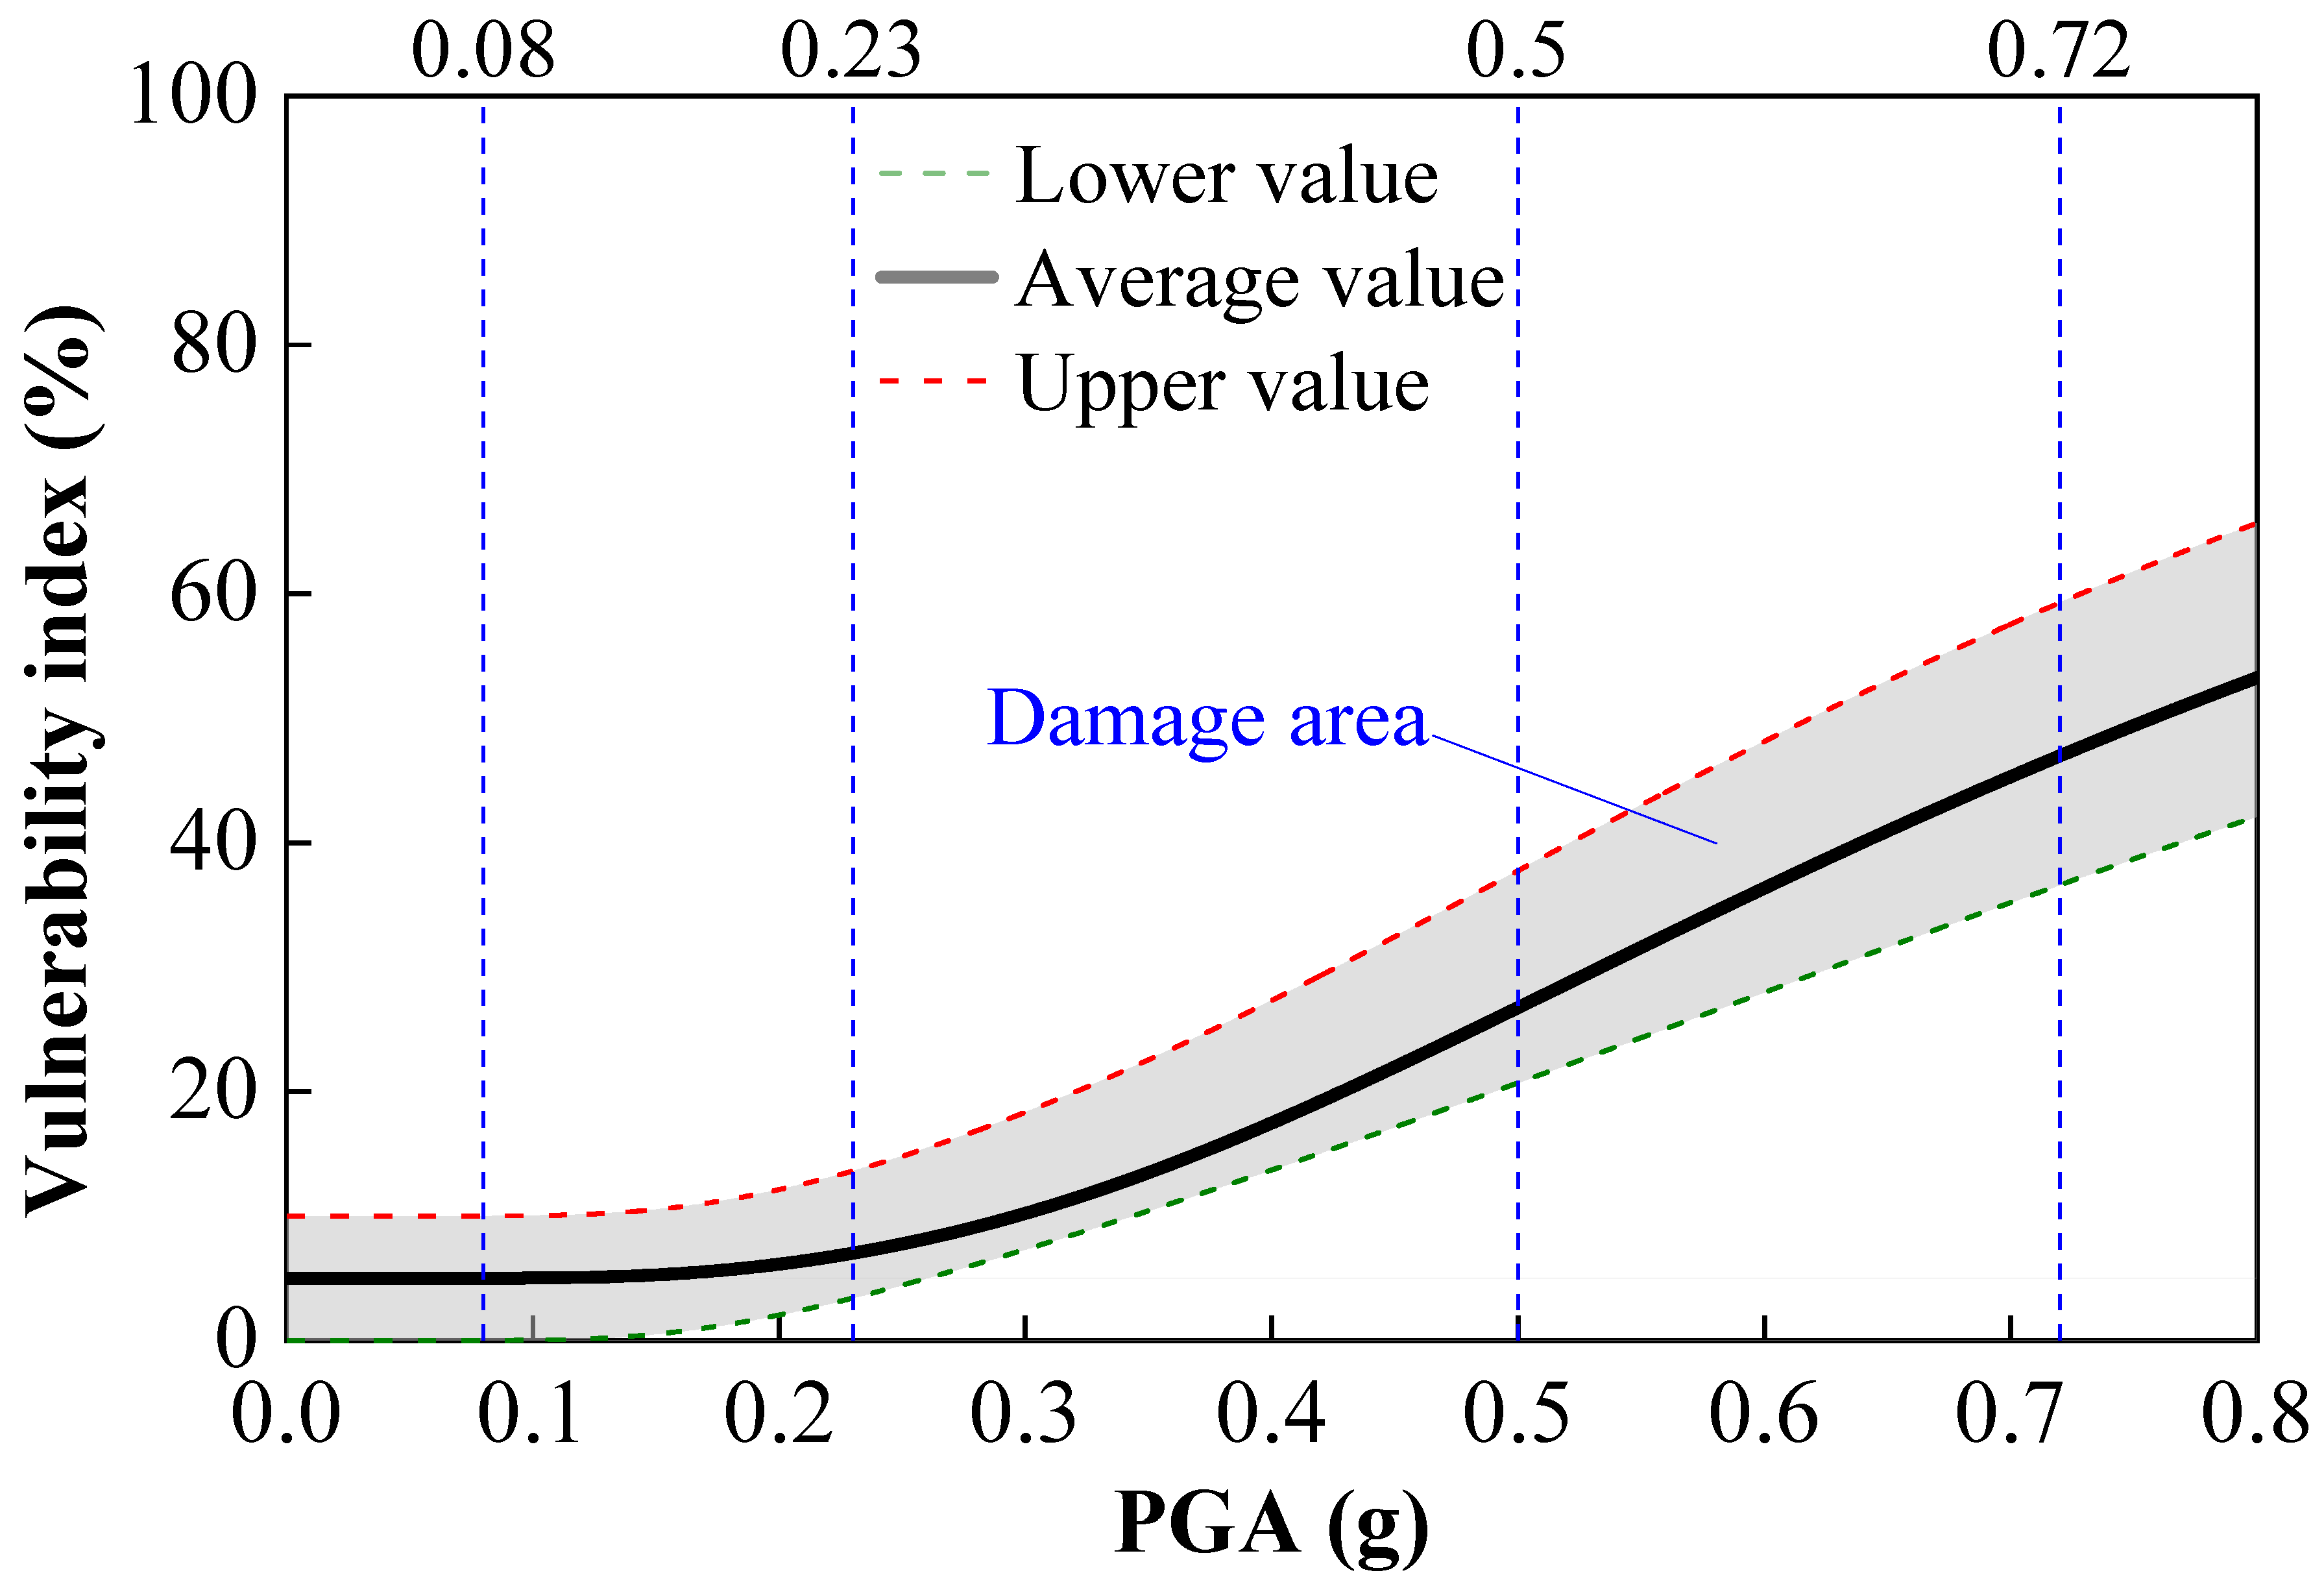
The structure vulnerability index curve calculated based on Equation (18) is shown in Figure 12, where the vertical lines of different colors correspond to the seismic actions at each design level.
Under frequent and design seismic actions, the vulnerability index values of the structure are all less than 15%, indicating good seismic performance. However, under rare seismic actions, the upper limit value of the vulnerability index reaches 37.74%. This relatively high vulnerability index indicates a significant risk of moderate damage to the structure. Under extremely rare earthquake effects, the upper and lower limits of the structure vulnerability index are 59.27% and 36.60%, respectively. This indicates a prominent risk of severe damage to the structure under extremely rare earthquake effects. Such damage may include moderate damage or even more severe damage, further highlighting the structure’s vulnerability under extreme earthquake effects. Overall, the structure’s safety is assured under conventional earthquakes, but moderate or higher damage must be prioritized for prevention under extreme earthquakes, providing a quantitative basis for seismic optimization design.

6. Influence of Traveling Wave Effect on Seismic Dynamic Response of Structure

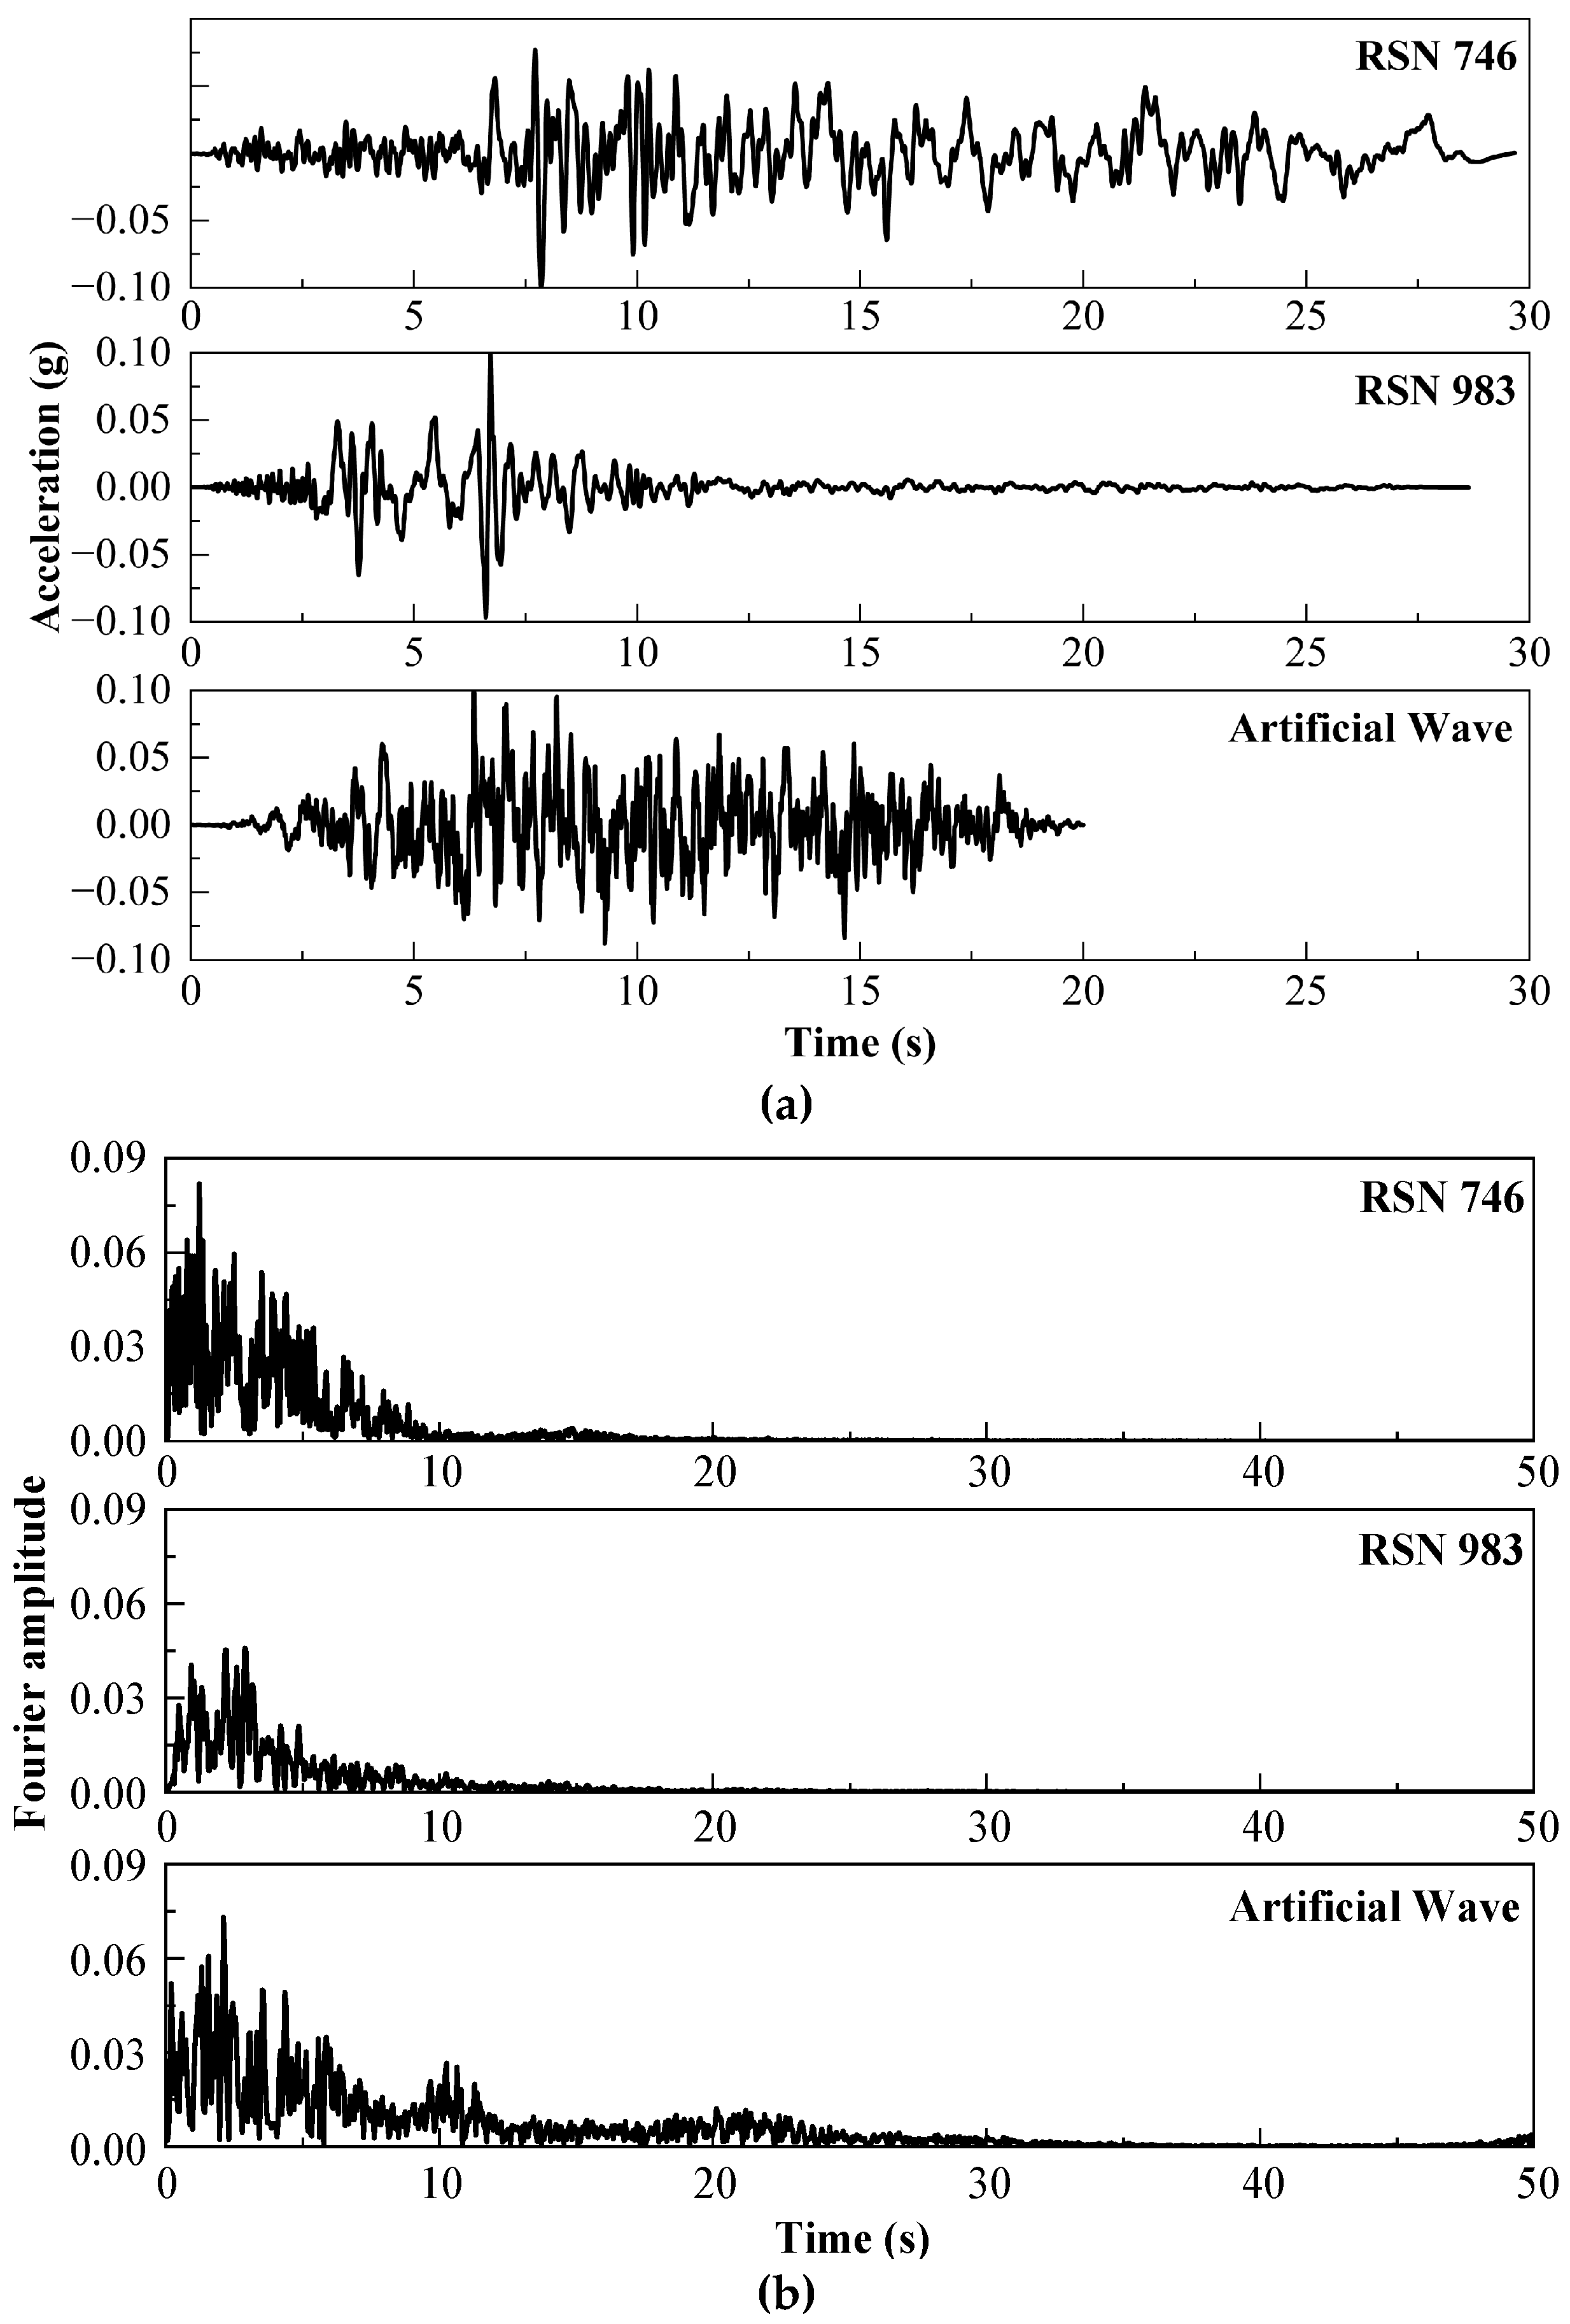
As shown in Table 3, two measured seismic waves and one artificial wave (measured waves accounting for 2/3) were selected, and adjusted the PGA to 0.1 g. The acceleration curves and Fourier spectra of the input seismic waves are shown in Figure 13.
To investigate the effects of traveling waves, three wave velocities (500 m/s, 1000 m/s, and 1500 m/s) were set. By inputting x-direction seismic waves at the bottom of the model, the horizontal traveling wave propagation effects were simulated.

6.1. The Influence of Traveling Wave Effect on Structure Displacement

The maximum overall displacement in the x-direction at 24 monitoring points under the influence of RSN746, RSN983, and artificial waves, considering the traveling wave effect, as shown in Figure 14.
Under the influence of the RSN746 wave, the displacement magnitude of the monitoring points remains relatively stable within the propagation speed range of 500 to 1500 m/s, with fluctuations less than 5%. When the input is consistent, the maximum displacement is concentrated at 26.32 to 26.53 cm. The RSN983 wave exhibits different characteristics, with an increase in propagation speed leading to an overall decrease in displacement, with a reduction of 15 to 20%. The displacement range under consistent input is 3.95 to 4.29 cm. Artificial waves are most significantly affected by the traveling wave effect, with displacement decreasing by 28% at a propagation speed of 500 m/s compared to consistent input, but recovering by approximately 18% when the speed increases to 1500 m/s.
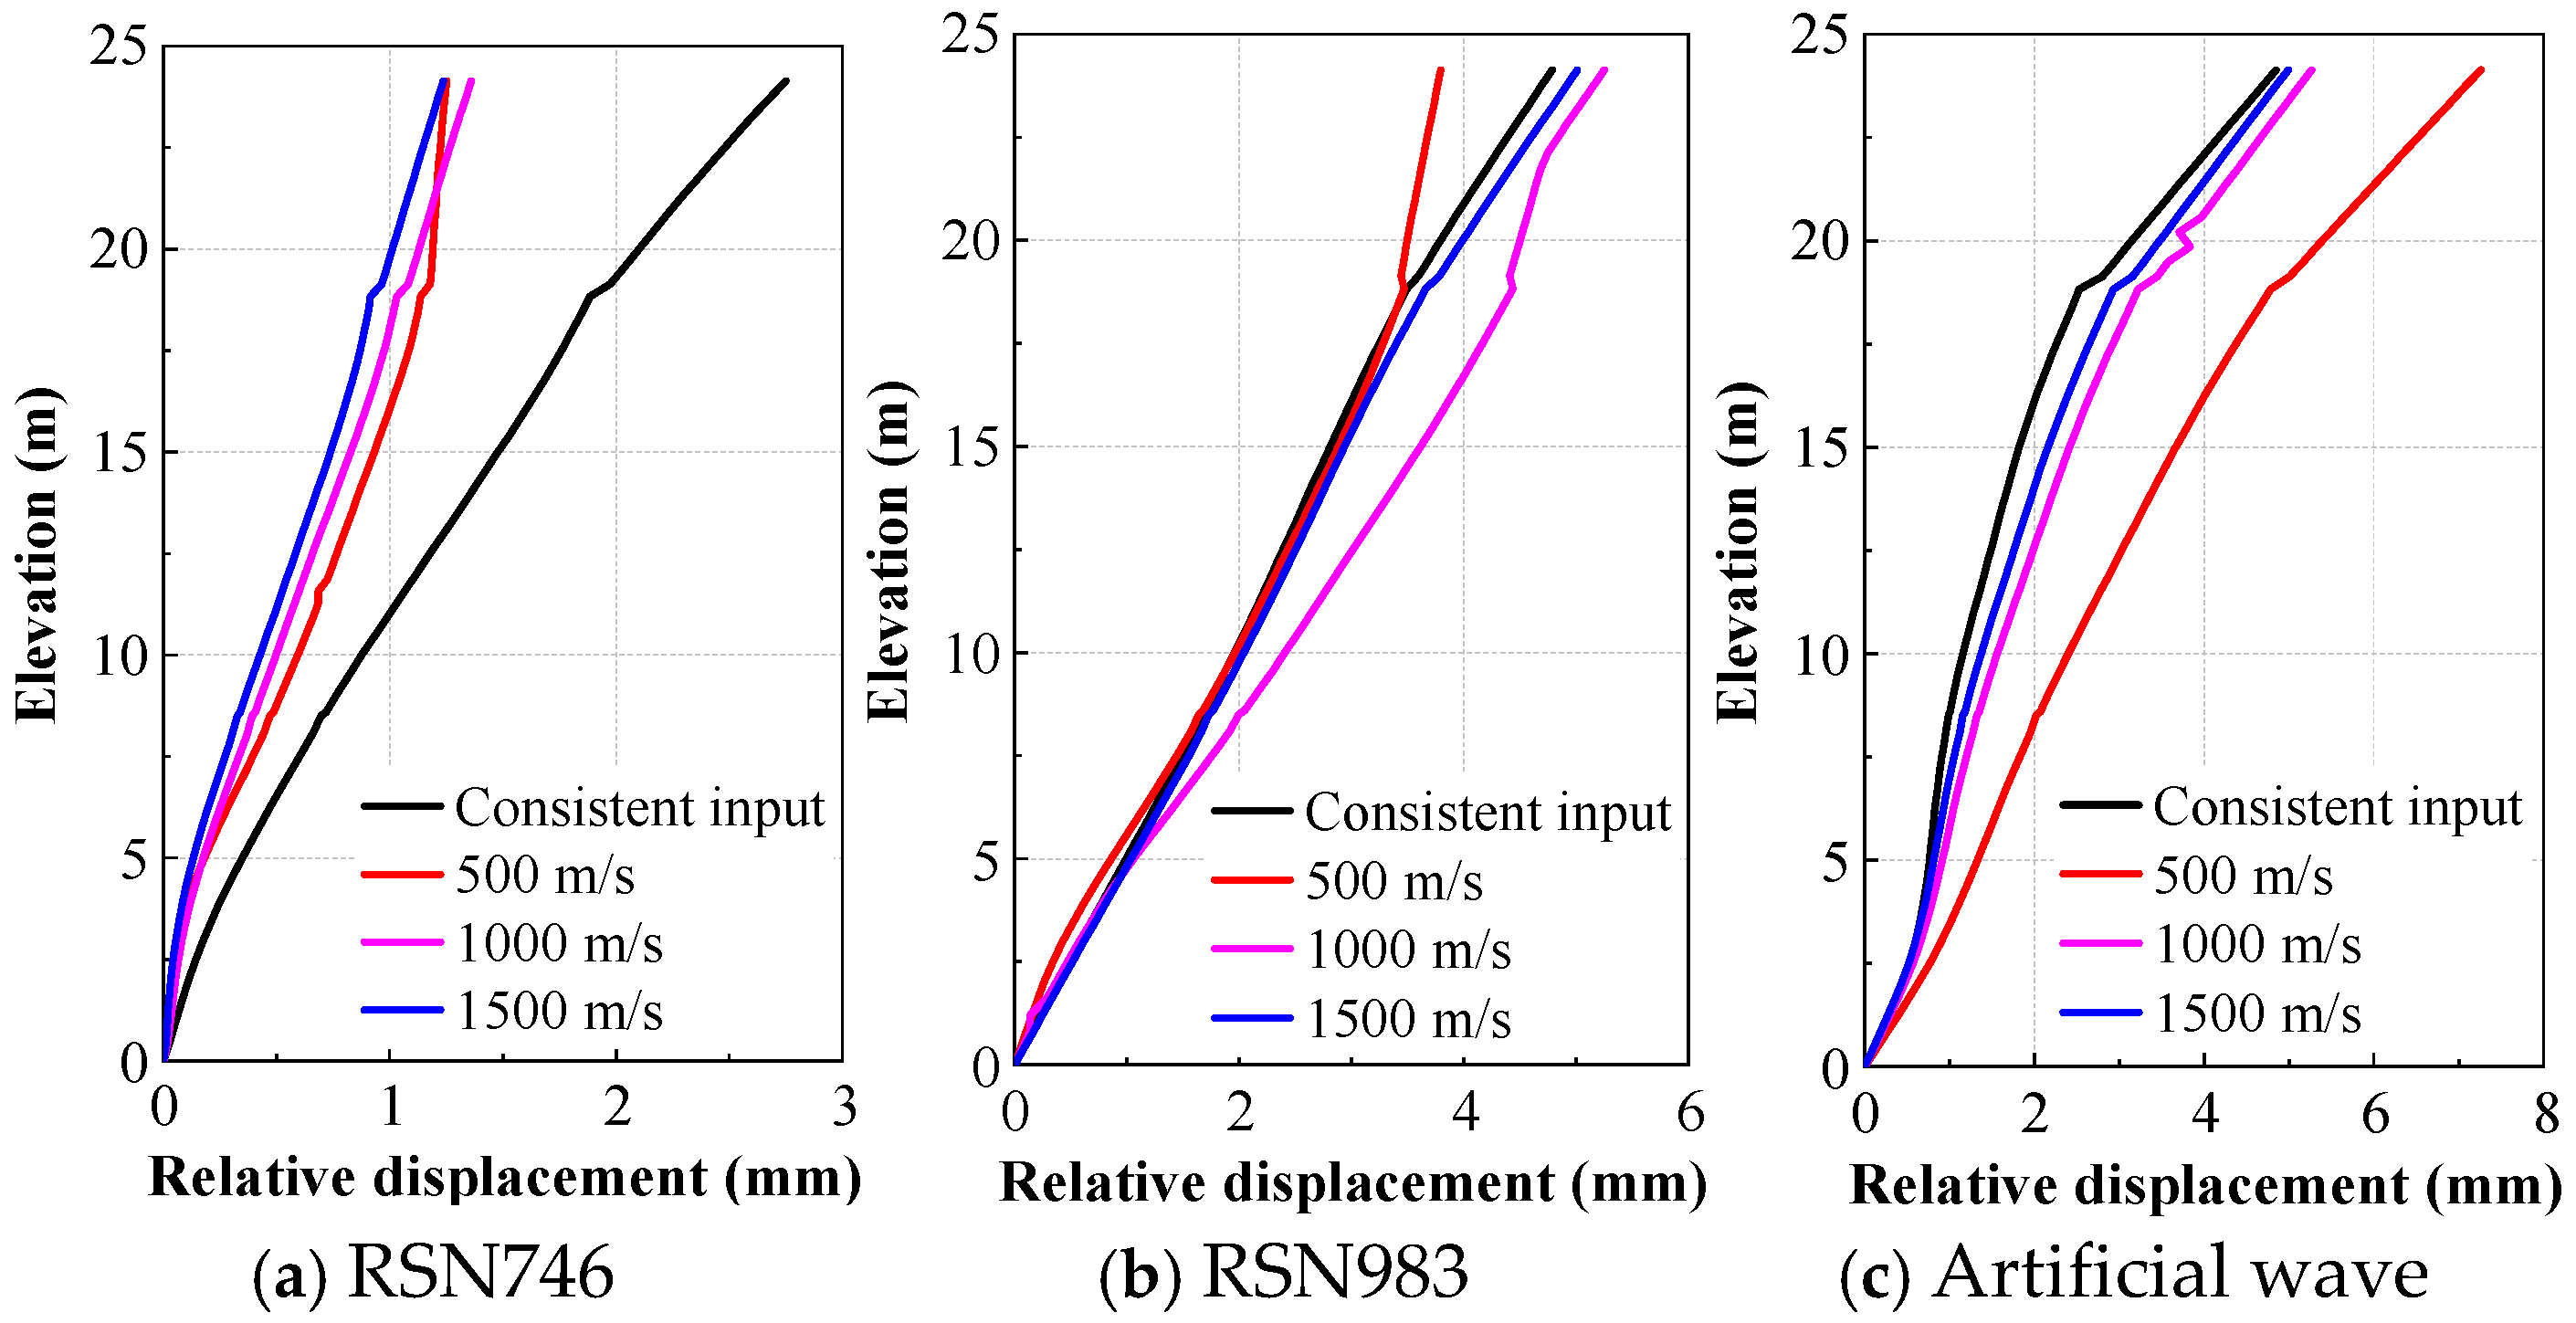
The displacement changes in the lower half of the structure (monitoring points #1 to #9) are significantly greater than those in the upper half (monitoring points #10 to #24), which may be related to resonance effects and changes in energy distribution caused by changes in wave velocity. The displacement differences between monitoring points in each layer are less than 5%, so the nodes on the left wall were selected to establish the elevation-displacement relationship (Figure 15).
The comparison between uniform and non-uniform input reveals that uniform excitation produces larger global displacements due to synchronous deformation of the entire structure, whereas traveling waves introduce phase delays that suppress global drift but significantly amplify relative displacement between structural segments. This mechanism explains the coexistence of reduced absolute displacement and increased deformation concentration under traveling wave excitation.

6.2. The Influence of Traveling Wave Effects on the Internal Force of Structure

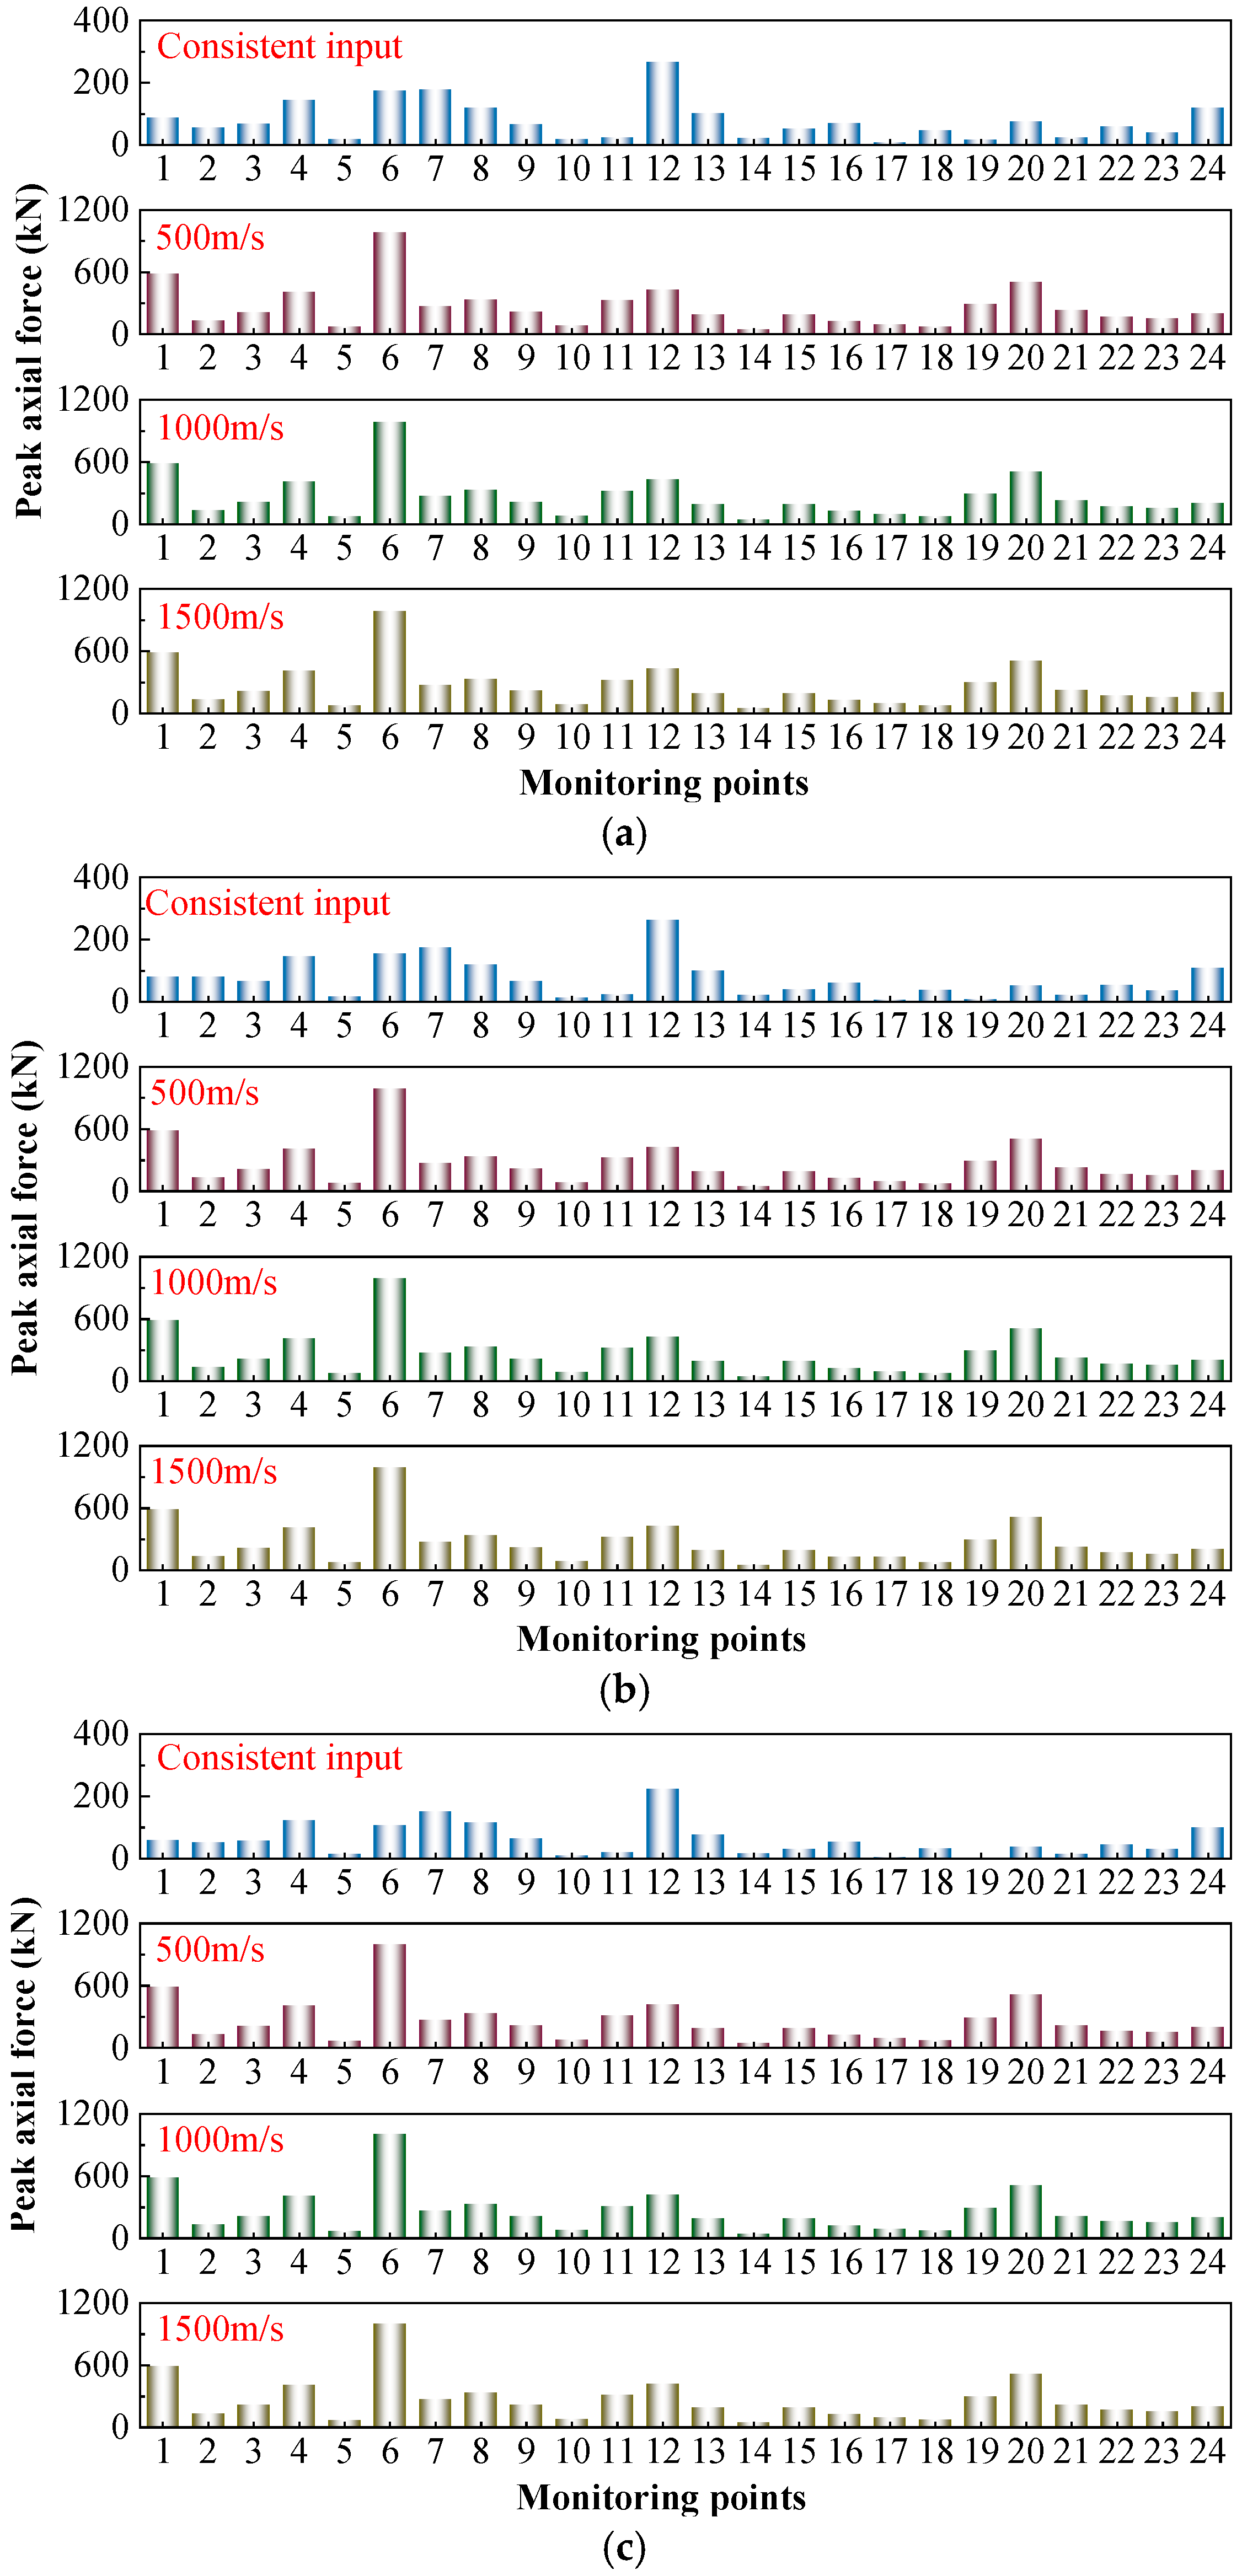
Figure 16 shows the results of peak axial force affected by traveling wave effects at 24 monitoring points under the influence of RSN746, RSN983, and artificial waves. The axial force response is significantly affected by non-uniform input but is less sensitive to seismic wave type and propagation velocity. At the same propagation velocity, the difference in peak axial force at monitoring points caused by different seismic waves is less than 3%. Therefore, the focus is on examining the effects of non-uniform input. This indicates that the influence of the waveform characteristics (e.g., RSN746 vs. RSN983) is secondary, whereas the transition from uniform input to traveling-wave input governs the magnitude of force amplification.
As shown in Figure 16, when the propagation speed increases to 500 m/s, the peak axial force significantly increases. Monitoring point #19 shows the largest increase (16.9 times), while monitoring point #24 shows the smallest increase (1.68 times). Under the 500 m/s condition, the axial force at monitoring point #6 reaches 983.7706 kN, indicating that this point is most prone to tensile-compressive failure. Monitoring points #7, #11, and #12 (mid-structure) within the same frame also exhibit high peak internal forces, indicating that this area is highly susceptible to damage. The axial forces at monitoring points #1 and #4 at the bottom of the side walls are 853.9005 kN and 406.4394 kN, respectively, significantly higher than those at other side wall monitoring points, suggesting that this area is prone to tensile-compressive failure.
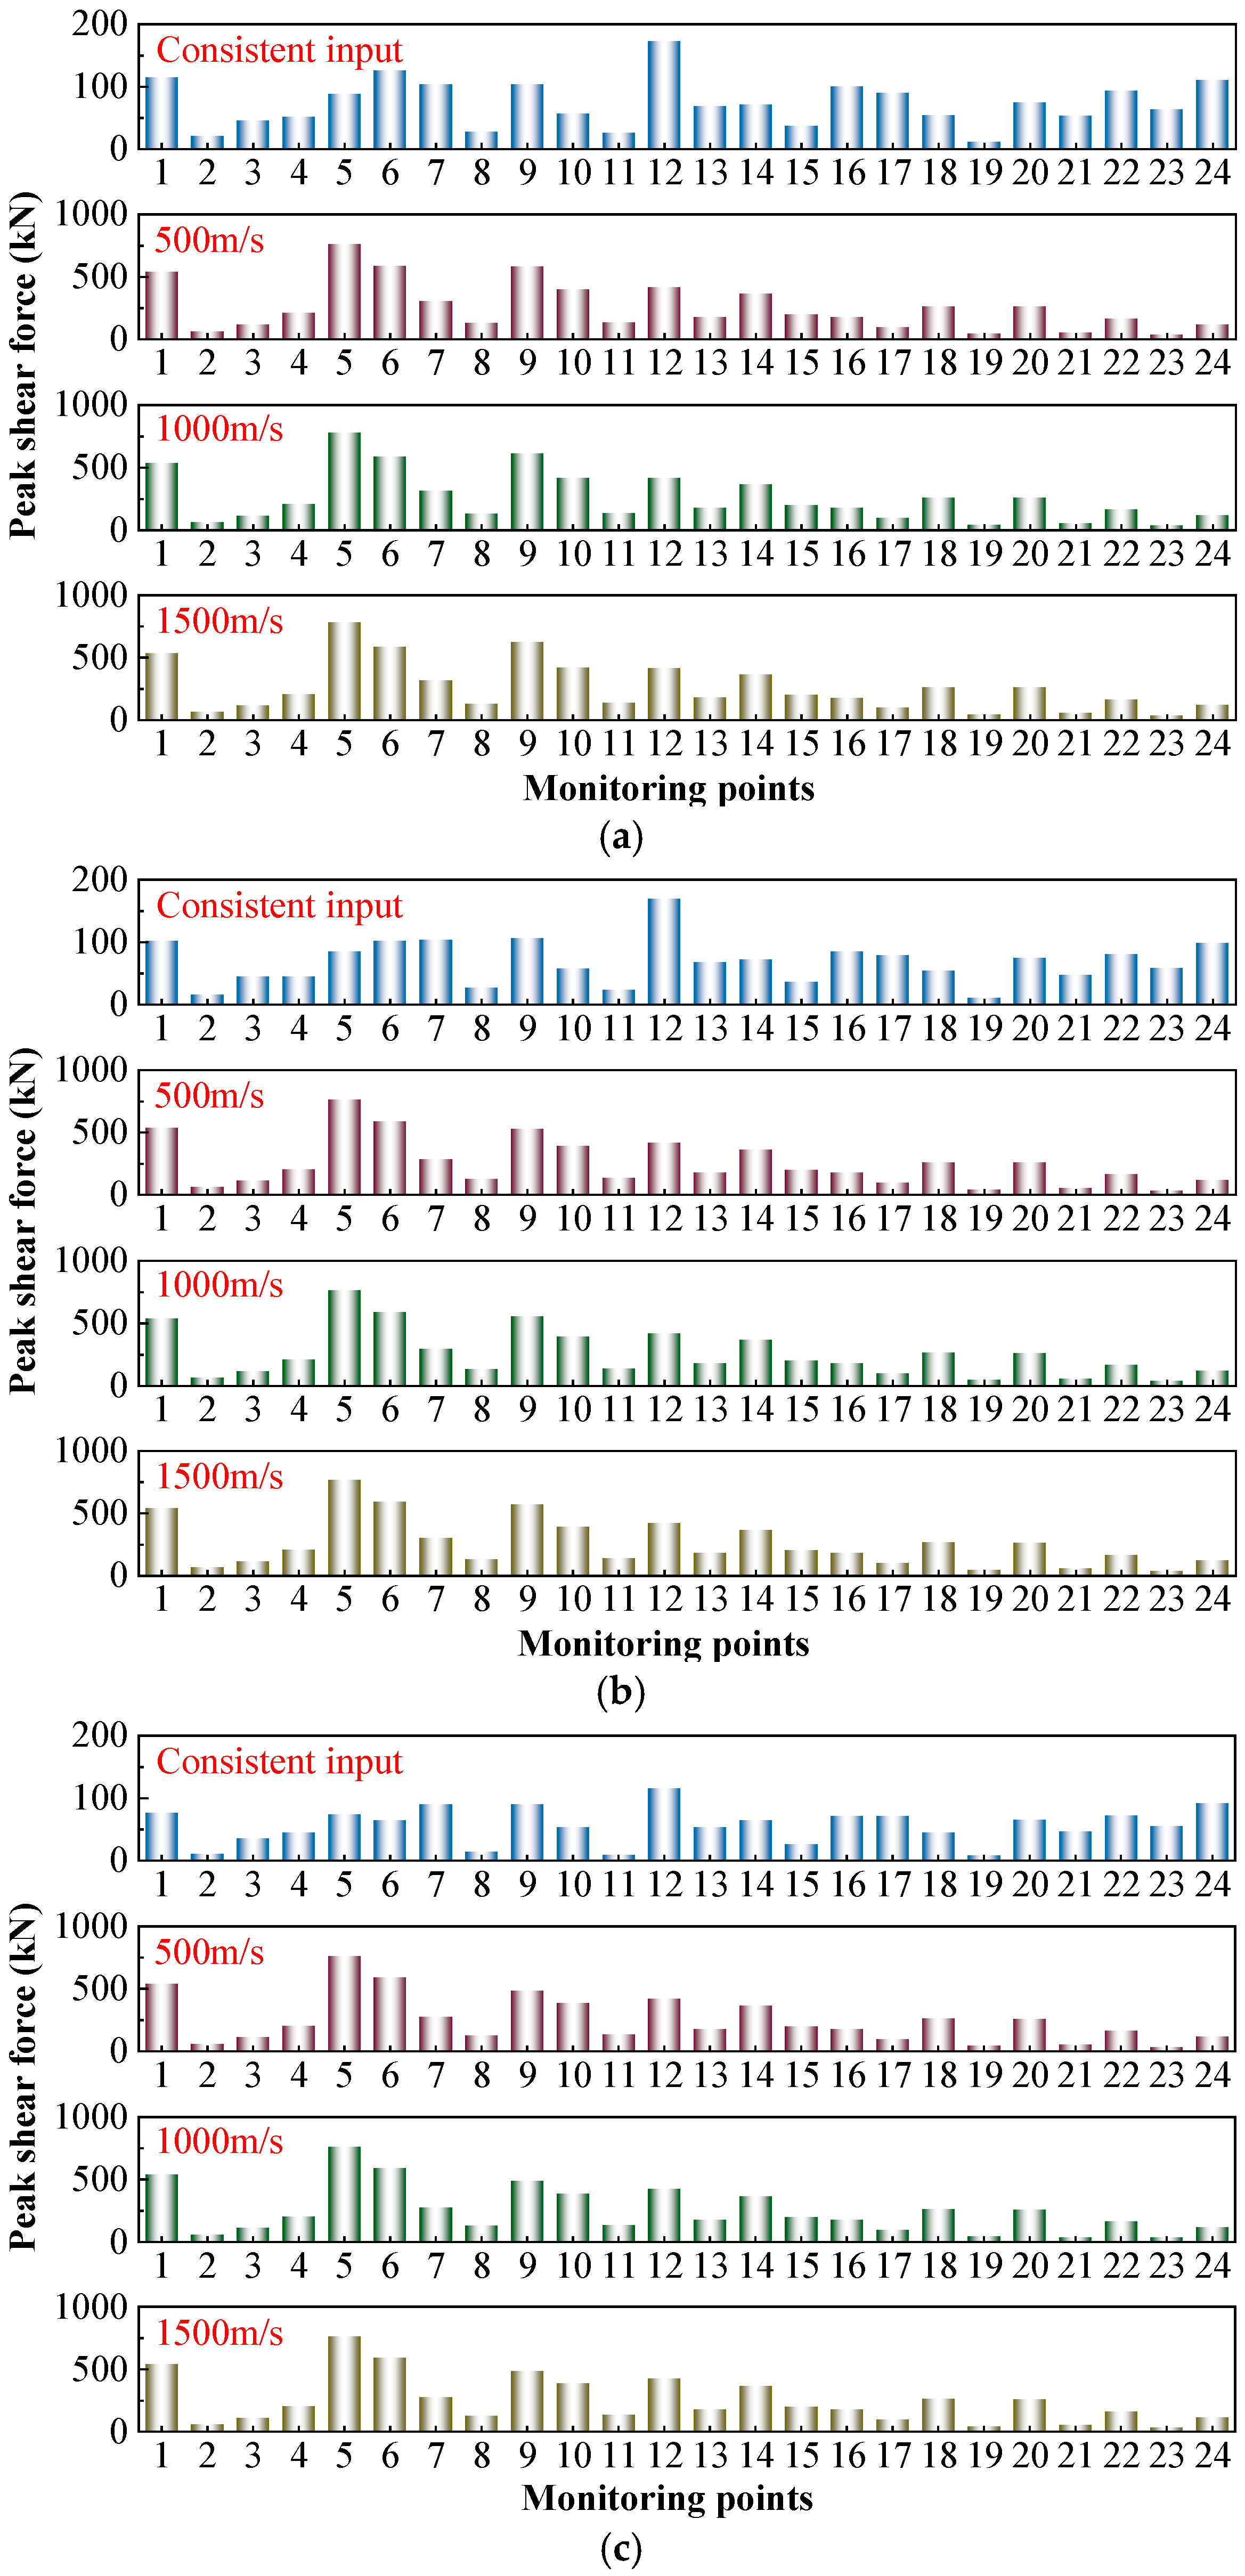
Figure 17 lists the peak shear forces of traveling wave effects under the influence of RSN746, RSN983, and artificial waves.
The pattern of shear force affected by non-uniform input is consistent with that of axial force, significantly influenced by traveling wave effects but less affected by seismic waves and propagation velocity. Under different seismic waves, when the propagation velocity is the same, the peak shear force differences among monitoring points are within 3%. Therefore, the following analysis focuses on the impact of non-uniform input on monitoring points. Again, this confirms that the primary source of internal force amplification is the input non-uniformity rather than the specific seismic waveform.
Under the 500 m/s condition, the peak shear forces at all monitoring points except points 21 and 23 significantly increased compared to the consistent input. Among these, point 5 showed the largest increase, with a shear force of 8.6 times that of the consistent input under the 500 m/s condition. The monitoring point #17 showed the smallest increase, only 1.07 times that of the consistent input. Under the 500 m/s condition, the monitoring point #5 exhibited the highest shear response (760.7008 kN), indicating that this point is most prone to shear failure. Monitoring points #6, #7, and #9 at the same elevation also exhibited high peak shear values, suggesting that the slab in this layer is prone to shear failure. Monitoring point 1 also exhibited a high peak shear value, indicating that the bottom of the left wall is also prone to shear failure.
In summary, axial force and shear force are less affected by propagation velocity and seismic waves. However, when transitioning from consistent input to inconsistent input, both values significantly increase, with the maximum increase in axial force reaching 16.9 times. This highlights that the determining factor of internal force variation is the input mode (uniform vs. traveling wave), rather than the wave type or velocity. This change is primarily attributed to seismic waves propagating along the X-axis direction. Analysis indicates that the concrete frame structure formed by the monitoring points #6, #7, #11, and #12 is prone to tensile-compressive failure, and the intermediate slab in the first layer is susceptible to shear failure. Additionally, monitoring point 1 at the bottom of the left-side wall exhibits relatively high axial force and shear force, necessitating enhanced reinforcement measures in these areas.

6.3. The Influence of Traveling Wave on the Structure Stress

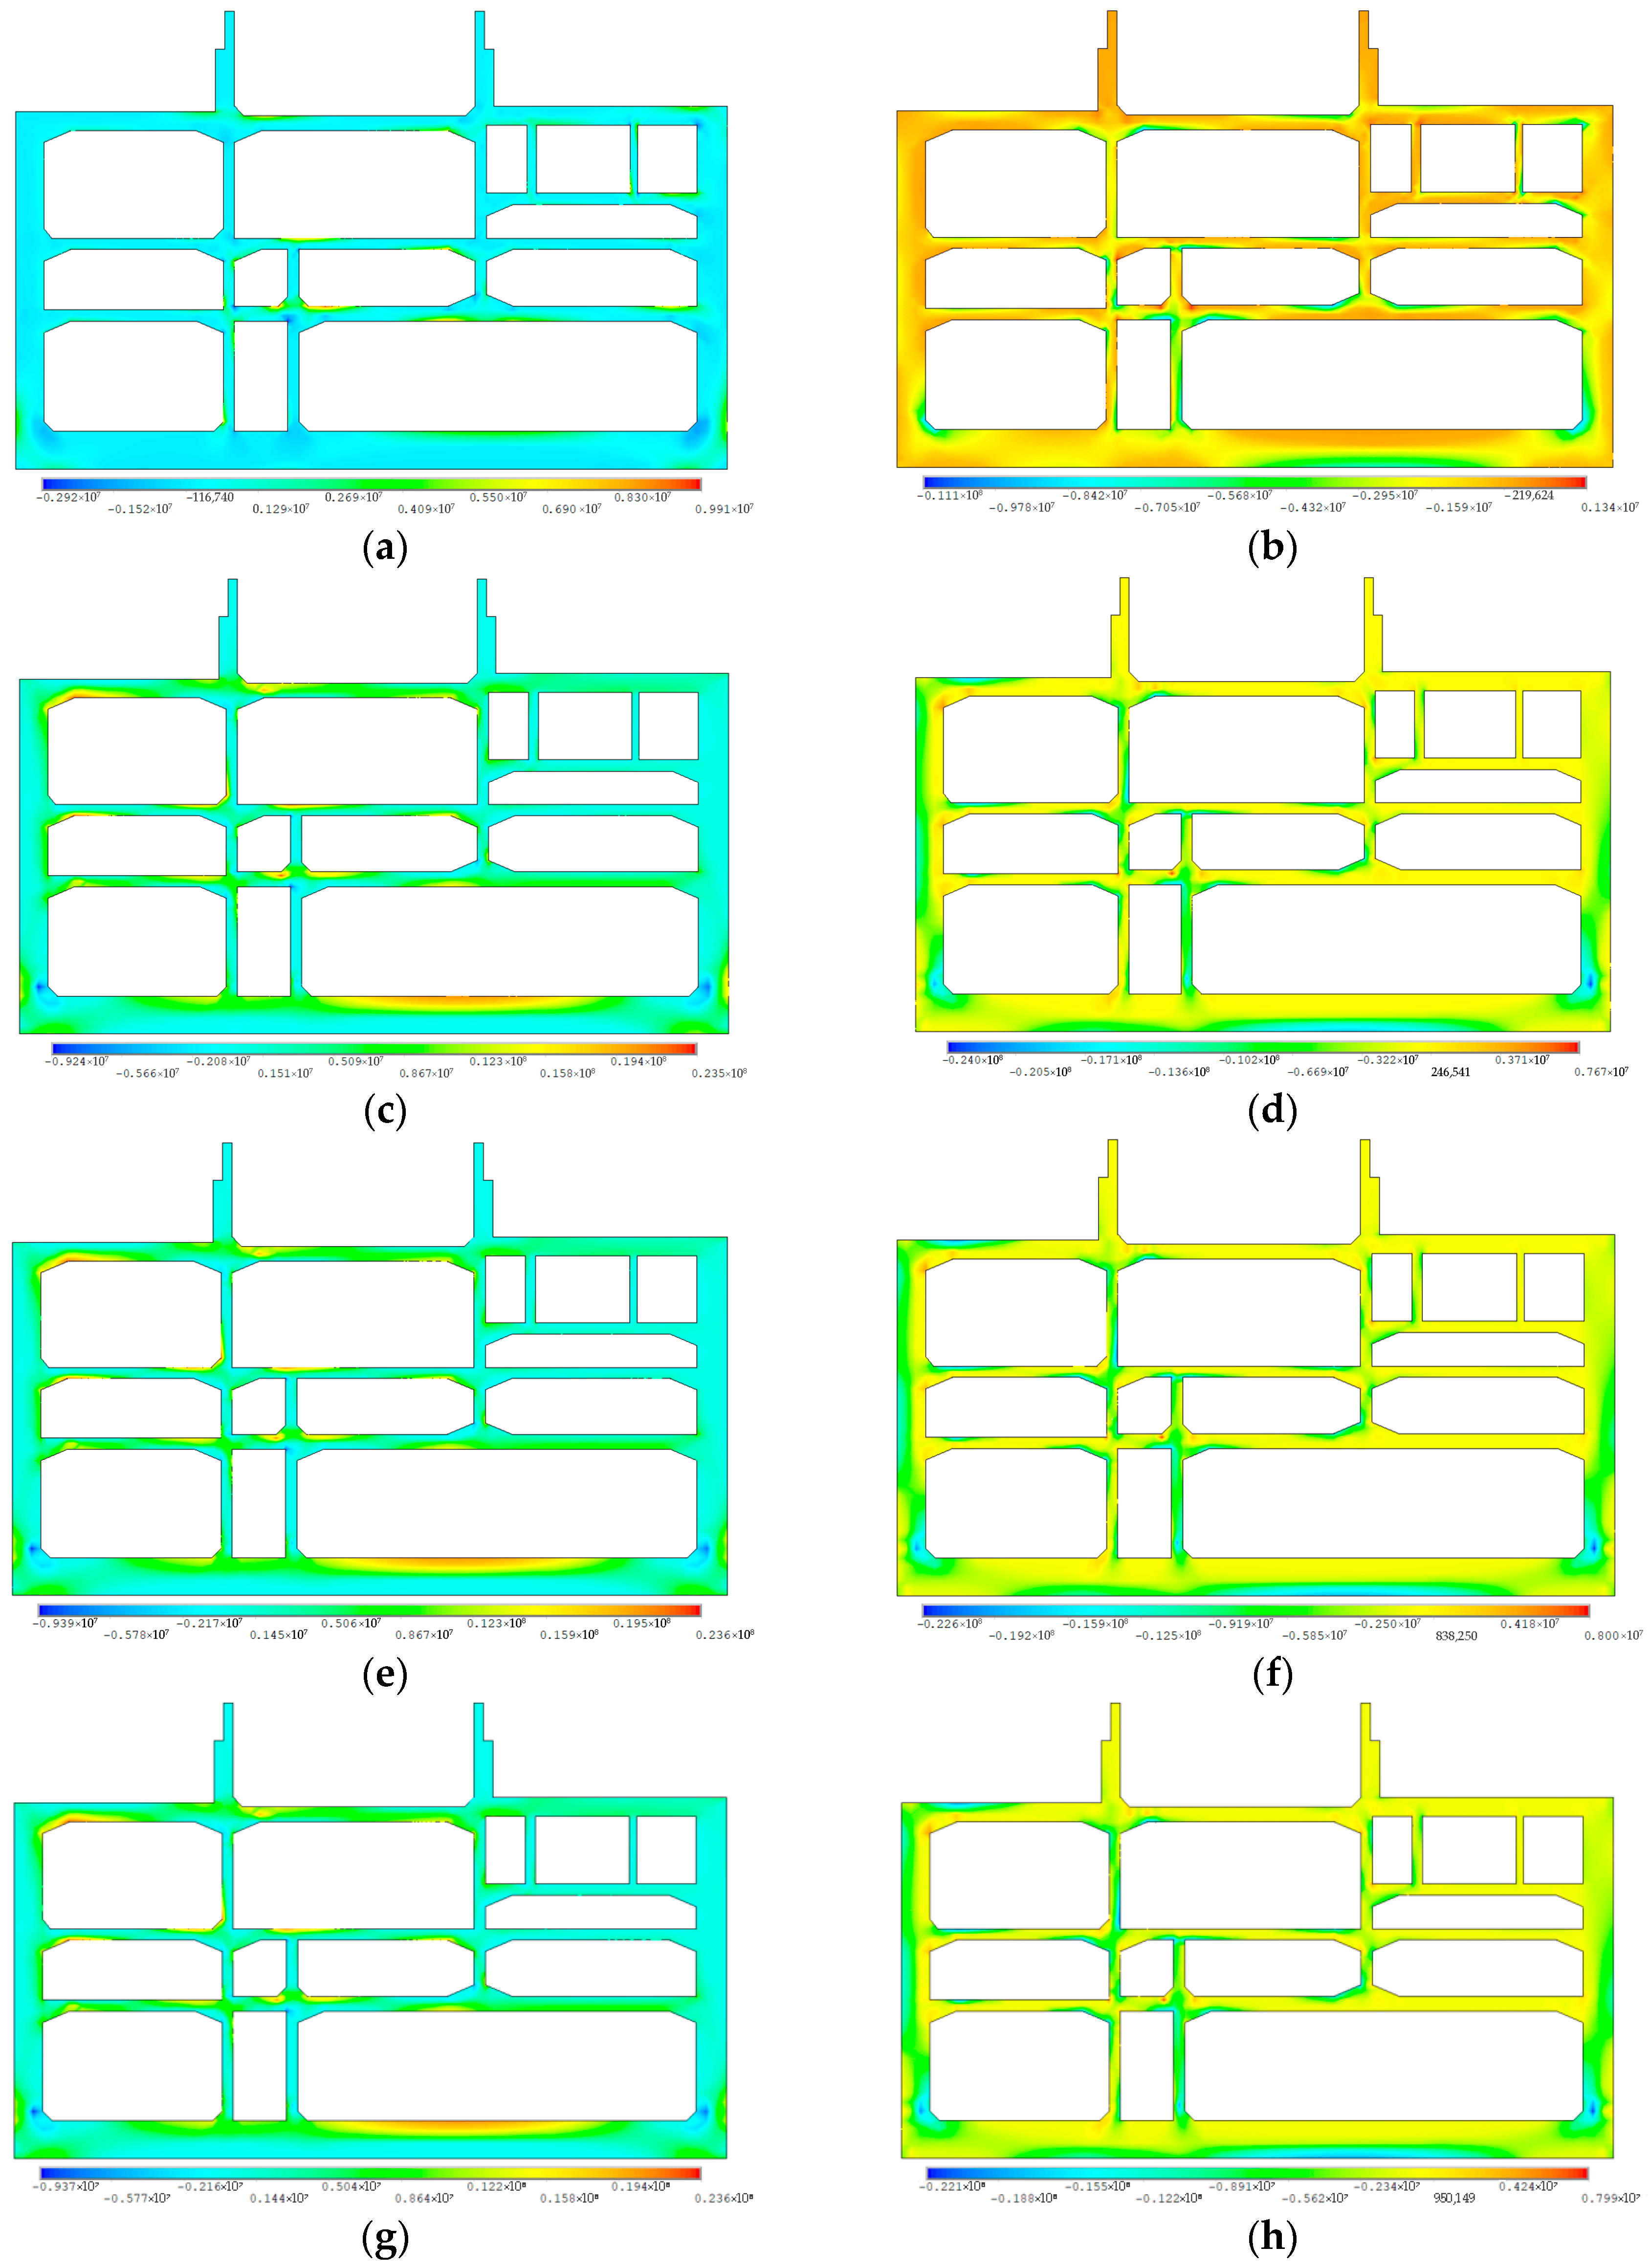
The input seismic peak time is defined as the time corresponding to the peak acceleration of the seismic wave (7.86 s for RSN746, 6.71 s for RSN983, and 6.34 s for the artificial wave). Analysis of stress distribution maps under three seismic waves with different propagation speeds reveals that the patterns of maximum/minimum principal stress changes are similar. Therefore, RSN746 is selected for typical analysis.
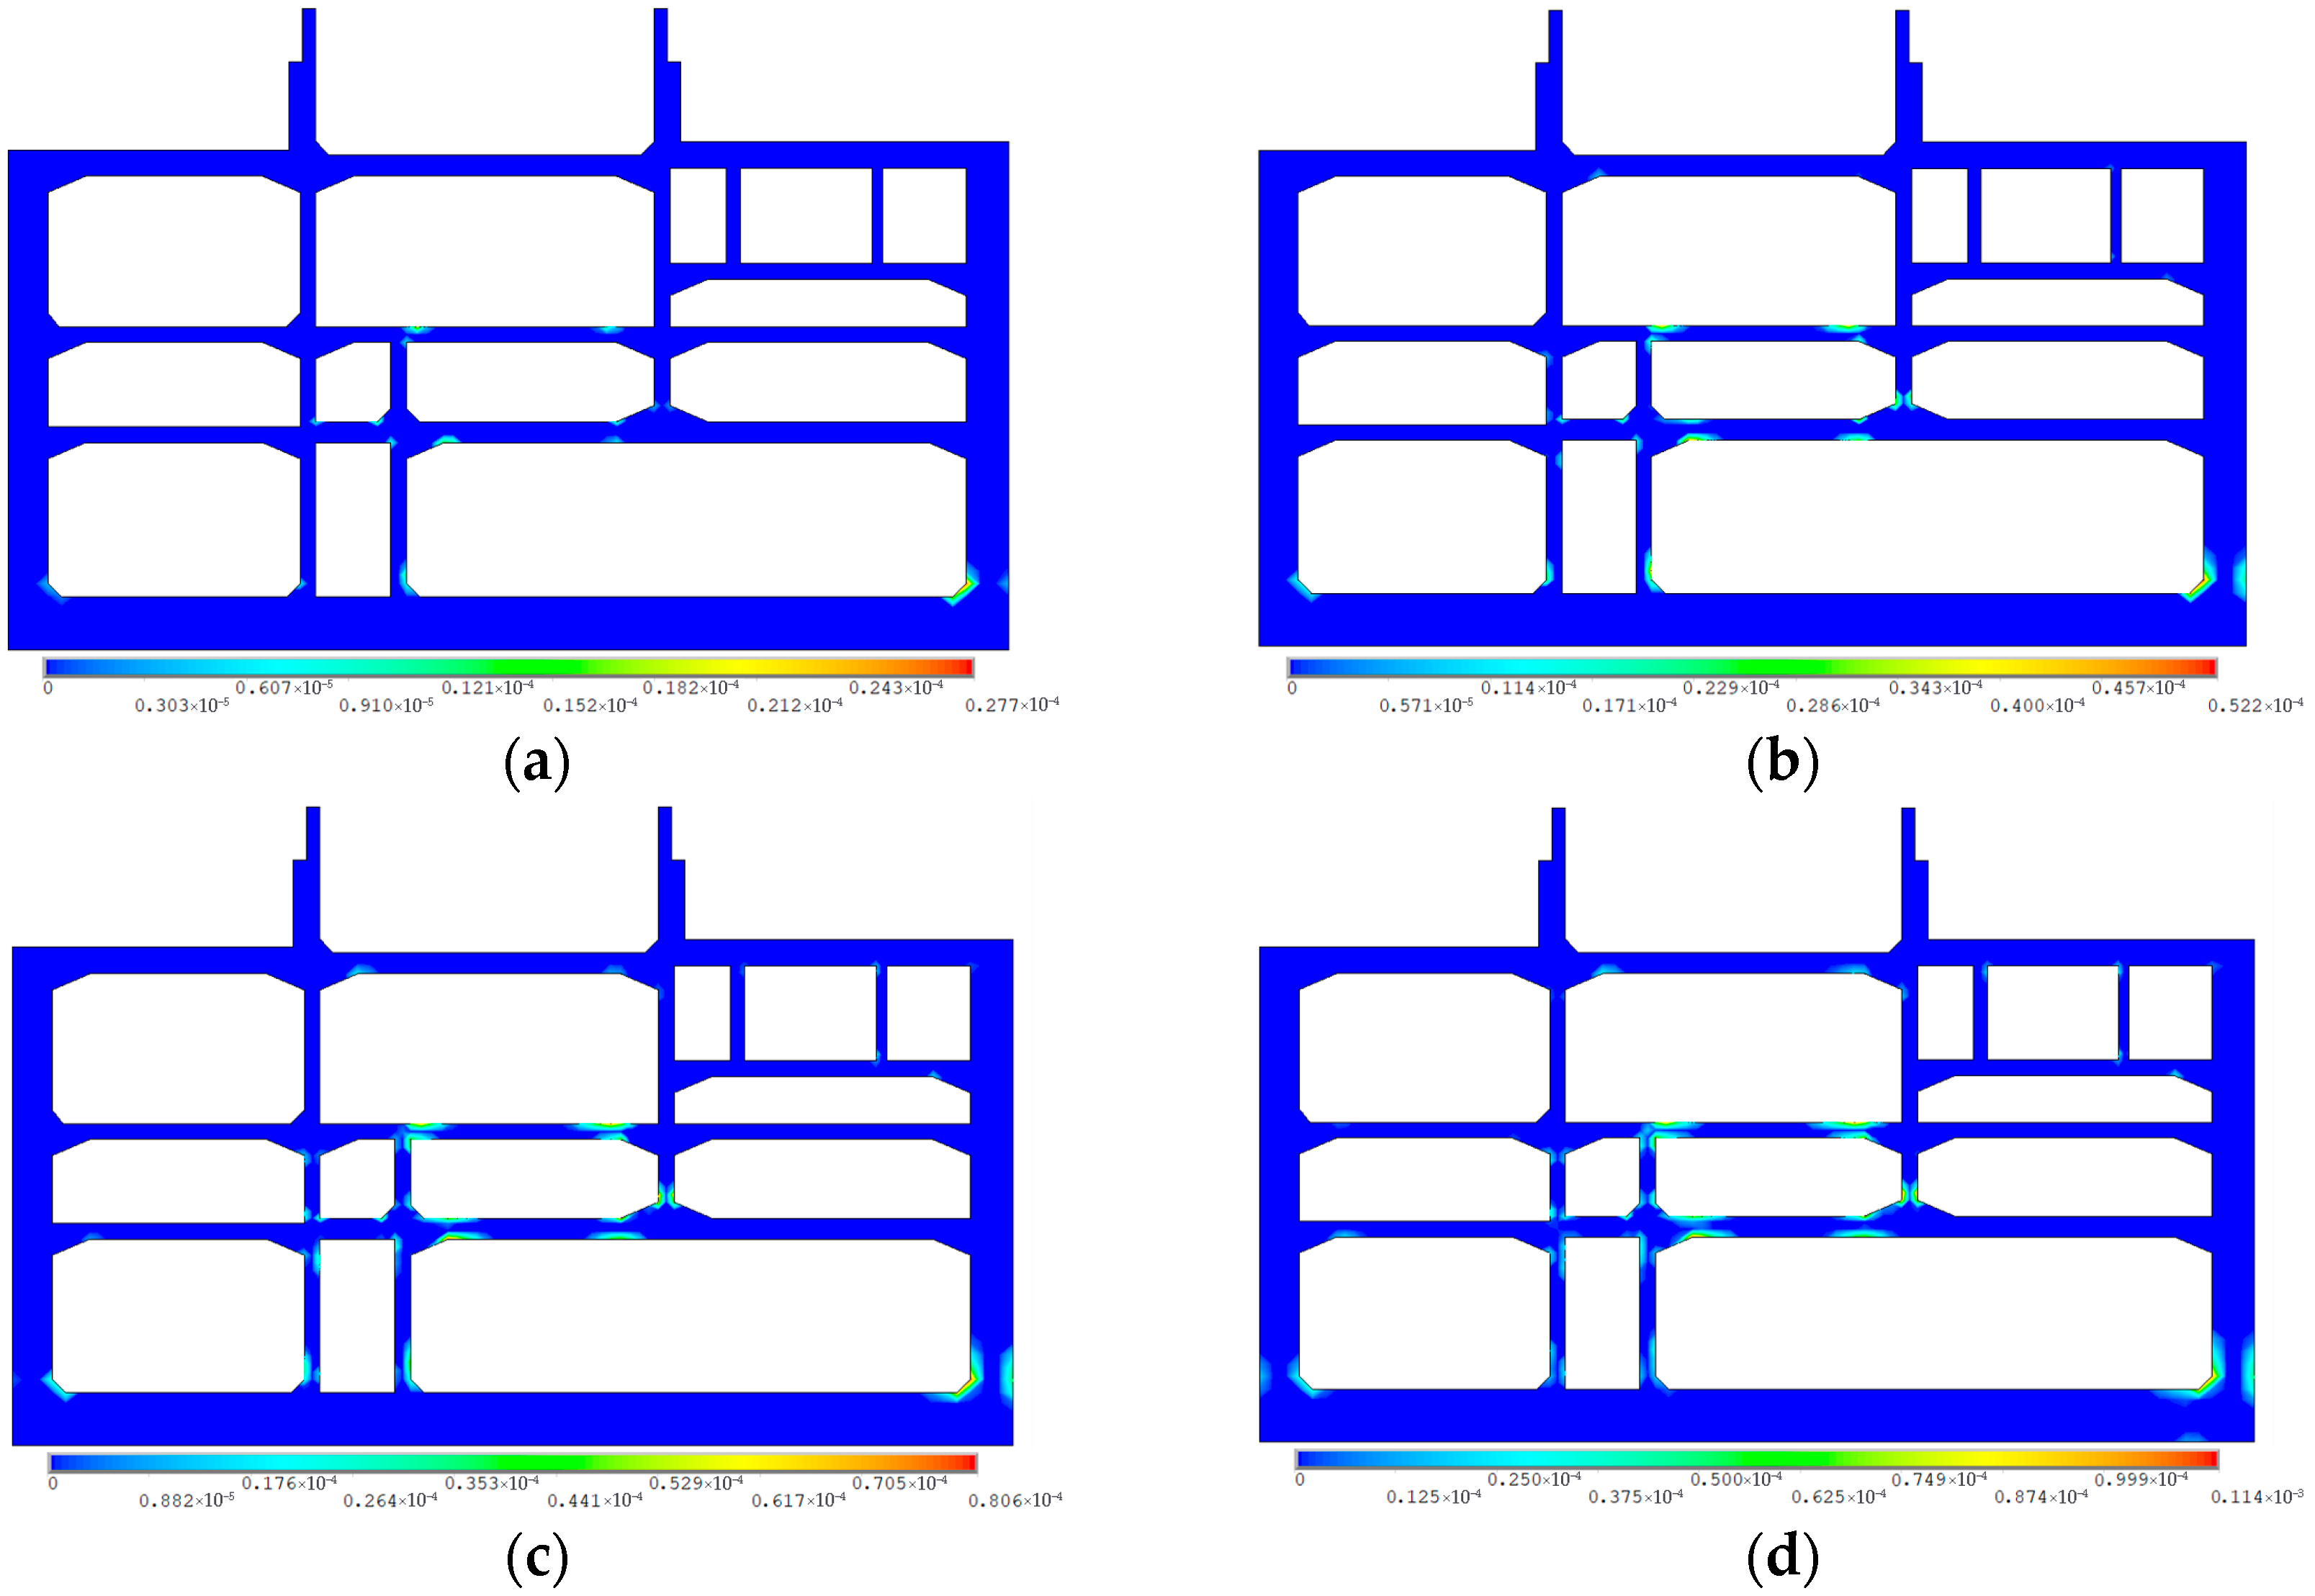
Figure 18 shows that when the propagation velocity increases from the consistent input to 500 m/s, the maximum principal stress peak increases from 9.91 to 23.5 MPa (an increase of 137%), and the minimum principal stress peak increases from 11.1 to 24 MPa (an increase of 116%). When the propagation speed is further increased to 1500 m/s, the maximum principal stress remains stable, while the minimum principal stress peak gradually decreases from 24 to 22.1 MPa. The stress cloud diagram indicates that under non-uniform input conditions, the stress concentration zones significantly expand. Except for the first span structure, stress concentration is evident in all other frames, with particularly pronounced stress concentration at the bottom of the side walls and the bottom plates of ramps ND and B. The stress responses at monitoring points #7 and #11 are the most significant.
The doubling of the principal stress under traveling wave excitation indicates a marked increase in stress concentration intensity. Such high gradients of tensile and compressive stress increase the likelihood of crack initiation, local brittleness, and stiffness degradation in the concrete components of underground structures, particularly in regions with geometric discontinuities or abrupt stiffness transitions.
Stress differences among different seismic waves remain below 10%, confirming that the dominant factor influencing stress distribution is the non-uniformity of seismic excitation rather than the specific waveform or propagation velocity. Monitoring points #7, #11, and #12 (located within the frame formed by the first- and second-floor intermediate slabs and the first- and second-intermediate columns) consistently exhibit the highest stress demands and constitute the primary weak zones of the structure.

7. Conclusions

This study is based on the JD-36 section of the Nanjing Huimin Avenue Comprehensive Reconstruction Project, where seismic fragility and traveling-wave effects were analyzed. The research outcomes have been practically applied in the engineering project, providing guidance for local reinforcement design and material selection at critical locations such as the bottom of sidewalls and the connections of the middle slabs. These applications also validate the scientific soundness and rationality of the proposed methodology. The developed model and analytical framework can offer reliable technical support for seismic performance evaluation and the optimization design of complex underground interchange structures in weak foundation conditions. The main findings are as follows:
(1) The structure has a low probability of exceeding PL3 damage. Under the action of multiple earthquakes and defense earthquakes, only cracks are produced, and the possibility of the development of a nonlinear state is low. moderate damage occurs under rare earthquakes. The probability of moderate damage under very rare earthquakes reaches 46.15%. Damage in underground structures under strong earthquakes is often concentrated at structure discontinuities, consistent with the plastic hinges observed in JD-36’s frame joints. The frame structure, composed of monitoring points #7, #8, #12, and #13, and the bottom of the right-side wall, are most prone to plastic damage, and it is recommended to use high-toughness and high-strength materials to carry out local reinforcement in order to slow down the development of damage.
(2) In terms of overall displacement, the displacement value of the consistent input condition is generally larger than that of the traveling wave input, and the displacement change in the lower half of the structure (monitoring points #1 to #9) is more significant than that of the upper half (monitoring points #10–#24). In terms of relative displacement, different propagation velocities at elevations over 18.8 m caused a change in the trend of displacement growth, with the most obvious change under the condition of 500 m/s. The maximum relative displacement of the traveling wave effect during RSN983 wave action was 1.2 times that of the consistent input, and it could be up to 1.5 times that of the artificial wave action.
(3) The axial force and shear force are less affected by the propagation velocity and seismic wave, but the value increases significantly when the input is not consistent, and the maximum increase in axial force is 16.9 times. The concrete frame composed of monitoring points #6, #7, #11, and #12 is prone to tensile and compressive damage, and the center plate of the first floor is prone to shear damage. Monitoring point #1 (bottom of the left wall) has large values of axial force and shear force, and it is necessary to focus on strengthening the structure in this area.
(4) The extreme value of the structure stress response for non-uniform inputs is twice that of uniform inputs. Under different seismic waves, the increase in propagation velocity caused changes in the stress extremes, but the difference is less than 10%. The most significant stress response is observed at monitoring points #7, #11, and #12 (located in the frame structure composed of the first and second floor center plates and the first and second center columns), which indicates that this area is prone to stress concentration.
Although the analysis framework demonstrates good applicability, certain methodological limitations should be acknowledged. The use of a two-dimensional plane-strain model and the assumption of a rigid ground–structure connection may restrict the ability to capture torsional responses, out-of-plane effects, and nonlinear contact phenomena. These simplifications may introduce uncertainties in the evaluation of stress concentration and internal force redistribution under highly heterogeneous ground motions.
Future research may therefore focus on (i) extending the numerical framework to three-dimensional modeling to capture complex spatial vibration modes, (ii) incorporating nonlinear soil–structure contact behavior such as slippage and separation, and (iii) performing experimental or full-scale monitoring verification using additional underground infrastructure to further validate the generality of the findings.
Author Contributions

Z.W.: software, visualization, data curation, writing—original draft. H.C.: conceptualization, methodology, funding acquisition, supervision. Y.Z.: visualization, conceptualization. S.H.: investigation, writing—review and editing. G.H.: investigation, software. J.X.: writing—review and editing, conceptualization, methodology, investigation, funding acquisition. Z.Y.: methodology. Z.S.: investigation. All authors have read and agreed to the published version of the manuscript.

Funding

This research was funded by the National Natural Science Foundation of China (Grant No. 52378384 and No. 42407226); the Natural Science Foundation of Anhui Province, China (Grant No.2308085ME188); and the Fundamental Research Funds of AUST, China (No. 2024JBZD0008). And the APC was funded by the National Natural Science Foundation of China (Grant No. 42407226).

Data Availability Statement

The original contributions presented in this study are included in the article. Further inquiries can be directed to the corresponding author.

Conflicts of Interest

Yonggang Zhang is employed by China Construction Eighth Engineering Division Co., Ltd. Zhihong Yu and Zhonghe Sun are employed by China Construction Eighth Engineering Division Rail Transit Construction Co., Ltd. The companies have no role in the design and execution of this study, nor in the decision to publish this paper. Other co-authors have no other conflicts of interest to declare.

References

  1. Broere, W. Urban underground space: Solving the problems of today’s cities. Tunn. Undergr. Space Technol. 2024, 55, 245–248. [Google Scholar] [CrossRef]
  2. Yu, H.; Chen, G. Pseudo-static simplified analytical solution for seismic response of deep tunnels with arbitrary cross-section shapes. Comput. Geotech. 2021, 137, 104306. [Google Scholar] [CrossRef]
  3. Yu, H.; Chen, G. Analytical solution for seismic response of deep tunnels covered by an isolation layer subjected to SH waves. Int. J. Numer. Anal. Methods Geomech. 2023, 47, 3316–3330. [Google Scholar] [CrossRef]
  4. Chen, G.; Yu, H. Analytical Solution for Stresses and Displacements of Deep Tunnels With Rockbolts Support Subjected to P and SV Waves. Int. J. Numer. Anal. Methods Geomech. 2025, 49, 3357–3374. [Google Scholar] [CrossRef]
  5. Yue, J.; Liang, Q.; Fan, C.; Li, S.; Wang, L.; Sun, W. Dynamic response characteristics of a steep loess slope with a tunnel under earthquake action. Bull. Eng. Geol. Environ. 2024, 83, 164. [Google Scholar] [CrossRef]
  6. Wang, X.; Xu, C.; Yan, G.; Zhong, Z.; Zhang, Z. A three-dimensional numerical simulation method for seismic nonlinear response of underground structure in liquefiable site and analysis of structural damage. Comput. Geotech. 2024, 165, 105895. [Google Scholar] [CrossRef]
  7. Qiu, D.; Ma, B.; Ren, W.; Chen, J.; Wang, P. Seismic damage assessment for the underground large-scale frame structure based on the seismic failure path. Soil Dyn. Earthq. Eng. 2024, 182, 108704. [Google Scholar] [CrossRef]
  8. Xu, Z.; Zhuang, H.; Xia, Z.; Yang, J.; Bu, X. Study on the effect of burial depth on seismic response and seismic intensity measure of underground structures. Soil Dyn. Earthq. Eng. 2023, 166, 107782. [Google Scholar] [CrossRef]
  9. Cui, Z.D.; Zhang, L.J.; Zhan, Z.X. Seismic response analysis of shallowly buried subway station in inhomogeneous clay site. Soil Dyn. Earthq. Eng. 2023, 171, 107986. [Google Scholar] [CrossRef]
  10. Liu, J.; Wang, W.; Zhao, D.; Zhang, X. Integral response deformation method for seismic analysis of underground structure. Chin. J. Rock Mech. Eng. 2013, 32, 1618–1624. [Google Scholar]
  11. Bao, X.; Liu, J.; Li, S.; Lu, X.; Wang, F. Improvement of integral response deformation method for underground structures. Eng. Mech. 2023, 40, 76–86. [Google Scholar]
  12. Huh, J.; Tran, Q.H.; Haldar, A.; Park, I.; Ahn, J.-H. Seismic Vulnerability Assessment of a Shallow Two-Story Underground RC Box Structure. Appl. Sci. 2017, 7, 735. [Google Scholar] [CrossRef]
  13. Jiang, J.; EI Naggar, M.-H.; Du, X.; Xu, C. Seismic fragility curves for shallow buried subway station using pushover-based method. Tunn. Undergr. Space Technol. 2023, 135, 105059. [Google Scholar] [CrossRef]
  14. Xie, H.; Cai, H. Main Methods and Status of Seismic Research on Underground Metro Stations. Constr. Well Technology. Mine Constr. Technol. 2023, 44, 85–90. [Google Scholar]
  15. Shukla, D K; Rizzo, P C; Stephenson, Earthquake load analysis of tunnels and shafts: D E Proc 21st US Symposium on Rock Mechanics, Rolla, Missouri, 28–30 May 1980, P622–P631. Int. J. Rock Mech. Min. Sci. Geomech. Abstr. 1981, 18, 98. [CrossRef]
  16. Yao, H.X.; Dong, Z.Q.; Li, G.; Bao, X.; Yu, D.-H.; Li, J.-L. Near-fault free-field inversion for seismic response assessments of soil–structure interaction systems. Soil Dyn. Earthq. Eng. 2025, 198, 109567. [Google Scholar]
  17. Huang, C.; Fishman, K.L.; Richards, R., Jr. Seismic plastic deformation in the free-field. Int. J. Numer. Anal. Methods Geomech. 1999, 23, 45–60. [Google Scholar] [CrossRef]
  18. Jang, J.; Huang, W.; Zhao, K.; Chen, G.-X.; Du, X.-L. Seismic vulnerability analysis of underground structures of typical shallow-buried rectangular frame subway stations. Eng. Mech. 2024, 43, 151–156. [Google Scholar]
  19. Sun, W.; Lin, J.; Ma, Q.; Yan, S.-H.; Tong, H.; Liang, Q.-G. Seismic fragility assessment of circular metro tunnels in loess deposit. J. Cent. South Univ. 2024, 31, 950–964. [Google Scholar] [CrossRef]
  20. Chaudhary, M.T.A. Influence of site conditions on seismic design parameters for foundations as determined via nonlinear site response analysis. Front. Struct. Civ. Eng. 2021, 15, 275–303. [Google Scholar] [CrossRef]
  21. Chen, L.; Wang, Z.F.; Wang, Y.; Bai, X.; Lai, J. Characteristics and failure analysis of a railway tunnel collapse influenced by cavity in phyllite strata. Eng. Fail. Anal. 2024, 142, 106794. [Google Scholar] [CrossRef]
  22. Zhang, H.; Wang, C.X.; Wang, D.; Liu, Z.; Meng, S. Seismic susceptibility study of shallow buried integrated pipeline corridor under near-fault ground shaking. Eng. Mech. 2024, 41, 213–221. (In Chinese) [Google Scholar]
  23. Duan, C.; He, Z.; Shi, Y.; Xu, L.; Men, W.; Chen, R. Influence of site condition on seismic fragility of horseshoe-shaped tunnels. Tunn. Constr. 2023, 43, 252. [Google Scholar]
  24. Liu, G.; Geng, P.; Wang, T.; He, D.; Chen, Z.; Yao, C. Seismic fragility curves of circular tunnels in saturated sand. Eng. Fail. Anal. 2024, 157, 20. [Google Scholar] [CrossRef]
  25. Xu, M.; Cui, C.; Zhao, J.; Xu, C.; Zhang, P.; Su, J. Fuzzy seismic fragility analysis of underground structures considering multiple failure criteria. Tunn. Undergr. Space Technol. Inc. Trenchless Technol. Res. 2024, 145, 105614. [Google Scholar] [CrossRef]
  26. Ma, C.; Li, K.; Lu, D.; Li, X.; Liu, Z.; Du, X. Seismic fragility analysis of underground structures subjected to bi-directional ground motions based on the damage weight coefficients of components. Soil Dyn. Earthq. Eng. 2024, 178, 108437. [Google Scholar] [CrossRef]
  27. Zhang, J. Seismic Vulnerability Analysis of Underground Utility Tunnel. Master’s Thesis, Dalian University of Technology, Dalian, China, 2018. (In Chinese). [Google Scholar]
  28. Zhuang, H.; Cheng, S.; Chen, G. Numerical simulation and analysis of earthquake damages of Dakai metro station caused by Kobe earthquake. Rock Soil Mech. 2008, 29, 6. (In Chinese) [Google Scholar]
  29. Du, X.; Ma, C.; Lu, D.; Xu, C.; Xu, Z. Collapse simulation and failure mechanism analysis of the Daikai subway station under seismic loads. China Civ. Eng. J. 2000, 50, 11. (In Chinese) [Google Scholar]
  30. Diao, Y.; Li, C.; Li, H.; Dong, H.; Hao, E. Seismic performance assessment of a precast segmental column bridge considering soil–structure interaction and depth-varying multi-support ground motion inputs. Front. Struct. Civ. Eng. 2025, 19, 1478–1492. [Google Scholar] [CrossRef]
  31. Du, X.; Jiang, J.; Xu, Z.; Xu, C.; Liu, S. Study on quantification of seismic performance index for rectangular frame subway station structure. China Civ. Eng. J. 2019, 52, 111–119+128. (In Chinese) [Google Scholar]
  32. Li, W.S. Study on Seismic Performance Level Limits for Rectangular Frame Underground Structures. Master’s Thesis, Shanghai Normal University, Shanghai, China, 2023; p. 000211. (In Chinese). [Google Scholar]
  33. Wang, K. Seismic Vulnerability Analysis of Assembled Subway Underground Station Structure. Master’s Thesis, Soil Dynamics and Earthquake Engineering, Xi’an Technological University, Xi’an, China, 2022; p. 000338. (In Chinese). [Google Scholar]
  34. Chen, J.; Xu, C.; El Naggar, H.M.; Du, X. Quantification of seismic performance index limits and evaluation of seismic fragility for a new rectangular prefabricated subway station structure. Tunn. Undergr. Space Technol. 2023, 138, 105183. [Google Scholar] [CrossRef]
Figure 1. Location of the project.
Applsci 15 12264 g001
Figure 2. Model drawing of the main structure, travel tunnel, and schematic diagram of Section JD-36.
Applsci 15 12264 g002
Figure 3. Stress–strain curve of C40 concrete.
Applsci 15 12264 g003
Figure 4. Round shaking acceleration response spectrum curve.
Applsci 15 12264 g004
Figure 5. Configuration of Section JD-36 (mm).
Applsci 15 12264 g005
Figure 6. Grid diagram of the overall model and the grid diagram of the structure. (a) The two-dimensional model. (b) All intersection nodes of the structure are selected as monitoring points, and the mesh di-vision and numbering scheme.
Applsci 15 12264 g006
Figure 7. Plastic damage cloud of Section JD-36 under different intensities of seismic action. (a) 0.1 g. (b) 0.2 g. (c) 0.3 g. (d) 0.4 g. (e) 0.5 g. (f) 0.6 g. (g) 0.7 g. (h) 0.8 g.
Applsci 15 12264 g007aApplsci 15 12264 g007b
Figure 8. Angular distribution of interlayer displacements.
Applsci 15 12264 g008
Figure 9. Linear fitting results (The red line is the fitted line).
Applsci 15 12264 g009
Figure 10. Structure susceptibility curve.
Applsci 15 12264 g010
Figure 11. Structure damage state probability diagram.
Applsci 15 12264 g011
Figure 12. Vulnerability index.
Applsci 15 12264 g012
Figure 13. Input seismic waves. (a) Acceleration curves. (b) Fourier Spectra.
Applsci 15 12264 g013
Figure 14. Maximum overall displacement. (a) RSN746. (b) RSN983. (c) Artificial wave.
Applsci 15 12264 g014
Figure 15. Relative displacement of the structure under the action of the traveling wave effect. (a) RSN746. (b) RSN983. (c) Artificial wave.When the elevation exceeds 18.8 m (NU ramp layer), the displacement growth pattern undergoes a sudden change. Under the 500 m/s condition, the maximum relative displacement is 2.19 times that of the consistent input. Under 1000 m/s, the displacement reduction reaches 12%. And under 1500 m/s, it decreases by another 10% compared to the condition of 1000 m/s. Figure 15b shows that displacement curves for all conditions converge in the 0 to 18.8 m elevation range, but displacement sharply decreases for the condition of 500 m/s beyond this elevation, with a 20% increase in displacement at the variable cross-section for the condition of 1000 m/s. Under the 500 m/s condition, the displacement caused by artificial waves is significantly higher than under other conditions. At elevations above 18.8 m, the displacement growth rate increases by approximately 35% compared to lower elevations.
Applsci 15 12264 g015
Figure 16. Peak axial force at monitoring points. (a) RSN746. (b) RSN983. (c) Artificial wave.
Applsci 15 12264 g016
Figure 17. Peak shear force at monitoring points. (a) RSN746. (b) RSN983. (c) Artificial wave.
Applsci 15 12264 g017
Figure 18. Maximum and minor principal stresses under the action of RSN746. (a) Consistent input maximum principal stress. (b) Consistent input minimum principal stress. (c) Maximum principal stress at 500 m/s. (d) Minimum principal stress at 500 m/s. (e) Maximum principal stress at 1000 m/s. (f) Minimum principal stress at 1000 m/s. (g) Maximum principal stress at 1500 m/s. (h) Minimum principal stress at 1500 m/s.
Applsci 15 12264 g018
Table 1. Soil parameters.
Soil LayerMiscellaneous SoilStockpile SoilClay #1Clay #2Fine Sand
layer thickness, m1.52.524.319.313.6
density (ρ), kg/m319001790176017701840
shear wave velocity (Vs), m/s133.99117.75124.69135.74267.47
compressed wave velocity (Vp), m/s357.95340.89369.99425.97612.32
Poisson’s ratio (μ)0.20.150.350.40.3
elastic modulus (E), MPa81.8657.0873.8891.31342.25
cohesion strength (c), kPa12.515.215.018.25.5
internal friction angle (φ), º10.512.16.69.131.4
Table 2. Stress–strain relation.
StrainStress (Pa)StrainStress (Pa)
0.00026,500,0000.002217,639,256
0.000410,657,7720.002416,352,264
0.000613,909,6030.002614,998,125
0.000816,081,2500.002813,693,217
0.00117,474,6310.00312,492,396
0.001218,327,2170.003211,414,270
0.001418,809,6620.003410,458,480
0.001619,040,2380.00369,615,931
0.001819,098,8500.00388,874,319
0.00218,654,2060.0048,220,904
Table 3. Seismic wave parameters.
RSN NumberEarthquakeDuration (s)MagnitudePGA_X (g)
135Santa Barbara11.745.920.003672
147Coyote Lake26.865.740.2555
504Taiwan SMART1(40)28.616.320.1842
564Kalamata_Greece-0129.256.20.2386
724Superstition Hills-0222.146.540.1365
746Loma Prieta29.666.930.07123
983Northridge-0128.646.690.9949
987Northridge-0129.996.690.3185
1689Northridge-05205.130.02227
3746Cape Mendocino28.627.010.4776
4337Umbria Marche (foreshock)_Italy155.70.2962
6060Big Bear-0128.346.460.1423
8167San Simeon_CA29.456.520.0465
-Artificial seismic waves20-0.10
Table 4. Classification of performance levels.
Performance LevelPerformance Requirements
normal use (PL1)minor localized cracks in the structure, no cracks in the center columns, no repairs required for normal operation of the structure.
minor damage (PL2)The structure is slightly damaged, with clearly visible local cracks but no plastic hinges. The structure is basically intact and can be used normally with simple reinforcement of local cracks.
life safety (PL3)Macroscopic cracks at the joints of structure walls, slabs, and columns, with plastic hinges at the joints, require a longer period of time to repair before they can be returned to service.
preventing collapse (PL4)The building shows damage, and the structure is close to collapse and is difficult or impossible to repair.
Table 5. Quantification of injury indicators.
Damage LevelDetailed DescriptionQuantitative Scope
of the Indicator
mostly intactstructurally sound and in working orderθmax ≤ 1/1195
slightly damageda few members showed cracks1/1195 < θmax ≤ 1/505
moderate damagevisible cracks were present in most members, and concrete was peeling from wall, column, and slab joints1/505 < θmax ≤ 1/269
severe damagevisible cracks were present in almost all members1/269 < θmax ≤ 1/158
structure collapsethe structure suffered shear damage and collapsed1/158 ≤ θmax
Table 6. Probability table of structure damage state under different defense standards.
Defense StandardsDestructive State Probability
Basically IntactMinor DamageMedium DamageSerious DamageStructure Collapse
multi-earthquake99.94%0.05%000
protected against earthquakes68.62%30.02%1.34%0.02%0
rare earthquakes5.54%49.56%36.64%7.55%0.71%
very rare earthquakes0.51%19.30%46.15%27.04%7.00%
Table 7. Table of damage status indices.
Earthquake Damage IndexDamaged Condition
Basically
Intact
Minor
Damage
Medium
Damage
Serious
Damage
Structure
Collapse
upper and lower limits[0, 10][10, 20][30, 55][55, 85][85, 100]
average value51542.57092.5
Disclaimer/Publisher’s Note: The statements, opinions and data contained in all publications are solely those of the individual author(s) and contributor(s) and not of MDPI and/or the editor(s). MDPI and/or the editor(s) disclaim responsibility for any injury to people or property resulting from any ideas, methods, instructions or products referred to in the content.