3.1. Data Collection
Data were collected through a structured online questionnaire specifically designed for this study (see
Appendix A). The instrument included blocks on demographic and contextual information, knowledge and awareness of AI tools, frequency and purpose of AI use, strategies of self-regulation, and ethical and emotional reflections on AI in academic contexts. The questionnaire was distributed to undergraduate and graduate students at universities in the Valencian Community, Spain, between January and June 2025. Participation was voluntary, anonymous, and conducted in compliance with the EU General Data Protection Regulation (GDPR) and Spanish data protection laws. Prior to participation, all respondents were required to provide informed consent. A total of
valid responses were obtained after data cleaning, which served as the basis for the subsequent analyses.
The questionnaire was developed through a combined deductive–inductive process. As a conceptual starting point, we reviewed established AI literacy frameworks, including UNESCO’s AI guidance and the Meta-AI Literacy Scale (MAILS). These sources helped identify broad dimensions relevant for students’ engagement with AI—such as awareness of AI tools, responsible use, reflection, and interaction with AI systems—although the specific items in our questionnaire were developed independently to capture behavioral patterns more directly linked to academic practice. In addition, the instrument incorporated dimensions drawn from well-established research on self-regulated learning, including habits of revision, monitoring, and appropriate reliance on technological tools, which are increasingly relevant in AI-mediated learning environments.
Item wording went through an iterative refinement process involving internal expert review by the research team, who have extensive experience in survey design and AI-in-education research. A pilot study with approximately 50 students was conducted to assess clarity, response distribution, and completion time. Based on pilot feedback, we removed ambiguous items, simplified language, and ensured that the response formats produced sufficient variability without floor or ceiling effects. The resulting instrument tries to reflect both theoretical alignment with established frameworks and empirical adjustments based on early student input.
While the data were collected through a self-report questionnaire, the instrument was specifically designed to capture behavioral indicators (e.g., frequency of revision, reliance, or task-specific usage) rather than attitudinal perceptions, thus partially overcoming the limitations of traditional self-report methods. This design choice aligns with the study’s aim of inferring actual behavioral patterns from students’ reported practices rather than their subjective opinions about AI.
For the multi–item blocks, internal consistency was assessed using Cronbach’s alpha. Given the conceptual distinction between positive and negative emotional reactions, the emotional items were grouped into two subscales. The positive-emotion subscale (curiosity, calmness, motivation) demonstrated excellent reliability (Cronbach’s
= 0.90), and the negative-emotion and ethical-reflection subscale (guilt, ethical doubt, stress, distrust) also showed excellent reliability (Cronbach’s
= 0.92). These coefficients indicate that the items within each subscale measure coherent constructs and are suitable for use as external validators of the behavioral profiles. Detailed coefficients are reported in
Table 2.
All analyses were conducted using IBM SPSS Statistics (v29; IBM Corp., Armonk, NY, USA) and Python (v3.11; Python Software Foundation, Wilmington, DE, USA) in Google Colab (Google LLC, Mountain View, CA, USA). Data preprocessing included removal of incomplete responses (less than 80% completion), recoding of categorical variables, and standardization of continuous variables as z-scores. Assumptions of normality and homogeneity were checked before applying parametric tests. Descriptive and inferential analyses (ANOVA, Kruskal–Wallis, and multinomial logistic regression) were performed in SPSS, while clustering and topological analyses were implemented in Python using the pandas (PyData/NumFOCUS, Austin, TX, USA), scikit-learn (Inria, Paris, France), and KeplerMapper (open-source Python TDA project) libraries. All scripts and procedures followed a reproducible pipeline consistent with the three research questions presented at the end of the Introduction.
3.3. Clustering of AI Competency Profiles
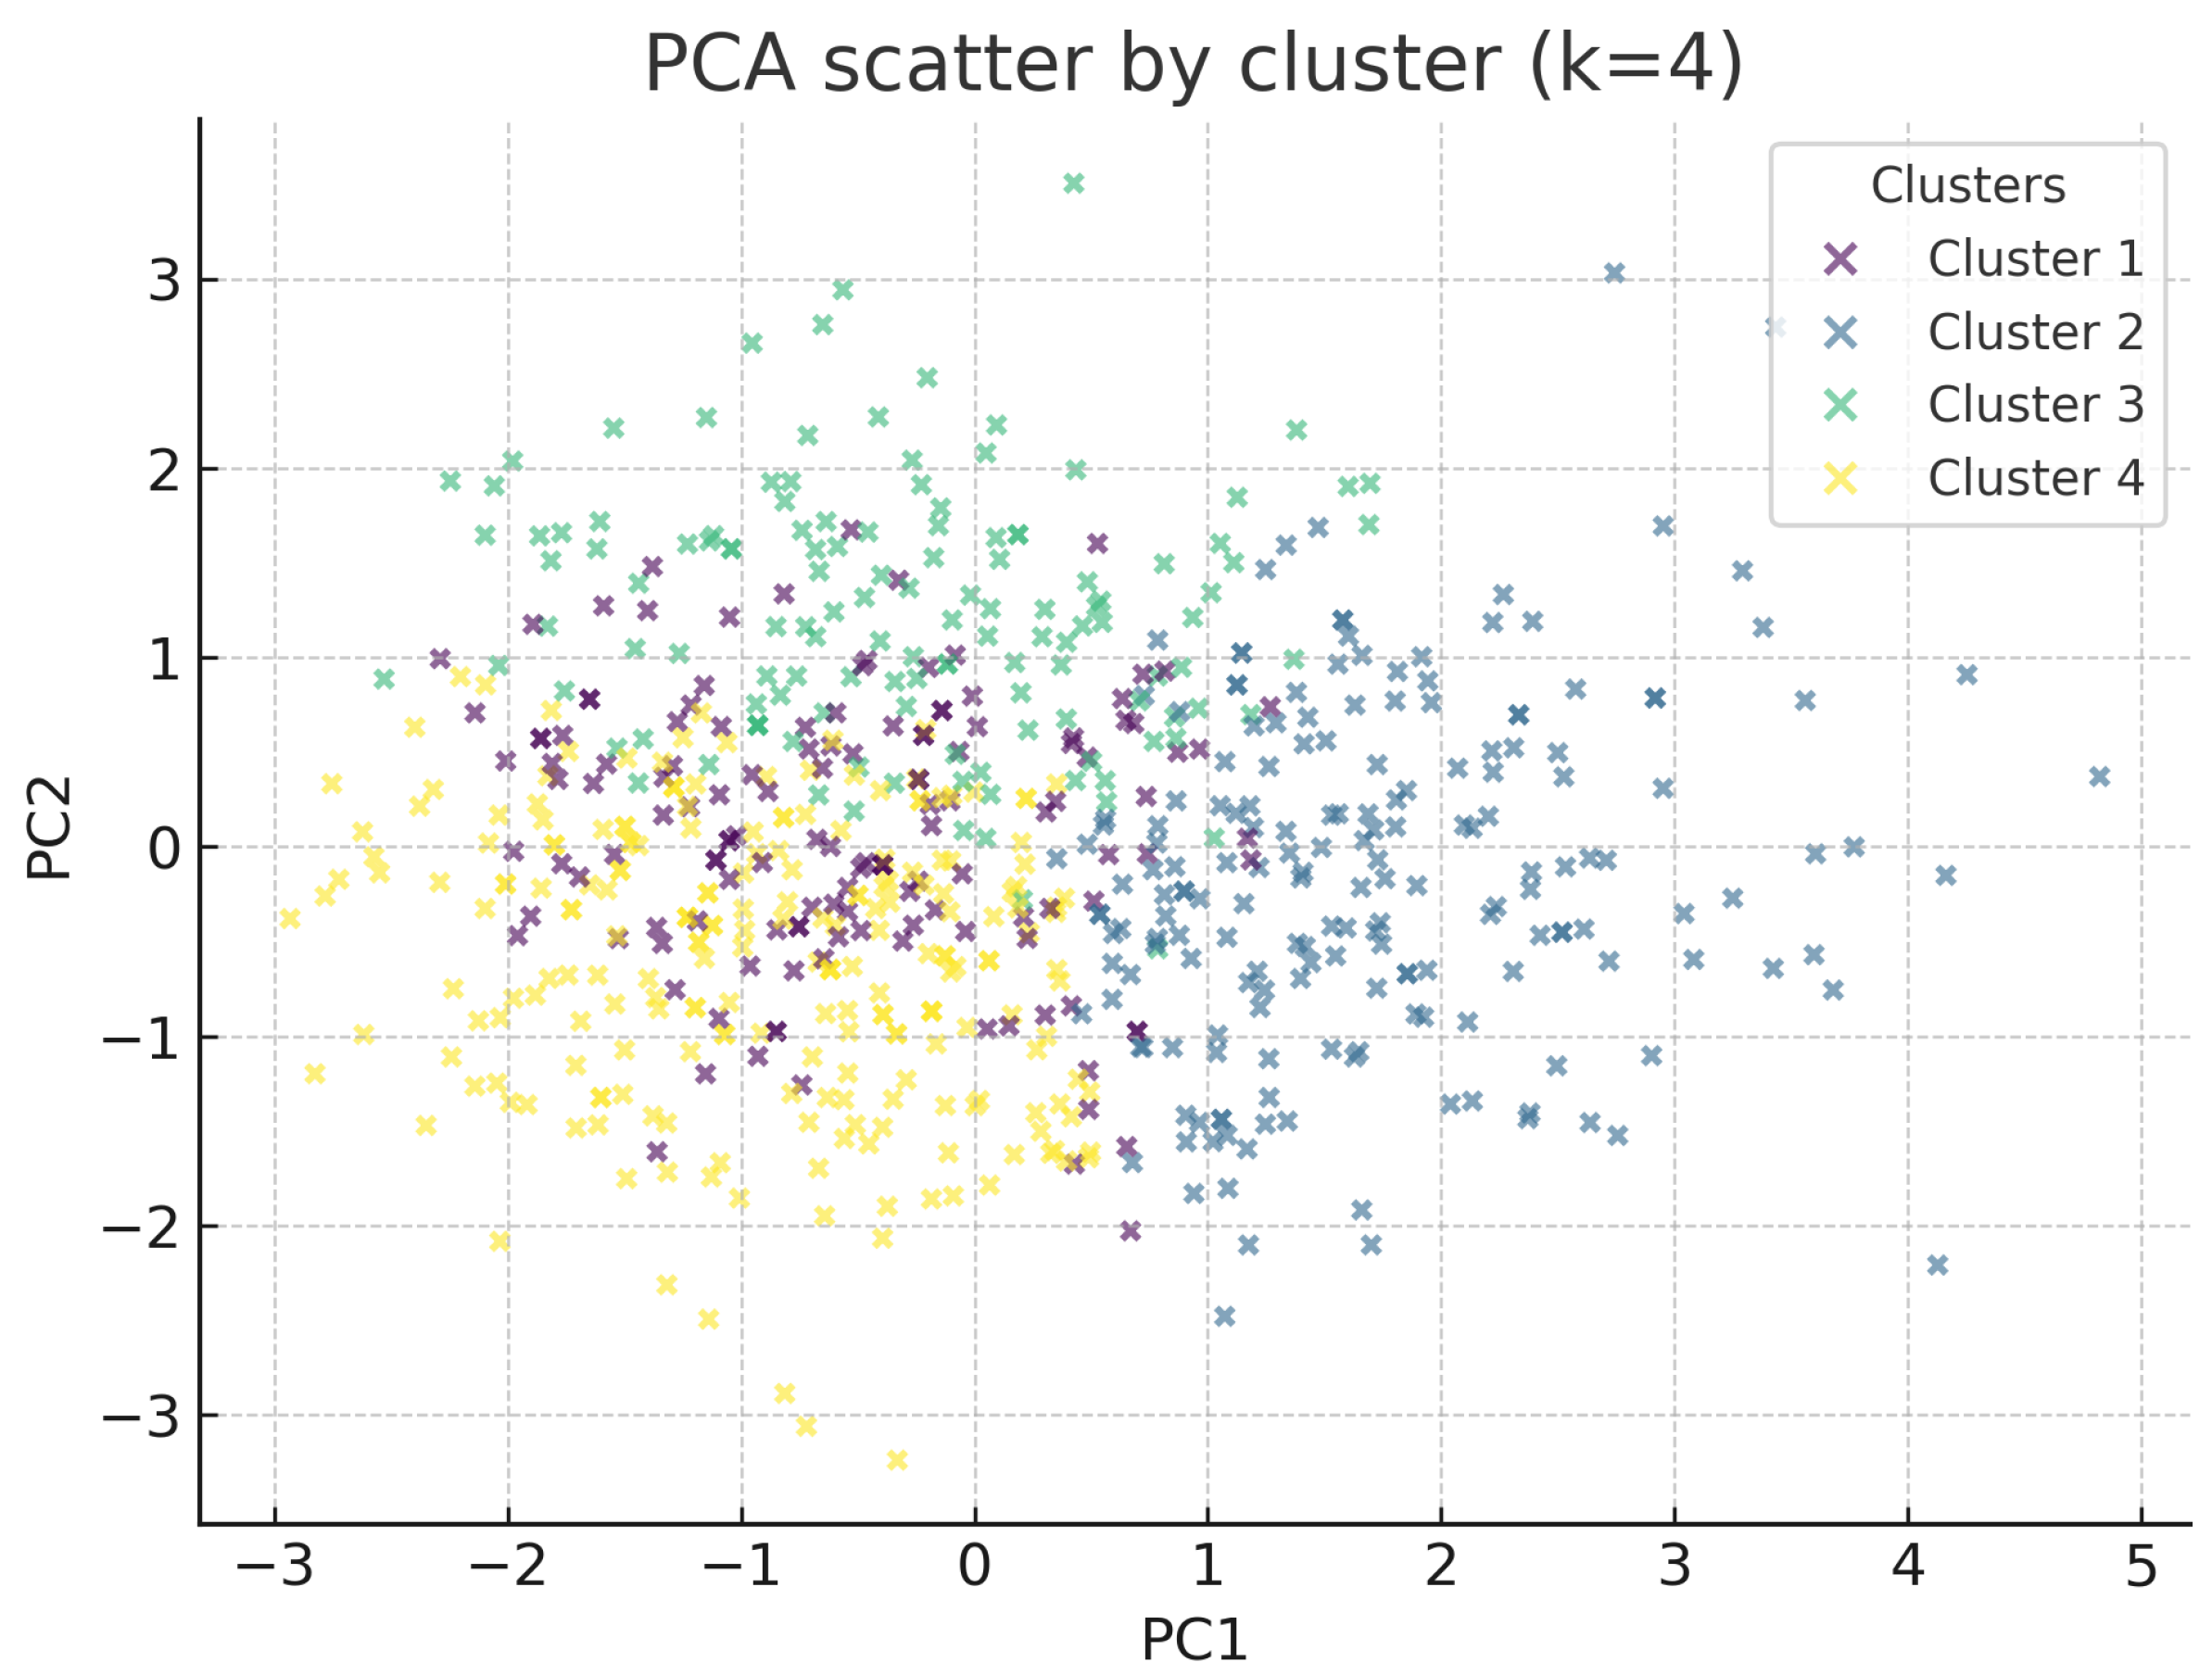
To identify distinct patterns of AI use and competency among students, we conducted a cluster analysis using the k-means algorithm, which is an unsupervised machine learning technique that partitions observations into k clusters by minimizing within-cluster variance while maximizing between-cluster differences. The algorithm is widely used in educational and social sciences to detect hidden profiles in survey data.
We selected variables reflecting frequency and purpose of AI use, self-regulation (revision and overreliance), ethical concern (plagiarism, impact on learning), and emotional responses (curiosity, motivation, stress, distrust). Prior to clustering, variables were standardized (z-scores) to ensure equal weighting.
All variables included in the clustering were selected based on theoretical relevance to AI use, self-regulation, and ethical engagement, following recommendations from previous empirical studies on digital and AI literacy [
1,
10,
19]. This ensures that the resulting clusters reflect meaningful patterns grounded in established constructs rather than purely statistical separations.
This selection focuses on the most theoretically relevant and empirically recurrent behavioral patterns documented in AI literacy and self-regulated learning research, providing a robust basis for identifying meaningful usage profiles while acknowledging that student behavior may include additional nuances beyond the scope of an exploratory survey.
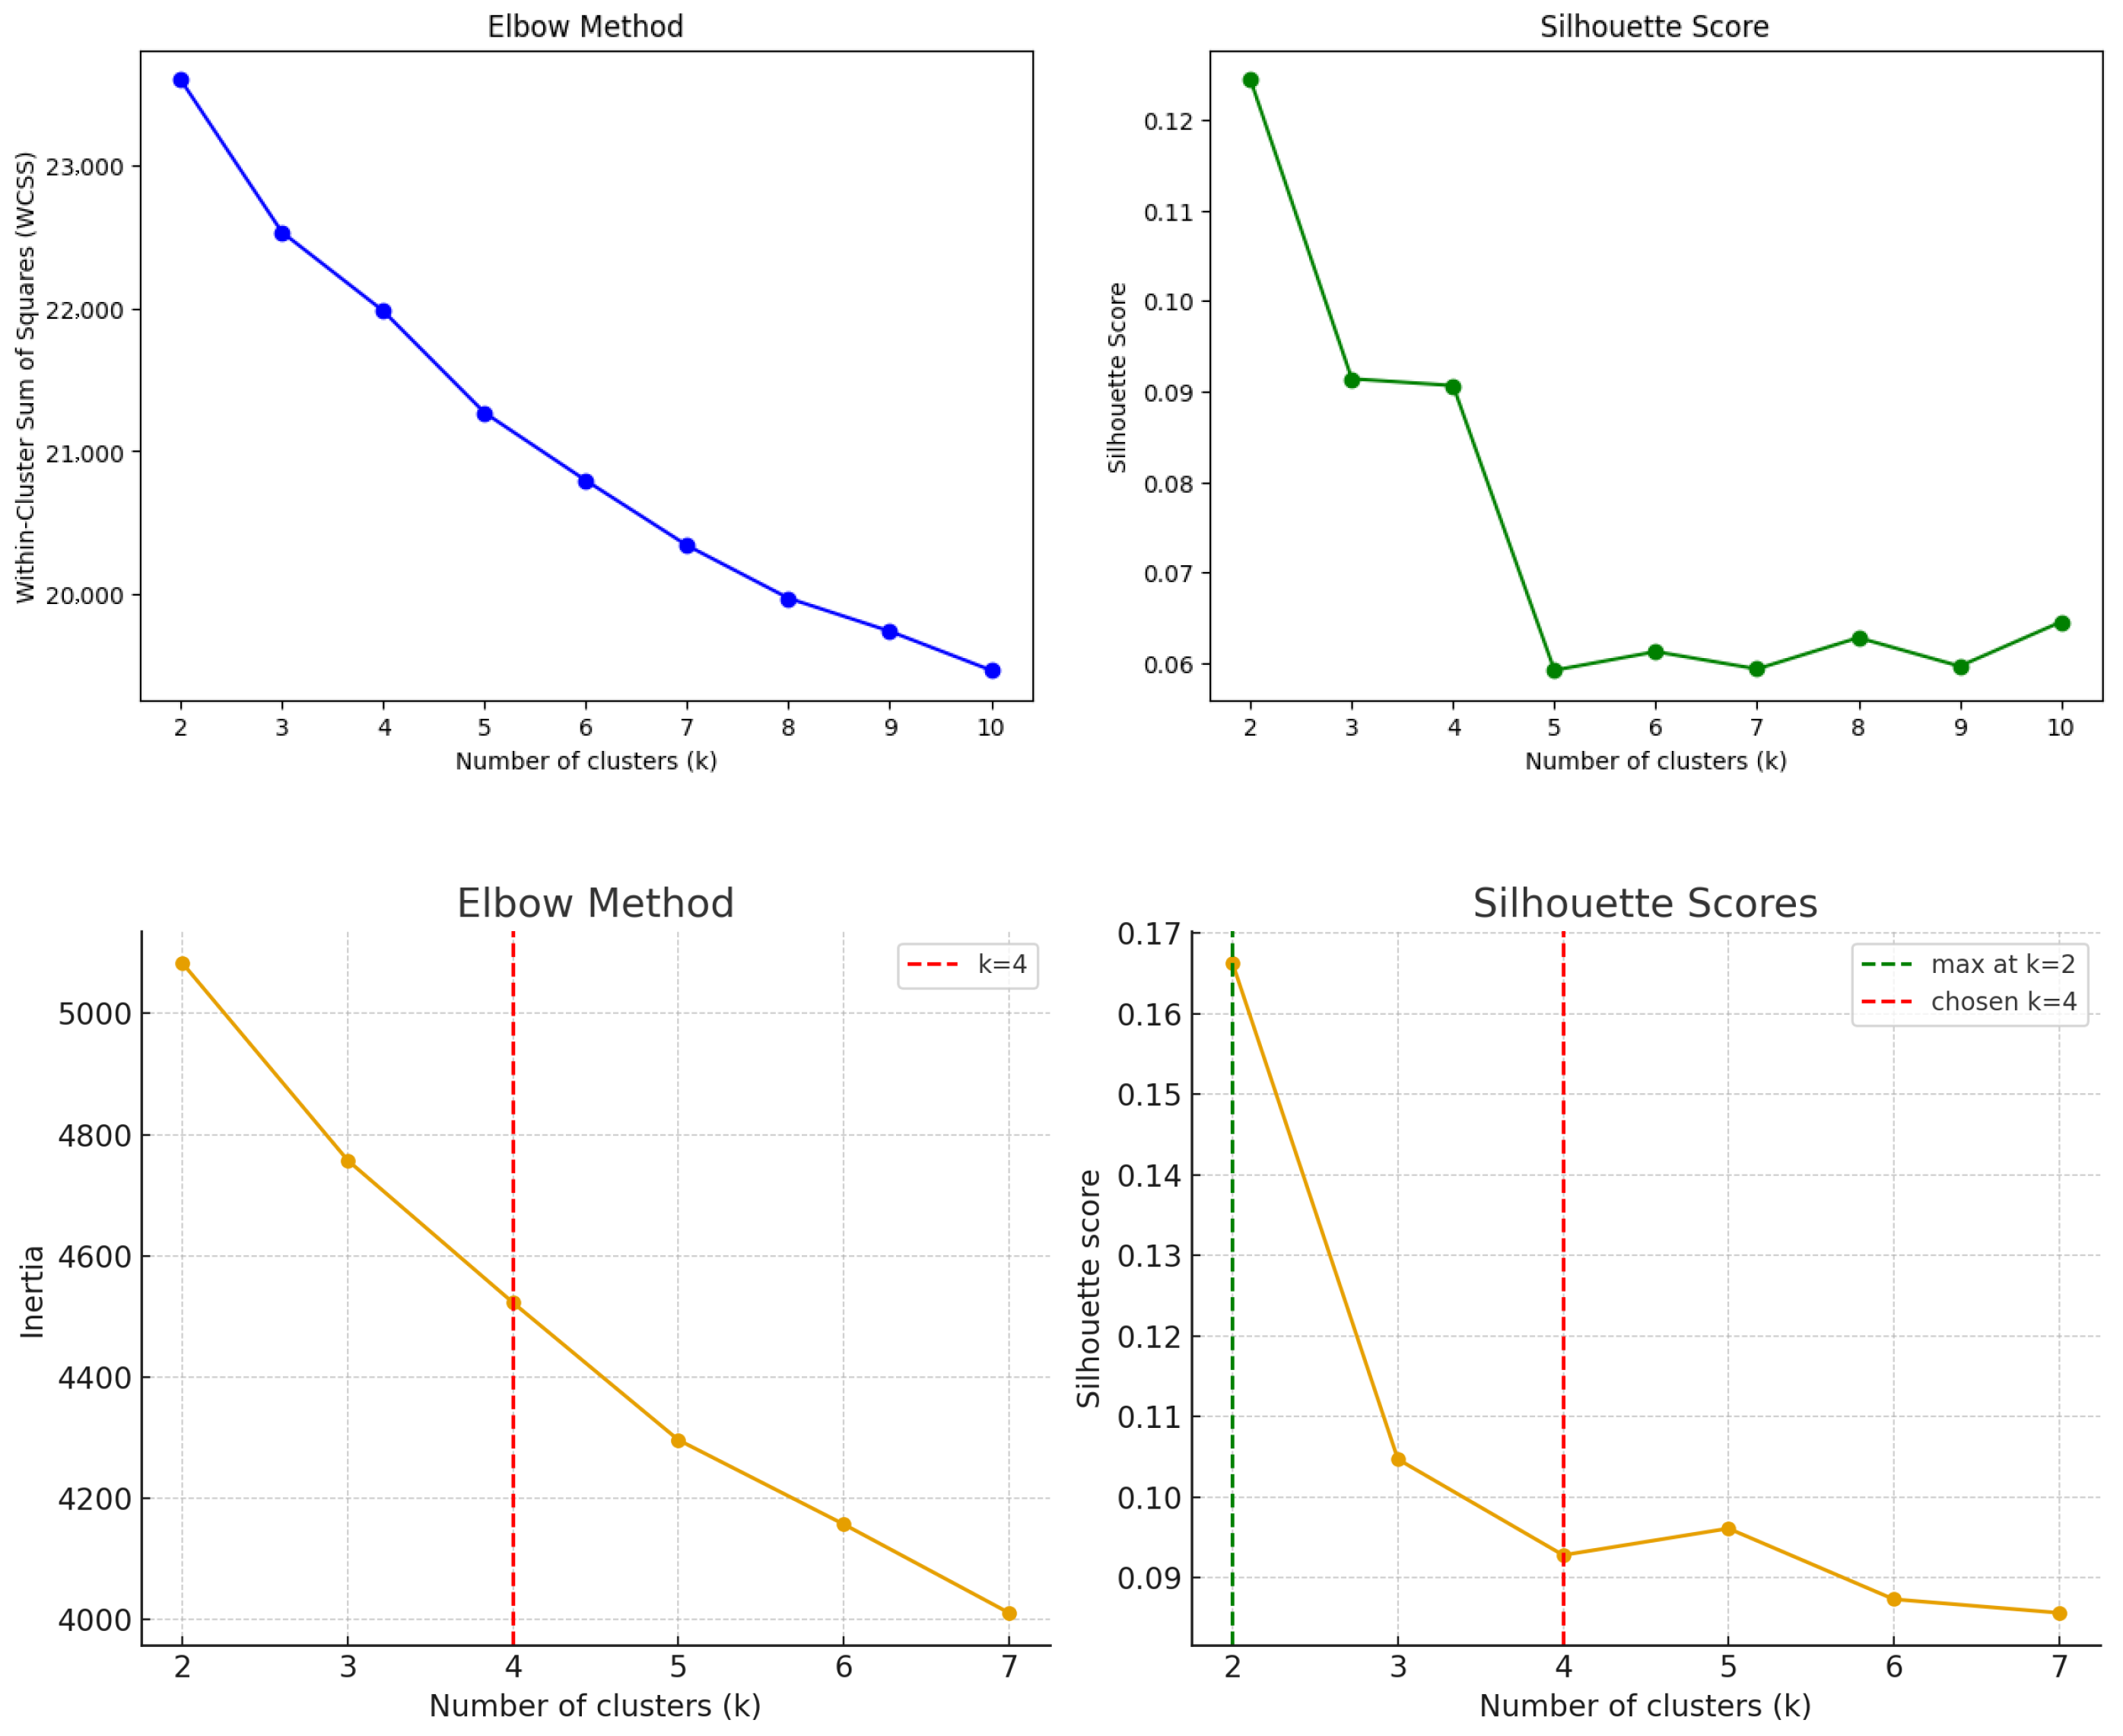
The optimal number of clusters was determined by examining the elbow criterion (inertia plot) and silhouette scores. Both criteria suggested that a solution with four clusters provided a proper balance between parsimony and interpretability. This choice is also consistent with theoretical frameworks distinguishing between low, medium, high, and advanced competency levels. Although the algorithm produced four clusters, in the interpretation of the results, we refer to them as profiles. This terminology tries to emphasize that the groups represent emergent patterns of AI use and competency rather than fixed categories or hierarchical levels. Using the notion of profiles allows us to highlight behavioral tendencies and educational implications, while avoiding the prescriptive connotations of terms such as “levels.”
Although the silhouette coefficient slightly increased again for , that solution produced an additional split within the high-engagement group without improving the interpretability or balance of cluster sizes. Therefore, the solution was retained as theoretically meaningful, allowing clearer differentiation of behavioral tendencies while avoiding artificial subdivision of similar profiles. This choice was further supported by the elbow criterion, which indicated diminishing returns in explained variance beyond four clusters.
Profile Assignment for New Students
Although the primary goal of this study was exploratory, the identified profiles can also serve as reference categories for new students. Once cluster centroids are established, a new participant’s responses can be standardized and compared to these centroids using distance-based classification (e.g., nearest centroid assignment). This procedure allows assigning each new student to the most similar competency profile without re-estimating the full clustering model. In practice, this approach could support educators in diagnosing students’ AI competency and tailoring interventions accordingly. Future work could extend this approach by developing a short-form questionnaire or predictive model to enable faster classification in applied settings.
This procedure also enables a continuous ranking score (e.g., inverse distance to higher-profile centroids) that can be reported in a strictly formative manner to guide feedback and support.
3.5. Data Analysis: An Exploratory Topological Approach
To identify emergent, non-obvious groupings within the multidimensional survey data, we employed Topological Data Analysis (TDA). TDA is a framework from computational mathematics that analyzes the “shape” of data, excelling at identifying clusters, loops, and connections within high-dimensional datasets that may be missed by traditional methods [
12]. This approach is particularly suited to the exploratory goal of discovering profiles without imposing strong a priori assumptions about their number or nature.
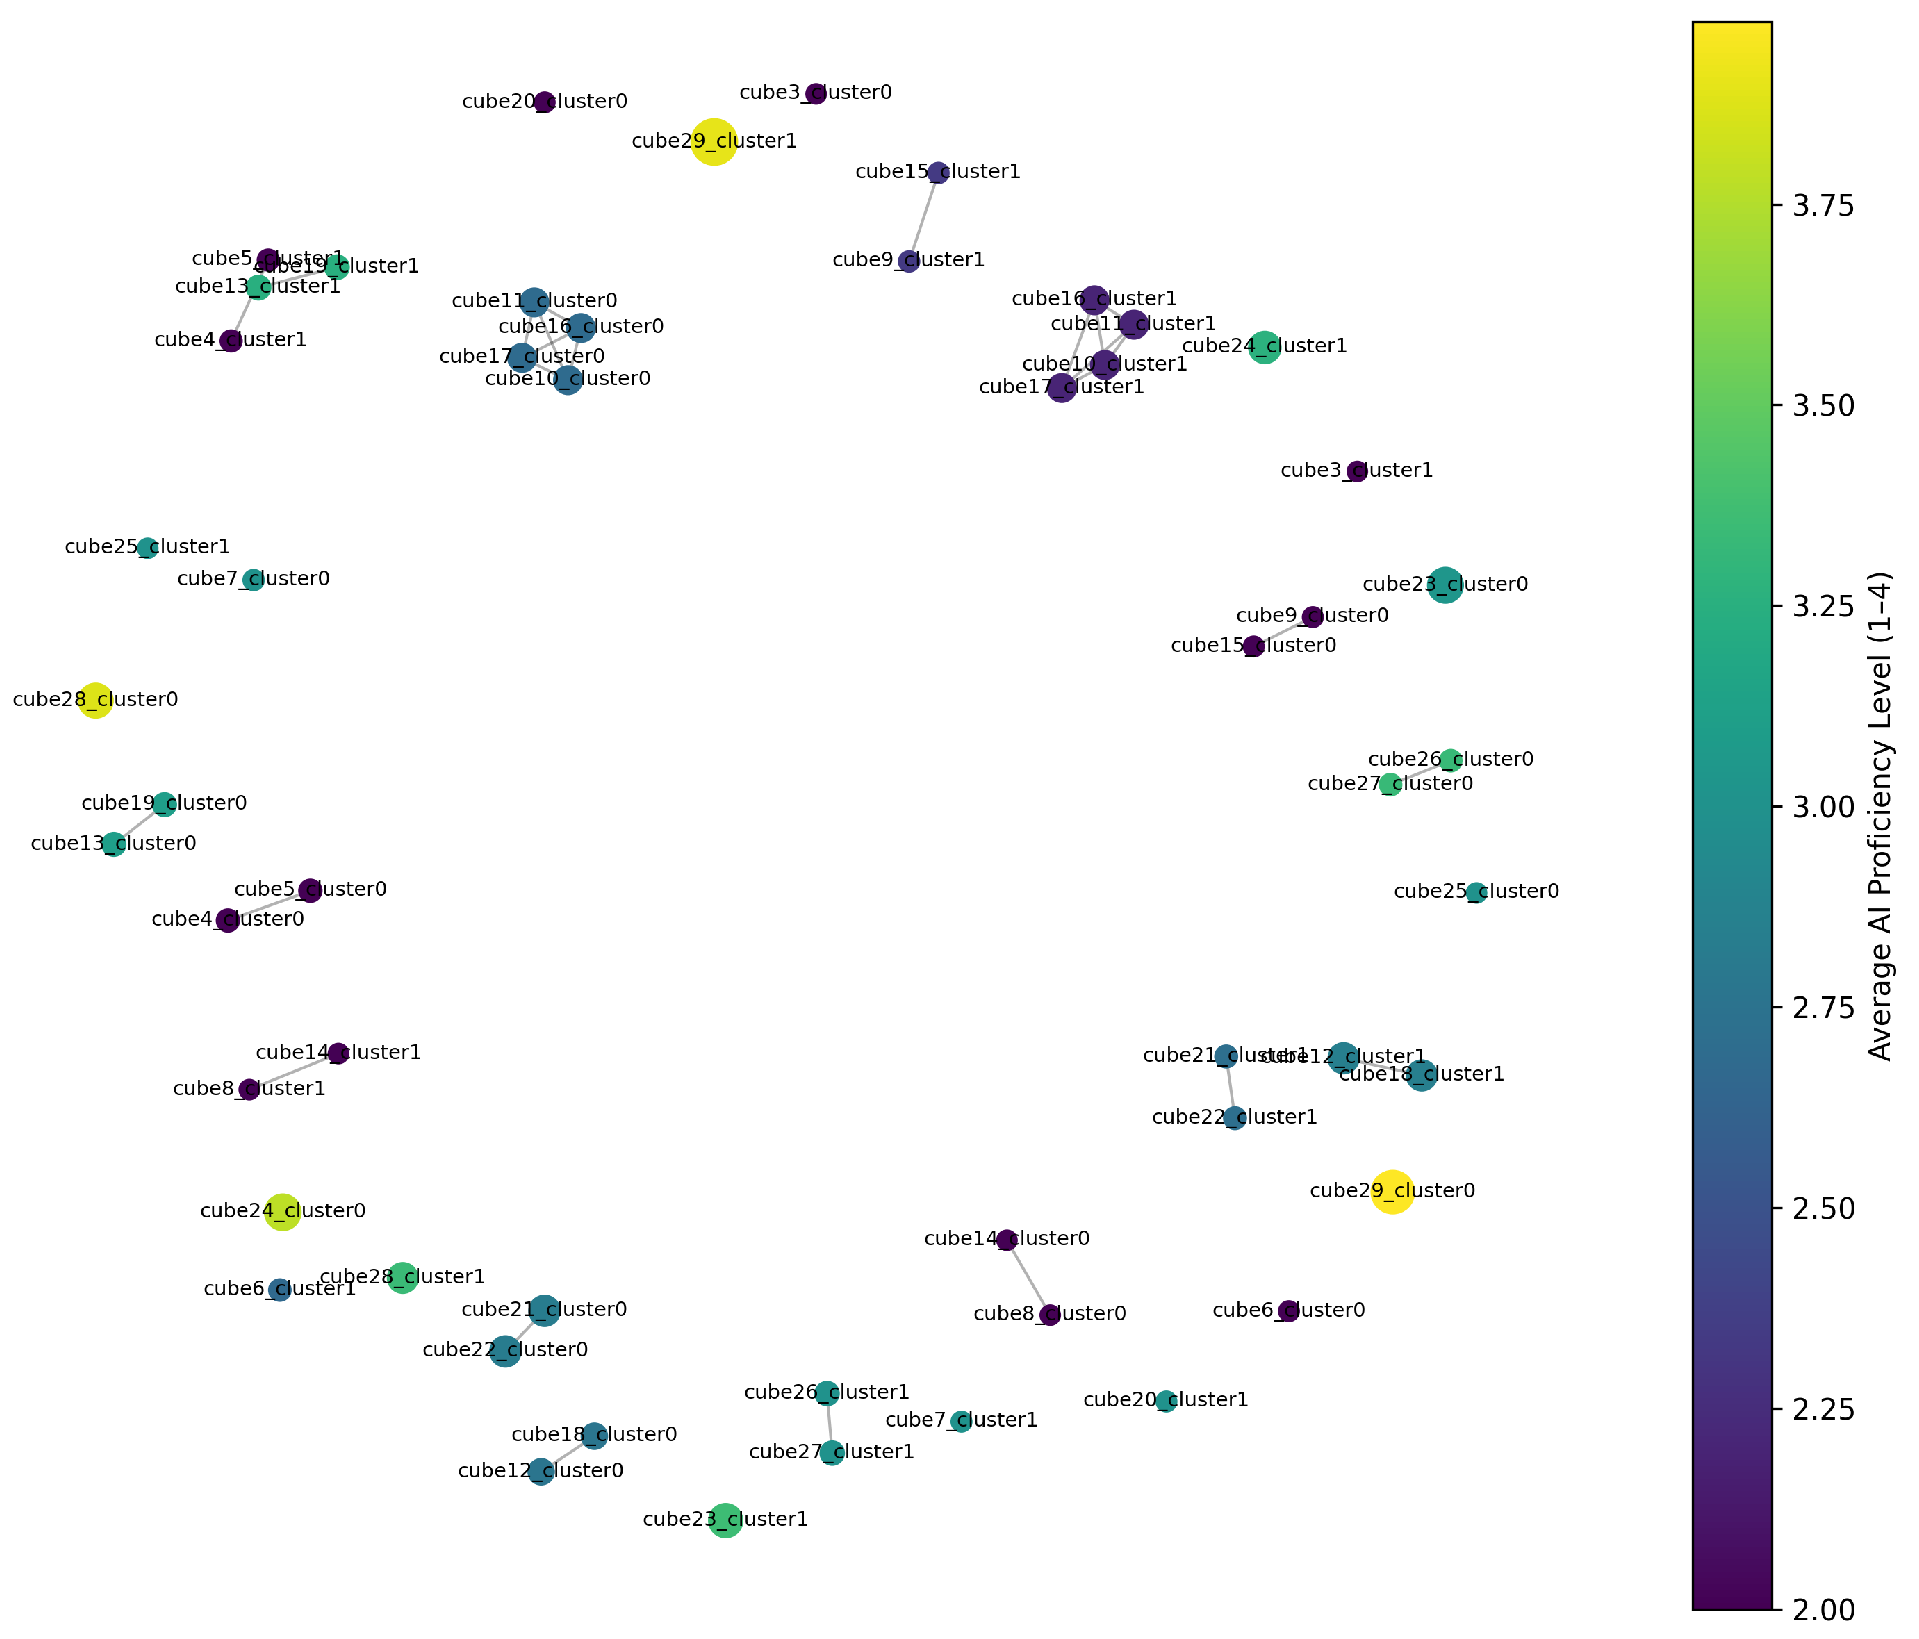
We utilized the Mapper algorithm [
13], which provides an intuitive, topological summary of the entire dataset. In this representation, distinct nodes and connected components can be interpreted as potential prototypical profiles of student AI tool usage. The structural insights derived from the Mapper graph were then used to guide further analysis. On the one hand, the number and relationships of persistent clusters observed in the graph offered guidance for selecting an appropriate value of
k and interpreting the results of a subsequent partition-based method such as k-means. On the other hand, the significant nodes of the Mapper graph, characterized by the average values of their constituent data points, could be directly interpreted as usage profiles. This flexible approach allows the data’s intrinsic topology to dictate the grouping strategy, ensuring that the identified profiles genuinely reflect underlying patterns in student behavior rather than being artifacts of a particular clustering algorithm.
3.6. Analytical Framework for AI Competency Assessment
To consolidate the methodological design, this study adopts a practical analytical framework for assessing students’ AI competency through behavioral evidence. The framework integrates three sequential stages that together form a coherent process of empirical inference and pedagogical interpretation.
First, behavioral data collection was carried out through a structured questionnaire designed to capture not only frequency of AI use but also self-regulation, ethical awareness, and emotional engagement (see
Appendix A). Second, computational modeling was applied to reveal latent structures in students’ reported behaviors. This stage combined clustering analysis (k-means) and Topological Data Analysis (Mapper) to detect both discrete profiles and continuous transitions among them. Finally, educational interpretation and formative ranking were performed, aligning the resulting profiles with existing AI literacy frameworks and interpreting them as progressive levels of competency development rather than static categories.
This integrated framework offers a reproducible path from data collection to pedagogical application, supporting institutions in identifying behavioral patterns of AI use and designing targeted learning interventions that promote responsible, autonomous, and ethically aware engagement with AI.
The diagram in
Figure 1 provides a concise overview of the entire methodological process. It shows how the study progressed from the design and collection of behavioral data to the computational modeling phase—combining clustering and topological analysis—and finally to the stage of educational interpretation. This visual synthesis clarifies the logical flow of the empirical work and helps avoid redundancy among the methodological subsections by integrating them into a single coherent structure.


