Article

Synthetic Data Generation Pipeline for Multi-Task Deep Learning-Based Catheter 3D Reconstruction and Segmentation from Biplanar X-Ray Images

1
State Key Laboratory for Artificial Microstructure & Mesoscopic Physics, School of Physics, Peking University, Beijing 100871, China
2
Beijing Qubot Holdings Limited, Beijing 100871, China
*
Author to whom correspondence should be addressed.
Appl. Sci. 2025, 15(22), 12247; https://doi.org/10.3390/app152212247
Submission received: 15 October 2025 / Revised: 14 November 2025 / Accepted: 15 November 2025 / Published: 18 November 2025

Abstract

Catheter three-dimensional (3D) position reconstruction is a technology that reconstructs spatial positions from multiple two-dimensional (2D) images. It plays a pivotal role in endovascular surgical navigation, guiding surgical catheters during minimally invasive procedures within vessels. While deep learning approaches have demonstrated significant potential for catheter 3D reconstruction, their clinical applicability is limited due to the lack of annotated datasets. In this work, we propose a synthetic data generation pipeline coupled with a multi-task deep learning framework for simultaneous catheter 3D reconstruction and segmentation from biplanar 2D X-ray images. Our pipeline begins with a novel synthetic data generation methodology that creates realistic catheter datasets with precise ground truth annotations. We next present a combined catheter segmentation and 3D reconstruction architecture, utilizing shared encoder features, in the context of a multi-task deep learning framework. Finally, our work demonstrates the effectiveness of the synthetic data generation method for training deep learning models for 3D reconstruction and segmentation of medical instruments.

1. Introduction

Endovascular intervention is a minimally invasive and widely adopted treatment for cerebrovascular and cardiovascular diseases. Compared to open surgery, it involves a small incision, causing less trauma, lower infection risk, and faster recovery.
However, endovascular intervention requires precise navigation of surgical instruments within the complex vascular environment. During the procedure, guidewires and catheters are inserted into the vasculature through the femoral artery, which is considerably distant from the target lesion. Guided by two-dimensional (2D) X-ray fluoroscopy images, interventional radiologists navigate the inserted instruments to the target lesion for treatment. This navigation process requires exceptional manipulation skills and extensive experience, as well as three-dimensional (3D) spatial awareness to avoid instrument–vessel collisions that could lead to fatal bleeding and penetration.
To mitigate the risk of instrument-vessel collision, the so-called roadmap image is used to guide the navigation of the inserted instruments. The roadmap image is a 2D subtraction image of a digital subtraction angiography (DSA) image and a fluoroscopy image, which provides a 2D relative distance of the inserted instruments to the vessel wall. While this approach has improved procedural safety, it remains fundamentally limited by its two-dimensional nature.
Recently, the magnetically controlled catheter and guidewire navigation systems [1,2,3,4] have been developed to navigate the inserted instruments with magnet tip [5,6,7] to the target lesion. These systems require 3D instrument reconstruction to provide precise navigation in the magnetic field workspace. However, the roadmap image is only a 2D image, which cannot provide the three-dimensional spatial information of the inserted instruments. Consequently, there is an urgent need for real-time instrument 3D position reconstruction and segmentation methods. Such methods would not only directly provide visual feedback to the interventional radiologists, but also serve as a fundamental component for emerging robot-assisted surgical systems that require precise instrument spatial positioning for surgical decision-making.
Over the past decade, several works have attempted to address the medical instrument 3D reconstruction problem through traditional computer vision techniques that implement instrument segmentation and the application of epipolar geometry. Hoffmann et al. [8,9,10] proposed a semi-automatic catheter segmentation and reconstruction method from two views, which relies on manual seed point selection and the application of tree structured graph search algorithms. Delmas et al. [11] proposed an algorithm that reconstructs 3D curves of instruments from two fluoroscopic views by leveraging epipolar geometry and graph optimization. Petković et al. [12] proposed a real-time catheter reconstruction method from a monoplanar X-ray by optimizing the best match of the backprojection of the catheter. Wagner et al. [13] introduced a method for 4D catheter reconstruction utilizing a biplanar X-ray time sequences, which were registered using an elastic grid registration technique and then reconstructed through epipolar geometry reconstruction techniques. The aforementioned methods rely on threshold selection and may not possess strong generalization capabilities, limiting their clinical applicability across diverse imaging conditions and instrument types.
Meanwhile, leveraging the impressive results that the U-net architecture has shown in medical image segmentation [14], various works have attempted to address the catheter segmentation and 3D reconstruction problem by utilizing deep learning techniques. Several U-net architecture neural networks have been proposed to segment the catheters from X-ray fluoroscopy images [15,16,17]. Moreover, multi-task networks have been studied for real-time catheter segmentation and 2D tip point localization from fluoroscopy images [18,19]. Three-dimensional guidewire reconstruction networks have been proposed to predict the 3D guidewire points directly from a monoplanar X-ray fluoroscopy image [20] and biplanar X-ray fluoroscopy images [21]. However, deep learning techniques heavily rely on the quantity and quality of training data. The lack of publicly available training data poses a significant challenge for these methods. Although some studies have made their datasets public [21], these datasets often lack diversity in terms of guidewire types and backgrounds. In particular, the design of the magnetic instruments typically differs in shape and construction from standard instruments.
In this work, we present a methodology to construct a custom dataset and a novel deep learning network for catheter 3D reconstruction and segmentation from a pair of biplanar X-ray images, which can be deployed in a biplanar X-ray system (Figure 1). Our approach addresses several key challenges inherent to this task: (1) low signal-to-noise ratio and movement artifacts in X-ray fluoroscopy images, (2) difficulty in obtaining ground truth 3D catheter positions for model training, and (3) discontinuity issues in catheter reconstruction and length prediction limitations of previous deep learning methods.
To overcome these challenges, we employ instrument subtraction images (the difference between fluoroscopy and mask images) as input to our deep learning model instead of original X-ray fluoroscopy images. This preprocessing step effectively removes irrelevant anatomical information such as skeletal structures and organs, thereby allowing the model to focus exclusively on the instrument and improving the generalization ability across diverse imaging conditions. To address the scarcity of ground truth data, we introduce a methodology to construct a custom dataset and leverage synthetic data to train our model, circumventing the difficulty in obtaining accurate 3D catheter positions. Our method represents the catheter as a cubic B-spline curve, with our deep learning model predicting the positions of control points rather than direct catheter positions. Additionally, our model simultaneously predicts catheter segmentation masks and 3D catheter positions by leveraging shared encoder hidden representations. This integrated approach successfully resolves the discontinuity issues in catheter reconstruction and overcomes the computational limitations of previous methods, enabling real-time performance. Experimental results demonstrate the efficacy of our approach, achieving a dice score of 0.83 for catheter segmentation and a reprojection dice score of 0.40 for catheter 3D reconstruction on an experimental dataset.

2. Materials and Methods

2.1. Data Synthesis

One of the main challenges in catheter 3D position reconstruction is the scarcity of ground truth 3D catheter positions for model training. To overcome this limitation, we developed a comprehensive synthetic data generation pipeline. Without loss of generality, we develop a specifically designed catheter featuring a magnetic tip as an example for subsequent discussions. This catheter can be easily adapted for use in magnetically controlled catheter systems [1,2,3,4,5,6,7]. The sectional view of the synthetic catheter is shown in Figure 2. A magnet ring is located at the tip of the catheter, composed of neodymium iron boron (NdFeB). The catheter’s body consists of a polytetrafluoroethylene (PTFE) liner tube surrounded by a spring and enclosed in an outer shell made of Pebax elastomer, whose outer diameter (OD) is 1.7 millimeter (mm) and inner diameter (ID) is 1.4 mm.
To generate catheters with various shapes, we create cubic B-spline curves to serve as the catheters’ skeletons by randomly generating control points. We then sample 1000 3D points from each curve to serve as the ground truth for training data. Using these skeletons and setting the outer diameter of the catheter to 1.7 mm and the inner diameter to 1.4 mm, we generate corresponding synthetic catheter meshes with Blender [22]. These meshes are then projected into synthetic X-ray catheter images using gVirtualXray [23], an open-source virtual X-ray imaging library that relies on the Beer–Lambert law. In this work, we set the source-to-image distance (SID) to 1200 mm and the source-to-object distance to 788 mm, using a detector with a size of 430 × 430 mm and a resolution of 512 × 512 . The pixel intensity of the synthetic X-ray catheter image is calculated by integrating the linear attenuation coefficient along the ray path with the Beer–Lambert law [23]:
I c ( x , y ) = i N bin R ( E i ) D ( E i ) exp ( j μ j ( E i ) d j ( x , y ) ) ,
where I c ( x , y ) is the intensity of catheter X-ray image at pixel ( x , y ) . The emitted X-ray spectrum is discretized in N bin energy bins. E i corresponds to the energy of the i-th energy bin. D ( E i ) is the number of photons emitted by the X-ray source with energy E i . R ( E i ) is the response function of the detector. Quantum noise and electronic noise can be introduced into the X-ray image through D ( E i ) and R ( E i ) . μ j ( E i ) is the linear attenuation coefficient of the j-th material at energy E i , and d j ( x , y ) is the path length along the ray path from the X-ray source to the pixel ( x , y ) through the j-th material.
For an effective simulation, one can apply a monochromatic X-ray source. In such case, the emitted X-ray spectrum is a delta function, and Equation (1) can be simplified to:
I c ( x , y ) = R ( E ) D ( E ) exp ( j μ j ( E ) d j ( x , y ) ) ,
where E is the energy of the X-ray source. Then the natural logarithm of the intensity is
ln I c ( x , y ) = j μ j ( E ) d j ( x , y ) + C ,
where C = ln R ( E ) + ln D ( E ) is a constant. The natural logarithm of the intensity is a linear function of the path length through the materials, which directly contains the information of the material thickness and composition.
To simulate anatomical structures, we employ TIGRE [24], an open-source computed tomography (CT) toolbox, which provides tools to project volumetric CT scan data into synthetic 2D X-ray anatomical images. The voxel value of the volumetric CT scan data is the Hounsfield unit (HU) of the corresponding voxel in the CT scan data. Equation (4) shows the relationship between the linear attenuation coefficient μ and the HU value of voxel i,
H U i = μ i μ w a t e r μ w a t e r μ a i r × 1000 ,
where μ w a t e r and μ a i r are the linear attenuation coefficients of water and air, respectively. The linear attenuation coefficient of water and air can be obtained from the National Institute of Standards and Technology (NIST) database [25]. One can easily obtain the linear attenuation coefficient μ i = H U i μ w a t e r μ a i r 1000 + μ w a t e r for each voxel from the CT scan data.
The TIGRE toolbox projects the volumetric linear attenuation coefficient data into synthetic 2D X-ray images by integrating the voxel values along the ray path. The intensity of one pixel on the synthetic anatomical X-ray image I a ( x , y ) can be described by Equation (5),
I a ( x , y ) = i = 1 N ( μ i × d i ( x , y ) ) ,
where N is the number of voxels along the ray path, and μ i is the linear attenuation coefficient of voxel i.
This approach enables us to generate anatomical X-ray images. One example is shown in Figure 3b, which simulates pre-inserted catheter conditions. The CT volumetric data utilized come from a publicly available dataset on PhysioNet [26,27,28]. Furthermore, in order to enhance the realism of the synthetic data, we apply affine and deformation transformations to volumetric CT scan data to simulate the patient’s motion during the fluoroscopy image simulation procedure, which can be expressed as
μ ˜ i = f ( μ i ) ,
I a ˜ ( x , y ) = i = 1 N ( μ ˜ i × d i ( x , y ) ) ,
where f ( μ i ) represents the affine and deformation transformation function implemented by using monai [29], and I a ˜ ( x , y ) denotes the intensity of the synthetic anatomical image at pixel ( x , y ) following the applied affine and deformation transformations. The final fluoroscopy images are generated by overlaying the synthetic X-ray catheter images onto the transformed synthetic anatomical backgrounds.
I f ( x , y ) = ln I c ( x , y ) + I a ˜ ( x , y ) ,
= I ^ c ( x , y ) + I a ˜ ( x , y ) ,
where I f ( x , y ) is the natural logarithm of the intensity of the fluoroscopy image at pixel ( x , y ) , and intermediate variables I ^ c ( x , y ) = ln I c ( x , y ) is introduced for convenience. The pipeline for obtaining fluoroscopy images is shown in Figure 4.
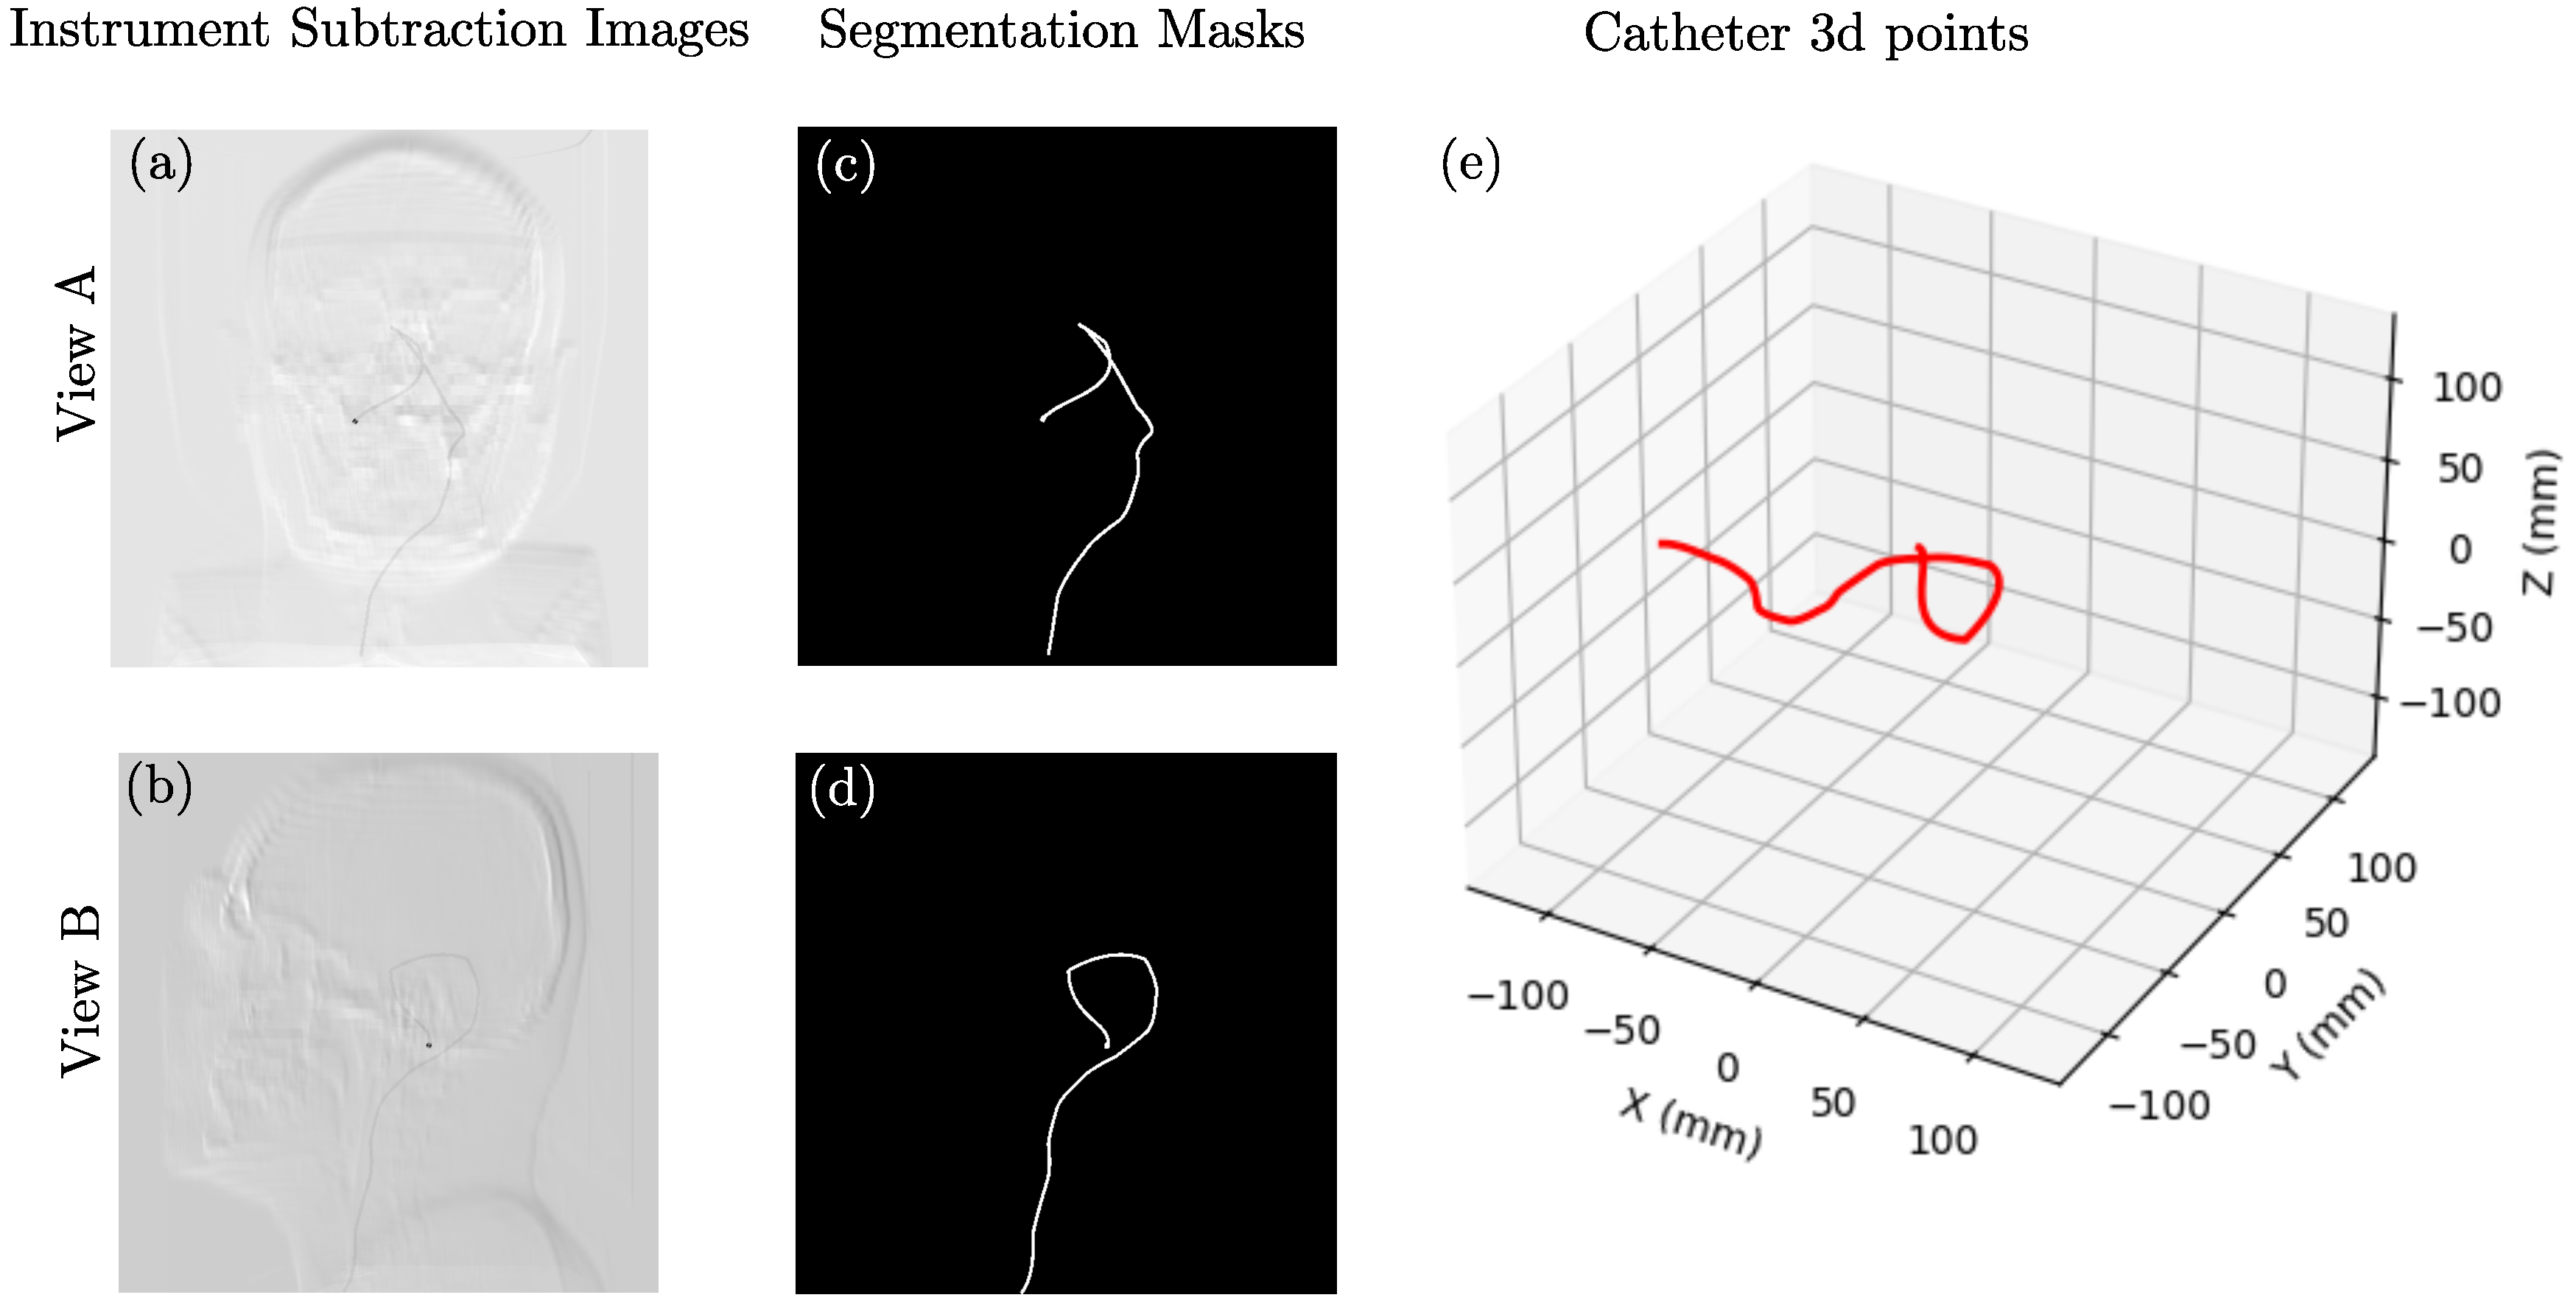
While datasets can be constructed directly from fluoroscopy images, we propose a novel integration of established image processing techniques into a deep learning pipeline to enhance our model’s generalization capabilities. Specifically, instead of using raw fluoroscopy images as conventional methods do (Figure 3a), we utilize instrument-specific images derived through mask subtraction from the original fluoroscopy data, I instrument ( x , y ) = I f ( x , y ) I a ( x , y ) , as illustrated in Figure 3c. This subtraction approach is based on the well-established Digital Subtraction Angiography (DSA) technique, which isolates and emphasizes the catheter structure by removing background anatomical features. The complete procedure for extracting these instrument subtraction images is demonstrated in Figure 3. This integration improves the generalization ability of the model for catheter reconstruction tasks. An example of the synthetic data generated through this methodology is shown in Figure 5.
By focusing exclusively on the instrument itself, our model develops invariance to patient-specific anatomical variations, which constitutes a significant advantage of our methodology. This approach effectively decouples the catheter reconstruction task from the variability in underlying anatomy, thereby improving the model’s ability to generalize across diverse clinical scenarios.

2.2. Neural Network Architecture

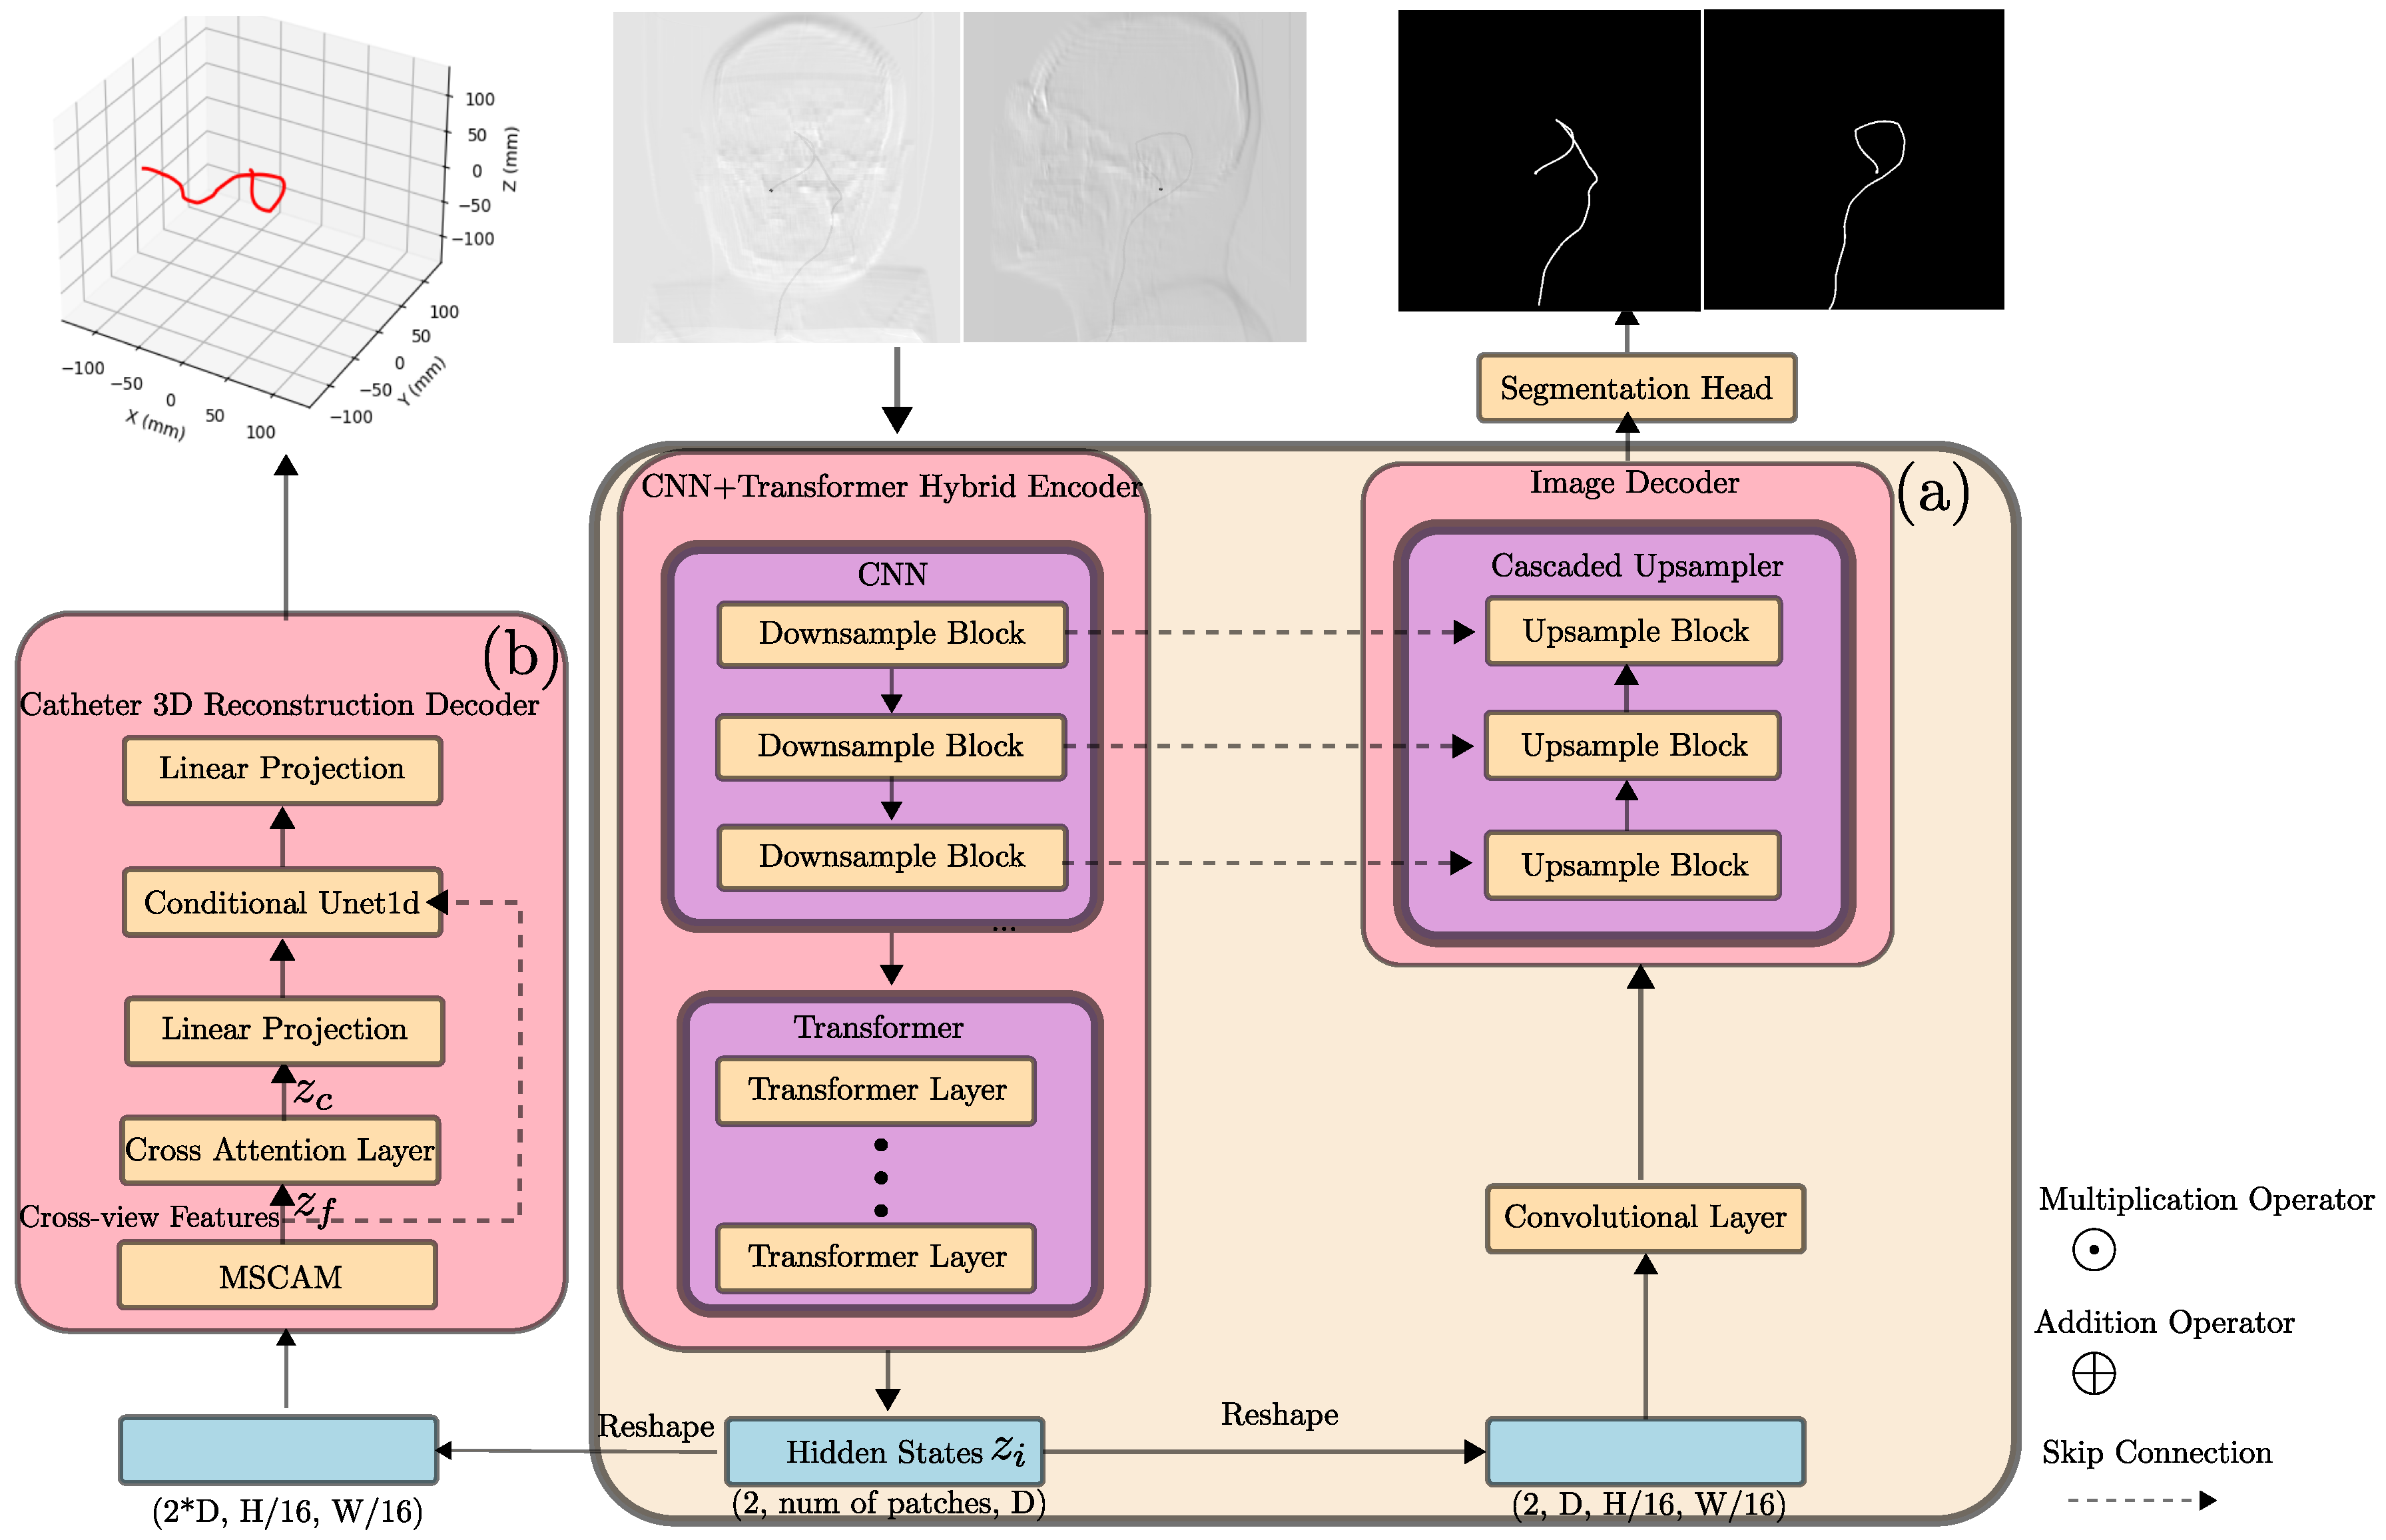
In this work, we propose a novel multi-task deep learning model for catheter 3D reconstruction and catheter segmentation from a pair of biplanar X-ray images x R 2 × H × W , where H and W are the height and width of the image, respectively. The input images undergo standardization before being fed into the model. Our model adopts a TransUNet-inspired architecture [30] with a sophisticated encoder–decoder framework designed to handle the two tasks efficiently.
In our model, we adopt the TransUnet architecture [30] as the skeleton for our encoder and image components, which are shown in Figure 6a. This decision is strategically grounded in TransUNet’s established excellence in medical image segmentation tasks, where it has demonstrated superior accuracy and effectiveness across multiple benchmarks [30,31,32].
The encoder is a CNN-Transformer hybrid model, where a CNN is first applied to extract features from the individual view of the input image x i R 1 × H × W , i [ 1 , 2 ] , where i is the view index. This view-independent feature extraction is crucial for the segmentation task, which requires preserving the integrity of spatial information within each view without cross-view contamination. Then the view-specific features are fed into a Transformer encoder to extract the hidden states per view z i R n patches × D , where n patches = H × W P 2 is the number of patches, P is the patch size and D is the feature dimension.
For catheter image segmentation task, we implement a cascaded upsampling decoder that progressively enlarges the view-specific hidden features through multi-scale fusion. This decoder connects to the encoder via skip connections, preserving spatial information across multiple resolution levels and ensuring fine-grained segmentation results. The architecture maintains view independence throughout the segmentation pipeline, allowing for precise delineation of catheter structures in each projection.
The 3D reconstruction decoder contains a multi-scale convolutional attention module (MSCAM) [31], a cross attention module [33] and a conditional 1D U-net model, which can be seen in Figure 6b. The MSCAM is an effective multi-features aggregation and refinement module which contains a cross channel attention and spatial attention mechanism [31]. It facilitates the cross-view features integrating spatial information from both projections to establish a comprehensive representation of the catheter’s 3D configuration. In the cross attention module, two learnable query vectors with positional embedding are created to query the fused hidden states with a cross attention mechanism. This cross attention mechanism implements a mapping from the image feature space z f R n patches × D to the control point feature space z c R N × D , where N is the number of control points.
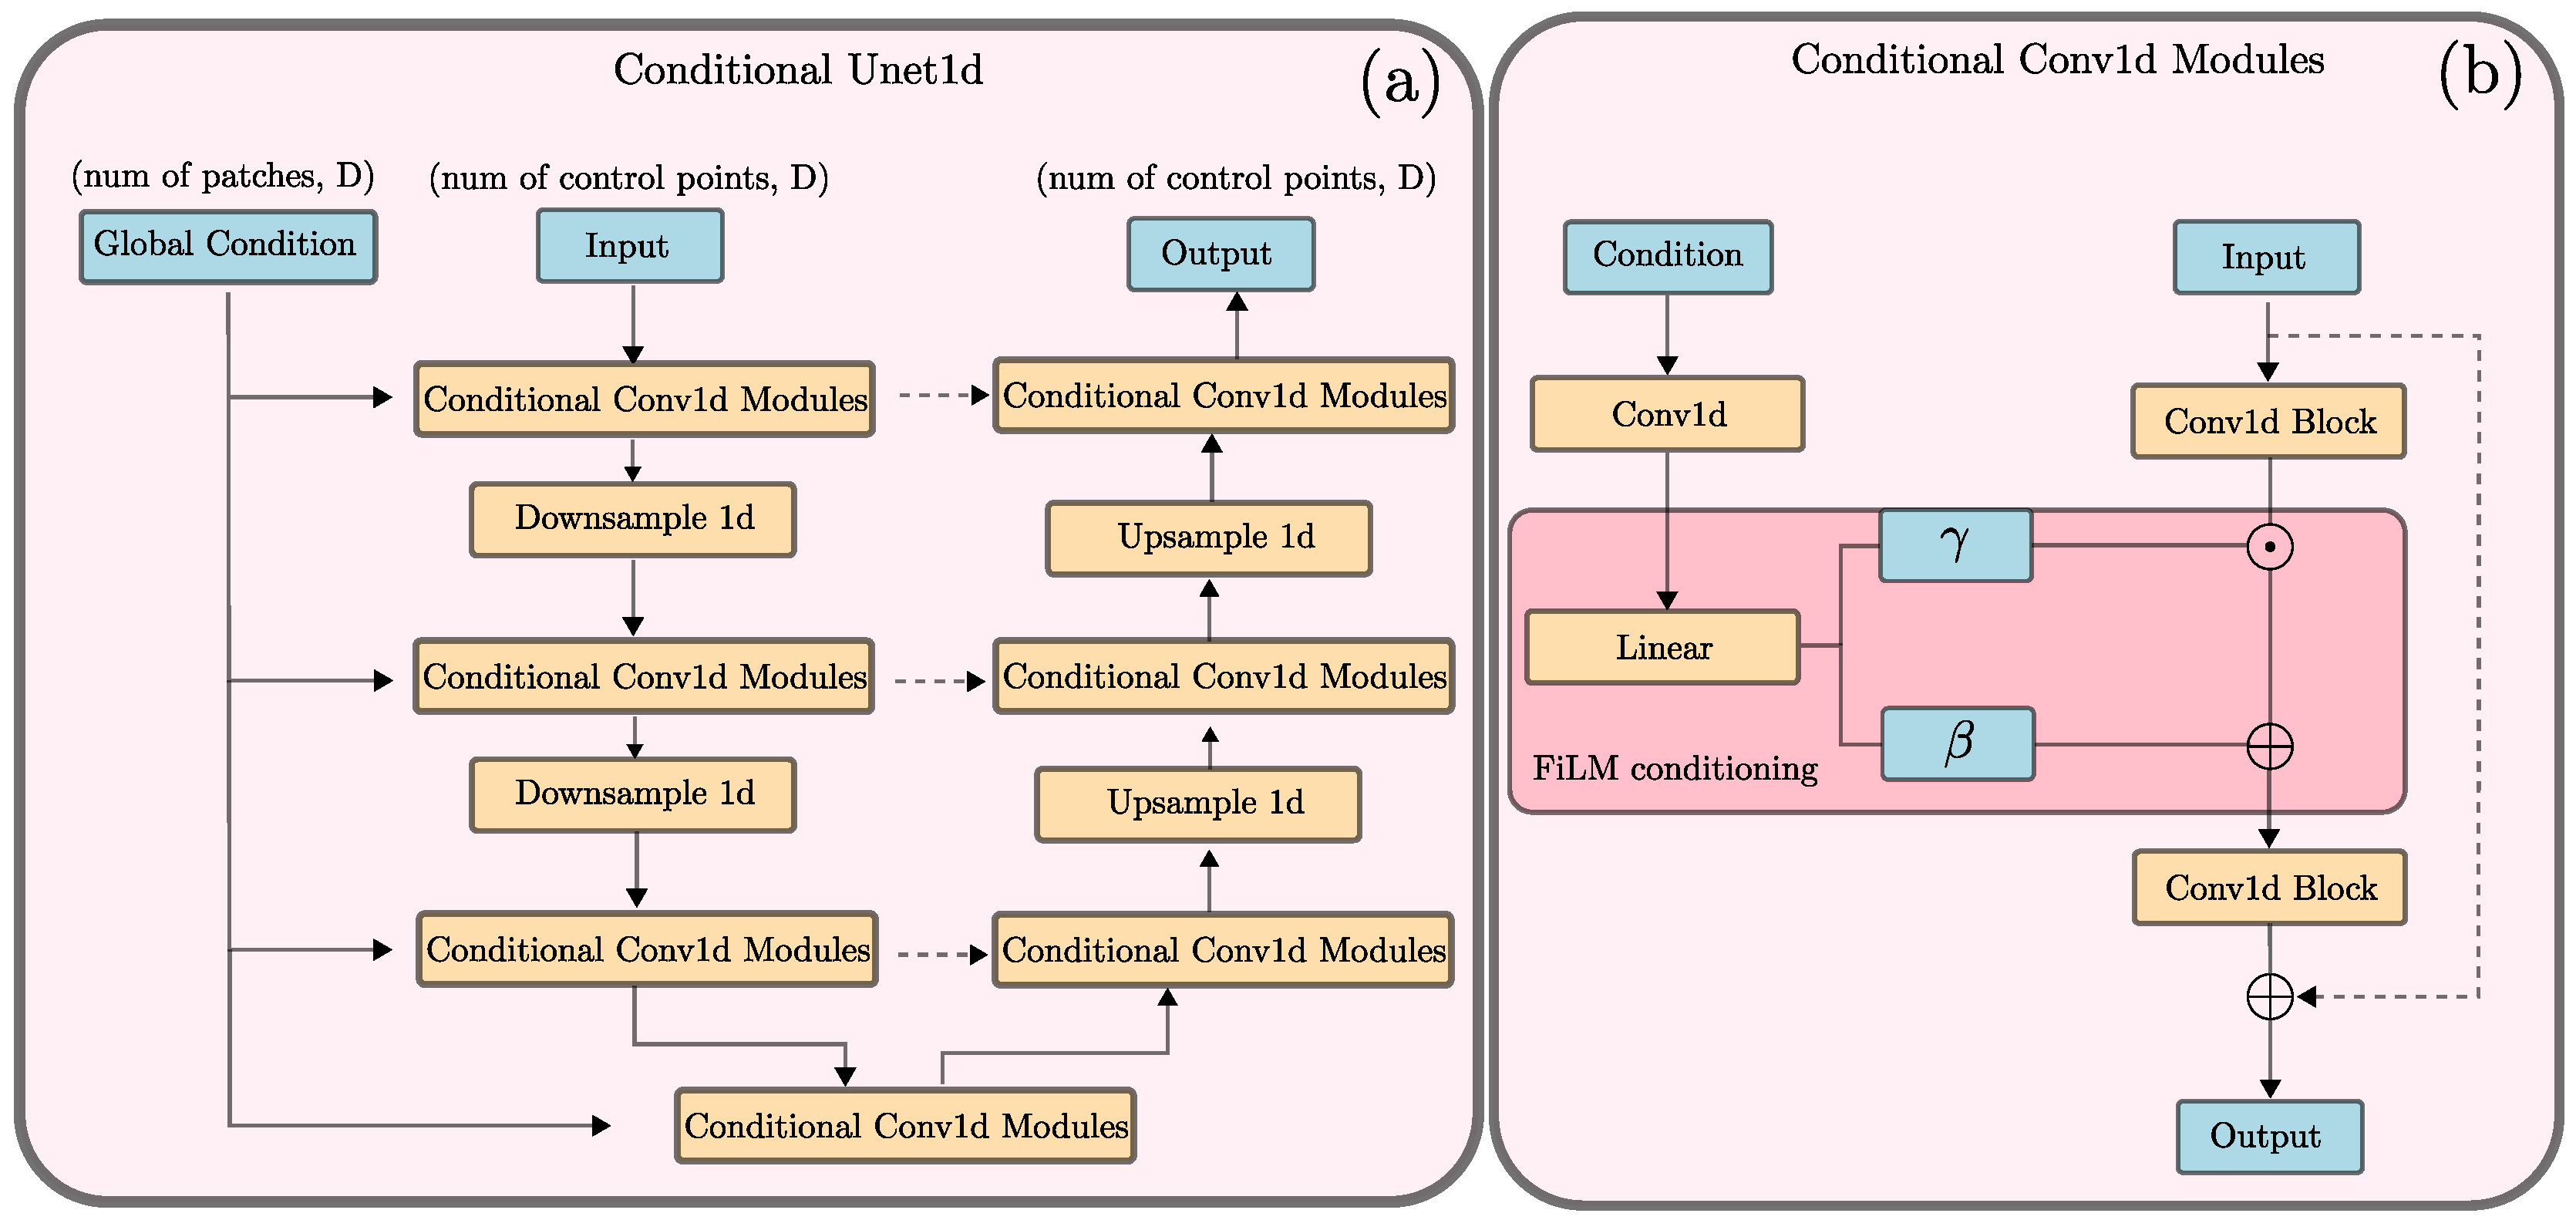
Following a linear projection layer, the hidden features of control points are fed to the conditional 1D U-net model, a widely used architecture in the field of sequence modeling tasks [34]. The overall architecture of the conditional 1D U-net model is presented in Figure 7a,b. The model consists of a conditional encoder, a decoder, and skip connections. For the conditional encoder, to preserve contextual awareness, the cross-view features are fed to the conditional 1D U-net modules as the global condition tensor. We implement Feature-wire Linear Modulation (FiLM) [35] to modulate the hidden features of control points. The FiLM layer generates scaling γ and bias β parameters which are then used for conditional modulation on the hidden features of control points γ h + β to achieve precise control of local control point features through global contextual information, where h represents the hidden features of control points. The decoder is composed of conditional convolutional 1D modules that progressively integrate multi-scale features via skip connections. The U-net structure of the conditional 1D U-net can preserve the different resolution level spatial information of control points, ensuring that both fine-grained details and broader structural patterns of the control point sequence are maintained throughout the reconstruction process.
The 3D reconstruction decoder produces 16 control points as its final output, which collectively define a cubic B-spline curve that represents the three-dimensional geometry of the catheter, which can be expressed as a function of a variable t [ 0 , 1 ] :
S ( t ) = i = 0 N c 1 B i , 3 ( t ) P i ,
where P i is the i-th control point, B i , 3 ( t ) is the i-th cubic B-spline basis function, and N c is the number of control points. In this work, N c = 16 . The basis function can be derived by the de Boor-Cox algorithm [36]
B i , 0 ( t ) = 1 , t i t < t i + 1 0 , otherwise ,
B i , k ( t ) = t t i t i + k t i B i , k 1 ( t ) + t i + k + 1 t t i + k + 1 t i + 1 B i + 1 , k 1 ( t ) ,
where t i denotes the i-th knot that samples parameter values t uniformly from the interval [ 0 , 1 ] . In this work, we implement an open uniform type of knot vector. Once the optimized control points are obtained, the complete 3D catheter trajectory can be efficiently reconstructed through a straightforward sampling process. This involves calculating the corresponding 3D catheter points using the B-spline equation referenced in Equation (10).
This parametric representation enables the generation of a smooth, continuous curve that accurately captures the catheter’s spatial configuration. The uniform sampling approach ensures consistent point density along the entire catheter length, facilitating subsequent visualization and analysis. This final reconstruction step transforms the discrete set of control points into a comprehensive 3D model that precisely delineates the catheter’s path through the vascular anatomy, providing clinicians with valuable spatial information for procedural guidance.

2.3. Loss Function

The total loss function for training the model is a weighted sum of the two tasks’ loss functions,
L = 1 N sample i = 1 N sample ( λ 3 D ( S ^ i S i 2 + S ^ i S i 2 ) + λ seg ( ( w pos M i log ( M i ^ ) + w neg ( 1 M i ) log ( 1 M i ^ ) ) + 1 2 M i M i ^ M i + M i ^ ) .
The 3D reconstruction loss combines mean square error between predicted catheter 3D points S ^ i and ground truth catheter 3D points S i , along with a gradient consistency term S ^ i S i 2 that enforces smoothness and geometric fidelity of catheter shape, where the · 2 denotes the L 2 norm. The catheter segmentation loss is a combination of a weighted cross-entropy loss with class balancing coefficients w pos and w neg , and a Dice loss of predicted catheter segmentation M i ^ and ground truth catheter segmentation M i . The weights λ 3 D and λ seg control the contribution of each loss term to the total loss.

3. Results

The model was trained end-to-end using the loss function in Equation (13) with the AdamW optimizer [37] and a weight decay of 5 × 10 2 . The model was trained for 50 epochs with a batch size of 112. The model was trained on four NVIDIA A100 GPUs. The One Cycle scheduler [38] with a maximum learning rate of 2 × 10 4 was used to adjust the learning rate. We generated a synthetic dataset through the method in Section 2.1, which contained 10 5 pairs of samples. The dataset was split into 90 % for the training dataset and 10 % for the validation dataset. Our model was trained on the synthetic dataset.
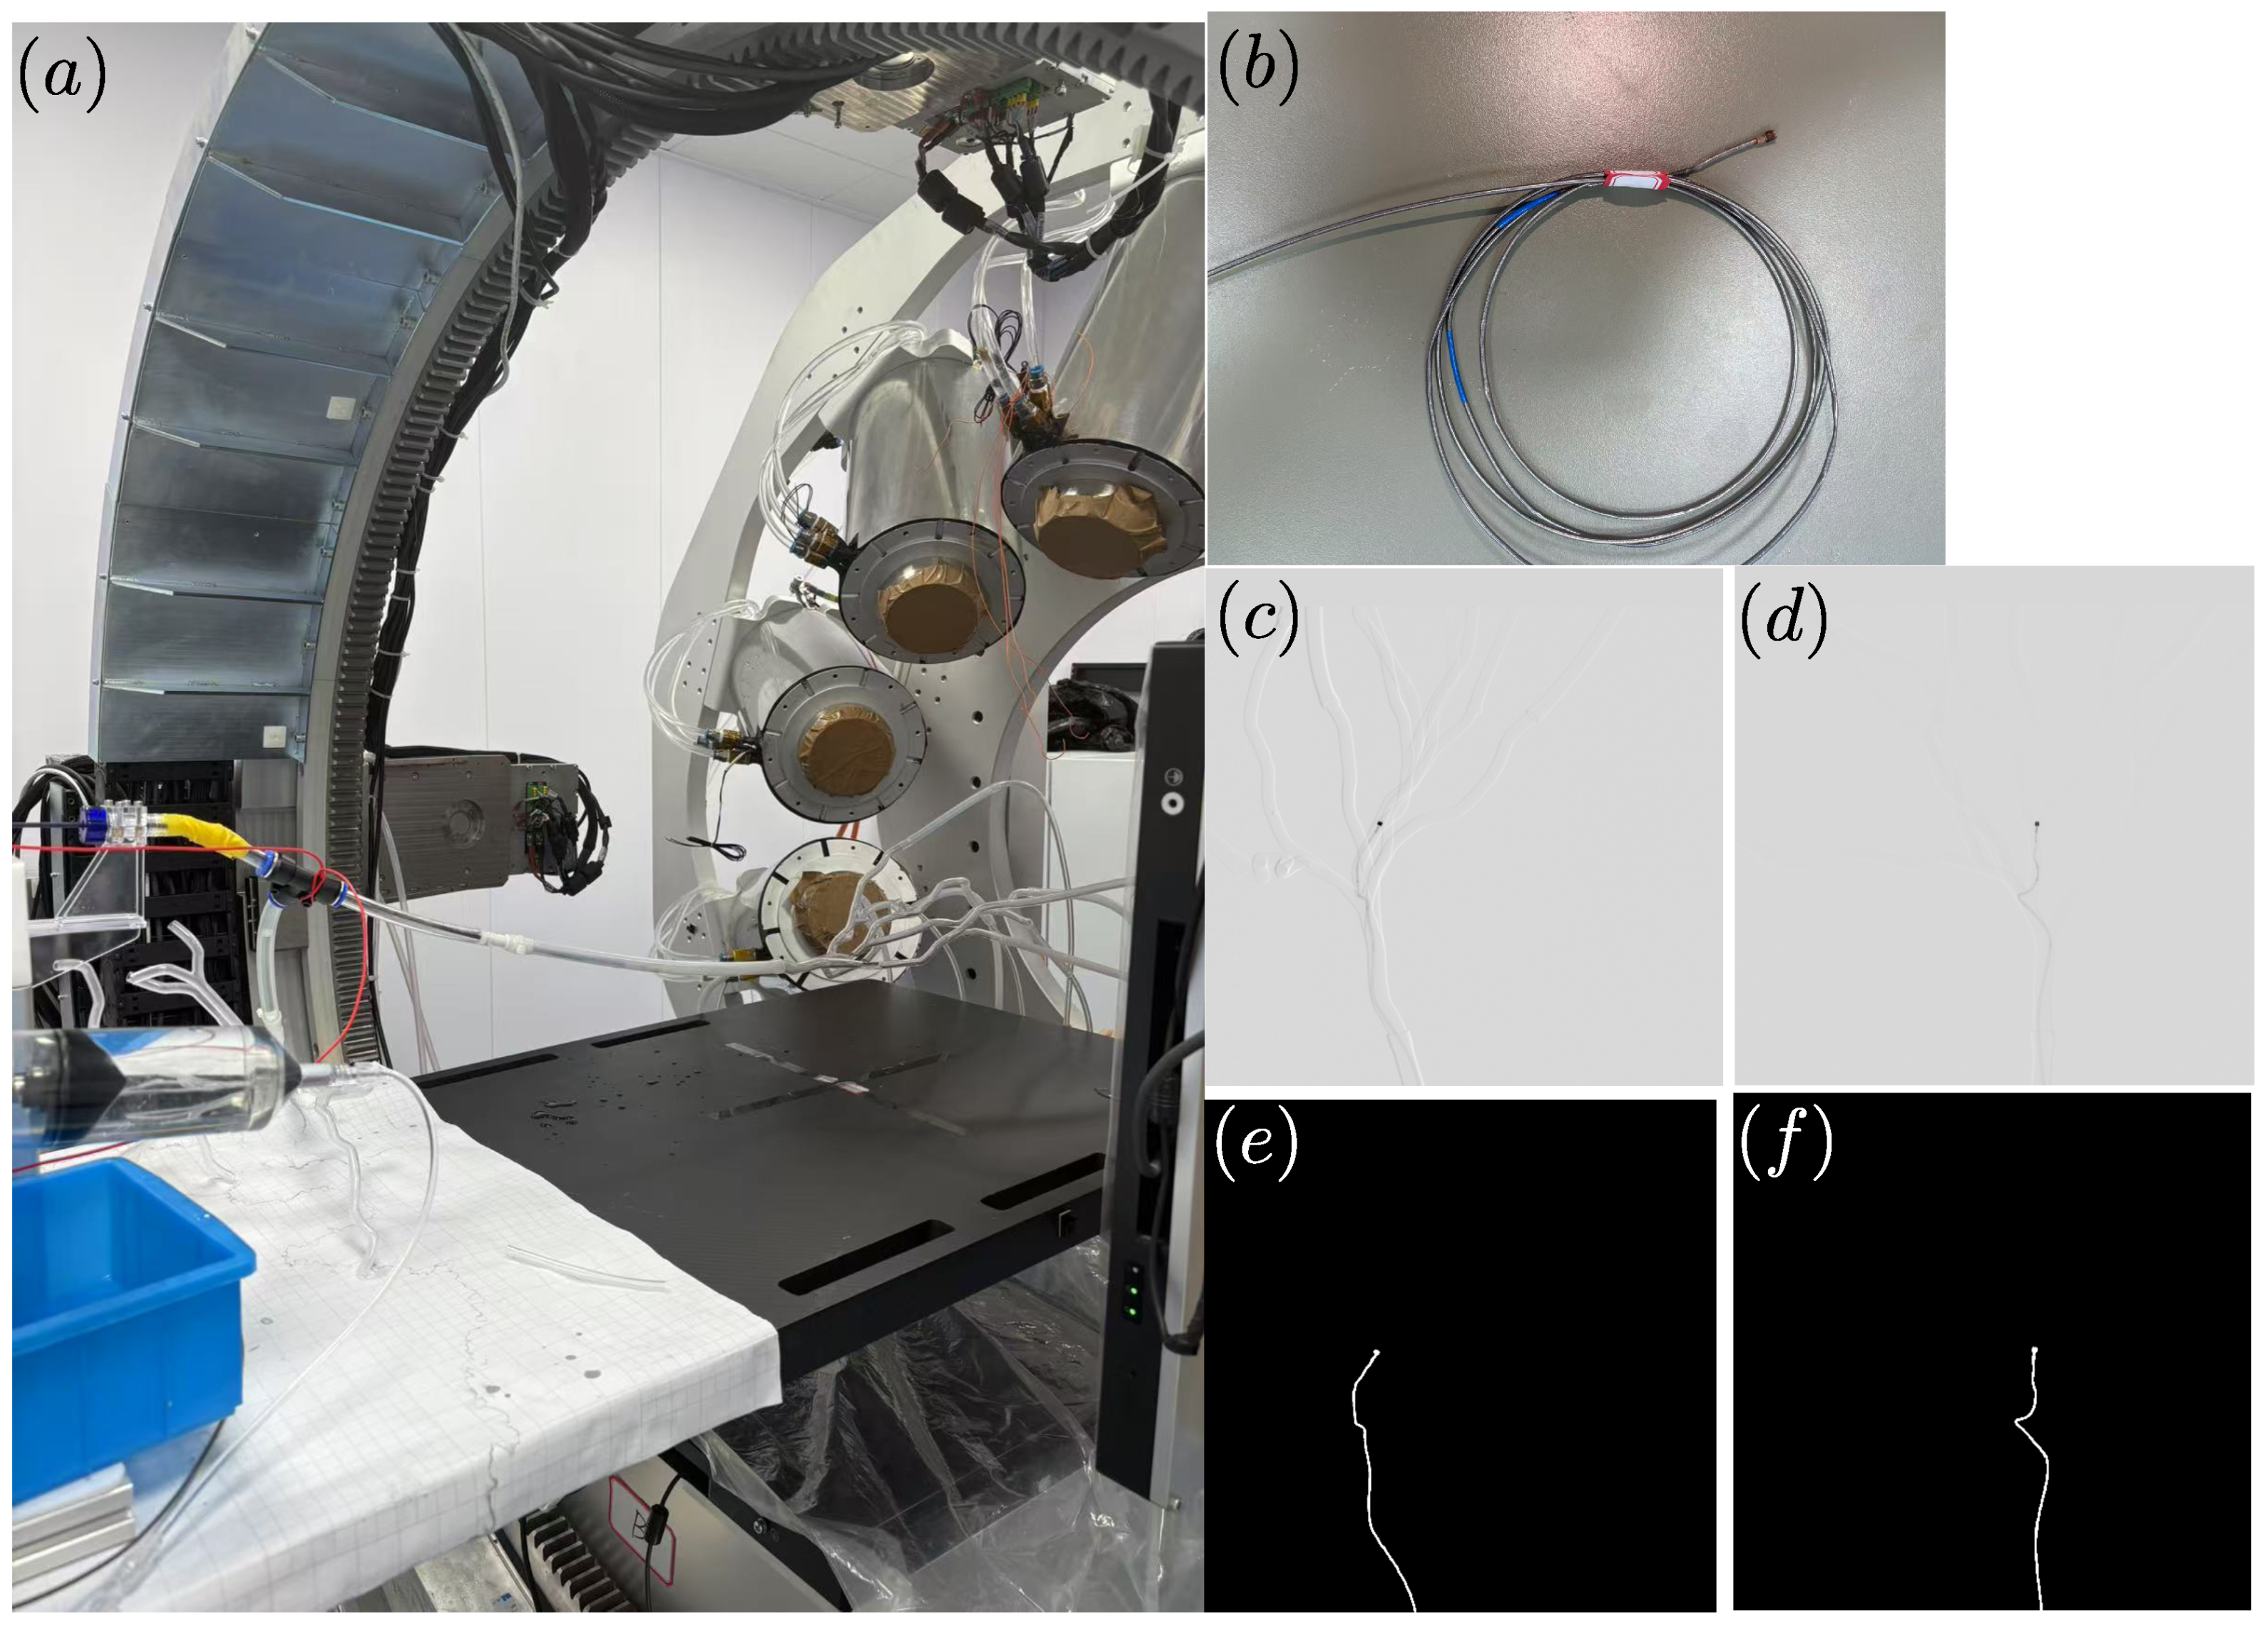
In order to evaluate the generalization ability of our model, we also collected a experimental dataset from a clinical setting, which contained 10 2 pairs of samples. In our study, the proposed biplanar X-ray system (Figure 1) has been implemented, and its operation is demonstrated in Figure 8a. The source-to-image distance (SID) is equal to 1200 mm and the source-to-object distance (SOD) is equal to 788 mm. The images captured by the biplanar X-ray system were resized to 512 × 512 . A silicone vessel phantom is placed in the center of the biplanar X-ray system. The catheter inserted into the silicone vessel phantom was designed based on Figure 2. Figure 8c,d shows an example of a pair of biplanar instrument subtraction images. The corresponding manually annotated segmentation masks are shown in Figure 8e,f. Since ground truth 3D catheter positions are unavailable for the experimental dataset, we evaluated model performance using the Dice score. This metric compares the re-projected segmentation masks (derived from predicted 3D catheter points projected back onto the biplanar X-ray images) against manually annotated segmentation masks.
For the segmentation, the model was evaluated using the Dice score. For the 3D reconstruction task, we used the root mean square error (RMSE) and re-projection Dice score (RP-DICE) as the evaluation metrics for validation dataset. For the experimental dataset, we only evaluated the model using the re-projection Dice score (RP-DICE). The differences in the evaluation metrics (Dice, RMSE, and RP-DICE) reflect their distinct purposes in assessing model performance. The Dice score measures the overlap between the predicted and ground truth segmentation masks, focusing on 2D segmentation accuracy. RMSE quantifies the average error in the 3D positional reconstruction of the catheter, providing a measure of geometric accuracy. RP-DICE, on the other hand, evaluates the overlap between the reprojected 3D reconstruction and the ground truth segmentation in 2D space. When 3D ground truth points are unavailable, RP-DICE serves as an alternative metric to indirectly assess the 3D reconstruction error. The detail performance of the model is shown in Table 1.
Our method achieves dice score of 0.91 for catheter segmentation, RMSE of 5.5 mm and reprojection dice score of 0.40 for catheter 3D reconstruction on the validation dataset. On the experimental dataset, our model achieves dice score of 0.83 for catheter segmentation and reprojection dice score of 0.40 for catheter 3D reconstruction. The difference in performance between the validation and experimental datasets can be attributed to the domain gap between synthetic data (used for training and validation) and experimental data (used for testing). The experimental dataset contains more complex imaging conditions, such as noise, and variability in artifacts, which are not fully represented in the synthetic training data. Figure 9 shows an example of the predicted results. Figure 9a,b illustrates a pair of biplanar instrument subtraction images used as inputs for our model, with the corresponding ground truth segmentation masks shown in Figure 9c,d. The predicted segmentation masks generated by our model are presented in Figure 9e,f, demonstrating accurate segmentation performance. Figure 9g,h visualizes the reprojection of the predicted 3D reconstruction onto the 2D image plane, which is utilized to compute the RPDICE score. It is evident that the reprojected segmentation masks exhibit larger errors compared to the direct segmentation predictions, highlighting the inherent challenges in achieving precise 3D reconstruction from 2D imaging data. Even though the model is trained on synthetic data, it achieves good performance on the experimental dataset. The model also demonstrates efficient performance with inference times less than 50 microseconds on a single A100 GPU. The code is available at https://github.com/JunangWang/Catheter_Reconstruction.git (accessed on 7 August 2025).

4. Discussion

Endovascular intervention surgery is a frequently used and successful treatment option for cerebrovascular and cardiovascular diseases. However, X-ray fluoroscopy images and 2D roadmap images do not deliver direct 3D information about guidewires and catheters, resulting in a deficiency of 3D visual feedback for interventional radiologists. Additionally, the rising interest in magnetically controlled guidewire and catheter robotic systems is driving the need for precise spatial positioning of medical instruments to ensure accurate control. There is an urgent requirement for an effective segmentation and 3D reconstruction method. One potential solution to this issue is the use of deep learning techniques. However, the limited availability of public datasets restricts the generalization capability of deep learning methods across different clinical scenarios and types of medical instruments.
This work presents an approach for 3D reconstruction of medical instruments in clinical settings by integrating several established techniques into a unified framework tailored to a specific and clinically relevant application: catheter 3D reconstruction and segmentation. We first develop a comprehensive pipeline that generates a custom synthetic dataset containing image pairs with their corresponding 3D catheter position annotations. Our data generation process combines synthetic anatomical backgrounds with synthetic instrument renderings to create realistic training images. The ground truth 3D catheter geometries are modeled as B-spline curves to ensure smooth and anatomically plausible representations. We then propose a multi-task deep learning network for instrument segmentation and 3D catheter reconstruction from biplanar X-ray inputs, highlighting the effectiveness of synthetic data in training medical 3D reconstruction models. The model was trained end-to-end using the loss function in Equation (13) with AdamW optimizer [37]. The segmentation Dice score was 0.83, the RP-DICE was 0.40 on the experimental dataset. The results show that the model can effectively perform the two tasks simultaneously.
Although the model can effectively perform the two tasks simultaneously, there are still some limitations. First, the model is exclusively trained on synthetic data, which may introduce a domain gap when applied to real clinical scenarios. In real-world datasets, input images often contain various artifacts, including motion artifacts and patient-related artifacts, such as clothing, jewelry, or external medical devices that are not part of the anatomy being imaged. Additionally, digital artifacts may arise from issues like dead detector pixels or residual images from previous exposures. Second, our evaluation was conducted on a limited experimental dataset, which constrained our ability to comprehensively assess the model’s robustness and generalization capabilities. Third, the synthetic nature of our training data may not fully capture the complexity and variability inherent in actual clinical imaging conditions. Moreover, the 3D reconstruction accuracy is not high enough for clinical application. Finally, the model is designed only for single catheter segmentation and 3D reconstruction, which may not be suitable for complex clinical scenarios.
To address the identified limitations, future research will adopt several targeted strategies to enhance the model’s performance and clinical applicability. First, evaluations will be expanded to include larger and more diverse real-world datasets by collaborating with medical institutions to collect data across various imaging devices, patient populations, and clinical environments. Second, domain adaptation techniques will be explored to bridge the synthetic-to-real gap, including methods like adversarial training, style transfer, and hybrid datasets that combine synthetic and annotated real-world data. Self-supervised learning approaches will further utilize unlabeled clinical data to reduce dependency on annotations. Third, efforts will be made to improve 3D reconstruction accuracy by integrating advanced geometric priors, physics-based simulations, and standardized evaluation metrics to ensure clinical-grade reconstruction fidelity. Finally, the model will be extended to handle multiple instruments, and generalizing to other types of medical instruments and imaging modalities through diverse training datasets.

Author Contributions

Conceptualization, methodology, investigation, formal analysis, visualization, writing—original draft, and writing—review and editing. J.W.; data curation, validation. G.Z.; writing—review and editing, project administration, investigation. W.Y. and C.W.; supervision, writing—review and editing. J.Y. All authors have read and agreed to the published version of the manuscript.

Funding

This research was funded by the National Key Research and Development Program of China (Nos. 2021YFB3501301, 2021YFB3501302).

Institutional Review Board Statement

The study used publicly available datasets that do not require ethical approval.

Informed Consent Statement

Not applicable.

Data Availability Statement

The data underlying this article will be shared on reasonable request to the corresponding author.

Acknowledgments

The authors would like to extend their gratitude to Beijing Qubot Holdings Limited for their valuable support.

Conflicts of Interest

Author Guixiang Zhang was employed by the company Beijing Qubot Holdings Limited. The remaining authors declare that the research was conducted in the absence of any commercial or financial relationships that could be construed as a potential conflict of interest.

Abbreviations

The following abbreviations are used in this manuscript:
NdFeBNeodymium Iron Boron
PTFEpolytetrafluoroethylene
SIDSource-to-Image Distance
SODSource-to-Object Distance
CTComputed Tomography
HUHounsfied Unit
CNNConvolutional Neural Network
MSCAMMulti-Scale Convolutional Attention Module
FiLMFeature-wire Linear Modulation

References

  1. Kummer, M.P.; Abbott, J.J.; Kratochvil, B.E.; Borer, R.; Sengul, A.; Nelson, B.J. OctoMag: An electromagnetic system for 5-DOF wireless micromanipulation. IEEE Trans. Robot. 2010, 26, 1006–1017. [Google Scholar] [CrossRef]
  2. Le, V.N.; Nguyen, N.H.; Alameh, K.; Weerasooriya, R.; Pratten, P. Accurate modeling and positioning of a magnetically controlled catheter tip. Med. Phys. 2016, 43, 650–663. [Google Scholar] [CrossRef] [PubMed]
  3. Sikorski, J.; Dawson, I.; Denasi, A.; Hekman, E.E.; Misra, S. Introducing BigMag—A novel system for 3D magnetic actuation of flexible surgical manipulators. In Proceedings of the 2017 IEEE International Conference on Robotics and Automation (ICRA), Singapore, 29 May–3 June 2017; pp. 3594–3599. [Google Scholar]
  4. Fu, S.; Chen, B.; Li, D.; Han, J.; Xu, S.; Wang, S.; Huang, C.; Qiu, M.; Cheng, S.; Wu, X.; et al. A magnetically controlled guidewire robot system with steering and propulsion capabilities for vascular interventional surgery. Adv. Intell. Syst. 2023, 5, 2300267. [Google Scholar] [CrossRef]
  5. Kim, Y.; Parada, G.A.; Liu, S.; Zhao, X. Ferromagnetic soft continuum robots. Sci. Robot. 2019, 4, eaax7329. [Google Scholar] [CrossRef] [PubMed]
  6. Dreyfus, R.; Boehler, Q.; Lyttle, S.; Gruber, P.; Lussi, J.; Chautems, C.; Gervasoni, S.; Seibold, D.; Ochsenbein-Kölble, N.; Reinehr, M.; et al. Dexterous helical magnetic robot for improved endovascular access. Sci. Robot. 2024, 9, eadh0298. [Google Scholar] [CrossRef] [PubMed]
  7. Torlakcik, H.; Sevim, S.; Alves, P.; Mattmann, M.; Llacer-Wintle, J.; Pinto, M.; Moreira, R.; Flouris, A.; Landers, F.; Chen, X.; et al. Magnetically guided microcatheter for targeted injection of magnetic particle swarms. Adv. Sci. 2024, 11, 2404061. [Google Scholar] [CrossRef] [PubMed]
  8. Hoffmann, M.; Brost, A.; Jakob, C.; Bourier, F.; Koch, M.; Kurzidim, K.; Hornegger, J.; Strobel, N. Semi-automatic catheter reconstruction from two views. In Proceedings of the Medical Image Computing and Computer-Assisted Intervention, Nice, France, 1–5 October 2012; pp. 584–591. [Google Scholar]
  9. Hoffmann, M.; Brost, A.; Jakob, C.; Koch, M.; Bourier, F.; Kurzidim, K.; Hornegger, J.; Strobel, N. Reconstruction method for curvilinear structures from two views. In Proceedings of the Medical Imaging 2013: Image-Guided Procedures, Robotic Interventions, and Modeling, Lake Buena Vista, FL, USA, 9–14 February 2013; Volume 8671, pp. 630–637. [Google Scholar]
  10. Hoffmann, M.; Brost, A.; Koch, M.; Bourier, F.; Maier, A.; Kurzidim, K.; Strobel, N.; Hornegger, J. Electrophysiology catheter detection and reconstruction from two views in fluoroscopic images. IEEE Trans. Med. Imaging 2015, 35, 567–579. [Google Scholar] [CrossRef] [PubMed]
  11. Delmas, C.; Berger, M.O.; Kerrien, E.; Riddell, C.; Trousset, Y.; Anxionnat, R.; Bracard, S. Three-dimensional curvilinear device reconstruction from two fluoroscopic views. In Proceedings of the Medical Imaging 2015: Image-Guided Procedures, Robotic Interventions, and Modeling, Orlando, FL, USA, 21–26 February 2015; Volume 9415, pp. 100–110. [Google Scholar]
  12. Petković, T.; Homan, R.; Lončarić, S. Real-time 3D position reconstruction of guidewire for monoplane X-ray. Comput. Med. Imaging Graph. 2014, 38, 211–223. [Google Scholar] [CrossRef] [PubMed]
  13. Wagner, M.; Schafer, S.; Strother, C.; Mistretta, C. 4D interventional device reconstruction from biplane fluoroscopy. Med. Phys. 2016, 43, 1324–1334. [Google Scholar] [CrossRef] [PubMed]
  14. Ronneberger, O.; Fischer, P.; Brox, T. U-net: Convolutional networks for biomedical image segmentation. In Proceedings of the Medical Image Computing and Computer-Assisted Intervention, Munich, Germany, 5–9 October 2015; pp. 234–241. [Google Scholar]
  15. Ambrosini, P.; Ruijters, D.; Niessen, W.J.; Moelker, A.; van Walsum, T. Fully automatic and real-time catheter segmentation in X-ray fluoroscopy. In Proceedings of the Medical Image Computing and Computer-Assisted Intervention, Quebec City, QC, Canada, 11–13 September 2017; pp. 577–585. [Google Scholar]
  16. Nguyen, A.; Kundrat, D.; Dagnino, G.; Chi, W.; Abdelaziz, M.E.; Guo, Y.; Ma, Y.; Kwok, T.; Riga, C.; Yang, G.Z. End-to-end real-time catheter segmentation with optical flow-guided warping during endovascular intervention. In Proceedings of the 2020 IEEE International Conference on Robotics and Automation (ICRA), Paris, France, 31 May–31 August 2020; pp. 9967–9973. [Google Scholar]
  17. Zhou, Y.J.; Xie, X.L.; Zhou, X.H.; Liu, S.Q.; Bian, G.B.; Hou, Z.G. Pyramid attention recurrent networks for real-time guidewire segmentation and tracking in intraoperative X-ray fluoroscopy. Comput. Med. Imaging Graph. 2020, 83, 101734. [Google Scholar] [CrossRef] [PubMed]
  18. Ullah, I.; Chikontwe, P.; Park, S.H. Real-time tracking of guidewire robot tips using deep convolutional neural networks on successive localized frames. IEEE Access 2019, 7, 159743–159753. [Google Scholar] [CrossRef]
  19. Zhou, Y.J.; Liu, S.Q.; Xie, X.L.; Zhou, X.H.; Wang, G.A.; Hou, Z.G.; Li, R.-Q.; Ni, Z.-L.; Fan, C.C. A real-time multi-task framework for guidewire segmentation and endpoint localization in endovascular interventions. In Proceedings of the 2021 IEEE International Conference on Robotics and Automation (ICRA), Xi’an, China, 30 May–5 June 2021; pp. 13784–13790. [Google Scholar]
  20. Jianu, T.; Huang, B.; Berthet-Rayne, P.; Fichera, S.; Nguyen, A. 3D guidewire shape reconstruction from monoplane fluoroscopic images. In Proceedings of the International Conference on Robot Intelligence Technology and Applications, Taicang, China, 6–8 December 2023; pp. 84–94. [Google Scholar]
  21. Jianu, T.; Huang, B.; Nguyen, H.; Bhattarai, B.; Do, T.; Tjiputra, E.; Tran, Q.; Berthet-Rayne, P.; Le, N.; Fichera, S.; et al. Guide3D: A biplanar X-ray Dataset for Guidewire Segmentation and 3D Reconstruction. In Proceedings of the Computer Vision—ACCV 2024: 17th Asian Conference on Computer Vision, Hanoi, Vietnam, 8–12 December 2024; pp. 1549–1565. [Google Scholar]
  22. Community, B.O. 2018. Blender—A 3D Modelling and Rendering Package. Stichting Blender Foundation, Amsterdam. Available online: http://www.blender.org (accessed on 6 August 2025).
  23. Vidal, F.P.; Afshari, S.; Ahmed, S.; Atkins, C.; Béchet, É.; Bellot, A.C.; Bosse, S.; Chahid, Y.; Chou, C.-Y.; Culver, R.; et al. X-ray simulations with gVXR as a useful tool for education, data analysis, set-up of CT scans, and scanner development. Dev. X-Ray Tomogr. XV 2024, 13152, 30–49. [Google Scholar]
  24. Biguri, A.; Dosanjh, M.; Hancock, S.; Soleimani, M. TIGRE: A MATLAB-GPU toolbox for CBCT image reconstruction. Biomed. Phys. Eng. Express 2016, 2, 055010. [Google Scholar] [CrossRef]
  25. Hubbell, J.H.; Seltzer, S.M. Tables of X-Ray Mass Attenuation Coefficients and Mass Energy-Absorption Coefficients (Version 1.4); National Institute of Standards and Technology: Gaithersburg, MD, USA, 2004. Available online: http://physics.nist.gov/xaamdi (accessed on 7 August 2025).
  26. Hssayeni, M. Computed Tomography Images for Intracranial Hemorrhage Detection and Segmentation (Version 1.3.1). PhysioNet. RRID:SCR_007345. 2020. Available online: https://doi.org/10.13026/4nae-zg36 (accessed on 7 August 2025).
  27. Hssayeni, M.D.; Croock, M.S.; Salman, A.D.; Al-Khafaji, H.F.; Yahya, Z.A.; Ghoraani, B. Intracranial Hemorrhage Segmentation Using A Deep Convolutional Model. Data 2020, 5, 14. [Google Scholar] [CrossRef]
  28. Goldberger, A.; Amaral, L.; Glass, L.; Hausdorff, J.; Ivanov, P.C.; Mark, R.; Stanley, H.E. PhysioBank, PhysioToolkit, and PhysioNet: Components of a new research resource for complex physiologic signals. Circulation 2000, 101, e215–e220. [Google Scholar] [CrossRef] [PubMed]
  29. Cardoso, M.J.; Li, W.; Brown, R.; Ma, N.; Kerfoot, E.; Wang, Y.; Murrey, B.; Myronenko, A.; Zhao, C.; Yang, D.; et al. Monai: An open-source framework for deep learning in healthcare. arXiv 2022, arXiv:2211.02701. [Google Scholar] [CrossRef]
  30. Chen, J.; Lu, Y.; Yu, Q.; Luo, X.; Adeli, E.; Wang, Y.; Lu, L.; Yuille, A.; Zhou, Y. Transunet: Transformers make strong encoders for medical image segmentation. arXiv 2021, arXiv:2102.04306. [Google Scholar] [CrossRef]
  31. Rahman, M.M.; Munir, M.; Marculescu, R. Emcad: Efficient multi-scale convolutional attention decoding for medical image segmentation. In Proceedings of the IEEE/CVF Conference on Computer Vision and Pattern Recognition, Seattle, WA, USA, 16–22 June 2024; pp. 11769–11779. [Google Scholar]
  32. Cao, H.; Wang, Y.; Chen, J.; Jiang, D.; Zhang, X.; Tian, Q.; Wang, M. Swin-unet: Unet-like pure transformer for medical image segmentation. In Proceedings of the Computer Vision–ECCV 2022 Workshops, Tel Aviv, Israel, 23–27 October 2022; pp. 205–218. [Google Scholar]
  33. Vaswani, A.; Shazeer, N.; Parmar, N.; Uszkoreit, J.; Jones, L.; Gomez, A.N.; Kaiser, L.; Polosukhin, I. Attention is all you need. Adv. Neural Inf. Process. Syst. 2017, 30, 1–11. [Google Scholar] [CrossRef]
  34. Chi, C.; Xu, Z.; Feng, S.; Cousineau, E.; Du, Y.; Burchfiel, B.; Tedrake, R.; Song, S. Diffusion policy: Visuomotor policy learning via action diffusion. Int. J. Robot. Res. 2025, 44, 1684–1704. [Google Scholar] [CrossRef]
  35. Perez, E.; Strub, F.; De Vries, H.; Dumoulin, V.; Courville, A. Film: Visual reasoning with a general conditioning layer. In Proceedings of the AAAI Conference on Artificial Intelligence, New Orleans, LA, USA, 2–7 February 2018; p. 32. [Google Scholar]
  36. Boor, C.D. Subroutine Package for Calculating with b-Splines; Los Alamos Scientific Laboratory: Los Alamos, NM, USA, 1971. [Google Scholar]
  37. Loshchilov, I.; Hutter, F. Decoupled weight decay regularization. arXiv 2017, arXiv:1711.05101. [Google Scholar]
  38. Smith, L.N.; Topin, N. Super-convergence: Very fast training of neural networks using large learning rates. In Proceedings of the Artificial Intelligence and Machine Learning for Multi-Domain Operations Applications, Baltimore, MD, USA, 14–18 April 2019; Volume 11006, pp. 369–386. [Google Scholar]
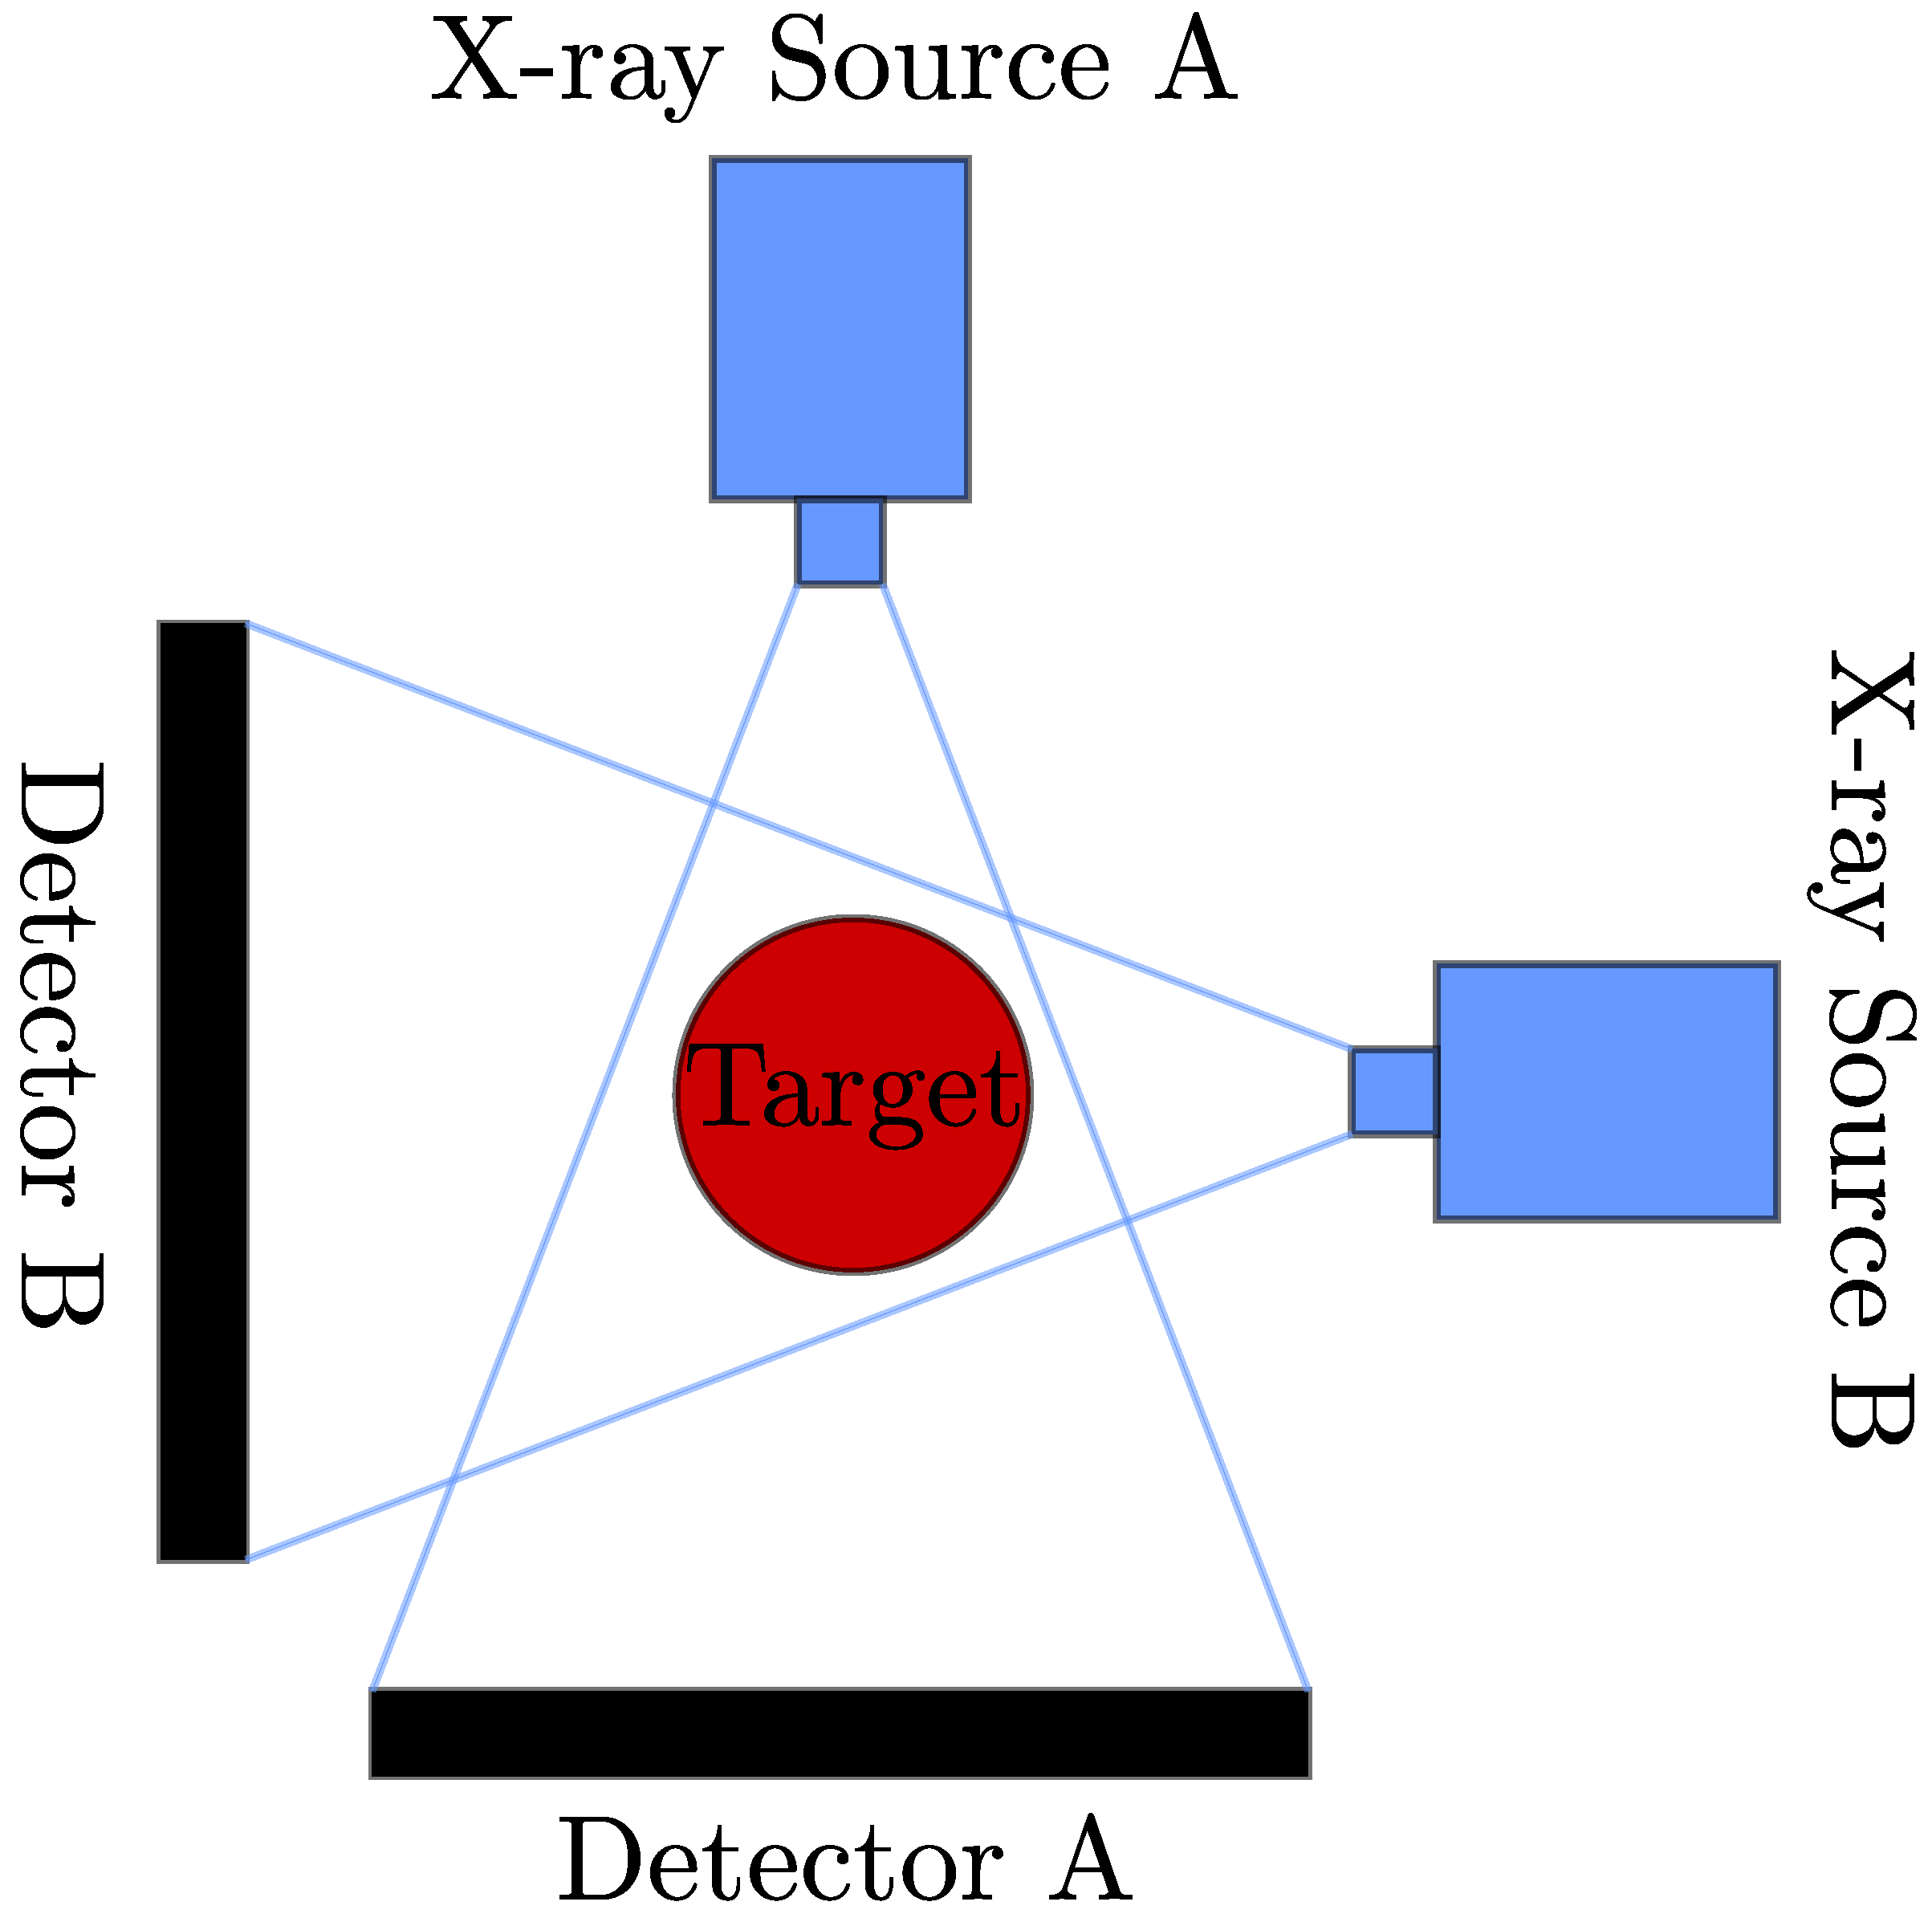
Figure 1. Schematic diagram of a biplanar X-ray system. The system consists of a pair of X-ray sources and a pair of detectors. The system can obtain two orthogonal views of the target.
Applsci 15 12247 g001
Figure 2. The sectional view illustrates the synthetic catheter. The black component represents the magnet ring, a cylindrical piece measuring 2.6 mm in diameter and 2 mm in height, composed of Neodymium Iron Boron (NdFeB). This magnet ring is positioned at the catheter’s tip. The gray section denotes the catheter’s body, featuring an outer diameter (OD) of 1.7 mm and an inner diameter (ID) of 1.4 mm. It consists of a polytetrafluoroethylene (PTFE) liner tube surrounded by a spring and enclosed in an outer shell made of Pebax elastomer. The red dashed line indicates the catheter’s skeleton.
Applsci 15 12247 g002
Figure 3. The procedure for obtaining instrument subtraction images. (a) Fluoroscopy images are created by combining the synthetic X-ray catheter images and the synthetic anatomical images. Affine and deformation transformations are applied to the volumetric CT scan data to simulate the patient’s motion during the fluoroscopy image simulation procedure. (b) Anatomical images are obtained by projecting the volumetric CT scan data into 2D X-ray images. (c) Instrument subtraction images are obtained by subtracting anatomical X-ray images from fluoroscopy images.
Applsci 15 12247 g003
Figure 4. The pipeline of obtaining fluoroscopy images.
Applsci 15 12247 g004
Figure 5. One example of the synthetic data, which contains biplanar views of the instrument subtraction images (a,b), the ground truth mask images (c,d), and the corresponding ground truth 3D catheter points represented by the red curve (e).
Applsci 15 12247 g005
Figure 6. The architecture of the proposed model. (a) TransUnet serves as the encoder and image decoder. (b) Schematic of the catheter 3D points decoder. The details of the conditional 1D U-net is demonstrated in Figure 7.
Applsci 15 12247 g006
Figure 7. The architecture of the condition 1D U-net. (a) Diagram of the conditional 1D U-net within the catheter 3D points decoder. (b) Illustration of the conditional convolutional 1D module embedded in the conditional 1D U-net. Feature-wire Linear Modulation (FiLM) [35] conditioning on the condition tensor is applied to modulate the hidden features of the input.
Applsci 15 12247 g007
Figure 8. (a) A biplanar X-ray system with a silicone vessel phantom positioned at the center. (b) The catheter design inserted into the silicone vessel phantom, based on Figure 2. (c,d) Real-world biplanar subtraction instrument images captured as an image pair. (e,f) Manually annotated segmentation masks corresponding to images (c,d).
Applsci 15 12247 g008
Figure 9. (a,b) An example of a pair of biplanar instrument subtraction images used as input images for our model. (c,d) The ground truth segmentation masks and (e,f) the predicted segmentation masks. (g,h) The re-projected segmentation masks of the predicted 3D catheter points.
Applsci 15 12247 g009
Table 1. Performance of the model on the validation and experimental datasets.
DatasetDiceRMSERP-DICE
Validation Dataset0.915.50.40
Experimental Dataset0.83/0.40
Disclaimer/Publisher’s Note: The statements, opinions and data contained in all publications are solely those of the individual author(s) and contributor(s) and not of MDPI and/or the editor(s). MDPI and/or the editor(s) disclaim responsibility for any injury to people or property resulting from any ideas, methods, instructions or products referred to in the content.