Abstract
The arid–hot valley regions in southwestern China are characterized by developed geological structures and frequent local heavy rainfalls, which often trigger flash floods. The mechanical properties of soil and rock masses in these regions are critical for the construction of regional projects. Field direct shear tests can accurately reflect the mechanical properties of the soil and rock masses in their natural state, but they are costly and cause significant disturbance to the surrounding environment. In contrast, laboratory direct shear tests are more straightforward and cost-effective but cannot fully replicate the complex stress conditions and structural characteristics of in situ soil and rock masses. The lack of correlation between field and laboratory direct shear strength indicators significantly hinders the accurate assessment of geotechnical properties, thereby affecting the precision of engineering applications. To this end, this paper focuses on the soil and rock layers in the arid–hot valley regions in southwestern China. This research took into account the effects of soil depth and moisture content, proposing a solution that fully correlates field and laboratory direct shear strength test indicators. Field and laboratory direct shear tests were conducted at shallow depths to investigate the relationship between the shear strength indicators of various geological formations. The results show that laboratory remolded sample tests generally yield lower shear strength values compared to field direct shear tests. The laboratory shear strength and internal friction angle of each rock and soil layer show a linear increase with depth. A mathematical relationship between soil layer depth, laboratory shear strength indicators, and field shear strength indicators can be established using a quadratic polynomial function. This resolved the “disconnect” between field and laboratory test results, significantly reducing engineering survey costs and providing important theoretical basis and reference for engineering construction in arid and hot river valley regions.
1. Introduction
As a special geographic area, the arid–hot valley region is characterized by high temperatures, scarce rainfall, intense evaporation, and complex geological formations, presenting unique challenges for engineering projects [1]. These conditions lead to distinct soil and rock properties, making the region particularly vulnerable to geological hazards such as landslides. Among the parameters critical for evaluating stability and designing safe structures is the shear strength of soil and rock masses [2,3,4]. This parameter is influenced not only by the intrinsic physical and chemical properties of the material but also by multiple factors, including stratum depth, geological structures, hydrogeological conditions, and past stress conditions [5,6,7]. Given the increasing frequency of geological disasters and the growing scale of engineering projects, accurate assessment of soil and rock shear strength has become essential, especially in complex structures such as slope stabilization systems, large bridges, and tunnels [8].
The field direct shear test is a key method to directly measure the shear strength of soil and rock masses, playing a crucial role in geological engineering surveys and construction projects [9]. As a result of physical and chemical weathering, weathered soils are highly susceptible to disturbance during sampling, transportation, and specimen preparation. Coupled with the size effect in testing, laboratory tests often struggle to yield accurate mechanical parameters. Consequently, in situ geotechnical tests on weathered soil strata are critical [10,11]. Field tests, however, face challenges due to the complexities and variability of field conditions. Factors such as stratum heterogeneity, groundwater influence, and equipment precision limitations can interfere with the testing process, increasing costs and compromising the accuracy and reliability of results [12,13]. In contrast, laboratory direct shear tests offer advantages, such as operational convenience, controlled environments, and high repeatability of data, making them a valuable supplementary tool for researchers and engineers to evaluate soil and rock shear strength. Nevertheless, the factors affecting laboratory test results are highly complex [14]. Deformation and strength parameters obtained from laboratory tests often differ significantly from the true properties of the soil and rock mass, leading to the use of conservative design parameters, which can negatively impact the cost-effectiveness of engineering projects [15]. The lack of correlation between field and laboratory shear strength indicators significantly hinders the accurate evaluation and application of geotechnical properties in engineering, compromising the scientific rigor and precision of construction practices. In the arid–hot valley region, such discrepancies may be further exacerbated by the area’s unique climatic and geological conditions. For instance, high temperatures and arid conditions result in low and uneven water content in the soil and rock masses, while the natural structure of the soil and rock in the field test differs greatly from the remolded sample used in laboratory tests. Therefore, exploring the correlation between in situ and laboratory shear strength parameters is of great significance. Mathematical functions can be used to quantify the relationship between soil depth, laboratory shear strength parameters (cohesion, internal friction angle), and in situ parameters. This approach not only accounts for the dynamic influence of depth on soil mechanical properties, overcoming the limitations of traditional single-parameter correlations, but also enables the prediction of in situ rock and soil strength without relying on extensive field testing. Its core advantages lie in: retaining the low-cost and easy-to-operate characteristics of indoor tests while using mathematical models to correct differences between indoor and field conditions, providing high-precision strength parameter references for engineering practice; simultaneously, it reduces environmental disturbance caused by field tests, enhancing the efficiency and sustainability of engineering surveys.
This paper aims to reveal the intrinsic nature of the variation in soil and rock shear strength with shallow stratum depth through systematic theoretical analysis and experimental research. It also analyzes the effectiveness and scientific validity of laboratory direct shear tests in reflecting and predicting the shear strength of in situ soil and rock masses, identifies the relationship between field and laboratory shear strength indicators, and explores solutions to fully correlate these test results. The findings provide a foundation for the scientific, precise, and safe construction of projects in the arid–hot valley region.
2. Materials and Methods
2.1. Geological Stratification and Specimen Acquisition
The study area is situated within the arid–hot valley region of southwestern China (Figure 1a). This region exhibits a climate gradient transitioning from subtropical to warm-temperate, characterized by significant topographic relief and pronounced altitudinal variation. The study area spans approximately 10 km in length and 5 km in width, with elevations ranging from 1000 to 2000 m above sea level. Intense seasonal rainfall during the monsoon period poses a substantial risk for flash flooding and associated geohazards. The surficial geology at the sampling sites comprises Quaternary artificial cultivated soil (Q4s). Underlying strata include Quaternary diluvial–pluvial deposits (Q4sl+pl) within the valley bottoms and diluvial–eluvial clays (Q4sl+el) on hillslopes. The bedrock consists of the upper section of the Permian Emeishan Basalt Formation (P2β3), characterized by dense, dark gray to gray-green basalt displaying amygdaloidal structures and intercalated tuff layers. A schematic cross-section illustrating the typical distribution of these soil and rock strata is presented in Figure 1b.
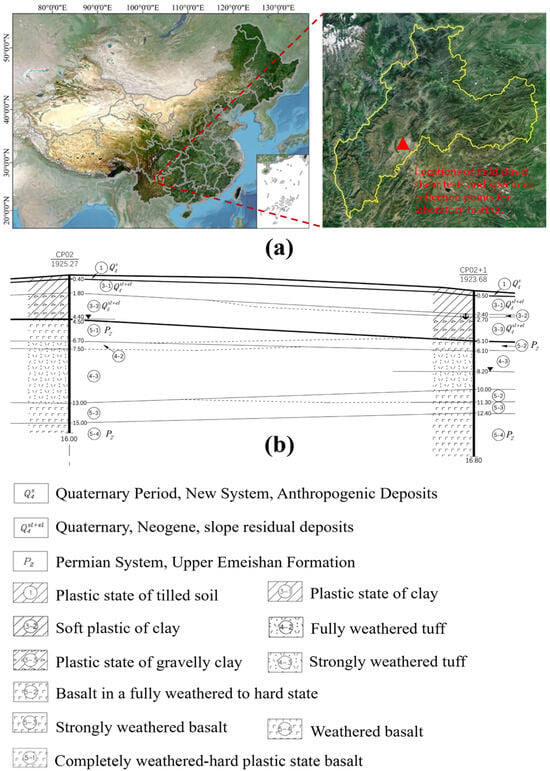
Figure 1.
Research Area Overview. (a) Schematic diagram of the sampling locations in the arid–hot valley region of southwestern China, showing the spatial distribution of the study area and the locations of field direct shear tests (Trenches T1, T2, T3) and specimen collection points for laboratory testing. (b) Schematic cross–section of the typical soil and rock strata in the study area.
Specimen Acquisition: Undisturbed soil and rock specimens were collected from representative locations within the study area, targeting the key geological formations identified above. Sampling was conducted using a combination of hand-excavated trenches and specialized thin-wall tube samplers to minimize disturbance. For each stratum, multiple specimens were extracted at varying depths to capture the vertical heterogeneity of the materials. The sampling depths ranged from 0.5 to 6.0 m, covering the shallow soil and rock layers of engineering interest. The field specimens were prepared with nominal dimensions of 55 × 55 cm. All specimens were immediately sealed in plastic wrap and wax to preserve natural moisture content and structure, then transported to the laboratory for further testing. A total of 16 groups of specimens were collected, including plastic clay, fully weathered tuff, fully weathered basalt, and highly weathered basalt.
2.2. Field Direct Shear Test
2.2.1. Test Principle
Field direct shear tests were conducted to determine the in-situ shear strength parameters—cohesion (c) and internal friction angle (φ)—of key geological formations within the arid–hot valley profile. Four representative strata were selected based on their widespread distribution and significant variations in engineering properties:
- Fully Weathered Tuff: Represents the end-member weathering product of volcaniclastic parent material (γ = 18.2 kN/m3).
- Fully Weathered Basalt: Represents the end-member weathering product of mafic volcanic parent rock (γ = 19.5 kN/m3).
- Highly Weathered Basalt: Represents a critical transitional weathering zone within the basalt sequence (γ = 21.3 kN/m3).
- Plastic Clay: Represents typical Quaternary sedimentary deposits, exhibiting contrasting physico-mechanical behavior to weathered residual soils (γ = 17.8 kN/m3).
Specimen sampling followed a depth-stratified design within shallow depths:
where denotes the state of the soil or rock layer at depth h.
With remolding ratio defined as: , where and denote soil and rock fragment masses, respectively.
This selection strategically captures the dominant materials influencing slope stability in the region. Other weathering grades (e.g., moderately weathered) were excluded due to limited spatial distribution and lesser impact on the specific geohazards under investigation. A total of three test trenches (T1, T2, T3) were excavated for the field direct shear tests. The testing matrix is summarized in Table 1.

Table 1.
Field Direct Shear Test Plan.
This selection strategically captures the dominant materials influencing slope stability in the region. The number of tests for each formation was determined based on their spatial distribution and engineering significance. Fully weathered tuff and fully weathered basalt are widely distributed and critically influence slope stability; hence, multiple tests were conducted to capture their variability. In contrast, highly weathered basalt and plastic clay have limited distribution and lesser impact on the specific geohazards under investigation; therefore, one test each was deemed sufficient to represent their mechanical behavior. Other weathering grades (e.g., moderately weathered) were excluded due to limited spatial distribution and lesser impact on the specific geohazards under investigation.
The fundamental principle involves applying a controlled vertical load (normal stress, σ) to a prepared in situ specimen. Upon stabilization of vertical displacement, a horizontal load (shear force) is incrementally applied. The resulting shear stress (τ) and corresponding horizontal displacement are recorded until shear failure occurs. For specimens within the same test trench, peak shear stress (τpeak) values obtained under different normal stresses are analyzed using linear regression (least squares method) based on the Mohr–Coulomb failure criterion (τ = c + σ tan φ) to derive the cohesion (c) and internal friction angle (φ) for the specific stratum or structural interface.
The Mohr–Coulomb failure criterion was extended to account for depth-dependent stress states: , where is pore air pressure. The effective stress tensor in Cartesian coordinates: governs shear strength evolution, with as Kronecher delta.
2.2.2. Apparatus and Measurement System
Field testing employed a WBJL-type in situ direct shear apparatus, utilizing a vertical loading and horizontal shear configuration. The system comprises three primary subsystems (Figure 2):
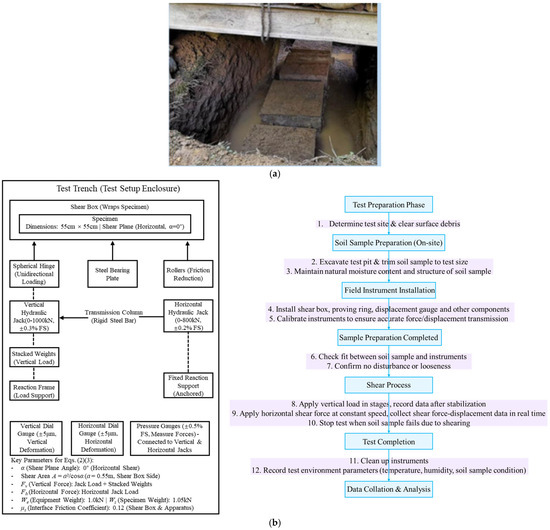
Figure 2.
Field Direct Shear Test Setup and Specimen. (a) Undisturbed soil specimen prepared in the trench; (b) Schematic diagram of the in situ direct shear apparatus.
- Vertical Loading System (0–1000 kN, ±0.3% FS, where FS stands for Full Scale): Utilized a reaction frame with stacked weights and a hydraulic jack for staged application of normal stress. Force transmission employed columns, steel bearing plates, and spherical hinges to ensure uniaxial loading. Rollers minimized friction between the shear box and loading apparatus.
- Horizontal Shear System (0–800 kN, ±0.2% FS, where FS stands for Full Scale): Utilized fixed reaction supports anchored in the test trench walls. A jack applied horizontal thrust to the shear box via transmission columns (rigid steel rods) and a spherical hinge, enabling incremental shear force application.
- Measurement System (±5 μm): Incorporated calibrated jacks and pressure gauges (with an accuracy of ±0.5% FS) for force application and displacement monitoring. Vertical deformation was measured using precision dial gauges. Horizontal displacement was measured using dial gauges fixed at designated points on the shear box force application surface.
Stress calculation incorporated geometric corrections:
where is the normal stress on the shear plane (kPa), is the shear stress on the shear plane (kPa), is the applied vertical force (kN), is the applied horizontal force (kN), is the area of the shear plane (m2), is the angle between the shear plane and the horizontal direction (°); for horizontal shear, , is the interface friction coefficient between the shear box and loading apparatus (dimensionless, taken as 0.12 in this study), is the weight of the equipment above the specimen (kN, taken as 1.0 kN), is the weight of the specimen (kN, taken as 1.05 kN).
Loading followed a staged creep protocol:
- Vertical stress: ;
- Shear strain rate: ;
- Failure criterion: .
2.2.3. Field Direct Shear Test Procedure
Testing strictly adhered to the specifications outlined in the Code for Investigation of Geotechnical Engineering (GB 50021-2001, 2009 edition) [16] and the Specification for In-situ Direct Shear Test (YS 5221-2000) [17]. The procedure encompassed the following key stages:
- Site Preparation & Specimen Fabrication: Following site designation, a test trench was excavated. Undisturbed specimens (nominal dimensions 55 cm × 55 cm × 20 cm, Figure 2) were meticulously prepared by hand within the trench walls. Four specimens were typically prepared per trench. Actual specimen dimensions were recorded post-preparation.
- Equipment Installation: The shear box was positioned and secured around the specimen. For designated test groups involving saturation, immersion was performed at this stage. Subsequently, the vertical loading system was installed and pressure applied incrementally until specimen compression stabilized (monitored via vertical dial gauge). Finally, the horizontal shear and deformation measurement systems were installed.
- Application of Normal Stress: A predefined vertical pressure (normal stress) was applied to the specimen and maintained constant until the vertical displacement stabilized. The applied normal stress levels were 50 kPa, 100 kPa, 200 kPa, and 400 kPa, corresponding to the coefficient k = 0.5, 1.0, 2.0, and 4.0, respectively, in the equation from Section 2.2.2. Each specimen was subjected to shear under a single, predetermined normal stress level until failure; multi-stage testing on a single specimen was not performed.
- Shearing Phase: Upon stabilization of vertical settlement, the horizontal shear force was initiated at approximately 1/10 of the estimated peak capacity. The shear force was then applied in increments of 54 kPa. At each load increment, the horizontal force, displacement, and specimen behavior were recorded. The vertical pressure was held constant throughout the entire shearing phase.
- Unloading and Post-Test: Upon completion of shearing, vertical pressure was released first, followed by the horizontal shear force. The shear box was then removed, and the failed specimen was examined and described.
2.3. Laboratory Direct Shear Test
2.3.1. Sample Preparation
Materials for laboratory testing were sourced from the same sampling points as the field investigations, targeting cohesive soil, fully weathered tuff, fully weathered basalt, and highly weathered basalt. At each target depth, corresponding undisturbed soil samples were carefully retrieved for laboratory testing. Basic physical properties of the fine-grained fraction (soil portion) of the soil–rock mixtures are presented in Table 2, while Figure 3 shows the particle size distribution of the entire soil–rock mixture, including both soil and rock fragments. For remolded testing, soil–rock mixtures were homogenized at a 7:3 ratio (by dry weight), compacted, and trimmed into standard ring-shear specimens (61.8 mm diameter × 20 mm height).
Table 2.
Basic physical properties of the fine-grained fraction (soil portion) of the soil–rock mixtures.
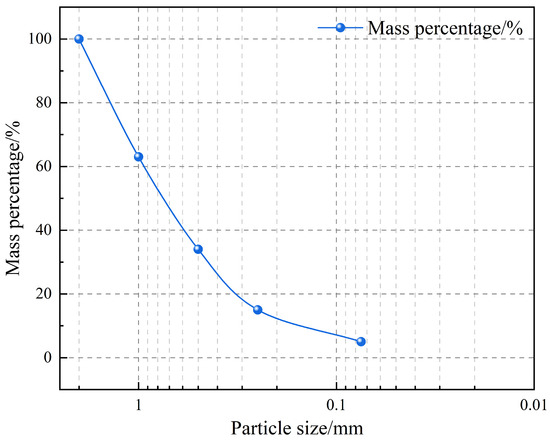
Figure 3.
Particle size distribution curves of the total soil–rock mixtures.
In the preparation of remolded specimens, soil and rock fragments are distinguished based on particle size. According to standard geotechnical practice, particles with a diameter less than 4.75 mm (passing the No. 4 sieve) are classified as soil, while particles with a diameter greater than or equal to 4.75 mm (retained on the No. 4 sieve) are classified as rock fragments. This ensures a clear distinction between soil mass ms and rock fragment mass mr in the calculation of the remolding ratio .
2.3.2. Test Method
Laboratory direct shear tests were performed using a conventional shear box apparatus. Specimens were subjected to four levels of normal stress: 50 kPa, 100 kPa, 200 kPa, and 400 kPa. The number of test groups for each soil/rock layer, along with the depth range and water content range of the specimens, are summarized in Table 3. For each soil type, four parallel tests were conducted under these four normal stress levels to establish the shear strength envelope. A total of 16 test groups (4 specimens per group) were conducted. For each soil type, four parallel tests were conducted under these four normal stress levels to establish the shear strength envelope. The rapid shear method was employed at a constant displacement rate of 0.8 mm/min. Shearing was terminated when a distinct peak shear stress was observed and recorded. For materials exhibiting strain-hardening behavior without a clear peak, the shear stress at 4 mm displacement was defined as the shear strength, consistent with common geotechnical testing practice to ensure comparability of results. In practice, the test continued beyond 4 mm displacement if necessary to accurately capture the peak shear stress, particularly for strain-softening materials, as evidenced in Figure 4.
Table 3.
Laboratory Direct Shear Test Plan.
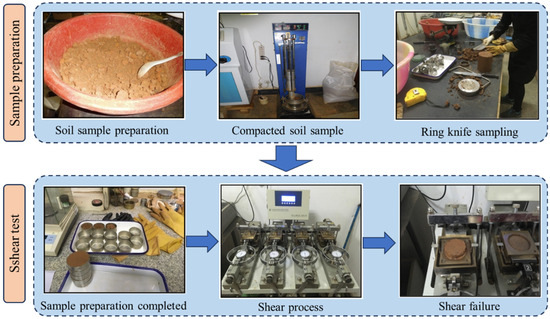
Figure 4.
Laboratory Direct Shear Test Procedure.
To ensure the rationality of correlating field and laboratory test results at different depths, the following design was adopted in this study. The field direct shear tests covered a depth range of 0.5–3.1 m, while the laboratory direct shear tests extended to 0.5–6.0 m. The core correlation analysis focused on the overlapping depth interval (0.5–3.1 m) to avoid deviations caused by inconsistent depth ranges. The mapping relationship was established by treating soil layer depth (H) and laboratory shear strength indicators (cohesion C, internal friction angle φ) as independent variables, and field shear strength indicators (C′, φ′) as dependent variables. A bivariate quadratic polynomial function was used for fitting, and the fitting effect was verified by correlation coefficient (R2) and mean relative error (MRE). The results showed that R2 of cohesion and internal friction angle mapping reached 0.97, and MRE was 3.2%, which met the criteria of R2 ≥ 0.95 and MRE ≤ 5%, confirming the reliability of the correlation model. In addition, sensitivity analysis was conducted to clarify the influence degree of each independent variable on the dependent variable, providing a theoretical basis for the physical significance of the correlation model.
2.4. Methods for Deriving Mapping Relationships
Using soil layer depth (H) and indoor parameters (C, ϕ) as independent variables, and field parameters (C′, ϕ′) as dependent variables, a binary quadratic polynomial function was used for fitting. The formula is as follows:
Here, x and y represent two independent variables, namely soil layer depth (H) and indoor shear strength indicators (such as cohesion c or internal friction angle φ). In the formula: n is the degree of the polynomial; k and l are non-negative integers; ak,l are the coefficients of the polynomial, taken from the natural number domain; the degree of is k + l.
Sensitivity Analysis Methods
Single-factor sensitivity analysis method: Fix other coefficients and independent variables (H, C, ϕ), and only change a certain coefficient. Calculate the relative change rate of the field indicators (C′, ϕ′), and define the sensitivity coefficient S as
In the formula: RI is the index change rate; RC is the coefficient change rate. If , then the coefficient is highly sensitive; if , then the coefficient is moderately sensitive; if , then the coefficient is low sensitivity. The threshold of 0.1 is adopted based on common practice in geotechnical sensitivity analysis, where a relative change rate of 10% is considered a meaningful lower limit for identifying parameters with non-negligible influence.
3. Results
3.1. Morphological Characteristics of Soil Samples
Figure 5 illustrates the morphological characteristics of soil samples taken from different sampling points. Figure 5a shows the plastic clay, which is primarily brown, with mixed grayish-brown and other hues. It is very wet, predominantly in a plastic state, with some areas exhibiting hard plastic and soft plastic states. There is a small amount of gravel and angular fragments mixed locally, primarily distributed at the top of the trench, with a thickness generally ranging from 0.5 to 1.5 m. Figure 5b shows the fully weathered tuff, which exhibits a mixed color, predominantly dark purplish-red, with gray-yellow, yellow-brown, and other color patches, and black-brown thin films. It is fully to highly weathered and appears in a hard, soil-like state, with localized angular fragments and gravel. The parent rock structure is clearly visible, and some areas contain fully weathered basalt blocks or thin layers. It is mostly blocky and can be broken by hand. The residual structural strength of the parent rock is significant, but rapidly decreases after disturbance or exposure. It is mostly layered or lenticular, distributed across the upper and middle sections of the slope (referring to the natural hillslope terrain within the study area), with thicknesses ranging from 2.0 to 5.0 m. Figure 5c shows the fully weathered basalt, which is gray-yellow with black-brown thin films. It is fully to highly weathered, appearing in a hard, soil-like or blocky state, with small amounts of gravel and angular fragments, and can be broken by hand. It softens and disintegrates easily when wet. Figure 5d shows the highly weathered basalt, which is gray-yellow, gray-brown, and gray-green, with black-brown thin films. It is highly weathered and appears predominantly gravelly, with some areas showing blocky, angular fragments, and soil-like material. Some gravel cores are black-gray. There are two types of highly weathered basalt: one is highly fragmented and gravelly, with cores that are mostly black-gray and relatively hard; the other is more intact, appearing blocky but relatively soft. This is a soft rock, predominantly fragmented, with localized areas of more severe fragmentation. It is mostly layered or lenticular, distributed across the middle sections of the bedrock, with thicknesses ranging from 2.0 to 6.0 m.
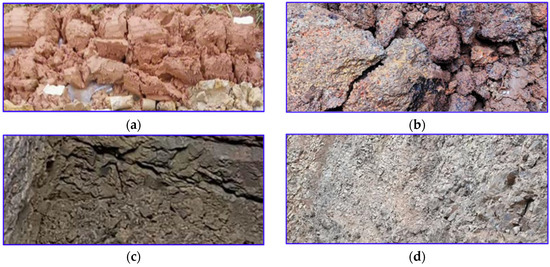
Figure 5.
Morphology of Soil Samples from Different Soil and Rock Layers. (a) Plastic clay; (b) Fully weathered tuff; (c) Fully weathered basalt; (d) Highly weathered basalt.
3.2. Field Direct Shear Test
3.2.1. Stress–Strain Curve of Field Direct Shear Test
The shear stress–displacement curve is a key tool for understanding the fundamental mechanical and deformation characteristics of soil and rock media. It provides insights into the mechanical behavior of undisturbed soils. In field direct shear tests, the vertical pressure P and shear stress τ must first be calculated. The vertical pressure P is determined using the following formula:
where P is the vertical pressure (kPa); F1 is the load applied by the normal stress jack (kN); P1 is the weight of the equipment, equal to 1 kN; P2 is the weight of the specimen, equal to 1.05 kN; α is the angle between the shear plane and the horizontal direction (°). A is the area of the shear plane (m2), calculated as A = a2/cos α, where a is the edge length of the shear box, equal to 0.55 m.
The shear stress τ in field shear tests is calculated using the following formula:
where τ is the shear stress (kPa); F11 is the thrust applied along the shear plane by the shear stress jack (kN); all other parameters are the same as those in Formula (5).
Clarification on the parameters in Formulas (6) and (7):
In Formula (6), P1 represents the total weight of the equipment above the specimen, including the shear box, loading plates, and spherical hinges. P2 is the weight of the specimen itself. The value of 1.05 kN for P2 is a representative value used for standardization; actual specimen weights varied slightly but had negligible impact on the stress calculations.
Although the formulas include the angle αα to account for the theoretical possibility of an inclined shear plane, all field direct shear tests in this study were conducted on a horizontal shear plane (α = 0). The shear box was carefully leveled during installation to ensure the shear plane remained horizontal throughout the test.
Figure 6 illustrates the stress–strain curves obtained from the field direct shear tests. These curves demonstrate that all tested in situ soil samples exhibit strain-softening behavior, characterized by a distinct peak shear stress followed by a gradual decrease in strength with continued displacement. This behavior indicates that the soil and rock masses undergo progressive failure, with the breakdown of interparticle bonds and structural rearrangement during shearing. At low stress levels, particle interactions within the soil and rock mass are minimal, resulting in significant elastic deformation. Stress and strain exhibit a linear relationship, characterized by high stiffness and minimal deformation during this stage. As stress increases, particles begin to slide or displace relative to each other, transitioning the mass into the plastic deformation stage. Stress reaches its peak at this stage, indicating the maximum shear strength of the mass. After the peak, particle interactions weaken, leading to a reduction in bearing capacity. Stress decreases as strain increases, and deformation accelerates until failure occurs. As the vertical load increases, the initial shear stress–strain curve of the sample becomes steeper, and the linear-elastic stage extends, indicating a higher elastic modulus. This response reflects the enhanced interlocking and frictional resistance among soil and rock particles under greater confining pressure, which was explicitly examined through the controlled application of normal stresses at multiples of the overburden pressure (k = 0.5, 1.0, 2.0, 4.0). The sample’s resistance to deformation strengthens, increasing its shear strength.
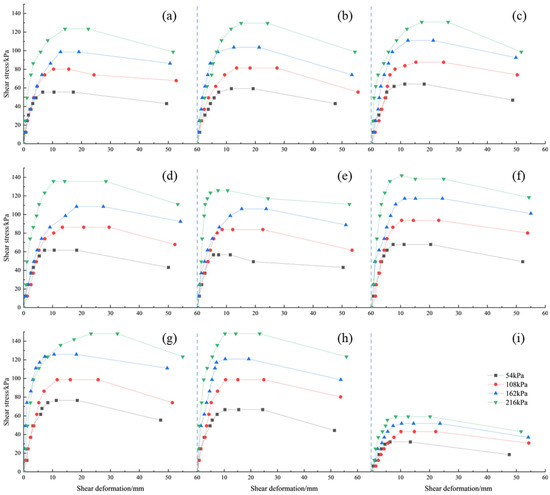
Figure 6.
Stress–strain Curves of Field Direct Shear Test Samples. (a) 0.6 m fully weathered tuff; (b) 2.1 m fully weathered tuff; (c) 2.3 m fully weathered tuff; (d) 0.7 m fully to highly weathered basalt; (e) 0.9 m fully to highly weathered basalt; (f) 2.9 m fully to highly weathered basalt; (g) 3.1 m fully to highly weathered basalt; (h) 2.0 m highly weathered basalt; (i) 0.7 m plastic clay.
3.2.2. Relationship Between Normal Stress and Shear Stress
Figure 7 illustrates the relationship between normal stress and shear stress for each soil and rock layer. From the figure, it can be observed that the field shear strength exhibits a strong linear correlation with vertical stress, with the fitting correlation coefficient exceeding 99%.
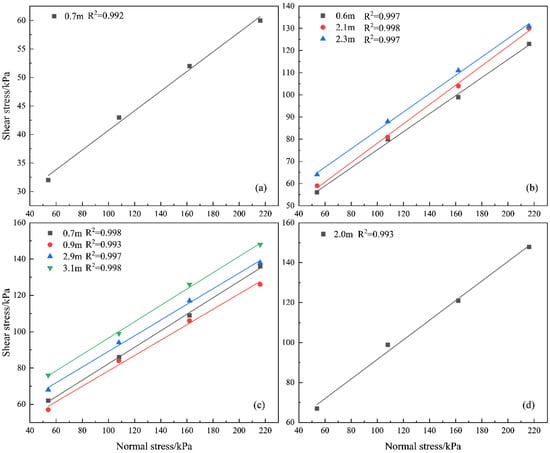
Figure 7.
Relationship Between Normal Stress and Shear Stress of Each Soil and Rock Layer. (a) Plastic clay; (b) Fully weathered tuff; (c) Fully weathered basalt; (d) Highly weathered basalt.
The shear strength of the soil and rock mass, τf, increases with the normal stress, σ, on the shear plane, which is consistent with Mohr’s strength theory. As the normal stress increases, the contact area between soil particles enlarges, and the number of contact points rises, thereby enhancing the friction and shear strength of the soil and rock mass. Additionally, the increase in normal stress can compress the voids between soil particles, further enhancing the compaction and shear resistance of the soil and rock mass.
3.2.3. Shear Strength Indicators
Based on the Mohr–Coulomb strength theory, the data in Figure 6 are processed using the following calculation formula:
where τ is the shear stress on the failure surface (kPa), representing the shear strength of the soil and rock mass; σ is the normal stress on the failure surface (kPa); c is the cohesion of the soil and rock mass (kPa); φ is the internal friction angle of the soil and rock mass (°).
The resulting parameters are the effective cohesion and effective internal friction angle, as shown in Table 4.
Table 4.
Shear strength indicators of Field Shear Test.
Overall, the cohesion (c) of the samples increases with depth, while the variation in the internal friction angle (φ) remains relatively small. The differences in soil cohesion are primarily influenced by the weathered crust, degree of consolidation, and extent of weathering. Shallow soil and rock masses are directly exposed to the environmental climate and exhibit a distinct weathered crust. As depth increases, the influence of the weathered crust and the extent of weathering gradually diminish, leading to a decrease in cohesion. In contrast, the internal friction angle is closely related to the particle shape and gradation characteristics of the soil, which undergo less change during weathering, resulting in minimal variation in the internal friction angle. For fully weathered tuff, the cohesion (c) ranges from 33.9 kPa to 42.6 kPa, with an average of 37.2 kPa. The internal friction angle (φ) ranges from 22.3° to 23.3°, with an average of 22.7°. For fully weathered basalt in its natural state, cohesion (c) ranges from 35.8 kPa to 51.8 kPa, with an average of 42.6 kPa, while the internal friction angle (φ) ranges from 23.0° to 24.3°, with an average of 23.7°. The cohesion (c) of highly weathered basalt in its natural state is 41.9 kPa, with an internal friction angle (φ) of 26.3°. For plastic clay in its natural state, cohesion (c) is 23.8 kPa, and the internal friction angle (φ) is 9.7°.
3.3. Laboratory Direct Shear Test
3.3.1. Variation in Water Content with Depth in Different Soil and Rock Layers
Figure 8 illustrates and compares the variation in water content with depth across different soil and rock layers. To facilitate a clear visual comparison of the variation trends among these formations on a single figure, the depth scales are optimized individually for each stratum. As shown, the water content of plastic clay and fully weathered basalt initially decreases and then increases with depth. This is likely due to the relatively high-water content in the shallow layers, where water is less able to penetrate the underlying soil. As the depth increases, groundwater replenishment causes the water content to rise again. In contrast, the water content of fully weathered tuff varies significantly with depth, likely due to the uneven distribution of weathered tuff layers and varying clay content, causing fluctuations in water content in the shallow soil layers. Once the soil depth reaches 6 m, groundwater replenishment becomes less effective, resulting in a gradual decrease in water content.
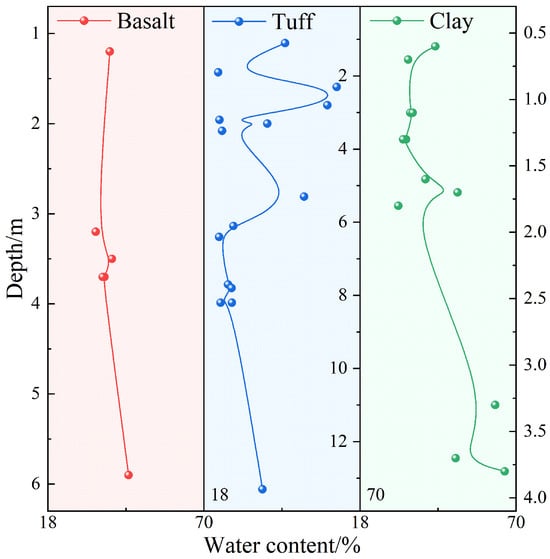
Figure 8.
Variation in Water Content with Depth for Different Soil and Rock Layers (Note: Depth scales are individualized for each formation to optimally display their respective variation ranges, enabling direct comparison of trends on a single plot.).
3.3.2. Variation in Shear Strength Indicators with Water Content
Soil water content is closely related to shear strength indicators [18,19]. It should be noted that some data points with high water content and extreme values were excluded from the plots to enhance the clarity of the relationships. However, all tests were conducted and considered in the analysis. Given that there are more test points for clay and tuff, the relationship between their water content and cohesion is analyzed, as shown in Figure 9. Overall, the cohesion of plastic clay decreases as the water content increases. Before reaching 35% water content, cohesion decreases significantly; beyond this point, the decrease becomes more gradual. This behavior occurs because as the soil transitions from dry to wet, the distance between soil particles increases, and the water film thickens, weakening the bonding force. Once the soil reaches a fluid state, the bonding force nearly disappears. The relationship between cohesion and water content can be approximated by an exponential function, as shown in Formula (8). For fully weathered tuff, the cohesion initially increases and then decreases with increasing water content. This is because, at lower water content, cohesion rises as water is added, and the contact points between soil particles form a meniscus shape, maximizing the bonding force. However, as water content continues to rise, the water film thickens, the distance between particles increases, and the bonding force gradually weakens.
where ccllay is the cohesion of clay (kPa); ctuff is the cohesion of tuff weathered soil (kPa); w is the water content of the soil (%).
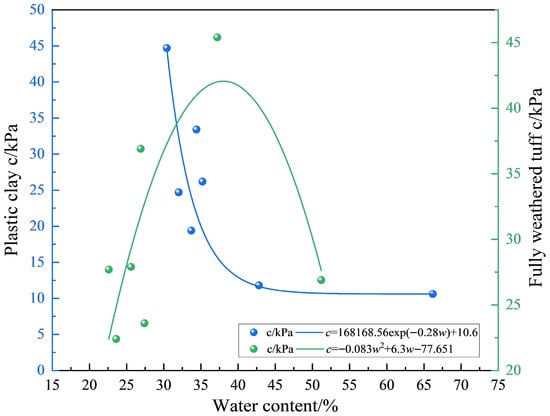
Figure 9.
Relationship Between Water Content and Cohesion for Different Soil and Rock Layers. (Note: The water content range in this figure includes data points after removing outliers for better representation of the trend. The full data set is available upon request).
The relationship between water content and internal friction angle for different soil and rock layers is analyzed, as shown in Figure 10. The internal friction angle is primarily determined by the coarse particles in the soil. Changes in water content have minimal impact on the composition, size, and shape of these coarse particles, resulting in a weak correlation between the internal friction angle and water content.
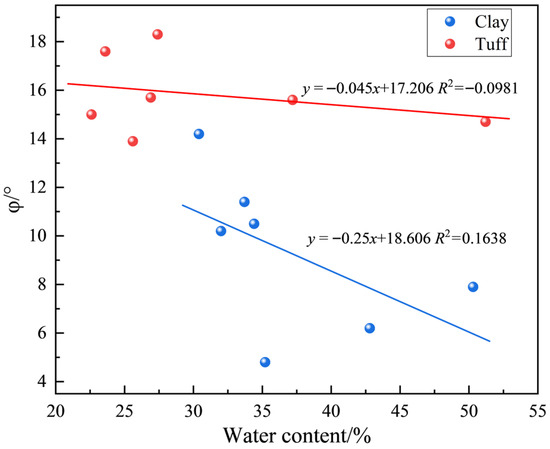
Figure 10.
Relationship Between Water Content and Internal Friction Angle for Different Soil and Rock Layers. (Note: The water content range in this figure is limited to highlight the trend, as the internal friction angle is less sensitive to water content. Some high-water-content points were excluded for clarity. All tests were conducted and considered in the analysis. The full data set is available upon request).
3.3.3. Variation in Shear Strength Indicators with Soil Depth
There is a relationship between the shear strength of the soil and rock mass and the depth of the soil layers [20]. Based on laboratory direct shear tests, the relationship between the shear strength indicators at different depths for each soil layer is shown in Figure 11. From the figure, it can be observed that the cohesion of the soil increases linearly with the depth of the soil layer. This is because, as depth increases, the contact area between soil particles expands, and the water content, organic matter, and minerals in the soil rise, all of which enhance the bonding force between soil particles, thereby increasing cohesion. The internal friction angle increases with depth. At greater depths, the overlying pressure causes the soil and rock particles to become more tightly packed, enhancing the friction and interlocking forces between them. Additionally, deeper soil layers have undergone longer periods of deposition and compaction, resulting in a denser structure. This more stable structure improves the resistance of soil particles to shear, thereby increasing the internal friction angle. All laboratory test data are included in Figure 11 without exclusion to ensure completeness and accuracy of the depth-dependent trends.
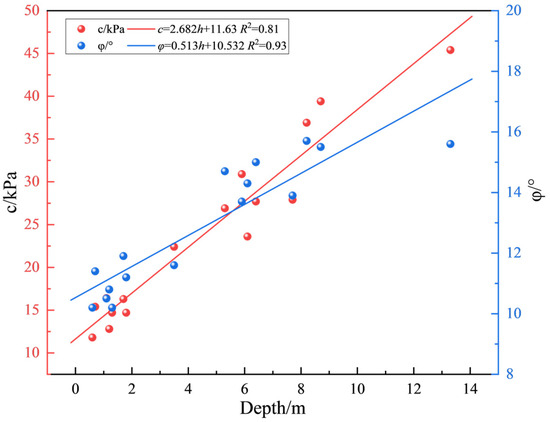
Figure 11.
Relationship Between Depth and Shear strength Indicators of Different Soil and Rock Layers. (Note: All laboratory test data are included in this figure without exclusion).
By fitting the depth and cohesion values for each soil and rock layer to a linear function, the mathematical relationship between the shear strength indicators and the depth of each soil and rock layer can be determined, as shown in Formula (9).
where c is the cohesion of each soil and rock layer (kPa); φ is the internal friction angle of each soil and rock layer (°); h is the depth of the soil layer (m).
4. Discussion
4.1. Comparative Analysis of Field and Laboratory Direct Shear Strength Indicators
Figure 12 compares the shear strength values at different depths obtained from field and laboratory direct shear tests. It is evident that, in general, the field direct shear strength values are significantly higher than those from the laboratory tests at all depths. Note that at 0.7 m depth, two field cohesion values were obtained from plastic clay and fully weathered basalt, respectively. For clarity in trend comparison, only the plastic clay data are plotted in Figure 12, as the laboratory tests for fully weathered basalt were conducted at greater depths (2.0–5.0 m). The field cohesion value for fully weathered basalt at 0.7 m is provided in Table 5 and discussed in Section 3.2.3. The average cohesion from the field tests is 40.5 kPa, compared to 16.4 kPa from the laboratory tests. Similarly, the average internal friction angle from field tests is 23.7°, while laboratory tests yield an average of 11.3°. Several factors contribute to this discrepancy: As depth increases, the composition and structure of the soil may change. Deeper soil layers often contain more gravel and angular particles, which result in higher frictional resistance. This, in turn, leads to the higher cohesion and internal friction angle values observed in field shear tests. Additionally, deep soil layers may experience consolidation and compaction over time due to prolonged self-weight loading, leading to tighter particle contact and, consequently, higher shear strength. In contrast, remolded samples used in laboratory direct shear tests are prepared by drying, crushing, and rehydrating the soil to achieve the desired water content. This process largely removes any residual chemical bonding and cementation, resulting in a reduction in shear strength compared to the in situ samples. In field shear tests, the soil is subjected to a three-dimensional stress state, while in laboratory direct shear tests, it experiences a two-dimensional stress state. This difference in stress conditions may result in variations in soil behavior under applied loads.
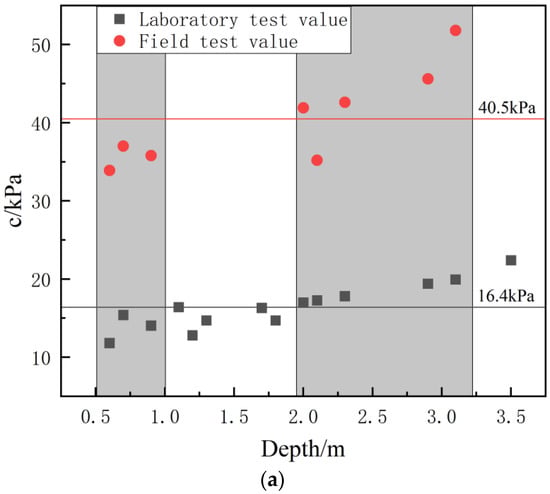
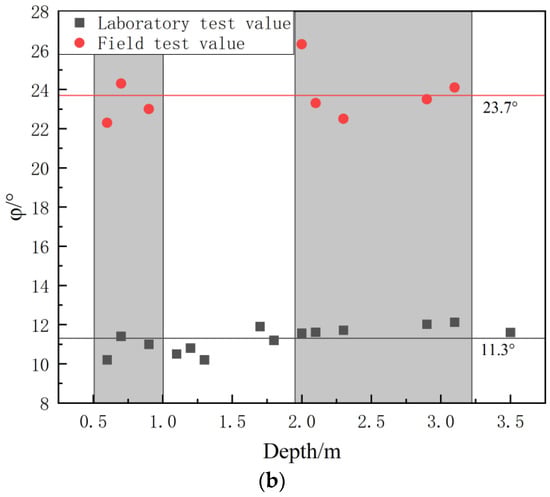
Figure 12.
Comparison of the Shear Strength Between Field and Laboratory Tests. (a) Comparative Curves of Cohesion (C); (b) Comparative Curves of Internal Friction Angle (C). (Note: At 0.7 m depth, two field cohesion values were obtained from plastic clay and fully weathered basalt. Only the plastic clay data are shown here for clarity, as the laboratory tests for fully weathered basalt were conducted at depths ≥ 2.0 m). The gray areas in the figure represent the comparison of parameters within the same depth range.
Table 5.
Strength fitting formula coefficients.
4.2. Correlation Analysis of Direct Shear Strength Indicators at Different Depths
Figure 13 shows the heatmap of correlation coefficients between cohesion (c) and internal friction angle (φ) from field and laboratory direct shear tests at various soil depths.
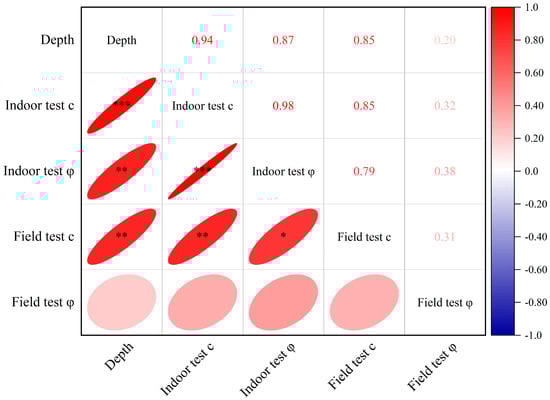
Figure 13.
Correlation Coefficient Heatmap. (* p ≤ 0.05 ** p ≤ 0.01 *** p ≤ 0.001).
From the figure, it can be observed that as the soil depth increases, both the internal friction angle and cohesion from the field and laboratory tests generally show an increasing trend. According to the principle of effective stress, as soil depth increases, the weight of the overlying layers also increases, which in turn raises the effective stress. For non-cohesive soils, this increase in effective stress leads to a corresponding rise in the internal friction angle. For cohesive soils, the increase in effective stress also causes cohesion to rise. Moreover, changes in the arrangement and structure of soil and rock particles occur with depth. In deeper soil layers, the particles become more tightly packed, and the structure of cohesive soils becomes more stable, leading to an increase in both internal friction and cohesion. Although the absolute values of field and laboratory strength indicators differ significantly, both show a similar increasing trend with depth. The laboratory tests, which extended to 6.0 m, provide a continuous depth-dependent trend that aligns with the field data in the overlapping depth range (0.5–3.1 m). However, due to the lack of field test data beyond 3.1 m, it is not possible to confirm whether the field and laboratory test results converge at greater depths. Future research involving field tests at depths beyond 3.1 m is recommended to validate this trend. The increasing trend in both tests is attributed to the enhanced overlying pressure and more stable soil structure at greater depths, which reduce the influence of surface disturbances and initial structural differences.
It is noteworthy that the correlation coefficients for the field internal friction angle (φ) are relatively lower compared to other parameters (Figure 13). This can be attributed to the inherent heterogeneity of in situ soil–rock mixtures, the presence of localized structural features such as fractures and weathering zones, and the complex stress history of the natural deposits. These factors introduce greater variability in field-measured φ values, which are less pronounced in laboratory settings due to specimen homogenization and controlled testing conditions.
4.3. Mapping Relationship Between Field and Laboratory Direct Shear Strength Indicators
The correlation between field and laboratory test results was constructed based on the consistent depth interval. Specifically, the field tests were carried out at 0.5–3.1 m, and the laboratory tests included the same depth range (0.5–3.1 m) while extending to 6.0 m. Only the data within the overlapping depth of 0.5–3.1 m were used for fitting to ensure that the correlation was not affected by the difference in test depth ranges.
As observed above, there is a certain correlation between shallow soil layer depth and the direct shear strength indicators from field and laboratory tests. In this paper, soil layer depth and laboratory direct shear parameters are considered as independent variables, with field direct shear strength indicators as the dependent variable. A bivariate quadratic function is used to fit the relationship between the three parameters. The fitted surface is shown in Figure 14, and the fitting result is expressed by Formula (10). The correlation coefficient for cohesion mapping is R2 = 0.97, with an MRE of 3.2%; the correlation coefficient for internal friction angle mapping is R2 = 0.97, with an MRE of 3.2%. Both meet the criteria of R2 ≥ 0.95 and MRE ≤ 5%, indicating that the coefficients can effectively establish a mapping relationship between field and indoor indicators. Both meet the criteria of R2 ≥ 0.95 and MRE ≤ 5%, indicating that the coefficients can effectively establish a mapping relationship between field and indoor indicators.
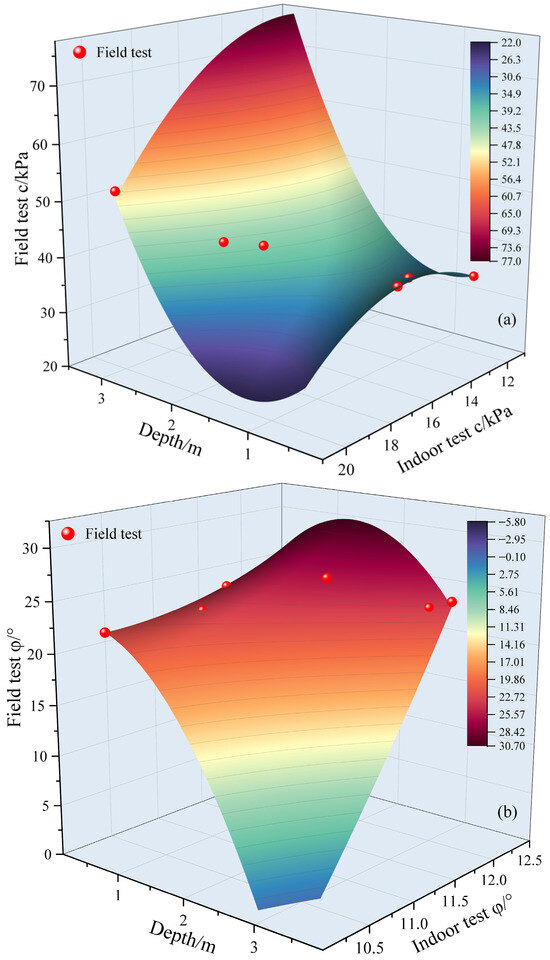
Figure 14.
Relationship Between Field and Laboratory Direct Shear strength Indicators at Different Depths. (a) Relationship Between Field and Laboratory Direct Shear Cohesion at Different Depths (b) Relationship Between Field and Laboratory Direct Shear Internal Friction Angles at Different Depths.
In the equation, C′ represents the in situ direct shear cohesion (kPa); C represents the laboratory direct shear cohesion (kPa); ϕ′ represents the in situ internal friction angle (°); ϕ represents the laboratory internal friction angle (°); H is the depth of the soil layer (m); a, b, c, d, e, f, g, h, i, j, k, and l are the coefficients to be determined, which are solved by performing regression analysis on the experimental data using the least squares method to minimize the sum of squared errors between the field measured values and the formula-predicted values.
An analysis of the sensitivity of the coefficients in the above formula (Table 5) was conducted. The sensitivity index (S) of coefficient c in the cohesion formula is 1.23 (highly sensitive), indicating that indoor cohesion has a significant linear influence on field cohesion; the sensitivity index of coefficient a is 0.85 (moderately sensitive), with depth having a secondary nonlinear influence; and the sensitivity index of coefficient i is 0.07 (low sensitivity), having a minor impact on the results. In the internal friction angle formula, the sensitivity coefficient S for coefficient j is 1.15 (highly sensitive), while the sensitivity of the remaining coefficients is relatively low.
From the actual field test data presented in Table 5 and Figure 12, it can be observed that both cohesion and internal friction angle generally increase with depth within the tested range (0.5–3.1 m). The field cohesion shows a consistent increasing trend from 23.8 kPa at 0.7 m to 51.8 kPa at 3.1 m, while the internal friction angle increases from 9.7° to 24.1° over the same depth range. The quadratic polynomial fitting provides a mathematical representation of this relationship, but the primary conclusions are drawn from the actual measured data. The increasing trend with depth is attributed to enhanced overlying pressure and more stable soil structure at greater depths, which improve particle contact and interlocking. It should be noted that the mathematical fitting surface in Figure 14 represents an approximation of the actual data trends, and the physical interpretations are based on the measured field test results rather than the fitted surface characteristics.
Additionally, it is worth noting that laboratory direct shear tests were conducted on specimens from depths up to 6.0 m, while field tests were limited to shallow depths (up to 3.1 m) due to practical constraints such as equipment accessibility and cost. The laboratory data from greater depths provide valuable insights into the continuous variation in shear strength indicators with depth, which aligns with the observed linear trends in Section 3.3.3. However, since no field data are available for these deeper layers, these laboratory results were not utilized in establishing the mapping relationship between field and laboratory strength indicators. Future work could involve extending field tests to greater depths to validate and refine the proposed mapping model for the entire soil profile, thereby enhancing its applicability in deeper geotechnical applications.
However, it should be noted that the proposed mapping model is based on the limited field test data up to 3.1 m depth. When extrapolating beyond the data range, the model may yield predictions with increased uncertainty. For instance, at a depth of 3.2 m, the model predicts a field cohesion of about 77 kPa, which is 48% higher than the maximum measured field cohesion of 52 kPa at 3.1 m. Moreover, at this depth, the laboratory cohesion is around 20 kPa, while the model prediction corresponds to a laboratory cohesion of 12 kPa. This discrepancy highlights the limitations of the model in extrapolating to depths beyond the available field data. Therefore, the proposed mapping relationship should be applied with caution within the depth range of 0.5–3.1 m, and further field tests at greater depths are recommended to validate and refine the model for extended depth ranges. In engineering practice, appropriate safety factors should be considered when using the predicted values, especially for critical applications.
4.4. Comparison with Literature
To further validate the reliability of our results, we compared the shear strength parameters obtained in this study with those reported in the literature for similar geological formations. For example, Lv et al. [3] investigated the shear strength of soil–rock mixtures using in situ tests and reported cohesion values ranging from 30 to 50 kPa and internal friction angles from 20° to 25° for weathered soils, which are consistent with our findings for fully weathered tuff and basalt. Similarly, Zhang et al. [2] studied the effects of moisture and stone content on shear strength characteristics of soil–rock mixtures and found that cohesion decreases with increasing water content, a trend also observed in our laboratory tests for plastic clay and fully weathered tuff. Additionally, Huang et al. [5] reported a correlation between shear strength and soil physicochemical properties in weathered profiles, with cohesion values varying from 20 to 60 kPa depending on depth and weathering degree, which aligns with our depth-dependent results. The general agreement between our results and previous studies reinforces the applicability of the proposed mapping relationship for geotechnical applications in arid–hot valley regions.
4.5. Applicability to Other Soil Types
The mapping relationship proposed in this study is developed specifically for the soil and rock layers in arid–hot valley regions, including plastic clay, fully weathered tuff, fully weathered basalt, and highly weathered basalt. The differences between field and laboratory shear strength indicators are attributed to factors such as in situ structure, cementation, stress history, and sample disturbance. For other soil types (e.g., sandy soils, silty clays, or residual soils in different climatic regions), the differences between field and laboratory tests may vary significantly due to variations in soil composition, gradation, moisture sensitivity, and geological history.
Based on the general trends observed in this study and existing literature [2,5,9], field shear strength values are typically higher than laboratory values. For instance, in cohesive soils, the field cohesion may exceed laboratory cohesion by 20% to 100%, while the internal friction angle may be 10% to 40% higher in field tests. In granular soils, the differences may be smaller due to less influence of structure and cementation. However, these estimates are qualitative and should be interpreted with caution. The proposed mapping method (Equation (11)) can be adapted for other soil types if similar depth-dependent and compositional factors are considered, but it requires validation through extensive field and laboratory testing for each specific soil type and region. Future research should focus on establishing generalized correlation models for a wider range of geotechnical materials.
4.6. Suggestions for Improving Laboratory Test Reliability
To enhance the reliability of laboratory tests in representing the in situ shear strength of soil, several measures can be taken. First, using undisturbed samples as much as possible can preserve the natural structure and stress history of the soil. Second, simulating the in-situ stress conditions during laboratory testing, such as by applying confining pressures that match the field conditions, can improve the representativeness. Third, considering the effects of temperature and moisture cycles that occur in the field can help in better replicating the actual behavior. Additionally, employing advanced testing techniques, such as cyclic shear tests or tests that account for time-dependent behavior, may also provide more accurate results. Future research should focus on developing standardized protocols that incorporate these factors to minimize the discrepancies between field and laboratory tests.
5. Conclusions
- This paper focuses on the soil and rock layers at shallow depths in the arid–hot valley region in southwestern China. A comparative study of field shear tests and laboratory direct shear tests is conducted, exploring the mechanisms behind the differences between the two. A mapping relationship between the field and laboratory direct shear strength indicators at different depths is established, and a method for effectively correlating the results from field and laboratory direct shear strength tests is proposed. This provides a solution for accurately assessing the strength of soil and rock masses in the region using laboratory direct shear tests.
- Overall, the cohesion and friction angle of the soil and rock mass increase linearly with depth. Field shear strength values at the overlapping depth range of field and laboratory tests are significantly higher than those obtained from laboratory tests. As depth increases, the field test cohesion initially decreases and then increases, while the internal friction angle first increases and then decreases. Laboratory test cohesion shows an increasing trend with depth, and both field test cohesion and internal friction angle exhibit a general increase. The laboratory tests can, to some extent, reflect the basic mechanical properties of the soil and rock mass. The relationship between the field and laboratory direct shear strength indicators at the overlapping depths can be approximated by a quadratic function, with R2 ≥ 0.97 and MRE ≤ 3.2%, ensuring the accuracy of the correlation.
- By clarifying the mathematical relationship between the field and laboratory direct shear strength indicators at different depths, this paper provides a quantitative basis and reference for accurately evaluating the mechanical properties of the soil and rock mass in environments similar to the arid–hot valley region. The findings provide valuable insights for optimizing engineering designs, improving construction plans, and enhancing test methods for similar environments.
Author Contributions
Q.Z.: Data curation, Formal analysis, Funding acquisition, Investigation, Project administration, Writing—original draft, Writing—review & editing. Z.L. (Zhibin Li): Formal analysis, Investigation, Methodology, Writing—original draft. J.L.: Formal analysis, Investigation, Methodology, Writing—review & editing. H.K.: Data curation, Funding acquisition, Project administration, Writing—review & editing. X.H.: Funding acquisition, Project administration, Methodology, Writing—review & editing. X.L.: Funding acquisition, Project administration, Methodology, Writing—review & editing. S.W.: Funding acquisition, Project administration, Methodology, Writing—review & editing. Z.L. (Zhen Liu): Funding acquisition, Writing—review & editing. C.Z.: Funding acquisition, Writing—review & editing. All authors have read and agreed to the published version of the manuscript.
Funding
The work presented in this article was supported by Science and Technology Innovation Project of China Southern Power Grid Co., Ltd. (Grant No. CGYKJXM20220236) and the National Natural Science Foundation of China (NSFC) (Grant No. 42277131, 42293354, 42293351, 42293355, 42293350).
Institutional Review Board Statement
Not applicable.
Informed Consent Statement
Not applicable.
Data Availability Statement
The raw data supporting the conclusions of this article will be made available by the authors on request.
Conflicts of Interest
Authors Qinghe Zeng, Xionghui Huang and Shoukui Wang were employed by China Southern Power Grid Ehv Power Transmission Company. Authors Hong Ke and Xiangqing Li were employed by China Energy Engineering Group Yunnan Electric Power Design Institute Co., Ltd. The remaining authors declare that the research was conducted in the absence of any commercial or financial relationships that could be construed as a potential conflict of interest.
References
- Chen, J.W.; Qin, Y.; Hu, F.D.; Xu, N.X.; Guo, Y.X.; Qin, J.Y.; Ren, G.M. Microstructural Evolution and Mechanical Properties of Fly-Ash-Based Grouting Materials in Different Aqueous Environments. Water 2025, 17, 1407. [Google Scholar] [CrossRef]
- Zhang, Y.; Lu, J.Y.; Han, W.; Xiong, Y.W.; Qian, J.S. Effects of Moisture and Stone Content on the Shear Strength Characteristics of Soil-Rock Mixture. Materials 2023, 16, 567. [Google Scholar] [CrossRef] [PubMed]
- Lv, X.F.; Zhou, H.Y. Soil-rock mixture shear strength measurement based on in situ borehole pressure-shear tests. J. Geophys. Eng. 2018, 15, 2221–2234. [Google Scholar] [CrossRef]
- Merchan-Breuer, D.A.; Murphy, E.; Berka, B.; Nova, L.C.M.; Liu, Y.; Merchan-Merchan, W. Synthesis of Carbonaceous Hydrophobic Layers through a Flame Deposition Process. Appl. Sci. 2022, 12, 2427. [Google Scholar] [CrossRef]
- Huang, B.F.; Qiu, M.; Lin, J.S.; Chen, J.L.; Jiang, F.S.; Wang, M.K.; Ge, H.L.; Huang, Y.H. Correlation between shear strength and soil physicochemical properties of different weathering profiles of the non-eroded and collapsing gully soils in southern China. J. Soils Sediments 2019, 19, 3832–3846. [Google Scholar] [CrossRef]
- Sharma, L.K.; Umrao, R.K.; Singh, R.; Ahmad, M.; Singh, T.N. Geotechnical Characterization of Road Cut Hill Slope Forming Unconsolidated Geo-materials: A Case Study. Geotech. Geolog. Eng. 2017, 35, 503–515. [Google Scholar] [CrossRef]
- Yuan, K.; Song, Y.; Fu, G.; Lin, B.; Fu, K.; Wang, Z. Spatial Distribution and Main Controlling Factors of Nitrogen in the Soils and Sediments of a Coastal Lagoon Area (Shameineihai, Hainan). Appl. Sci. 2023, 13, 7409. [Google Scholar] [CrossRef]
- Huang, X.X.; Zeng, Y.J.; Lu, S.; Lu, G.P.; Ou, H.; Wang, B.B. Formation and Evolution Mechanisms of Geothermal Waters Influenced by Fault Zones and Ancient Lithology in the Yunkai Uplift, Southern China. Water 2025, 17, 1885. [Google Scholar] [CrossRef]
- Greco, V.R. Variability and Correlation of Strength Parameters Inferred from Direct Shear Tests. Geotech. Geolog. Eng. 2016, 34, 585–603. [Google Scholar] [CrossRef]
- Goh, S.G.; Rahardjo, H.; Leong, E.C. Shear Strength Equations for Unsaturated Soil under Drying and Wetting. J. Geotech. Geoenvironm. Eng. 2010, 136, 594–606. [Google Scholar] [CrossRef]
- Viana da Fonseca, A.; Rios Silva, S.; Cruz, N. Geotechnical Characterization by In situ and Lab Tests to the Back-Analysis of a Supported Excavation in Metro do Porto. Geotech. Geolog. Eng. 2010, 28, 251–264. [Google Scholar] [CrossRef]
- Punetha, P.; Mohanty, P.; Samanta, M. Microstructural investigation on mechanical behavior of soil-geosynthetic interface in direct shear test. Geotext. Geomembr. 2017, 45, 197–210. [Google Scholar] [CrossRef]
- Waghmare, K.D.; Tripathi, K.K. Development of a Field Torsional Direct Shear Test Apparatus. Geotech. Geolog. Eng. 2024, 42, 479–500. [Google Scholar] [CrossRef]
- Hou, Z.K.; Gutierrez, M.; Wang, A.M.; Almrabat, A.; Yang, C.H. Mechanical properties and brittleness of shale with different degrees of fracturing-fluid saturation. Curr. Sci. 2018, 115, 1163–1173. [Google Scholar] [CrossRef]
- Morgenstern, N.R. Anchoring in Rock and Soil. Earth-Sci. Rev. 1984, 21, 302–303. [Google Scholar] [CrossRef]
- GB 50021-2001; Code for Geotechnical Engineering Investigation. China Architecture & Building Press: Beijing, China, 2009.
- YS 5221-2000; Field Direct Shear Test Procedure. China Planning Press: Beijing, China, 2001.
- Wang, C.; Yang, W.M.; Zhang, N.; Wang, S.W.; Ma, C.Y.; Wang, M.X.; Zhang, Z.Y. Effect of Moisture Content and Wet-Dry Cycles on the Strength Properties of Unsaturated Clayey Sand. Buildings 2024, 14, 1375. [Google Scholar] [CrossRef]
- Lian, B.Q.; Peng, J.B.; Wang, X.G.; Huang, Q.B. Moisture content effect on the ring shear characteristics of slip zone loess at high shearing rates. Bull. Eng. Geol. Environ. 2020, 79, 999–1008. [Google Scholar] [CrossRef]
- Feng, X.L.; Li, S.; Yang, C.Y.; Li, Z.R.; Lin, H.; Wang, Z.Y. Macro-Micro Failure Characteristics of Soft-Hard Composite Rock with Unparallel Joints: Analysis Based on DIC and AE Technique. Appl. Sci. 2024, 14, 11706. [Google Scholar] [CrossRef]
Disclaimer/Publisher’s Note: The statements, opinions and data contained in all publications are solely those of the individual author(s) and contributor(s) and not of MDPI and/or the editor(s). MDPI and/or the editor(s) disclaim responsibility for any injury to people or property resulting from any ideas, methods, instructions or products referred to in the content. |
© 2025 by the authors. Licensee MDPI, Basel, Switzerland. This article is an open access article distributed under the terms and conditions of the Creative Commons Attribution (CC BY) license (https://creativecommons.org/licenses/by/4.0/).