Article

Study on Breakdown Characteristics of On-Train High-Voltage Combined Electrical Apparatus Under Lightning Transient Conditions

1
School of Electrical Engineering, Beijing Jiaotong University, Haidian District, Beijing 100044, China
2
China Academy of Railway Sciences, Haidian District, Beijing 100044, China
*
Author to whom correspondence should be addressed.
Appl. Sci. 2025, 15(22), 12238; https://doi.org/10.3390/app152212238
Submission received: 12 October 2025 / Revised: 14 November 2025 / Accepted: 15 November 2025 / Published: 18 November 2025

Abstract

The high-voltage system of high-speed trains is now in the form of combined electrical apparatus, which has a high probability of insulation breakdown due to frequent overvoltage during operation. To solve this issue, an electric field simulation model of the high-voltage combined electrical system was established, the electric field distribution of the high-voltage box electrode under overvoltage operating conditions was analyzed, and the air breakdown characteristics under field action were studied. The study shows that under overvoltage conditions, the electric field intensity near the small electrodes of the combined electrical unit is higher than the air breakdown field intensity, and the statistical time delay is approximately 5.94 μs when 150 kV voltage is applied. When the size of the connected electrode is doubled and 150 kV voltage is applied, the statistical delay is about 7.20 μs and the probability of discharge is reduced. Further installation of an insulating partition between the circuit breaker and the ground switch completely solved the problem of low electrical gap insulation capacity. Combined with impulse withstand tests, the effectiveness of the electrode size design was verified, and the research results provided theoretical support for the miniaturization and high-reliability design of vehicle-mounted high-voltage electrical appliances.

1. Introduction

High-voltage combined electrical apparatus is widely used in high-speed trains, avoiding the influence of the external environment on insulation. In the design and production of high-voltage combined electrical apparatus, the high-voltage components still take into account the distributed structure, with small electrode sizes. During the operation of high-speed trains, several kinds of overvoltage are frequently generated, including high-order harmonic overvoltage, operation overvoltage, pantograph–catenary offline overvoltage, and low-frequency oscillation overvoltage in the neutral zone [1]. Under the overvoltage effect, the high-voltage combined electrical apparatus of high-speed trains frequently experiences insulation breakdown faults, affecting the safe and stable operation of electrified railways [2,3,4].
As shown in Figure 1, accidents may occur during the operation of high-voltage switchgear. Extensive and in-depth research has been carried out around the word on insulation breakdown and insulation failure of high-voltage composite electrical appliances, covering electric field analysis, discharge, electrical theory, test technology, particle defects, etc. [5]. In terms of field analysis, Peng Zongren of Xi’an Jiaotong University and others calculated the electric field distribution of the traction transformer bushing by using the finite element method in combination with the design scheme and installation environment and analyzed the electric field distribution law and the impact of various defects on the electric field distribution during manufacturing and operation [6].
Wu Guangning of Southwest Jiaotong University analyzed the breakdown characteristics and partial discharge characteristics of an oil–paper interface under different hydraulic pressures and explored the mechanism of reducing the partial discharge damage of oil-impregnated paperboard by hydraulic pressure using the characteristic parameters of partial discharge and experimental phenomena. For the study of gap discharge characteristics, Liu Xiaopeng et al. studied the evolution process of 30–50 cm air gap breakdown, analyzed the gas movement and electrical thermal characteristics of the discharge channel after air gap breakdown, obtained the ratio range of the development path of the discharge channel to the vertical distance of the gap, and revealed the positive correlation between the recovery time of the arc channel and the energy injected into the discharge channel [7,8]. Lu Fangcheng et al. carried out research on the discharge of ball–plate electrode and needle–ball electrode gaps with burrs at different distances under positive operating impulse voltage, analyzed the spatial electric field distribution and streamer initiation and ionization during the discharge initiation and gap breakdown, explored the electric field change law at the time of corona initiation and gap breakdown, revealed the relationship between the instantaneous power and spatial electric field jump of an electrode gap streamer and the gap voltage and surface defects, and concluded that the burr defect will shorten the discharge initiation delay and reduce the discharge voltage of the electrode gap [9,10,11]. Shen Jingyu [12] and others carried out a study on the impact of lightning impulse voltage polarity on the breakdown characteristics of a series double gap for a ball–plate electrode gap. Through experimental testing and electric field simulation, they revealed the breakdown mechanism of the series double gap under the action of different polarities and the impact of related characteristics. Huang Yubin et al. [13] studied the pilot discharge of a positive long air gap, analyzed the process of the pilot channel radius expansion, and obtained the relationship between the reduced electric field and the gas temperature in the pilot channel. Cheng Chen et al. [14] carried out a quantitative schlieren observation experiment of positive pilot discharge in a rod–plate gap, analyzed the temporal evolution law of the axis temperature of the unstable pilot channel, and revealed the mechanism of the influence of the temperature distribution of the unstable pilot channel on the initiation of the leader. Hu Jinyang et al. [5] built a streamer discharge initiation model combining the air pressure, electrode curvature, and voltage rise rate, which can calculate the initial field strength and time delay and obtain the time delay distribution characteristics under low air pressure through experiments. Ma Xudong et al. tested the discharge characteristics of interphase and phase-to-ground gaps by the lifting method and obtained the fitting formula of the switching impulse discharge voltage U50 and its distance to the gap. The gap type affects the growth rate of the discharge curve. Increasing the radius of curvature of the grading ball can improve the tolerance. The difference in electrode positions leads to different discharge characteristics, which provides a basis for the insulation design of the valve hall [15]. The above research has guided the design, manufacturing, operation, and maintenance methods of gas-insulated metal-enclosed equipment. The electrified railway system has frequent overvoltage, large electrode size differences, and poor electrical system matching. The above research conclusions have limitations when used for the insulation fault analysis and system optimization of high-speed EMUs. The existing theoretical framework for investigating the causes of accidents in high-voltage combined electrical apparatus on railways remains insufficient. Clarifying the causes of discharges in high-voltage combined electrical apparatus necessitates urgent research into the electric field strengths associated with partial discharges and even breakdowns. This paper focuses on simulating key discharge zones during accidents. Experimental verification confirms that altering the electrode dimensions can prolong the statistical delay, thereby suppressing the progression of the discharge process.
In this paper, the insulation failure of a high-speed EMU high-voltage system under frequent overvoltage conditions is studied, and an electric field simulation model of the high-voltage combined electrical apparatus system is established. The electric field distribution of the high-voltage box electrode under switching overvoltage conditions is analyzed, and the air breakdown characteristics under field action are studied. The electrode design conditions of high-speed EMUs are obtained, which provides theoretical support for the miniaturization and high-reliability design of vehicle-mounted high-voltage apparatus.

2. Internal Discharge Model of the Combined Electrical Apparatus

2.1. Analysis of the Development Process of Medium and Long Gap Discharges

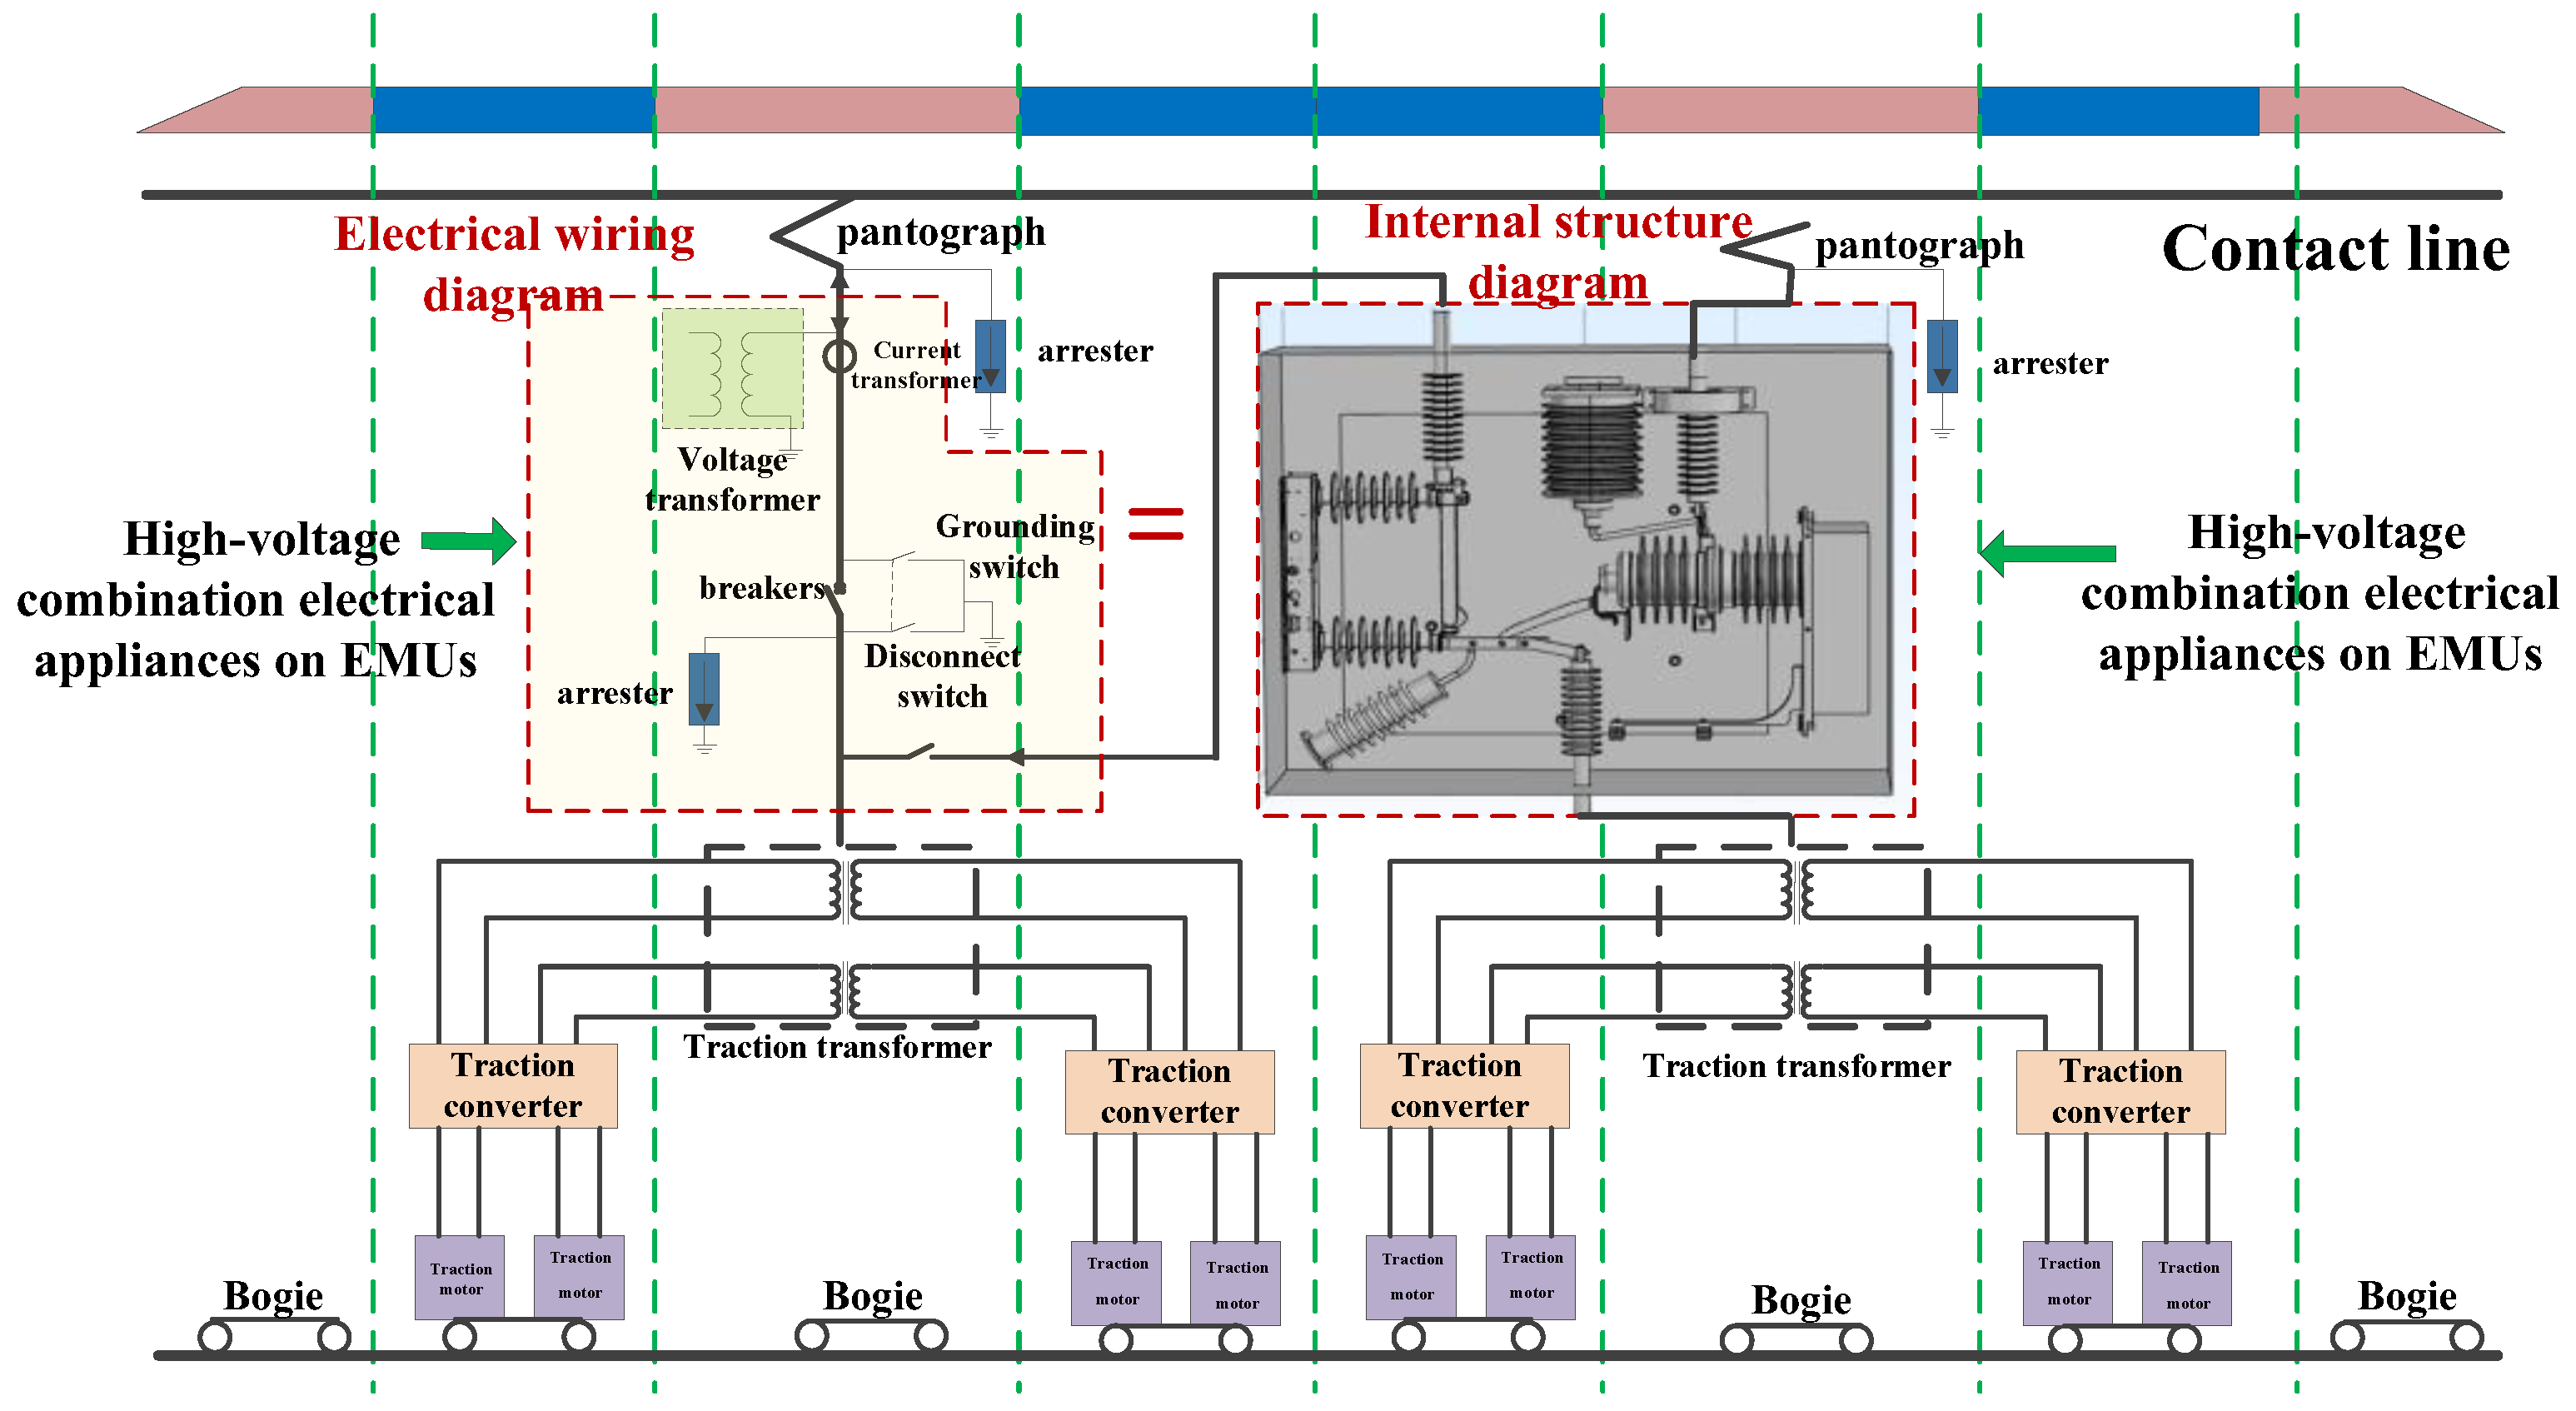
High-speed EMUs take power from the pantograph and transmit it to the transformer through high-voltage combined electrical apparatus, which includes circuit breakers, disconnectors, grounding switches, lightning arresters, voltage transformers, etc. High-speed EMUs adopt a high-voltage electrical combination structure, integrating the high-voltage equipment in the high-voltage box (hereinafter referred to as the “high-voltage box”), as shown in Figure 2. The minimum size of the electrodes in the high-voltage box is a rounded radius of 2 mm, and the electrodes are 15 cm away from the grounding housing. Under the condition of frequent overvoltage in the system, the electrodes will discharge. The discharge delay and statistical delay analysis are highly dispersed, and there are both Thomson discharge and flow column discharge phenomena, which are typical medium and long gap discharges [16,17,18].
When overvoltage occurs in the system, the electric field on the electrode surface increases, and field-induced emissions occur at the small electrode terminals, providing initial electrons for subsequent discharges. So, the high-voltage electrode discharge process of the medium and long gap on the AIS can be divided into three stages [19]. When the applied voltage rises to a certain value, the field strength on the surface of the small-size electrode reaches the value of electron escape or gas ionization. The electron ejection field strength can be expressed as follows:
E e s = V β r
In the formula, Ees is the electron escape intensity, kV/cm; V is the applied voltage, kV; r is the radius of curvature of the electrode, cm; and β is the field enhancement factor.
When the electron escape field strength is lower than the gas breakdown field strength compared to the air breakdown field strength, the electron collides with the ground electrode to induce secondary ionization and trigger discharge.
γ ( e α d 1 ) 1
In the formula, γ is the secondary ionization coefficient, indicating the number of secondary electrons released when a single positive ion strikes the cathode; d is the electrode spacing, cm; and α is the ionization coefficient, cm−1, which characterizes the number of electron collision ionizations per unit length and is related to the electric field intensity E and pressure p, usually satisfying the Townsend equation [20]:
α = A p e B p / E
In the formula, A and B are gas characteristic constants.
When the breakdown field strength of the air is lower than the escape field strength of the electrons, the air on the electrode surface ionizes and generates electron collapse, causing the flow column to develop into a through channel.
When the applied voltage is further increased, there is a statistical delay, which is key to the formation of the discharge. For medium and long gaps, the discharge delay can be expressed as follows:
t d = k l v
In the formula, k is the time coefficient; l is the shortest distance between the electrode and the ground, cm; and v is the rate of electron collapse, m/s.
Discharge occurs when the duration of overvoltage is longer than the sum of the formation time of the breakdown field strength or the electron escape field strength and the discharge delay.

2.2. Discharge Control Equations for High-Voltage Combined Electrical Systems

To obtain the breakdown time of high-voltage combined electrical apparatus under overvoltage conditions, a model was established to analyze the electric field distribution characteristics of the high-voltage box under lightning impulse conditions. Since the entire discharge process has good axial symmetry, this paper establishes a two-dimensional axial symmetry model to reduce computational complexity and analyze the discharge development process.
The modeling of the discharge process of high-voltage combined electrical apparatus requires the combination of gas dynamics and plasma physics, mainly including the following equations:
n i t + ( n i v i ) = S i
In the equation, ni is the particle density, g/cm3; vi is velocity, m/s; and Si is the number of particles produced or removed by the collision reaction.
The equation of conservation of momentum for the motion of charged particles under the action of electric field force and collisions is given as follows:
m i n i ( v i t + v i v i ) = q i n i E p i + j m i n i v i j ( v j v i )
where mi is the mass of the particle, g; qi is the charge, C; E is the electric field intensity, kV/cm; pi is pressure, Pa; and vij is the frequency of collisions.
The energy variation in the charged particles is characterized using the energy conservation equation, including joule heating and collision loss:
t ( 3 2 n i k B T i ) + ( 5 2 n i k B T i v i ) = q i n i v i E j ε i j v i j n i
In the formula, kB is the Boltzmann constant; Ti is the temperature of the particle, K; and εij represents collision energy loss, J.
The spatial electric field distribution is determined by the charge density:
E = ρ ε 0
In the formula, ρ is the total charge density, C/m3, and ε0 is the vacuum dielectric constant.
The equation for the average electric field intensity in the domain is found:
E a v = i n E i x a v i n x i
In the formula, Eav is the average electric field intensity, kV/cm; n is the number of calculation points taken; xav is the unit length, cm; Ei is the electric field intensity at the i-th point, kV/cm; and xi is the distance from the i-th point to the ground switch, in cm.
The equation for calculating the coefficient of electric field non-uniformity is given below:
f = E max E a v
In the formula, f is the electric field non-uniformity coefficient; Emax is the maximum field strength in this area, kV/cm; and Eav is the average field strength in the area, kV/cm.
Combining Formulas (1) and (2), it can be shown that for galvanized electrodes, the electron escape field strength is lower than the air breakdown field strength. Electrons move between the two electrodes, causing secondary emission, resulting in electron collapse and gap breakdown, which still requires a certain statistical time delay.

3. Electric Field Characteristics of AIS Under Lightning Voltage Conditions

3.1. Electric Field Distribution Characteristics of AIS Under Overvoltage Conditions

The internal electric field structure of high-voltage combined electrical apparatus is complex. This paper focuses on studying the affected areas during accidents, simulating and analyzing the electric field and discharge conditions. A three-dimensional finite element model of the high-voltage combined electrical apparatus was constructed, encompassing but not limited to the input/output terminals, circuit breakers, voltage transformers, high-voltage disconnect switches, and surge arresters. During simulation modeling, it was discovered that the internal conditions of the switchgear are highly complex, with numerous areas not under direct observation. Consequently, the simulation model was simplified to a certain extent:
(1)
For the geometric model of high-voltage enclosures, minor details such as small protrusions or grooves typically do not significantly affect the overall electric field distribution. This includes structures like bolts, through-holes, and flanges. Therefore, these minor geometric features can be simplified or omitted, focusing instead on larger structural elements.
(2)
Circular chamfers in support insulators and vacuum circuit breaker insulator skirt sections may be simplified.
(3)
Boundary conditions may be appropriately simplified in certain cases. For instance, if regions of the high-voltage enclosure far from boundaries contribute minimally to the electric field, far-field boundary conditions can be set to fixed potential or free space.
(4)
Environmental factors like temperature and humidity typically exert a minor influence on the electric field distribution. Under standard environmental conditions, these factors are not considered in detail within the simulation model.
In simulation calculations, the relative permittivity of each material component must be set. The material parameters are shown in Table 1. The grid partitioning uses the “Conventional” partitioning method.
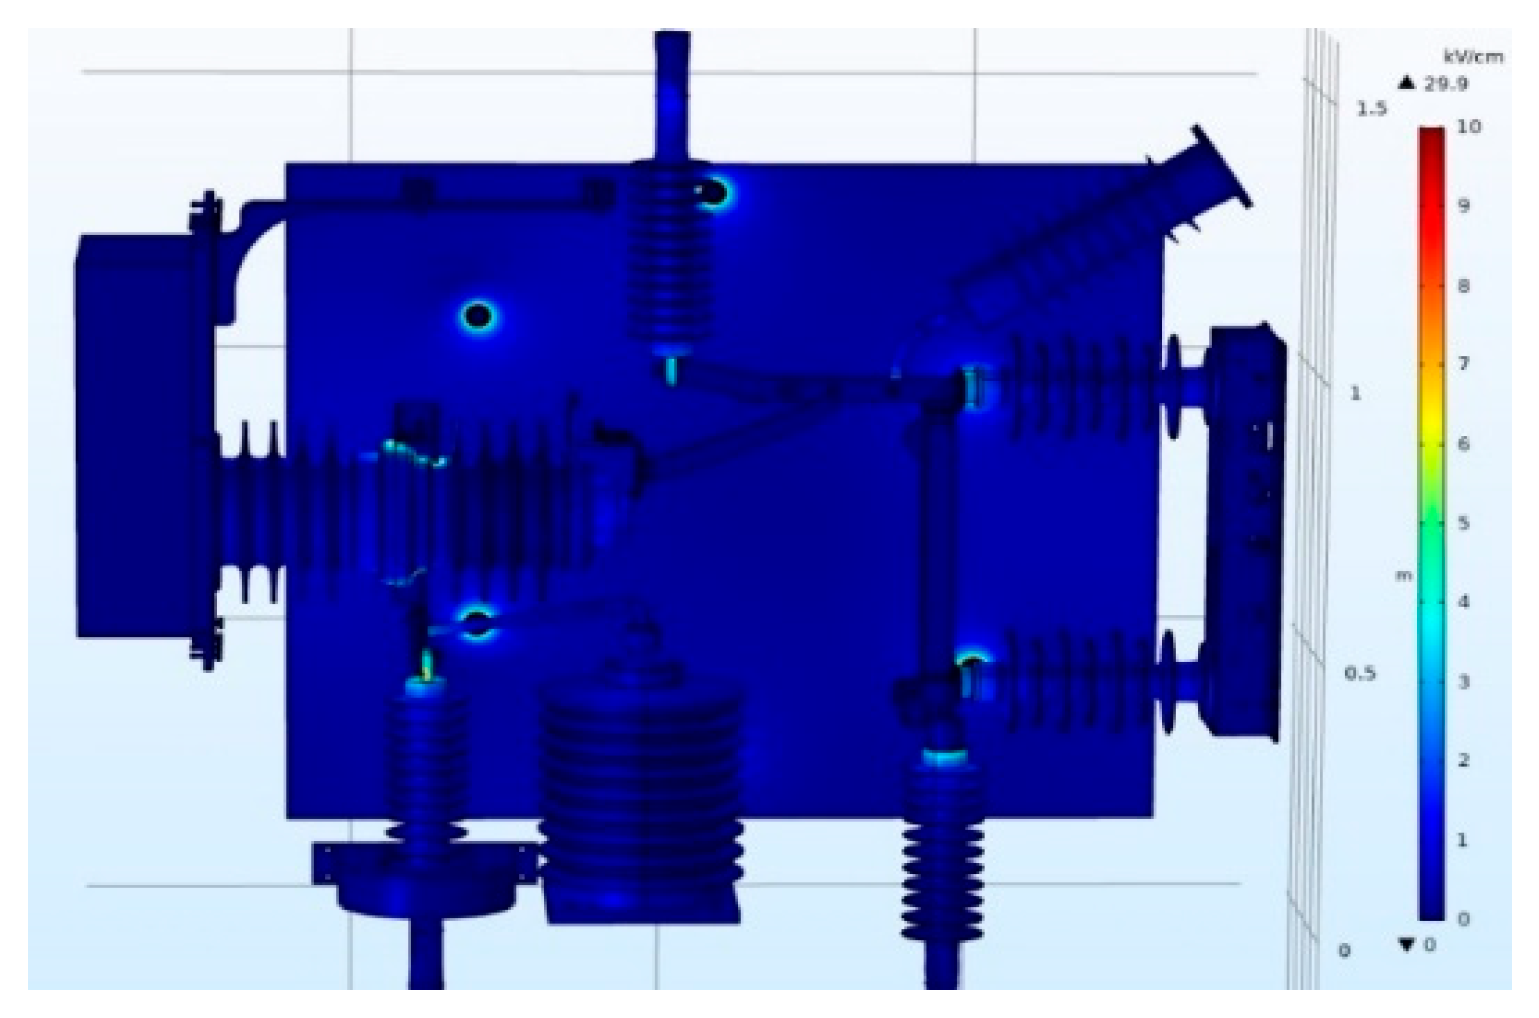
The cloud map of the electric field distribution inside the high-voltage electrical box under power frequency voltage was calculated based on the finite element model. As shown in Figure 3, the areas with the most concentrated electric field distribution inside the box are the edge and corner of the high-voltage fittings and busbar, the connection between the high-voltage fittings and the insulator umbrella skirt, the connection between the high-voltage fittings and the insulating housing of the circuit breaker, and the metal screw section, where the maximum electric field strength is 17.82 kV/cm, located at the connection between the high-voltage fittings of the main circuit breaker and the insulator umbrella skirt.
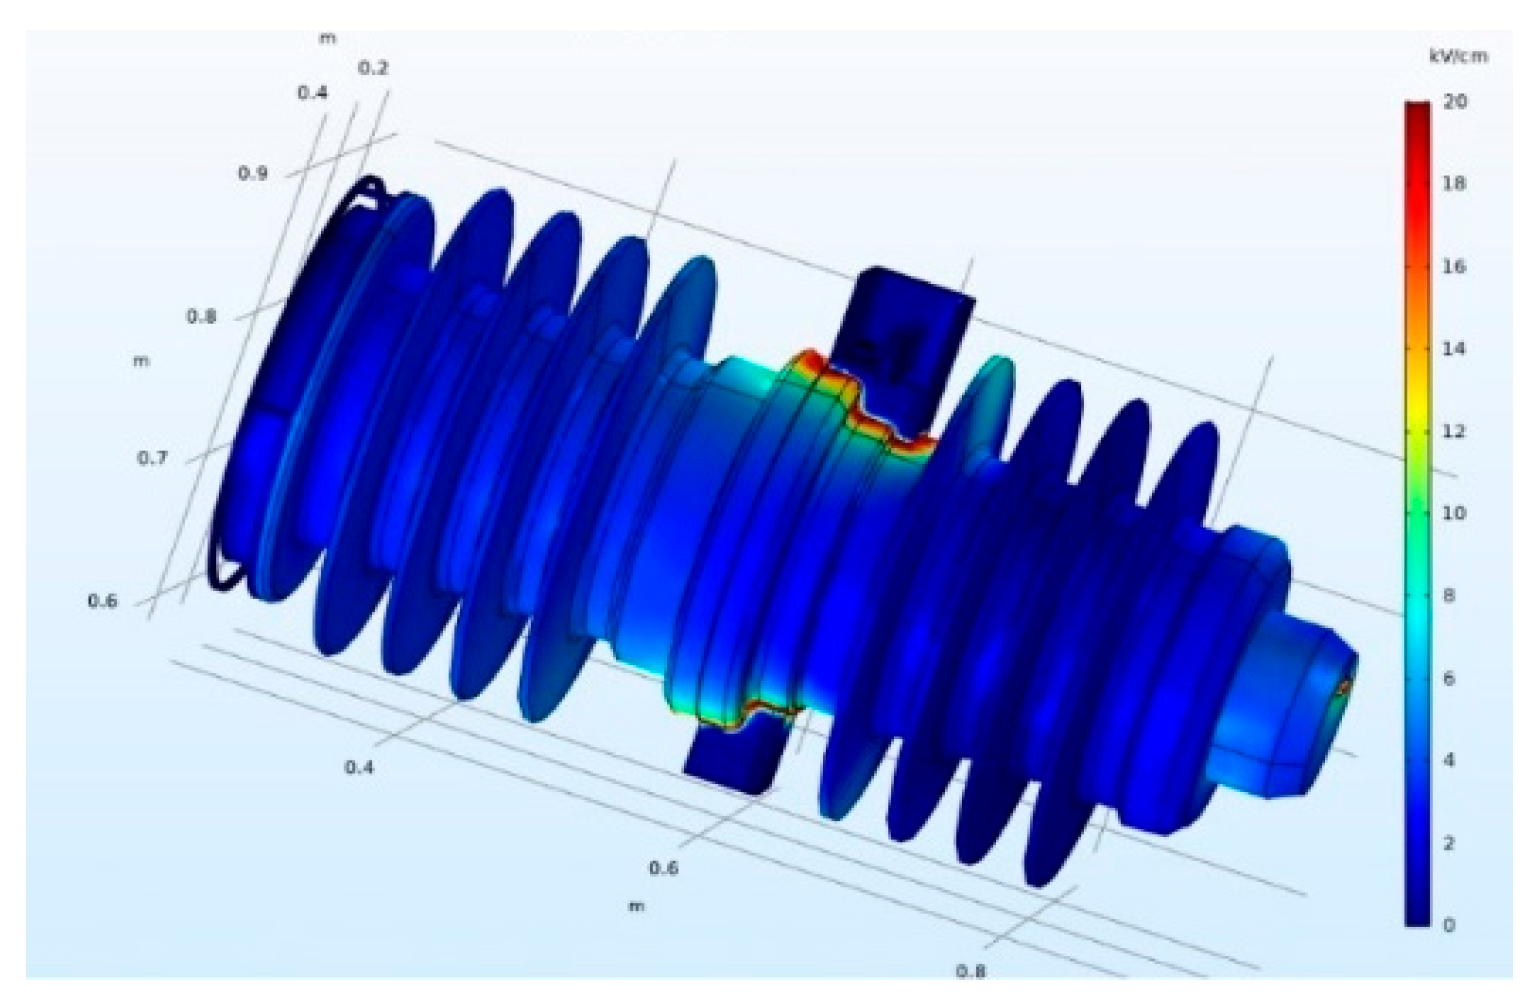
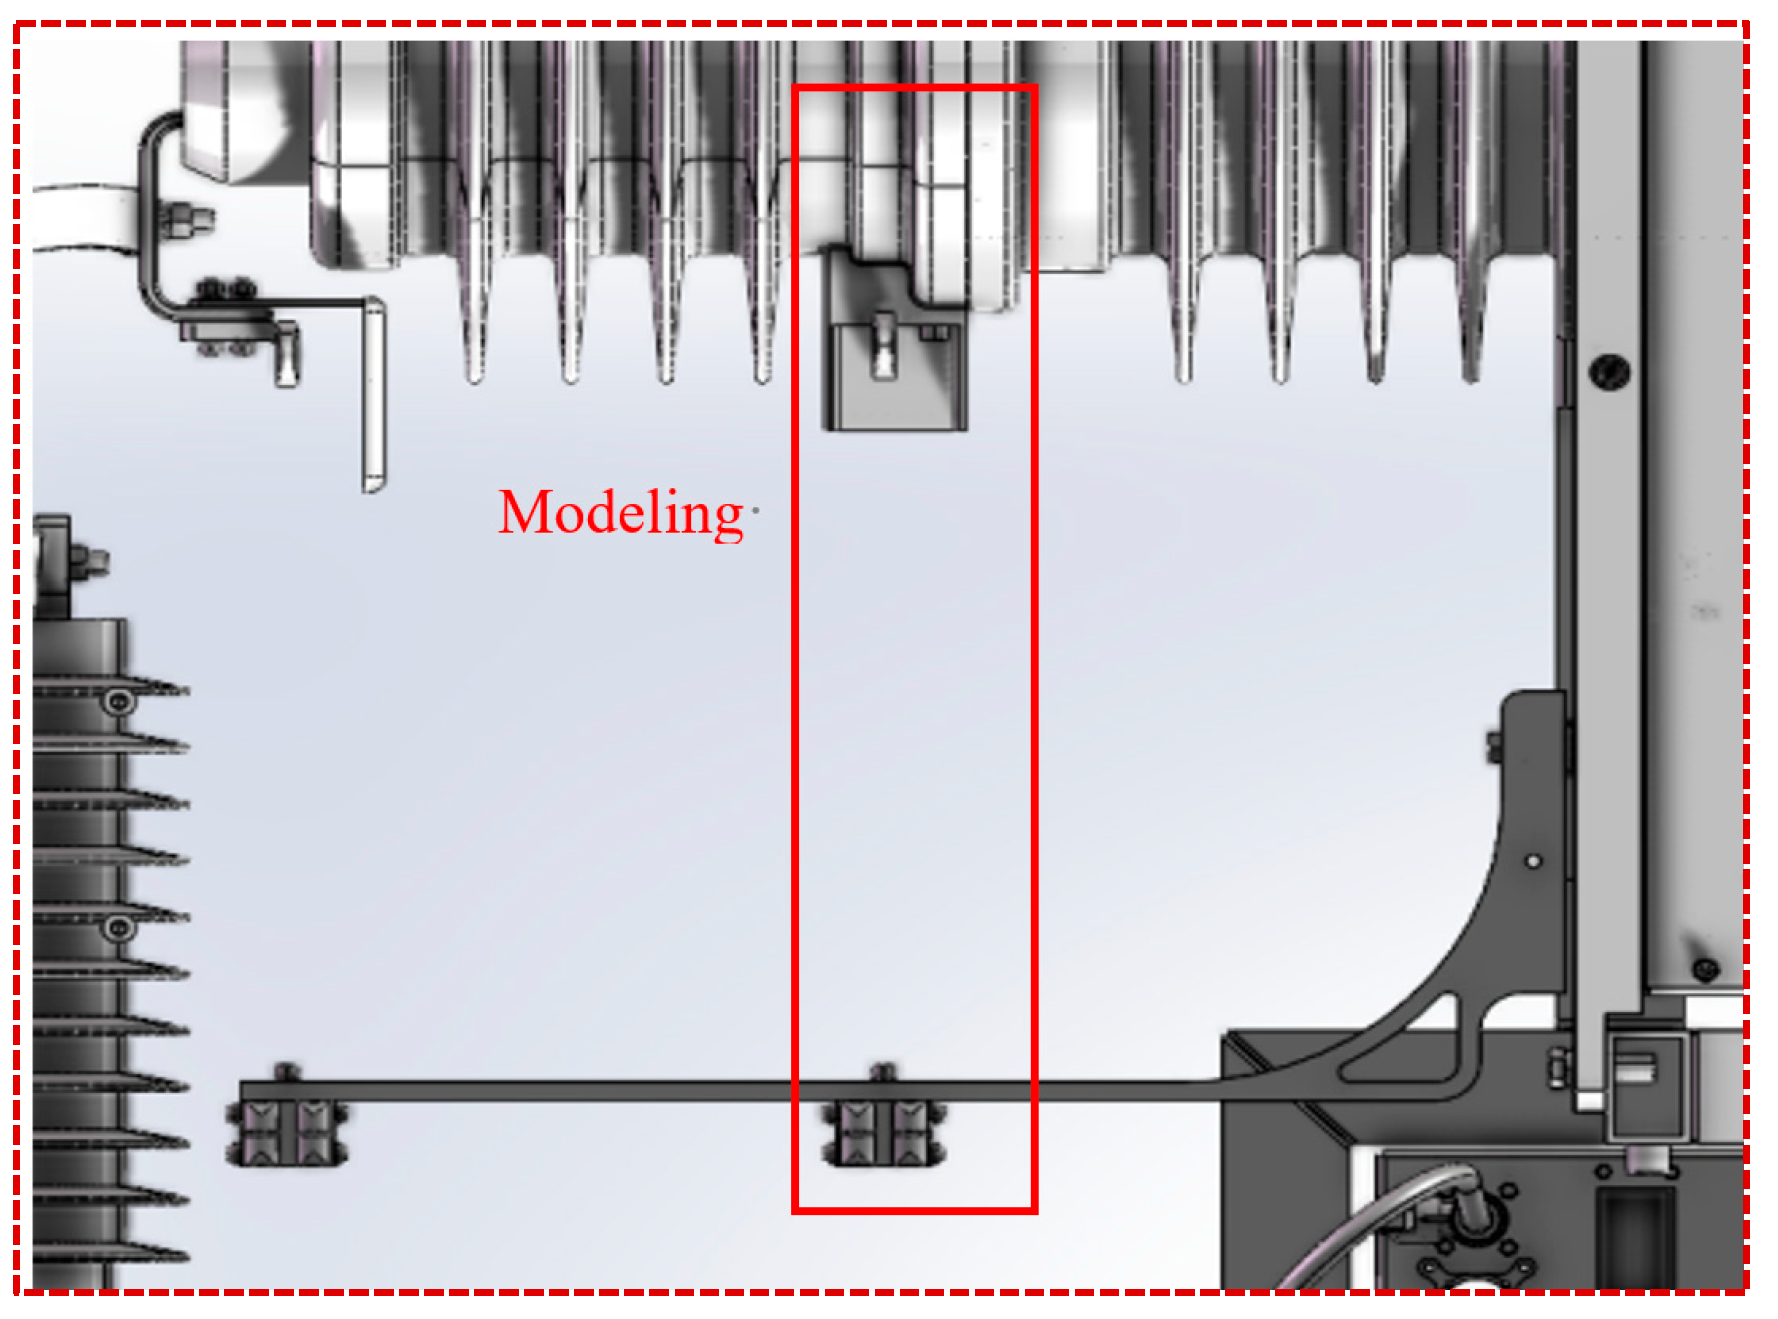
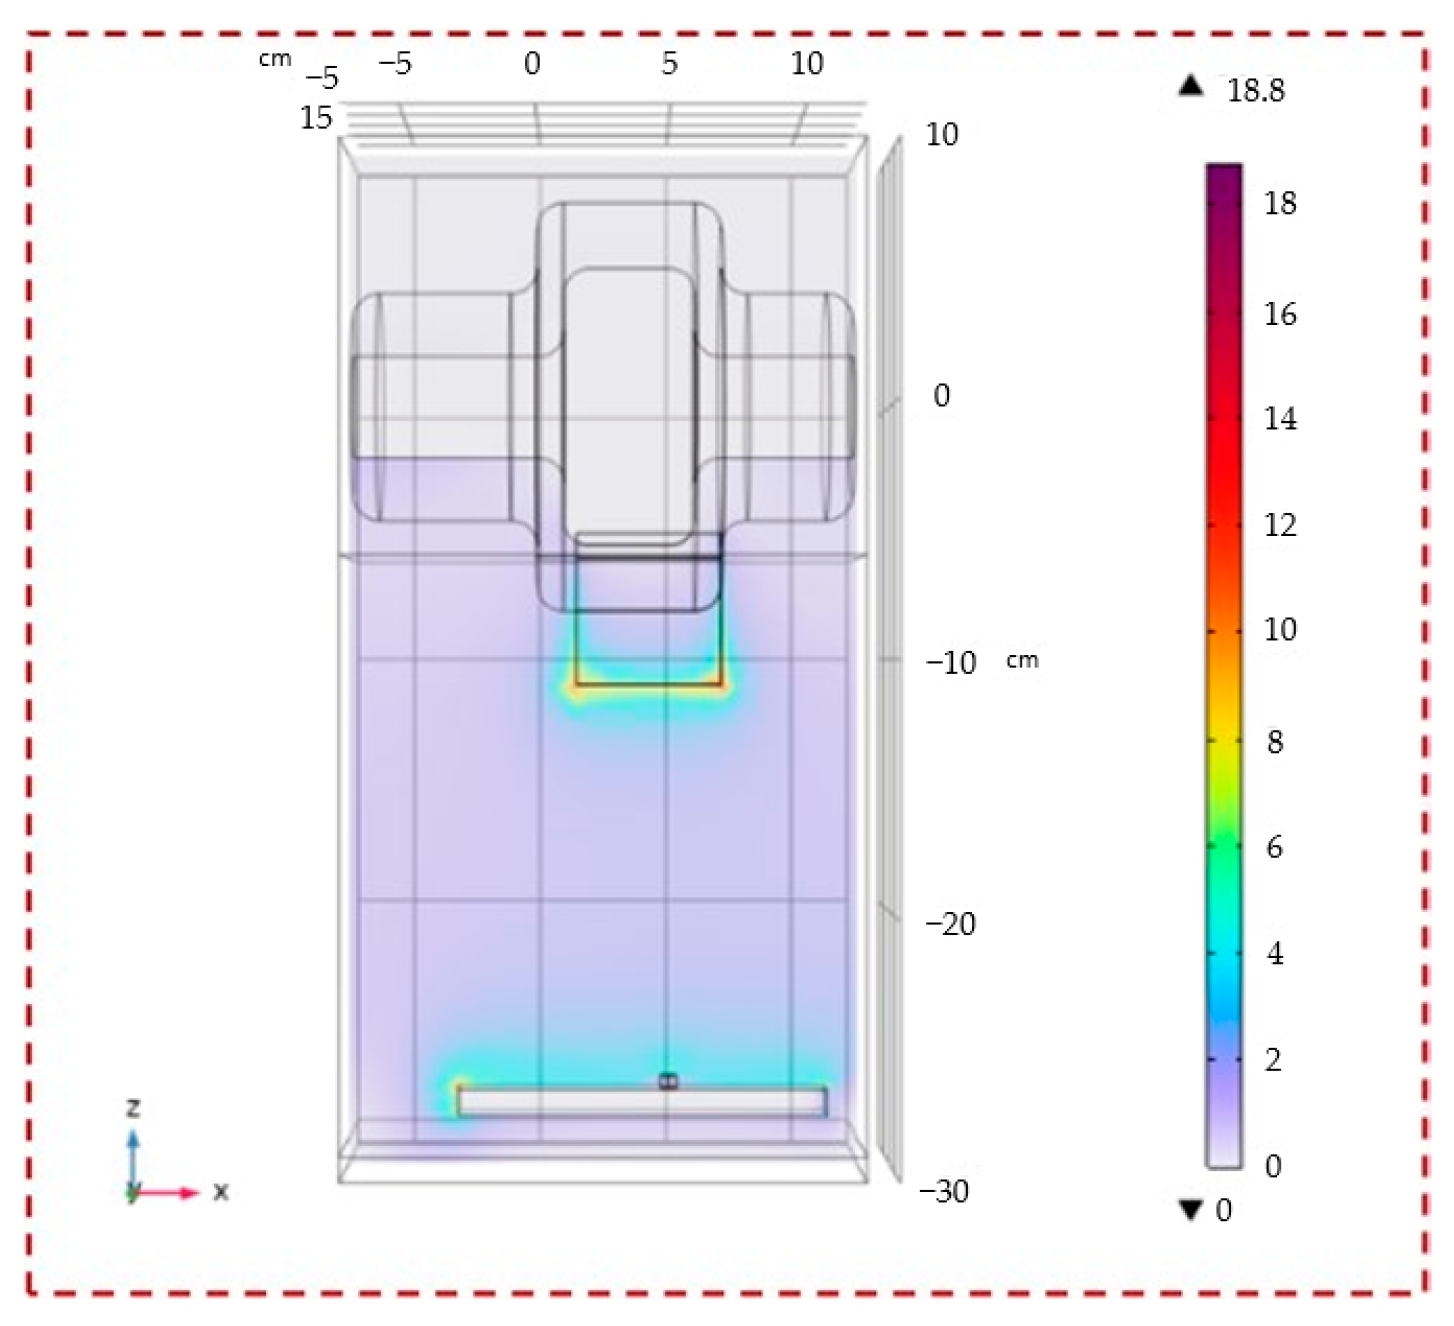
As shown in Figure 4, the area with the maximum field strength of the circuit breaker was modeled, the gap field strength from the main circuit breaker to the ground switch was simulated, and the distribution of the gap field strength directly below the main circuit breaker was obtained, as shown in Figure 5.
A domain probe was set in the gap below the main circuit breaker, resulting in a maximum field strength Emax of 18.8 kV/cm and an average field strength Eav of 1.63 kV/cm. The electric field non-uniformity coefficient was calculated as 11.53 by Formula (10).
When the rod–plate electrode gap length is 23 cm and the electric field non-uniformity coefficient is 11.53, the gap breakdown voltage is the product of the average breakdown field strength and the gap length, resulting in a theoretical breakdown voltage of 59.84 kV. That is, when the applied voltage reaches approximately 59.84 kV, effective electrons are generated as the electric field strength exceeds the actual breakdown threshold, and gap breakdown will be triggered when the statistical delay is long enough.

3.2. Electric Field Increase Process Under Overvoltage Conditions

During normal operation of the locomotive, the high-voltage box is subjected to 27.5 kV power frequency voltage. Under the influence of resonant overvoltage, it will be subjected to a voltage of approximately 65 kV. It will withstand lightning overvoltage of 150 to 180 kV when it is struck by lightning.
When the electrode is subjected to a voltage that is too high, the air near the electrode breaks down and forms plasma. At this point, the electrical size of the electrode increases, making it more likely to break down and cause a fault when subjected to overvoltage shock.
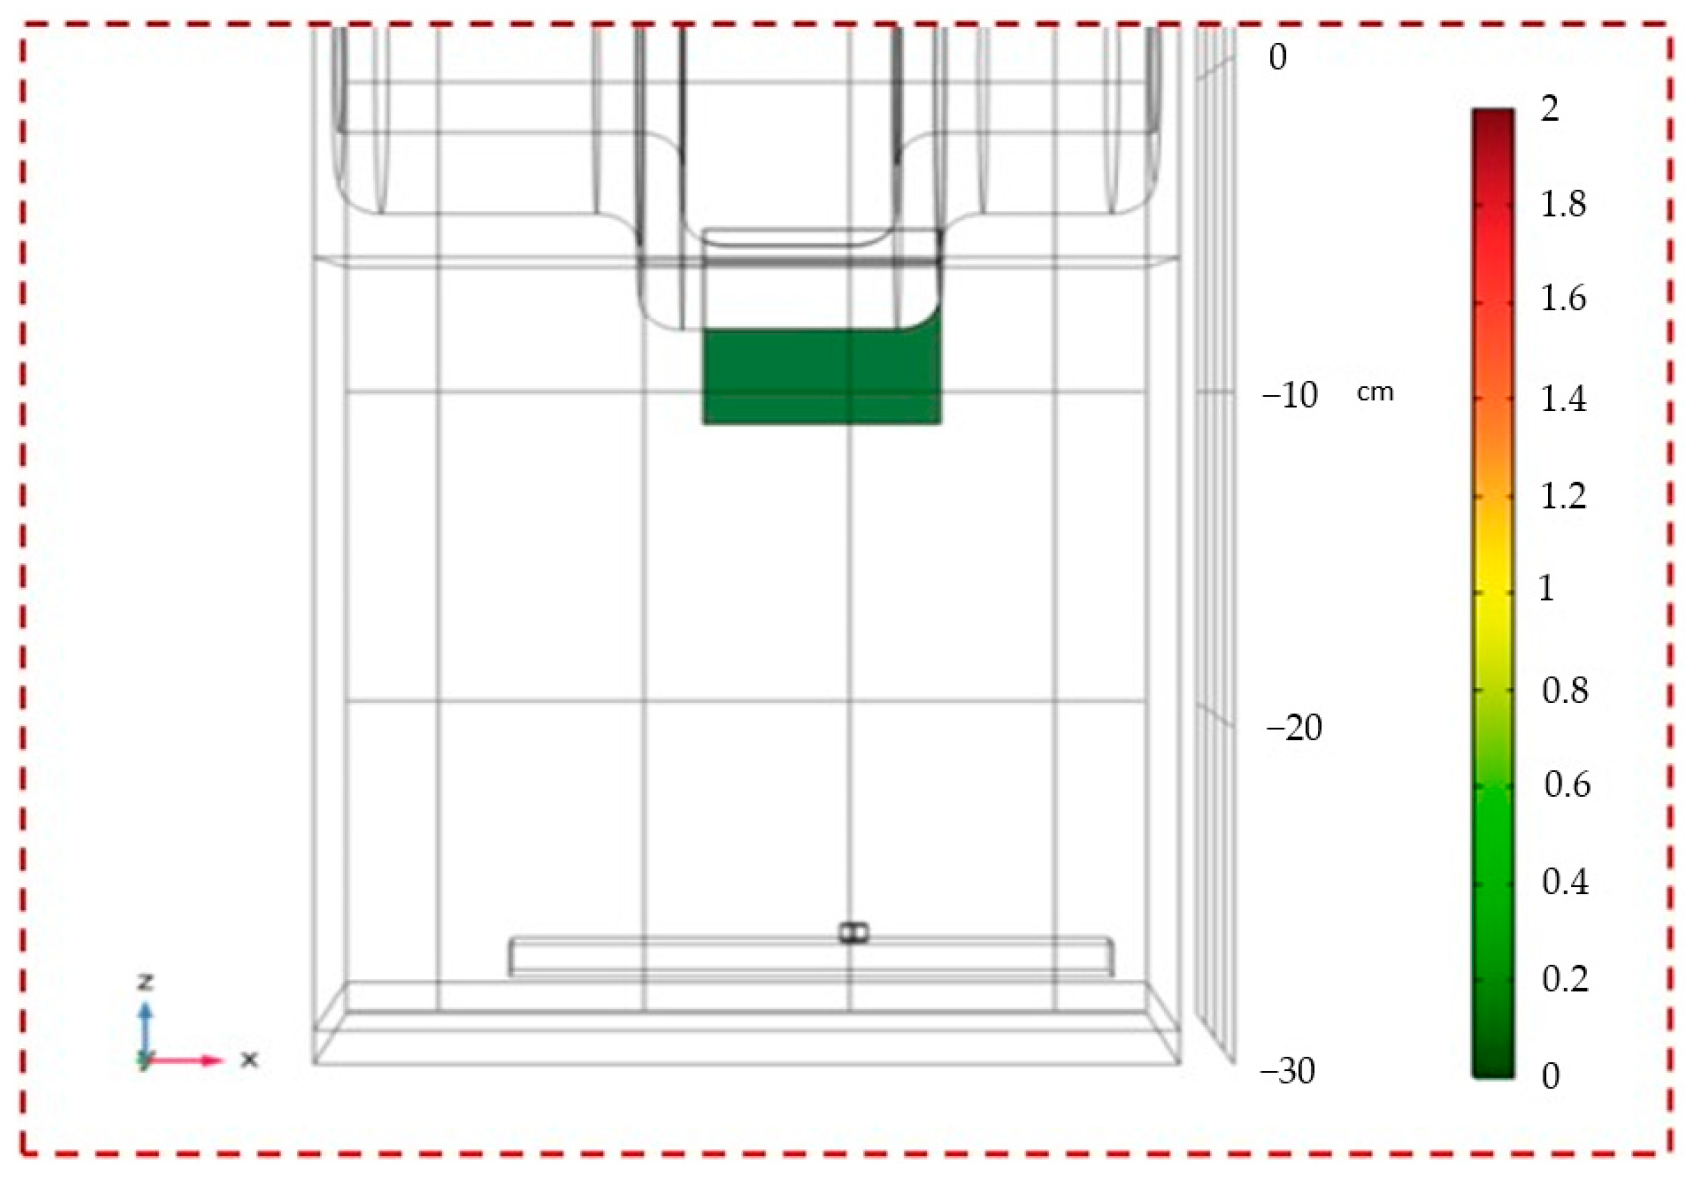
The breakdown of the air gap between the circuit breaker and the ground switch during normal operation is shown in Figure 6. When the gap is not broken down, the breakdown indicator is 0. When Townsend discharge occurs in the gap, the breakdown indicator is 1. When a flow discharge occurs in the gap, the breakdown indicator is 2. At power frequency voltage, the gap field strength is lower, the breakdown indicator is 0, the electrode electrical dimensions do not change, and there is no discharge in the gap. The distribution of the gap field strength under the influence of resonant overvoltage is shown in Figure 7.
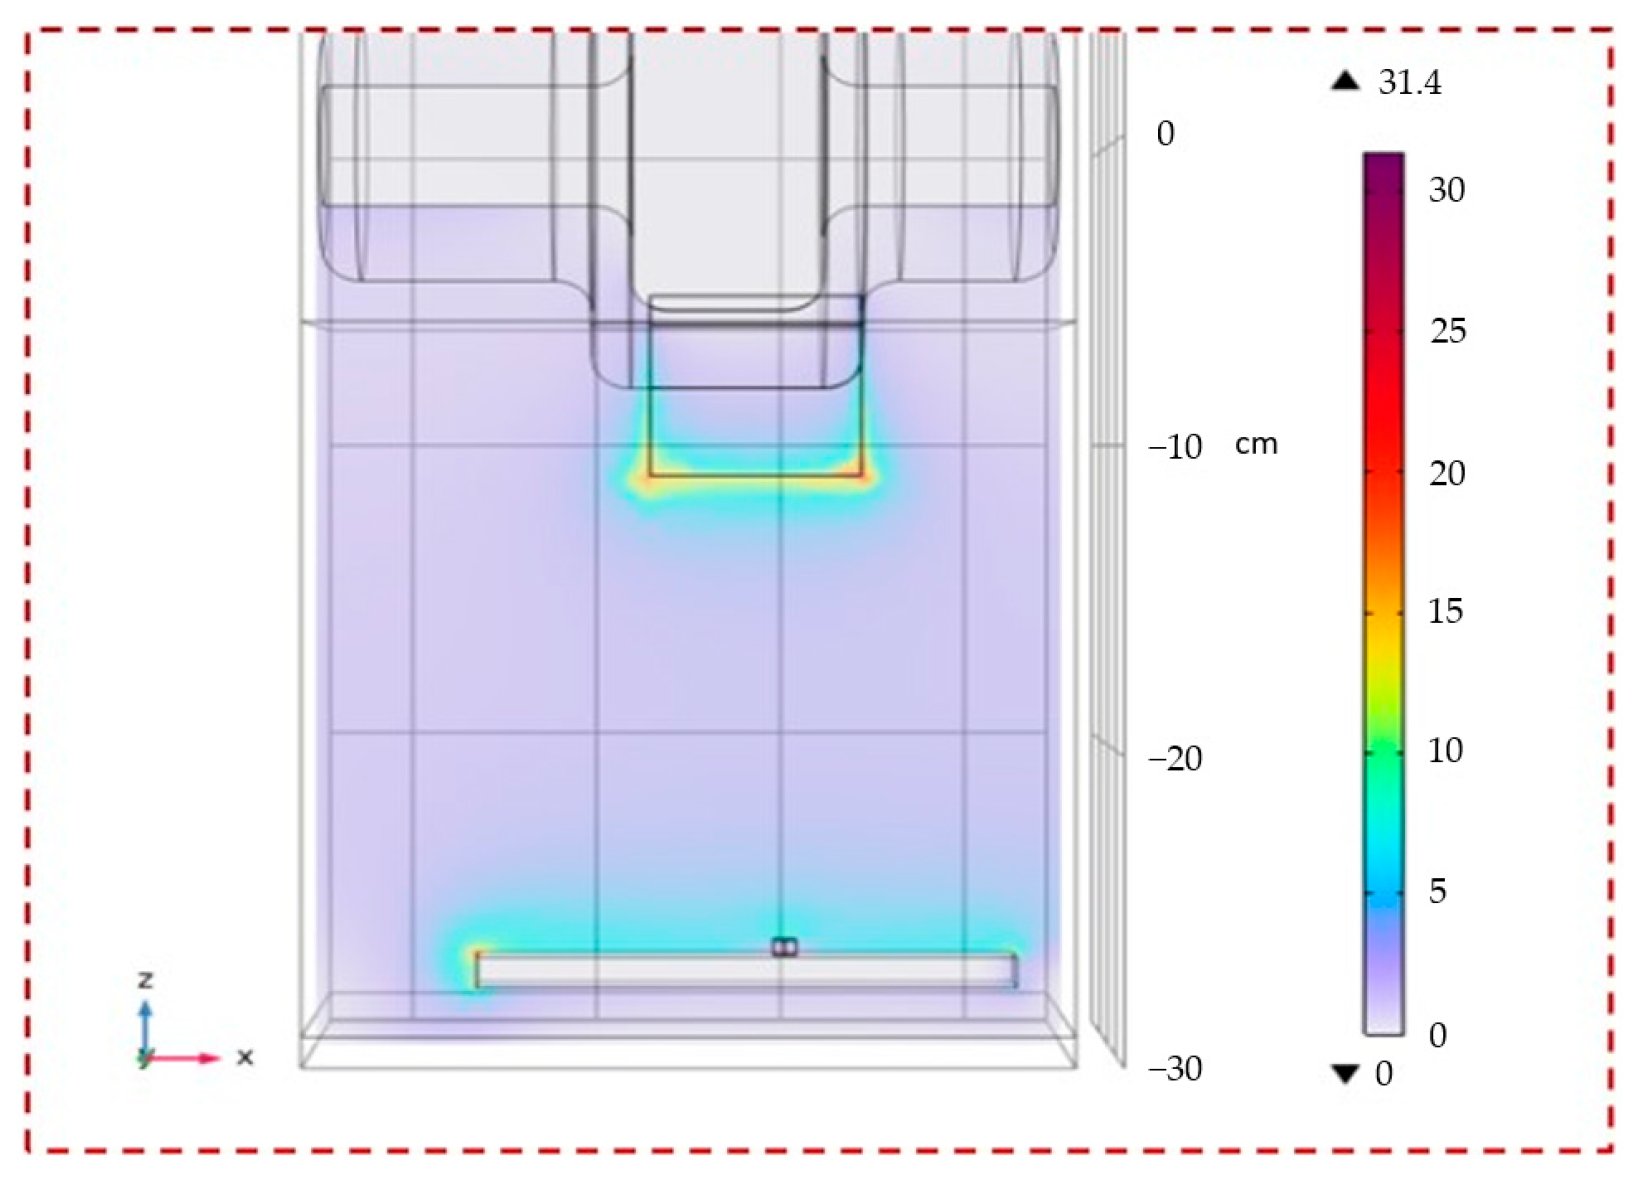
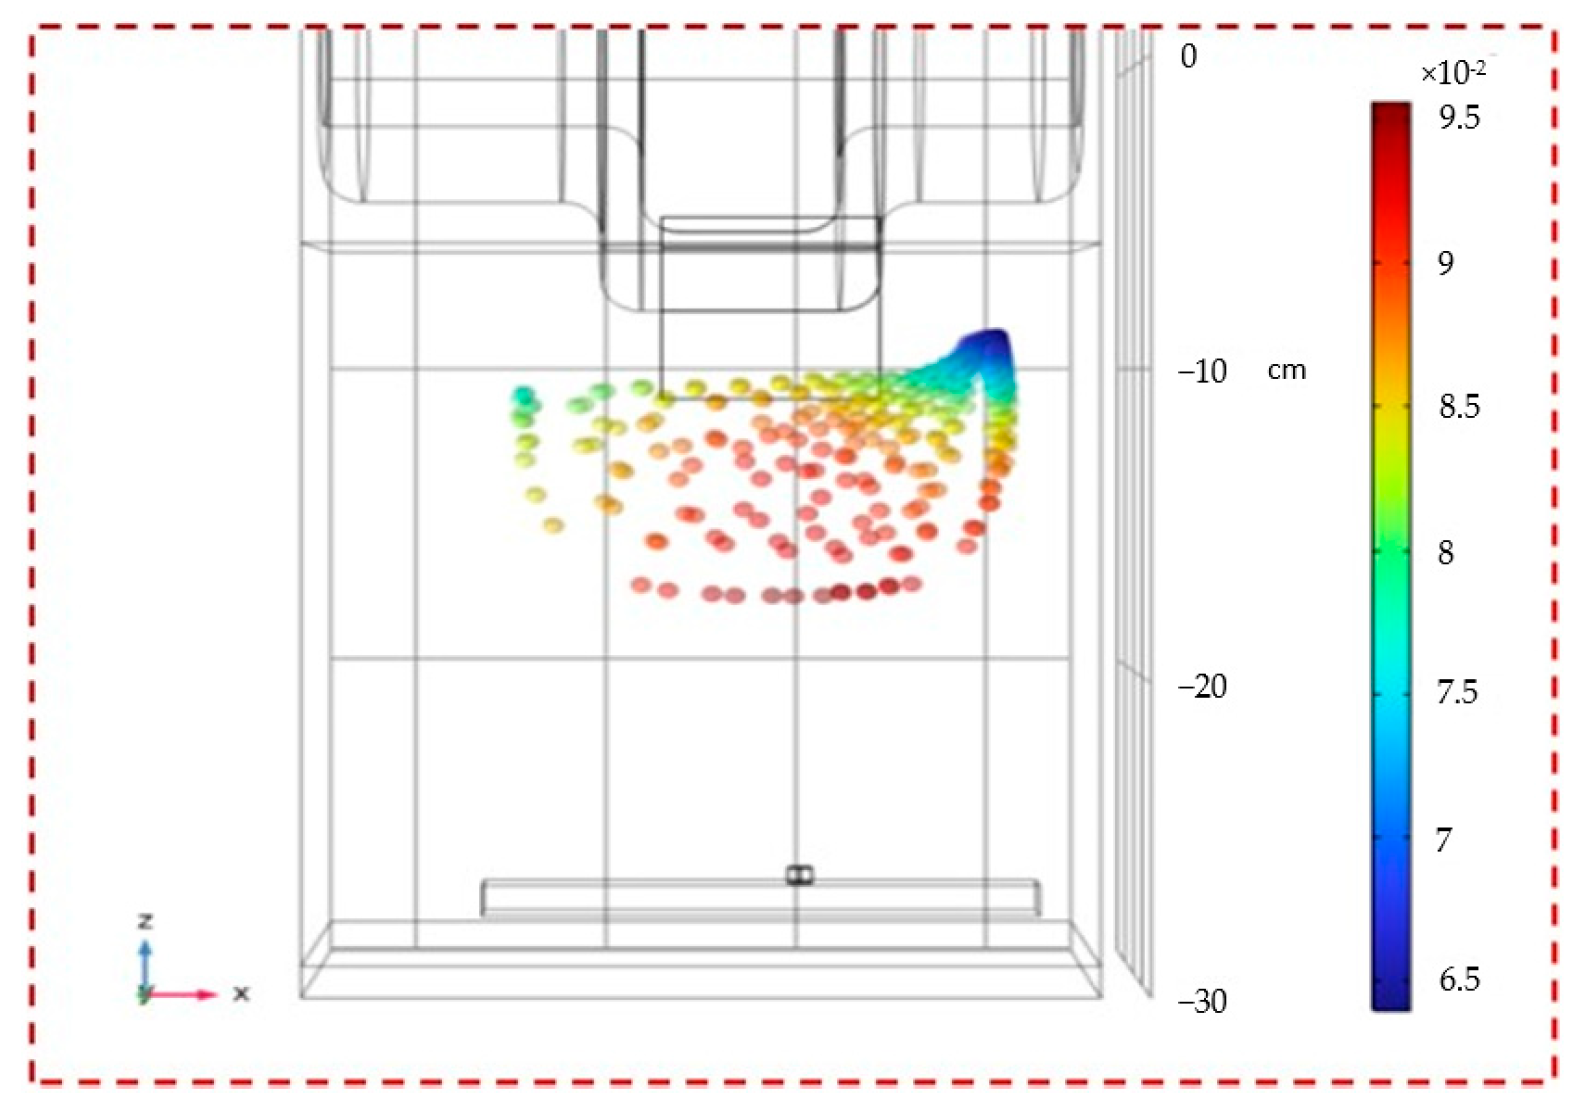
At this point, the maximum field strength has reached the air breakdown field strength, and the maximum voltage has exceeded the theoretical breakdown voltage by 59.84 kV, as shown in Figure 8. As can be seen from Figure 9, although the gap field strength has exceeded the theoretical breakdown field strength of the gap, no discharge has occurred in the gap. The reason for this is that the resonant overvoltage lasts for a short time, and there is not enough statistical delay to form a discharge channel after the effective electrons are generated in the gap. The initial electrons form electron collapse under the acceleration of the electric field, but the electric field is insufficient to maintain the conversion of the current injection to the lead discharge after voltage decay, and the discharge channel freezes.
The gap breakdown when subjected to a lightning impulse overvoltage with a peak of 150 kV is shown in Figure 10. At this point, the electrode surface breakdown indicator values are distributed from 0.4 to 1.2, and the electrode surface discharges. By increasing the electrode size and setting the domain probe in the gap below the main circuit breaker, a maximum field strength Emax of 17.3 kV/cm and an average field strength Eav of 1.84 kV/cm were obtained.
The electric field non-uniformity coefficient is 9.4, as calculated by Formula (10), at which point the theoretical breakdown voltage increases to 73.6 kV.
As shown in Figure 11. Simulation analysis was conducted on the breakdown conditions of the air gap between the circuit breaker and the grounding arm, encompassing both electric field strength and discharge delay aspects. The simulation results will provide a theoretical foundation for subsequent experimental work.

4. Insulation Characteristic of AIS Under AC and Lightning Impulse Voltage

4.1. Analysis of Discharge Initiation Under AC Withstand Voltage

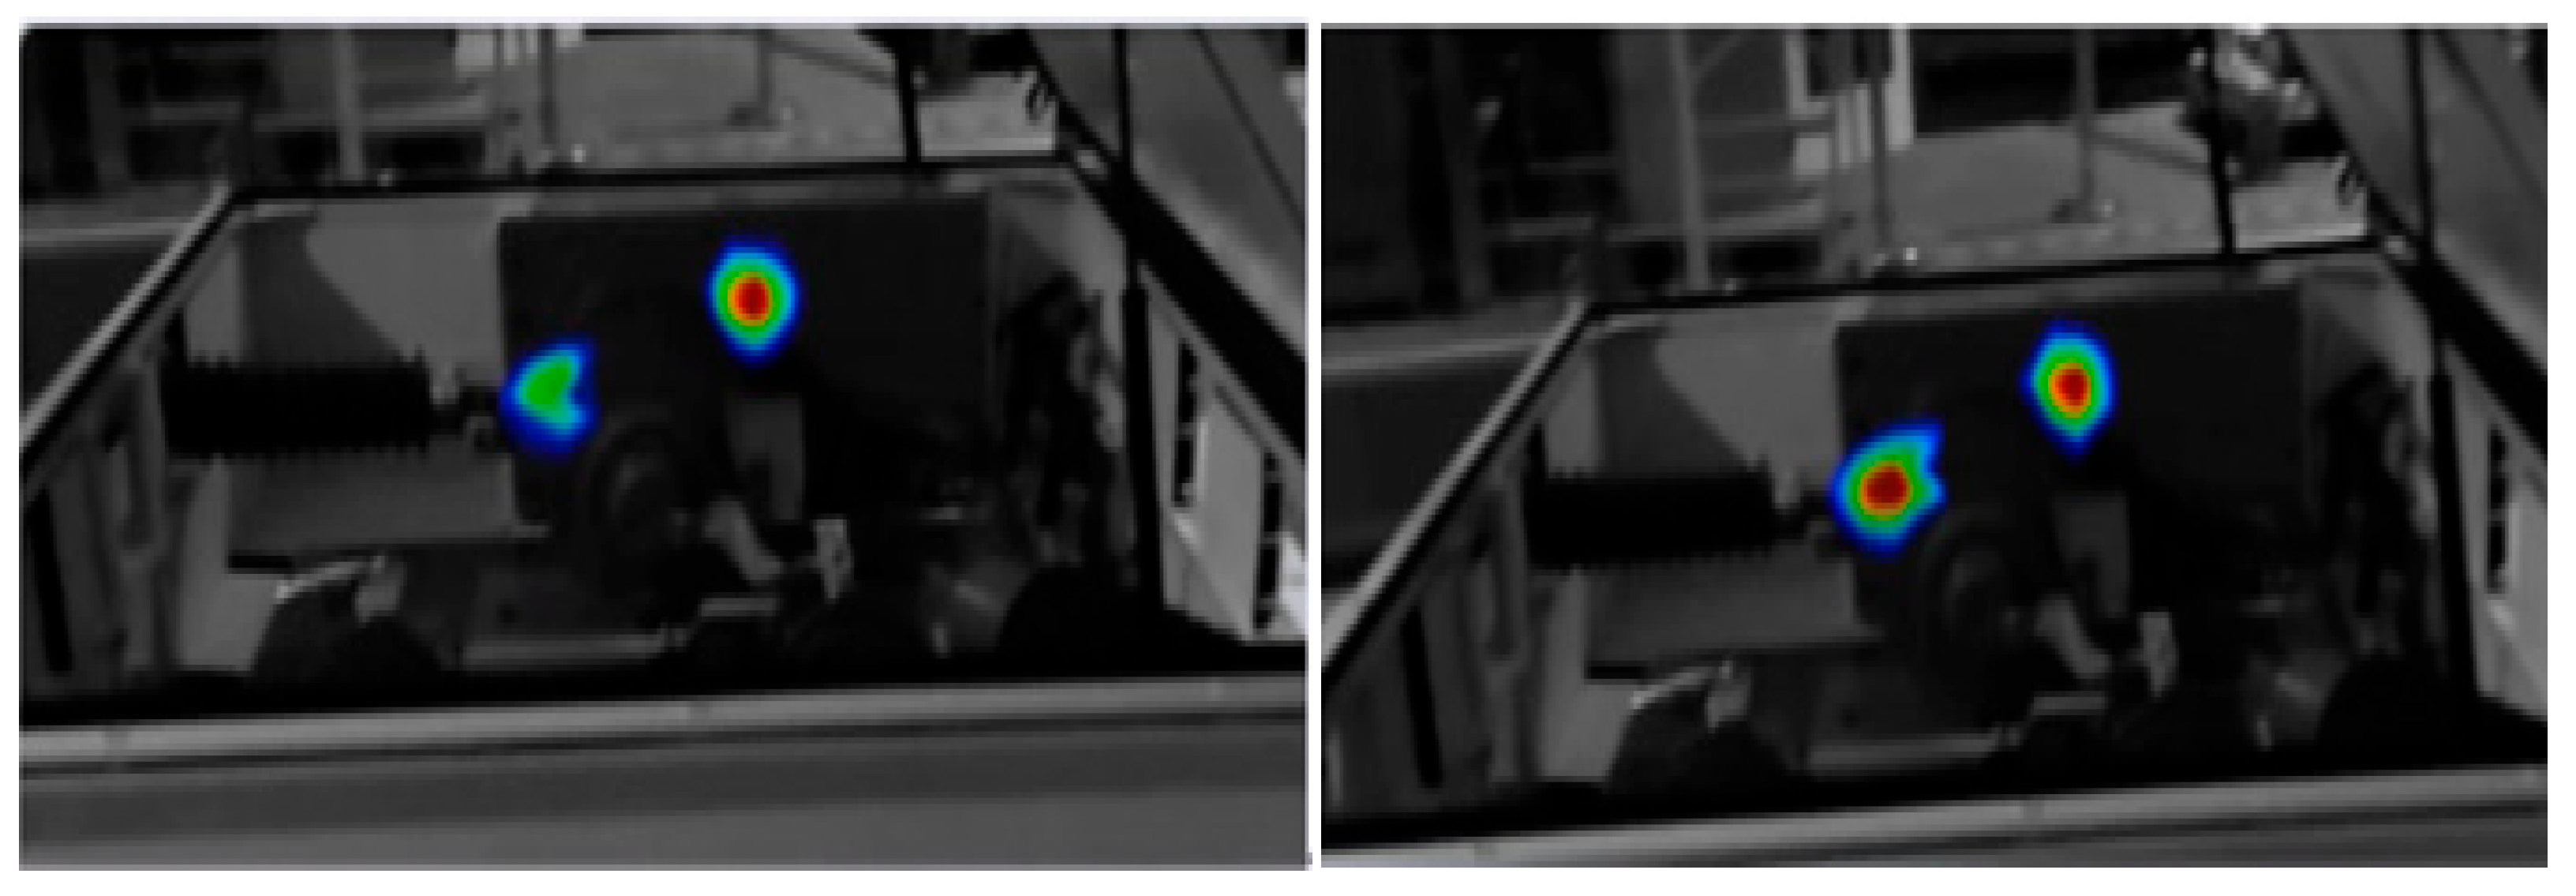
Considering that the traction power supply system is powered by a power frequency of 50 Hz and there is a high harmonic influence in the system, AC voltage is applied to the AIS; when the voltage increases to 67 kV, the high-voltage electrode has a partial discharge, the AIS electrode discharge position is observed by the voiceprint method, as shown in the figure, and the discharge position of the middle tap electrode of the circuit breaker is consistent with the electric field analysis.

4.2. Test Wiring and Test Procedure

The main instruments and equipment used in this test are shown in Table 2.
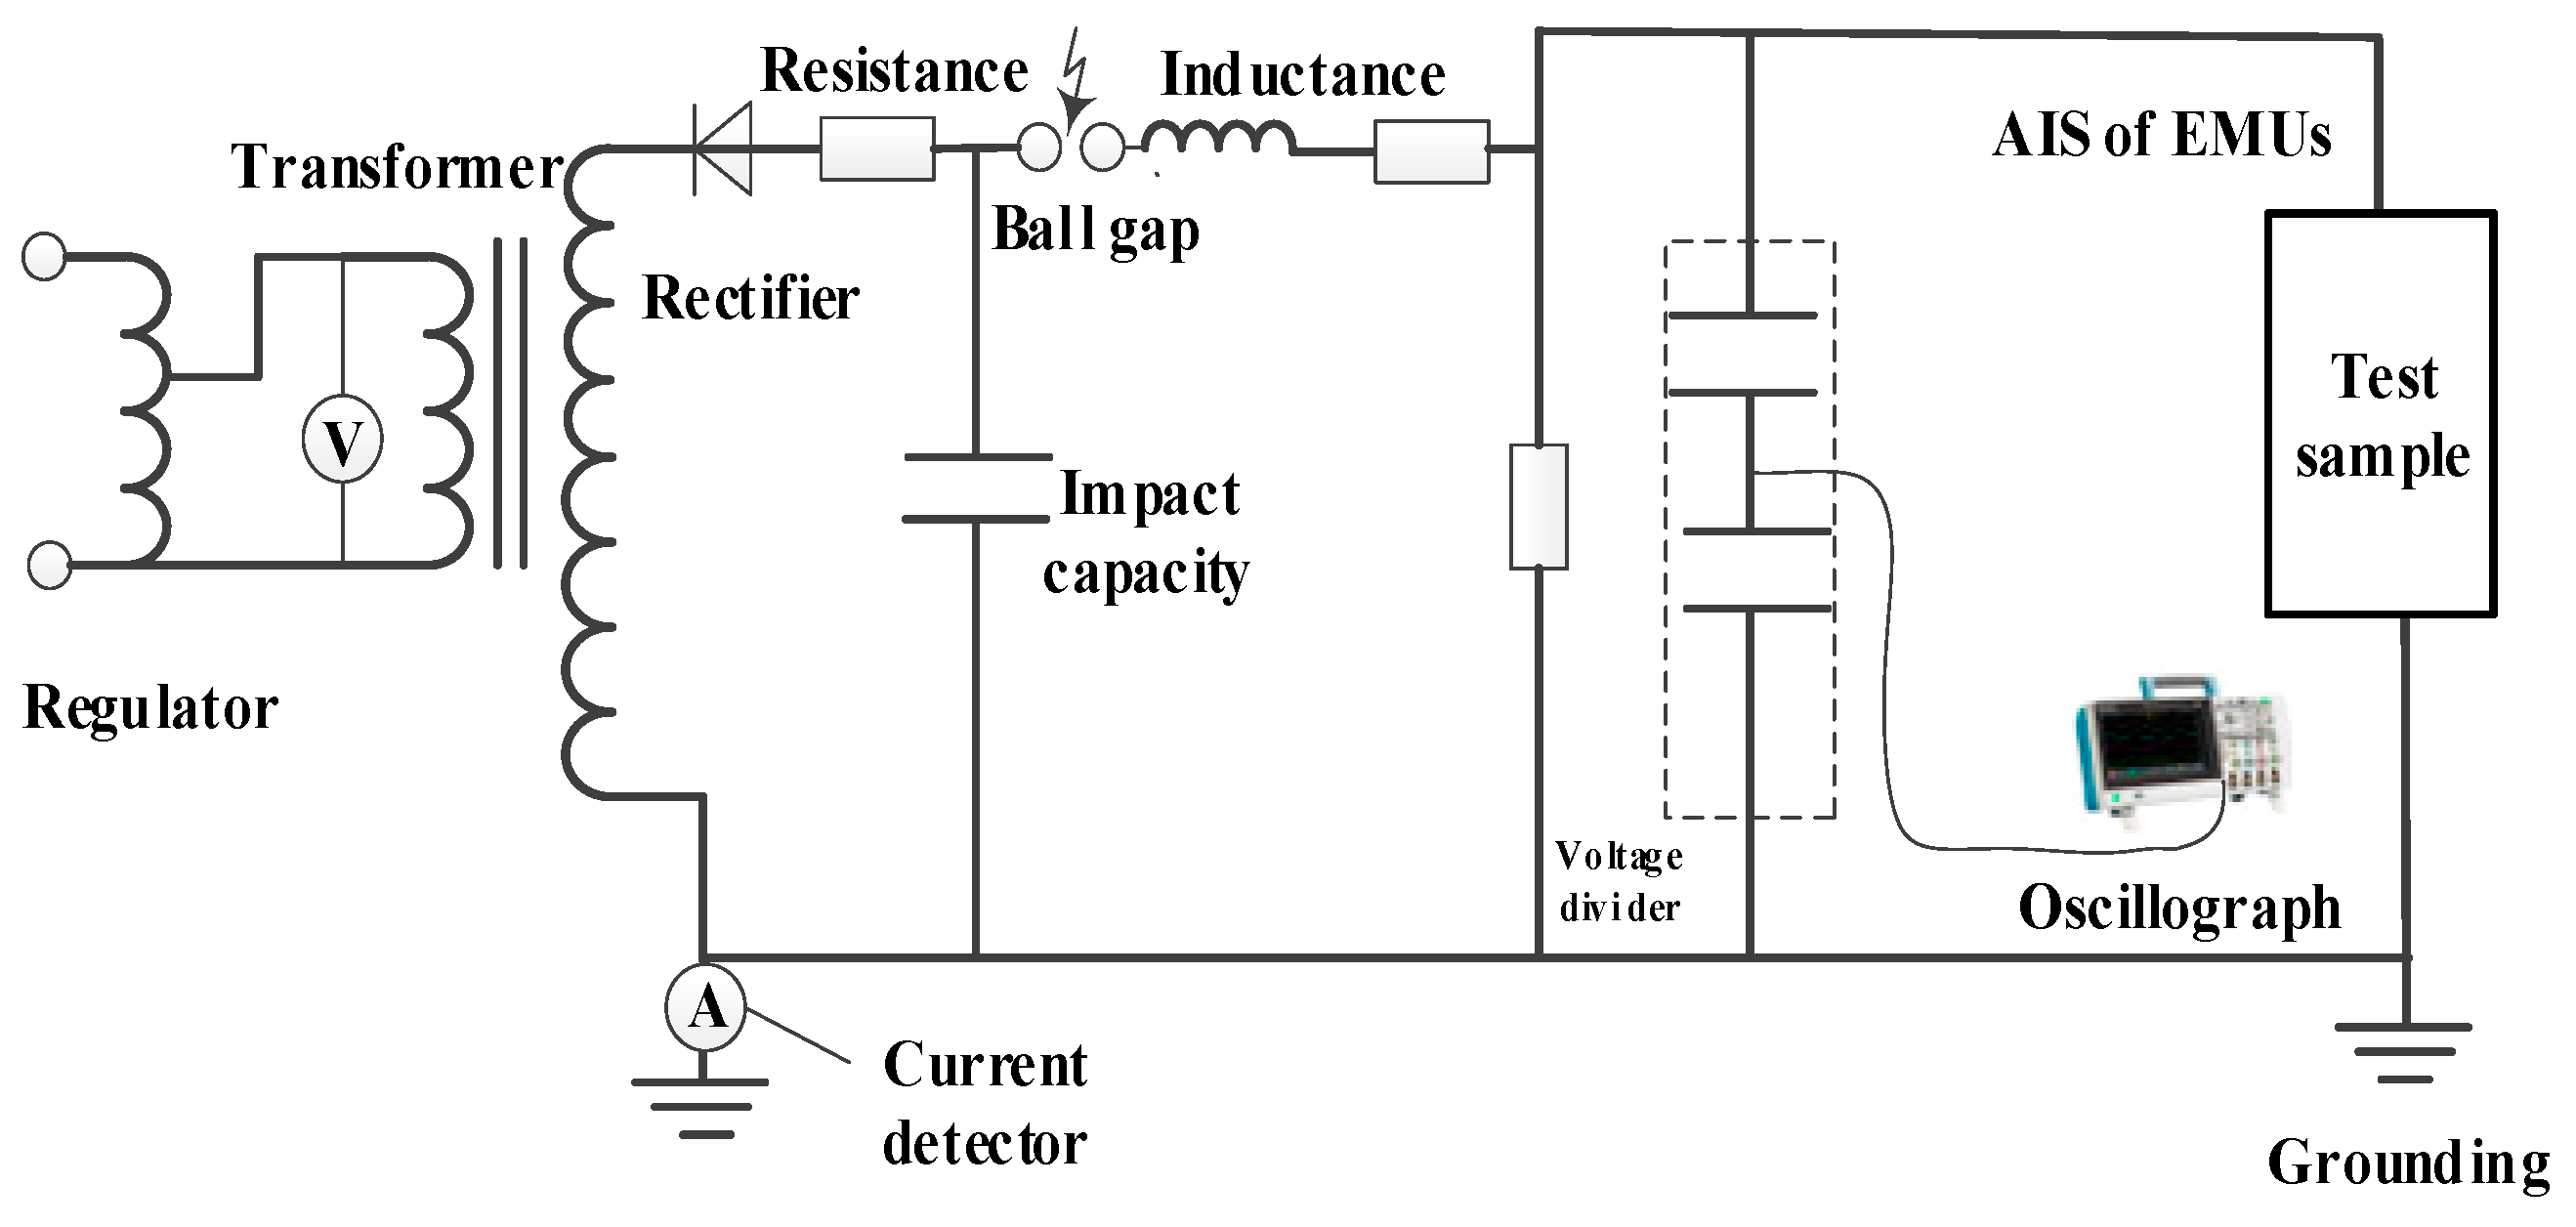
The wiring for the lightning impulse test is shown in Figure 12.
Test environment parameters are shown in Table 3.
The disconnector inside the high-voltage equipment box is closed, the break of the circuit breaker is short-circuited, and the lightning arrester is replaced with a bushing of the same model after the valve plate is removed. The T-head of the outgoing high-voltage cable is protected with a plug, the shielding layer of the high-voltage cable is grounded at one end, the high-voltage box is grounded, and an impulse voltage is applied through the terminal of the high-voltage cable.

4.3. Analysis of Test Results

The time corresponding to the theoretical breakdown voltage of the air gap is defined as Tb, and the discharge time is denoted as Tc. Consequently, the statistical time delay td is given by the following:
t d = T c T b
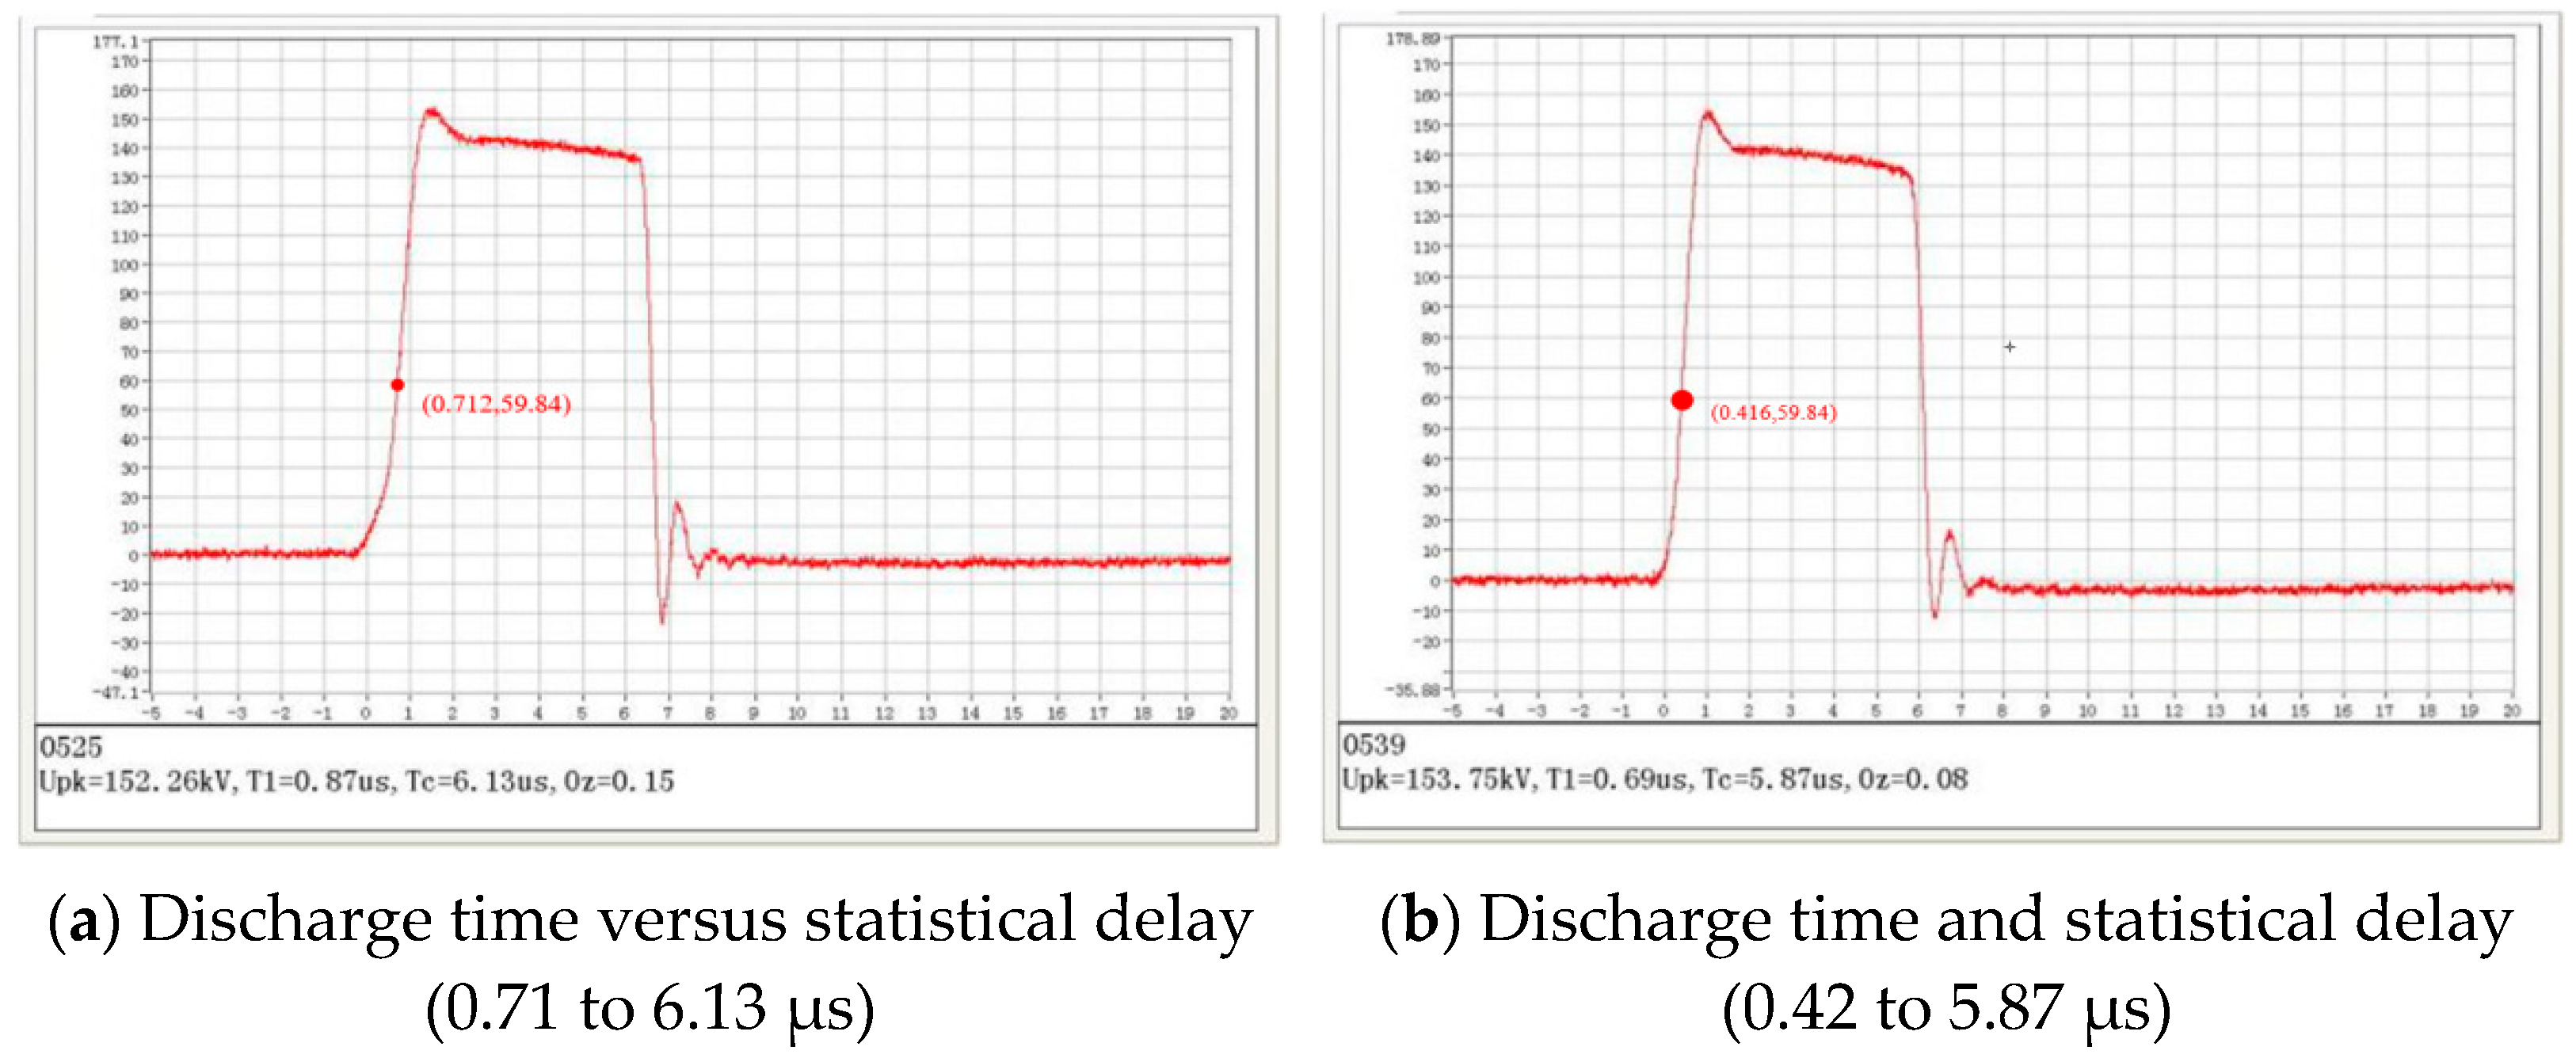
Lightning impulse voltage tests were conducted on the test equipment. Thirteen tests were conducted, out of which five showed discharge, with a discharge probability of 38.5%. The discharge waveforms are shown in Figure 13.
As shown in Table 4. Combining the data from five groups of tests, the statistical delay td is roughly distributed between 5 and 7 μs, with an average statistical delay of 5.94 μs. The discharge waveforms are shown in Figure 14.
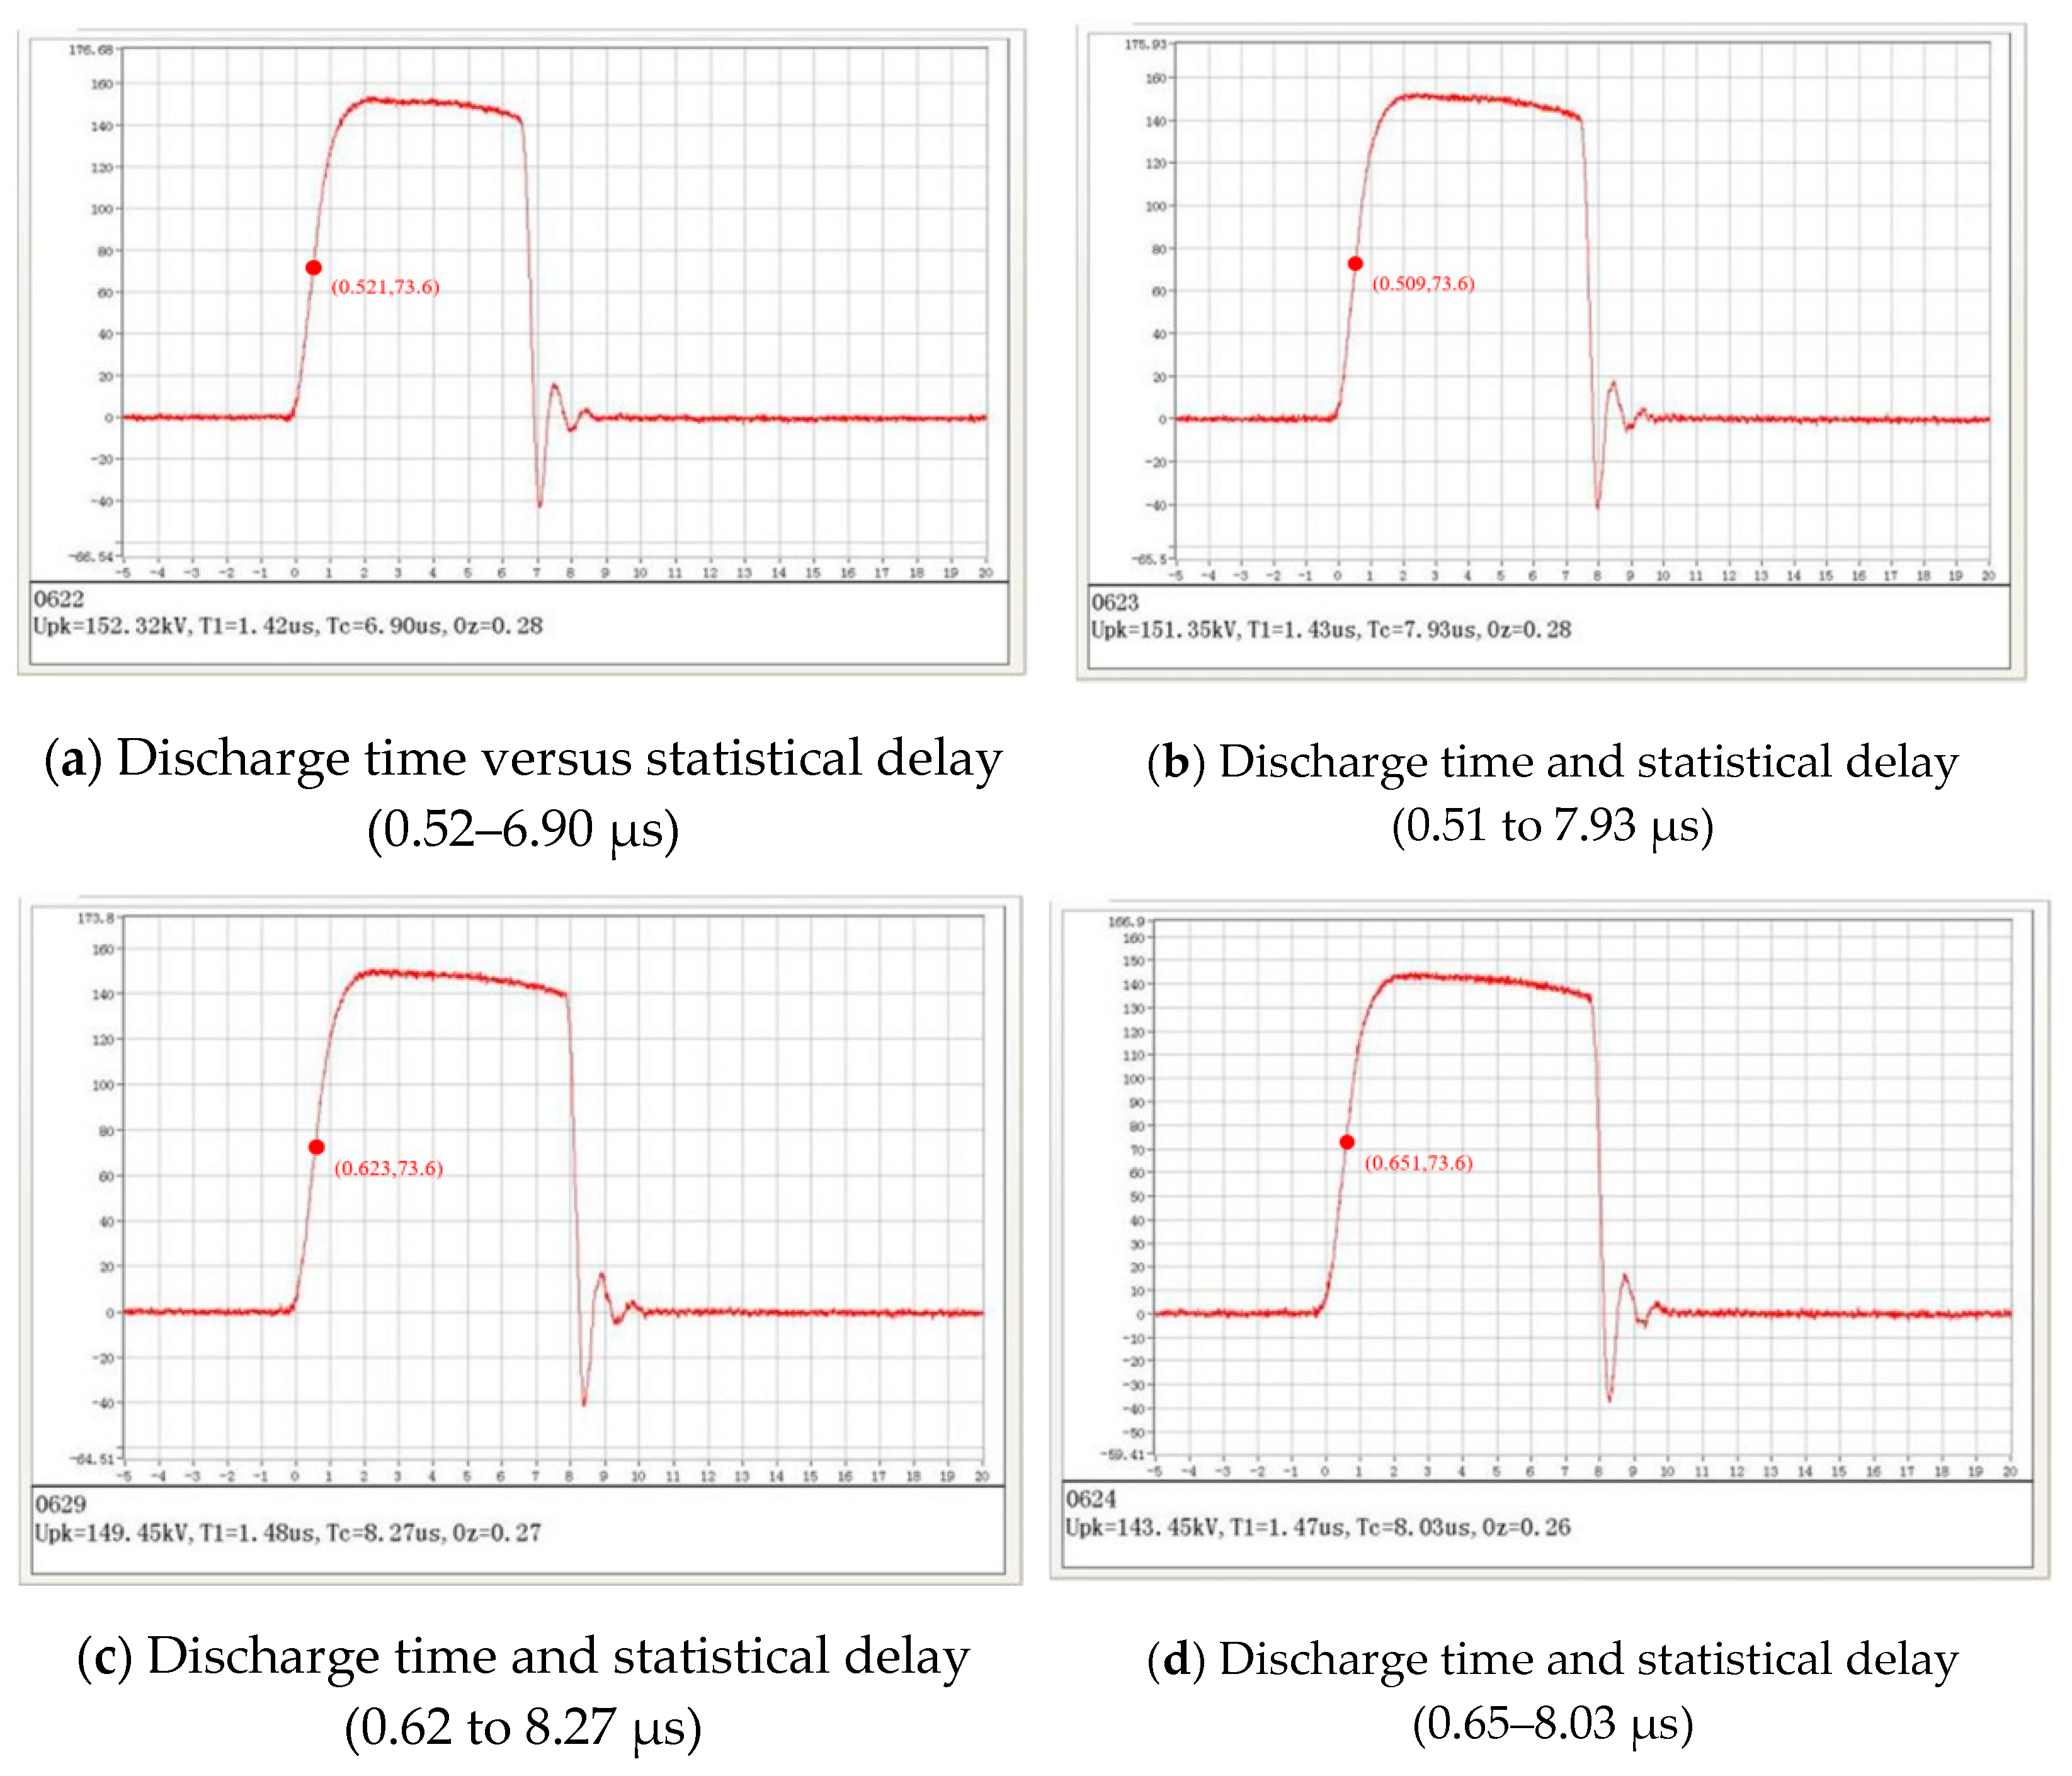
The electrode size was increased, the test was repeated, and fifteen lightning impulse tests were conducted on the test equipment, out of which four showed discharge, with a discharge probability of 26.7%. The discharge waveforms are shown in Figure 15.
As shown in Table 5. The statistical delay td is distributed between 6 and 8 μs, with an average statistical delay of 7.20 μs. In the high-voltage equipment box, the disconnector is closed, the circuit breaker is short-circuited, and the lightning arrester is replaced with a bushing of the same type after the valve plate is removed. The T-head of the outgoing high-voltage cable is protected with a plug, the shielding layer of the high-voltage cable is grounded at one end, and the high-voltage box is grounded. After the top enclosure is fully covered, an impulse voltage is applied through the terminal of the high-voltage cable. This impulse voltage is applied by installing insulating plates at the bottom and top of the discharge point. The test results are shown in Table 6. In Table 6, Ο indicates that no discharge occurred between the electrodes.
From the above data, it can be seen that as the coefficient of electric field non-uniformity decreases, the statistical delay increases. When the electrode curvature radius is small, the electric field is highly concentrated, the electron collapse rate is fast, the statistical delay is small, the discharge channel is formed rapidly, and even if the overvoltage duration is short, the discharge may be completed in a short time, and the probability of air gap breakdown is high. When the electrode size is increased to 2.5 cm, the electric field becomes more uniform compared to before, the electron collapse rate slows down, the statistical delay extends to 7 μs, the discharge takes longer to trigger, and if the overvoltage duration is insufficient, the discharge may not be completed, at which point the air gap does not break down and the discharge probability decreases. At the same time, the circuit breaker in the high-voltage equipment box is installed with an insulating partition relative to the ground switch to effectively solve the problem of low electrical gap insulation capacity, and the test structure meets the technical requirements.
Research indicates that increasing electrode dimensions can effectively prolong the statistical delay and suppress discharge under overvoltage conditions. This study provides theoretical guidance for electrode optimization in EMU systems.

5. Conclusions

This paper studies the initial process and breakdown characteristics of multiple displacements in the high-voltage combined electrical system of an EMU under lightning voltage conditions and obtains the spatio-temporal distribution characteristics of overvoltage in the high-voltage combined electrical system. Combined with the study, the conclusions are as follows:
(1)
The local electric field intensity of the small-sized electrodes under overvoltage conditions is significantly higher than that of the air breakdown field, resulting in a shortened statistical time delay and a significantly increased discharge probability. Increasing the radius of curvature of the electrode can effectively reduce the coefficient of electric field non-uniformity, bringing the maximum field strength close to the air breakdown threshold and reducing the probability of discharge. By optimizing the electrode geometry, the local electric field intensity can be reduced and the statistical delay can be prolonged, thereby enhancing the insulation reliability of high-voltage combined electrical apparatus.
(2)
For the electrode gap inside the high-voltage box, the coefficient of electric field non-uniformity in the weak insulation area of the high-voltage box is obtained as 11.53, and the calculated theoretical gap breakdown voltage is 59.84 kV. When subjected to lightning impulse voltage, too short a discharge delay causes discharge, which affects the insulation inside the high-voltage box. This result provides a quantitative basis for the insulation design of high-voltage equipment.
(3)
The impulse test shows that when the electric field non-uniformity coefficient decreases from 11.53 to 9.40, the average statistical delay extends from 5.94 μs to 7.20 μs, and the discharge probability decreases, verifying the significant effect of the electric field concentration on discharge triggering. At the same time, the installation of insulating separators can better cooperate with the measure of increasing the electrode size. The insulation design criteria proposed in the study provide theoretical support for the miniaturization and high-reliability design of the high-voltage system of EMUs.

Author Contributions

Conceptualization, J.S. and S.Y.; Methodology, J.S.; Validation, J.T.; Formal analysis, J.T.; Investigation, Y.L. and J.T.; Resources, J.S.; Data curation, J.S., K.Z. and J.T.; Writing—original draft, K.Z.; Writing—review & editing, Y.L. and S.Y.; Supervision, K.Z. and S.Y.; Project administration, K.Z. and Y.L.; Funding acquisition, S.Y. All authors have read and agreed to the published version of the manuscript.

Funding

This work was supported by the Fundamental Research Funds for the Central Universities (2024JBMC039), the National Natural Science Foundation of China (52377131), and the Science and Technology Project of the National Energy Group (SHTL-21-08, SHSN-22-05, SHTL-2022-9, SNFZ23086).

Institutional Review Board Statement

Not applicable.

Informed Consent Statement

Not applicable.

Data Availability Statement

The original contributions presented in this study are included in the article. Further inquiries can be directed to the corresponding author.

Conflicts of Interest

The authors declare no conflict of interest.

Abbreviations

The following abbreviations are used in this manuscript:
EMUsElectric Multiple Units
AISAir-Insulated Metal-Enclosed Switchgear

References

  1. Wang, W.; Li, S. Research on insulation breakdown of engineering solid dielectrics. Chin. Sci. Bull. 2020, 65, 3461–3474. [Google Scholar] [CrossRef]
  2. Shi, T.; Wang, H.; Niu, L.; Niu, B.; Han, X.; Zhong, L.; Li, J. Motion and Discharge Characteristics of Mixed Submillimeter Metal Particles and Diverse Insulating Impurities Under AC Voltages. IEEE Trans. Dielectr. Electr. Insul. 2025; Early Access. [Google Scholar] [CrossRef]
  3. Wang, X.; Long, Y.; Wang, S.; Peng, Z.; Qiu, P.; Zhou, D. Research on the Mechanism of Extra Fast Transient Overvoltage of Gas Insulated Switchgear Equipment Based on the Tripping Event of 500kV Huangping Plant Station. In Proceedings of the 2025 4th International Conference on New Energy System and Power Engineering (NESP), Fuzhou, China, 25–27 April 2025; pp. 539–542. [Google Scholar] [CrossRef]
  4. Zhang, S.; Chen, X.; Li, F.; Cao, H.; Luo, L.; Sheng, G.; Jiang, X. Research on the Inversion of Hot Spot Temperature in GIS Equipment Considering Multiphysics Simulation Data. In Proceedings of the 2025 5th Power System and Green Energy Conference (PSGEC), Hong Kong, 20–23 August 2025; pp. 108–112. [Google Scholar] [CrossRef]
  5. Hu, J.; Xu, X.; Che, J.; Zhang, W.; Cheng, C.; He, H. Study on the initiation characteristics of low-pressure positive 1 m air gap impulse flow discharge. Hunan Electr. Power 2023, 43, 70–78. [Google Scholar]
  6. Deng, Z.; Peng, Z.; Yin, F.; Zhao, Z.; Wu, H. Calculation of electric field distribution and insulation failure analysis of traction transformer bushing. High Volt. Appar. 2016, 52, 78–84. [Google Scholar]
  7. Liu, X.; Zhao, X.; Ma, Y.; Du, Y.; He, J. Analysis of arc channel characteristics after air gap breakdown. Proc. CSEE 2023, 43, 5302–5311. [Google Scholar]
  8. Liu, X.; Dong, M.; Deng, H.; Zhao, X.; He, J. Gas motion characteristics in the discharge channel after air gap breakdown. Chin. J. Electr. Eng. Technol. 2021, 36, 2667–2674. [Google Scholar]
  9. Lu, F.; Zhang, B.; Geng, J.; Wang, P.; Ding, Y.; Gao, S. Ball-plate gap flow discharge characteristics under the influence of burr defects. Insul. Mater. 2022, 55, 67–72. [Google Scholar] [CrossRef]
  10. Lu, F.; Qin, Y.; Wang, P.; Geng, J.; Ding, Y.; Yao, X. Spatial electric field variation during the development of positive polarity operating impulse voltage current injection. High Volt. Technol. 2019, 45, 2964–2970. [Google Scholar]
  11. Lu, F.; Zhao, Y.; Wang, P.; Ding, Y.; Qin, Y.; Geng, J.; Xu, J.; Zhu, Y. Influence of burr defects on the impact discharge characteristics of ball-plate gap operation. Insul. Mater. 2018, 51, 82–86. [Google Scholar]
  12. Shen, J.; Xu, Z.; Liu, Z.; Geng, Y.; Wang, J. Breakdown polarity effect of series double vacuum gap under lightning impulse voltage. Trans. China Electrotech. Soc. 2025, 40, 5589–5600. [Google Scholar]
  13. Huang, Y.; Chen, W.; He, H.; Cheng, C.; Zhang, W.; Wu, Y.; Che, J. Calculation method of electric field in long-gap positive leading discharge channel. Proc. CSEE 2023, 43, 8977–8987. [Google Scholar]
  14. Cheng, C.; Chen, W.; He, H.; Huang, Y.; Fu, Z.; Zhao, A.; Hu, D. Study on temperature evolution law of unstable pilot channel for positive polarity long air gap discharge. J. Electr. Eng. China 2024, 44, 6238–6248. [Google Scholar]
  15. Ma, X.; Bao, Z.; Geng, J.; Zhang, C.; Li, Y.; Ding, Y.; Jiang, L.; Wang, S. Air gap operation impact discharge characteristics of ±800 kV ultra-high voltage valve hall in 2500 m altitude area. Power Capacit. React. Power Compens. 2024, 45, 88–97. [Google Scholar] [CrossRef]
  16. Vu-Cong, T.; Toigo, C.; Ortiz, G.; Dalstein, M.; Jacquier, F.; Girodet, A. Numerical simulation of partial discharge current pulse: Comparison between SF6, Fluoronitrile—CO2 mixture and Fluoroketone—CO2 mixture. In Proceedings of the 2020 IEEE Conference on Electrical Insulation and Dielectric Phenomena (CEIDP), East Rutherford, NJ, USA, 18–30 October 2020; pp. 403–406. [Google Scholar] [CrossRef]
  17. Li, S.; Yu, X.; Wang, H.; Chen, Y.; Yang, D.; Yu, C. Analysis and Experimental Study of an Internal Discharge Fault in a 220kV GIS. In Proceedings of the 2025 4th International Conference on New Energy System and Power Engineering (NESP), Fuzhou, China, 25–27 April 2025; pp. 691–696. [Google Scholar] [CrossRef]
  18. Qian, B.; Wan, X.; Chen, L.; Zhou, Y.; Chen, C. Analysis of Several Fault Cases and Rectification Measures for GIS Circuit Breaker Switch Operations in Substations. In Proceedings of the 2025 IEEE 8th Information Technology and Mechatronics Engineering Conference (ITOEC), Chongqing, China, 14–16 March 2025; pp. 121–124. [Google Scholar] [CrossRef]
  19. Bharanidharan, R.; Vijayalakshmi, V.J.; Maheswari, R.V. Simulation and Characterization of Dielectric Behavior of Pure SF6 and N2 for High-Voltage Applications Using FEM. In Proceedings of the 2025 11th International Conference on Electrical Energy Systems (ICEES), Chennai, India, 21–23 August 2025; pp. 313–318. [Google Scholar] [CrossRef]
  20. Baruah, N.; Bahdad, F.O.; Ranjan, P.; Han, Q.; Chen, L. Breakdown modeling of SF6 and its environmentally friendlier alternatives in quasi uniform fields. IEEE Trans. Dielectr. Electr. Insul. 2025; Early Access. [Google Scholar] [CrossRef]
Figure 1. Insulation breakdown fault in on-train AIS.
Applsci 15 12238 g001
Figure 2. Diagram of a standard EMU and its high-voltage box structure.
Applsci 15 12238 g002
Figure 3. Overall field strength of AIS.
Applsci 15 12238 g003
Figure 4. Electric field strength of breakers.
Applsci 15 12238 g004
Figure 5. Gap in AIS.
Applsci 15 12238 g005
Figure 6. Electric field of the gap.
Applsci 15 12238 g006
Figure 7. Gap breakdown at power frequency.
Applsci 15 12238 g007
Figure 8. Electric field intensity.
Applsci 15 12238 g008
Figure 9. Gap breakdown under resonant overvoltage.
Applsci 15 12238 g009
Figure 10. Trajectory of charged particles.
Applsci 15 12238 g010
Figure 11. Gap breakdown under lightning impulse voltage.
Applsci 15 12238 g011
Figure 12. AIS partial discharge of EMU under AC withstand voltage.
Applsci 15 12238 g012
Figure 13. Lightning impulse test circuit.
Applsci 15 12238 g013
Figure 14. Discharge waveforms of lightning impulse tests.
Applsci 15 12238 g014aApplsci 15 12238 g014b
Figure 15. Increased electrode lightning impulse test discharge waveforms.
Applsci 15 12238 g015
Table 1. Material list of equipment inside high-voltage combined electrical apparatus.
Serial NumbersMaterial NameUsage LocationNote
1Silicone rubberInsulatorCircuit breaker
2AluminumGrounding arm
3GPO-3Insulation board
4AluminumFastening screw
Table 2. Test instruments and equipment.
Serial NumbersDevice NameModelQuantity
1High-voltage equipment box (AIS of EMUs, Beijing, China)SFE32TP03-461-300001
2Impulse voltage generator (Wuhan Huagao Equipment New Technology Co., Ltd., Wuhan, China; Beijing CRRC S Railway Technology Co., Ltd., Beijing, China)CDY-L400 kV/30 kJ1
Table 3. Test environment parameters.
TemperatureAtmospheric PressureDischarge
Gap
Atmospheric Calibration
Positive Factor
Experiment
Voltage Value
17.5 °C1011 hPa230 mm0.992149 kV
Table 4. Discharge statistical delay.
Serial NumbersTheoretical Breakdown
Moment/μs
Discharge Time/μsStatistical Delay/μs
10.7126.135.418
20.4165.875.454
30.3966.786.384
40.7848.227.436
50.9105.955.040
Table 5. Statistical delay of discharge.
Serial NumberTheoretical Breakdown Time/μsDischarge Time/μsStatistical Time Delay/μs
10.5216.906.379
20.5097.937.421
30.6238.277.647
40.6518.037.379
Table 6. Clearance breakdown after installing the insulating board.
Discharge Situation
Number of tests12345
ΟΟΟΟΟ
678910
ΟΟΟΟΟ
1112131415
ΟΟΟΟΟ
Disclaimer/Publisher’s Note: The statements, opinions and data contained in all publications are solely those of the individual author(s) and contributor(s) and not of MDPI and/or the editor(s). MDPI and/or the editor(s) disclaim responsibility for any injury to people or property resulting from any ideas, methods, instructions or products referred to in the content.