Article

Experimental Study on Wetting Front and Air Counterflow in Unsaturated Sand Columns During Ponded Water Infiltration

1
Key Laboratory of Geological Hazards on Three Gorges Reservoir Area, Ministry of Education, China Three Gorges University, Yichang 443002, China
2
College of Civil Engineering and Architecture, China Three Gorges University, Yichang 443002, China
*
Author to whom correspondence should be addressed.
Appl. Sci. 2025, 15(22), 12200; https://doi.org/10.3390/app152212200 (registering DOI)
Submission received: 10 October 2025 / Revised: 6 November 2025 / Accepted: 13 November 2025 / Published: 17 November 2025
(This article belongs to the Special Issue Seepage Problems in Geotechnical Engineering)

Abstract

This study investigates water–air coupled transport characteristics during ponded water infiltration in unsaturated sand columns through systematic laboratory experiments. The experiments considered three soil textures, two initial dry densities (1.50 and 1.60 g/cm3), and four initial saturations (0% to 41%), with synchronous monitoring of pore pressure and volumetric water content using pressure sensors (P1–P7) and moisture sensors (W1–W5) to track dynamic changes in wetting front, pressure, and saturation. The results reveal four distinct stages of pore pressure variation during ponded water infiltration: pressure soars (Stage I), pressure ascends with air compression (Stage II), pressure surges due to air breakthrough (Stage III), and pressure stabilization (Stage IV). The duration, intensity of these stages, and wetting front migration rates are significantly influenced by soil texture, initial dry density, and initial saturation. Specifically, lower dry density and clay content shorten the time for the wetting front to reach the column bottom, while higher initial saturation promotes entrapped air bubble breakthrough, triggering Stage III. This study enhances understanding of water–air coupled transport in unsaturated sandy soils, providing insights for optimizing irrigation and soil-water conservation strategies.

1. Introduction

Unsaturated soil is a complex system composed of three phases: solid particles, pore water, and pore air. Due to the diversity of solid particle shapes and the wide variation in particle size distribution, the pore structure of soil becomes extremely complex. The voids of soil are filled by pore water and pore air. The relative change in the saturation of water/air phases causes complex water–air distribution states, such as continuous air in discontinuous water phase, both continuous water and air phases, and entrapped air phase in continuous water phase [1,2]. Such water–air interaction process in unsaturated soil has long been a concern for researchers, but is still a tough challenge in experimental study. Particularly in studies of rainfall infiltration and ponded water infiltration, scholars have found that considering or ignoring the effect of the air phase in soil has a significant impact on the study of water infiltration and seepage [3,4,5,6].
In traditional unsaturated infiltration studies, it is usually assumed that the air phase in the soil is fully connected to the atmosphere, thus ignoring air phase flow and its influence on water phase seepage. Based on this assumption, typical water phase seepage models, such as the Green-Ampt model and Richards’ saturated–unsaturated seepage model are used to simulate water flow. The Green-Ampt model is used in one-dimensional seepage condition, and the latter can be used in one-dimensional to three-dimensional seepage conditions [7]. A one-dimensional soil column laboratory testing model is often used to carry out rainfall infiltration and ponded water infiltration experiments to observe the wetting front advancing rate, the variations in water content, matric suction, and pore water pressure. Zhao et al. [8] used different soil columns from 200 mm to 1200 mm to conduct the capillary rise experiments. It revealed that when the wetting front went through the interface between the coarser and finer soil layer, the finer soil layer is conducive to uplifting capillary water. Li et al. [9] used an 850 mm height soil column to study the effects of rainfall infiltration and ponded water infiltration on soil infiltration rate. Bathurst et al. [10] used a 2150 mm sandy soil column to investigate the influence of geotextiles on ponded water infiltration. The bottom of the above experimental soil columns is open, which not only facilitates the observation of water seepage amount but also allows pore air to connect with the atmosphere. Thus, it results in a small internal air pressure gradient in the soil and minimal barrier to water phase seepage. The above experimental results also show good consistency with the theoretical models such as Richards’ model.
However, scholars found that under some special water–air phase seepage boundary conditions, the air phase may be expelled by the water phase, compressed in the entrapped zone, and ejected in the form of bubbles. In the last century, Wang [3] and Culligan [4] discovered that entrapped air bubbles in unsaturated soil have a significant impact on water phase seepage. In recent years, Ng [5,11] revealed that water–air interaction in landfills is strong; the trapped air and the biological and chemical reactions generated gas in landfills that may break through the upper cover with the increasing of air phase pressure. Siemens et al. [12] studied the air counterflow in soil through one-dimensional soil column ponded water infiltration experiments. Chen et al. [6] observed air overflow in a two-dimensional sand tank. Abdulkadir et al. [13] studied the air–water upward and downward flows in 127 mm internal diameter pipes using advanced conductance ring probes located at two measurement locations. The above studies found that when the connectivity between air phase inside soil and atmosphere outside soil is poor, the coupling between water flow and air flow is obviously strong. Thus, the air phase flow in such conditions cannot be ignored, otherwise, it will lead to significant error in analyzing water infiltration rate, water content distribution, etc.
In terms of experimental devices, studies range from one-dimensional soil columns to two-dimensional sand tanks, and three-dimensional in situ tests, among which one-dimensional soil column models are relatively widely used, with soil column heights ranging from 190 mm to 4000 mm. Montoya-Dominguez et al. [14] used a 300 mm soil column to study the rainfall infiltration process; Hou et al. [15] used a 4000 mm soil column to investigate changes in matric suction and soil moisture during rainfall infiltration; Udukumburage et al. [16] used a 1200 mm soil column to observe changes in positive and negative pore water pressure during ponded water infiltration; Rubio et al. [17] used a 190 mm soil column and a 90 mm × 90 mm × 225 mm box, respectively, to study the ponded water infiltration process; Dong et al. [18] used a 600 mm soil column to research the ponded water infiltration process in multi-layered soil; Li et al. [9] used an 850 mm soil column to study the ponded water infiltration process; Autovino et al. [19] used a 250 mm soil column to study infiltration rates in single-layer and multi-layered soils; Bai et al. [20] conducted in situ rainfall infiltration tests on a naturally excavated slope; and Wen et al. [21] carried out in situ ponded water infiltration tests in roadside bioretentions.
In terms of sensor arrangement, researchers mainly used volumetric water content sensors to monitor changes in volumetric water content [8,9,10,14,15,17,18,19,20,21], tensiometers to measure soil matric suction [10,14,15,16], and traditional pressure sensors to monitor positive pore water pressure or pore air pressure in soil [8,16]. Bathurst [10] used a conductivity probe to monitor the advancing process of the wetting front.
In terms of experimental data analysis, researchers mainly analyzed the propagation process of the wetting front [9,10,17], infiltration rate [9,19], and unsaturated seepage parameters [9,22,23] through measured temporal data such as volumetric water content, matric suction, and pore water pressure in soil, and studied the effects of soil types, initial dry densities, initial water contents, and soil layer structures on the infiltration process [9,19,20]. Mburu et al. [24] investigated the unsaturated slopes stability subjected to rainfall infiltration using numerical simulation. Other researchers focused on collapsible loess and studied the coupled process between infiltration and volume deformation [25,26]. Siemens [12] observed air phase flow in soil using artificial transparent soil and analyzed the mechanism of air phase infiltration resistance.
To explain complex unsaturated seepage phenomena, on the basis of traditional Green-Ampt and Richards’ seepage models, researchers have explored hydro-thermal coupled seepage models [27] and multi-phase flow models [28,29]. Ma [30] improved a one-dimensional Green-Ampt model to consider air phase infiltration resistance in multi-layered soils. Wu [31] improved a one-dimensional seepage model by considering the coupling of seepage and deformation.
From the above literature review, the water–air two-phase seepage process in unsaturated soil has not been fully revealed, especially under heavy rain or ponded water infiltration conditions, where soil air is enclosed by surface ponding, resulting in obvious air phase infiltration resistance. In this study, a soil column ponded water infiltration experiment was designed. Pore pressure sensors were used to sensitively capture pore air pressure fluctuations caused by pore air compression and bubble overflow. Volumetric water content sensors inside the soil and external photography were used to observe the dynamic advancing process of the wetting front. On this basis, the physical process of water–air interaction was analyzed.

2. Laboratory Experiments

2.1. Experimental Device

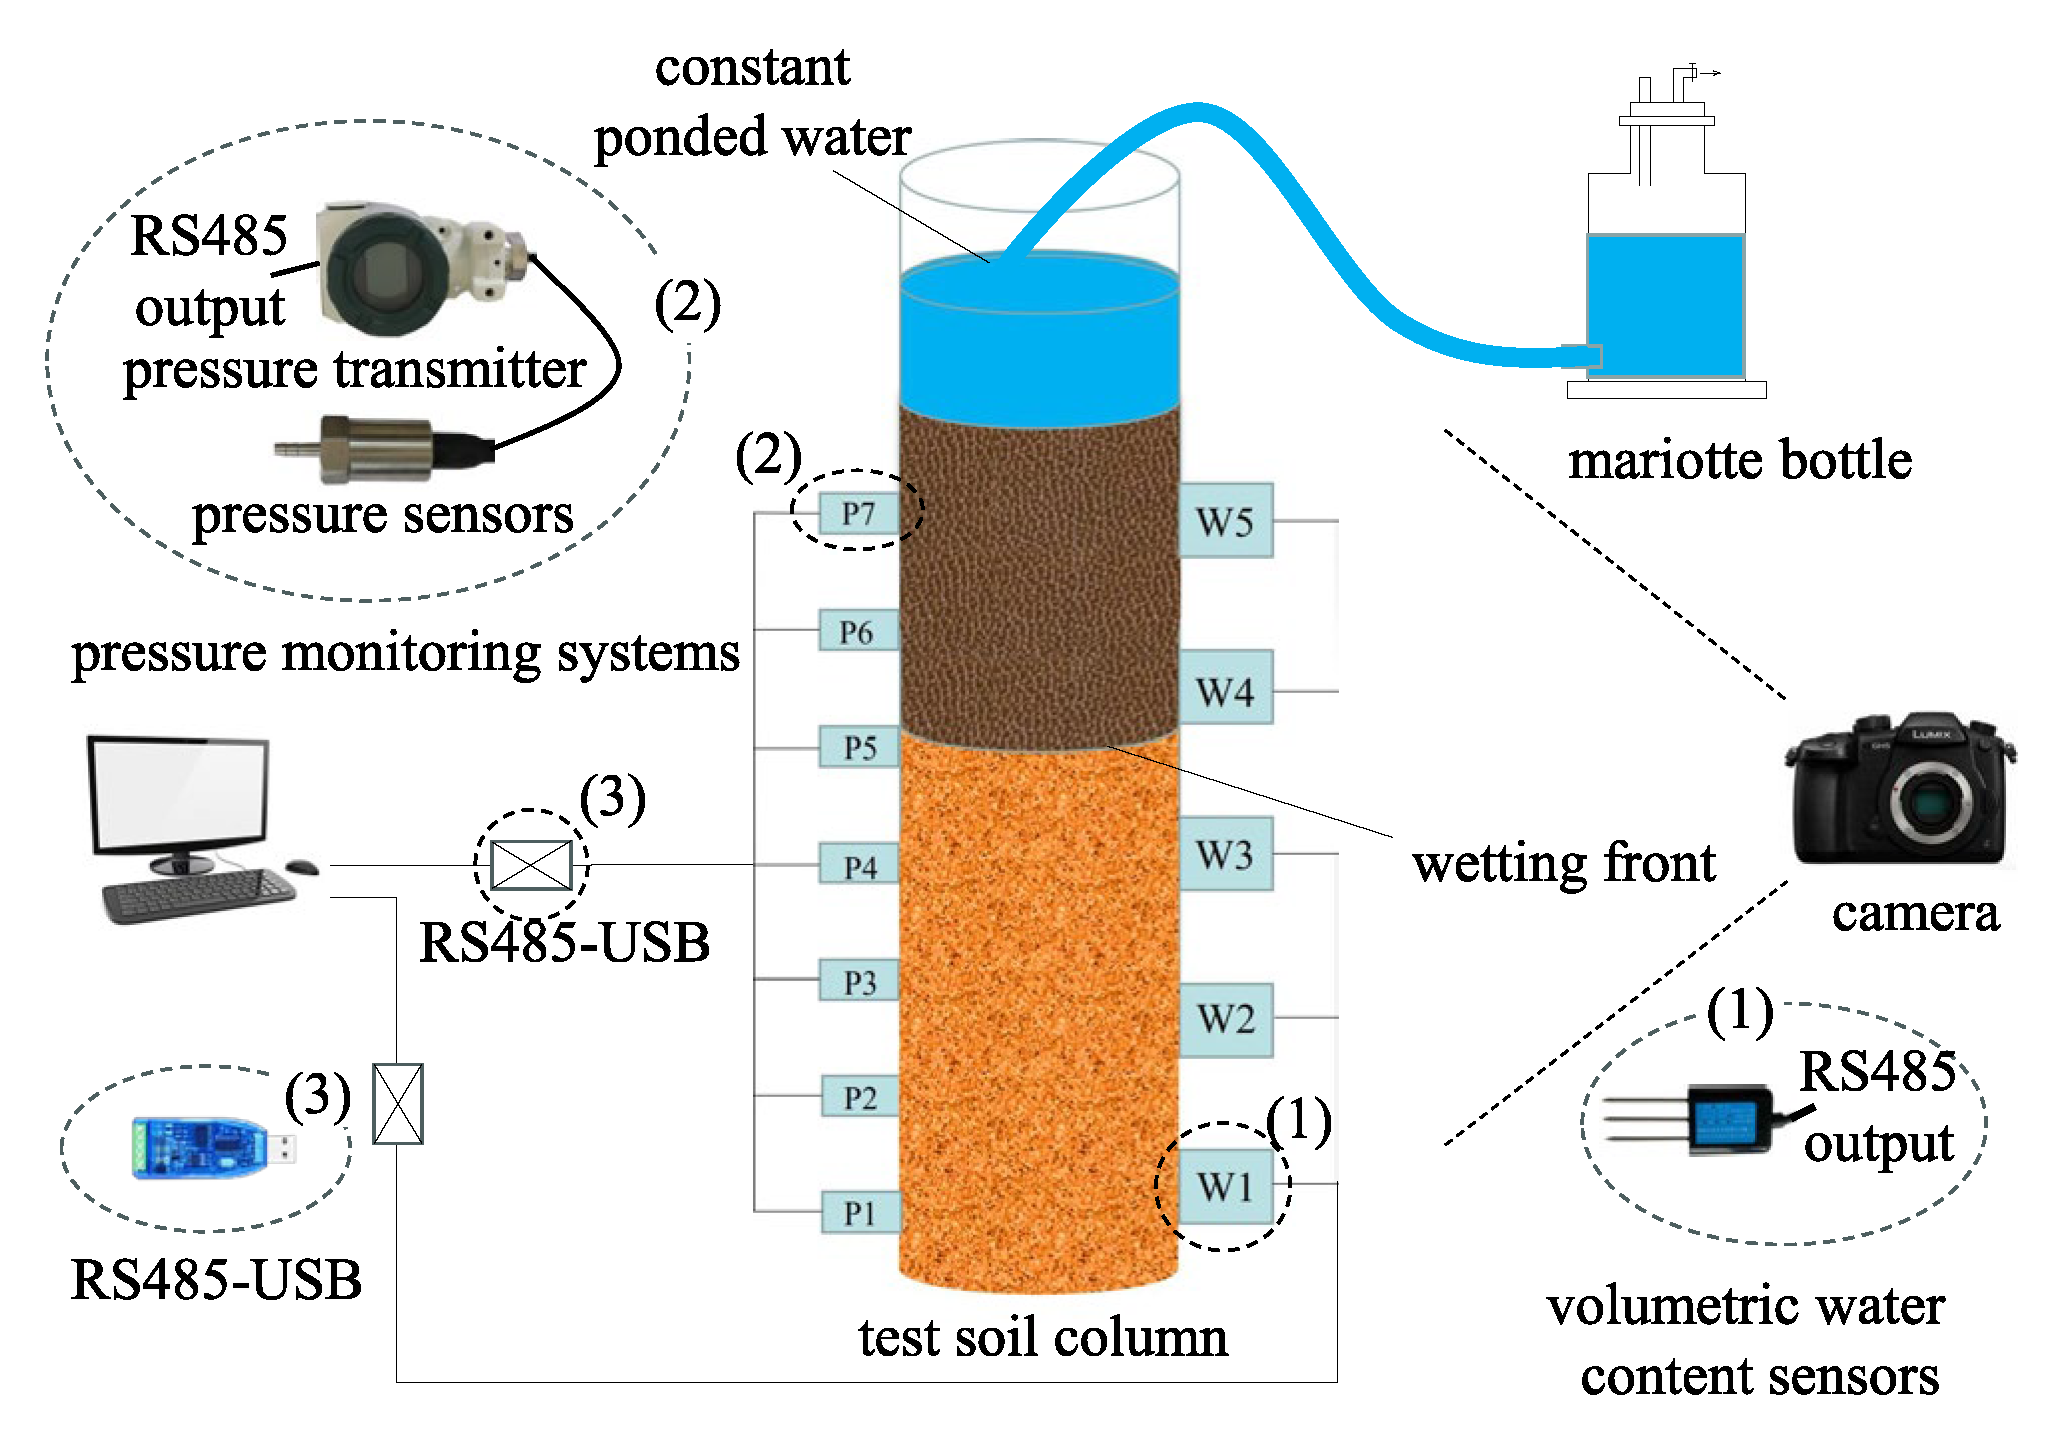
The soil column setup for ponded infiltration tests, which installs pore pressure sensors and volumetric water content sensors, is schematically depicted in Figure 1. The acrylic glass tube has 500 mm in height, 90 mm inner diameter, and 5 mm in wall thickness. The compacted soil column in the tube is 400 mm height and the ponded water depth is a constant 50 mm. A sealed bottom boundary, which differs mainly from the soil column models in cited the literature, was implemented to simulate field-impermeable layers. Two types of sensors were radially installed on the exterior of the soil column: positive pore pressure sensors (P1–P7) and volumetric water content sensors (W1–W5). The pressure sensors were vertically spaced at 50 mm intervals, with the lowermost sensor (P1) positioned 20 mm above the column base. The moisture sensors were installed at 70 mm vertical intervals and at the opposite side of pressure sensors, with the lowest sensor (W1) located 40 mm from the base.
The experimental soil column was compacted into 8 layers, with each compacted layer attaining a controlled thickness of 50 mm post-compaction. Each soil layer was compacted to the target dry density and initial water content specified in the experimental protocol, with the mass of compacted soil controlled to achieve the designated height. Once uniformly compacted, the surface of each layer was scarified to enhance interlayer bonding before compacting the subsequent layer. After the soil column was compacted, the pressure sensors were mounted on the column wall through conduits and positioned flush with the soil surface at their interface, whereas the volumetric water content probes were vertically inserted into predrilled holes to ensure optimal contact with the target medium. Crushed stone layers were installed at the top of the column to prevent disturbance of the soil surface during the application of the water head.

2.2. Sensors and Data Acquisition

The layout of the sensors and the data acquisition circuitry are presented in Figure 2. Pressure sensors consist of two primary components: a sensing element and a transmitter. The positive pore pressure sensors (Model EXP870F, Baoji Zhixing Sensor Co., Ltd., Baoji, China) had a measurement range of 0–100 kPa and a resolution of ±0.1 kPa. The pressure transmitters converted analog signals from the sensors to digital outputs, then the digital data were acquired by RS485 communication and transmitted to a computer through RS485-to-USB converters. Volumetric water content measurements were obtained via VMS-3000-ECTH-N01 sensors (Weimengshi Co., Ltd., Jinan, China) with a 0–100% measurement range, featuring ± 2% accuracy in the 0–50% range and ± 3% accuracy in the 50–100% range. The sensor utilized acid- and alkali-resistant stainless-steel electrodes to determine volumetric water content by measuring changes in soil electrical conductivity, with data transmitted to a host computer via an RS485-to-USB converters. Pressure sensors were calibrated against a static deadweight tester across the 0–100 kPa range at six equidistant points; volumetric water content sensors were calibrated using the testing soil samples with predetermined moisture levels, achieving a regression coefficient (R2) > 0.98.

2.3. Exterior Photographing

To record the test process, especially the wetting front advancing downward, a digital camera was placed in the front of the test device. The Canon EOS 6D Mark II (Tokyo, Japan) high-resolution digital camera was mounted 1.5 m ahead of the experimental device to capture time-lapse images. The EOS utility software (version 3.9.0.0.) was installed on the computer to conduct automatic photographing every 30 s, enabling continuous quantification of wetting front migration dynamics throughout the experiment. The camera was horizontally aligned with the center point of soil column. The ratio of advancing distance to total length of column was calculated by digitalizing in image. Thus, the wetting front advancing distance was measured by the ratio times actual length of soil column (i.e., 400 mm). The measurement times by computer recorded sensor data and external photographing should be synchronized manually by adjusting the start time of computer and Canon camera.

2.4. Experimental Soils

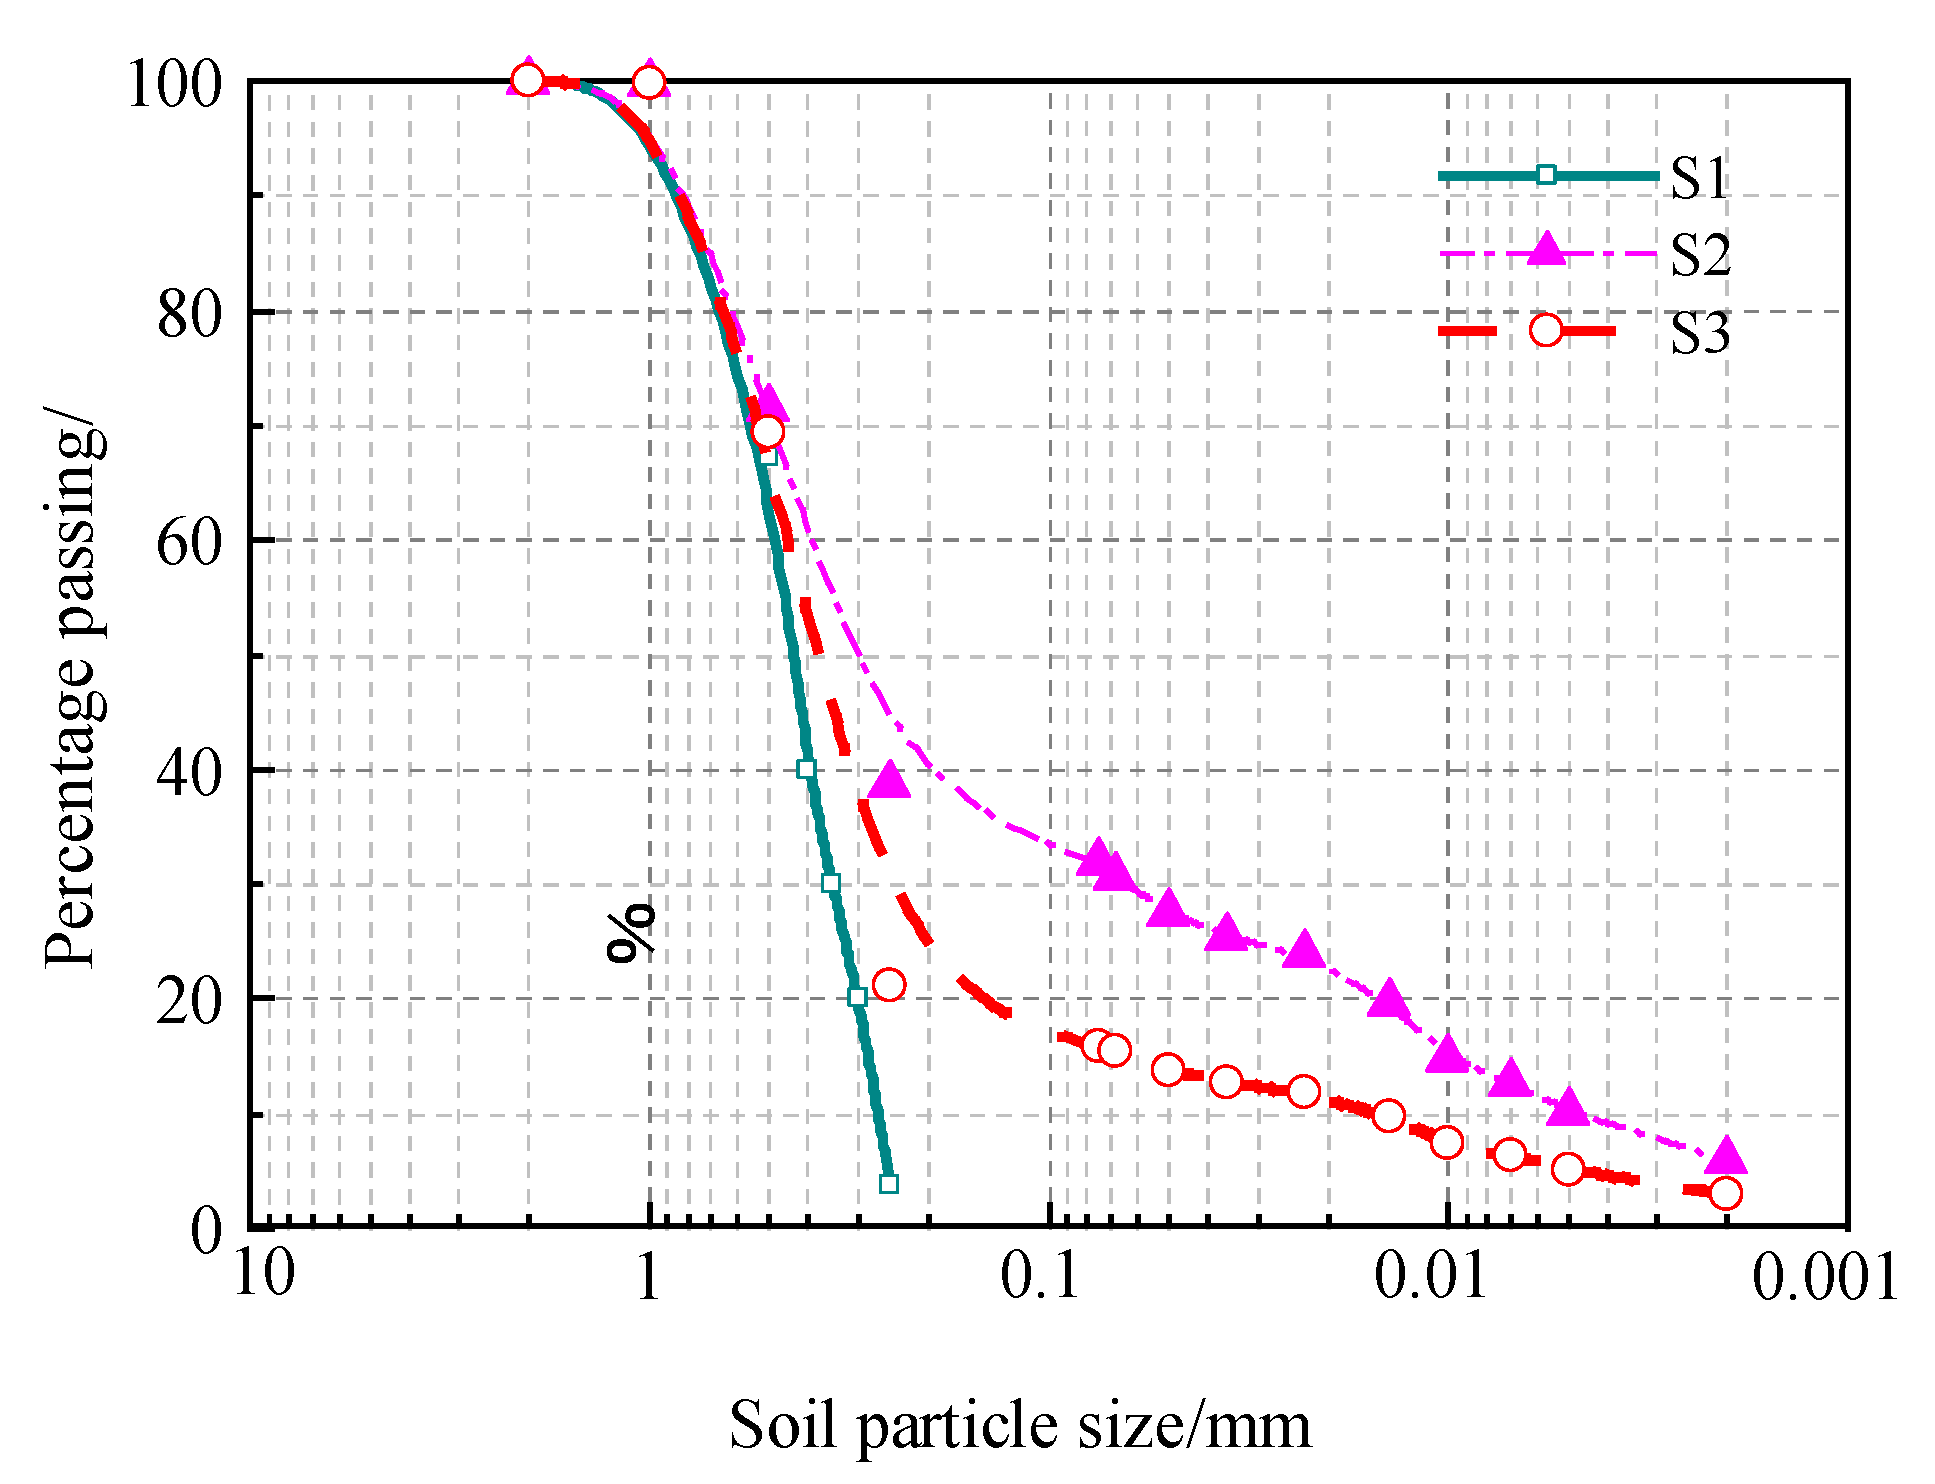
Figure 3 shows the cumulative particle size distribution curves of the three soil types used in this study. The particle size distribution and specific gravity of three types of soil are listed in Table 1. The sample soil S1 is a standard sand specifically designed for the sand-cone density experiment method, with particle sizes ranging from 0.1 to 2.0 mm, particles < 0.25 mm less than 3.9%, and no particles greater than 2.0 mm. Plus a uniformity coefficient (Cu) of 1.8 and a curvature coefficient (Cc) of 1.0. According to the unified soil classification system (USCS), S1 is a poorly graded sand. The soil sample S2, classified as silty sand by USCS, is sampled from the campus of China Three Gorges University. The S2 soil sample contained approximately 32% particles smaller than 0.075 mm, with a uniformity coefficient (Cu) of 78.5 and a curvature coefficient (Cc) of 2.12. The soil sample S3, classified as silty sand by USCS, was prepared by mixing the soil sample S1 and S2 at a dry weight ratio of 1:1, with a uniformity coefficient (Cu) of 30.0 and a curvature coefficient (Cc) of 12.65. The specific gravity (Gs) values of the S1, S2, and S3 sample particles are measured as 2.61, 2.66, and 2.64, respectively. Table 1 presents the soil properties of the three types of soil. Among the three soil types, S1 serves as a standard sand representing clean sandy deposits in natural settings; S2 and S3 are artificially configured samples. Specifically, S2 simulates chalk-bearing sandy soils prevalent in agricultural regions, while S3 represents a textural transition between clean and chalky sands, designed to address texture gaps in the sample set.

2.5. Experimental Scenarios

To investigate the water-air two-phase flow dynamics in sand columns during pond infiltration under multiple initial conditions, the experiment considered three influencing factors: initial saturation, dry density, and clay content, and designed a series of experimental protocols involving three soil types under two initial dry densities (ρd = 1.50 and 1.60 g/cm3) and initial gravimetric water contents (w0 = 0% to 10%). Experimental controls for initial saturation spanned from oven-dried (0%) to unsaturated conditions of 41%, while controls for initial dry density represented loose to moderately compacted states typical of in situ sandy soils. The detailed experimental scheme of the 14 sand column ponded water infiltration experiments is presented in Table 2.
When each test scenario was well prepared, the constant water head was applied to initiate the experiment, while the computer was activated to collect data from pressure and volumetric water content sensors, and images were captured to record the experimental process. The experiment was terminated when the wetting front reached the base of the soil column and all sensor readings stabilized. All tests were carried out at a constant ambient temperature of 25 ± 2 °C.

3. Results

3.1. Data Processing

Since the saturated volumetric water content associated with different soil types and the measured volumetric water content has a different scale, the saturation of the soil is chosen as a normalized variable for data analysis. According to the mass-volume relationship of soil, the initial dry density (ρd0) is related to the specific gravity (Gs) and initial void ratio (e0), as shown in Equation (1). The volumetric water content (θ) is defined in Equation (2) and it is ρd/ρw times the gravimetric water content (ω). If no volume change occurs, the volumetric and gravimetric water content has a linear correlation. The saturated volumetric water content (θsat) is defined in Equation (3). It is equal to porosity (n) and can be calculated by ρd and Gs. For sand, assume the volume change is none during seepage process, thus the void ratio (e) remains constant as e0 and the ρd and θsat will keep constant at the end of the tests. The saturation (Sr) of the soil is defined in Equation (4). During the test, the volumetric water content (θ) is measured by sensor and the corresponding saturation (Sr) can be obtained by dividing the constant saturated volumetric water content.
ρ d 0 = m s V 0 = G s ρ w 1 + e 0
θ = V w V = ω G s 1 + e = ω ρ d ρ w
θ s a t = V v V = e 1 + e = n = 1 ρ d G s ρ w
S r = V w V v = θ θ s a t
where ms is the mass of the soil particles, V0 is the initial volume of the soil sample, ρw is the density of the water, e0 is the initial void ratio, Vv is the void volume of the soil sample, and Vw is the water phase volume of the soil sample.
For the test case #2, the specific gravity Gs is 2.61, the initial gravimetric water content ω is 8.0%, and the initial dry density ρd is 1.50 g/cm3. Then, the initial void ratio e0 is 0.74 by Equation (1), the initial volumetric water content θ is 0.12 by Equation (2), the saturated volumetric water content θsat, the same as porosity n, is 0.43 by Equation (3), and the initial saturation Sr is 28% as shown in Table 2. In the same way, the test results are processed and shown in the following parts.

3.2. Wetting Front

The wetting front was monitored via two approaches in this experiment. The movement of the external wetting front was monitored by the digital camera photographing, while the internal wetting front dynamics were tracked via volumetric water content sensors.
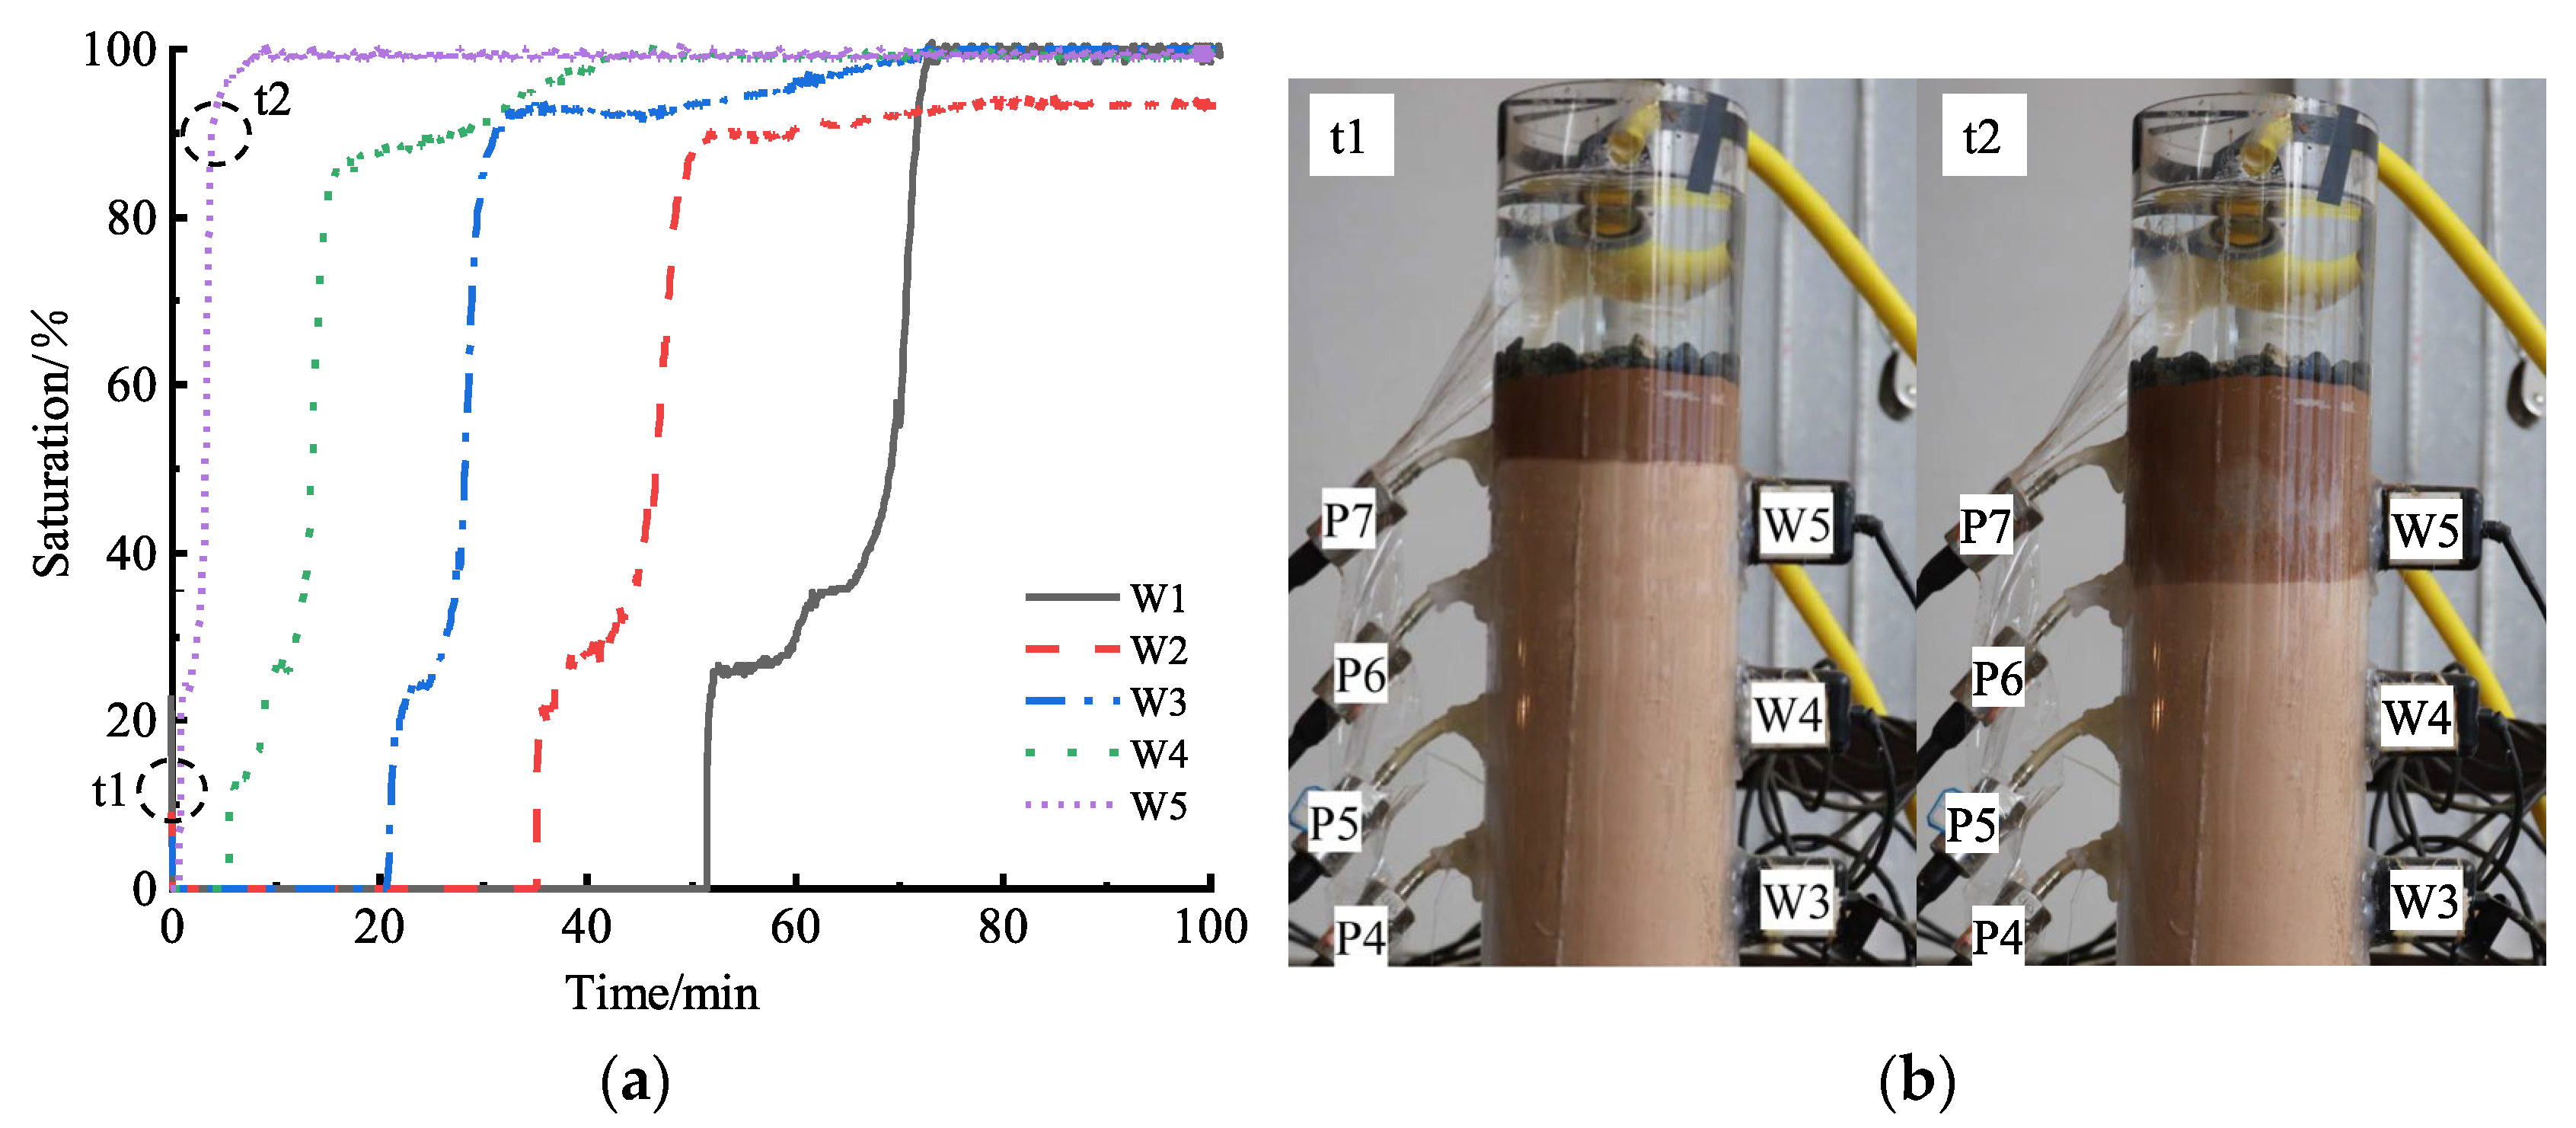
Using the measured volumetric water content from sensors, the saturation was calculated and a typical saturation-time curves of experiment #3 were plotted, as shown in Figure 4a. When the wetting front advances in a dry sand column, the saturation is sensitive to water content variation. It often surges with time during infiltration. The saturation level within 50% to 70% is selected as the wetting front arrival time for analysis.
As illustrated in Figure 4a, during ponded water infiltration, the wetting front advanced downward and the soil column’s saturation exhibited a sequential response from top to bottom. Since the volumetric water content sensor could only measure the average water content of surrounding soil mass, the measured volumetric water content varied with the advancing rate of the wetting front. At the time of wetting front approaching a sensor, the sensor increased from 0% to 20%, as shown in Figure 4b at time t1. When the wetting front went through the sensor measured region, the saturation increased from 20% to 70% or 80%, as shown at time t2 in Figure 4b. After the wetting front passed the sensor, the saturation kept constant or slightly increased to near 100%. The range of 50–70% corresponds to the midpoint of this abrupt surge, at which point the wetting front is completely established at the sensor position. Within this saturation range, the soil transitions from a predominantly unsaturated state to a near-saturated state, with majority of the pore spaces filled by infiltrating water. Therefore, this study uses the increment in saturation as one of the criteria for identifying wetting front advancement.
In contrast, the movement of the wetting front visualized from outside is monitored by the high-definition digital camera in this study. In relatively high initial saturation conditions, the low color contrast in the images captured by the camera makes identifying the progression of the wetting front difficult. Thus, it has merits to use a volumetric water content sensor for determining the wetting front’s advancement in laboratory tests.
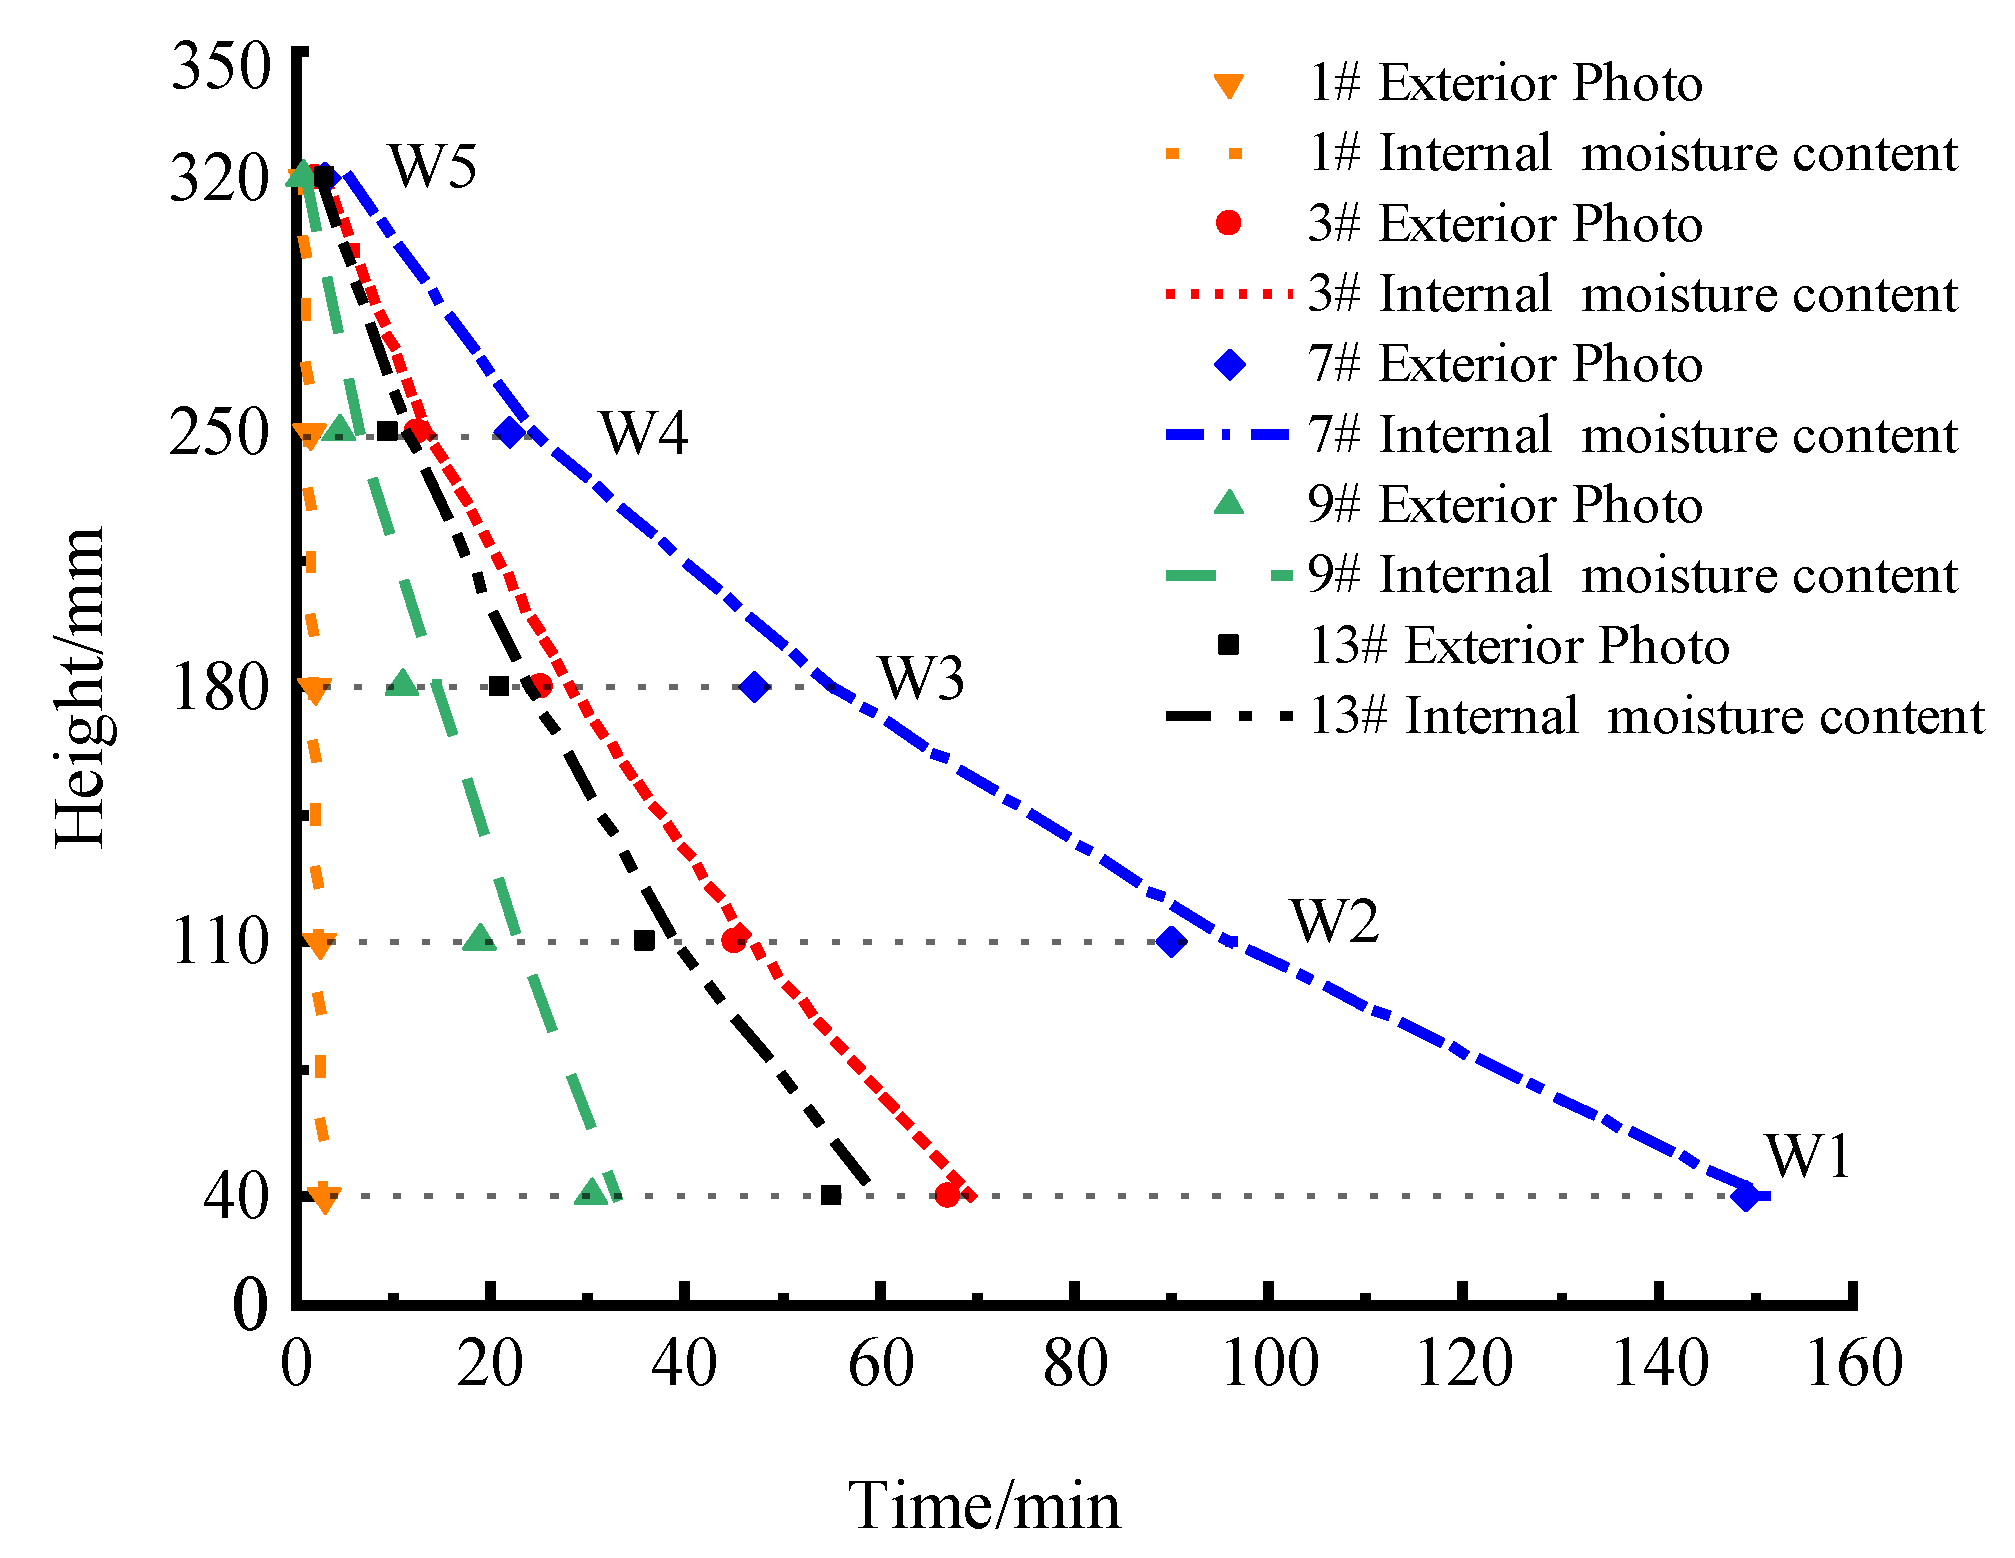
The wetting front position versus time curves for representative soil types S1, S2, and S3 at initial dry densities of 1.50 g/cm3 and 1.60 g/cm3, respectively, with all initial saturations of 0%, are presented in Figure 5.
Figure 5 demonstrated that the advancing trends of both the external and internal wetting fronts are consistent. For experiment #3 (S2 soil sample, initial dry density of 1.50 g/cm3, initial saturation of 0%), the correlation coefficient between the internally and externally monitored wetting front data was 0.99, indicating a strong linear relationship. Similarly, in experiments #9 and #13, the correlation coefficient between the internal and external wetting front monitoring data was 0.98. While in experiment #1, there is almost no difference between the internal and external wetting fronts due to the extremely fast infiltration rate of the pure sand column.
With a correlation coefficient of 0.95 for the positional changes in the two observed fronts, the advancement of the internal and external wetting fronts has a slight difference mainly caused by the boundary effect. As in experiment #7, the S2 soil sample had a dry density of 1.60 g/cm3, and the maximum time difference between the internal and external wetting front movements was 8 min. When the initial water content of the soil is high, the color contrast between the soil ahead of and behind the wetting front becomes minimal, rendering external observation of the wetting front challenging. In such cases, monitoring the wetting front position through changes in internal soil saturation is a viable alternative. As shown in Figure 5, the external wetting front generally progresses faster than the internal wetting front in some positions. This discrepancy is attributed primarily to the combined effects of friction between the soil column and the container walls and entrapped air bubbles within the soil, and both effects hinder water infiltration. The specific influence of the air phase resistance on water infiltration is discussed in detail later in this paper. In addition, the time for the wetting front to reach the bottom of the column shortens as the initial dry density and water content decrease, and prolongs as both increase.

3.3. Analysis of the Pattern of Pressure and Saturation Variation

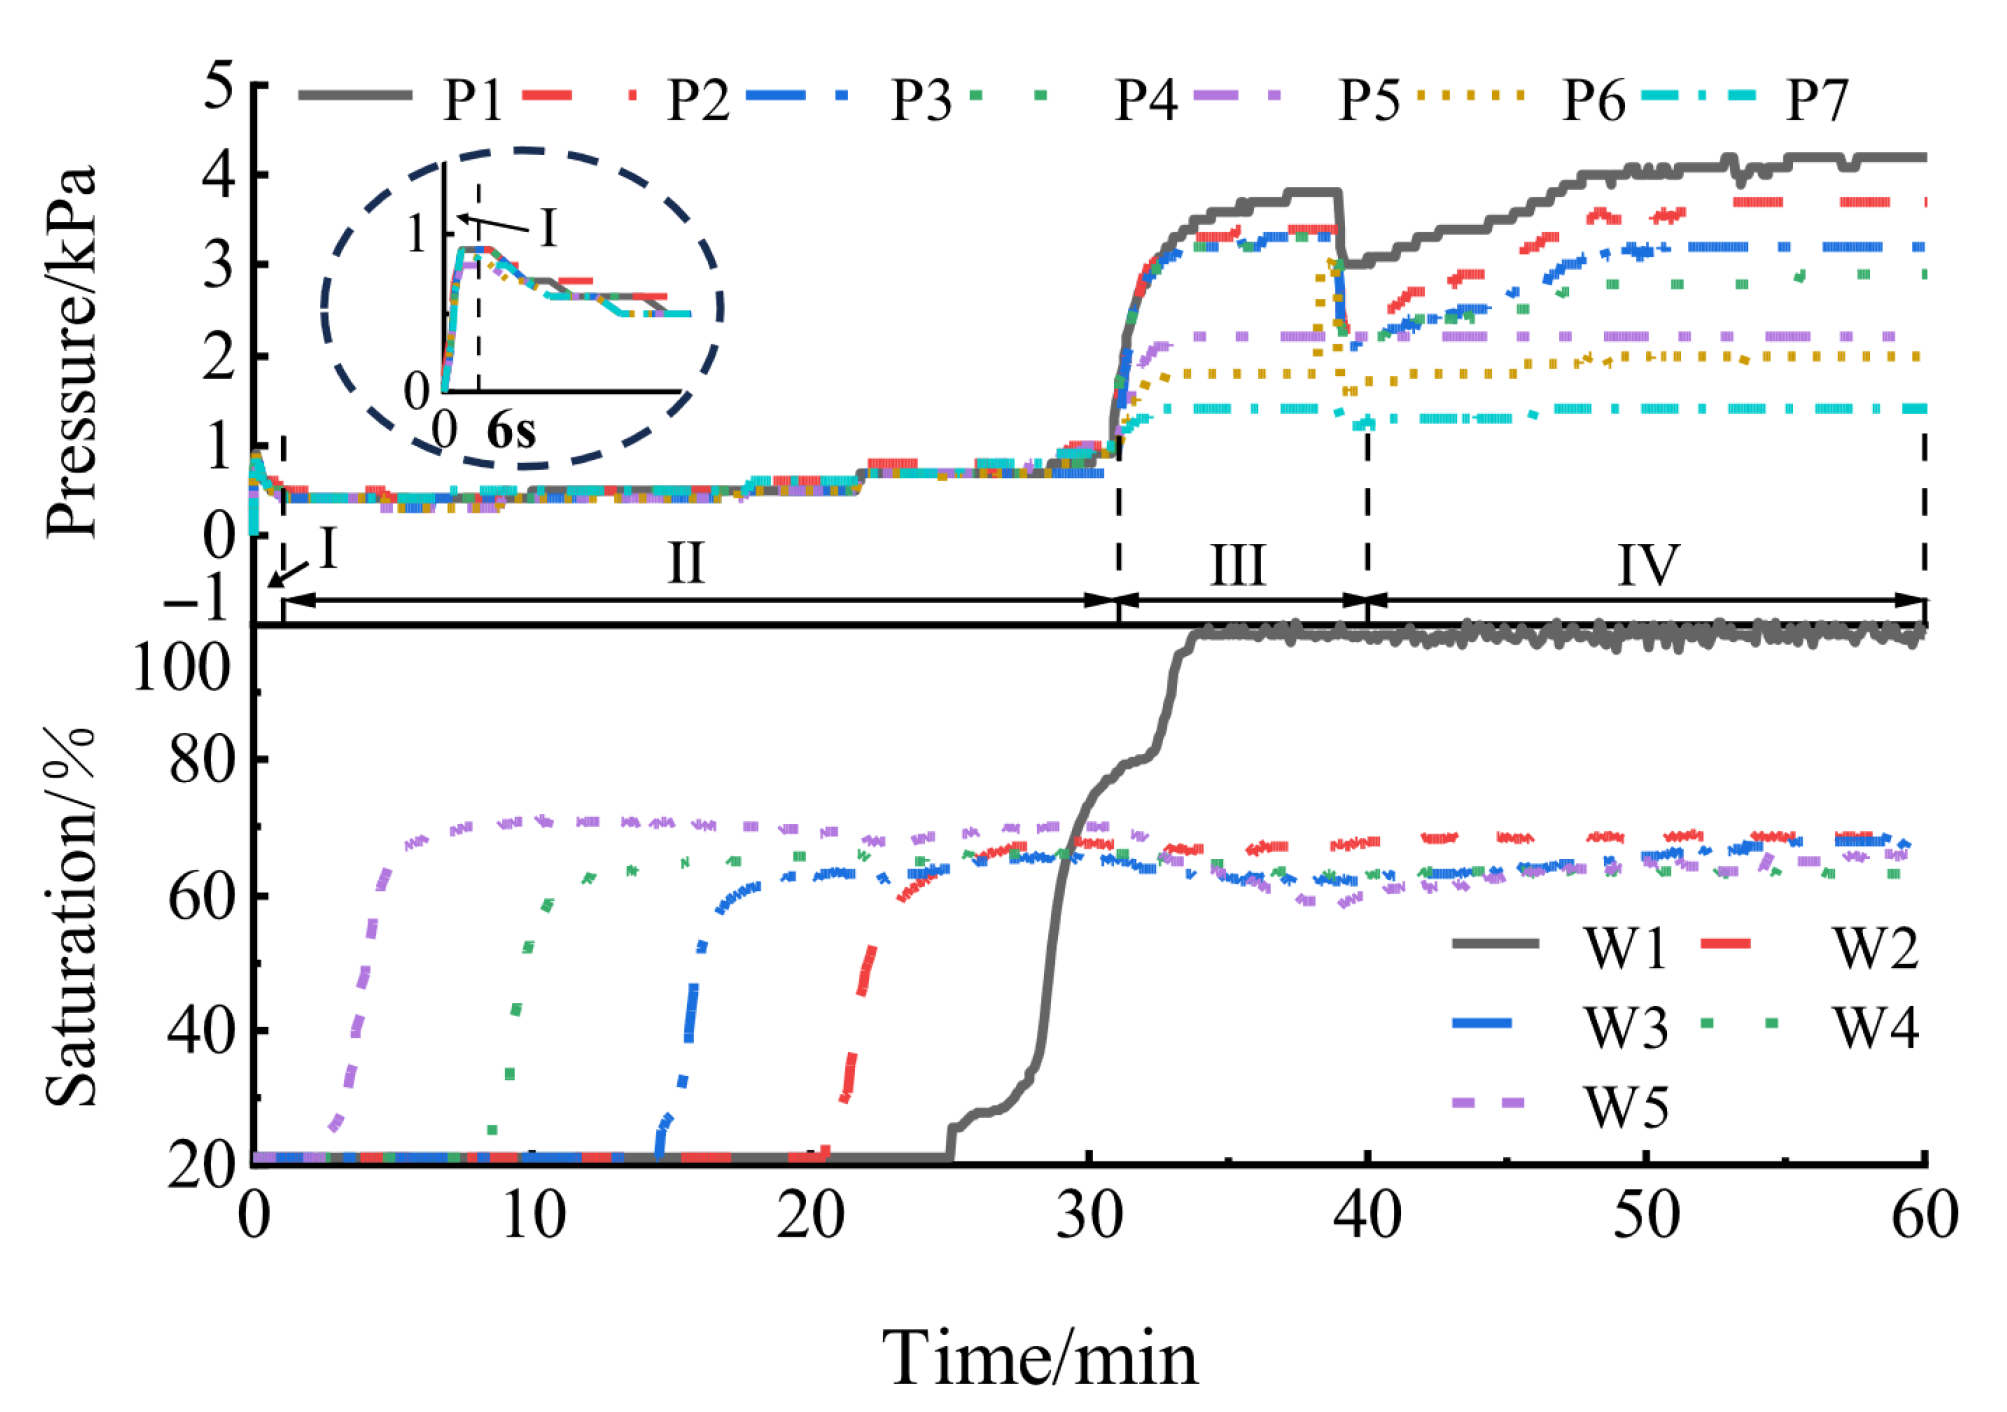
During the infiltration process, both the pore pressure and saturation within the soil column exhibited notable variations. This study selected the experiment #4 of the S2 soil sample with a dry density of 1.5 g/cm3 and an initial saturation of 21% as a representative case to show the dynamic changes in pressure and saturation. As shown in Figure 6, according to the variation in pore pressure during the infiltration process, the ponded infiltration process can be clearly divided into four distinct stages.
  • Stage I: Pressure soars under ponded water applied. This stage occurs instantaneously upon the application of a water head. Owing to the initial unsaturation conditions and enclosed boundary, air phase was entrapped in the soil column. Upon application of the water head, the pressure readings from the P1 to P7 sensors all rose simultaneously within an extremely short time from 0 kPa to 1.0 kPa. The selected time span of Stage I (i.e., 30 s, 18 s, 24 s, 6 s, 18 s, 15 s, 12 s, 48 s, 24 s, and 36 s) is statistically analyzed. The average value is 23.1 s and the standard deviation is 12.3 s. The measured pore pressure is pore air pressure which reflects the top-layer pore water pressure resisted by pore air pressure. This phenomenon occurs because the wetting front advances rapidly downward immediately after water head application, forming a water column of approximately 100 mm that transmits pressure to the sensors. Under this depth, the continuous air phase is compressed by the infiltrating water phase, forming a transient air pressure barrier that hinders the further rapid infiltration of the water phase. Since the W5 sensor is located approximately 150 mm from the water head surface, no water content change is detected during the first stage. Overall, the first stage is characterized by a linear increase in internal pore air pressure within the soil column following the application of a ponded water boundary at its top, driven by the transmission of external pressure.
  • Stage II: Pressure ascends gently as the air is expelled to the lower part of the soil column. This stage is characterized by the gradual advancement of the wetting front to the bottom of the soil column. The pressure initially decreases rapidly 0.2–0.4 kPa at the beginning of this stage, then gently increases with the advancing of wetting front. This fact is related to top air breakthrough at the beginning of this stage. The air phase under the wetting front is expelled and compressed. Part of the air phase finds a path and scape from the top of the water head, which causes a temporary pore air pressure release. As the wetting front advances, the originally connected air phase is continuously expelled to the lower part and slightly compressed. When wetting front continuously moves downward, the air phase is partitioned into two parts. The main part is continuous air phase and the remaining part is entrapped air bubbles which are discontinuous in the soil void. In this stage, it is hard to distinguish whether the pore pressure sensor is monitoring the continuous air pressure or the pressure of the entrapped bubble. Those two parts of air phase both significantly hinder the water infiltration. With the existence of the entrapped air phase, the measured volumetric water content is much less than the saturated value θsat and the calculated saturations of W2–W5 sensors are about 70%.
  • Stage III: Pressure surging with air breakthrough. This stage is generally characterized by the air bubbles releases from soil and pore air pressure as fluctuation with the wetting front approaching the bottom of the soil column. During this stage, the pore air pressure first increases; once it reaches a certain critical value, it decreases rapidly by a certain margin. The drop of pore pressure is statistically analyzed by selected test cases. Excluding the cases of none Stage III, the typical air breakthrough pressure drop is listed as 1.2 kPa, 1.8 kPa, 0.5 kPa, 0.2 kPa, 0.9 kPa, 0.3 kPa, and 0.4 kPa. The average value of these data is 0.8 kPa, and the standard deviation is 0.6 kPa. As the air counterflow passes the upper volumetric water content sensor, the measured saturation also has a mild response. It first decreases slightly locally and then increases. Analysis of the W1 curve indicates that the saturation of the soil sample near the W1 water content sensor had approached 80% before the start of Stage III, meaning the wetting front had already neared the bottom of the soil column prior to this stage. Due to the imposition of a certain initial saturation, the soil column contained a certain amount of confined air bubbles before the application of the water head. In Stage II, the pressure within the soil had not yet reached the threshold for bubble emission, so the air moved toward and accumulated at the bottom under the drive of the wetting front. As the wetting front advanced close to the bottom of the soil column, the air pressure reached the critical value (the air pressure required to drive entrapped bubbles to break through the water phase and escape from the soil column), causing the confined air bubbles at the bottom of the soil column to be expelled outward under internal pressure, which hindered the infiltration of the water phase. Meanwhile, as the confined bubbles were expelled, the water phase rapidly filled the voids left by the bubbles, leading to a certain decrease in pressure at the end of Stage III. With the further advancement of the wetting front, the confined bubbles at the bottom were pushed upward by the water phase, resulting in a slight decrease in saturation. After some bubbles were expelled, the water phase filled their voids, leading to a certain increase in saturation. However, due to the relatively high proportion of fine particles in the S2 soil sample, it is difficult for bubbles to escape on a large scale, and they only migrate slowly in the form of dispersed small bubbles. Thus, the fluctuation in saturation is hard to identify. In the case #4, the saturation of W5 during this stage—approximately 65% at 32 min, 57% at 38 min, and 66% at 40 min—can confirm this conclusion.
  • Stage IV: Pressure tends to stabilize. This stage is characterized by the whole column gradually approaching saturation and the pore water pressure steadily increasing with the groundwater table gradually rising. As infiltration approaches its final stage, confined air bubbles are unable to find pathways for escape and become compressed within soil voids. Concurrently, the wetting front reaches the soil column bottom, the groundwater table rises, and the continuous pore water pressure occurs. Owing to the closed boundary conditions at the column’s base and sides, seepage tends toward a steady state. At this stage, the monitored pore pressure is shifted from previous pore air pressure to current pore water pressure and the pressure exhibits a gradient distribution. The soil column approaches saturation, while the air saturation is close to the residual air saturation [32]. As shown in Figure 6, the measured pore water pressure of lowest pore pressure sensor P1 is 4.2 kPa, which is equal to theoretical hydrostatic pressure at a depth of 430 mm (4.2 kPa).
The characteristics of the four stages are summarized from the analysis of pore pressure in 14 ponded infiltration experiments under different initial conditions. For soil types under other conditions, certain variations occur in the four stages, which are analyzed in detail in the following sections.

3.4. Effect of Different Initial Saturation Levels on Infiltration

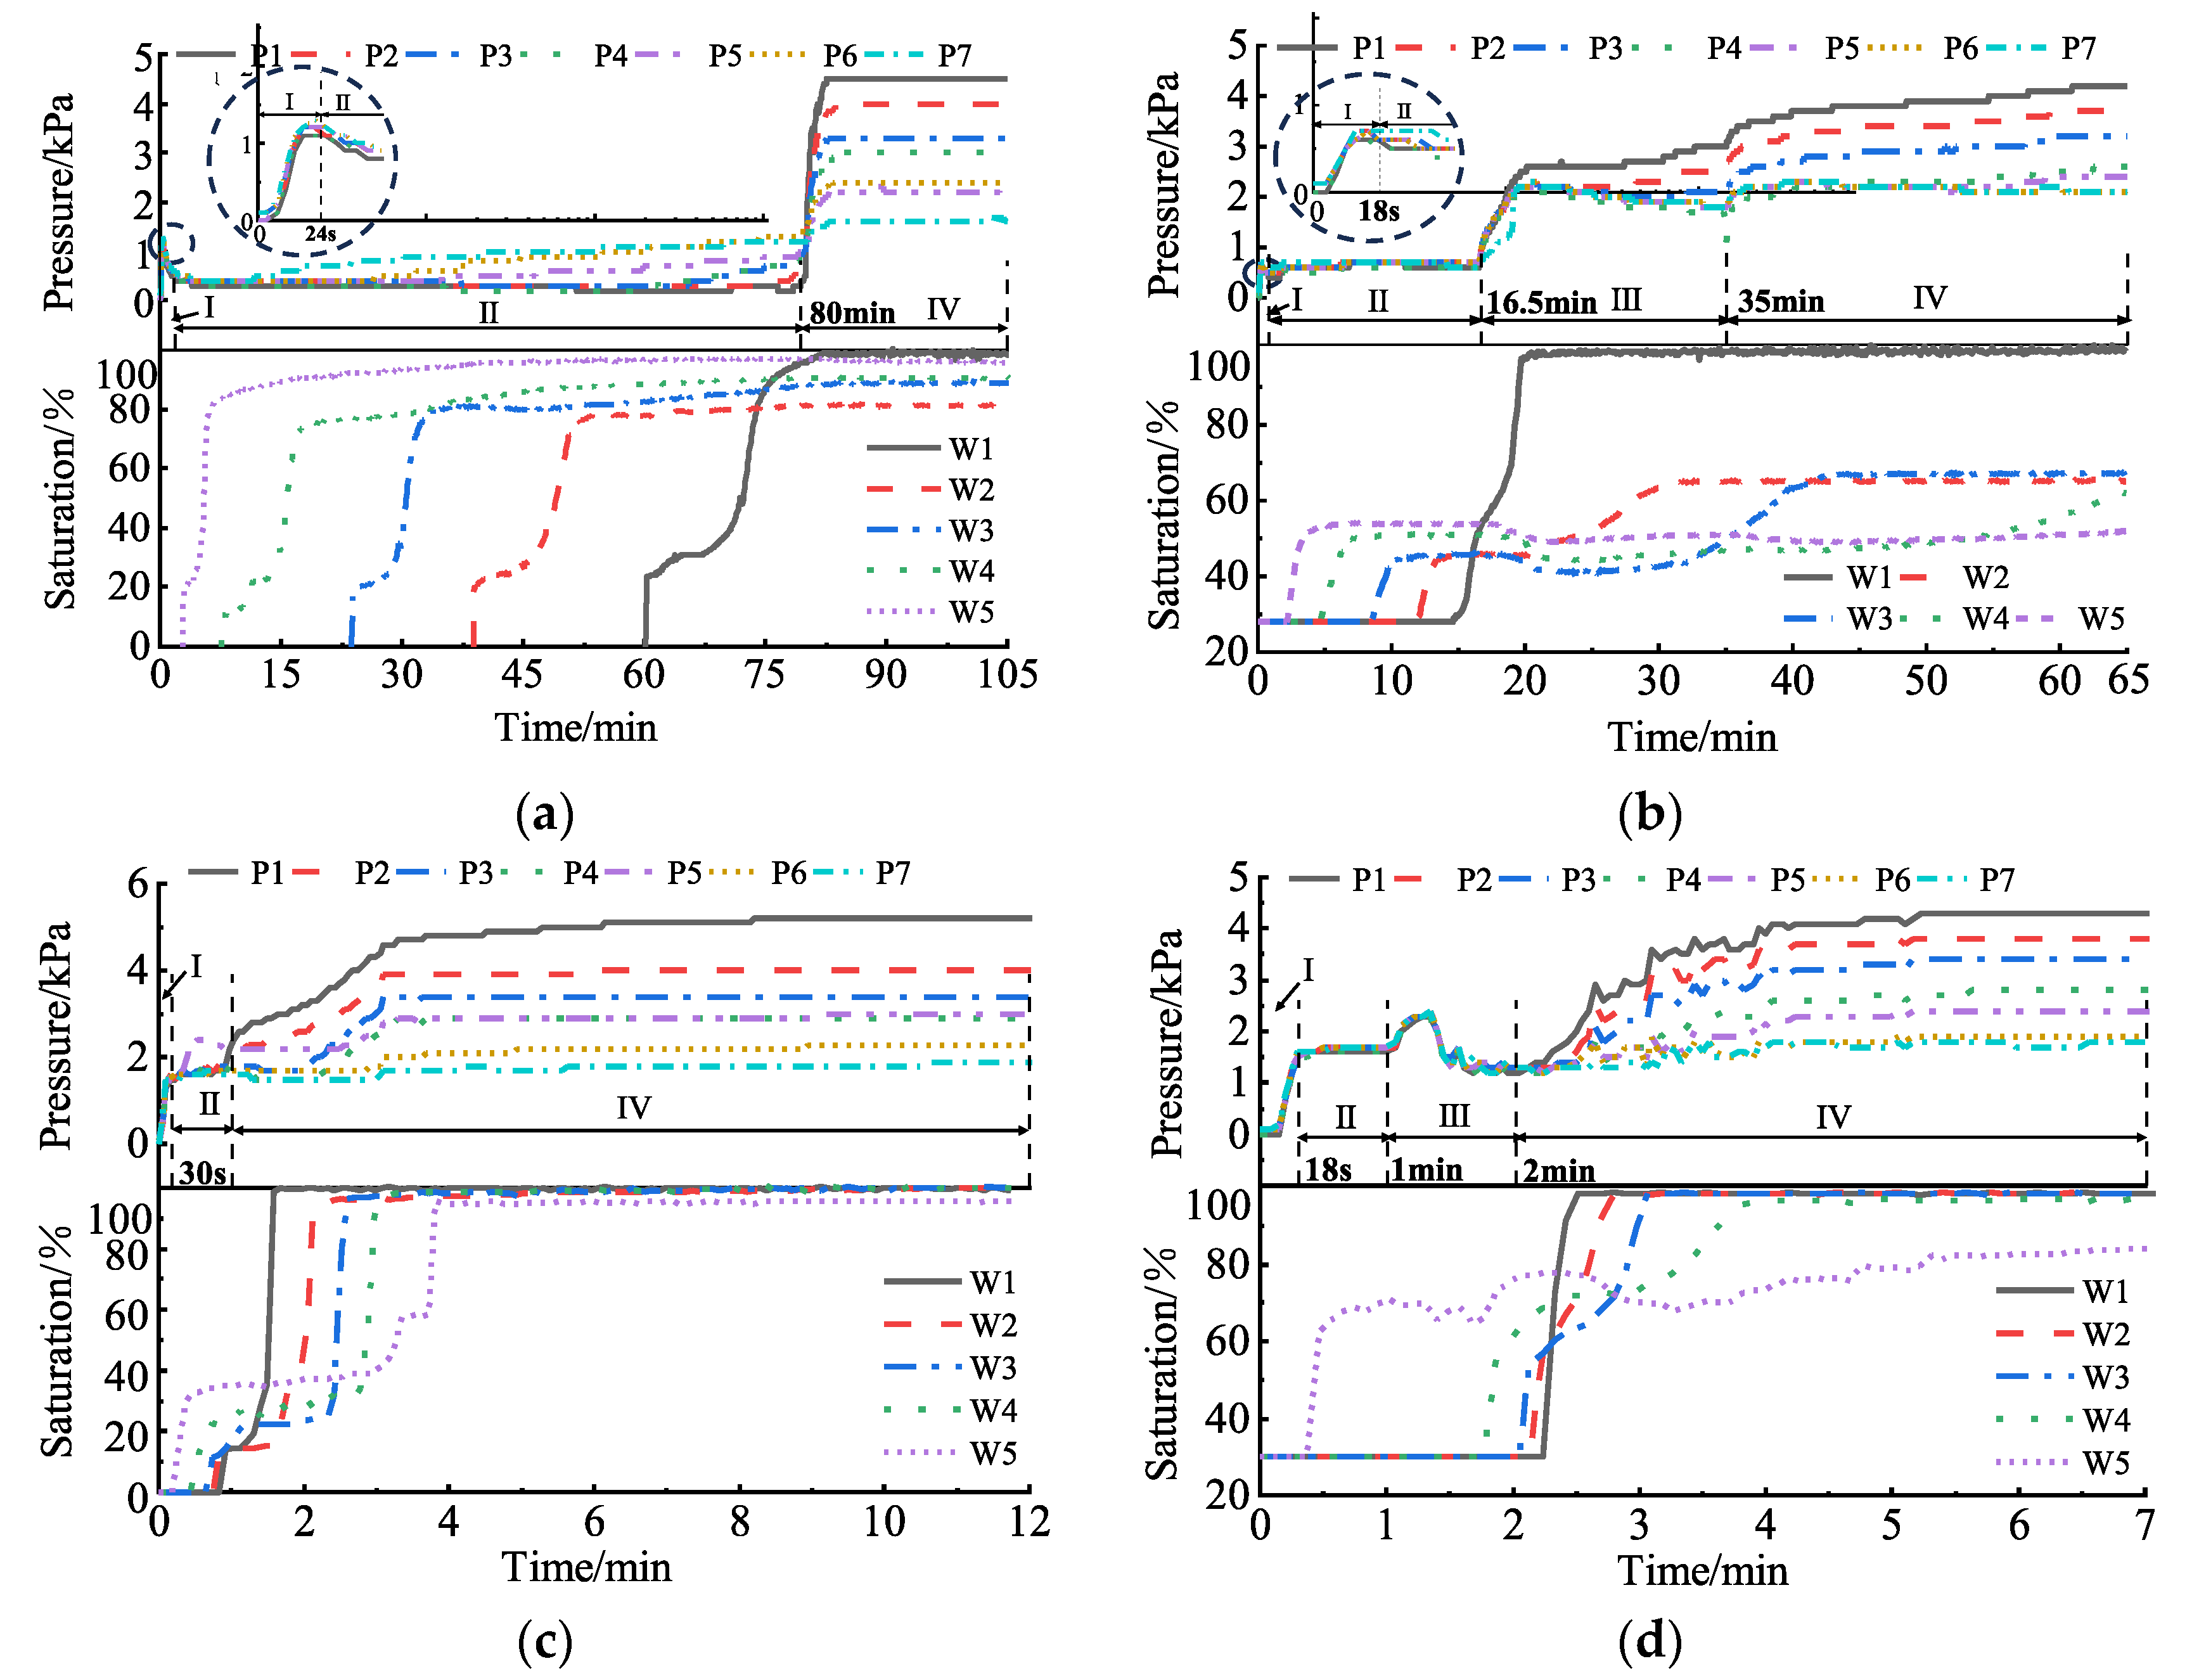
To investigate the effects of different initial saturations on infiltration, S2 (with the most proportion of fine particles) and S1 (pure sand) are selected and corresponding results of experimental cases #3, #5, #1, and #2 are shown in Figure 7. These cases are chosen because they clearly illustrate the infiltration resistance effect of entrapped air bubbles. As shown in Figure 7a,b, when the initial saturation is 0%, the infiltration process of the soil column does not include Stage III. In contrast, when a certain initial saturation is applied, Stage III occurs during the infiltration process. This shows that in the case of initial dry conditions the air phase is continuous and easily moves and finds a breakthrough path to escape. In the case of initial saturation of 28%, soil particles are pre-wetted by water and menisci are formed in soil voids which blocks the main air/water flow path. Thus, the air phase is hard to be entrapped and compressed by the wetting front at the lower part of soil column.
As the wetting front advances during Stage II, the water phase gradually displaces the air phase, causing most of the air to be expelled in this stage. By Stage III, only a small portion of the air remains in the soil column as partially connected or entrapped air bubbles, which are unable to break through the top water head and emerge. Thus, when the initial saturation is 0%, Stage III does not occur. When the initial saturation is about 28%, the soil column is assumed to contain an air phase that is not connected to the atmosphere at the start of the experiment, with entrapped air bubbles predominating in the air phase. Before Stage III began, the wetting front nearly reached the base of the soil column. As the air pressure accumulates to a critical threshold, entrapped air bubbles are expelled outward under internal pressure, hindering water infiltration and triggering the emergence of Stage III.
Figure 7a,b show the increase in pressure during Stage I: when the initial saturation is 0%, the pressure value in Stage I exceeds 1 kPa, whereas it falls below 1 kPa when the initial saturation is 28%. However, as shown in Figure 7d, when soil sample S2 has a dry density of 1.5 g/cm3 and an initial saturation of 28%, the peak pressure increase during Stage I exceeds 1 kPa. This is because when the initial saturation is 0%, upon applying the water head at the beginning of the experiment, the water phase rapidly displaces the air phase in the top 50 mm of soil, leading to the formation of a continuous water column exceeding 100 mm in height. This column transmits a pressure greater than 1 kPa to the pressure sensor via the water phase. When the initial saturation is greater than 0%, menisci form in the small pores between particles, and capillary tension hinders the rapid infiltration of the water phase. This prevents the water phase from forming a water column taller than 100 mm in the short term, resulting in a pressure sensor reading of less than 1 kPa. In Figure 7d, the peak pressure at the end of Stage I reached 1.5 kPa even when a nonzero initial saturation was present. This is because soil sample S1 is a pure sand sample: the instantaneous application of the water head triggers extremely rapid infiltration of the water phase, which rapidly saturates the top approximately 100 mm of the soil column and forms a 150 mm-tall water column that transmits pressure to the sensor. In comparison with soil sample S2, the pure sand column (Figure 7d) has the larger pores. The ponded water goes deeper in the soil column and applies about 0.8 kPa higher pore pressure than that in S2 test cases (Figure 6 and Figure 7d).
In the case of Figure 7b, the pressure variation pattern in Stage III differs from those in Figure 6 and Figure 7d, with no rapid drop observed after the pressure peak. This is because the S2 soil sample has a high proportion of fine particles, which fragment air bubbles into dispersed micro-bubbles. These micro-bubbles cannot form continuous air flow channels, resulting in a gradual rather than abrupt escape process. Additionally, the high initial saturation in Figure 7b weakens the connectivity of the air phase; when the pressure reaches its peak in Stage III, bubbles tend to escape individually rather than in a concentrated manner. When comparing Figure 7a,b under the S2 soil sample with a dry density of 1.5 g/cm3, the duration of Stage I is approximately 6 s longer for an initial saturation of 0% compared with 8%. Similarly, under the conditions of Figure 7c versus Figure 7d, Stage I takes approximately 12 s longer, indicating that as the initial saturation increases, the effect of external pressure transmission weakens, and the air resistance becomes more pronounced. When comparing Figure 7a,b, the duration of Stage II in Figure 7a is approximately 63 min longer than that in Figure 7b. Similarly, Figure 7c shows a longer Stage II duration than Figure 7d does. These results indicate that as the initial saturation increases, the hindering effect of local air phase compression on the water phase diminishes. When comparing Figure 7a,b, the duration of Stage IV is 5 min shorter for an initial saturation of 0% than for 8%. This indicates that as the initial saturation increases, the hindering effect of entrapped air bubbles on hydrostatic pressure transmission intensifies. Comparing Figure 7c,d, Figure 7c reaches saturation significantly faster than Figure 7d in Stage IV, corroborating this conclusion.
This observation is consistent with the study by Wang et al. [3], where they found that the trapped bubbles in unsaturated soil would significantly affect water seepage by causing pressure fluctuations. Current research further clarifies that Stage III will only occur when the initial saturation is greater than 0%. It is also consistent with the research by Siemens et al. [12], who emphasized that poor air connectivity would trigger air compression. The current study shows that the initial saturation is a key factor for air counterflow. When the initial saturation is close to 0%, continuous gas phase is easily released, while when the initial saturation increases, isolated bubbles will form, and those bubbles require a critical pressure to break through as mentioned in [4,5].

3.5. Effect of Different Dry Densities on Infiltration

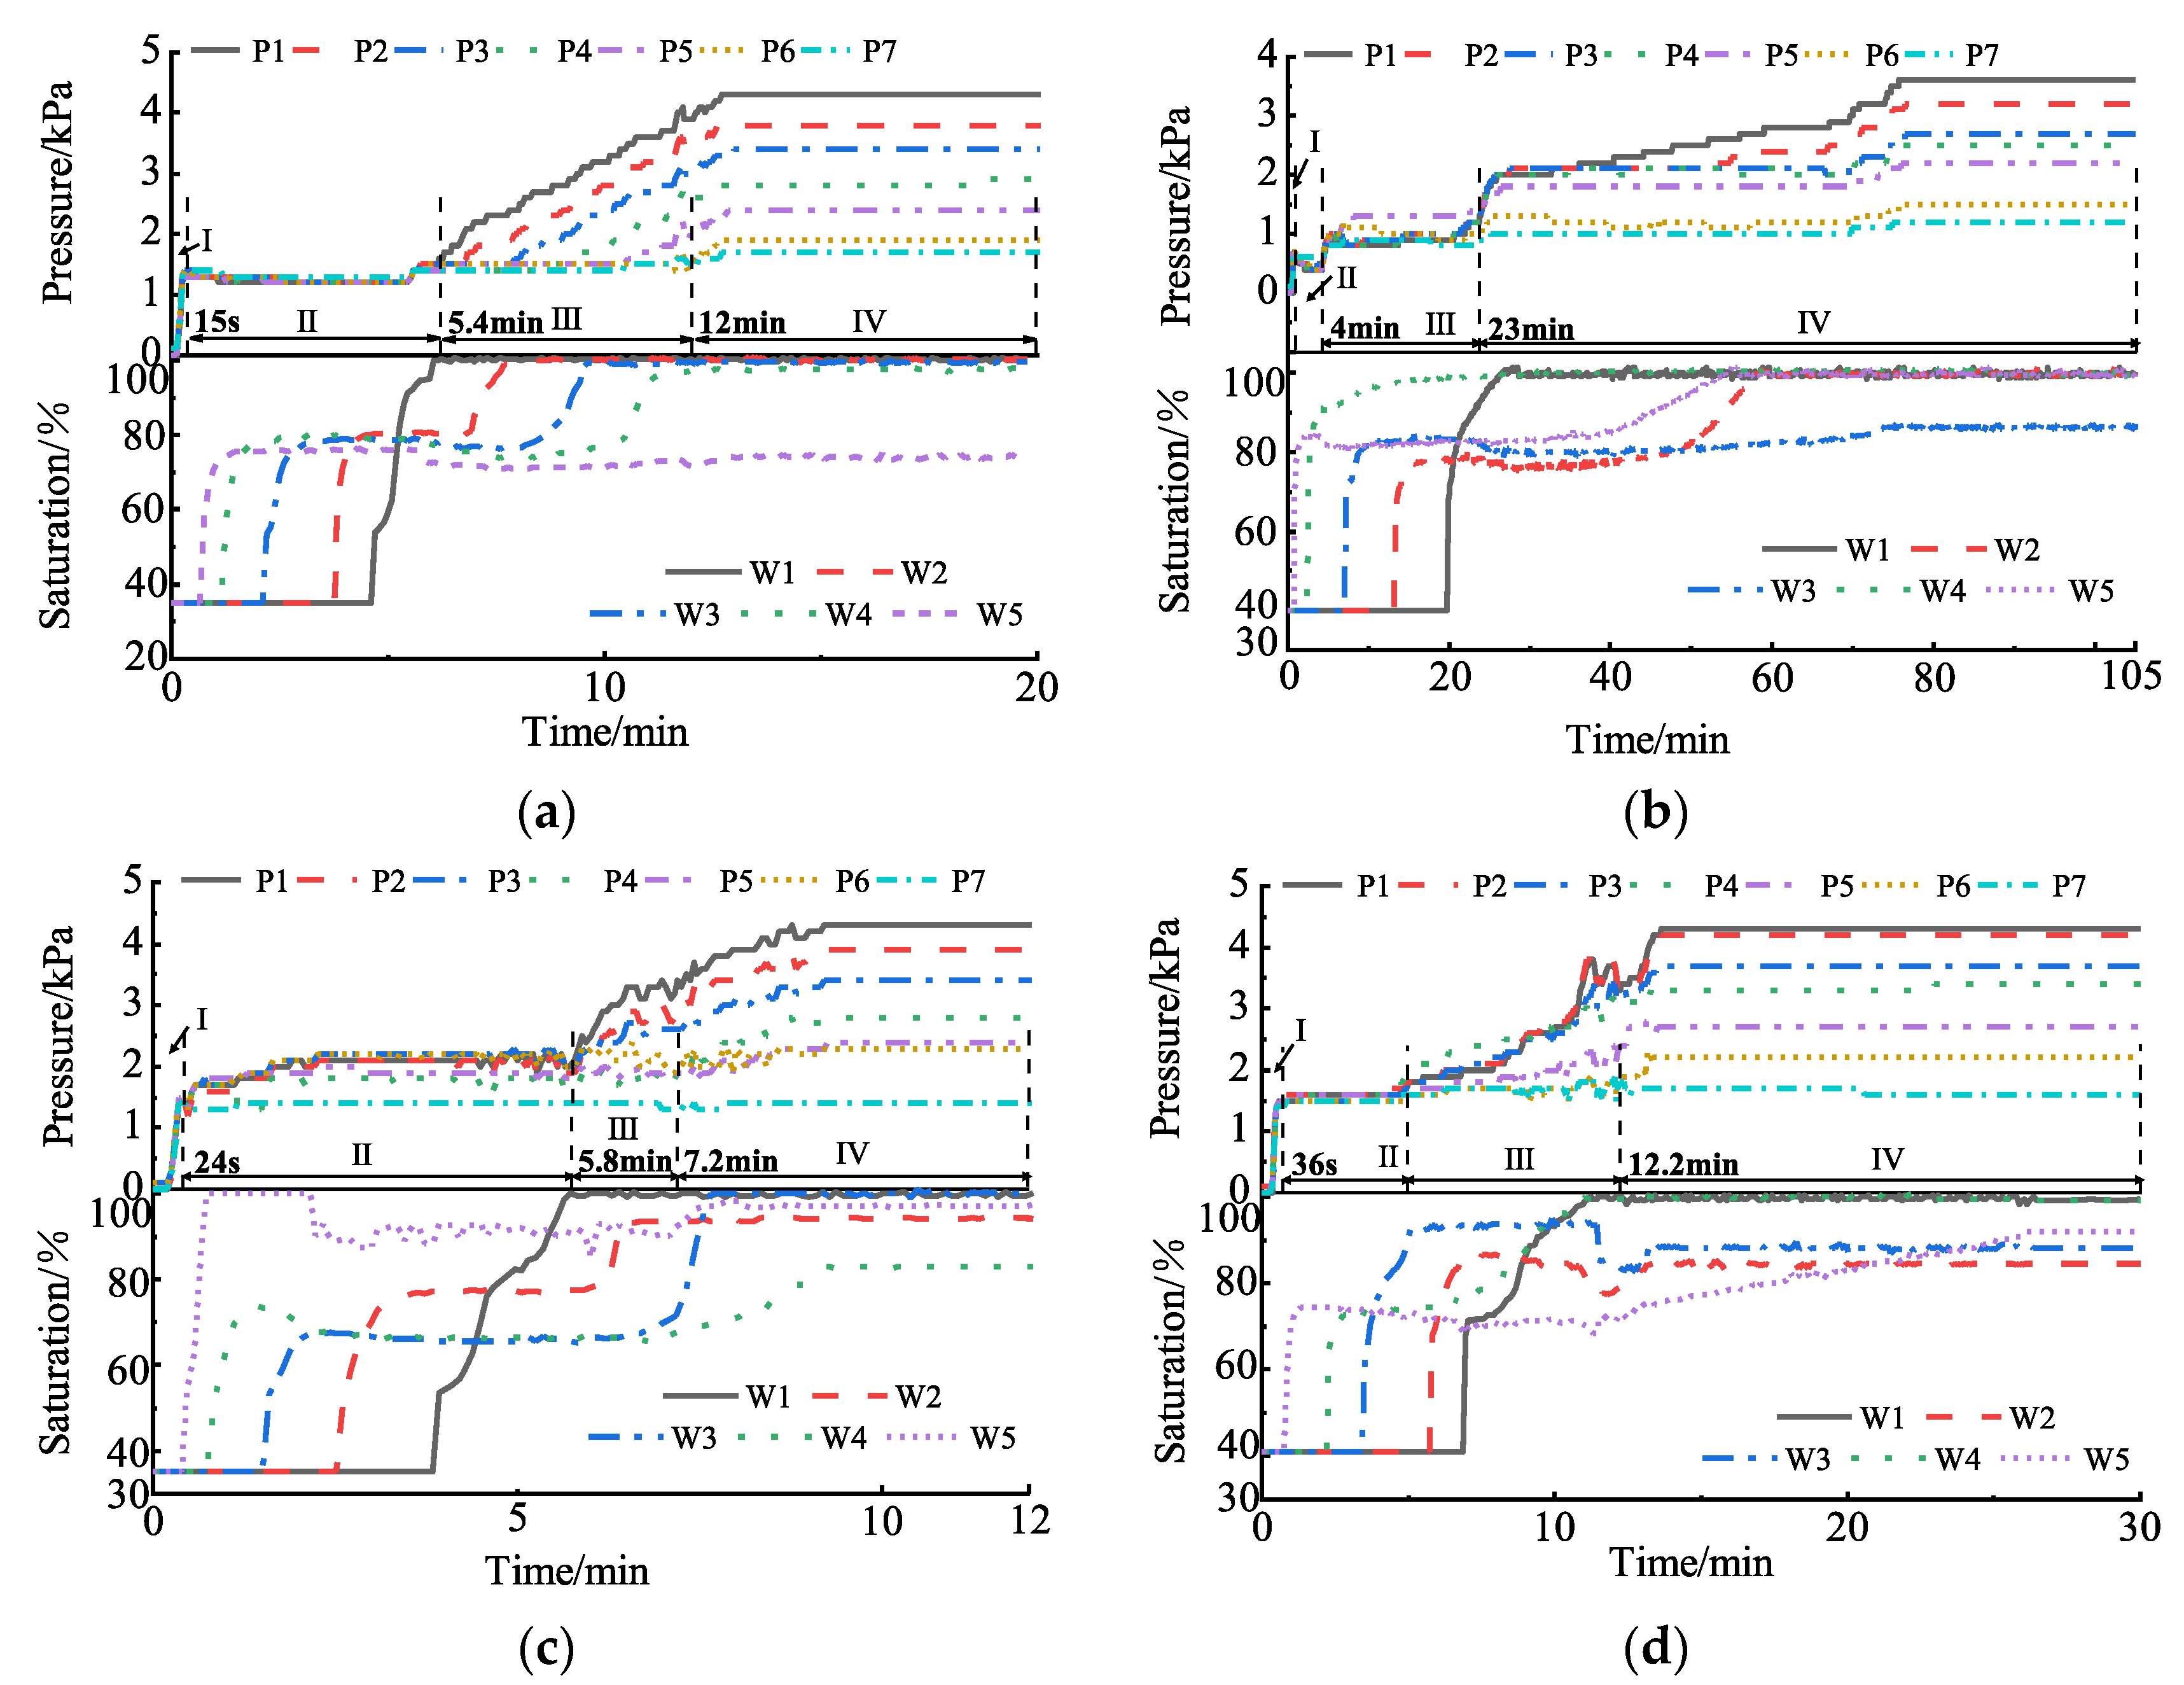
As shown in Figure 8, when the dry density varies, changes in pore connectivity within the soil column alter. With larger dry density, the void ratio of soil is less which causes smaller hydraulic conductivity and infiltration rate of water. In Figure 8a, the peak pressure increase is approximately 1.3 kPa. It shows that ponded water can easily infiltrate into top soil and no air bubble is found to escape from the soil. As a result, at the instant of water head application, the wetting front in Figure 8a has advanced approximately 80 mm in the soil column. It can be conceptualized as a 130 mm hydrostatic water column transmitting pressure to the enclosed air phase and all the pore pressure sensors have measured the same pressure increment. In Figure 8b, the peak pressure increase is approximately 0.8 kPa. The reason is that the initial dry density in Figure 8b is greater, which results in smaller voids in the soil, trapping air in relatively enclosed spaces. The surface tension generated thereby hinders pressure transmission, causing the pressure to increase only from 0 kPa to approximately 0.8 kPa. Similar results are shown in Bathurst et al. [10], Li et al. [9], and Autovino et al. [19] that say smaller void ratio causes lower hydraulic conductivity of water. While in the present study, we find air bubbles block water flow distinctly.
When comparing Figure 8c,d under the S3 soil sample under the same initial mass water content of 10%, the duration of Stage I is approximately 12 s longer for a dry density of 1.6 g/cm3 than for a dry density of 1.5 g/cm3. While in Figure 8a,b, the Stage I duration difference is approximately 6 s. Although the time difference in Stage I is moderate, comparing the peak pressure increases between Figure 8a,b during this stage indicates that as the dry density increases, the hindering effect of the air phase on the water phase in Stage I intensifies. When comparing Figure 8a,b, the duration of Stage II for the S2 soil sample at a dry density of 1.6 g/cm3 is approximately 17 min longer than that at 1.5 g/cm3. Similarly, comparing Figure 8c,d, the Stage II duration for the S3 soil sample at 1.6 g/cm3 is approximately 1 min longer than that at 1.5 g/cm3. As the dry density increases, the pore connectivity in the voids of soil decreases, reducing air phase expulsion pathways and thus hindering water phase infiltration. This results in enhanced seepage resistance and prolonged infiltration time during this stage. For the S2 soil sample, the duration of Stage III at a dry density of 1.6 g/cm3 was approximately 13 min longer than that at a dry density of 1.5 g/cm3. For the S3 soil sample, this stage took 5.8 min longer at 1.6 g/cm3 than at 1.5 g/cm3. As the dry density increases, when the air pressure reaches the critical value in Stage III, the air phase finds it more difficult to break through the top water head via available pathways, weakening its ability to overcome seepage resistance and prolong the infiltration time. In Stage IV, the water phase saturates the entire soil column from bottom to top. Once the soil sample approaches saturation, a continuous water pressure distribution occurs with the groundwater table rising in the soil column. For the P1 pore pressure sensor, the hydrostatic water pressure should be 4.2 kPa at a pressure head of 430 mm. The measured pore pressure data in Figure 8a,c,d are almost equal to 4.2 kPa. While the actual pressure observed in Figure 8b is lower than this value, which may be attributed to a higher dry density that reduces infiltration pathways during water phase infiltration. At the end of infiltration, residual air phases remain partially connected within the soil column, creating relatively enclosed spaces where surface tension develops, balancing the hydrostatic pressure transmission. As the dry density increases, the hindering effect of entrapped air bubbles on the water phase intensifies, slowing the overall saturation rate of the soil column.

3.6. Effect of Grain Size on Infiltration

As shown in Figure 9, significant differences in the water phase infiltration velocity exist under varying fine grain proportions. This occurred because a relatively high clay content increases the proportion of fine particles within the soil column, thereby reducing pore connectivity and intensifying the hindering effect of the air phase on the water phase, ultimately leading to a discernible decline in infiltration velocity. In Figure 9a,c, the peak pressure in Stage I was approximately 1.5 kPa, whereas Figure 9b exhibited a peak pressure increase of only 0.7 kPa. This discrepancy stems from the lower clay content in the S1 and S3 soil types than in the S2 samples. Upon application of the water head, the preset initial water content enables the top of the soil column to respond rapidly to changes in the wetting front, which advances swiftly over a short period to form a 150 mm hydrostatic water column. This column transmits pressure to the sensor through both the aqueous and air phases in the wetted soil. In contrast, the higher clay content in S2 reduces pore connectivity and increases tortuosity within the voids, hindering water head infiltration and limiting the peak pressure to 0.7 kPa. When comparing Figure 9a–c under the conditions of dry density of 1.5 g/cm3 and initial mass water content of 8%, the Stage I duration follows the order S2 > S3 > S1. Although the infiltration velocity during Stage I was extremely high, the differences in infiltration time were not pronounced. However, the peak pressure increases in this stage, indicating that as the clay content increases, the efficiency of external pressure transmission decreases. The Stage II infiltration duration follows the order S2 > S3 > S1. This stage can be viewed as the process of the wetting front advancing downward. As the clay content within the soil column increases, fewer infiltration pathways are available for the water phase, intensifying the hindering effect of the air phase on the water phase and thereby reducing the infiltration velocity. In Stage III, since the S1 soil sample is composed of pure sand, the internal pressure required to expel entrapped air bubbles is relatively low, resulting in faster pressure changes but more significant data fluctuations. The Stage III duration for the three soil types followed the order S2 > S3 > S1. As the clay content increases within the soil column, the ability of entrapped air bubbles to overcome seepage resistance weakens, thereby prolonging the infiltration time. This observation is consistent with Chen et al. [6], where they observed in a two-dimensional sand channel that fine particles would increase the tortuosity of the pores and hinder the gas flow. The results are also similar with the results of Dong et al. [18] that the soil texture controls the water–gas coupling effect. The Stage IV duration follows the order S2 > S3 > S1. As the clay content within the soil column increases, the hindering effect of the air phase on the water phase intensifies, resulting in a longer duration for soil column saturation during this stage.
For a brief summary, the main features of all the test results are listed in Table 3.

4. Conclusions

Through one-dimensional pond infiltration experiments on homogeneous soil columns in the laboratory, this study examines the laws of variation with time for the wetting front, pressure values, and saturation (based on measured volumetric water content) within sandy soil columns during the pond infiltration process under different initial saturations, different initial dry densities, and different initial clay contents. The main conclusions are as follows:
  • The water phase primarily enters the soil column through pore pathways, where smaller pore sizes reduce the infiltration volume per unit time and correspondingly increase infiltration resistance. Overall, a lower dry density and lower clay content lead to a shorter time for the wetting front to reach the bottom of the soil column. Conversely, a relatively high dry density and high clay content prolong this travel time.
  • When the initial water content of the soil is high, the color difference between the soil ahead of and behind the wetting front surface is minimal, making external observation of the wetting front difficult. In such cases, the position of the wetting front can be monitored by identifying the time when saturation reaches 50% to 70%, with a relative error between the two methods of less than 7%.
  • On the basis of the infiltration process in sandy soil, the variation in pore pressure can be divided into four stages (Stage I–IV). Depending on the initial dry density, initial saturation, and clay content of the soil column, the resistance to infiltration exerted by these four stages also varies. Among these factors, initial saturation determines the formation and breakthrough behavior of entrapped air bubbles (Stage III). Specifically, when the initial saturation is 0%, variations in pressure and saturation during soil column infiltration do not occur in Stage III. Once the initial saturation exceeds 0%, all four stages fully develop during the infiltration process. The dry density and clay content significantly influence the strength of the air phase resistance during Stages II and IV by modifying the pore connectivity. Specifically, higher values of dry density and clay content reduce pore connectivity within the soil column, which prolongs the infiltration time of the water phase across all stages and ultimately impedes the complete saturation of the soil column.

Author Contributions

Q.C. and H.M.: Analyzed the data, interpreted the results, and drafted the manuscript. Q.C., W.L. and H.M.: Experiment. H.Z.: Conceptualization, methodology, project administration, writing—review and editing. All authors have read and agreed to the published version of the manuscript.

Funding

This research was funded by the National Natural Science Foundation of China (Grant No. 51178251).

Institutional Review Board Statement

Not applicable.

Informed Consent Statement

Not applicable.

Data Availability Statement

Data sets generated during the current study are deposited in Zenodo at https://doi.org/10.5281/zenodo.17538413.

Acknowledgments

The authors would like to thank the reviewers and editors who presented critical and constructive comments for the improvement of this paper.

Conflicts of Interest

The authors declare no conflicts of interest.

References

  1. Fredlund, D.G. Unsaturated Soil Mechanics in Engineering Practice. J. Geotech. Geoenviron. Eng. 2006, 132, 286–321. [Google Scholar] [CrossRef]
  2. Mitchell, J.K. Fundamentals of Soil Behavior; Wiley: New York, NY, USA, 2005. [Google Scholar] [CrossRef]
  3. Wang, Z.; Jan, F.Y.; Van Genuchten, M.T.; Nielsen, D.R. Air entrapment effects on infiltration rate and flow instability. Water Resour. Res. 1998, 34, 213–222. [Google Scholar] [CrossRef]
  4. Culligan, P.J.; Barry, D.A.; Yves Parlange, J.; Steenhuis, T.S.; Haverkamp, R. Infiltration with controlled air escape. Water Resour. Res. 2000, 36, 781–785. [Google Scholar] [CrossRef]
  5. Ng, C.W.W.; Coo, J.L.; Chen, Z.K.; Chen, R. Water infiltration into a new three-layer landfill cover system. J. Environ. Eng. 2016, 142, 04016007. [Google Scholar] [CrossRef]
  6. Chen, K.P.; Wei, Y.B.; Wu, J.C. The effect of infiltration flux on air counterflow in a 2-D confined sand chamber. J. Hydrol. 2019, 571, 619–626. [Google Scholar] [CrossRef]
  7. Ravi, V.; Williams, J.R. Estimation of Infiltration Rate in the Vadose Zone. In Compilation of Simple Mathematical Models; U.S. Environmental Protection Agency: Washington, DC, USA, 1998; Volume I. [Google Scholar]
  8. Zhao, Z.; Luo, Z.; Sun, H.; Li, H.; Liu, Q.; Liu, H. Capillary Rise in Layered Soils. Appl. Sci. 2023, 13, 3374. [Google Scholar] [CrossRef]
  9. Li, L.; Li, X.; Li, Y.; Li, C.; Li, Y.; Wang, L.; He, Y.; Yao, C. An Analysis of Vertical Infiltration Responses in Unsaturated Soil Columns from Permafrost Regions. Appl. Sci. 2024, 14, 10195. [Google Scholar] [CrossRef]
  10. Bathurst, R.J.; Siemens, G.; Ho, A.F. Experimental investigation of infiltration ponding in one-dimensional sand-geotextile columns. Geosynth. Int. 2009, 16, 158–172. [Google Scholar] [CrossRef]
  11. Ng, C.W.W.; Chen, Z.K.; Coo, J.L.; Chen, R.; Zhou, C. Gas breakthrough and emission through unsaturated compacted clay in landfill final cover. Waste Manag. 2015, 44, 155–163. [Google Scholar] [CrossRef]
  12. Siemens, G.A.; Take, W.A.; Peters, S.B. Physical and numerical modeling of infiltration including consideration of the pore-air phase. Can. Geotech. J. 2014, 51, 1475–1487. [Google Scholar] [CrossRef]
  13. Abdulkadir, M.; Kajero, O.T.; Olarinoye, F.O.; Udebhulu, D.O.; Zhao, D.; Aliyu, A.M.; Al-Sarkhi, A. Investigating the Behaviour of Air–Water Upward and Downward Flows: Are You Seeing What I Am Seeing? Energies 2021, 14, 7071. [Google Scholar] [CrossRef]
  14. Montoya-Dominguez, J.D.; García-Aristizábal, E.F.; Vega-Posada, C.A. One-dimensional experimental study of rainfall infiltration into unsaturated soil. Rev. Fac. Ing. Univ. Antioq. 2017, 82, 74–81. [Google Scholar] [CrossRef]
  15. Hou, X.K.; Vanapalli, S.K.; Li, T.L. Water flow in unsaturated soils subjected to multiple infiltration events. Can. Geotech. J. 2020, 57, 366–376. [Google Scholar] [CrossRef]
  16. Udukumburage, R.S.; Gallage, C.; Dawes, L. An instrumented large soil column to investigate climatic ground interaction. Int. J. Phys. Model. Geotech. 2021, 21, 55–71. [Google Scholar] [CrossRef]
  17. Rubio, E.; Rubio-Alfaro, M.S.; Hernández-Marín, M. Wetting front velocity determination in soil infiltration processes: An experimental sensitivity analysis. Agronomy 2022, 12, 1155. [Google Scholar] [CrossRef]
  18. Dong, X.Y.; Qin, F.C.; Li, L.; Yang, Z.Q.; Li, Y.; Wu, Y.H. Study on water vertical infiltration characteristics and water content simulation of sandstone overlying loess. Water 2022, 14, 3716. [Google Scholar] [CrossRef]
  19. Autovino, D.; Bagarello, V.; Caltabellotta, G.; Varadi, F.K.; Zanan, F. One-dimensional infiltration in a layered soil measured in the laboratory with the mini-disk infiltrometer. J. Hydrol. Hydromech. 2024, 72, 149–157. [Google Scholar] [CrossRef]
  20. Bai, W.S.; Li, R.J.; Pan, J.Y.; Li, R.J.; Wang, L.; Yang, Z.W. Measured Rainfall Infiltration and the Infiltration Interface Effect on Double-Layer Loess Slope. Water 2023, 15, 2505. [Google Scholar] [CrossRef]
  21. Wen, X.; Hu, Z.P.; Jing, Y.L.; Zhang, Y.G.; Chai, S.H. Effects of rainwater infiltration in low impact development facilities on adjacent municipal roads in collapsible loess. Bull. Eng. Geol. Environ. 2022, 81, 25. [Google Scholar] [CrossRef]
  22. Liang, J.P.; Xing, X.G.; Gao, Y. A modified physical-based water-retention model for continuous soil moisture estimation during infiltration: Experiments on saline and nonsaline soils. Arch. Agron. Soil Sci. 2020, 66, 1344–1357. [Google Scholar] [CrossRef]
  23. Gao, Y.; Chang, K.; Xing, X.G.; Liang, J.P.; He, N.; Ma, X.Y. Determination of soil water hydraulic parameters from infiltration data. Eng. Comput. 2021, 39, 541–553. [Google Scholar] [CrossRef]
  24. Mburu, J.W.; Li, A.-J.; Lin, H.-D.; Lu, C.-W. Investigations of Unsaturated Slopes Subjected to Rainfall Infiltration Using Numerical Approaches—A Parametric Study and Comparative Review. Sustainability 2022, 14, 14465. [Google Scholar] [CrossRef]
  25. Zhang, L.; Li, T.L.; Li, J.H.; Liang, W.; Chen, C.L. Water infiltration and soil-water characteristics of compacted loess under applied vertical stress. J. Mt. Sci. 2023, 20, 873–885. [Google Scholar] [CrossRef]
  26. Ren, X.C.; Sun, W.F.; Lan, H.Q.; Bao, H.; Li, L.P.; Liu, S.J.; Yan, C.G.; Wang, X.C.; Li, Z.C.; Tian, C.Y. Influence of tension cracks on moisture infiltration in loess slopes under high-intensity rainfall conditions. Sci. Rep. 2025, 15, 4488. [Google Scholar] [CrossRef] [PubMed]
  27. Smits, K.M.; Cihan, A.; Sakaki, T.; Lllangasekare, T.H. Evaporation from soils under thermal boundary conditions: Experimental and modeling investigation to compare equilibrium-and nonequilibrium-based approaches. Water Resour. Res. 2011, 47, W05540. [Google Scholar] [CrossRef]
  28. Tamizdoust, M.M.; Ghasemi-Fare, O. Utilization of nonequilibrium phase change approach to analyze the nonisothermal multiphase flow in shallow subsurface soils. Water Resour. Res. 2020, 56, e2020WR027381. [Google Scholar] [CrossRef]
  29. Zhao, G.; Cheng, J.; Li, L.; Zhang, H.; Li, H.; Zhang, H. Effect of Water Content on Light Nonaqueous Phase Fluid Migration in Sandy Soil. Appl. Sci. 2024, 14, 9640. [Google Scholar] [CrossRef]
  30. Ma, Y.; Feng, S.Y.; Zhao, H.B.; Liu, X.D.; Su, D.Y. Water infiltration in layered soils with air entrapment: Modified Green-Ampt model and experimental validation. J. Hydrol. Eng. 2011, 16, 628–638. [Google Scholar] [CrossRef]
  31. Wu, L.Z.; Zhang, L.M.; Li, X. One-dimensional coupled infiltration and deformation in unsaturated soils subjected to varying rainfall. Int. J. Geomech. 2016, 16, 06015004. [Google Scholar] [CrossRef]
  32. Bear, J.; Cheng, A.H.D. Modeling Groundwater Flow and Contaminant Transport; Springer: Berlin/Heidelberg, Germany, 2010; Volume 23. [Google Scholar]
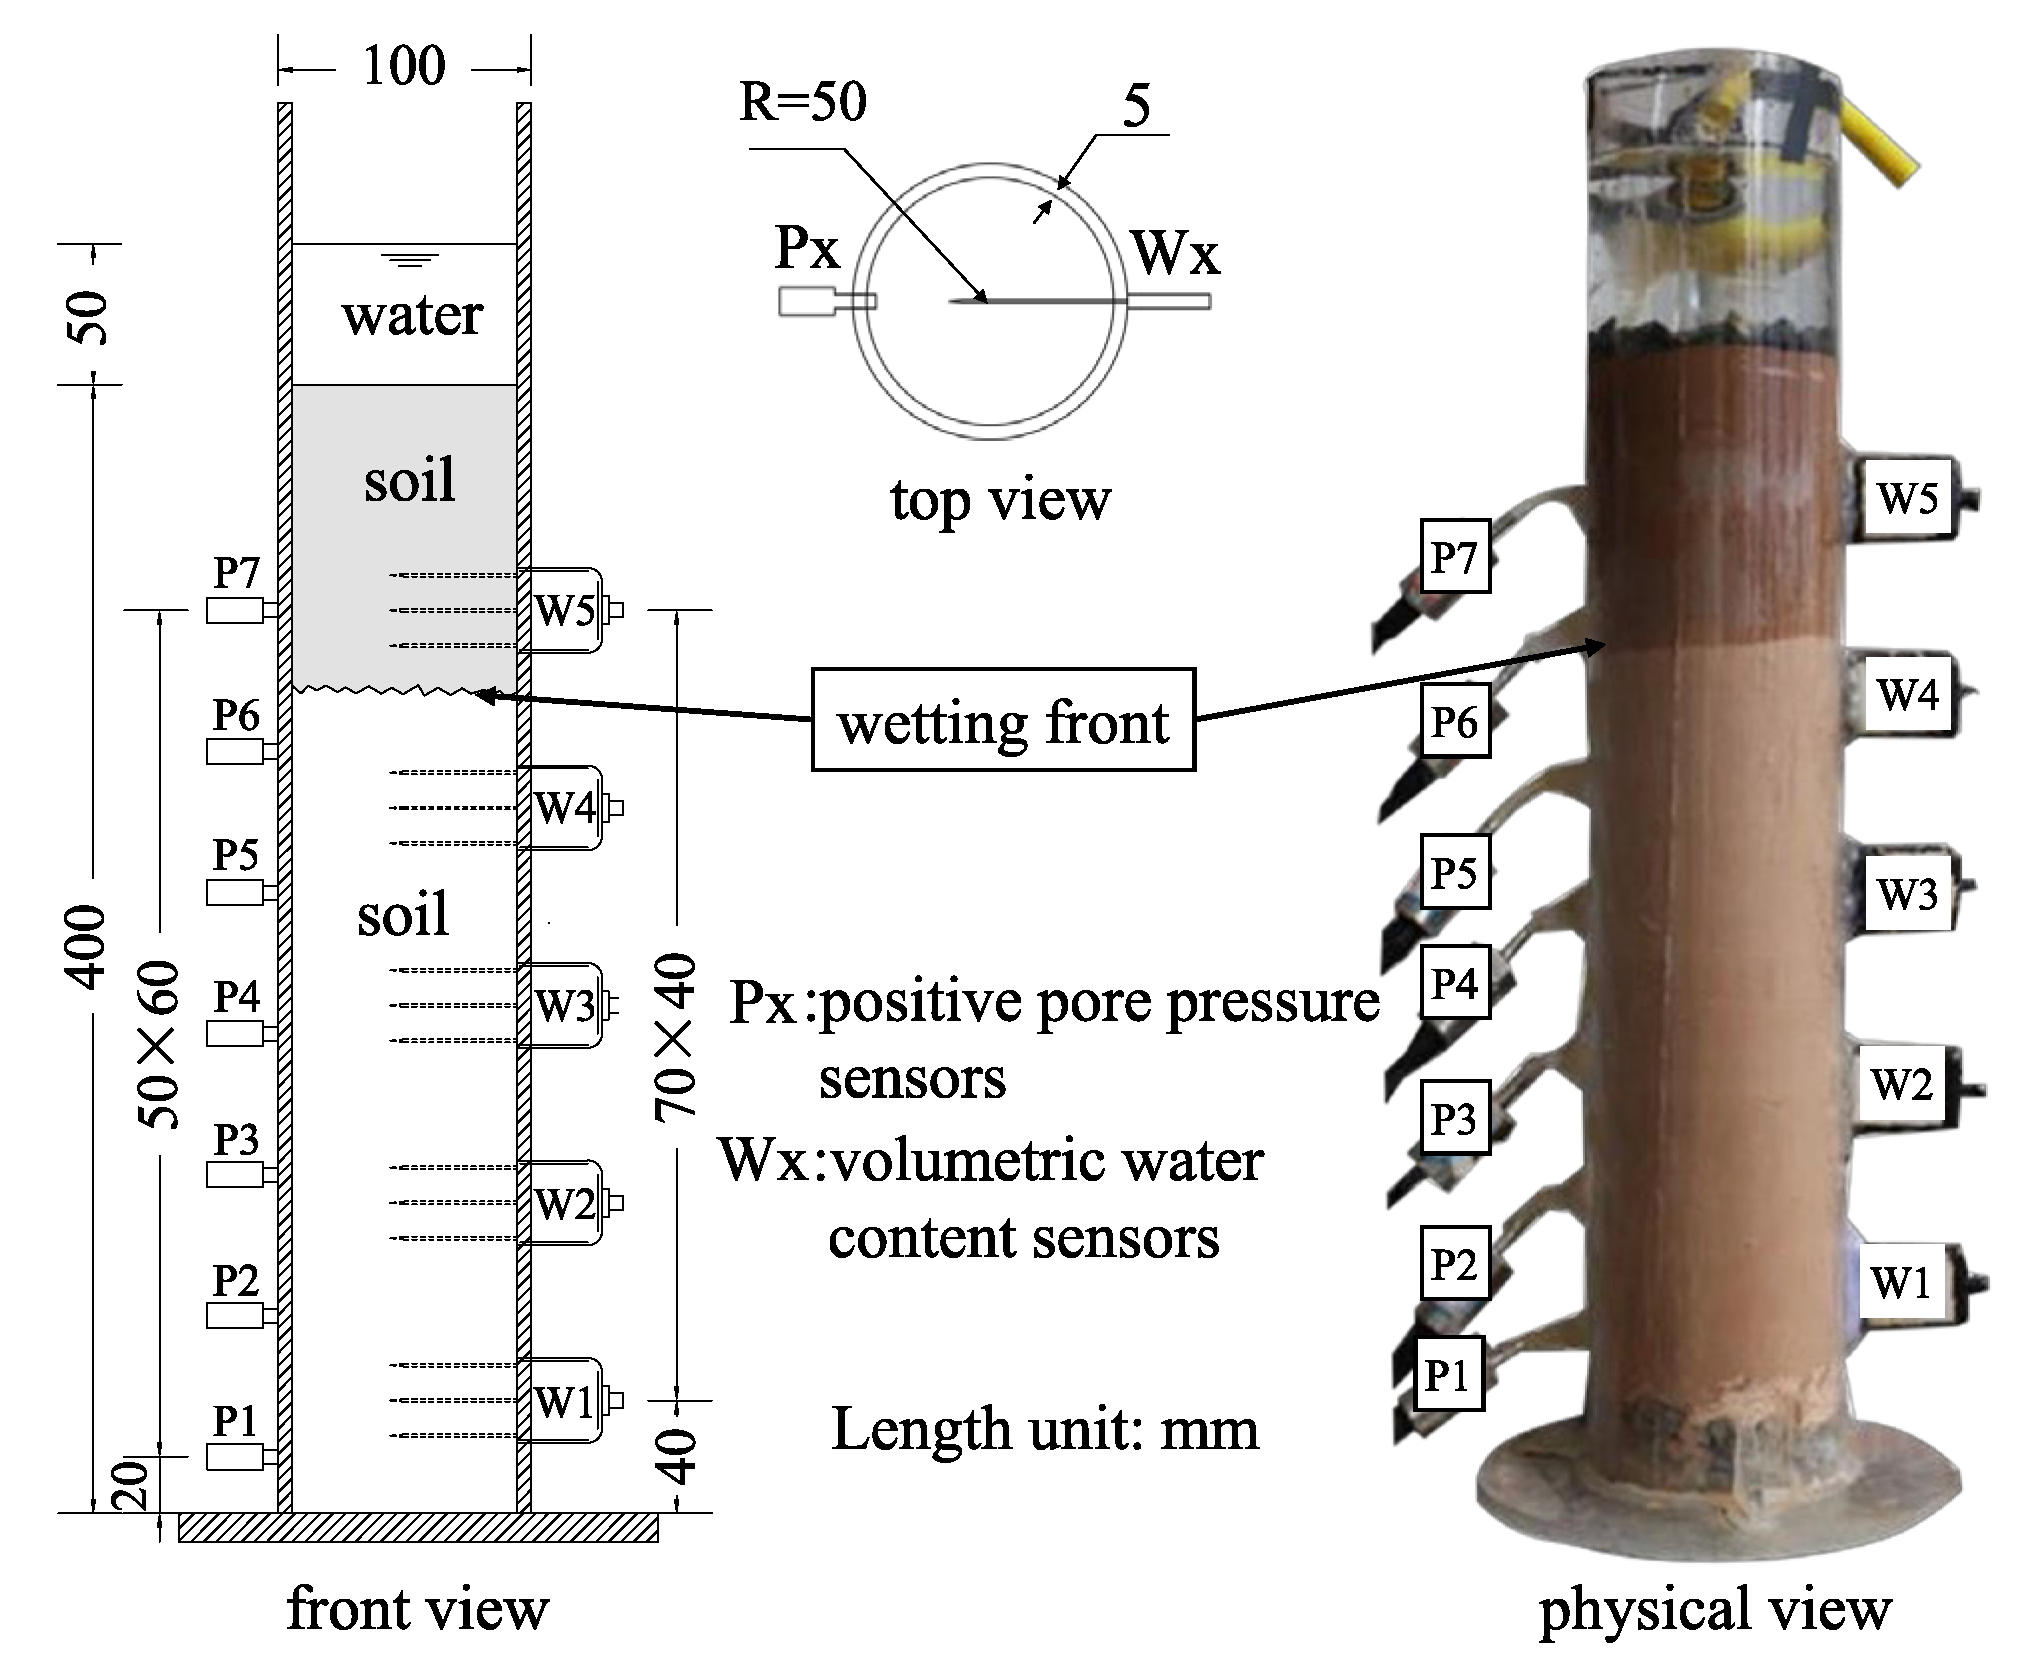
Figure 1. Diagram of the ponded water infiltration device.
Applsci 15 12200 g001
Figure 2. Sensors and data acquisition arrangement.
Applsci 15 12200 g002
Figure 3. Particle size distributions of the three soil types.
Applsci 15 12200 g003
Figure 4. Actual photo of infiltration with saturation curve change at #3 working condition (S2, ρ d = 1.5 g/cm3    S r 0 = 0%). (a) Curve of saturation versus time for working condition #3; (b) Physical image of wetting front propagation.
Applsci 15 12200 g004
Figure 5. Wetting fronts advancing with time monitored by the internal sensors and exterior photographs.
Applsci 15 12200 g005
Figure 6. Four typical patterns of pressure variation during ponded water infiltration (S2, ρ d = 1.5 g/cm3  S r 0 =21%).
Applsci 15 12200 g006
Figure 7. Temporal pressure and saturation curves for various initial saturations. (a) S2,   ρ d = 1.5 g / c m 3 S r 0 = 0 % ; (b) S2,   ρ d = 1.5 g / c m 3 S r 0 = 28 % ; (c) S1,   ρ d = 1.5 g / c m 3 S r 0 = 0 % ; (d) S1, ρ d = 1.5 g / c m 3 S r 0 = 28 % .
Applsci 15 12200 g007
Figure 8. Temporal pressure and saturation curves for different dry densities. (a) S2,   ρ d = 1.5 g / c m 3   S r 0 = 34 % ; (b) S2,   ρ d = 1.6 g / c m 3 S r 0 = 40 % ; (c) S3,   ρ d = 1.5 g / c m 3 S r 0 = 35 % ; (d) S3,   ρ d = 1.6 g / c m 3 S r 0 = 41 % .
Applsci 15 12200 g008
Figure 9. Temporal pressure curves for different fine grain proportions. (a) S1, ρ d = 1.5 g / c m 3 S r 0 = 28 % ; (b) S2, ρ d = 1.5 g / c m 3 S r 0 = 28 % ; (c) S3, ρ d = 1.5 g / c m 3 S r 0 = 28 % .
Applsci 15 12200 g009
Table 1. The physical properties of three types of soil.
SoilParticle Size Distribution (mm)Uniformity
Coefficient
(Cu)
Curvature
Coefficient
(Cc)
Specific
Gravity
(Gs)
USCS
Classification
S10.5–2.0 (32.8%)1.80.982.61SP (Poorly Graded Sand)
0.25–0.5 (63.3%)
<0.25 (3.9%)
S20.5–2.0 (28.6%)78.52.122.66SM (Silty Sand)
0.075–0.5 (39.5%)
<0.075 (31.9%)
S30.5–2.0 (30.8%)30.012.652.64SM (Silty Sand)
0.075–0.5 (53.3%)
<0.075 (15.9%)
Table 2. Ponding water infiltration experimental program.
NumberSoilInitial Dry Density (g/cm3)Initial Gravimetric Water Content
(Corresponding
Initial Saturation)
#1S11.500.0%(Sr = 0%)
#2S11.508.0%(Sr = 28%)
#3S21.500.0%(Sr = 0%)
#4S21.506.0%(Sr = 21%)
#5S21.508.0%(Sr = 28%)
#6S21.5010.0%(Sr = 34%)
#7S21.600.0%(Sr = 0%)
#8S21.6010.0%(Sr = 40%)
#9S31.500.0%(Sr = 0%)
#10S31.506.0%(Sr = 21%)
#11S31.508.0%(Sr = 28%)
#12S31.5010.0%(Sr = 35%)
#13S31.600.0%(Sr = 0%)
#14S31.6010.0%(Sr = 41%)
Table 3. Main features of the four stages according to the effects of initial saturation, initial dry density, and grain size distribution.
StageEffects on Ponded Water Infiltration in a Bottom Sealed Soil Column
Initial Saturation Sr0Initial Dry Density ρd0Soil Grain Size Distribution
IPressure rising rapidly;
with the increasing of Sr0,
pressure rising faster.
Pressure rising rapidly;
with the increasing of ρd0,
pressure rising slower.
Pressure rising rapidly;
with more fine particles
pressure rising slower.
IIPressure rising gently;
with the increasing of Sr0,
pressure rising faster.
Pressure rising gently;
with the increasing of ρd0,
pressure rising slower.
Pressure rising gently;
with more fine particles
pressure rising slower.
IIISr0 closing 0%, not Stage III;
Sr0 in 21–41%, pressure drops
with air breakthrough
With the increasing of ρd0,
water flow slower and
air bubble is more difficult
to breakthrough.
With more fine particles,
water flow slower and
air bubble is more difficult
to breakthrough.
IVPressure tends to stable;
with the increasing of Sr0,
more air bubble entrapped.
Pressure tends to stable;
with the increasing of ρd0,
more air bubble entrapped.
Pressure tends to stable;
with more fine particles,
more air bubble entrapped.
Disclaimer/Publisher’s Note: The statements, opinions and data contained in all publications are solely those of the individual author(s) and contributor(s) and not of MDPI and/or the editor(s). MDPI and/or the editor(s) disclaim responsibility for any injury to people or property resulting from any ideas, methods, instructions or products referred to in the content.