Article

Experimental Investigation of Local Wind Effects on Façade Scaffolding Structures

by
Paulina Jamińska-Gadomska
* and
Andrzej Sumorek
Department of Structural Mechanics, Lublin University of Technology, 20-618 Lublin, Poland
*
Author to whom correspondence should be addressed.
Appl. Sci. 2025, 15(22), 12196; https://doi.org/10.3390/app152212196
Submission received: 29 October 2025 / Revised: 13 November 2025 / Accepted: 13 November 2025 / Published: 17 November 2025
(This article belongs to the Section Civil Engineering)

Abstract

Wind is one of the main environmental loads acting on temporary scaffolding structures, yet current design codes apply simplified assumptions regarding its distribution. This study presents full-scale measurements of wind velocities on 10 façade scaffolds located across Poland, representing various building geometries and exposure conditions. Each scaffold was instrumented with five two-dimensional ultrasonic anemometers and one three-dimensional rooftop reference anemometer. Data were analysed in 10 min averages, divided into 30° directional sectors and compared with the normative model defined in EN 12811-1 using the site factor c s . The results reveal strong spatial variability of wind action across scaffold surfaces, with measured local velocities ranging from 20% to 140% of the reference values. The parallel flow component exhibited substantial scatter, while the perpendicular component was strongly damped by façade shielding and protective netting. For most mid-façade positions, measured values corresponded to c s = 0.25 0.5 , whereas corner and edge locations frequently exceeded c s = 1.0 . The findings demonstrate that the uniform site factors assumed in current standards do not capture the aerodynamic complexity of real scaffolds, especially under oblique or high-intensity wind conditions. The presented dataset provides a unique experimental basis for improving scaffold wind load modelling and developing position-specific design provisions.

1. Introduction

Scaffolding structures are essential components in the construction, maintenance, and renovation of buildings. Due to their lightweight configuration, variable geometry, and exposure to wind, scaffolds are particularly vulnerable to aerodynamic loading. Excessive wind forces can compromise the scaffolding stability, damage structural elements, and create significant safety hazards for workers and pedestrians. Accurate assessment of wind effects is therefore critical for ensuring both the structural integrity and occupational safety.
Current design practices are largely guided by standards such as EN 12811-1 [1], which provide recommendations for calculating wind loads on scaffolding. The standard considers factors such as wind direction, velocity profiles, scaffold height, and surrounding obstacles. However, these recommendations are derived mainly from simplified analytical formulations, and field validation remains limited.
Although only a few studies have addressed full-scale wind measurements directly on scaffolding structures, extensive full-scale investigations on low- to high-rise buildings [2,3,4,5,6,7] have established key relationships between façade pressure distributions and turbulence characteristics. Numerous wind tunnel experiments [8,9,10,11] and computational fluid dynamics (CFD) simulations [12,13,14,15,16,17] have been conducted to investigate flow separation, interference effects, and local accelerations around complex building geometries. While these studies are not focused on scaffolds themselves, they provide a valuable framework for interpreting the spatial variability of wind action observed in scaffold environments.
Experimental research on scaffolds has been mainly conducted at model scale. Wind tunnel tests on façade scaffolds showed that design provisions may underestimate the wind force coefficients for clad configurations [18] and that nearby structures can significantly modify the pressure distributions on non-porous cladding [19]. Studies on integral-lift scaffolds used in high-rise construction further developed this understanding. Aerodynamic tests established the static wind load and vibration factors [20], while the research in [21] found the existing code provisions to be overly conservative. Complementary CFD simulations [22] highlighted the importance of optimising the scaffold joint design, accounting for local wind direction and applying wind proofing measures to enhance the overall structural stability.
The aerodynamic influence of protective netting and cladding has also been investigated. Experimental and CFD studies demonstrated that total wind forces strongly depend on flow direction and cladding porosity [22,23]. Permeability and pressure measurements revealed that different net types induce distinct aerodynamic responses [24] and that pressure coefficients vary proportionally with the drag characteristics of the nets [25].
Apart from aerodynamic analyses, several works have examined the mechanical behaviour and load transfer mechanisms of scaffolding structures under wind and service loads [26,27]. Experimental and numerical verification of joint stiffness and connections were discussed by [28,29], while in situ measurements of axial forces in stands were presented by [30]. These studies highlight the importance of accurate wind load representation, as the internal force distribution within the scaffold is strongly dependent on the actual aerodynamic action. Dynamic investigations highlighted the influence of anchoring and bracing systems on natural frequencies and vibration modes [31,32], while random vibration theory was applied in [33] to determine the wind-induced vibration coefficients.
Full-scale field measurements on scaffolds remain rare. Early in situ investigations of authors focused on scaffolds without protective nets [34,35], where wind data were obtained from short-term full-scale measurements, collected over several days. The results indicated that local wind loads may significantly differ from those prescribed in the Eurocode provisions, leading to higher stresses and axial forces in structural elements. The research described in [36] proposed empirical equations for estimating wind loads on scaffolds through field measurements [37] validated against wind tunnel data [38]. The concept of controlling the wind pressure acting on the rear side of scaffolds by closing the gap between the scaffold and building façade was explored in [39]. Most recent field measurements on scaffolds focused on one cantilevered scaffold at a high-rise building and revealed complex wind load characteristics with non-Gaussian wind pressure distributions [40].
Most available data come from controlled environments such as wind tunnels or numerical simulations, which may not fully reproduce the complexity of natural wind exposure in built-up urban conditions. Therefore, the present study aims to fill this gap by conducting comprehensive full-scale field measurements of wind velocities on multiple scaffolds located on real buildings under natural wind conditions. The main objectives are to quantify the spatial variability of wind velocity over scaffold surfaces and to compare the measured results with the normative site factors specified in EN 12811-1 [1].

2. Materials and Methods

2.1. Scaffolding Structures

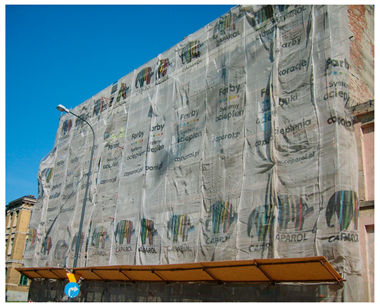
Field measurements were conducted on 34 façade scaffolds located across Poland, in both urban and suburban environments. However, only datasets meeting the following conditions were included in the analysis: mean reference wind speed (from 3D anemometer) greater than 3 m/s, the rooftop anemometer located sufficiently above the building’s aerodynamic wake, and complete and consistent time series from all 2D sensors. After applying these filters, data from 10 scaffolds were retained for quantitative comparison and analysis. The selected structures varied in geometry, height, and configuration, and they were positioned alongside buildings with solid façades. Three of them were equipped with protective netting.
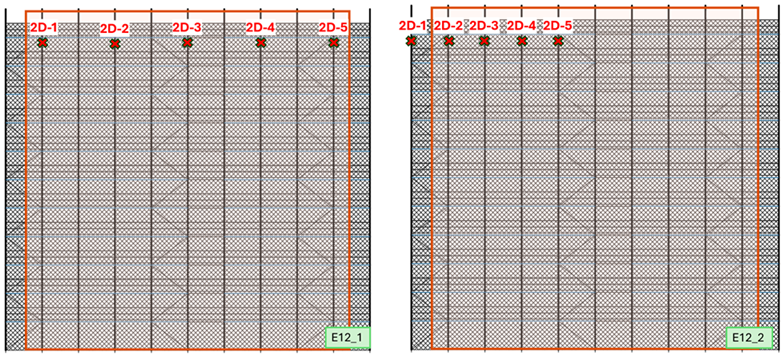
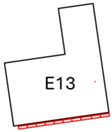
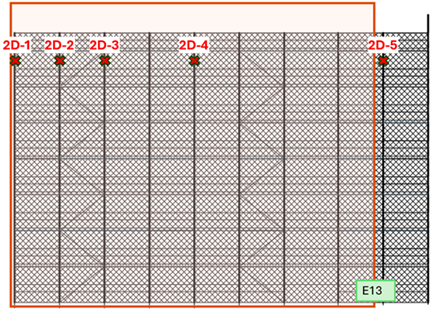
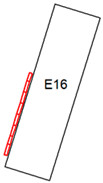
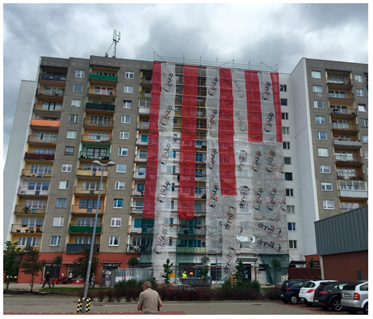
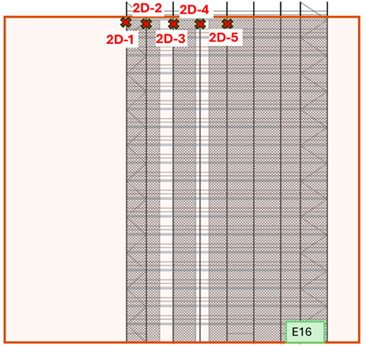
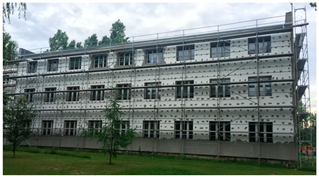
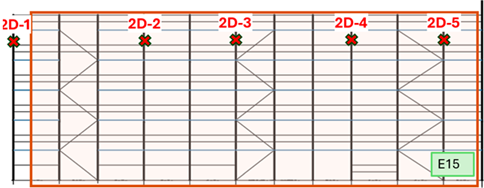
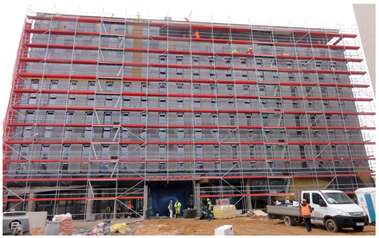
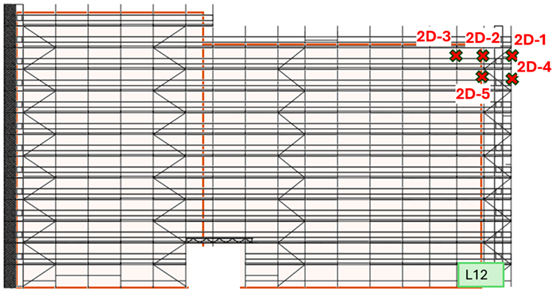
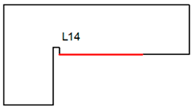
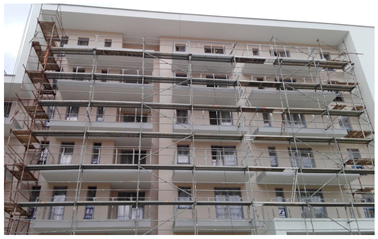
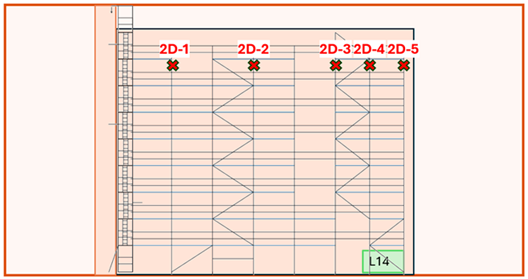
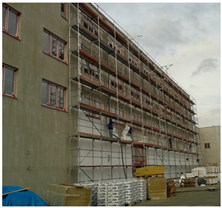
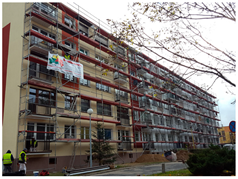
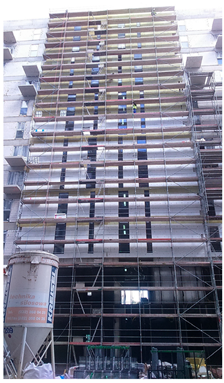
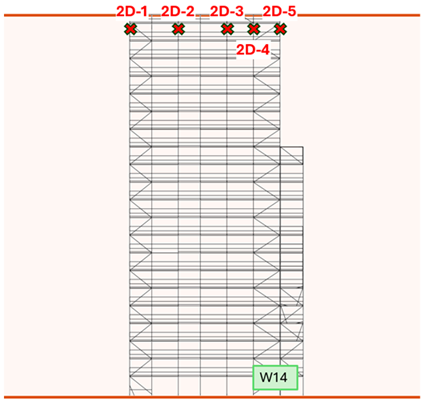
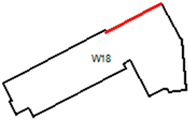
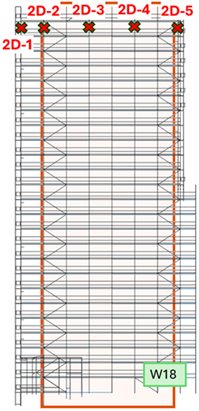
Table 1 and Table 2 summarise the basic characteristics of the investigated scaffolds (Hmax—maximum height, L—length), including horizontal building outlines with scaffold placements, photographs of scaffolding structures and vertical projection of scaffolds, buildings’ vertical outlines, protective netting (if installed), and the distribution of the 2D anemometers. The scaffold identifiers (e.g., E12, W18, L14) are internal labels used for referencing individual test sites; the letter indicates the regional group of measurements within Poland, and the number corresponds to the specific scaffold tested in that region. The notation has no analytical significance.

2.2. Instrumentation and Data Collection

Five two-directional (2D) ultrasonic anemometers were installed on the penultimate, or close, scaffold level (Figure 1a,b), providing measurements of the wind speed and direction at multiple points. The 2D anemometers measured only the horizontal wind components, which are the primary contributors to wind loads on scaffolding and directly correspond to the quantities defined in the normative model. In addition, a three-directional (3D) ultrasonic anemometer was installed approximately 3.5 m above the rooftop of each building (Figure 1c), to serve as a reference for the undisturbed wind flow and to provide the incoming wind direction and magnitude for the site. The characteristics of the used devices are presented in Table 3.
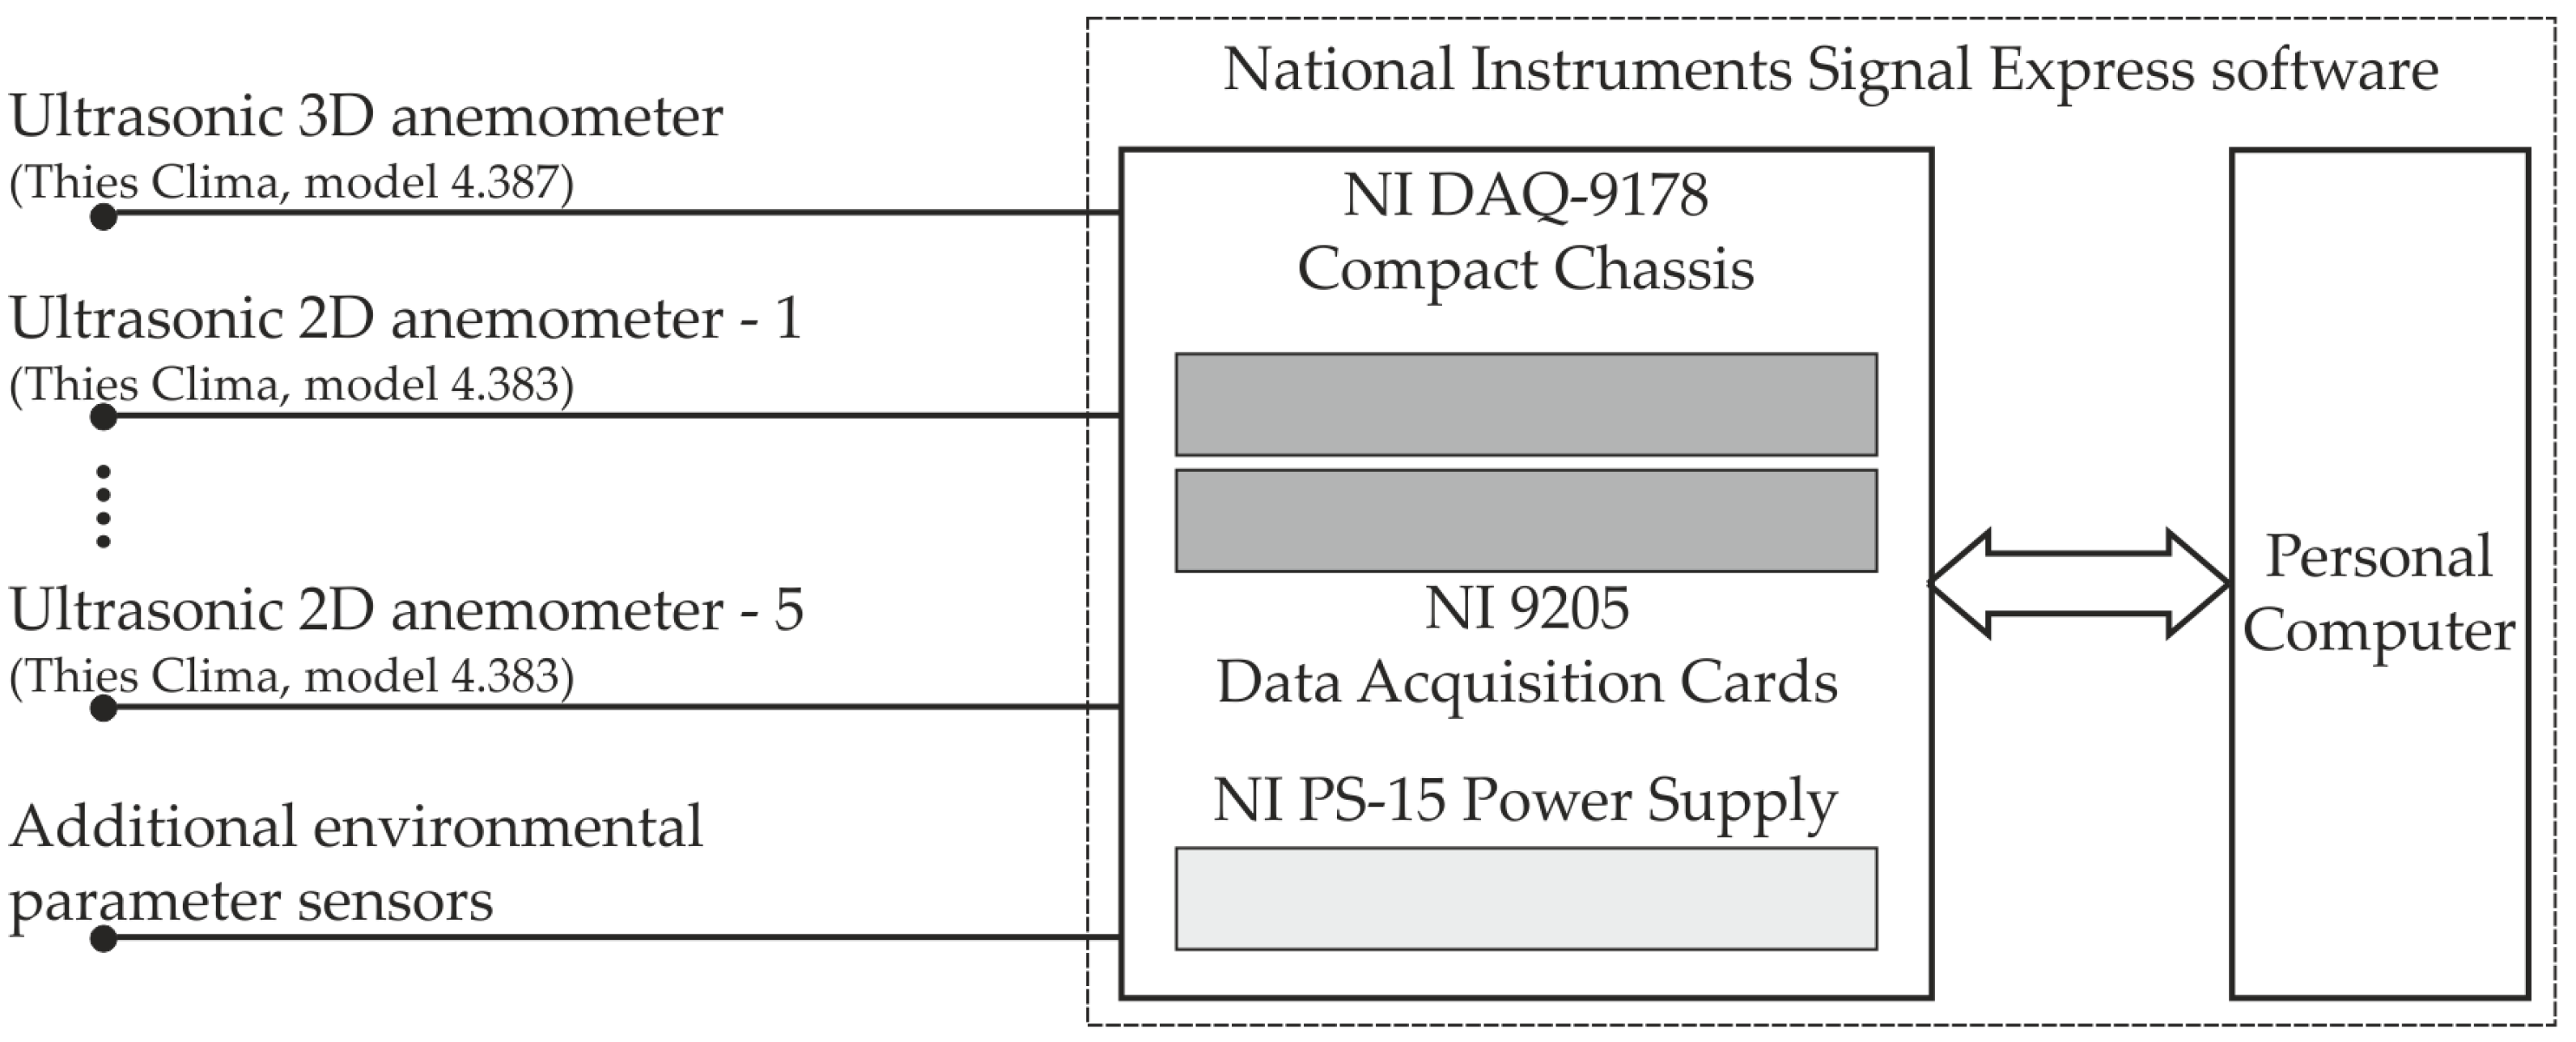
The data acquisition of the wind speed and direction was conducted using a set of National Instruments devices specifically designed for this purpose. It allowed for the simultaneous wind speed and direction measurements using 2D and 3D anemometers. Wind speed and direction data were recorded every 0.2 s. The system used is described in detail in [41,42] and is shown in Figure 2. Additionally, paper [43] shows, based on wind tunnel tests, that possible inaccuracies in the assembly of anemometers do not lead to unacceptable deviations in the measured angle and wind speed. These findings were important in light of current analyses, as sometimes it was impossible to maintain the exact assembling of anemometers both in the vertical and horizontal planes. All measurements were carried out over a period of approximately three hours on the single scaffolding.
The 2D anemometers were mounted to the outer posts of the scaffolding frames using steel brackets, protruding 0.36 m in front of the outer stand. In most cases, the scaffolding was of equal height to the building at which it was placed or up to 2 m higher. In order to avoid the impact of disturbances caused by the vortices shedding from the upper edge of the building on the measurement results, the anemometers were usually mounted about 1 m below the highest level of the scaffolding platforms or 2 m below the roof level. In some cases (E12_1, E13, E15, P10, L14, W14, W18), the 2D anemometers were placed along the entire span of the single scaffold level, and in others (E12_2, E16, P11), they were placed near the corner of the scaffolding. In case of scaffolding, L12 sensors were placed at two upper levels located above each other in order to capture the detachment of vortices from the edge of the building (comp. Table 1 and Table 2).

3. Results

3.1. Instantaneous Time Histories

The results obtained from the measurements of the wind speed and direction were analysed. For each sensor mounted on the scaffold, the instantaneous time histories were represented in local reference coordinates, where 0° corresponds to wind blowing from the building side. The datasets covered the entire measurement period, approximately three hours for each case. The values recorded by the 3D anemometer were considered as the reference wind speed and the direction of the flow acting on the scaffold. The data obtained from the 2D anemometers directly represented the prevailing wind angles and speeds in front of the scaffold where each sensor was mounted. The structures subjected to winds from relatively stable directions were chosen for further analysis, allowing for a clearer interpretation of local wind behaviour and facilitating a comparison between different scaffolding configurations.
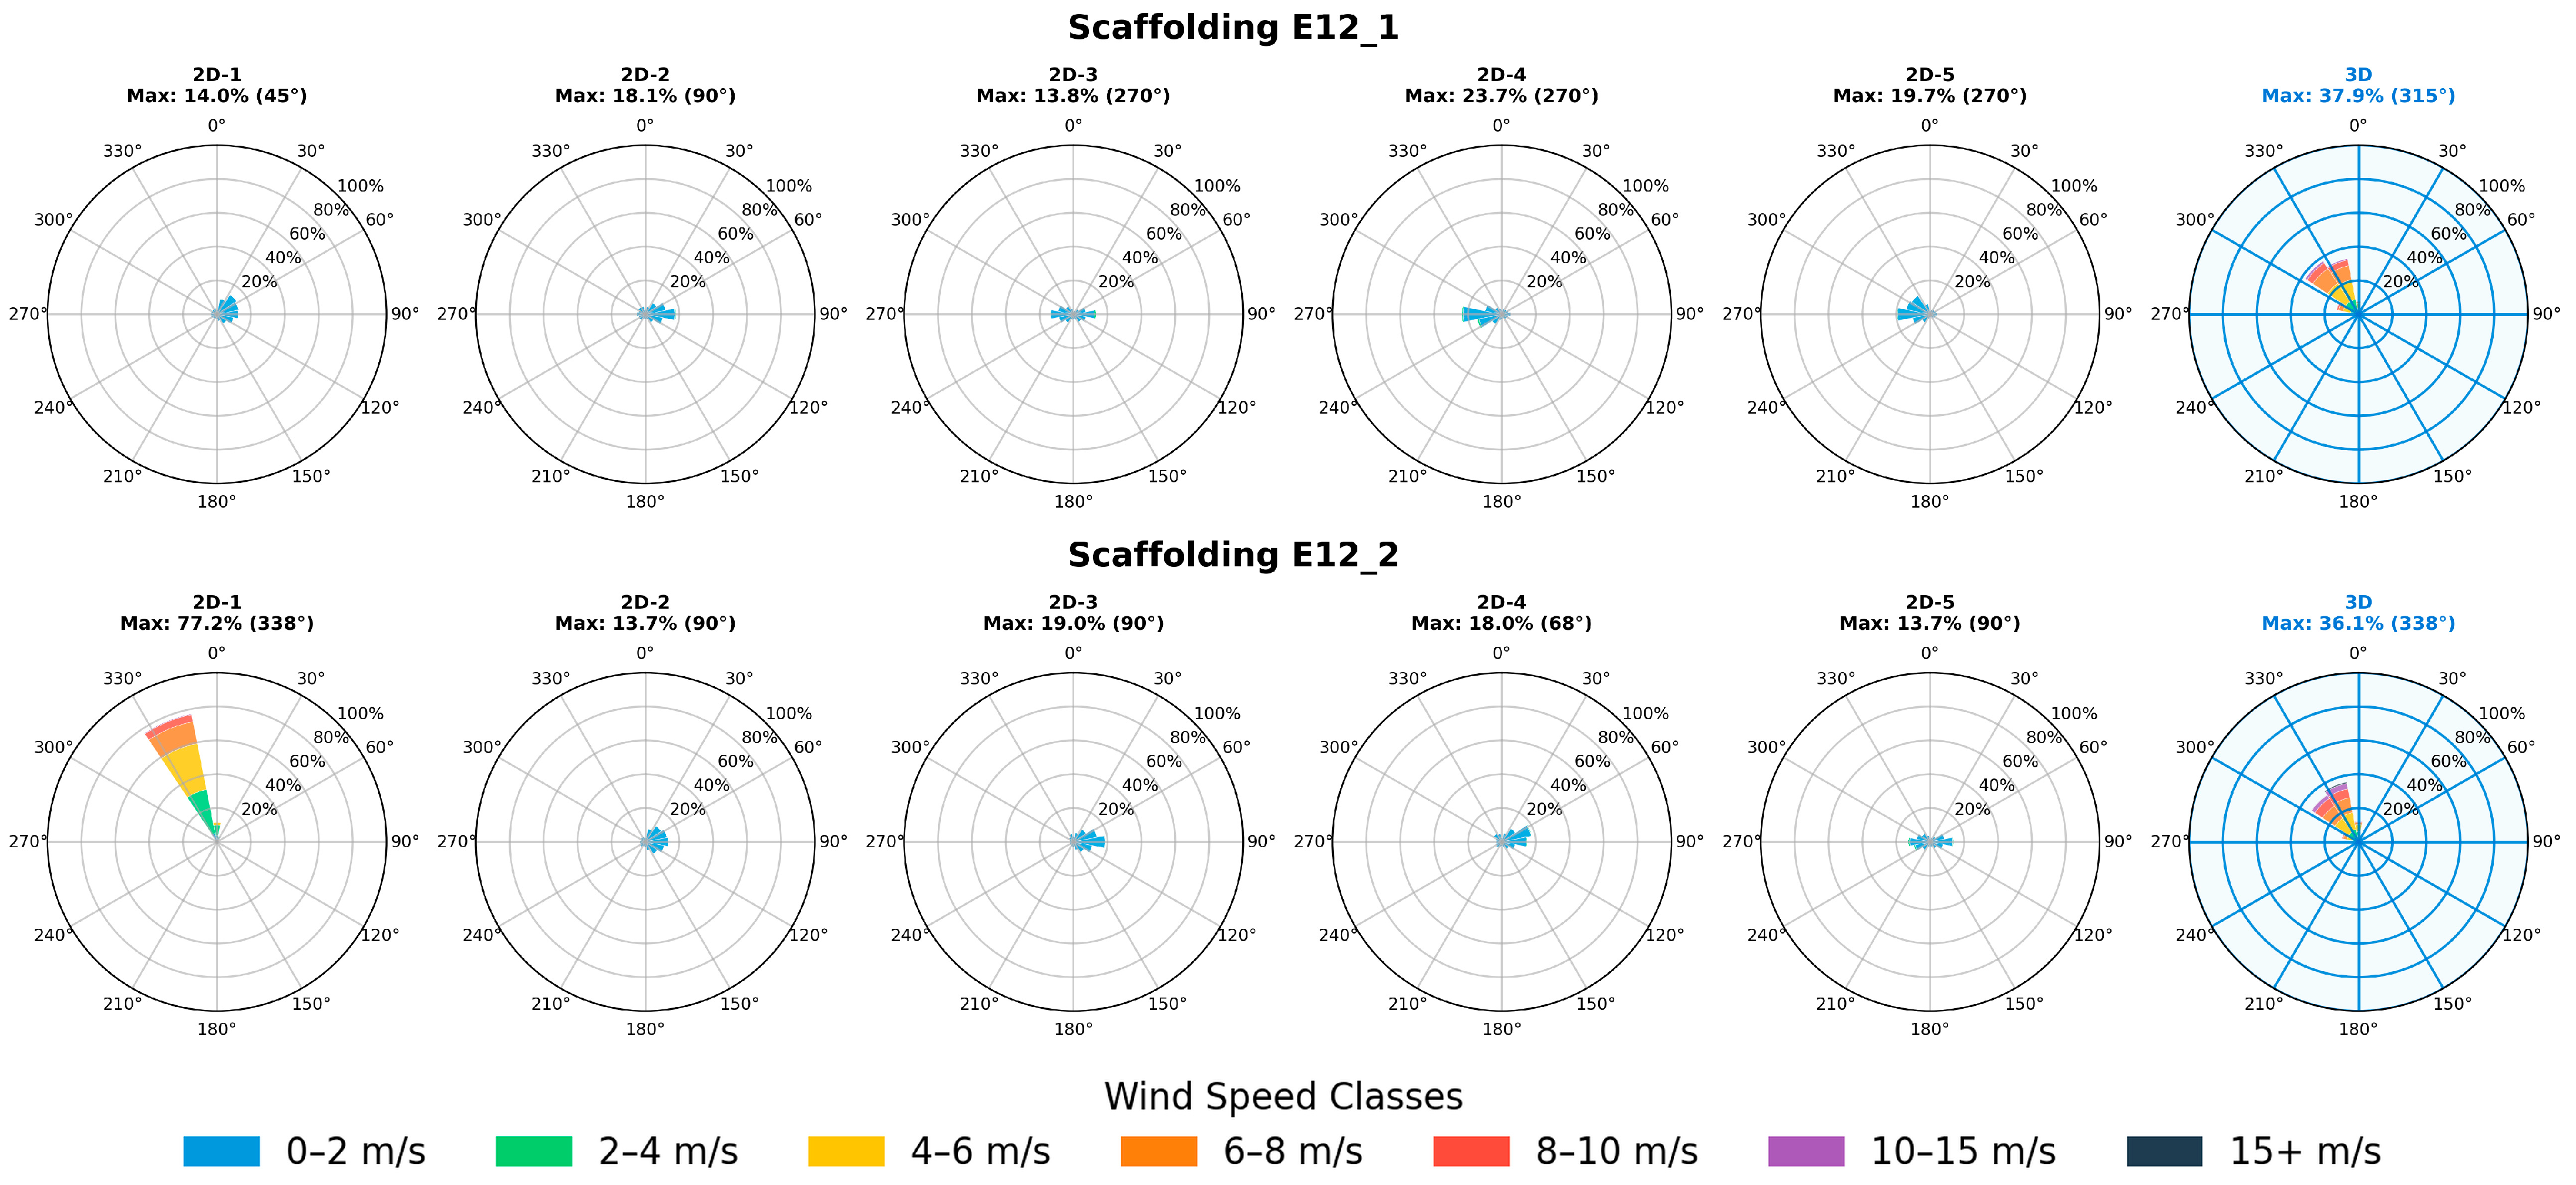
Figure 3 presents the wind measurement results for scaffold E12, which was covered with protective netting. This scaffold is of particular interest, due to its two distinct sensor arrangements, enabling a detailed assessment of the spatial variability in wind velocities across the structure. Two sets of results were obtained for scaffold E12, corresponding to two separate measurement sessions performed on the same day. In the first case, E12_1, the anemometers were distributed evenly on every second stand, starting from the second stand on the left. In the second case, E12_2, the anemometers were placed on the first five stands of the scaffold, counting from the left. The first stand of the scaffold, along with the 2D-1 anemometer, was located outside the building area.
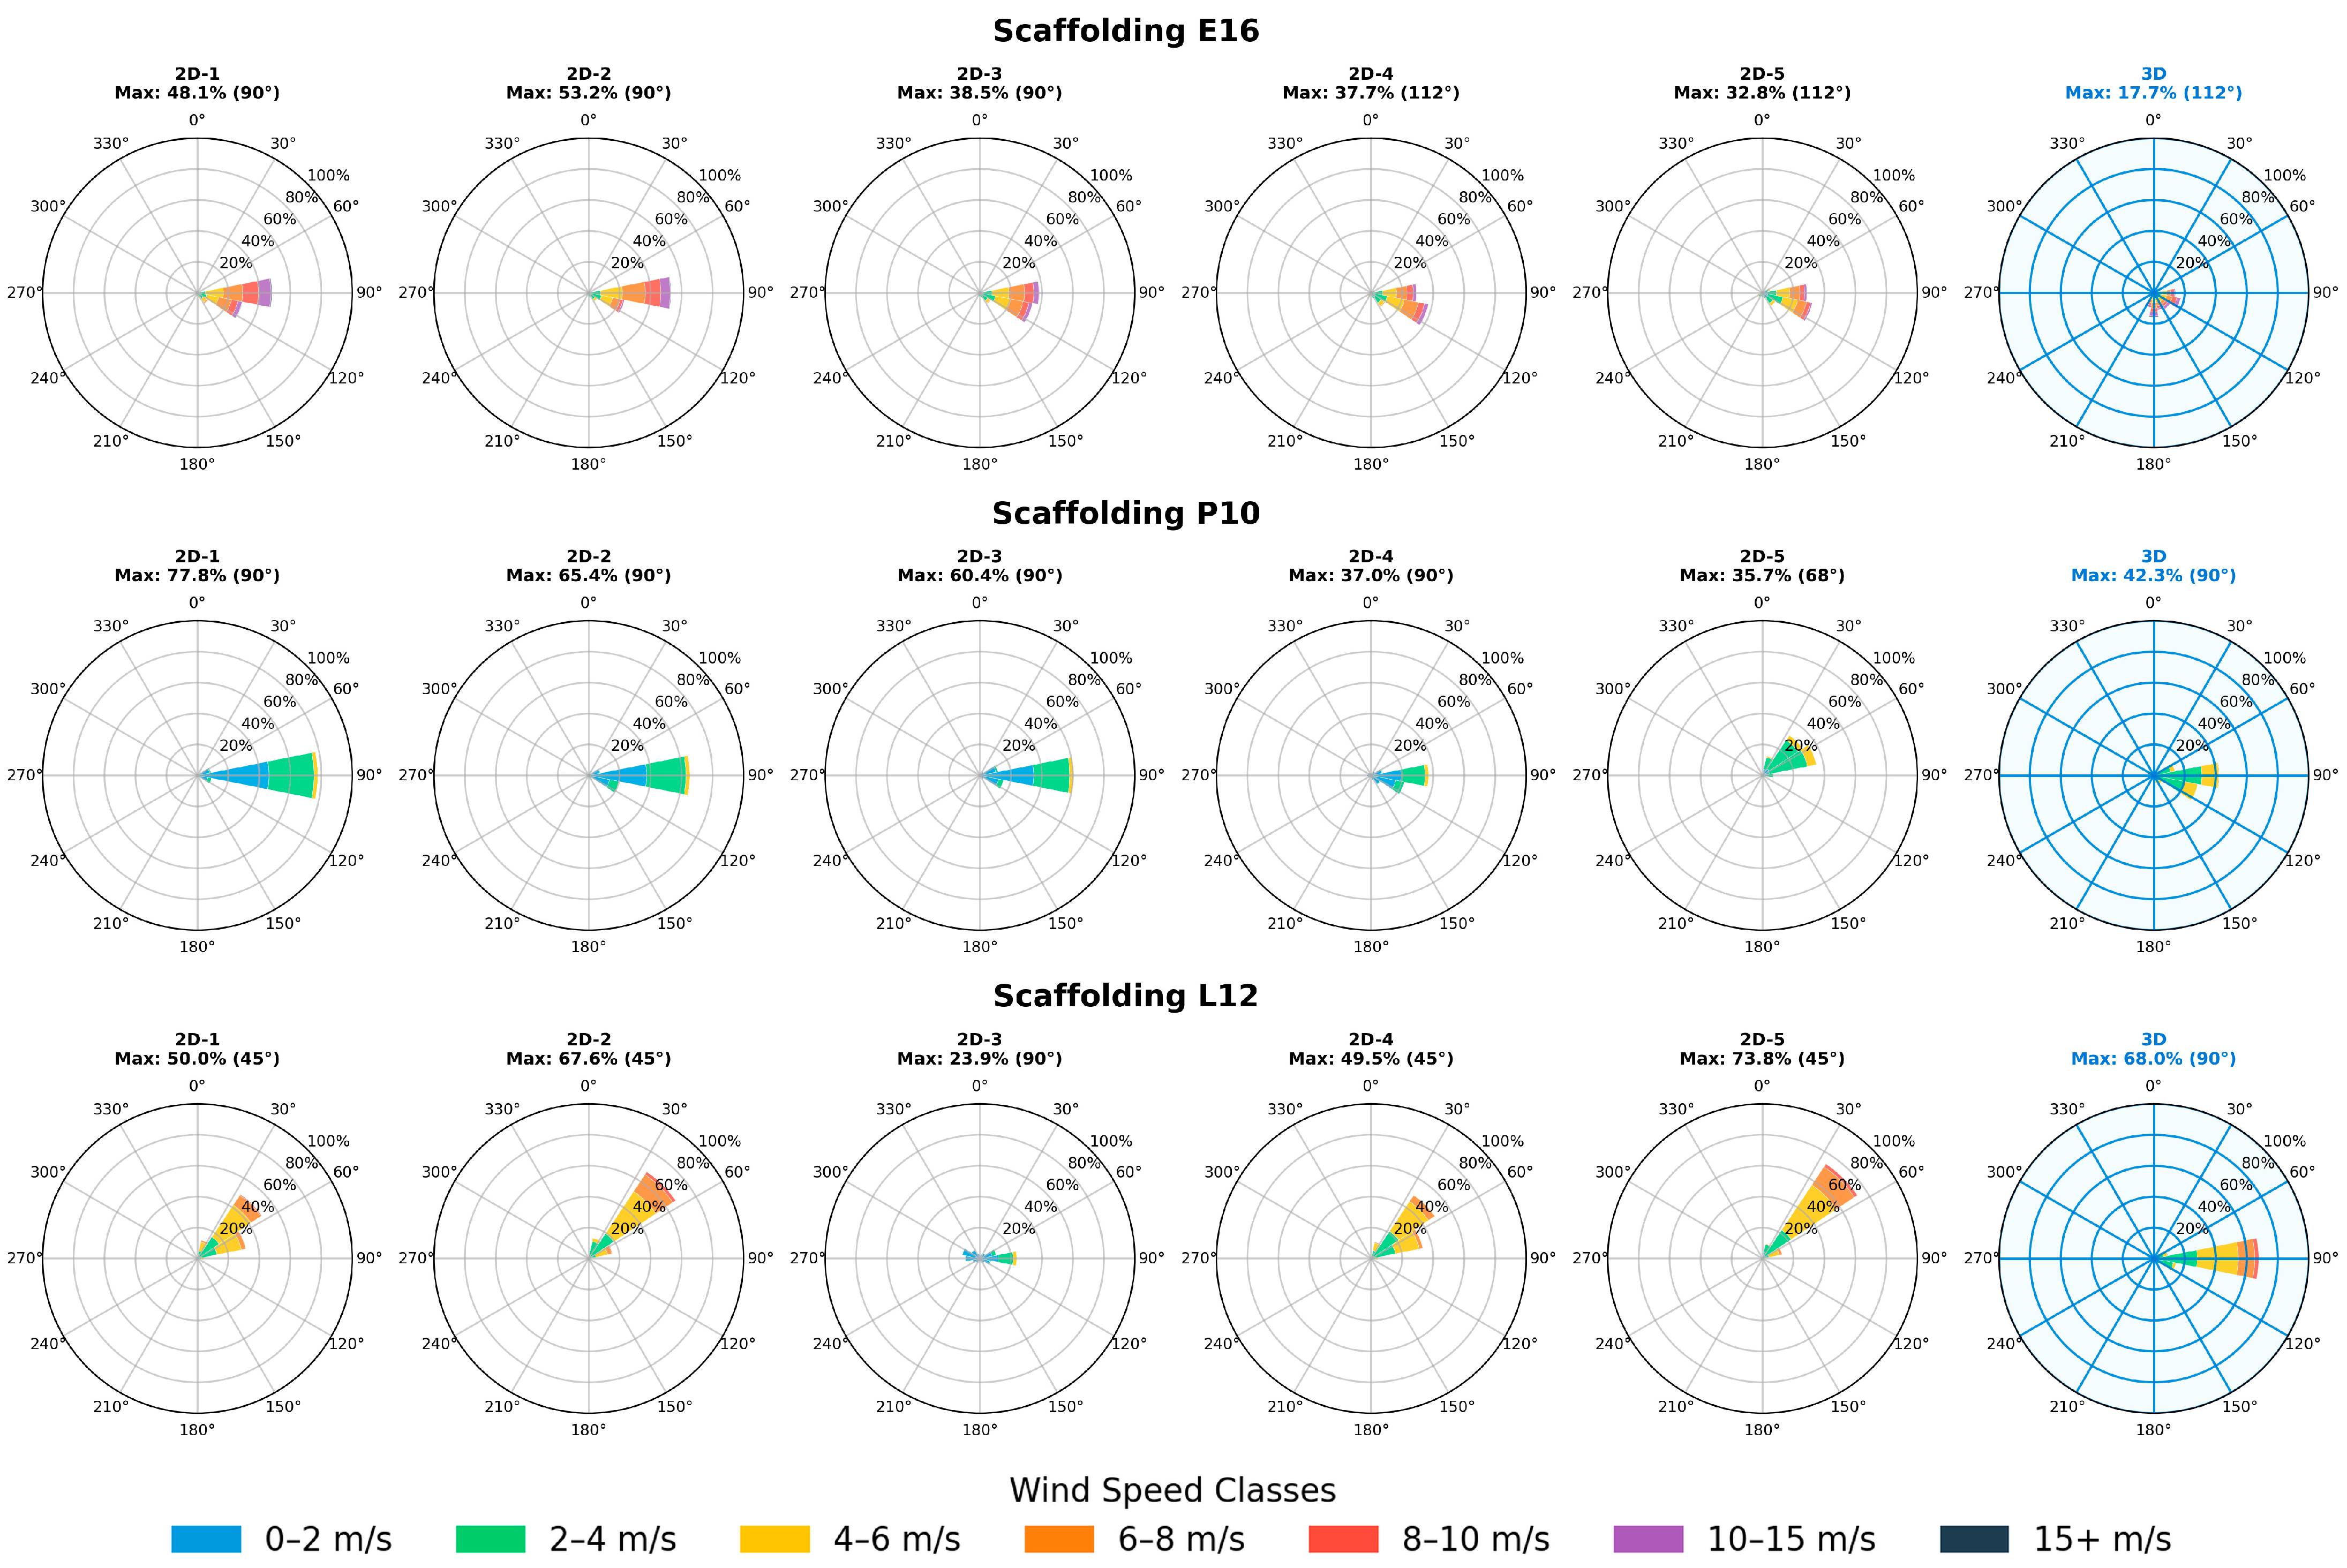
Figure 4 displays the results for the following scaffolds: E16, P10, L12. For scaffold E16 with protective netting, the 2D anemometers were mounted on five consecutive stands starting from the first stand on the left. The scaffold was covered with netting, which contained some gaps, and none of the stands protruded beyond the building outline. The results show wind speeds up to 10–15 m/s on all sensors. While the 2D anemometers show the prevailing wind directions in sectors 60–120°, the direction of the incoming wind from 3D anemometer ranged from 60° to 210°. The prevailing wind direction on sensors 2D-1, 2D-2, and 2D-3 was 90°, and on 2D-4 and 2D-5, it was 112°. For scaffold P10, the 2D anemometers were distributed along the entire span, from the first stand on the left to the last stand on the right, which was located outside the building area. The maximum wind speeds measured by the anemometers ranged from 4 to 6 m/s. The 3D sensor recorded wind directions in the range 60–120°, with 90° being the most frequent direction, with an occurrence of 42.3%. This was also the prevailing wind direction for all 2D sensors, except 2D-5, for which 68° occurred with 37.5% frequency.
In the case of scaffold L12, only the 2D-1, 2D-2, and 2D-3 sensors were placed on the penultimate level of the scaffold. The 2D-4 sensor was located one level below 2D-1, on the first stand on the right, protruding beyond the building outline. The 2D-5 anemometer was one level below 2D-2, on the second stand from the right, also outside the building area but close to the building edge. The 2D-3 sensor was mounted on the third stand from the right, with the building behind it. The 3D sensor recorded a main wind direction of 90° with 68% occurrence. The 2D-3 sensor showed that the wind directions covered most sectors, with a maximum occurrence of 23.9% for 90°. Other 2D sensors recorded a maximum occurrence for 45°: 67.6% for 2D-2 and 73.8% for 2D-5. Both of them were placed closer to the building edge. Sensors 2D-1 and 2D-4, placed outside the building area, also recorded a maximum occurrence for 45°: 50.0% and 49.5%, respectively. The wind speeds ranged as follows: 8–10 m/s for 3D, 2D-2, and 2D-5; 6–8 m/s for 2D-1 and 2D-4; 4–6 m/s for 2D-3.
The presented results illustrate the variability of wind conditions across different scaffold configurations and highlight the influence of geometry, sensor placement, and the presence of protective netting on the local wind characteristics.

3.2. Data Processing and Directional Analysis

The measurement data were processed to enable subsequent comparison with the normative wind load provisions given in EN 12811-1 [1]. All recorded wind speed and direction time series from both 2D and 3D sensors were converted to 10 min moving averages, consistent with the averaging period specified in EN 1991-1-4 [44] for determining the mean wind velocities. This temporal resolution matches the statistical basis of the European wind code and ensures comparability between the measured and code-prescribed values. To account for the directional variability of the wind exposure at each site, the processed data were divided into 30° directional sectors (0–30°, 30–60°, etc.) based on the reference 3D anemometer measurements. For each sector, the maximum 10 min mean wind speed was identified to characterise the most significant conditions from that direction. Only time periods during which the 3D anemometer recorded mean wind speeds exceeding 3 m/s were included in the analysis. This threshold was introduced because, at low wind speeds, the wind direction exhibits high variability and thus may not fully reflect the actual wind load on a scaffold.
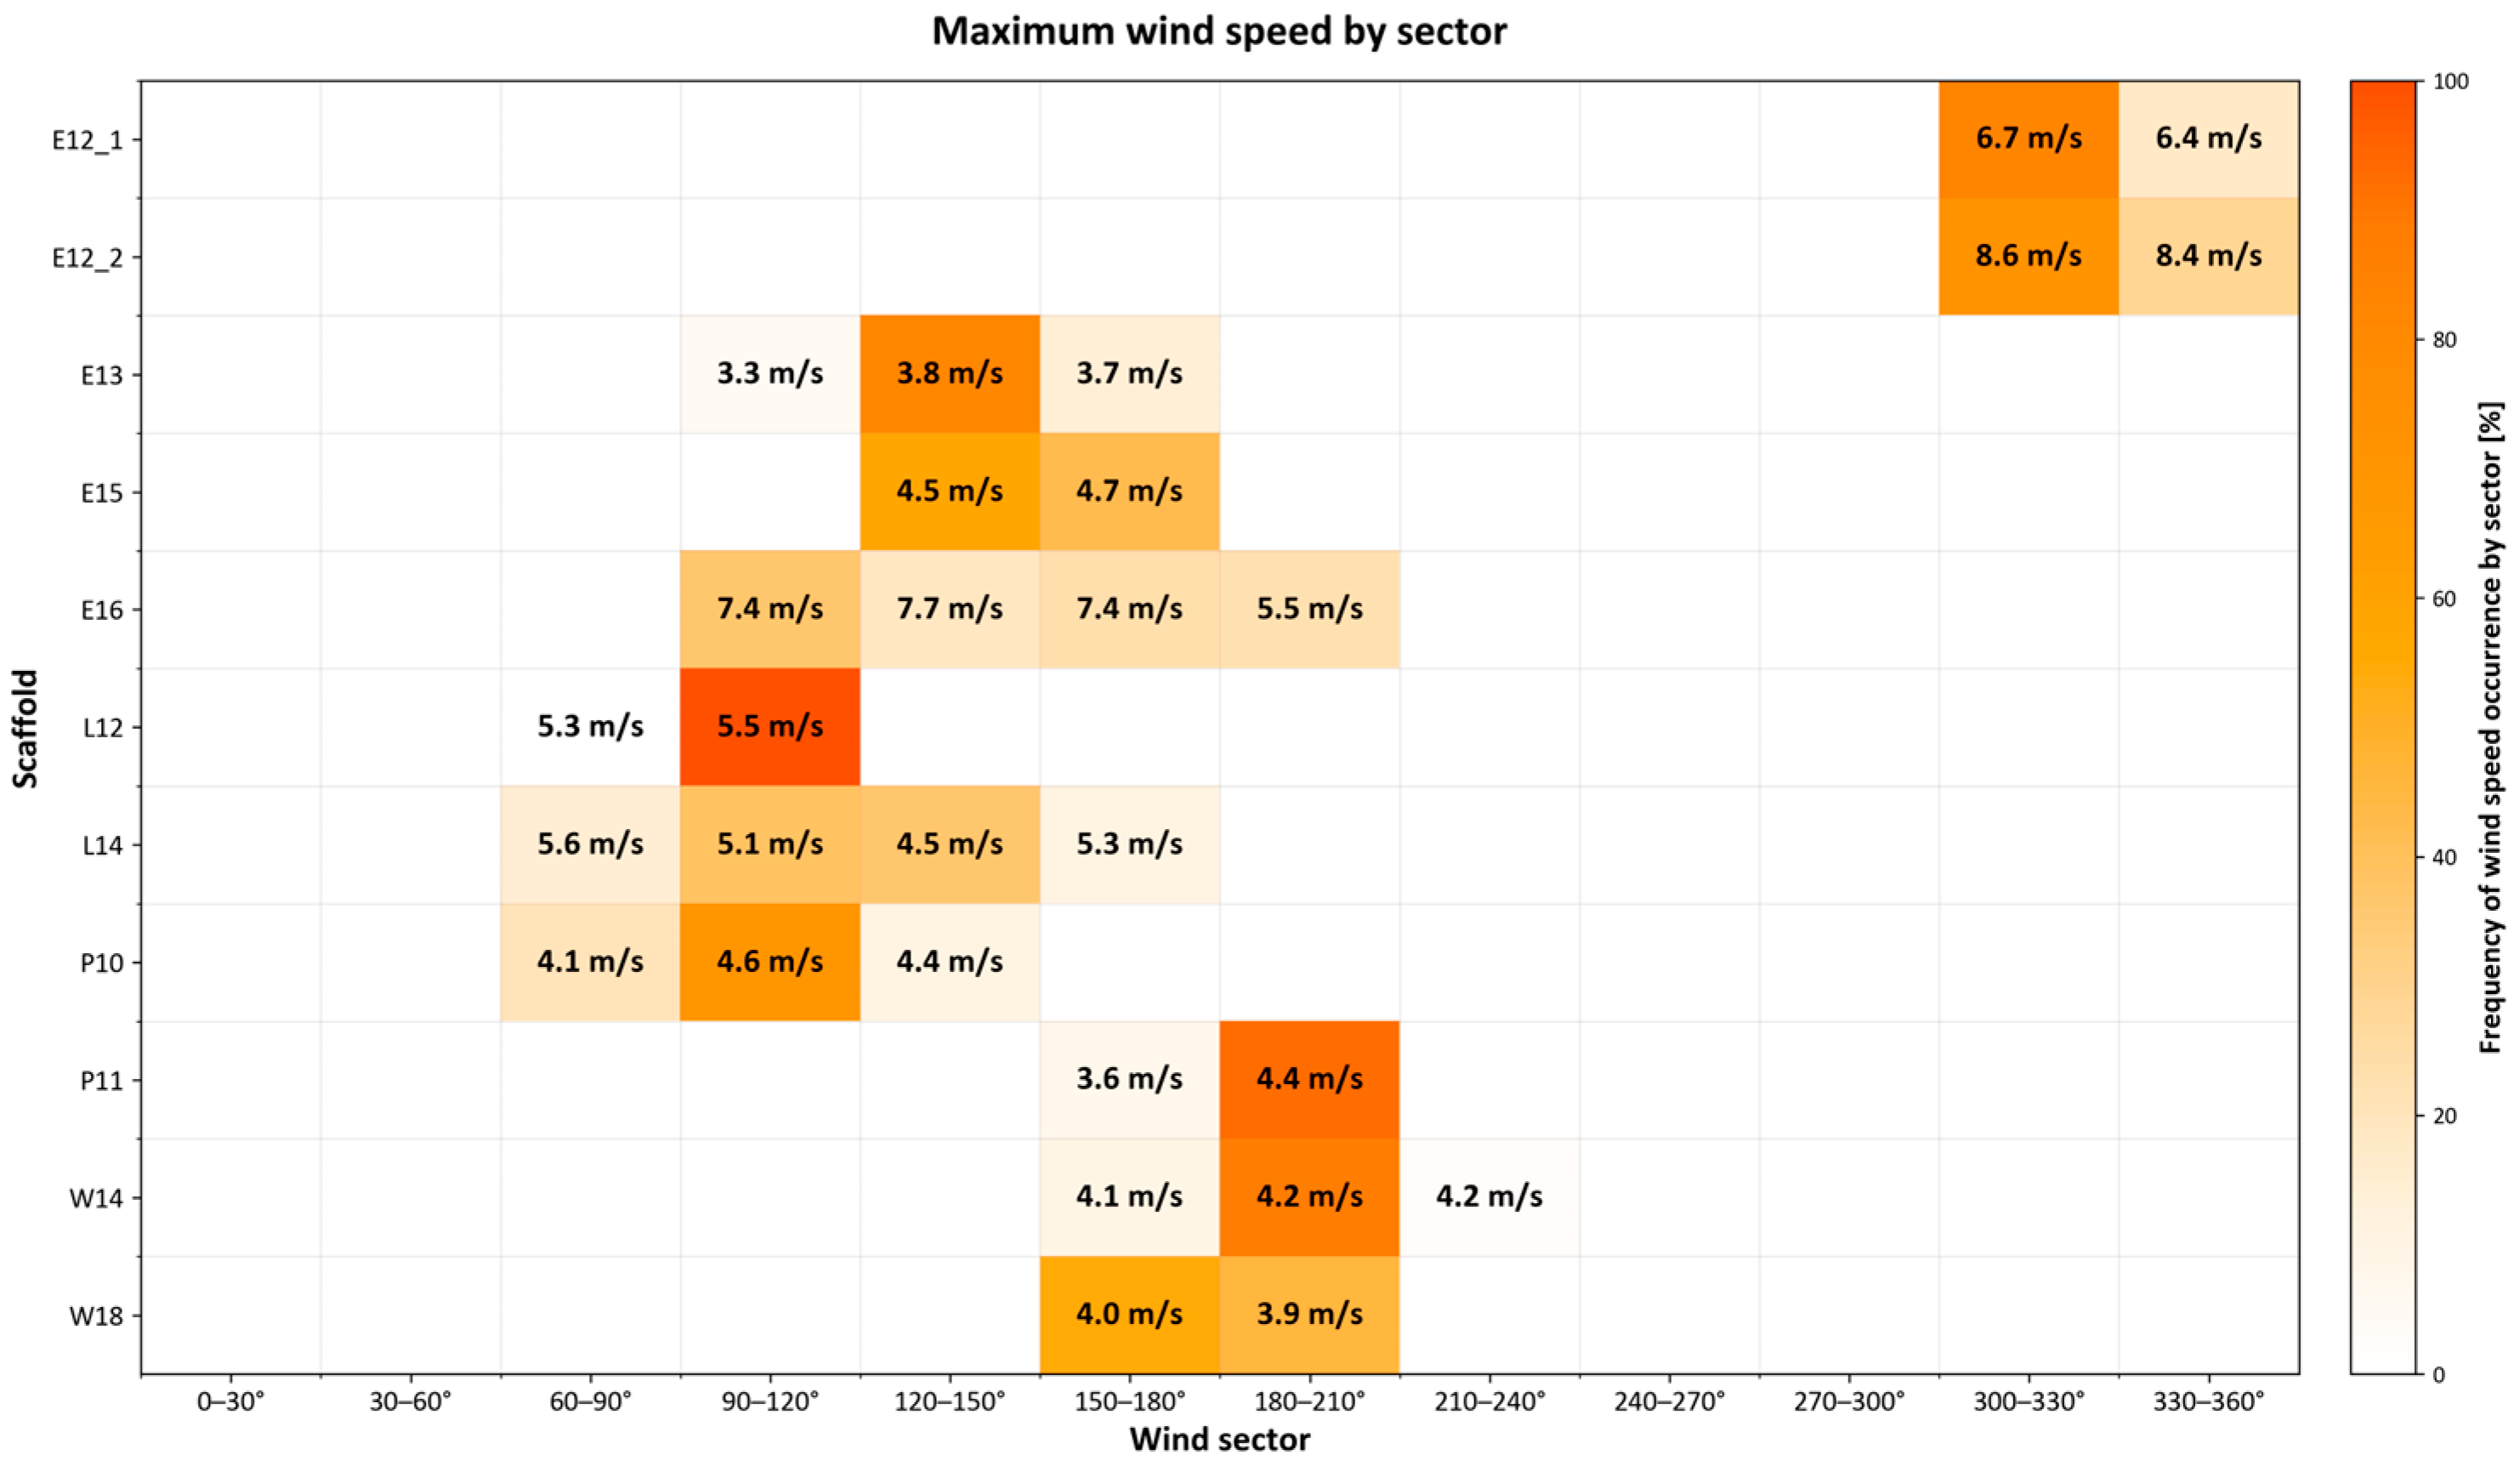
Figure 5 presents both the directional distribution and intensity of wind during the measurement campaigns for each scaffold. The colour intensity represents the frequency of the wind occurrence from each direction sector, expressed as a percentage, while the numerical values indicate the maximum 10 min mean wind speed recorded in that sector.
The distributions illustrate that, in most cases, the inflow was not perfectly aligned with the cardinal directions (0°, 90°, 180°, 270°) that would correspond to purely perpendicular or parallel flow. Instead, the actual wind approached the structures at oblique angles, with peak frequencies occurring also in intermediate sectors. This finding highlights the importance of accounting for the local wind environment and nearby obstacles, which can substantially modify both the flow direction and magnitude even within a single construction site.

3.3. Normative Comparison Methodology

To compare the measured wind speeds with those calculated according to the standard [1], a recalculation procedure was applied. According to the Eurocode [44], the mean wind speed at height z , above the ground is defined as
v z = c r z · c o z · v b ,
where v b is the fundamental basic wind velocity adjusted for the wind direction and season, c r ( z ) is the roughness factor, and c o ( z ) is the orography factor, taken as 1.0, since the National Annex provides no other value. The roughness factor c r z can be expressed as
c r z = 0.19 · z 0 z 0 , I I 0.07 · l n z z 0 ,
where: z 0 is the surface roughness length determined by the terrain category, and z 0 , I I = 0.05 m is the roughness of the second category of terrain.
The 3D anemometer was positioned above the influence zone of the scaffold and was considered representative of the undisturbed flow at the site. Because a full-scale vertical wind speed profile was not measured during the study, due to costs and limitations in number of sensors, the vertical variation between the 3D reference and the 2D sensors was reconstructed using the normative wind profile defined in Eurocode [44]. To obtain the expected wind speed at the 2D sensor height v ( z 2 D ) , the mean wind speed measured at the 3D anemometer height v m z 3 D was calculated using the wind profile described by Equations (1) and (2). The calculated 2D-height wind speed components, corresponding to the measured parallel and perpendicular components, were expressed as
v z 2 D = c r z 2 D c r z 3 D · v m , z 3 D ,
v z 2 D = c r z 2 D c r z 3 D · v m , z 3 D .
According to [1], the influence of the adjacent building on wind action should be considered when evaluating the wind load on scaffolding. The standard provides wind loads in terms of resultant forces acting on scaffold components, given by
F = c s i c f , i A i q i ,
where F is the resultant wind force on scaffold components, c f , i is the aerodynamic force coefficient for component i , A i is its reference area, q i is the velocity pressure acting on the component, and c s is the site coefficient accounting for the position of the scaffold relative to the building and the solidity ratio of the façade. For fully solid building façades and bare scaffolding structures, c s , = 1.0 for wind along the scaffold, and c s , = 0.25 for wind perpendicular to it. For permeable protective netting, the coefficients can be taken from Annex A.4 of [1].
Since the standard does not directly specify the wind speeds, the velocity pressure q i was converted into an equivalent wind speed at the 2D sensor height to enable a direct comparison with the measured 2D wind speeds. Because the velocity pressure is proportional to the square of the wind speed ( q v 2 ), the site coefficient c s effectively scales the local dynamic pressure and thus the squared velocity. Denoting by v z 2 D the reference wind speed from the normative profile at the 2D sensor height and by v m the corresponding measured 10 min mean speed, the relation between the measured and reference squared velocities can be written as
v m 2 = c s · v 2 ( z 2 D ) .
The equivalent normative wind speed allowing for direct comparison with measured speeds can be expressed as
v E N z 2 D = c s · v z 2 D ,
and separating for components parallel ( ) and perpendicular ( ) to the scaffold:
v E N , z 2 D = c s , · v z 2 D ,
v E N , z 2 D = c s , · v z 2 D .
This approach allows a direct comparison between the wind speeds measured at the 2D sensors and the wind action calculated according to the standard, while clearly showing the influence of site conditions through the site coefficient c s . The adopted coefficients for each scaffold, together with the vertical positions of the 2D and 3D sensors and terrain roughness heights, are summarised in Table 4.

3.4. Case Studies: Wind Velocity Patterns

For each scaffold, representative wind sectors were selected based on the 3D anemometer data—typically those with the highest frequency of occurrence or the largest mean wind speeds. Within these sectors, the measured velocity vectors from all 2D sensors were compared with the normative values.
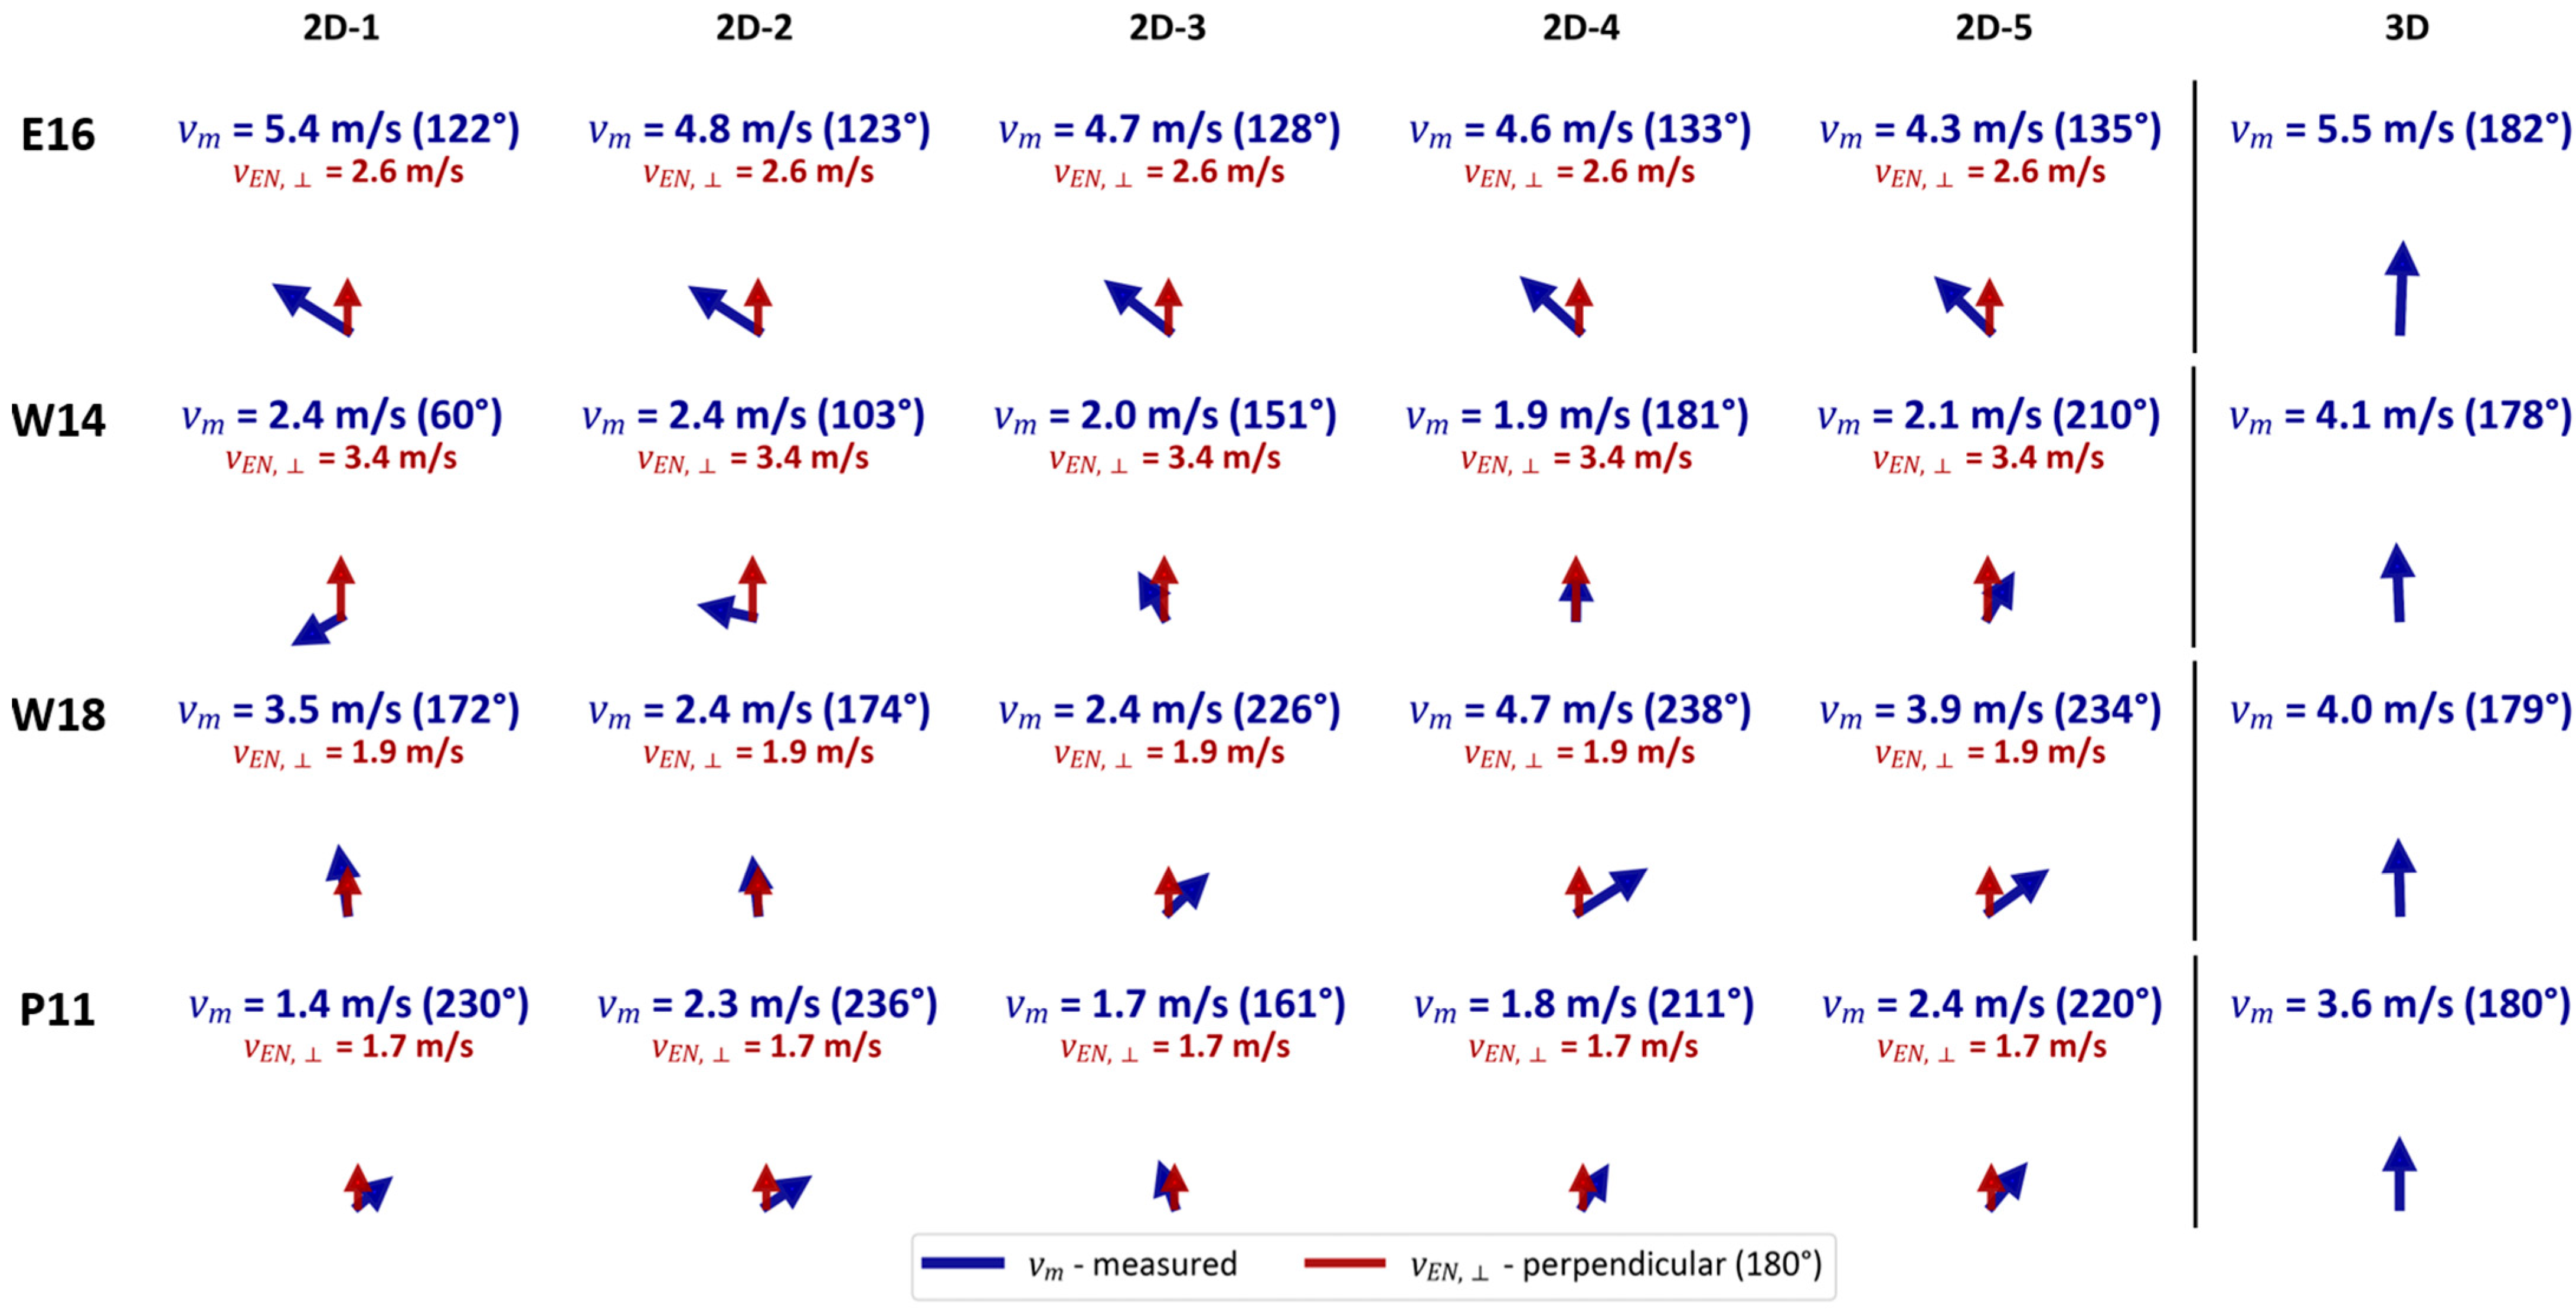
Figure 6 presents the comparison of the measured and reference wind velocity vectors for scaffolds exposed to wind inflow approximately perpendicular to the façade, 180° (± 5°). For scaffold E16, equipped with protective netting and measured during storm conditions, all five 2D sensors recorded velocities close to the reference 3D anemometer (differences ranging from −3% to −22%), with directional deviations of 47° to 60°. All the measured velocities substantially exceeded the normative values by 66% to 105%, indicating that the standard significantly underestimates the wind action during measured weather conditions.
Scaffolds P11 and W14 exhibited substantially lower velocities compared to the reference (reductions of 32% to 61% and 40% to 53%, respectively). Large directional deviations—up to 57° on scaffold P11, at sensor 2D-5, located outside the building edge, and 117° on scaffold W14 indicate complex three-dimensional flow patterns including lateral deflection and recirculation zones. Compared to normative predictions, P11 showed mixed results (three sensors 2% to 14% below and two sensors 36% and 46% above), while the W14 measurements were consistently 28% to 44% below the code values.
Scaffold W18 displayed high spatial variability. Sensors outside the building envelope showed velocity reductions of 10% to 40%, while sensors within or near building discontinuities exceeded or matched the reference values. All the W18 sensors exceeded the normative predictions by 23% to 140%, with the highest values near geometric discontinuities. This pattern, combined with directional deviations up to 59°, suggests the presence of a local acceleration zone, likely caused by flow channelling effects or vortex structures formed at building corners.
Figure 7 presents the wind vectors for scaffolds exposed to flow approximately parallel to the façade (≈90°). Scaffold L12 exhibited highly variable behaviour depending on sensor position. Sensors at the scaffold edge outside the building envelope (2D-1, 2D-4) matched the reference velocities and exceeded the normative values by 7% to 10%. Sensors near the building edge (2D-2, 2D-5) showed similar behaviour, exceeding the norms by 18% to 20%. Sensor 2D-3 within the building envelope recorded 75% velocity reduction and measured 72% below the normative values, demonstrating strong geometric sheltering at mid-façade positions. The measured directions at sensors 2D-1, 2D-2, 2D-4, and 2D-5 deviated by 37° to 46° from the nominal 90° inflow, suggesting significant flow deflection around the building edges, while the sensor 2D-3 showed smaller directional deviation (23°).
Scaffolds L14 and P10 exhibited consistent velocity reductions of 55% to 67% across all sensors, with measurements 52% to 65% below the normative predictions and minimal directional deviations (2° to 18°), characteristic of a well-developed boundary layer flow along extended façades.
Overall, the parallel flow results reveal that the normative provisions substantially overestimate the wind action in most cases (typically 50–65% below code predictions), except at exposed positions beyond the building envelope.
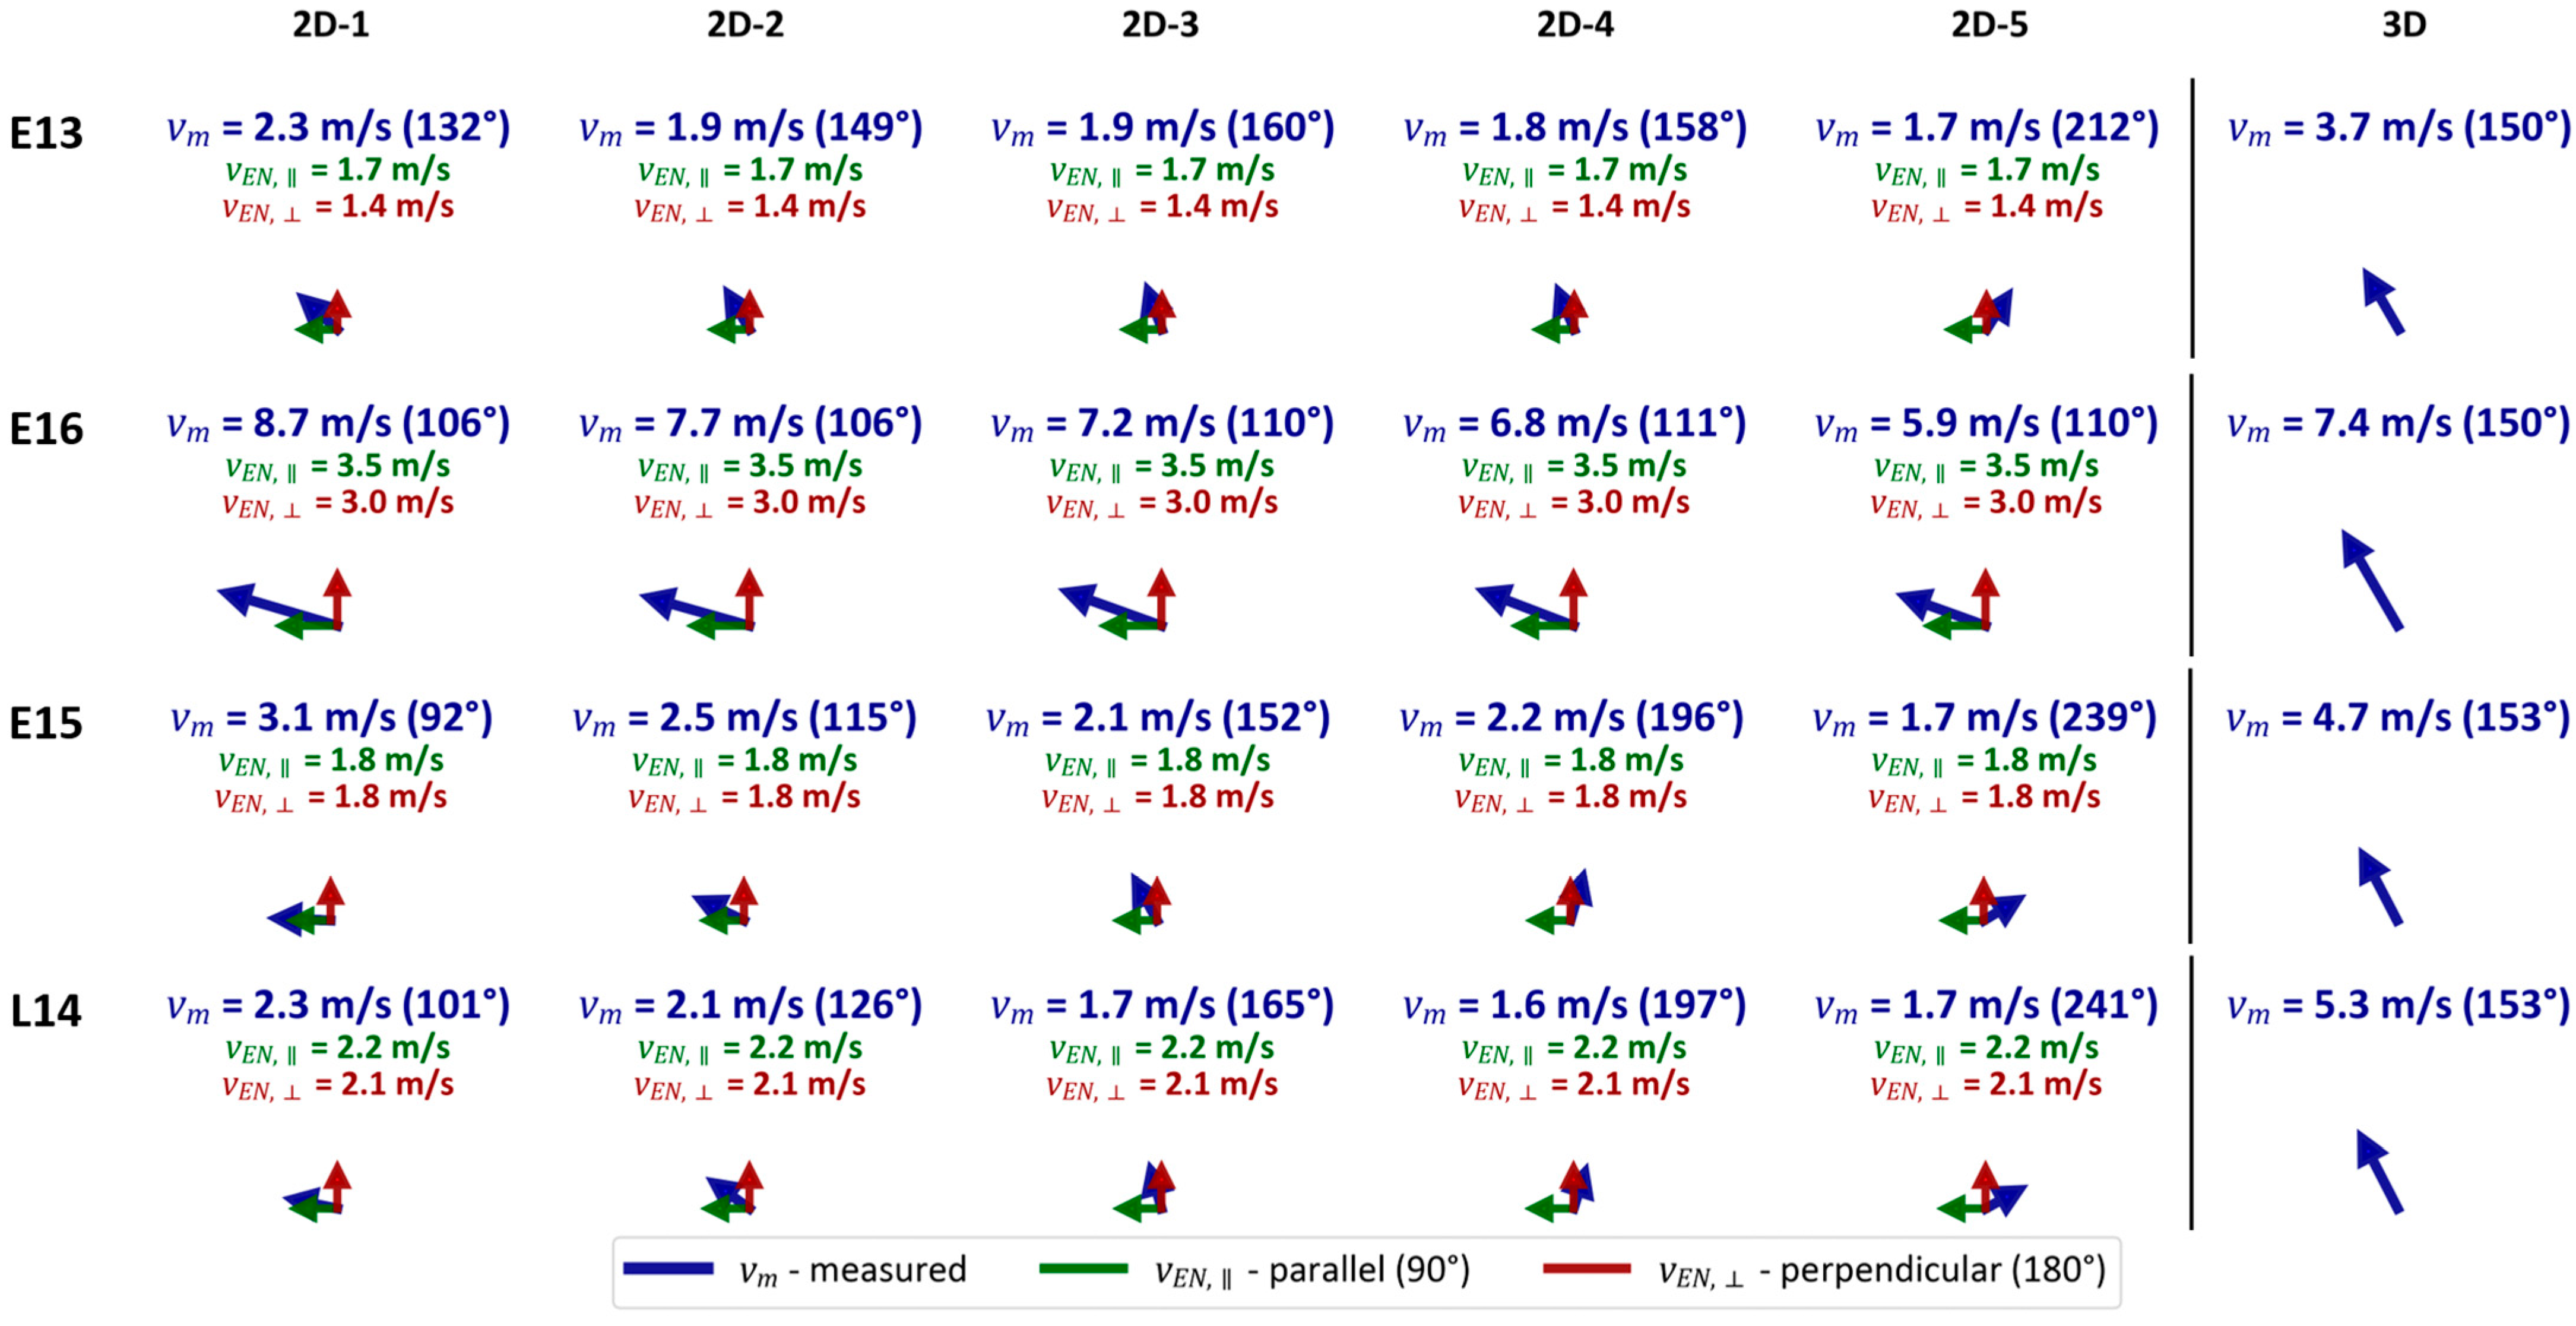
Figure 8 presents the results for the oblique inflow at 150° and 153°, where both the parallel and perpendicular components contribute to the total wind action. For netted scaffolds E13 and E16 (non-storm conditions for E13), the sensors showed variable behaviour depending on the position. Sensors 2D-1 through 2D-4 on scaffold E13 recorded velocity reductions of 39% to 52% relative to the reference, with measured values ranging from 4% above to 18% below the normative ones. Sensor 2D-5, extending beyond the building envelope, showed the strongest reduction (54% below reference, 22% below normative velocity), indicating that the position outside the building envelope combined with net sheltering produces significant flow attenuation. Scaffold E16, also netted but measured during storm conditions, exhibited different behaviour. Sensors 2D-1 and 2D-2 recorded velocities exceeding the reference by 18% and 4%, while sensors 2D-3, 2D-4, and 2D-5 showed progressive reductions by −2%, −7%, and −20%, respectively. Despite these variations relative to the reference, all the sensors substantially exceeded the normative predictions by 28% to 88%, with the highest exceedance at the 2D-1 sensor.
Scaffold E15, displayed velocity reductions of 36% to 63% relative to the reference. Sensor 2D-1, located near the windward building edge and extending beyond the envelope, exceeded the normative predictions by 19% with 60° directional deviation, demonstrating strong corner acceleration effects, where the oblique inflow interacts with the building edge. Sensors 2D-2 through 2D-5 measured velocities 3% to 32% below the code values, with progressive velocity reduction toward the leeward side, indicating wake development and flow separation downstream of the corner.
Scaffold L14 showed consistent reductions of 56% to 70% below the reference and 24% to 49% below the normative values, with sensor 2D-5 at the recessed building corner exhibiting the largest directional deviation of 88°, indicating a strong flow redirection caused by the building geometry.
These case-specific analyses demonstrate that wind action on scaffolding is strongly dependent on the inflow direction, building geometry, scaffold position, protective measures, and weather conditions. Windward corners on unnetted scaffolds, for example of E15, sensor 2D-1, produced significant acceleration, up to +19% above normative values. Mid-façade and leeward positions showed substantial reductions, 50–70% below normative values. Netted scaffolds generally showed reduced velocities, but storm conditions (E16) amplified the loads dramatically, producing exceedances up to 88% above the code predictions, even with netting in place. Although not analysed in the present study, the presence of nearby buildings can have a considerable impact on the wind field and, consequently, on the loads acting on the scaffolding.
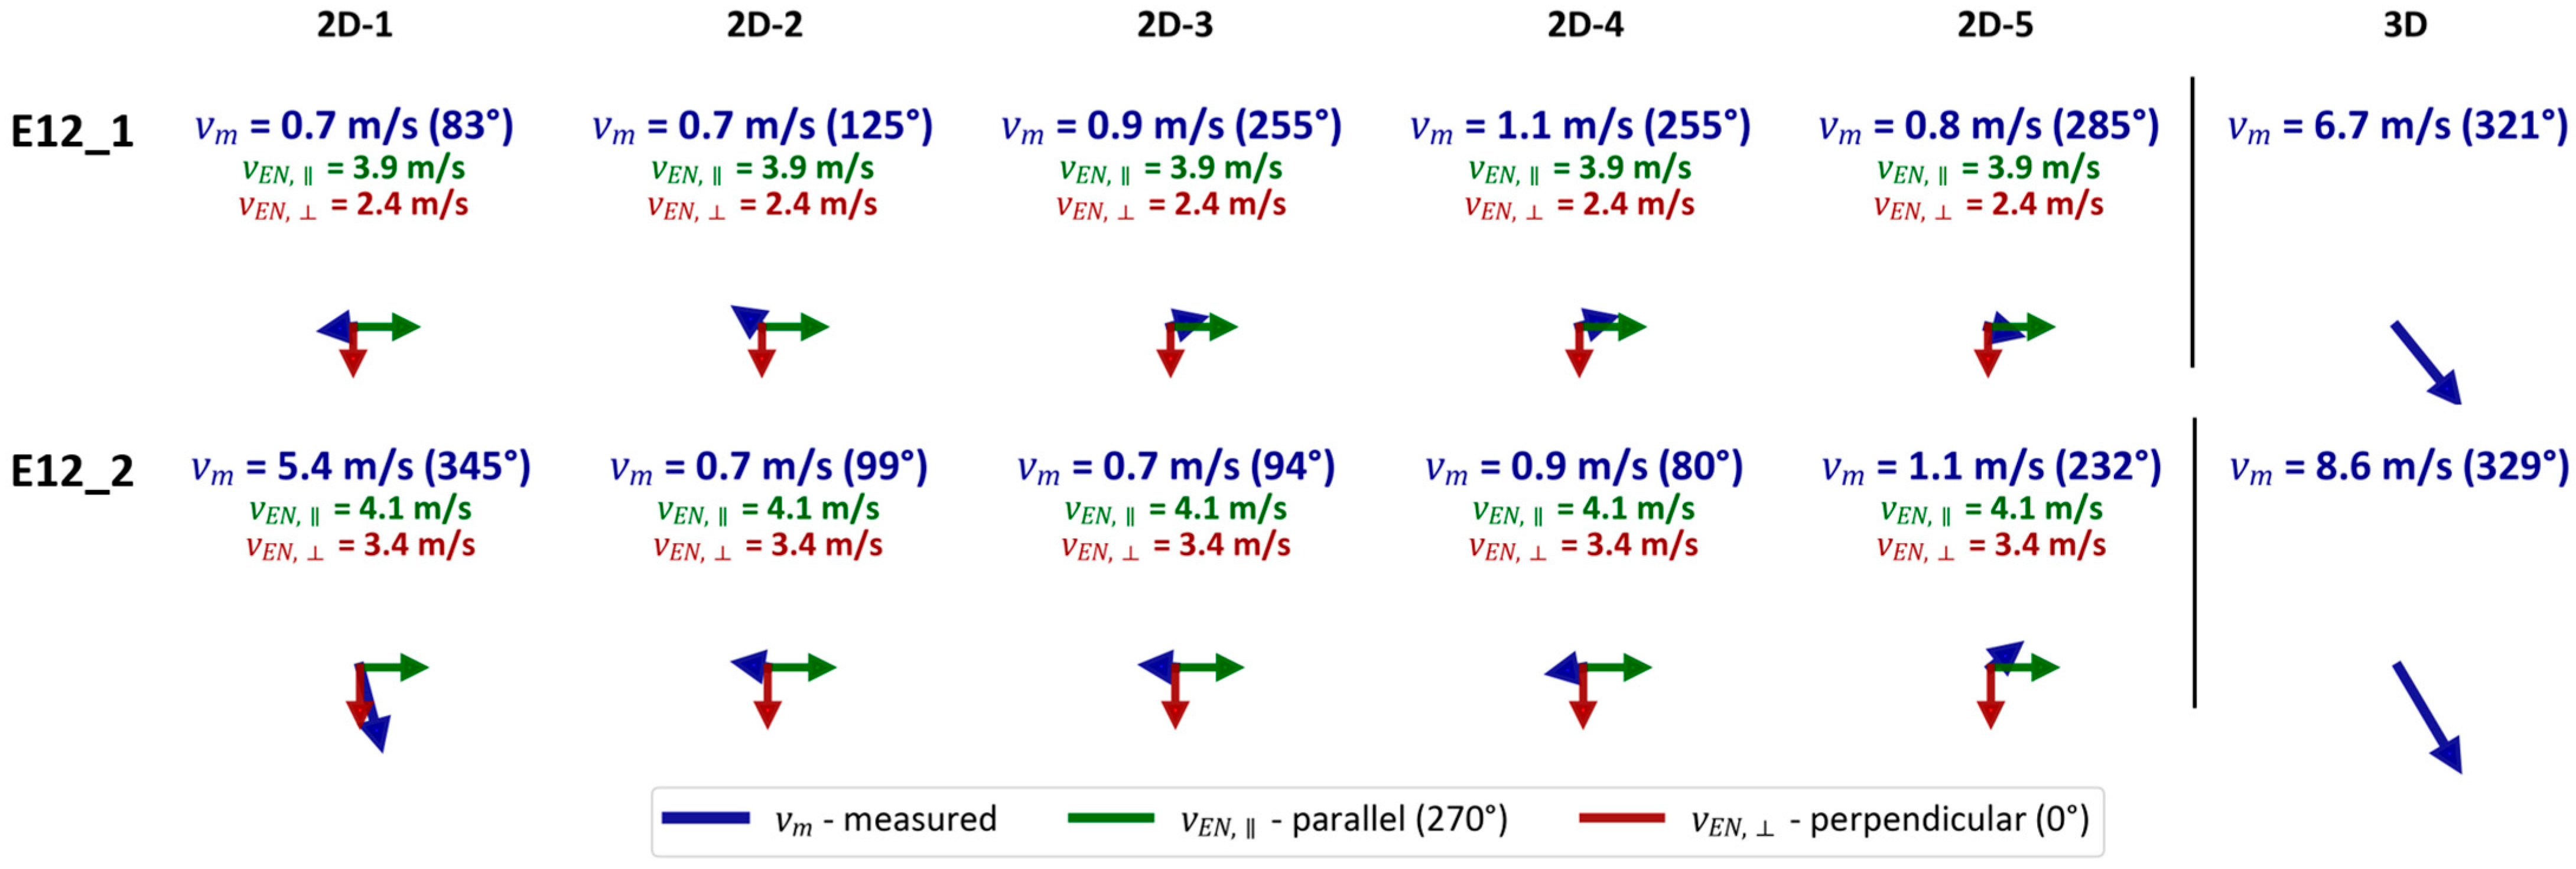
Figure 9 illustrates the wind vectors at scaffold E12 during two different measurement campaigns with varying reference velocities. Despite a 28% increase in the reference velocity, from 6.7 to 8.6 m/s, sensor 2D-2 showed a 57% velocity increase with directional changes up to 45°, confirming the higher directional sensitivity of the local flow. Sensor 2D-1, positioned beyond the building envelope, recorded velocities equal to approximately 63% of the reference value with only 6° directional deviation, indicating direct exposure. This comparison confirms that local flow patterns exhibit larger variability than the overall inflow, particularly near edges and protruding elements.

3.5. Assessment of Normative Site Coefficients

To evaluate how well the normative site coefficient c s represents the actual wind conditions at the measurement sites, a comparative analysis of the measured and reference wind velocities was performed. According to Equation (6), the measured and normative squared wind speeds are related as v m 2 = c s v 2 ( z 2 D ) . This allows the direct assessment of whether the code-prescribed c s values in Table 4 are correct.
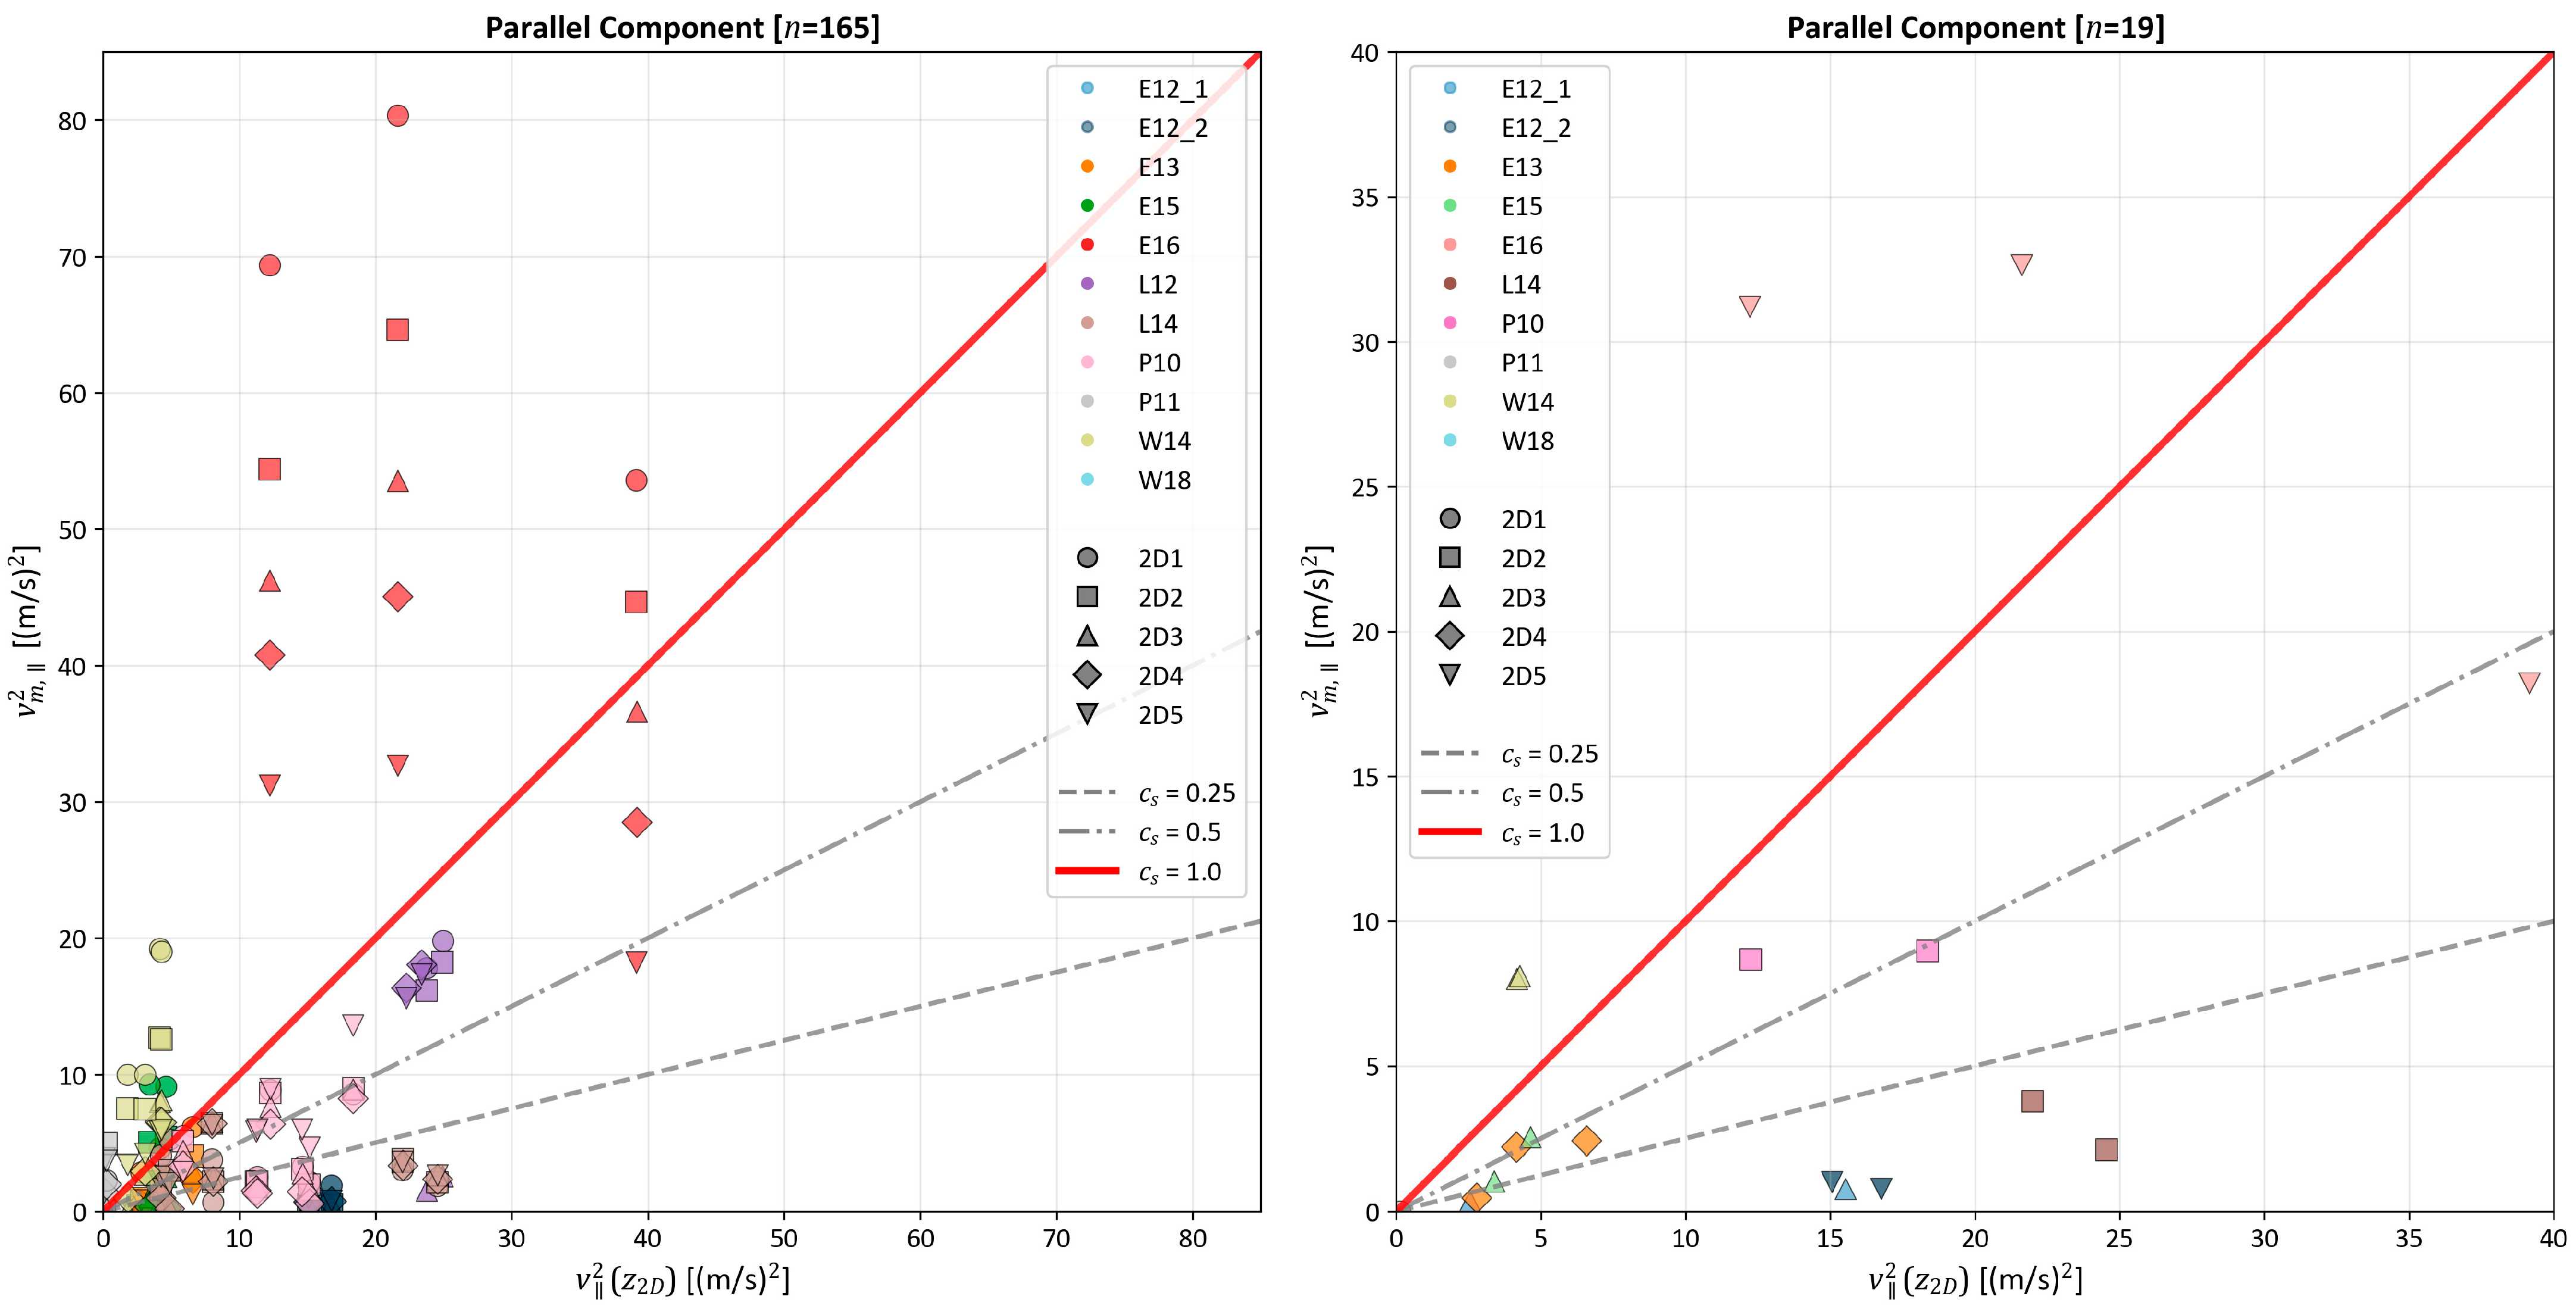
Figure 10 and Figure 11 present the measured squared wind velocities v m 2 as a function of the reference squared velocities v 2 z 2 D , derived from the normative wind profile at the 2D sensor height. Each data point represents a single 10 min averaged measurement from the filtered dataset described in Section 3.2, encompassing multiple scaffolds, measurement campaigns, and wind sectors. The diagonal reference lines corresponding to c s = 0.25 ,   0.5 ,   1.0 serve as a visual comparison of the code-prescribed values. The results are grouped by flow component (parallel and perpendicular to the façade) and sensor location (all positions versus mid-building façade only) to isolate the position-dependent effects.
The parallel component exhibits substantial scatter in the full dataset (Figure 10, left), reflecting the complex position-dependent nature of the flow along building façades. The statistical analysis reveals that 75% of the measurements fall below the normative threshold c s = 1.0 , with approximately 50% falling below c s = 0.5 . For scaffolds covered with protective netting (E12, E13, E16), the results reveal that the normative value c s = 0.25 , does not adequately represent the observed wind action. Specifically, 52% of the measurements from netted scaffolds exceed c s = 0.25 , with 28% exceeding c s = 1.0 . This indicates that protective netting does not consistently reduce wind velocities to the levels assumed in the standard, particularly for parts of scaffolding directly exposed to wind. The most extreme deviations occurred at scaffold E16 during the storm event, where measurements substantially exceeded c s = 1.0 across all but three measurement positions. For scaffolds without protective netting, approximately 68% of measurements exceeded c s = 0.25 , while 76% fell below c s = 1.0 , confirming that it provides an adequate upper bound for most positions under typical conditions.
When the analysis is restricted to mid-façade sensor positions (Figure 10, right), the scatter reduces markedly. Approximately 63% of mid-façade measurements fall below c s = 0.5 , and 79% fall below c s = 1.0 , with only isolated outliers (21%) exceeding the normative value for bare scaffolds. However, even at mid-façade positions, 58% of measurements exceed c s = 0.25 , indicating that the reduced site coefficient prescribed for netted scaffolds underestimates the wind action at more than half of the mid-façade locations. This spatial stratification confirms that flow acceleration and separation phenomena—which produce the highest local velocities—are concentrated near the scaffold edges and building corners, but the mid-façade regions also experience velocities exceeding the most conservative normative assumptions.
The perpendicular component displays significantly stronger reduction than the parallel component. For the complete dataset (Figure 11, left), 73% of measurements fall below the normative value c s = 0.25 , with 93% below c s = 0.5 and 99% below c s = 1.0 . This pronounced reduction indicates that the normative value c s = 0.25 prescribed for bare scaffolds at buildings without openings is conservative for nearly three-quarters of the measurements. Approximately 49% of the measurements fall below c s = 0.1 , showing that the perpendicular flow component is strongly damped across nearly all locations, with only isolated exceptions (1%) exceeding c s = 1.0 .
At mid-façade positions (Figure 11, right), the reduction is even more pronounced: 83% of measurements fall below the normative c s = 0.25 , and 100% fall below c s = 0.5 . The mid-façade positions experience perpendicular wind loads that are, on average, less than half of those assumed in the standard, with 52% of measurements lower than c s = 0.1 .
Certain scaffolds (e.g., W18) exhibit outliers with elevated perpendicular velocities at geometrically exposed positions in the full dataset, accounting for 27% of all measurements exceeding the normative c s = 0.25 . These outliers occur primarily at corners where local flow acceleration or channelling effects increase the perpendicular velocity component. However, these isolated exceptions are absent from mid-façade locations and do not alter the dominant pattern: the perpendicular flow component is strongly damped by the combined effect of façade presence and protective netting.

4. Discussion

4.1. Physical Mechanisms and Limitations of Normative Model

The experimental results reveal three distinct aerodynamic regimes on building-mounted scaffolds. Corner and edge positions experience flow acceleration due to streamline compression—a well-established phenomenon in bluff-body aerodynamics. Mid-building façade positions show velocity reduction due to boundary layer development along the building surface, where the wall friction progressively decelerates the near-wall flow. Recessed and leeward positions exhibit flow separation with extreme directional deviations, indicating recirculation zones with highly unsteady flow characteristics.
The current normative approach in [1] applies uniform site factors across entire scaffold surfaces: for netted scaffolds, c s , = c s , = 0.25 , and for bare scaffolds, c s , = 1.0   and c s , = 0.25 , respectively. The measurements demonstrate that both c s , and c s , vary by more than an order of magnitude across a single scaffold, depending on the local geometry, exposure, and prevailing flow direction.
Additionally, the standard does not account for the wind intensity effects. The measurements show that the relationship between the measured and normative velocities changes substantially during storm conditions, with all positions showing increased exceedances.
It should be noted that, while the analysis focused on 10 min mean velocities, short-term gusts may reach substantially higher values. Based on supplementary inspection of the recorded data, peak 2-s gusts were typically about 1.5–2.5 times larger than the 10 min means, consistent with reported gust factors for urban conditions [45].

4.2. Component-Specific Flow Characteristics

The parallel flow component exhibits substantial scatter along the scaffolds, especially at edges and corners, whereas the perpendicular component is strongly damped by the building to which scaffold is attached and the protective netting. The mid-façade perpendicular velocities are generally below 0.25 of the normative reference, with more than half below 0.1, illustrating the strong damping effect. Localised exceptions, such as corners and exposed geometries, highlight that geometric exposure can produce significant deviations from the normative assumptions.

4.3. Effectiveness of Protective Netting

Protective netting reduces wind velocities across most scaffold positions under typical conditions. For example, 69% of measurements on netted scaffolds E12 and E13 fell below the normative c s = 0.25 . However, the netting does not consistently reduce velocities in highly exposed locations, and mid-façade positions still exhibit exceedances in more than half of the measurements. Therefore, netting provides partial protection but cannot fully compensate for extreme local flow effects.

4.4. Design and Safety Implications

The results imply that a position-dependent treatment of site factors is necessary in design practice. Corners and edges may require c s > 1.0 , while mid-façade areas can be characterised by c s ≈ 0.25–0.5, depending on the geometry and exposure. For scaffolds expected to remain in place during storm seasons, enhanced load cases or mitigation strategies (temporary bracing, net removal, or inspection protocols) should be implemented. For complex cases—such as tall façades, long-term installations, or non-standard geometries—site-specific analyses or CFD simulations are recommended to supplement the code-based design.

4.5. Limitations and Future Research

Several study limitations should be noted. The measurements covered a limited number of scaffold configurations at specific sites in one climatic region. The 2D anemometers measured only the horizontal velocity components, and the 10 min averaging period did not capture peak instantaneous velocities. The anemometers were placed at one level; therefore, the velocity distribution can only show a section of the flat flow. Due to the random nature of weather conditions, it was not possible to conduct tests at constant values of wind speed. In addition, repeatable calibration under full-scale conditions was challenging. To address these limitations, future work should couple field measurements with wind tunnel experiments or CFD simulations for validation.
Priority areas for future research include the following:
  • High-frequency measurements to characterise peak gust factors and their spatial variation across scaffold surfaces.
  • Systematic investigation of net performance under varying wind velocities to quantify their impact on pressures on scaffold surfaces.
  • Extended measurement campaigns across diverse building types, heights, and climatic regions to develop generalised position-dependent site factor relationships.
  • Validation of computational fluid dynamics models against the full-scale dataset to establish best practices for numerical prediction.
The present dataset provides a foundation for these future studies and for the refinement of design code provisions to better reflect the complex and spatially variable wind loading observed on real building-mounted scaffolds.

5. Conclusions

This study presents a comprehensive full-scale experimental investigation of wind loads on building-mounted frame scaffolding structures, based on measurements from multiple scaffolds instrumented with 2D and 3D anemometers under natural wind conditions. The following conclusions can be drawn:
  • Wind velocities across scaffold surfaces exhibit extreme spatial variability. The squared velocity ratios v m 2 / v 2 ( z 2 D ) ranged from below 0.1 in sheltered mid-façade positions to above 1.0 at windward corners and edges. Flow acceleration occurs at exposed corners and edges, while mid-façade and recessed zones experience velocity reduction and strong directional deviations due to boundary layer and flow separation effects.
  • Current normative site factors [1] provide generally conservative estimates for mid-façade positions under typical wind conditions. For parallel and perpendicular wind directions, 79% and 83% of mid-façade measurements fell below the code-prescribed values, respectively. However, at windward corners and edges, the actual wind loads frequently exceeded the code predictions, with exceedances up to 20% under normal conditions and over 100% during storm events. For scaffolds with protective netting, the nominal c s = 0.25 does not consistently the capture observed reductions in wind velocities, particularly in more exposed positions.
  • The parallel flow component exhibits substantial scatter and site-dependent variability, whereas the perpendicular component is strongly damped by the façade presence and netting. Mid-façade perpendicular velocities were generally below the normative reference. Edge and corner positions remained exceptions due to local acceleration effects.
  • The results demonstrate that a uniform site factor is insufficient to describe the spatially variable aerodynamic environment of scaffolds. Position-specific site factors are recommended. Site-specific analyses should be considered for large or complex structures.
The findings demonstrate that the aerodynamic environment around building-mounted scaffolds is highly non-uniform and transient. Recognising this variability is essential to ensure structural safety. The dataset presented forms a valuable foundation for future development of refined physically grounded design guidelines.

Author Contributions

Conceptualisation, P.J.-G.; methodology, P.J.-G. and A.S.; software, P.J.-G. and A.S.; validation, P.J.-G.; formal analysis, P.J.-G.; investigation, P.J.-G.; resources, A.S.; data curation, P.J.-G.; writing—original draft preparation, P.J.-G.; writing—review and editing, A.S.; visualisation, P.J.-G.; supervision, P.J.-G.; project administration, A.S.; funding acquisition, A.S. All authors have read and agreed to the published version of the manuscript.

Funding

The research was conducted in the Lublin University of Technology and supported under the FD-20/EE-02/802 and FD-20/IL-4/999 grants.

Institutional Review Board Statement

Not applicable.

Informed Consent Statement

Not applicable.

Data Availability Statement

The original contributions presented in this study are included in the article. Further inquiries can be directed to the authors.

Conflicts of Interest

The authors declare no conflicts of interest.

References

  1. EN 12811-1:2003; Temporary Works Equipment—Part 1: Scaffolds—Performance and General Design. PKN: Warsaw, Poland, 2003.
  2. Richards, P.J.; Hoxey, R.P. Pressures on a Cubic Building-Part 1: Full-Scale Results. J. Wind Eng. Ind. Aerodyn. 2012, 102, 72–86. [Google Scholar] [CrossRef]
  3. Li, Q.S.; Xiao, Y.Q.; Wong, C.K.; Jeary, A.P. Field Measurements of Wind Effects on the Tallest Building in Hong Kong. Struct. Des. Tall Spec. Build. 2003, 12, 67–82. [Google Scholar] [CrossRef]
  4. Li, Q.S.; Xiao, Y.Q.; Wong, C.K.; Jeary, A.P. Field Measurements of Typhoon Effects on a Super Tall Building. Eng. Struct. 2004, 26, 233–244. [Google Scholar] [CrossRef]
  5. Yang, L.; Gurley, K.R.; Prevatt, D.O. Probabilistic Modeling of Wind Pressure on Low-Rise Buildings. J. Wind Eng. Ind. Aerodyn. 2013, 114, 18–26. [Google Scholar] [CrossRef]
  6. Goliber, M.; Sritharan, S.; Sarkar, P. An Investigation of the Accuracy of Pressure Measurements and Pressure Interpolation on the Roof of a Low-Rise Building; Iowa State University: Ames, IA, USA, 2010. [Google Scholar]
  7. Charisi, S.; Thiis, T.K.; Aurlien, T. Full-Scale Measurements of Wind-Pressure Coefficients in Twin Medium-Rise Buildings. Buildings 2019, 9, 63. [Google Scholar] [CrossRef]
  8. Zhou, L.; Zhu, Q.; Tse, K.T.; Ning, X.; Ai, Y.; Zhang, H. Flow Pattern- and Forces-Susceptibility to Small Attack Angles for a Rectangular Cylinder. Ocean Eng. 2024, 300, 117376. [Google Scholar] [CrossRef]
  9. Richardson, G.M.; Hoxey, R.P.; Robertson, A.P.; Short, J.L. The Silsoe Structures Building: Comparisons of Pressures Measured at Full Scale and in Two Wind Tunnels. J. Wind Eng. Ind. Aerodyn. 1997, 72, 187–197. [Google Scholar] [CrossRef]
  10. Irtaza, H.; Beale, R.G.; Godley, M.H.R. A Wind-Tunnel Investigation into the Pressure Distribution around Sheet-Clad Scaffolds. J. Wind Eng. Ind. Aerodyn. 2012, 103, 86–95. [Google Scholar] [CrossRef]
  11. Geurts, C.P.W. Full-Scale and Wind-Tunnel Measurements of the Wind and Wind-Induced Pressures over Suburban Terrain. J. Wind Eng. Ind. Aerodyn. 1996, 64, 89–100. [Google Scholar] [CrossRef]
  12. Liu, J.; Hui, Y.; Yang, Q.; Zhang, R. LES Evaluation of the Aerodynamic Characteristics of High-Rise Building with Horizontal Ribs under Atmospheric Boundary Layer Flow. J. Build. Eng. 2023, 71, 106487. [Google Scholar] [CrossRef]
  13. Elshaer, A.; Aboshosha, H.; Bitsuamlak, G.; El Damatty, A.; Dagnew, A. LES Evaluation of Wind-Induced Responses for an Isolated and a Surrounded Tall Building. Eng. Struct. 2016, 115, 179–195. [Google Scholar] [CrossRef]
  14. Yu, X.; Xie, Z.; Gu, M. Interference Effects between Two Tall Buildings with Different Section Sizes on Wind-Induced Acceleration. J. Wind Eng. Ind. Aerodyn. 2018, 182, 16–26. [Google Scholar] [CrossRef]
  15. Montazeri, H.; Blocken, B. CFD Simulation of Wind-Induced Pressure Coefficients on Buildings with and without Balconies: Validation and Sensitivity Analysis. Build. Environ. 2013, 60, 137–149. [Google Scholar] [CrossRef]
  16. Zhang, A.; Gao, C.; Zhang, L. Numerical Simulation of the Wind Field around Different Building Arrangements. J. Wind Eng. Ind. Aerodyn. 2005, 93, 891–904. [Google Scholar] [CrossRef]
  17. Xia, Y.; Shen, Y.; Yuan, J.; Chen, S. Numerical and Experimental Study on Flow Field around Slab-Type High-Rise Residential Buildings. Sustainability 2023, 15, 12685. [Google Scholar] [CrossRef]
  18. Wang, F.; Tamura, Y.; Yoshida, A. Wind Loads on Clad Scaffolding with Different Geometries and Building Opening Ratios. J. Wind Eng. Ind. Aerodyn. 2013, 120, 37–50. [Google Scholar] [CrossRef]
  19. Wang, F.; Tamura, Y.; Yoshida, A. Interference Effects of a Neighboring Building on Wind Loads on Scaffolding. J. Wind Eng. Ind. Aerodyn. 2014, 125, 1–12. [Google Scholar] [CrossRef]
  20. Yang, Z.; Xie, Q.; Li, Y.; He, C.; Yang, Z.; Xie, Q.; Li, Y.; He, C. Wind Load Parameters and Performance of an Integral Steel Platform Scaffold System. Wind Struct. 2023, 36, 263. [Google Scholar] [CrossRef]
  21. Fang, T.; Gong, J.; Dong, X.; Li, Y.; Cui, W.; Feng, Y. Aerodynamic Characteristics and Structural Effects of Suspending Scaffolds for Super High-Rise Building Construction. J. Build. Eng. 2025, 107, 112718. [Google Scholar] [CrossRef]
  22. Fang, F.M.; Chang, S.X.; Chung, C.Y.; Li, Y.C.; Lin, C.C.; Huang, C.H. Investigations on the Wind Force and Flow of a Scaffolding System. J. Chin. Inst. Eng. 2021, 44, 305–318. [Google Scholar] [CrossRef]
  23. Irtaza, H. Experimental and Computational Determination of Wind Loads on Netted/Sheeted Scaffold. Ph.D. Thesis, Oxford Brookes University, Oxford, UK, 2009. [Google Scholar]
  24. Hrischev, L.; Slavchev, V.; Tepeliev, V.; Dinev, D.; Angelova, R. Influence of Wind Loads on Façade Scaffolds Covered with Different Types of Nets. IOP Conf. Ser. Mater. Sci. Eng. 2020, 951, 012024. [Google Scholar] [CrossRef]
  25. Agarwal, A.; Irtaza, H. Turbulent Wind Flow through Permeable Claddings Mounted on Elevated Scaffold Using CFD Simulation. Eng. Rep. 2020, 3, e12350. [Google Scholar] [CrossRef]
  26. Cao, Q.; Huang, Y.; Chen, B.; Wu, P.; Zhang, S.; Liang, M.; Wei, L.; Huang, L. Performance Study of External Scaffolding under Wind-Induced Action. J. Phys. Conf. Ser. 2023, 2458, 012029. [Google Scholar] [CrossRef]
  27. Isobe, D.; Tago, T. One-Way Fluid–Structure Coupled Analysis of a Construction Scaffolding under Wind Loads. J. Civ. Eng. Constr. 2025, 14, 71–87. [Google Scholar] [CrossRef]
  28. Pieńko, M.; Błazik-Borowa, E. Verification of the Numerical Model of Insert-Type Joint of Scaffolding in Relation to Experimental Research. AIP Conf. Proc. 2018, 1922, 80003. [Google Scholar] [CrossRef]
  29. Abdel-Jaber, M.; Abdel-Jaber, M.S.; Beale, R.G. An Experimental Study into the Behaviour of Tube and Fitting Scaffold Structures under Cyclic Side and Vertical Loads. Metals 2022, 12, 40. [Google Scholar] [CrossRef]
  30. Błazik-Borowa, E.; Robak, A.; Pieńko, M.; Czepiżak, D. The Measurement of Axial Forces in Scaffolding Standards. Measurement 2023, 223, 113770. [Google Scholar] [CrossRef]
  31. Bęc, J.; Błazik-Borowa, E.; Szer, J. Analysis of Scaffolding Harmonic Excitation. Bull. Pol. Acad. Sci. Tech. Sci. 2023, 71, e144577. [Google Scholar] [CrossRef]
  32. Bęc, J. Influence of Anchoring and Bracing System on Dynamic Characteristics of Façade Scaffolding. Arch. Civ. Eng. 2023, 69, 493–506. [Google Scholar] [CrossRef]
  33. Yue, F.; Yuan, Y.; Li, G.; Ye, K.; Chen, Z.; Wang, Z. Wind Load on Integral-Lift Scaffolds for Tall Building Construction. J. Struct. Eng. 2005, 131, 816–824. [Google Scholar] [CrossRef]
  34. Lipecki, T.; Jamińska-Gadomska, P.; Bęc, J.; Błazik-Borowa, E. Façade Scaffolding Behaviour under Wind Action. Arch. Civ. Mech. Eng. 2020, 20, 27. [Google Scholar] [CrossRef]
  35. Lipecki, T.; Jamińska-Gadomska, P.; Błazik-Borowa, E. Wind Load on Façade Scaffolding without Protective Cover—Eurocode and in-Situ Measurement Approaches. J. Build. Eng. 2021, 42, 102516. [Google Scholar] [CrossRef]
  36. Ohdo, K. Introduction. In Specific Research Reports (SRR-No.31); National Institute of Industrial Safety: Tokyo, Japan, 2005; pp. 1–8. Available online: https://www.jniosh.johas.go.jp/en/publication/srr/srr-no31.html (accessed on 28 October 2025).
  37. Ohdo, K.; Takanashi, S.; Hino, Y.; Saito, K. Measurement of Wind Load Acting on the Scaffolds. In Specific Research Reports (SRR-No.31); National Institute of Industrial Safety: Tokyo, Japan, 2005; pp. 9–18. Available online: https://www.jniosh.johas.go.jp/en/publication/srr/srr-no31.html (accessed on 28 October 2025).
  38. Hino, Y.; Sato, N.; Phongkumsing, S.; Ohdo, K.; Takanashi, S. The Predictability of Wind Pressure Acting on the Actual Scaffolds by the Wind Tunnel Test. In Specific Research Reports (SRR-No.31); National Institute of Industrial Safety: Tokyo, Japan, 2005; pp. 19–26. Available online: https://www.jniosh.johas.go.jp/en/publication/srr/srr-no31.html (accessed on 28 October 2025).
  39. Hino, Y.; Ohdo, K. Study on a New Reinforcement Method of Temporary Scaffolds. In Specific Research Reports (SRR-No.31); National Institute of Industrial Safety: Tokyo, Japan, 2005; pp. 43–50. Available online: https://www.jniosh.johas.go.jp/en/publication/srr/srr-no31.html (accessed on 28 October 2025).
  40. Wang, J.; Wang, F.; Chen, X.; Wei, J.; Ma, J. Investigation of Wind Load Characteristics of Cantilevered Scaffolding of a High-Rise Building Based on Field Measurement. Energy Build. 2025, 328, 115123. [Google Scholar] [CrossRef]
  41. Sumorek, A. The measurement system of wind load of facade scaffolding. Inform. Control Meas. Econ. Environ. Prot. 2016, 6, 37–42. [Google Scholar] [CrossRef]
  42. Lipecki, T.; Jamińska, P.; Sumorek, A.; Błazik-Borowa, E.; Bęc, J. A System for Measuring Environmental Data in Full-Scale. J. Phys. Conf. Ser. 2018, 1101, 012019. [Google Scholar] [CrossRef]
  43. Lipecki, T.; Jamińska-Gadomska, P.; Sumorek, A. Influence of Ultrasonic Wind Sensor Position on Measurement Accuracy under Full-Scale Conditions. Sensors 2020, 20, 5640. [Google Scholar] [CrossRef] [PubMed]
  44. EN 1991-1-4:2008; Eurocode 1: Actions on Structures. Part 1–4: General Actions-Wind Actions. PKN: Warsaw, Poland, 2008.
  45. Wieringa, J. Gust Factors over Open Water and Built-up Country. Bound. Layer Meteorol. 1973, 3, 424–441. [Google Scholar] [CrossRef]
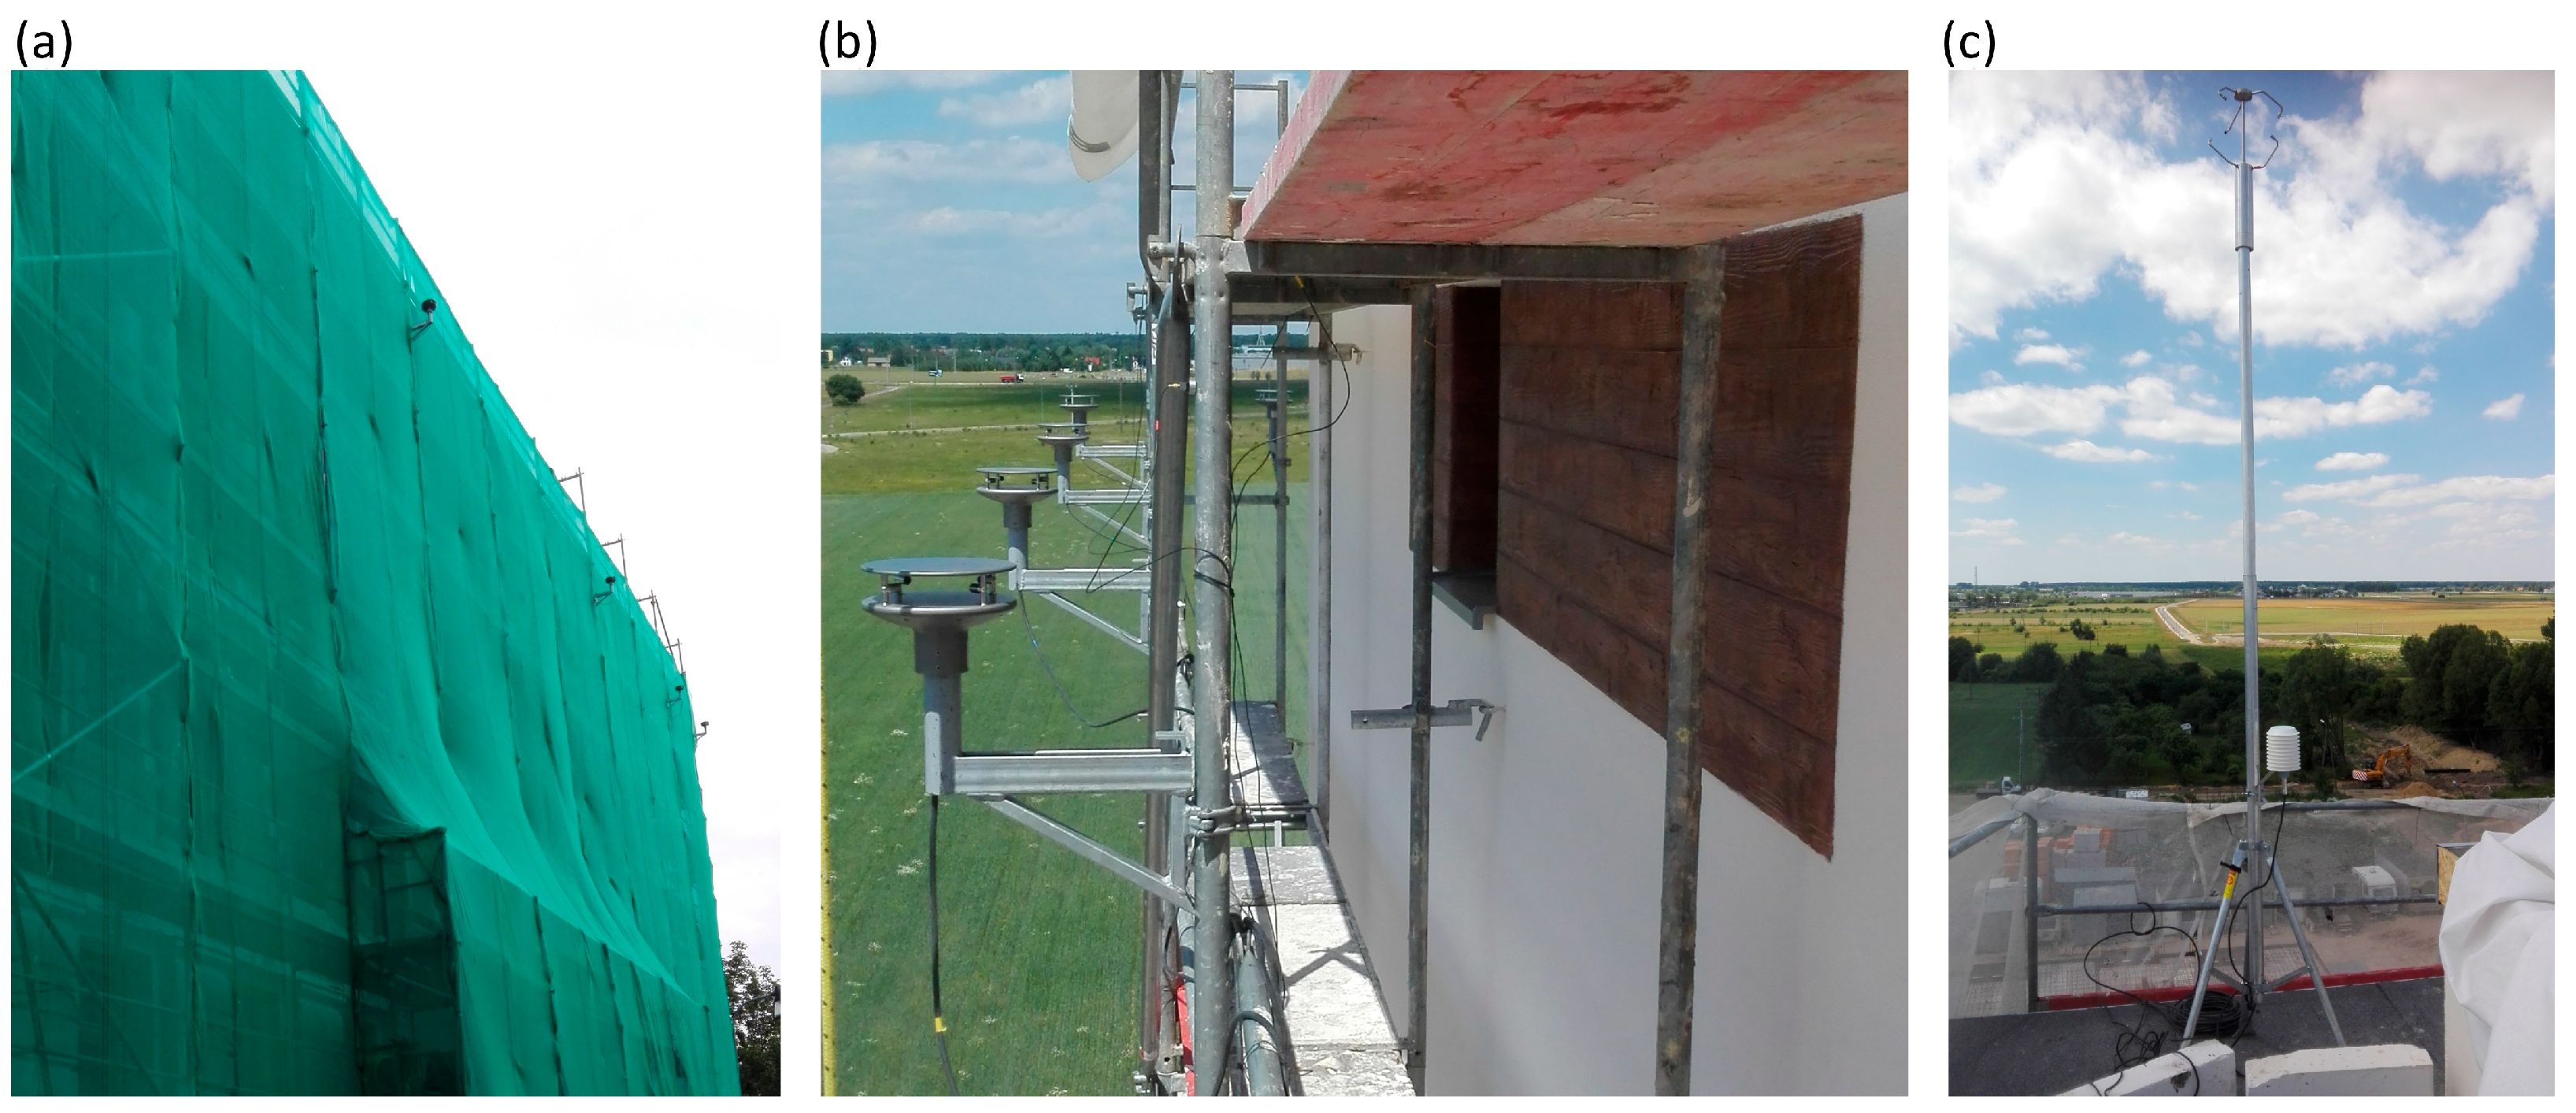
Figure 1. Method of installing anemometers: (a) 2D on scaffold with net, (b) 2D on scaffolding without net, (c) 3D anemometer on the rooftop.
Applsci 15 12196 g001
Figure 2. Measuring system configuration.
Applsci 15 12196 g002
Figure 3. Instantaneous time histories for scaffold E12 (E12_1, E12_2).
Applsci 15 12196 g003
Figure 4. Instantaneous time histories for scaffolds: E16, P10, L12.
Applsci 15 12196 g004
Figure 5. Maximum wind speed by sector for each scaffold based on 3D anemometer measurements. Cell colour indicates the frequency of wind occurrence from that direction (%), and values show the maximum 10 min mean wind speed recorded in each sector.
Applsci 15 12196 g005
Figure 6. Measured and calculated wind vectors for flow perpendicular to scaffolds E16, P11, W14, and W18 on façades.
Applsci 15 12196 g006
Figure 7. Measured and calculated wind vectors for flow parallel to scaffolds L12, L14, and P10 on façades.
Applsci 15 12196 g007
Figure 8. Wind vectors for flow at angle 150° and 153° to scaffolds E13, E16, E15, L14 on façades.
Applsci 15 12196 g008
Figure 9. Wind vectors at scaffold E12, in two different variants of distribution of anemometers.
Applsci 15 12196 g009
Figure 10. Measured versus reference squared wind velocities for the parallel flow component: left—all sensor positions (n = 165); right—mid-façade sensors only (n = 19). Diagonal lines represent site coefficient values c s =   0.25 , 0.5 , 1 .
Applsci 15 12196 g010
Figure 11. Measured versus reference squared wind velocities for the perpendicular flow component: left—all sensor positions (n = 170); right—mid-façade sensors only (n = 23). Diagonal lines represent site coefficient values c s =   0.25 , 0.5 , 1 .
Applsci 15 12196 g011
Table 1. Scaffolds with protective netting.
ScaffoldLocation Along
the Wall
PhotoLocation of 2D SensorsHmax [m]L
[m]
E12Applsci 15 12196 i001
Applsci 15 12196 i002Applsci 15 12196 i00324.225.7
E13Applsci 15 12196 i004Applsci 15 12196 i005Applsci 15 12196 i00615.323.0
E16Applsci 15 12196 i007Applsci 15 12196 i008Applsci 15 12196 i00938.222.5
Table 2. Scaffolds without protective netting.
ScaffoldLocation Along
the Wall
PhotoLocation of 2D SensorsHmax [m]L
[m]
E15Applsci 15 12196 i010Applsci 15 12196 i011Applsci 15 12196 i01211.431.3
L12Applsci 15 12196 i013Applsci 15 12196 i014Applsci 15 12196 i01532.045.0
L14Applsci 15 12196 i016Applsci 15 12196 i017Applsci 15 12196 i01818.020.0
P10Applsci 15 12196 i019Applsci 15 12196 i020Applsci 15 12196 i02116.245.1
P11Applsci 15 12196 i022Applsci 15 12196 i023Applsci 15 12196 i02416.254.9
W14Applsci 15 12196 i025Applsci 15 12196 i026Applsci 15 12196 i02743.117.0
W18Applsci 15 12196 i028Applsci 15 12196 i029Applsci 15 12196 i03053.823.6
Table 3. Characteristics of 2D and 3D anemometers.
Speed RangeSpeed Accuracy
v [m/s]
Speed
Resolution
Direction Accuracy
v [m/s]
Direction
Resolution
2D0.01–75 m/s±0.2 m/s (v < 5)
±2% (5 < v < 60)
0.01 m/s±2° (v > 1)0.1°
3D0.01–85 m/s±0.1 m/s (v < 5)
±1% (5 < v < 35)
±2% (35 < v < 85)
0.01 m/s±1° (1 < v < 35)
±2° (35 < v < 65)
±4° (65 < v < 85)
±2° (v > 1)
0.1°
Table 4. Parameters used for calculating mean wind speed for individual scaffolds.
Terrain Category z 0 [m] z 3 D [m] z 2 D [m]Net c s , [-] c s , [-]
E12IV126.321+0.250.25
E13IV11813+0.250.25
E15IV113.5910.25
E16IV14033+0.250.25
L12IV12921.510.25
L14IV12015.510.25
P10II0.051913.510.25
P11IV11713.510.25
W14IV1464110.25
Disclaimer/Publisher’s Note: The statements, opinions and data contained in all publications are solely those of the individual author(s) and contributor(s) and not of MDPI and/or the editor(s). MDPI and/or the editor(s) disclaim responsibility for any injury to people or property resulting from any ideas, methods, instructions or products referred to in the content.