Article

Line Spectrum Detection Algorithm of Single Vector Sensor Based on Singular Value Difference

1
School of Intelligent System Science and Information Engineering, Shenyang University, Shenyang 110044, China
2
Dalian Measurement and Control Technology Research Institute, Dalian 116000, China
3
Normal School, Shenyang University, Shenyang 110044, China
*
Author to whom correspondence should be addressed.
Appl. Sci. 2025, 15(22), 12184; https://doi.org/10.3390/app152212184
Submission received: 12 April 2025 / Revised: 6 November 2025 / Accepted: 8 November 2025 / Published: 17 November 2025

Abstract

The line spectrum of ship-radiated noise can be used in passive sonar to detect ship targets; however, it is affected by ocean noise and the Doppler effect, which has a negative effect on target detection. In the paper, the multi-channel data of a single vector sensor is used, and the line spectrum detection algorithm based on singular value difference in frequency domain is proposed for detecting ship targets. The simulated and experimental results show that the proposed algorithm can be used to detect line spectrum under Doppler and background noise interference. The proposed algorithm can provide feasible and low-cost line spectrum detection results in engineering applications, which ensures the certainty of passive detection by using this method.

1. Introduction

The line spectrum of ship-radiated noise, which is, in particular, composed of mechanical, propeller and structure vibration noise, etc., carries important information of ship characteristics and is of great significance for extracting and detecting ship targets [1,2,3]. However, the radiated noise of ships is affected by the oceanic environment, which makes the detection quite difficult [4,5,6]. Additionally, the Doppler phenomenon, caused by the instability of the ocean acoustic channel or the relative motion between a passive sonar and ship targets, can distort received signals and render the received acoustic signals time-varying. In order to illustrate the time-varying characteristic, a Low Frequency Analysis and Recording (LOFAR) diagram is widely used to provide the time and frequency domain information of underwater targets by obtaining the power spectrum of every small time period data [7,8,9]. As a non-parametric spectrum estimation method, the Welch power spectrum method is a common method to estimate the spectrum values of underwater acoustic signals. However, the ability to detect line spectrum under strong background noise interference is limited. Therefore, it is imperative to study line spectrum detection algorithms to suppress strong background noise interference under the Doppler effect.
Methods such as high-order cumulants [10,11], wavelet transform [12,13], adaptive line enhancement (ALE) algorithms [14,15] and singular value decomposition (SVD) [16,17] are commonly employed to attenuate noise for underwater line spectrum, but high-order cumulant method has limitations in suppressing noise due to the limited length of the actual processed data, and wavelet transform methods usually require setting a threshold value, which greatly influences the noise reduction performance. Moreover, ALE algorithms require a low estimation error for noise. SVD is one of the most important matrix decomposition methods, which can decompose any matrix into a linear combination of orthogonal bases, and reveal the intrinsic structure and characteristics of the matrix. Its decomposition result is stable and has low computational complexity. SVD methods can suppress noise by retaining linear combination components, the singular values of which are greater than others, but it is difficult to select singular values when the noise power is high. Additionally, with the aim of suppressing background noise in underwater line spectrum signals, the time-related radius and phase fluctuation difference are used by utilizing scalar sensors [18], where the background noise is assumed to be Gaussian white noise, without considering the case of Gaussian colored noise.
The equipment for receiving underwater target signals mainly includes scalar sensors and vector sensors. Vector sensors, developed on the basis of scalar sensors, are playing an increasingly prominent role in underwater acoustic engineering [19,20]. A single vector sensor can obtain multi-channel data and resist isotropic noise interference [21,22,23], while a scalar sensor can only collect acoustic data through a single channel. Additionally, a single vector sensor inherently possesses characteristics such as small size and the elimination of array calibration required in traditional array processing. These features make a single vector sensor suitable for line spectrum target detection [24,25]. The cross-spectrum of the multi-channel data of a single vector sensor can expand the possibilities of isolating spectral components in underwater ambient noise [26]. However, the background noise type considered is Gaussian white noise, while Gaussian colored noise remains unconsidered. In the field of cognitive radio, the eigenvalues of the covariance matrix of signals received by different antennas are often used to extract signal characteristics for spectrum sensing, such as Maximum Eigenvalue Detection (MED) [27,28], Maximum-Minimum Eigenvalue Detection (MMED) [29,30], Maximum Eigenvalue to Geometric Mean (MEAM) [31,32], etc. These methods are demonstrated to be low in implementation cost and relatively stable compared with energy detection [33].
Drawing inspiration from the above content, the paper analyzes the singular value difference between line spectrum signals and Gaussian noise in the frequency domain using data from a single vector sensor, and a line spectrum detection algorithm based on this difference is proposed. The simulation and experimental results show that the proposed algorithm can detect the underwater line spectrum well under Doppler effect and background noise interference compared with the traditional detecting methods, without setting a threshold value.
The paper is organized as follows. Section 2 introduces the signal model of line spectrum. The singular value difference between line spectrum signals and Gaussian noise in the frequency domain is analyzed in Section 3. The implementation of detection algorithm based on the singular value difference is proposed in Section 4. The simulation and experimental results are presented in Section 5 and Section 6, respectively. Section 6 is exclusively dedicated to the conclusions.

2. The Analysis of Singular Value Difference in Frequency Domain

The line spectrum component of underwater target-radiated noise is mainly generated by mechanical vibration sources and can be characterized by cosine function. When there is relative motion between the underwater target (sound source) and receiving sensor, Doppler frequency shift will occur due to Doppler effect. The line spectrum signals received by the x and y channels of a vector sensor at time t can be expressed as follows [22]:
r ( t ) = s ( t ) + n ( t ) = s x ( t ) s y ( t ) + n x ( t ) n y ( t ) = cos θ sin θ s ( t ) + n x ( t ) n y ( t )
where s ( t ) is the line spectrum signals received by the x and y channels of the vector sensor, with s ( t ) = [ s x ( t ) ; s y ( t ) ] T ; n ( t ) is the received noise of the x and y channels of the vector sensor, which are assumed as additive zero mean Gaussian noise and uncorrelated with each other, and n ( t ) = [ n x ( t ) ; n y ( t ) ] T ; θ denotes the azimuth angle of signal.
s ( t ) = i = 1 N A i cos [ 2 π ( f 0 i + Δ f i ) t + φ 0 i ]
where A i , f 0 i and φ 0 i are the amplitude, frequency and initial phase of the i-th line spectrum, respectively; i and N represent the sequence number and total number of line spectrum signal, respectively; Δ f i is the Doppler frequency of the i-th line spectrum, which can be calculated as follows:
Δ f i = v c f 0 i cos θ
where
v ( m / s ) is the relative movement speed of the transmitter and the receiver.
c is the propagation speed of sound wave in water.
Fourier transform is applied to r ( t ) and the frequency spectrum matrix of positive frequency axis is as follows.
R ( f ) = S ( f ) + N ( f ) = cos θ sin θ S 1 ( f ) + S 2 ( f ) + + S N ( f ) + N ( f ) = cos θ sin θ i = 1 N S i ( f ) + N ( f )
where S i ( f ) is the i-th line spectrum, and N ( f ) is noise spectrum matrix.
Taking frequency f c as center and consider that the frequency band among f c Δ m to f c + Δ m only contains the i-th line spectrum when Δ m is small enough, where m is the sequence number of the analysis bandwidth and, m = 1 , 2 , , M . Here, Δ m is represented as the analysis bandwidth.
Singular value decomposition (SVD) is performed in the analysis bandwidth:
R Δ m T ( f ) = U m D m V m T = u 1 , m u 2 , m d 1 , m 0 0 d 2 , m v 1 , m v 2 , m T
where
R Δ m T ( f ) is the transposition of R Δ m ( f ) , and the number of frequency elements in Δ m is N , then R Δ m T ( f ) is the matrix of N × 2 ;
V m = [ v 1 , m , v 2 , m ] is the unitary matrix, and v n , m , n = 1 , 2 is the column vector; the singular value corresponds to the data energy in the eigenvector direction.
U m is the unitary matrix of N × 2 ;
D m is the matrix of N × 2 ; d 1 , m and d 2 , m are the singular values of R Δ m T ( f ) , corresponding to the square roots of eigenvalues of R Δ m ( f ) R Δ m T ( f ) , where d 1 , m > d 2 , m .
Assuming that l m is supposed as an arbitrary vector on the two-dimensional plane composed of x and y axes, it can be expressed as follows:
l m = ξ 1 , m v 1 , m + ξ 2 , m v 2 , m = v 1 , m v 2 , m ξ 1 , m ξ 2 , m
where ξ 1 , m and ξ 2 , m are real numbers in the analysis bandwidth, respectively.
R Δ m T ( f ) is used to act on l and the formula as follows:
R Δ m T ( f ) l m = U m D m V m T l m = u 1 , m u 2 , m d 1 , m 0 0 d 2 , m v 1 , m v 2 , m T v 1 , m v 2 , m ξ 1 , m ξ 2 , m = u 1 , m u 2 , m d 1 , m 0 0 d 2 , m ξ 1 , m ξ 2 , m = d 1 , m ξ 1 , m u 1 , m + d 2 , m ξ 2 , m u 2 , m
Let η 1 , m = d 1 , m ξ 1 , m , η 2 , m = d 2 , m ξ 2 , m , then R Δ m T ( f ) l m = η 1 , m u 1 , m + η 2 , m u 2 , m . If ξ 1 , m 2 + ξ 2 , m 2 = 1 , there is η 1 , m 2 d 1 , m 2 + η 2 , m 2 d 2 , m 2 = 1 . It can be inferred that the result of R Δ m T ( f ) acting on l m is an ellipse. d 1 , m and d 2 , m are semi-major axis and semi-minor axis, respectively.
Under ideal conditions, the spectrum amplitude of each channel is uniformly distributed, and is uncorrelated with each other for Gaussian white noise spectrum. It can be inferred that the result of R Δ m T ( f ) acting on l m is approximately a circle. Then d 1 , m d 2 , m , and the difference between d 1 , m and d 2 , m is approximately equal to 0; for Gaussian colored noise, the spectrum amplitude values are large at some certain frequency points, the result of R Δ m T ( f ) acting on l m is approximated an ellipse. Then d 1 , m > d 2 , m > 0 . When there is only one line spectrum in the analysis bandwidth, it can be inferred that the data of the two-channel is correlated, and there is a non-zero singular value for R Δ m T ( f ) , that is, d 1 , m > 0 , d 2 , m = 0 . And when the impact of noise on the line spectrum signal is relatively small, and it can be inferred that the difference between d 1 , m and d 2 , m is relatively large.
In summary, the singular value difference in the Gaussian noise spectrum is smaller than that of the line spectrum under certain power spectrum ratios, because the data correlation of the Gaussian noise spectrum and line spectrum is different. Moreover, it can be inferred that the variance of singular value difference for the noise spectrum is relatively small due to such different correlations, and it is helpful for reducing noise interference. Therefore, the difference can be used to distinguish between line spectrum signals and Gaussian noise under certain power spectrum ratios.

3. The Implementation of Detection Algorithm Based on Singular Value Difference

According to the analysis of Section 3, the singular value difference can be used to detect line spectrum signals. The detection statistic in the analysis bandwidth is defined by using singular value difference:
η Δ m = ( d 1 , m d 2 , m ) 2
where η Δ m is the detection statistic value in the analysis bandwidth. Due to line spectrum signal being narrowband, 1 Hz is considered as the upper limit of the analysis bandwidth.
In order to make detected results smoother, the detection statistic value in the analysis bandwidth is interpolated over frequency. The value at each frequency point is presented as η ( f ) . The normalization operation is used to highlight line spectrum signal in whole frequency band. The calculation formula is as follows:
η N ( f ) = η ( f ) min η ( f ) max η ( f ) min η ( f )
where η N ( f ) is the normalized value at each frequency point.
The detection algorithm (Algorithm 1) based on singular value difference is abbreviated as SVD-DA for convenience in the paper. The flowchart of SVD-DA is presented in Figure 1.
Algorithm 1 Detection algorithm based on singular value difference
Data: The received sequence r ( n )
Result: Detection result
1 The spectrum of r ( n ) and is calculated as R ( f ) ;
2 The analysis bandwidth η Δ m is selected;
3 Set m = 0 ;
4 if m < = M
5     d 1 , m and d 2 , m are obtained by SVD;
6    Calculate η Δ m = ( d 1 , m d 2 , m ) 2 ;
7 end
8 η Δ m is interpolated to obtain η ( f ) ;
9 η ( f ) is normalized as η N ( f ) .

4. Simulation Analyses

4.1. Simulation 1 the Analysis of Detection Statistic Value in Analysis Bandwidth

In order to verify the correctness of the detection statistic value theory in Section 3 and Section 4, ship data is simulated, and the mean and variance of detection statistic values in the analysis bandwidth of line spectrum and Gaussian noise are counted and analyzed under different data duration and azimuth angle of signal. The total calculation number is 300. In the paper, all figures are generated using MATLAB software (Version [R2021a], MathWorks, Natick, MA, USA). Considering Doppler effect, the speed of the simulated ship data is set to 15.4 m/s, and the azimuth angle is from 90° to 10°. The frequency of line spectrum signal is set at 400 Hz. The sampling frequency is 2000 Hz. The number of points of the Fourier transform is the same as that of data. The signal-to-noise ratio (SNR) range is from −20 dB to 20 dB.
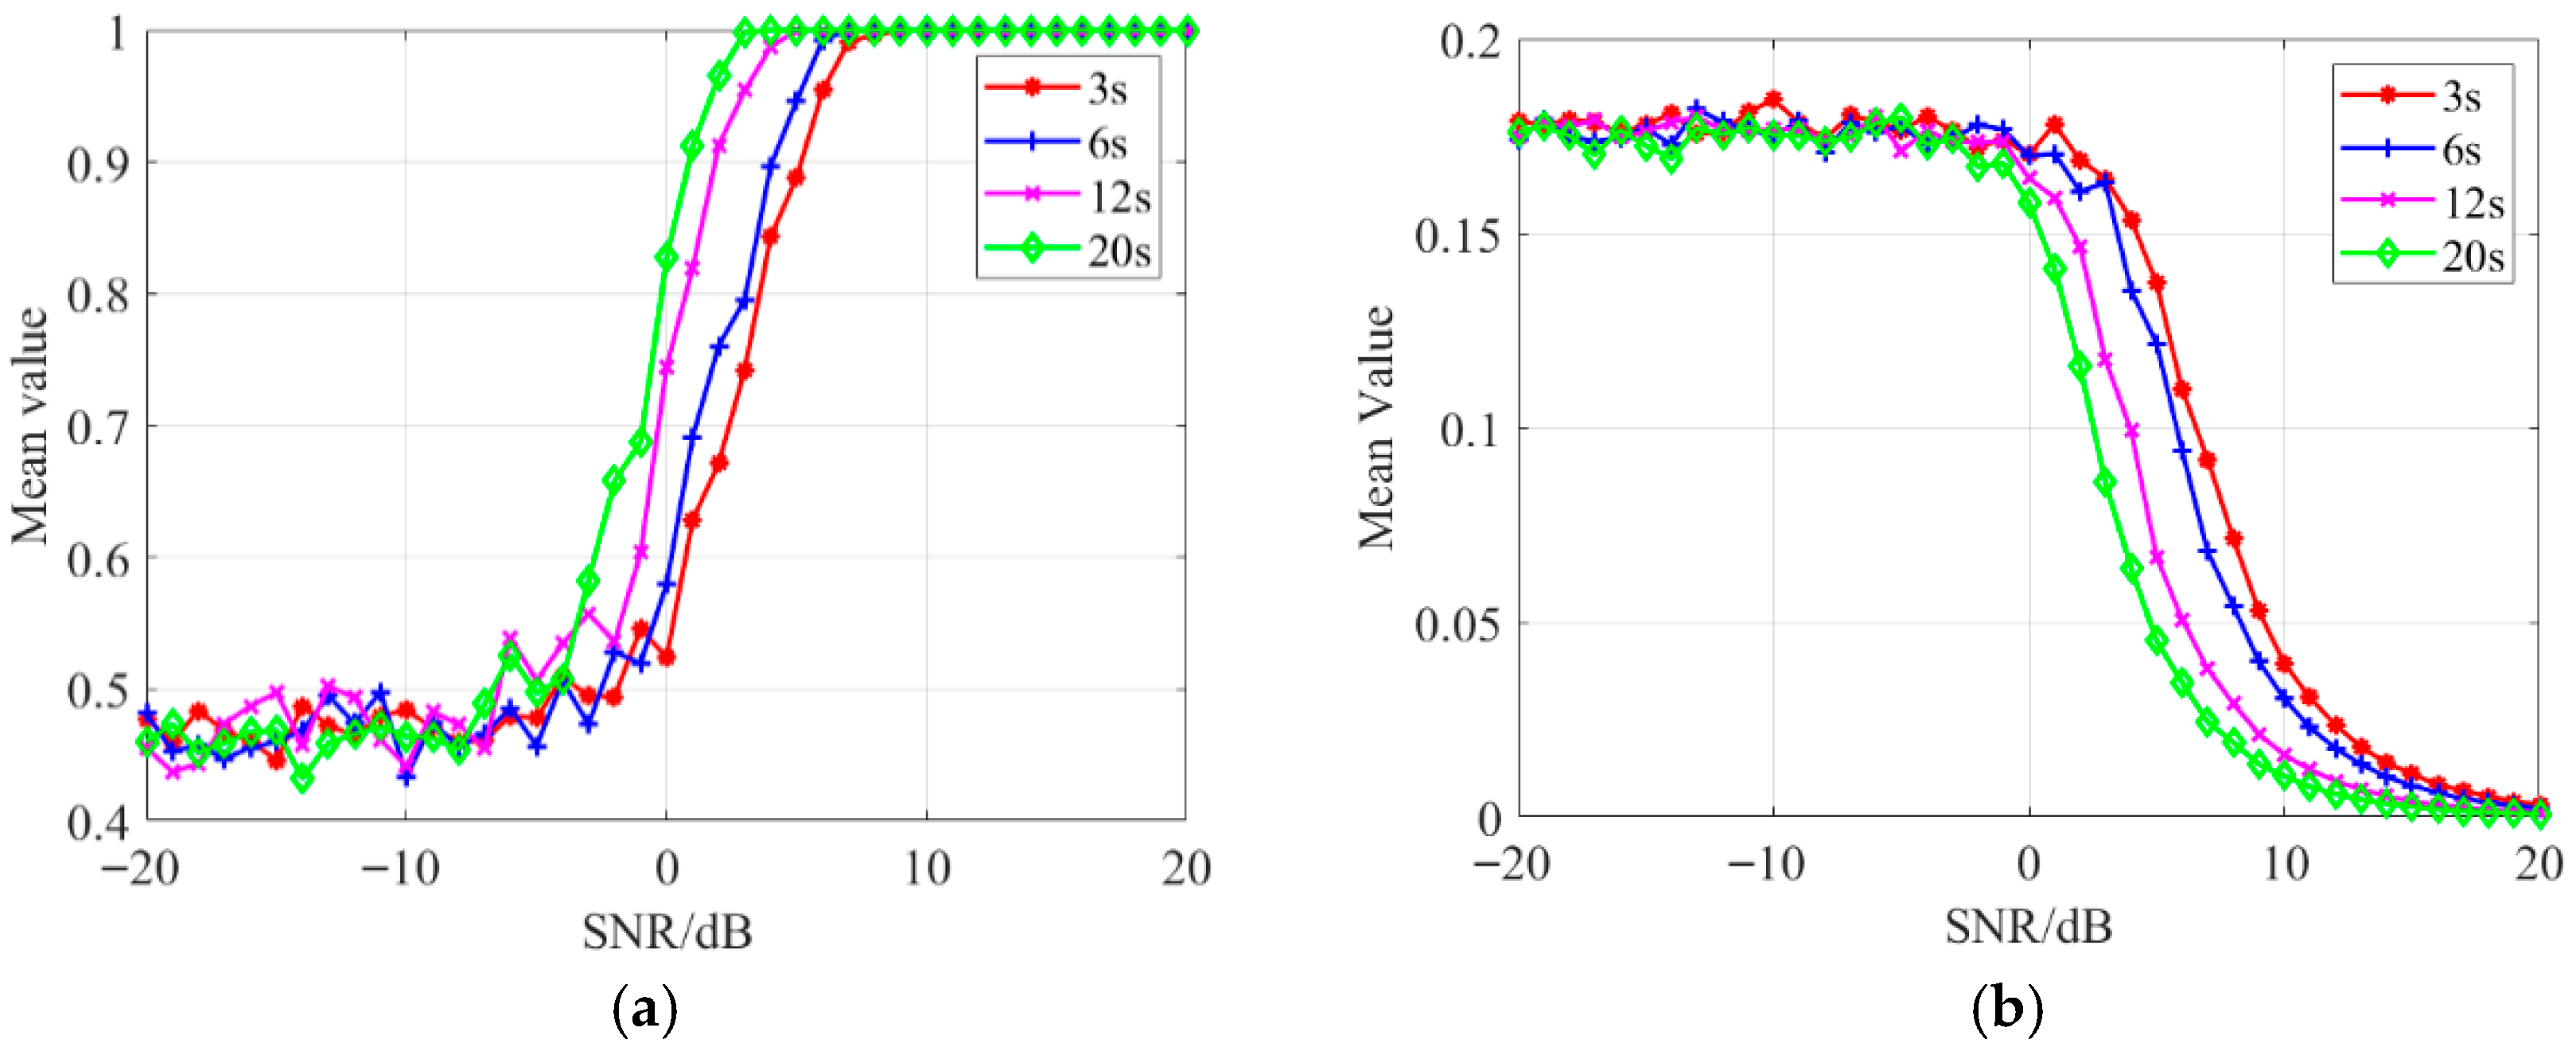
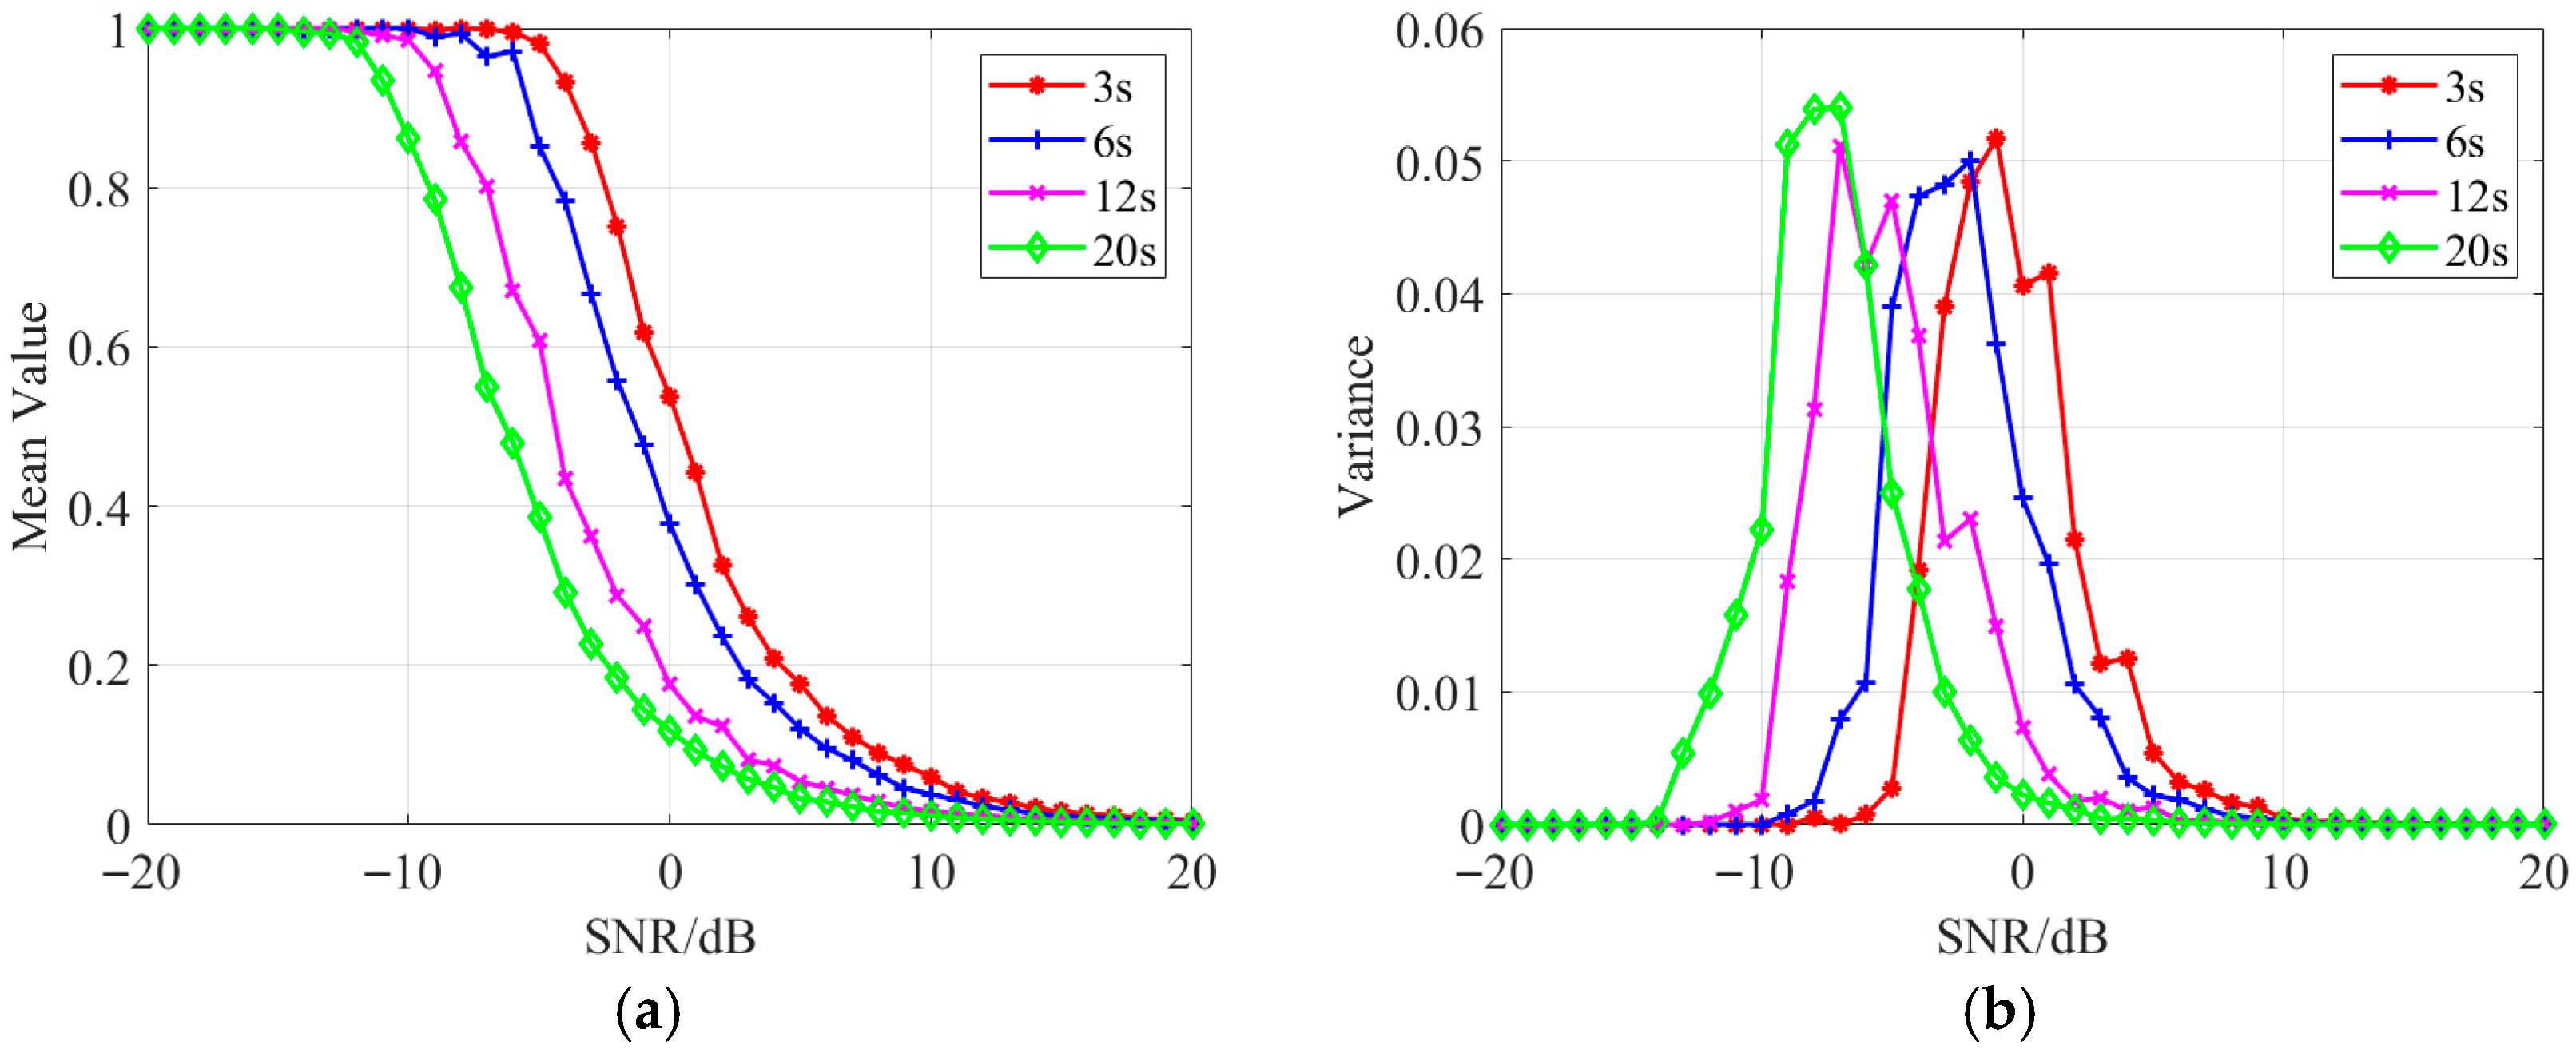
Figure 2 shows the mean of detection statistic values in the analysis bandwidth of line spectrum and Gaussian white noise. The data duration is 3 s, 6 s, 12 s and 20 s, respectively. The mean of detection statistic values in the analysis bandwidth of line spectrum and Gaussian white noise under different azimuth angles of signal are presented in Figure 3. The mean and variance in the detection statistic values in the analysis bandwidth of Gaussian colored noise are presented in Figure 4.
As is evident from Figure 2a, the mean value change trend of different data duration is almost similar. Specifically, the mean values are 1 when the signal duration is 3 s and the SNRs are greater than 7 dB. The values decrease gradually when the SNRs are between 7 dB and 0 dB, and then the values stabilize at around 0.5. Additionally, the mean values increase with increased data duration. And the mean values are 1 when the data duration is 20 s and the SNR is greater than 2 dB. The mean values in the analysis bandwidth of Gaussian white noise are between 0 and 0.18, as shown in Figure 2b. It is evident that under certain SNRs, the detection statistic values in the analysis bandwidth of line spectrum are much larger than those in the analysis bandwidth of Gaussian white noise, and the difference increases with the increase in data duration.
It can be seen from Figure 3 that the variance of detection statistic values in the analysis bandwidth of Gaussian white noise under different data duration and azimuth angle are smaller, between 0 and 0.02.
It shows in Figure 4a that the mean of detection statistic values in the analysis bandwidth of Gaussian colored noise is between 0 and 1, which increases as the SNR decreases. That is because the spectrum amplitude of Gaussian colored noise at some certain frequency points is larger, which affects the detection statistic values. When the SNRs are positive, the values are smaller than 0.6, which is close to the ones of line spectrum signal and approach zero gradually as the SNR increases. It is noteworthy that the difference between line spectrum signal and Gaussian colored noise increases with the increase in data duration by comparing Figure 2a and Figure 4a. The variance of the detection values is shown in Figure 4b, and it shows that the variance values are much smaller, which are between 0 and 0.06.
From the analysis, the detection statistic values in line spectrum analysis bandwidth are larger than those in the analysis bandwidth of Gaussian noise under certain power spectrum ratios, and the variance of detection statistic values for Gaussian noise are small, which is consistent with the theory of Section 3 and Section 4. Additionally, it can be seen from the simulation results that the difference between line spectrum signal and Gaussian noise increases with the increase in data duration.

4.2. Simulation 2: The Analysis of Line Spectrum Detection Outcomes

To confirm the validity of SVD-DA, a 35 s ship data is simulated. The frequencies of line spectrum are 400 Hz, 450 Hz and 600 Hz, respectively. The SNR is 15 dB. The Gaussian colored noise has its power concentrated around 435 Hz, with the SNR of the target signals to this noise being 6 dB. The other simulation conditions remain unchanged, which are same as simulation 1.
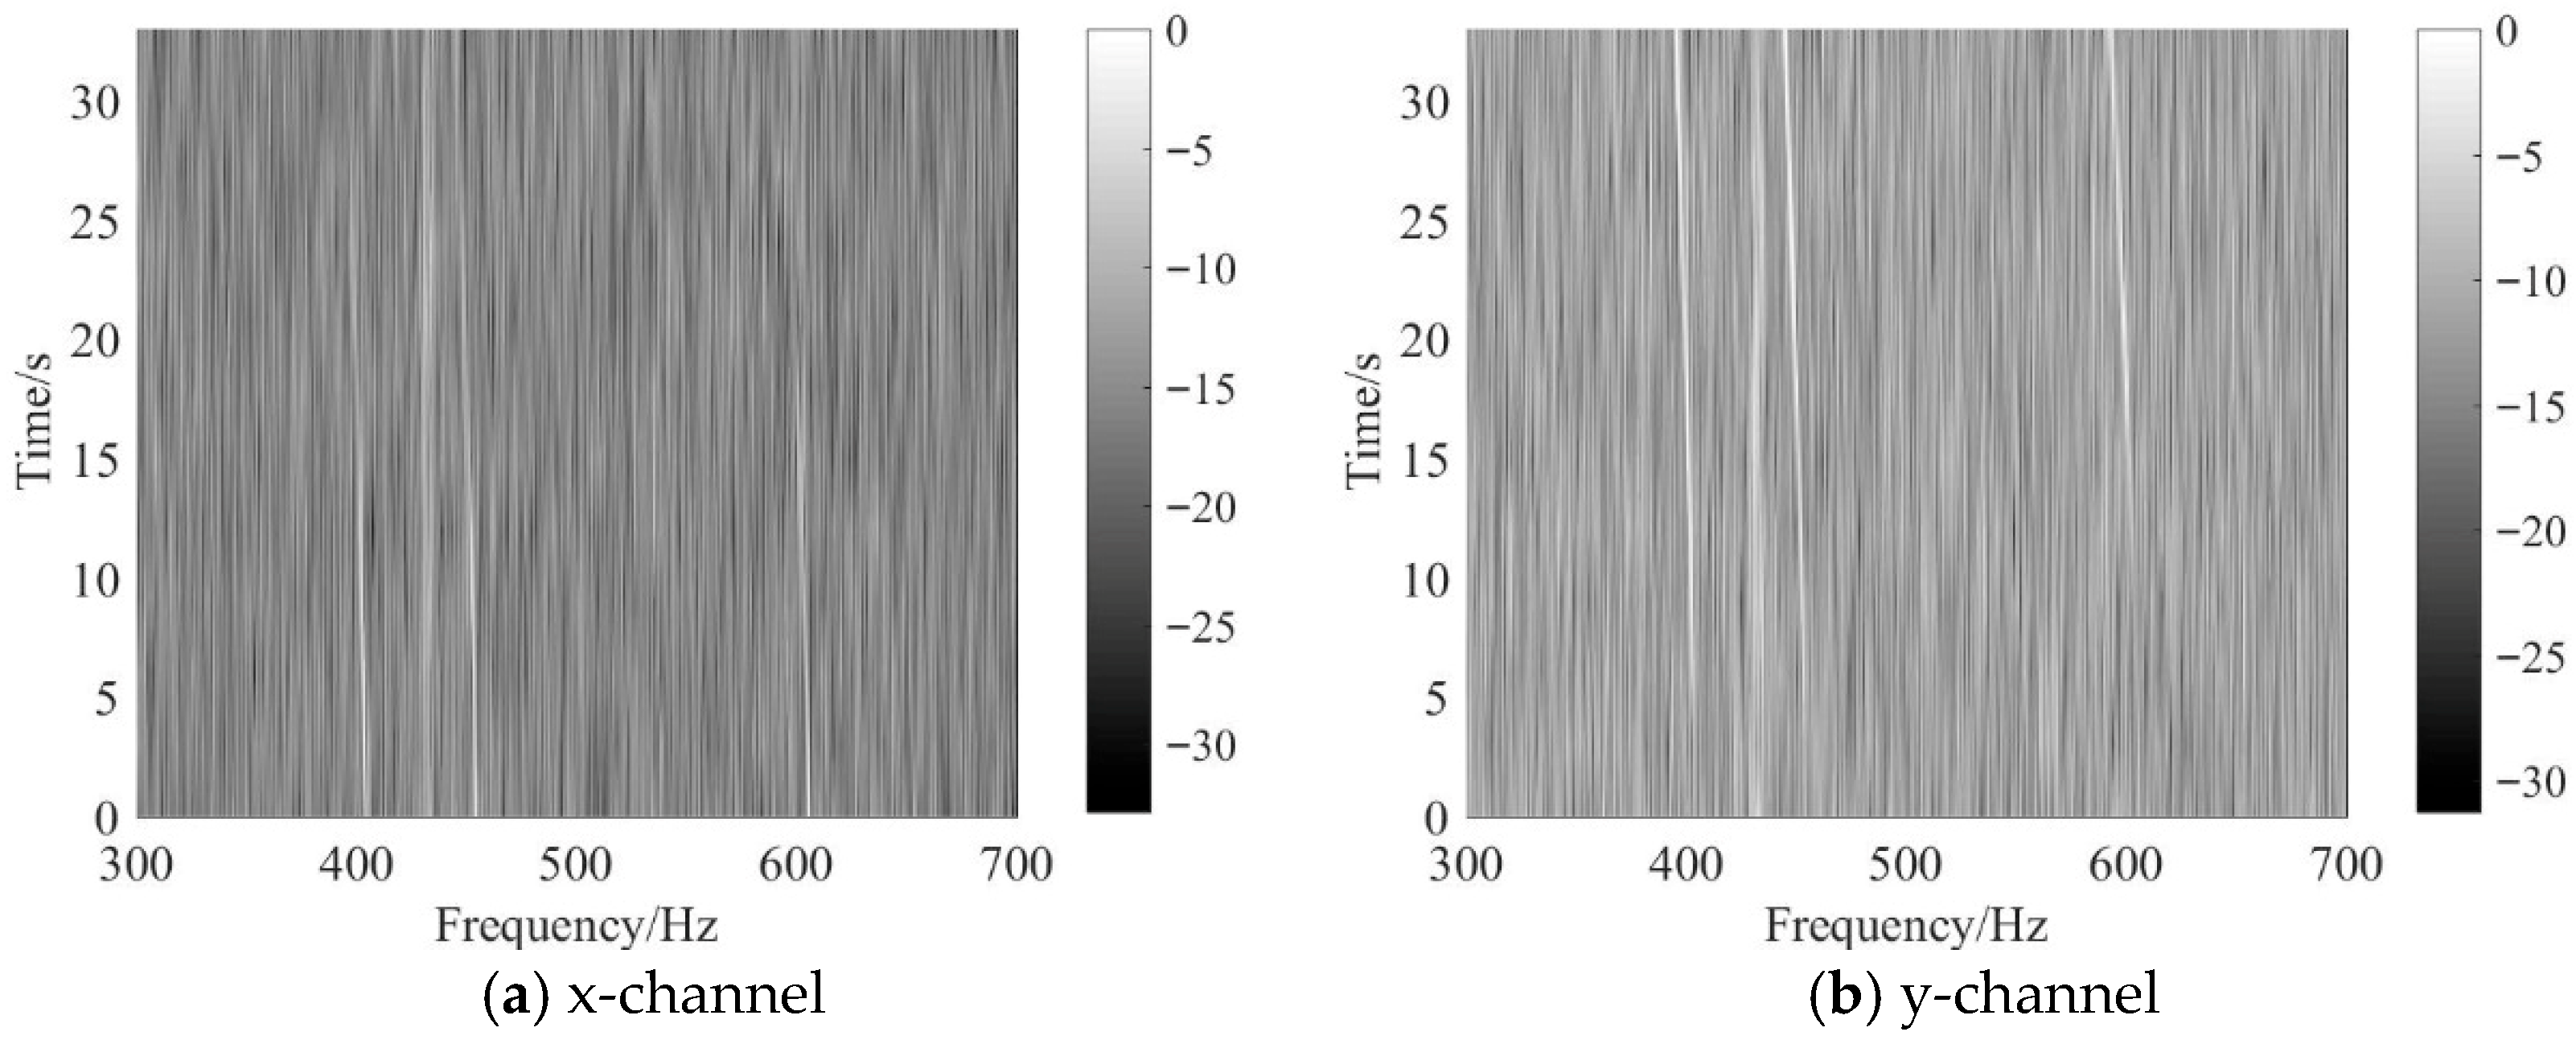
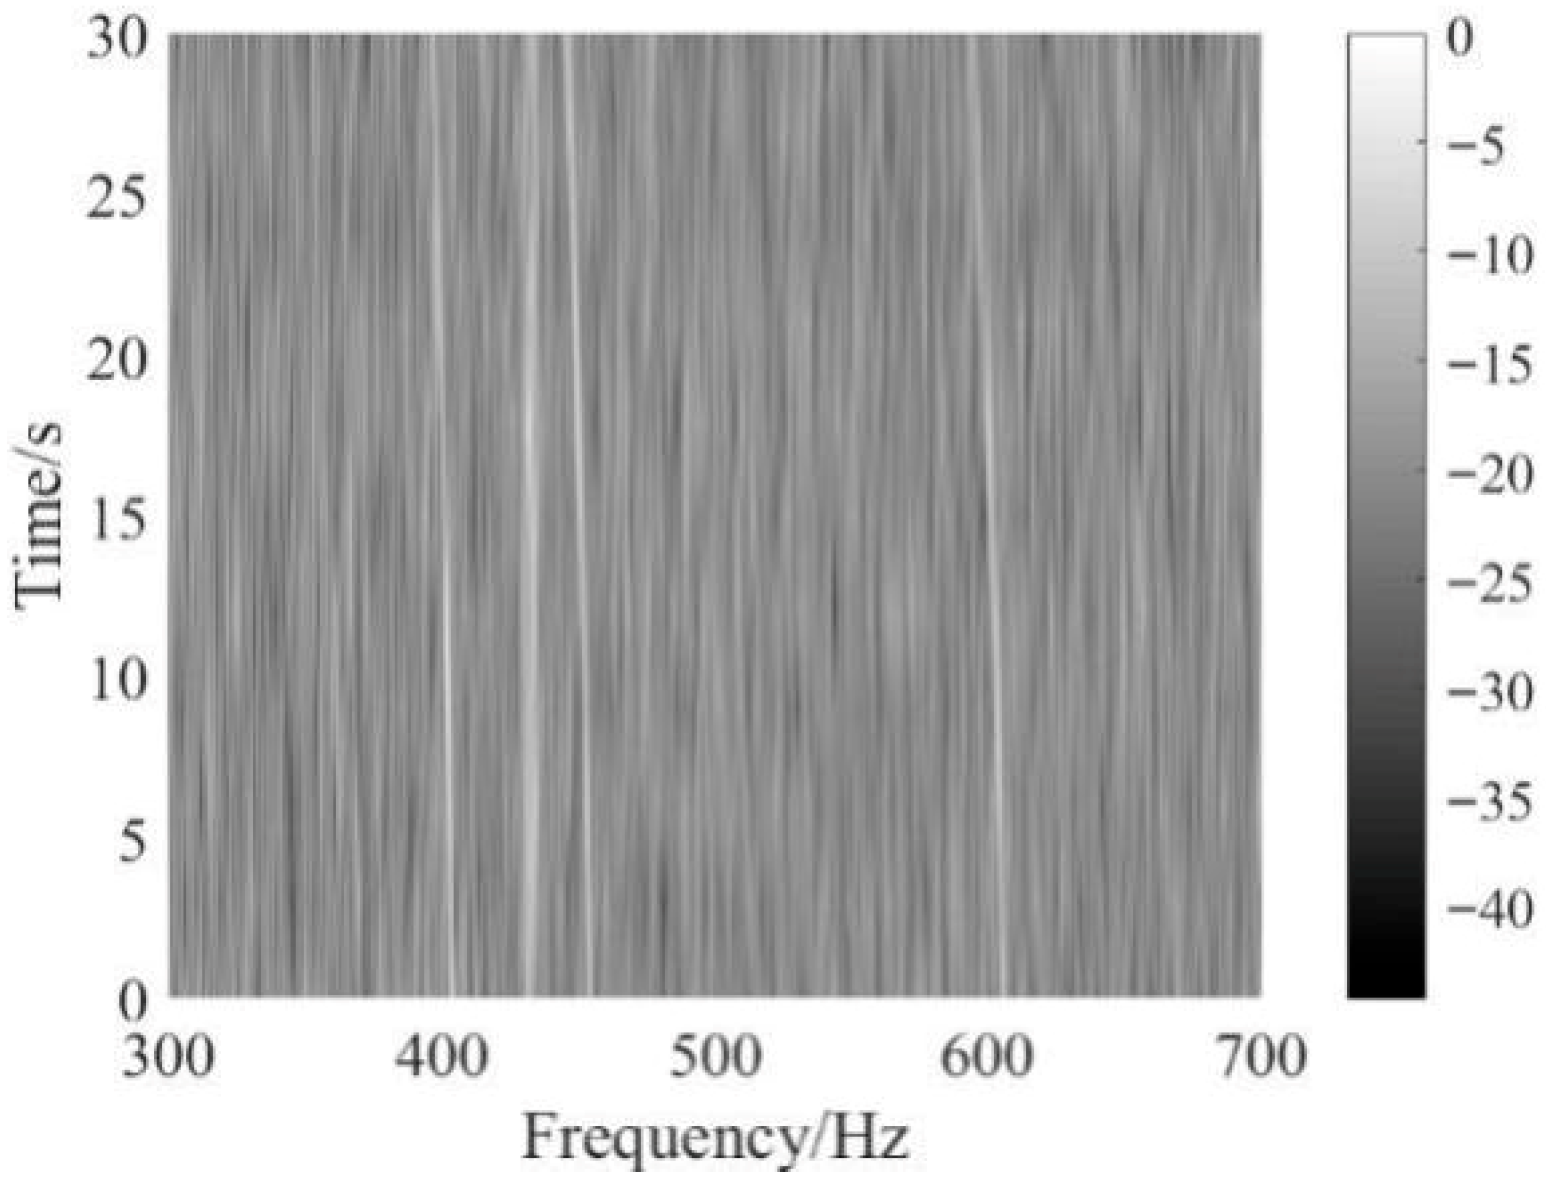
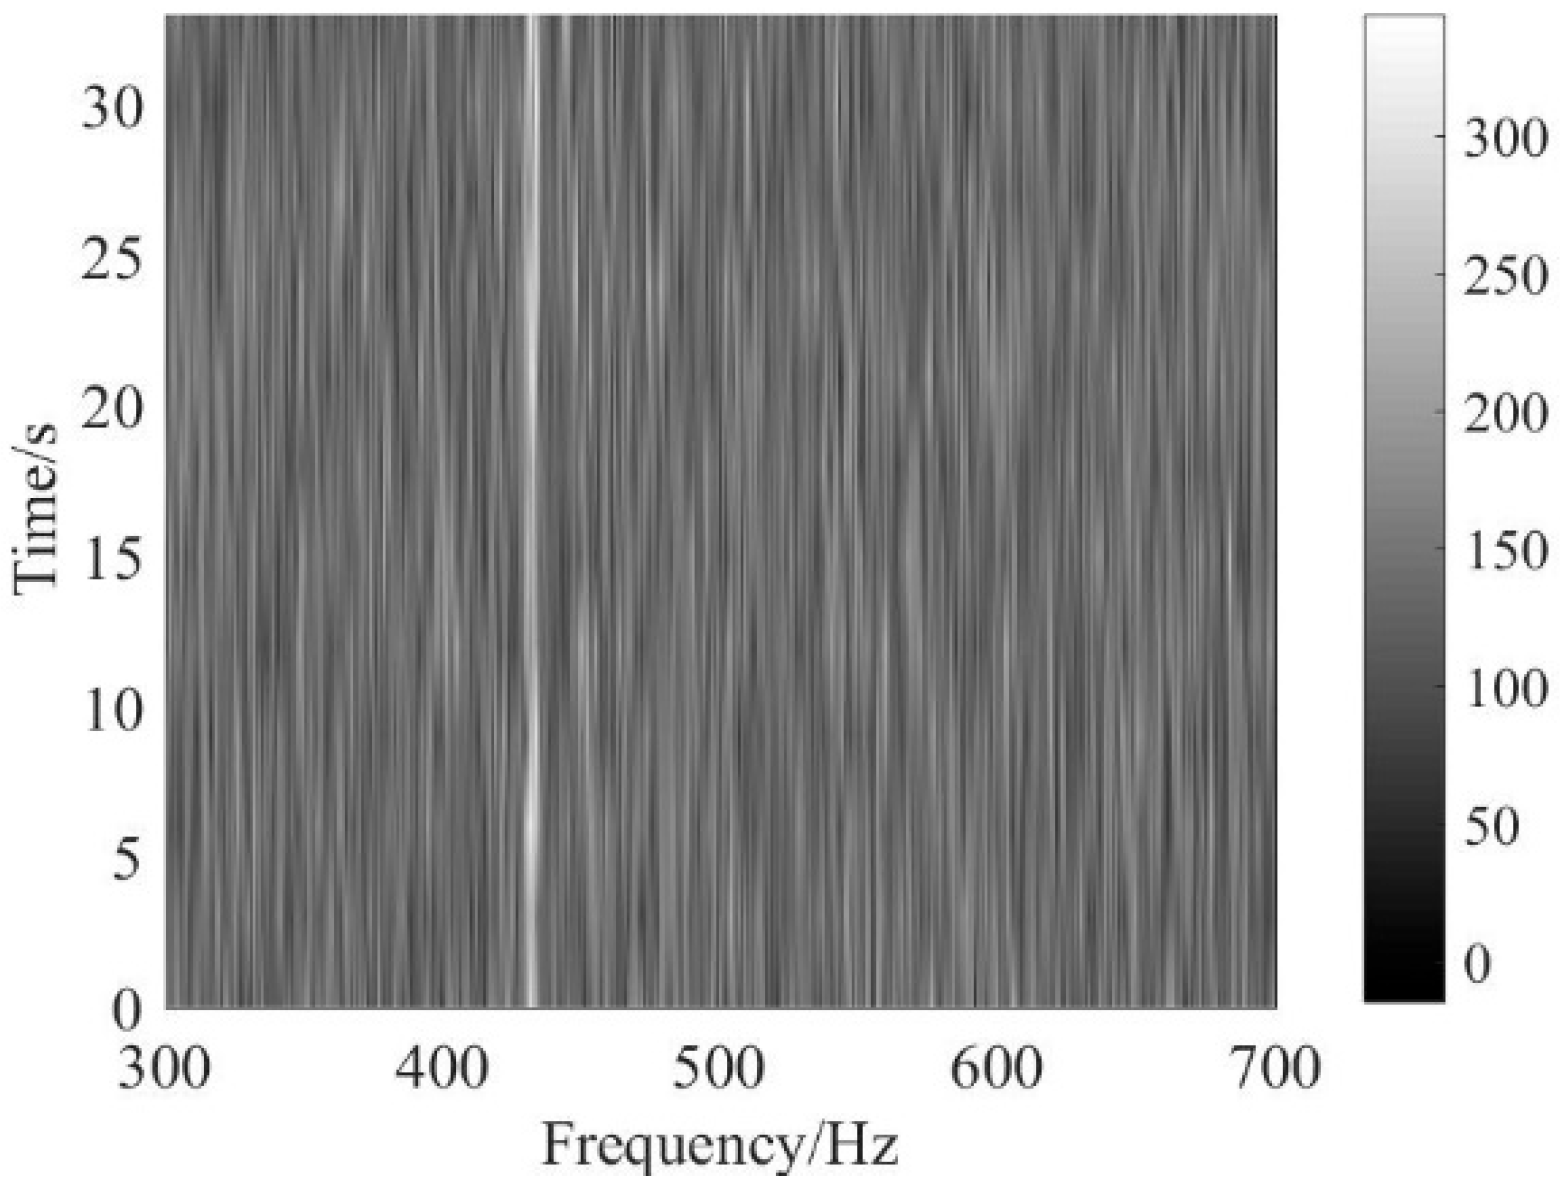
The power spectrum LOFAR diagrams obtained using the Welch method are shown in Figure 5. The display frequency range is from 300 Hz to 700 Hz in order to show the line spectrum signals clearly. The sliding window duration is 6 s and the overlap duration is 3 s. For Welch power spectrum, the sliding window duration is 2.5 s and the overlap duration is 1.5 s. As is evident from Figure 5, the signal SNRs are large in the x-channel initially, but the values become small after about 15 s; in the y-channel, the situation is reversed, which is caused by the ship position changing from 90° to 10°. Additionally, the Gaussian colored noise at around 435 Hz is not suppressed well, and it is easy to be mistaken for a line spectrum signal, which interferes with line spectrum detection. The fourth-order cumulant diagonal slice is applied for the two-channel signals, and the cross-spectrum is calculated to observe the effect of jointly utilizing information of both channels. The method is abbreviated as FCCS, the result of which is illustrated in Figure 6. For the comparison with the results of the Welch power spectrum method, the sliding window duration and the overlap duration are kept unchanged. In the figure, the three-line spectra can be seen in the whole period of time, but the spectrum values for noise are large, particularly for the Gaussian color noise, which is disadvantageous to line spectrum detection.
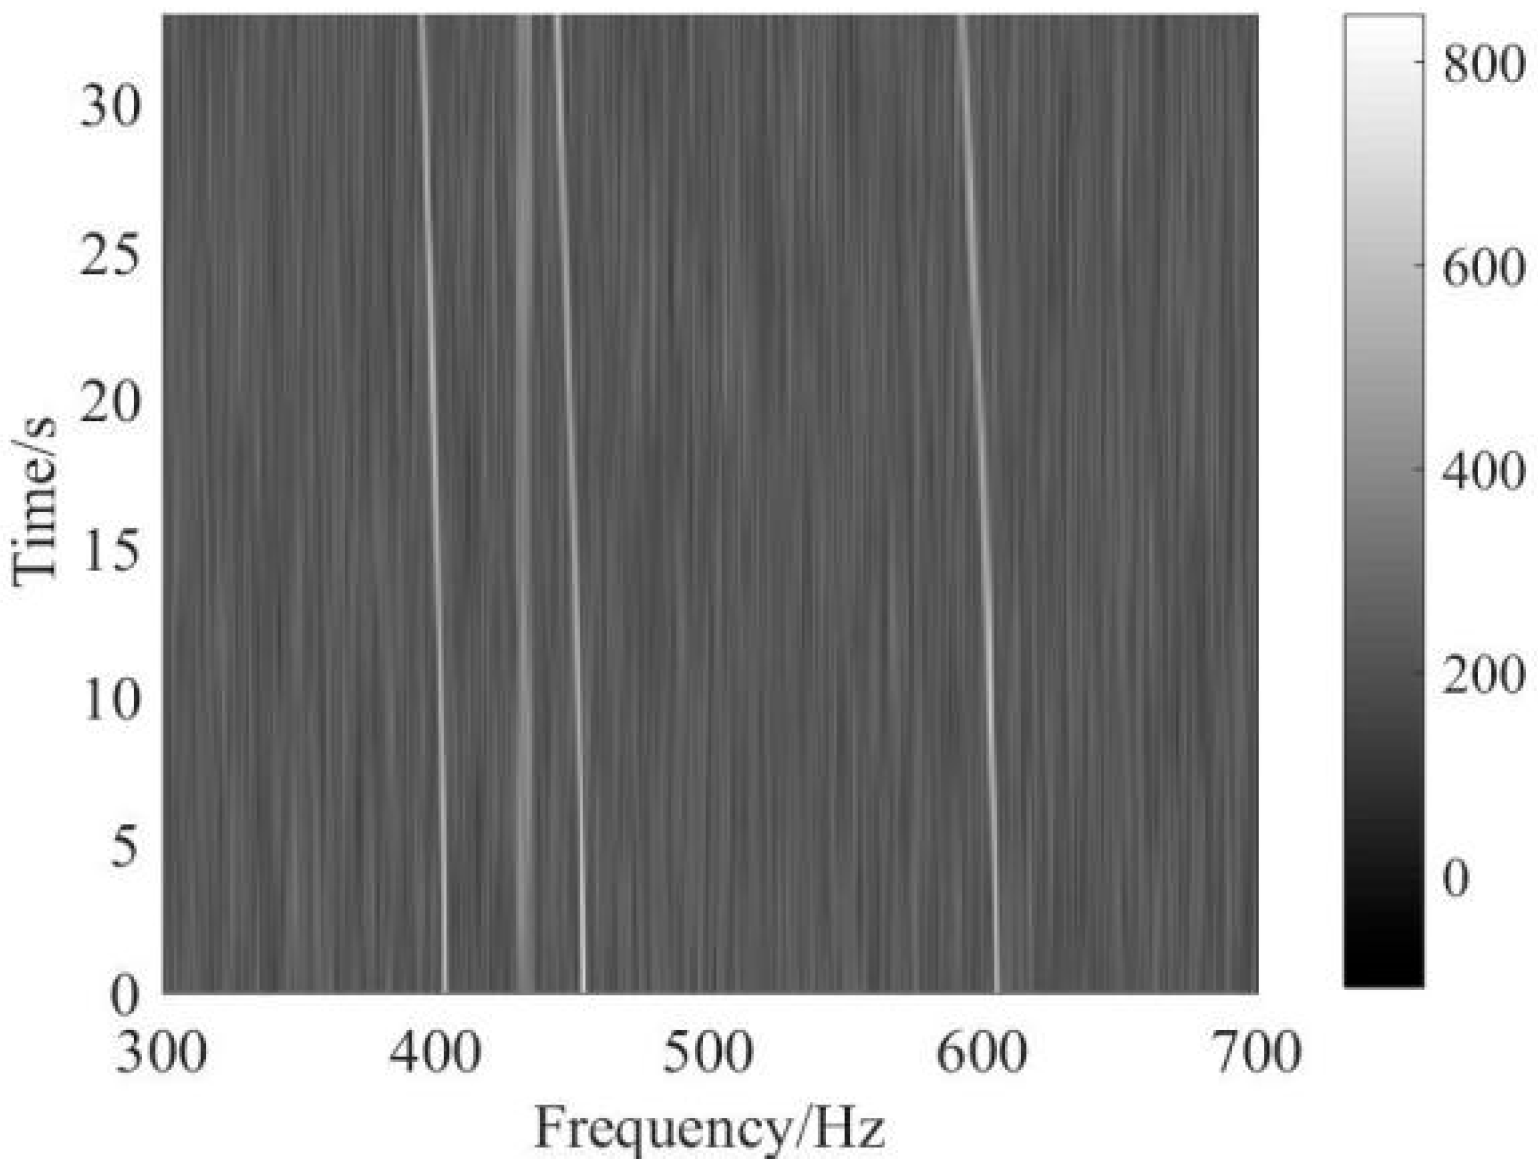
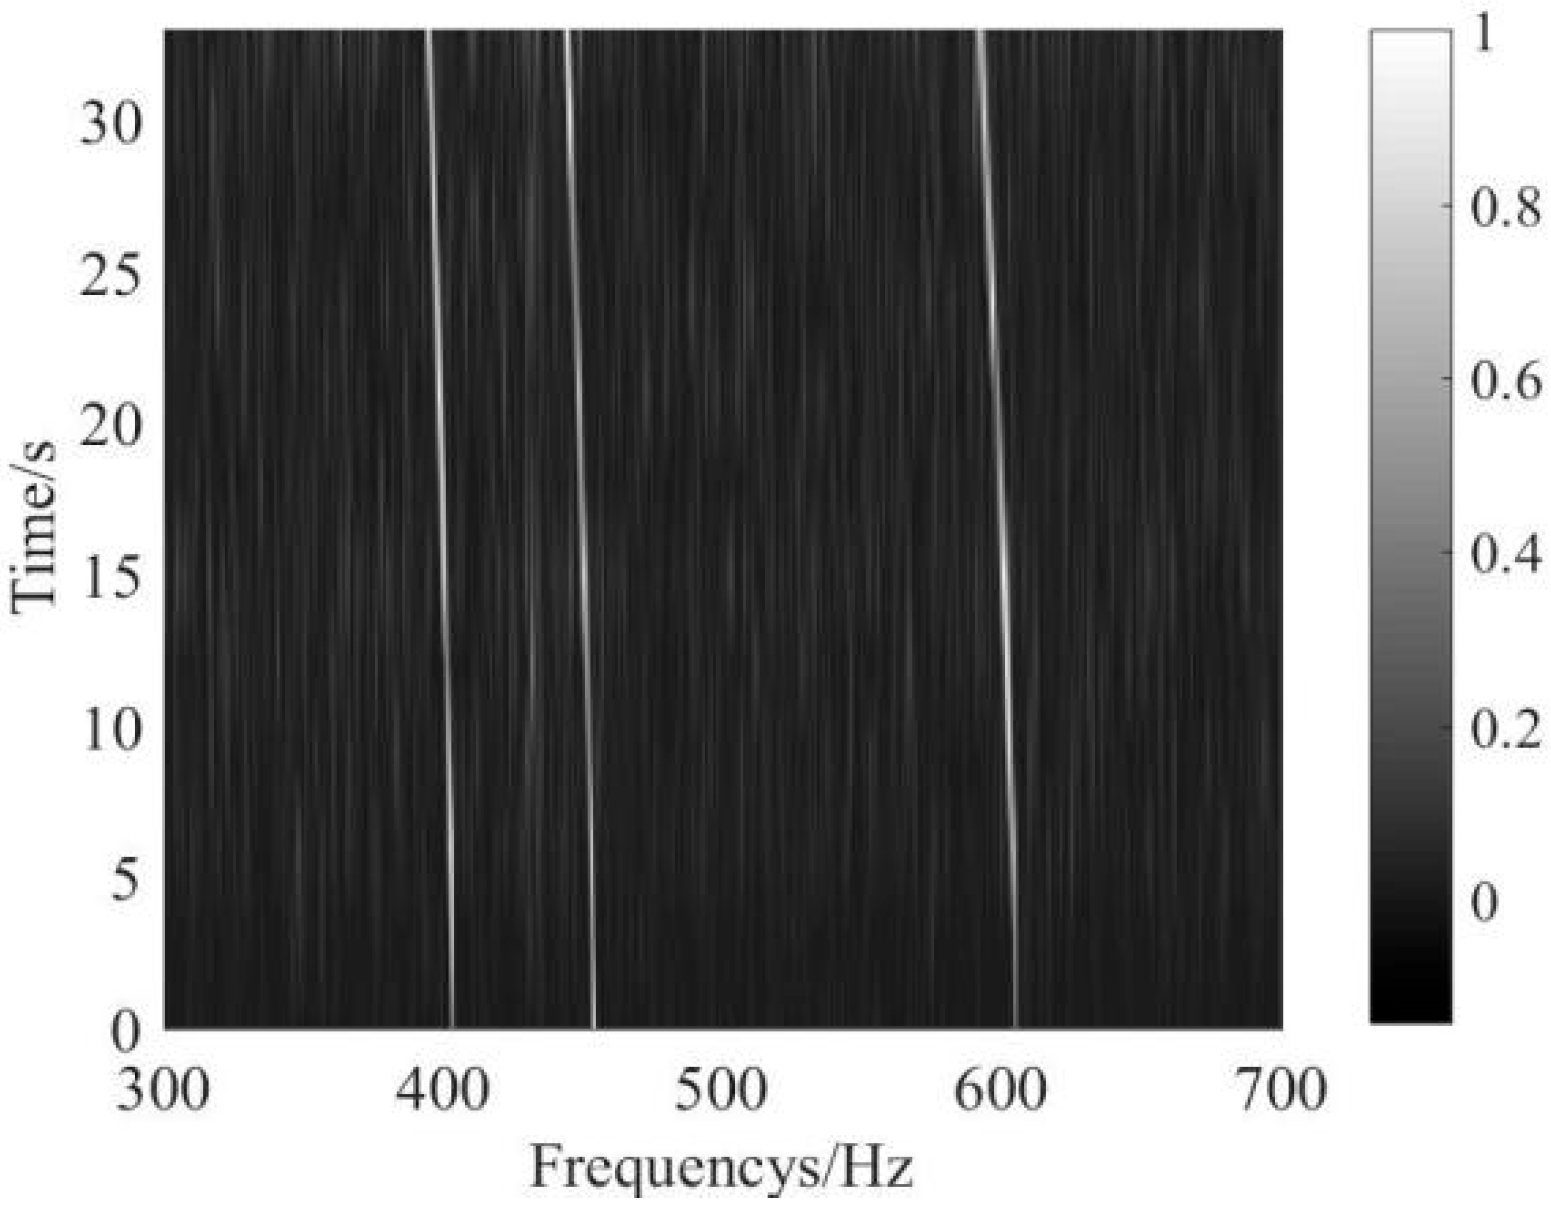
The simulation data undergoes the Fourier transform. And the results of maximum singular values and minimum singular values obtained by the SVD method are shown in Figure 7 and Figure 8, respectively, with the analysis duration of Fourier transform and the overlap duration unchanged. It can be seen from Figure 7 that the maximum singular values for the line spectra are larger than those for Gaussian white noise spectrum, but the values for Gaussian colored noise are still larger, which brings interference to line spectrum detection. It is obvious from Figure 8 that the minimum singular values for Gaussian colored noise are larger than others, but approach to the maximum singular values for Gaussian colored noise in Figure 7. Moreover, the minimum singular values for line spectra are smaller than the maximum singular values. It is not difficult to see that the three-line spectra can be detected by using detection values. The detection result of the proposed algorithm is shown in Figure 9. It can be seen that the detection values for line spectra at 400 Hz, 450 Hz and 600 Hz are obviously larger than those for noise during the whole period of time, and the variance in detection values for Gaussian noise is small. It is shown that the line spectrum detection results are better by using SVD-DA without prior knowledge at certain power spectrum ratios.

5. Experimental Data Analysis

The simulation results by using the proposed algorithm have been discussed. In this section, the capability of the proposed algorithm for line spectrum detection is analyzed using experimental data collected from an oceanic experiment. A single vector sensor serves as the receiving device.

5.1. Weak Line Spectrum Detection of Continuous Wave (CW) Signal

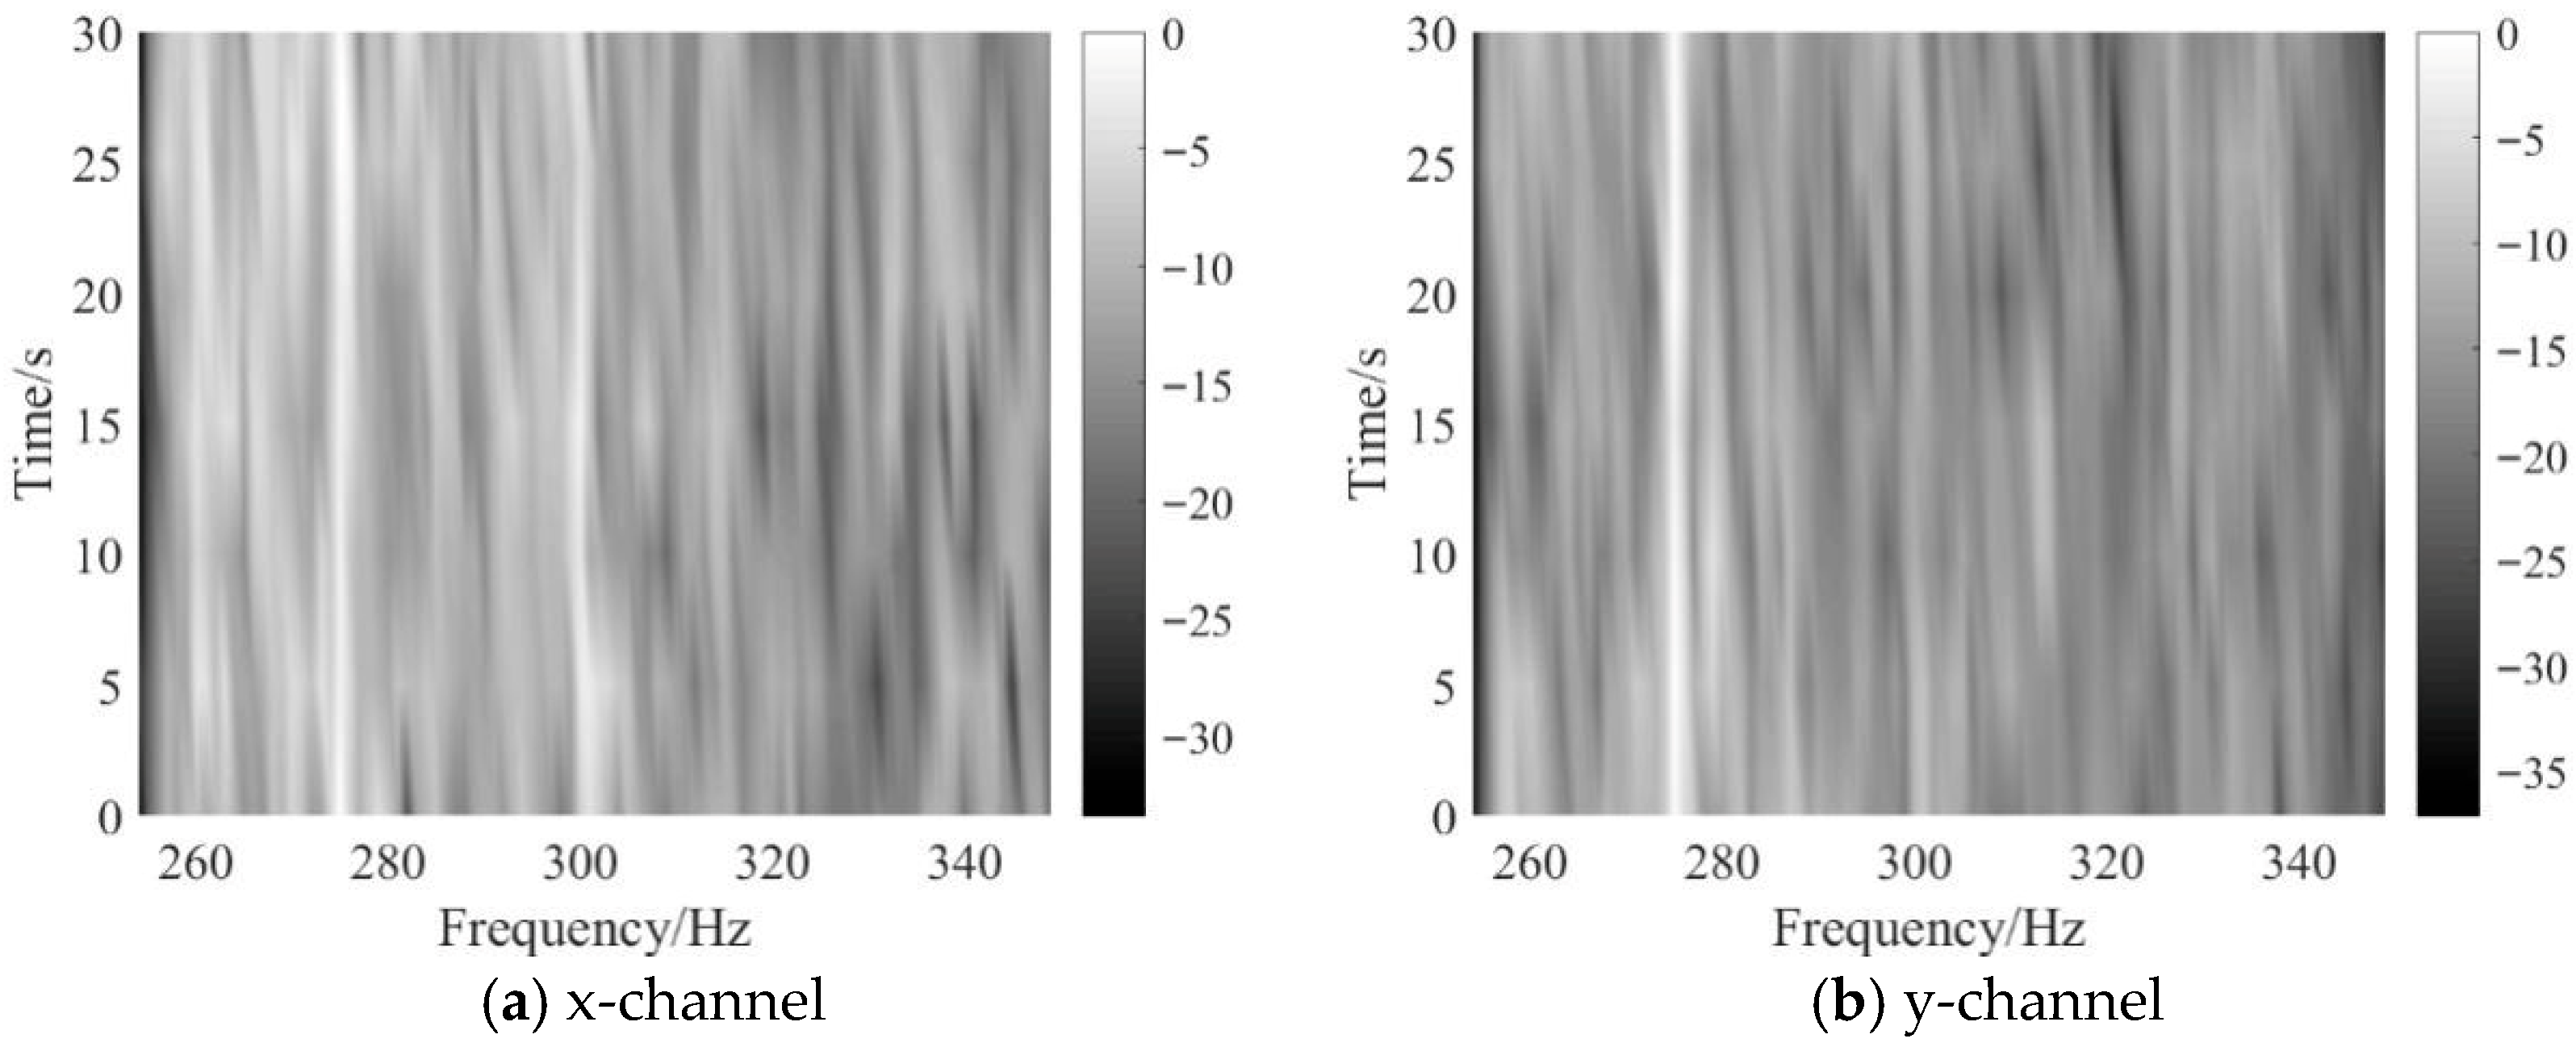
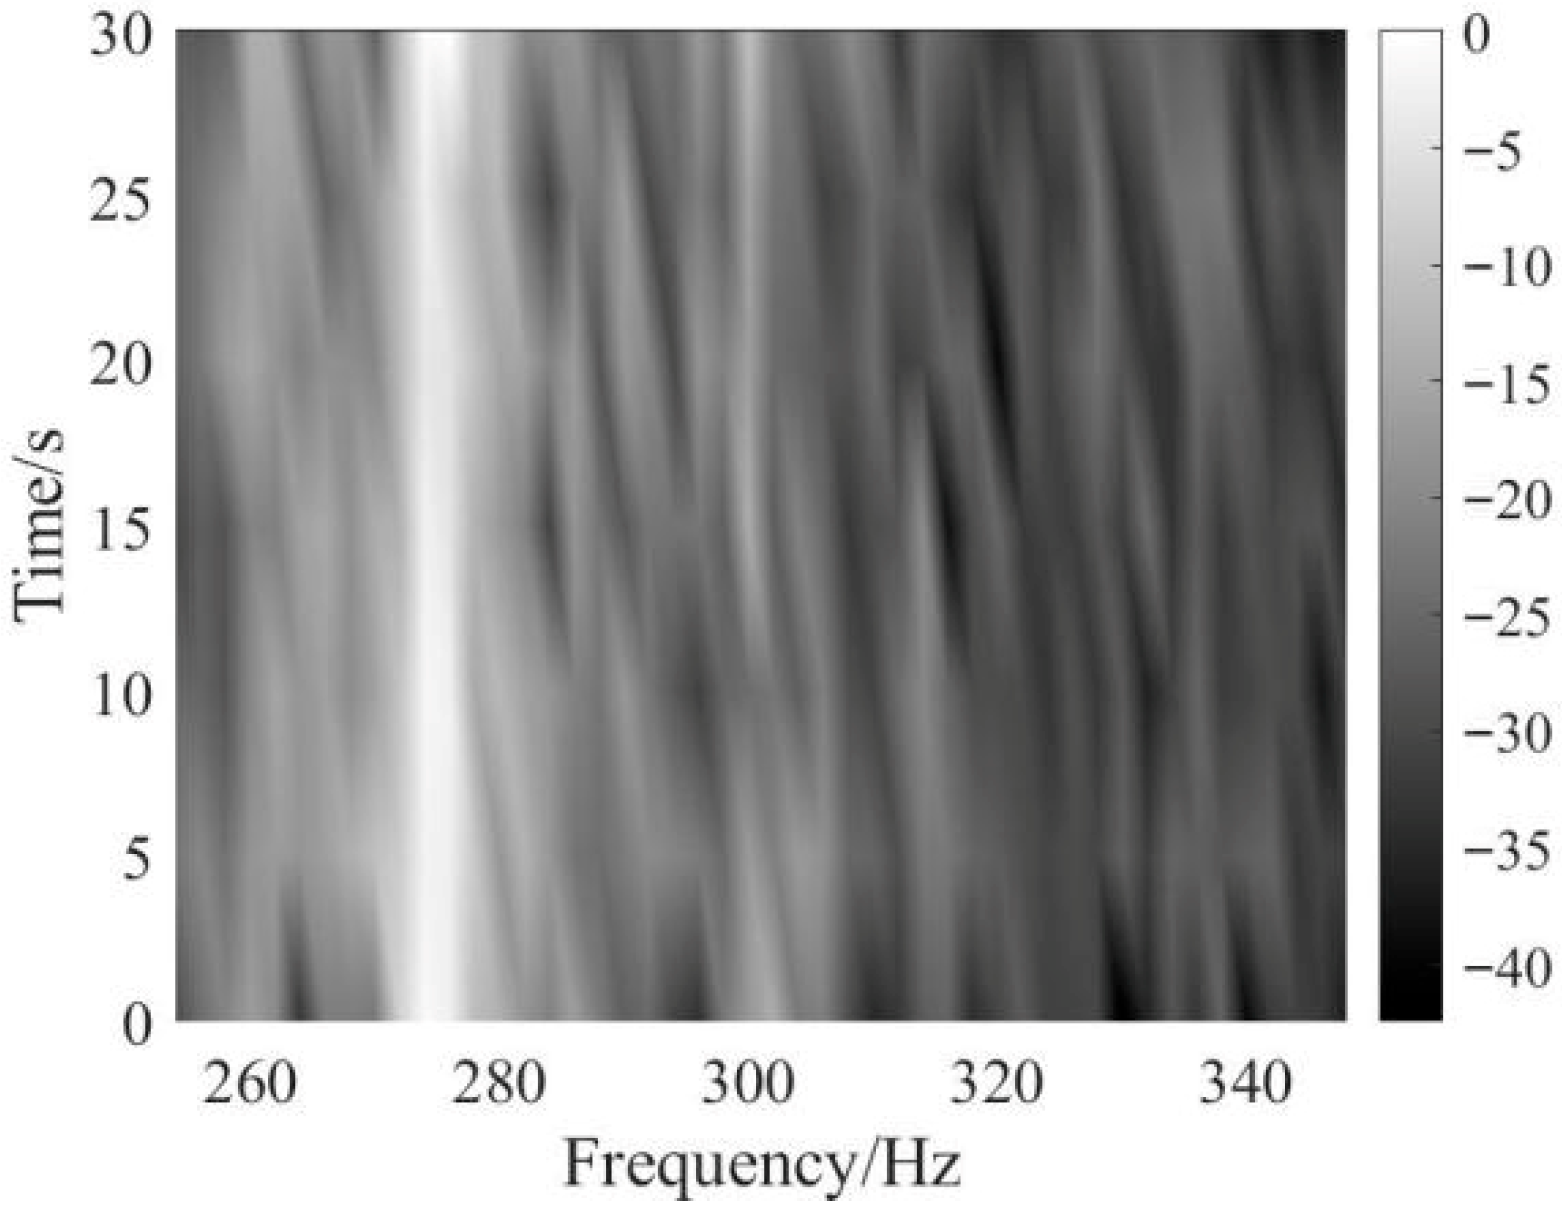
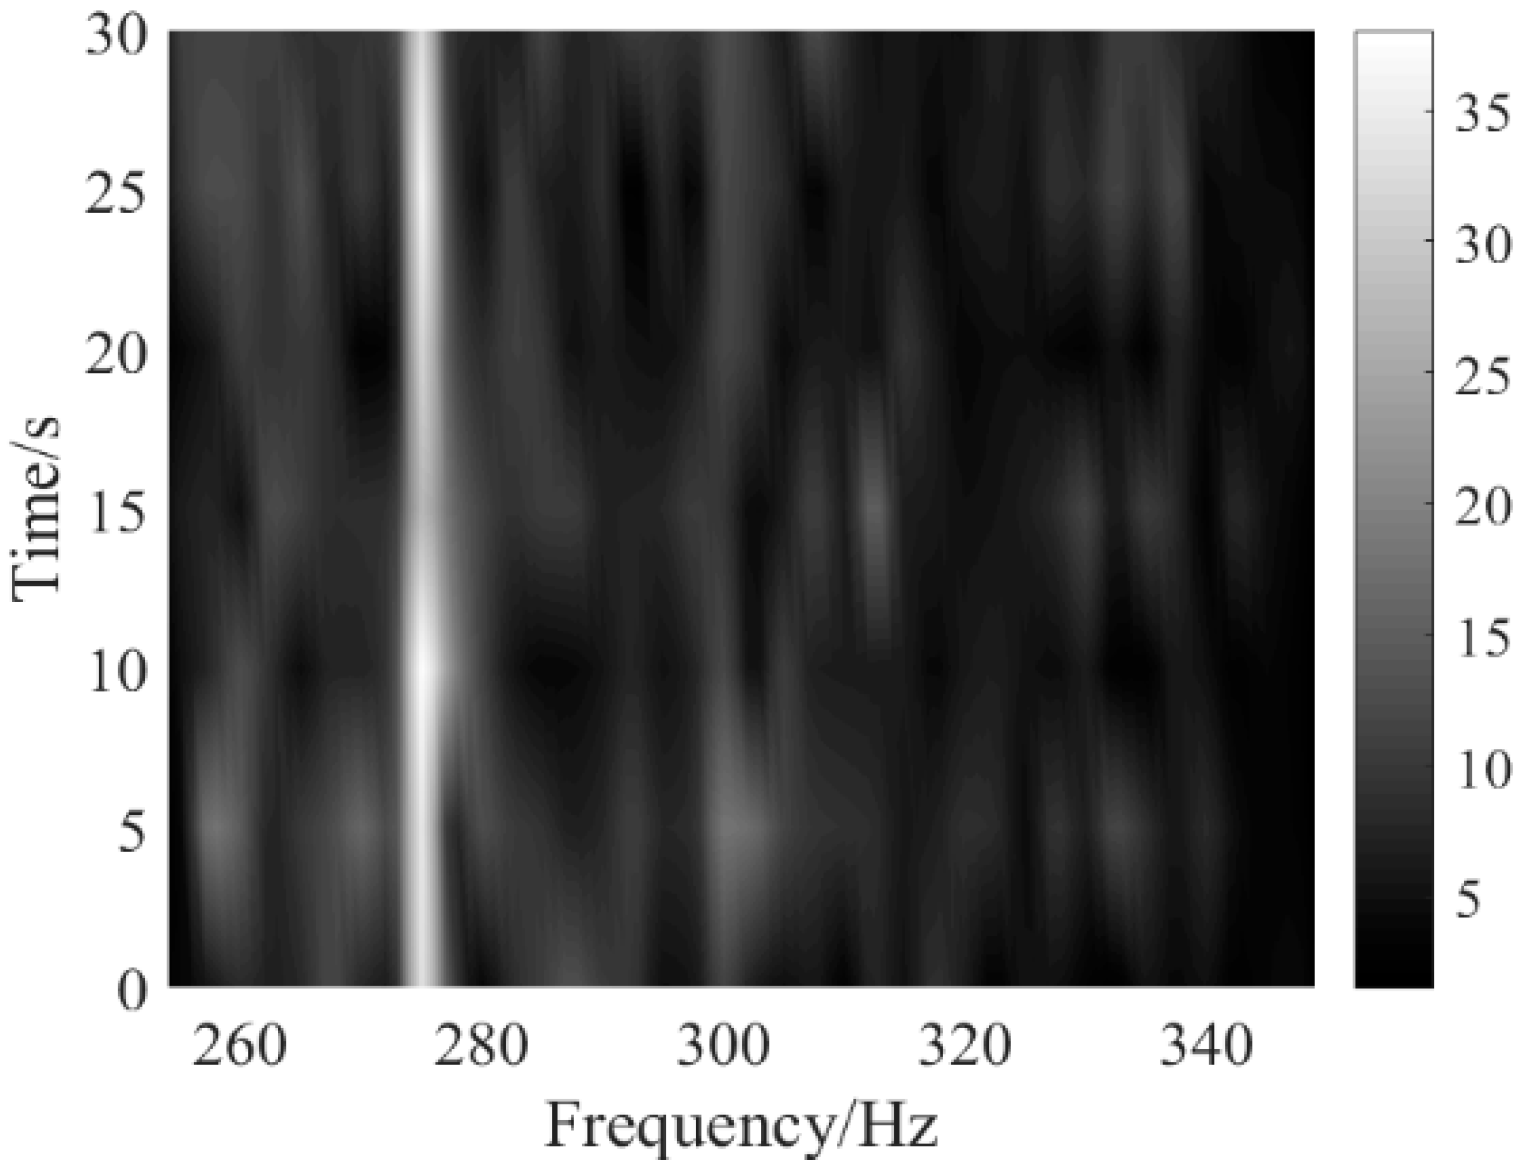
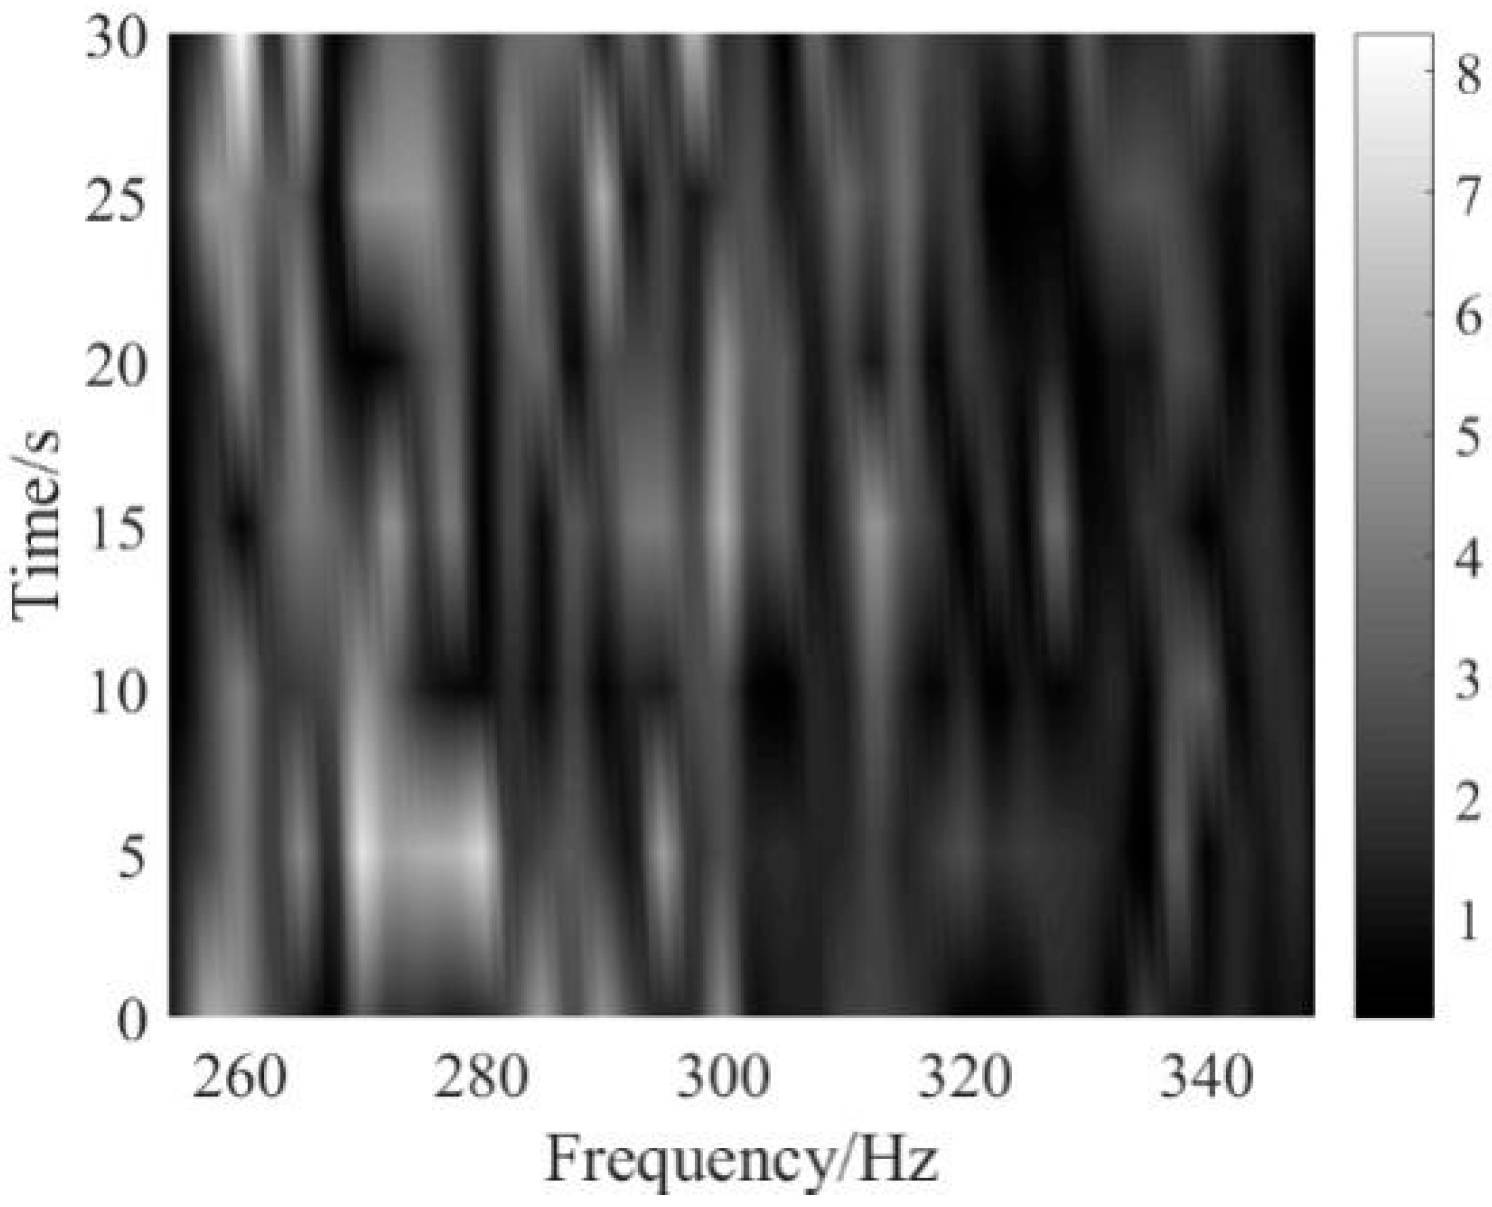
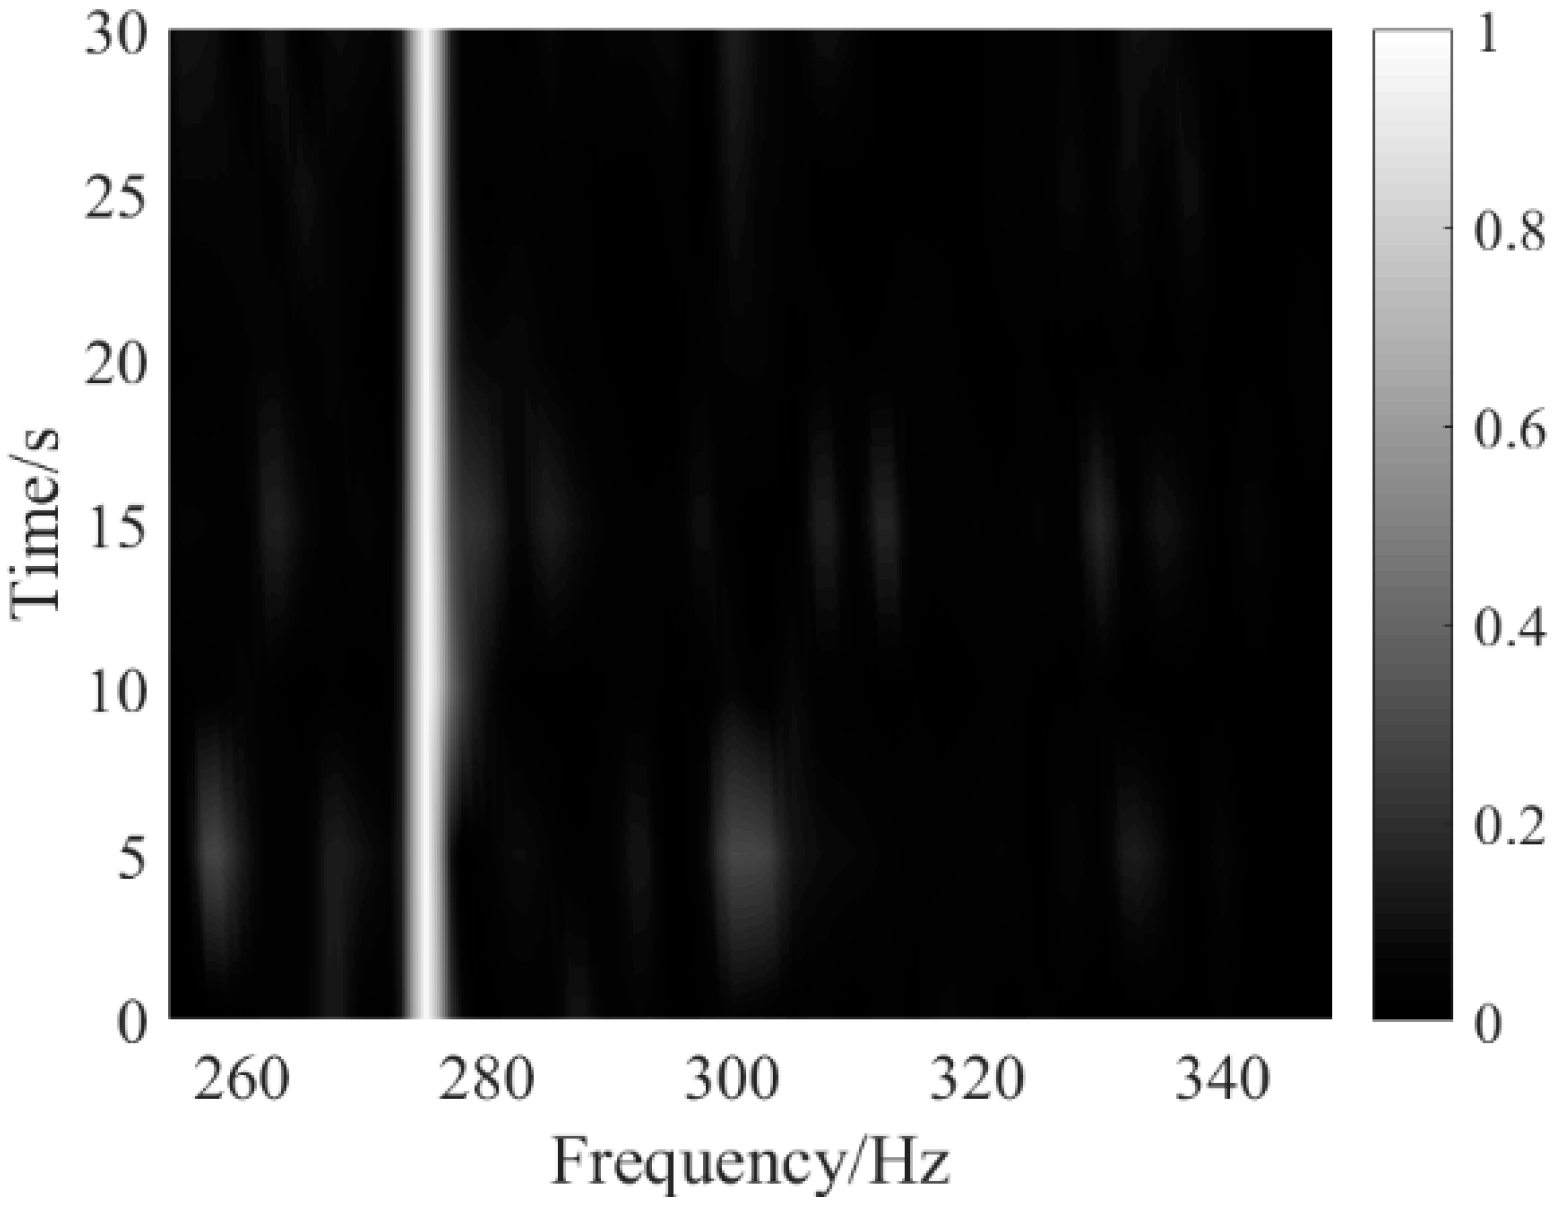
In order to verify the detection performance of the proposed algorithm under noise interference, the signal to be processed is a CW signal at a frequency of 275 Hz, recorded during an ocean experiment. The power spectrum LOFAR diagrams obtained using the Welch method are shown in Figure 10. The sliding window duration is 10 s and the overlap duration is 5 s. For Welch power spectrum, the sliding window duration is 2.5 s and the overlap duration is 1.5 s. It shows that the line spectrum is hard to detect, because the power spectrum ratios between the line spectrum signal and noise in the two channels are low according to the Welch method, with the line spectrum signal in the x-channel particularly seriously disturbed by environmental noise. The LOFAR diagram of the FCCS method is shown in Figure 11. The sliding window and overlapping durations remain unchanged. It can be seen that the power spectrum ratio is improved, but the noise spectrum values and their variance are still large, which affects the detection for line spectrum signal. Without changing the analysis duration of Fourier transform and the overlap duration, the results of maximum singular values and minimum singular values are presented in Figure 12 and Figure 13, respectively. It shows from Figure 12 that the maximum singular values for the signal are almost larger than those for the noise spectrum, the detection result of which are better than the Welch and FCCS methods, but the variance of maximum singular values for noise spectrum is larger. In Figure 13, it shows that the minimum singular values for the line spectrum signal are nearly equal to those for the noise spectrum. The detection result obtained by the proposed is shown in Figure 14. It can be seen that the detection values for the signal are significantly larger than those for the noise spectrum, and the variance of detection values for noise is small, which results in the line spectrum signal being clearly detectable.
Compared with the Welch method, FCCS method, and maximum singular value method, the proposed algorithm yields much smaller detection values for the noise spectrum than for the signal spectrum, along with a smaller variance of the noise spectrum, which is consistent with theoretical analysis. Consequently, the proposed algorithm is suitable for weak line spectrum detection of CW Signal.

5.2. Weak Line Spectrum Detection of Ship Signal

In the oceanic experiment, a single vector sensor was deployed at a depth of 180 m and the target ship data cruising in the proximity of the single sensor at a speed of 12 knots (approximately 6 m/s) were selected for target detection.
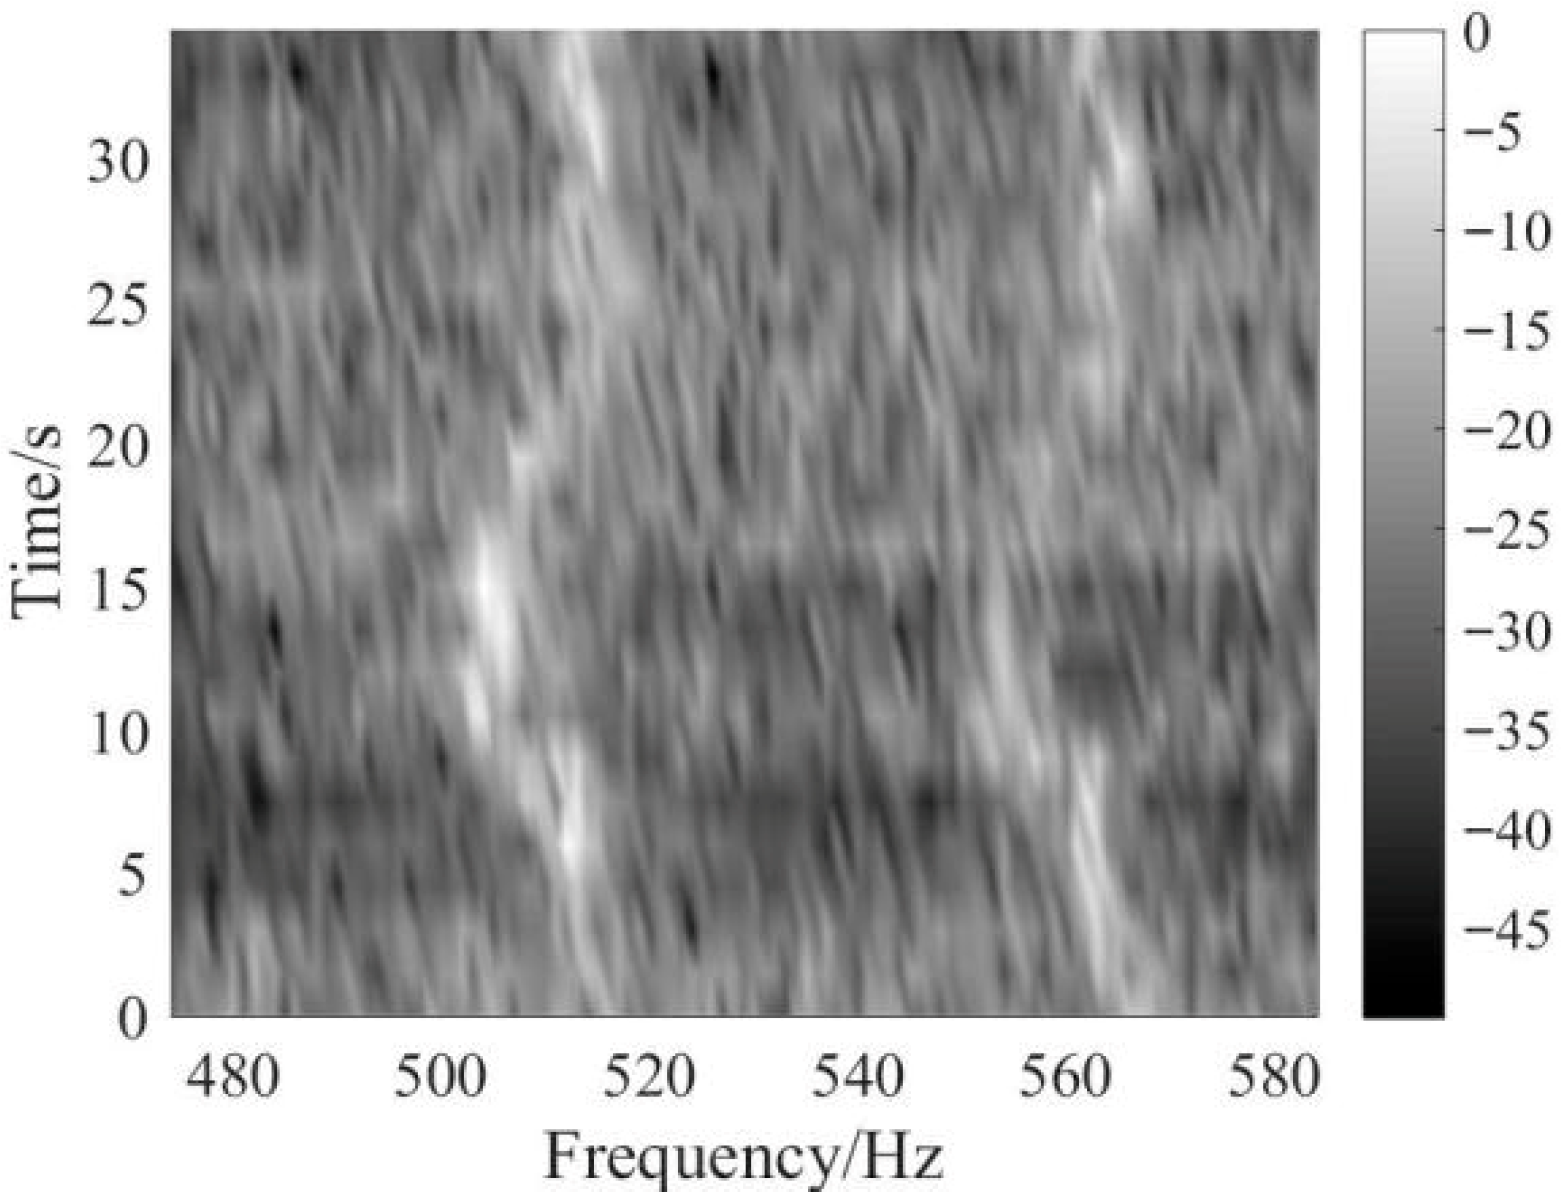
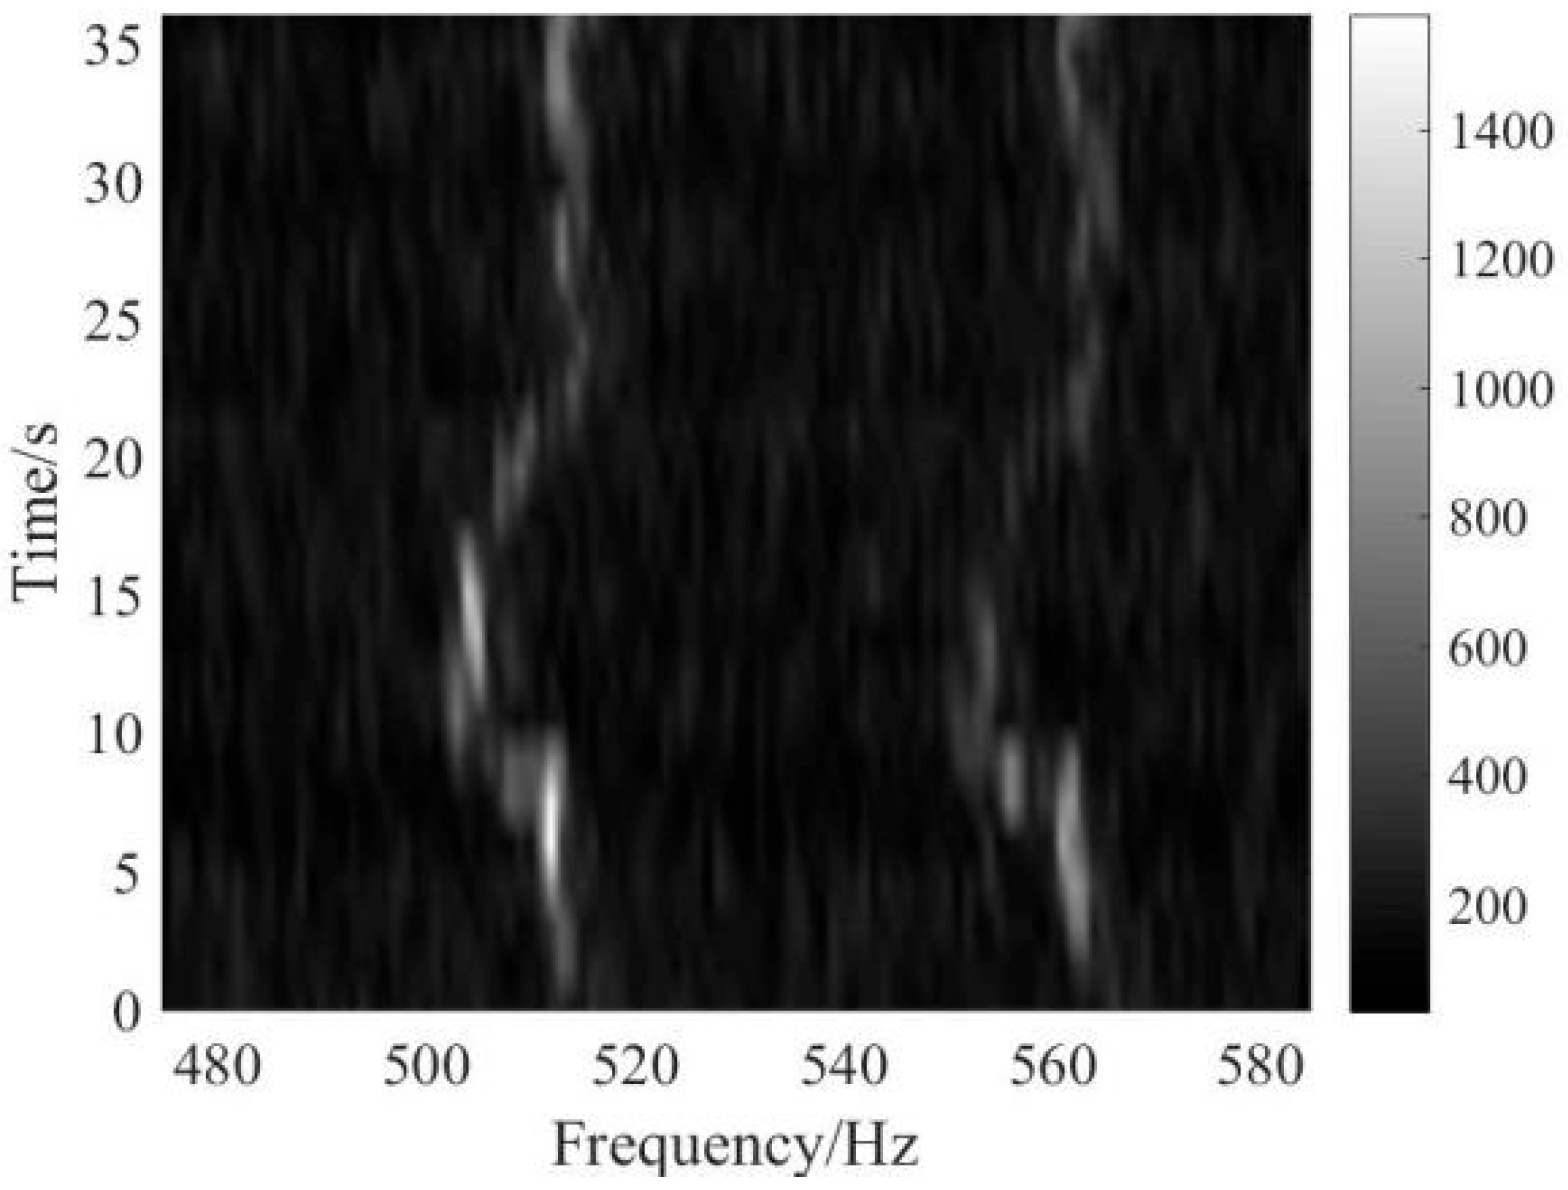
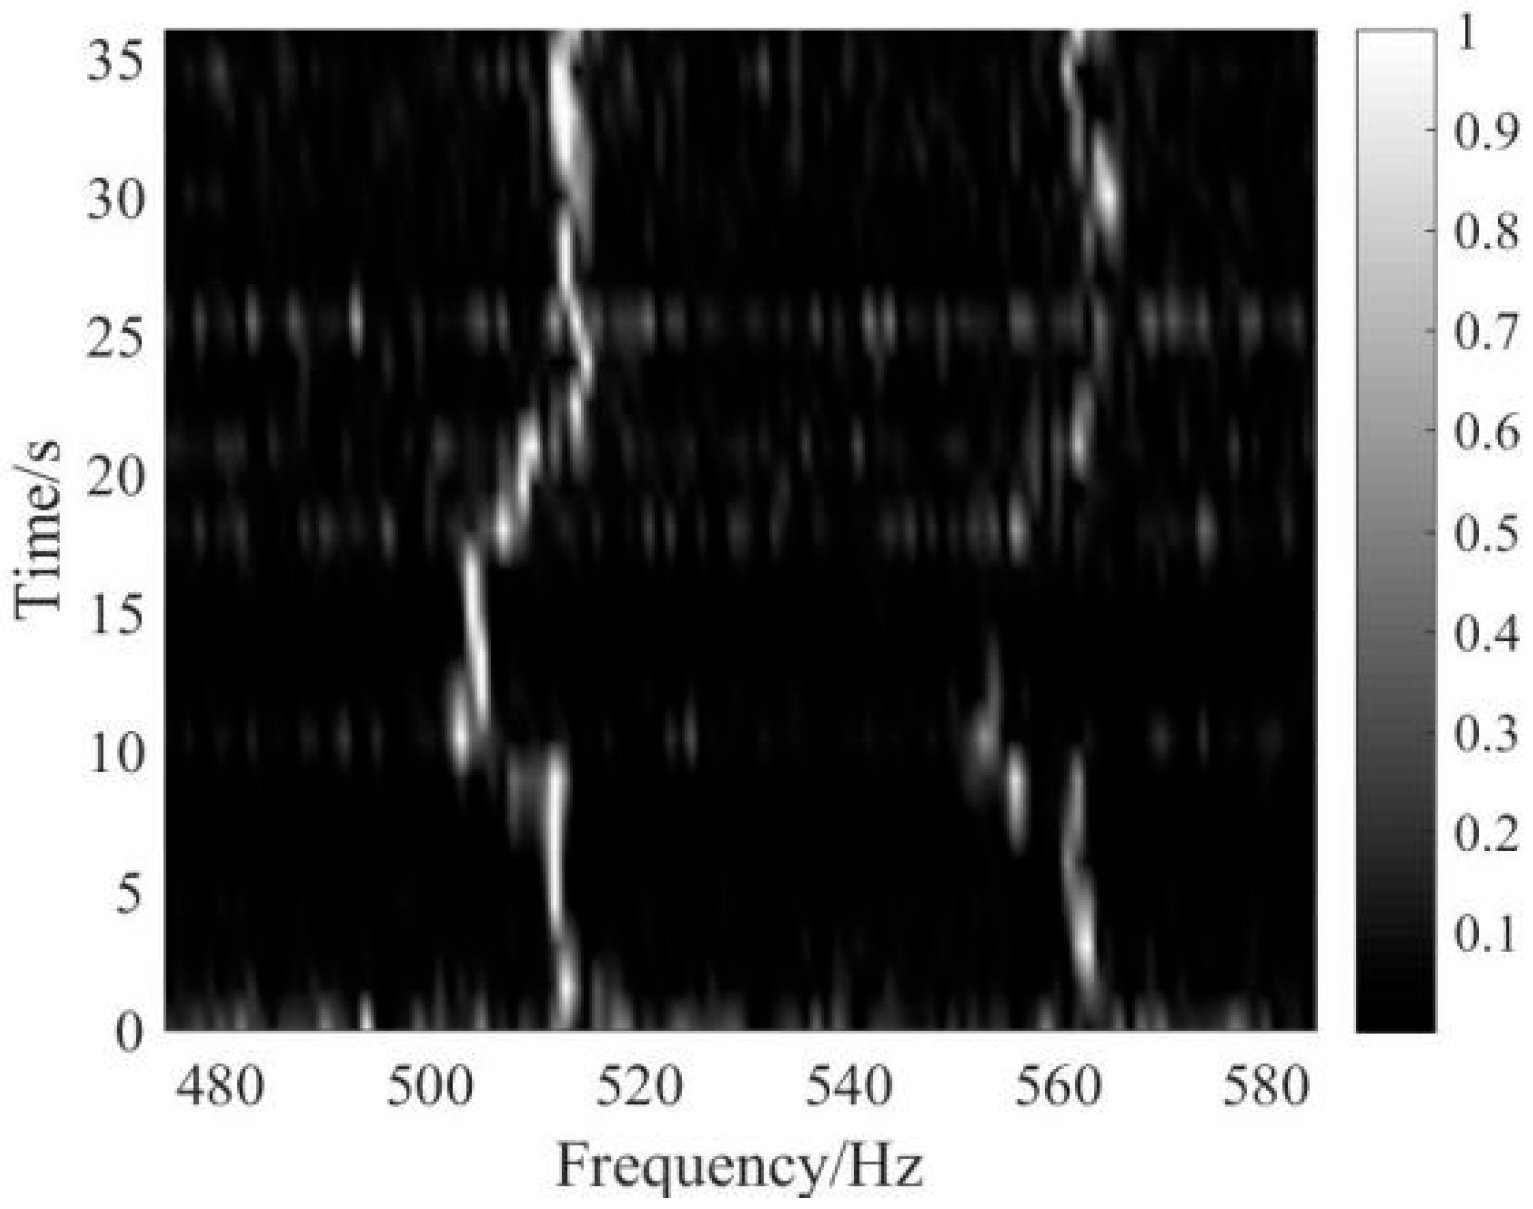
The power spectrum LOFAR diagrams obtained using the Welch method are shown in Figure 15. The sliding window duration is 3 s and the overlap duration is 1 s. For the Welch power spectrum, the sliding window duration is 1 s and the overlap duration is 0.5 s. It can be seen that there are two-line spectra between 480 Hz and 580 Hz, and both line spectra are obviously time-varying and broadened. On the LOFAR diagrams, the line spectra are displayed unclearly, and this is detrimental to underwater target detection. The LOFAR diagram of FCCS method is shown in Figure 16, with the same sliding window duration and overlap duration. It can be seen that the line spectra are clearer, but the noise is not suppressed well. To compare with Welch power spectrum and FCCS methods, the study presents the results of maximum singular values and minimum singular values shown in Figure 17 and Figure 18, respectively, and the detection result obtained by the proposed method shown in Figure 19, without changing the sliding window duration and overlap duration. It can be seen from Figure 17 that the maximum singular values for the noise spectrum are almost smaller than those for line spectrum signals, but the difference between them is relatively small, which results in the line spectra still not being clearly visible. In Figure 18, the minimum singular values for line spectrum at about 510 Hz around 5 s~10 s and 30 s~35 s are larger, which may be because the energy of the line spectra are larger, and the values for other line spectra are nearly equal to those for the noise spectrum. The line spectra, as shown in Figure 19, the detection values for line spectra are large most of the time and the line spectra can be detected according to the continuity of the line spectrum well.
For ship signals, the line spectra exhibit better continuity and higher distinctness by using the proposed algorithm, aiding accurate detection of ship targets’ line spectra and improving subsequent recognition reliability.

6. Conclusions

In the paper, a line spectrum detection algorithm based on singular value difference is proposed. The multi-channel data of a single vector sensor is used and applied to the Fourier Transform to obtain the frequency spectrum. The singular value difference in the analysis bandwidth is analyzed. It is found that the singular value difference in the analysis bandwidth of Gaussian noise is smaller than that in the analysis bandwidth of line spectrum when the power of line spectrum signal is larger, and the difference between line spectrum signal and Gaussian noise increases with the increase in data duration. The simulation results show that the Welch power spectrum method and the cross-spectrum method, combined with fourth-order cumulant diagonal slice (FCCS) cannot suppress noise well under a certain SNR, especially for Gaussian colored noise. Additionally, the maximum singular value method is not suitable for Gaussian colored noise to detect the line spectrum of underwater targets. Moreover, the simulation and experimental findings demonstrate that the proposed algorithm is capable of detecting line spectrum under Doppler and background noise interference. The proposed algorithm is feasible and low-cost for engineering applications.
It is noted that the detection statistic values for line spectrum decrease as the SNR decreases and gradually approaches those of the Gaussian white noise spectrum when the SNR decreases to a certain value, and the detection statistic values for Gaussian color noise spectrum increase with the decrease in SNR. The above situations are not conducive to the detection of line spectrum. How the problem can be solved needs to be studied in the future.

Author Contributions

Conceptualization, X.H.; methodology, X.H. and Y.W.; software, Y.H.; validation, X.H., Y.W. and Y.H.; formal analysis, X.H.; investigation, X.H.; data curation, X.H., P.H. and C.Z.; writing—original draft, X.H., P.H. and C.Z.; writing—review and editing, Y.W.; supervision, Y.W.; funding acquisition, Y.W. and Y.H. All authors have read and agreed to the published version of the manuscript.

Funding

This research was funded by the Key Laboratory Fund Item of China (Grant no. 914XXXXX15) and PhD Research Startup Foundation project of Liaoning Province of China (2021-BS-281).

Institutional Review Board Statement

Not applicable.

Informed Consent Statement

Not applicable.

Data Availability Statement

The datasets presented in this article are not readily available because the data are part of an ongoing study. Requests to access the datasets should be directed to the corresponding author.

Acknowledgments

Thank you to Tang Jun from Westlake University for his valuable suggestions on improving the article.

Conflicts of Interest

The authors declare that they have no competing interests.

References

  1. Luo, X.; Shen, Z.H. A Space-Frequency Joint Detection and Tracking Method for Line-Spectrum Components of Underwater Acoustic Signals. Appl. Acoust. 2021, 172, 107609.1–107609.12. [Google Scholar] [CrossRef]
  2. Yang, K.D.; Zhou, X.Y. Deep Learning Classification for Improved Bicoherence Feature Based on Cyclic Modulation And Cross-Correlation. J. Acoust. Soc. Am. 2019, 146, 2201–2211. [Google Scholar] [CrossRef] [PubMed]
  3. Li, J.; Yang, H.H. The Underwater Acoustic Target Timbre Perception and Recognition Based on the Auditory Inspired Deep Convolutional Neural Network. Appl. Acoust. 2021, 182, 108210–108232. [Google Scholar] [CrossRef]
  4. Wang, B.; Yang, H.; Fang, T. Modulation Recognition of Underwater Acoustic Communication Signals Based on Deep Learning. EURASIP J. Adv. Signal Process. 2024, 2024, 103. [Google Scholar] [CrossRef]
  5. Lei, Z.F.; Lei, X.F.; Zhou, C.H. Research on Feature Extraction of Ship-Radiated Noise Based on Compressed Sensing and Center Frequency. IEEE Access 2021, 9, 128679–128686. [Google Scholar] [CrossRef]
  6. Luo, X.W.; Li, L.; Shen, Z.H. Line Spectrum Trajectory Extraction Method of Underwater Acoustic Signal Based on Dynamic Parameter HMM. J. Electron. Inf. Technol. 2022, 44, 1956–1965. [Google Scholar]
  7. Guo, W.; Piao, S.; Guo, J.; Lei, Y.; Iqbal, K. Passive Detection of Ship-Radiated Acoustic Signal Using Coherent Integration of Cross-Power Spectrum with Doppler and Time Delay Compensations. Sensors 2020, 20, 1767–1787. [Google Scholar] [CrossRef]
  8. Wang, M.; Qiu, B.C.; Zhu, Z.F.; Ma, L.; Zhou, C.P. Passive Tracking of Underwater Acoustic Targets Based on Multi-Beam Lofar and Deep Learning. PLoS ONE 2022, 17, e0273898. [Google Scholar] [CrossRef] [PubMed]
  9. Wang, Y.Z.; Qiu, S.J.; Hu, G.Q.; Wu, B.; Yu, Y. Suppressing Short Time Marine Ambient Noise Based on Deep Complex Unet to Enhance the Vessel Radiation Signal in Lofar Spectrogram. J. Appl. Geophys. 2025, 233, 105611. [Google Scholar] [CrossRef]
  10. Zhang, R.; He, C.; Jing, L.; Zhou, C.; Long, C.; Li, J. A Modulation Recognition System for Underwater Acoustic Communication Signals Based on Higher-Order Cumulants and Deep Learning. J. Mar. Sci. Eng. 2023, 11, 1632–1652. [Google Scholar] [CrossRef]
  11. Shi, B.; Cao, T.Y.; Ge, Q.Q.; Wang, Z.T.; Guo, W.B. Underwater Non-stationary Acoustic Signal Detection Based on the STHOC Noise Suppression. Arab. J. Sci. Eng. 2025, 50, 10985–11000. [Google Scholar] [CrossRef]
  12. Yang, J.R.; Yan, S.F.; Mao, L.L.; Sui, Z.P.; Wang, W.; Zeng, D. Underwater Acoustic Signal Denoising Based on Sparse Tqwt and Wavelet Thresholding. Digit. Signal Process. 2024, 153, 12–27. [Google Scholar] [CrossRef]
  13. Zhang, Y.; Yang, Z.; Du, X.; Luo, X. A New Method for Denoising Underwater Acoustic Signals Based On EEMD, Correlation Coefficient, Permutation Entropy, and Wavelet Threshold Denoising. J. Mar. Sci. Appl. 2024, 23, 222–237. [Google Scholar] [CrossRef]
  14. Li, Z.; Cheng, Y.; Qiu, J. Adaptive Line Enhancer for Passive Sonars Based on Frequency-Domain Sparsity, Shannon Entropy Criterion and Mixed-Weighted Error. Arab. J. Sci. Eng. 2025, 50, 5899–5920. [Google Scholar]
  15. Yu, X.Y.; Chi, C.; Li, S.Q.; Li, Y.; Huang, H.N.; Wang, G.Q. Underwater Acoustic Target Recognition via Combining Adaptive Line Enhancement and Deep Neural Network. In Proceedings of the 2024 International Conference on Oceans, Singapore, 15–18 April 2024; pp. 1–4. [Google Scholar]
  16. Li, J.; Zhou, X.Y.; Cui, X.R.; Ji, M.Q.; Li, L.; Jiang, B.; Li, S.B.; Liu, J.H. Underwater Delay Estimation Based on Adaptive Singular Value Decomposition Reconstruction Under Low SNR and Multipath Conditions. Trans. Emerg. Telecommun. Technol. Adv. 2025, 36, e70145. [Google Scholar] [CrossRef]
  17. Chen, W.Y.; Wang, S.Z.; Li, Z.J.; Li, D. Underwater Acoustic Signal Denoising Method Based on DBO-VMD and Singular Value Decomposition. Aip Adv. 2015, 15, 055308. [Google Scholar] [CrossRef]
  18. Zheng, E.M.; Yu, H.B.; Chen, X.H.; Sun, C.Y. Line Spectrum Detection Algorithm Based on the Phase Feature of Target Radiated Noise. J. Syst. Eng. Electron. 2016, 27, 72–80. [Google Scholar]
  19. Wang, P.; Dong, J.; Wang, L.F.; Qiao, S.H. Signal Denoising Method Based on EEMD and SSA Processing for MEMS Vector Hydrophones. Micromachines 2024, 15, 1183. [Google Scholar] [CrossRef]
  20. Terracciano, D.S.; Costanzi, R.; Manzari, V.; Stifani, M.; Caiti, A. Passive Bearing Estimation Using a 2-D Acoustic Vector Sensor Mounted on a Hybrid Autonomous Underwater Vehicle. IEEE J. Ocean. Eng. 2022, 47, 799–814. [Google Scholar] [CrossRef]
  21. Choi, K.H.; Choi, J.W.; Kim, S.; Dahl, P.H.; Dall’Osto, D.R.; Song, H.C. Experimental Study on Performance Improvement of Underwater Acoustic Communication Using a Single Vector Sensor. IEEE J. Ocean. Eng. 2024, 49, 1574–1587. [Google Scholar] [CrossRef]
  22. Dong, H.T.; Suo, J.; Zhu, Z.G.; Li, S.Y. Improved Underwater Single-Vector Acoustic DOA Estimation via Vector Convolution Preprocessing. Electronics 2024, 13, 1796–1811. [Google Scholar] [CrossRef]
  23. Hawkes, M.; Nehorai, A. Acoustic vector-sensor correlations in ambient noise. IEEE J. Ocean. Eng. 2001, 26, 337–347. [Google Scholar] [CrossRef]
  24. Zhang, W.X.; Chen, Y.; Bian, Q.; Liu, Y.Y.; Liang, Y.; Meng, Z. An Adaptive Dual-Channel Underwater Target Detection Method Based on a Vector Cross-Trispectrum Diagonal Slice. J. Mar. Sci. Eng. 2025, 13, 1628. [Google Scholar] [CrossRef]
  25. Li, H.; Wang, T.; Guo, X.Y.; Su, L.; Mo, Y.X. Application research on vector coherent frequency-domain batch adaptive line enhancement in deep water. IET Radar Sonar Navig. 2024, 18, 1859–1873. [Google Scholar] [CrossRef]
  26. Shchurov, V.A. Movement of Acoustic Energy in the Ocean; Springer: New York, NY, USA, 2022; pp. 13–14. [Google Scholar]
  27. Ali, S.S.; Zhao, W.; Jin, M.; Yoo, S.J. Enhanced Maximum-Minimum Eigenvalue Based Spectrum Sensing. In Proceedings of the 2019 International Conference on Information and Communication Technology Convergence (ICTC), Jeju-si, Republic of Korea, 16–18 October 2019; pp. 708–713. [Google Scholar]
  28. Zhang, W.; Abreu, G.; Inamori, M.; Sanada, Y. Spectrum Sensing Algorithms via Finite Random Matrices. IEEE Trans. Wirel. Commun. 2012, 60, 164–175. [Google Scholar] [CrossRef]
  29. Penna, F.; Garello, R.; Spirito, M.A. Cooperative Spectrum Sensing Based on The Limiting Eigenvalue Ratio Distribution in Wishart Matrices. IEEE Commun. Lett. 2009, 13, 507–509. [Google Scholar] [CrossRef]
  30. Wang, P.; Fang, J.; Hing, N.; Li, H. Multiantenna-Assisted Spectrum Sensing for Cognitive Radio. IEEE Trans. Veh. Technol. 2010, 59, 1791–1800. [Google Scholar] [CrossRef]
  31. Zhang, R.; Lim, T.J.; Liang, Y.C.; Zeng, Y. Multi-Antenna Based Spectrum Sensing for Cognitive Radios: A GLRT Approach. IEEE Trans. Commun. 2010, 58, 84–88. [Google Scholar] [CrossRef]
  32. Ciflikli, C.; Ilgin, F.Y. Studentized Extreme Eigenvalue Based Double Threshold Spectrum Sensing Under Noise Uncertainty. Teh. Vjesn. 2020, 27, 353–357. [Google Scholar]
  33. Zeng, Y.; Liang, Y.C. Eigenvalue-based spectrum sensing algorithms for cognitive radio. IEEE Trans. Commun. 2009, 57, 1784–1793. [Google Scholar] [CrossRef]
Figure 1. The flowchart of SVD-DA.
Applsci 15 12184 g001
Figure 2. The mean of detection statistic values in the analysis bandwidth of (a) line spectrum signal and (b) Gaussian white noise under different data duration with SNR varying.
Applsci 15 12184 g002
Figure 3. The variance of detection statistic values in the analysis bandwidth of Gaussian white noise under different (a) data duration and (b) azimuth angles with varying SNR.
Applsci 15 12184 g003
Figure 4. The (a) mean and (b) variance of detection statistic values in the analysis bandwidth of Gaussian colored noise under different data duration with varying SNR.
Applsci 15 12184 g004
Figure 5. The LOFAR diagrams of the two-channel simulation data by Welch method.
Applsci 15 12184 g005
Figure 6. The LOFAR diagram of simulation data by FCCS method.
Applsci 15 12184 g006
Figure 7. The result of maximum singular values of simulation data.
Applsci 15 12184 g007
Figure 8. The result of minimum singular values of simulation data.
Applsci 15 12184 g008
Figure 9. The detection result of simulation data by the proposed algorithm.
Applsci 15 12184 g009
Figure 10. The LOFAR diagrams of the two-channel CW signal by Welch method.
Applsci 15 12184 g010
Figure 11. The LOFAR diagram of CW signal by FCCS method.
Applsci 15 12184 g011
Figure 12. The result of maximum singular values of CW signal.
Applsci 15 12184 g012
Figure 13. The result of minimum singular values of CW signal.
Applsci 15 12184 g013
Figure 14. The detection result of CW signal by the proposed algorithm.
Applsci 15 12184 g014
Figure 15. The LOFAR diagrams of the two-channel ship signal by Welch method.
Applsci 15 12184 g015
Figure 16. The LOFAR diagram of ship signal by FCCS method.
Applsci 15 12184 g016
Figure 17. The result of maximum singular values of ship signal.
Applsci 15 12184 g017
Figure 18. The result of minimum singular values of ship signal.
Applsci 15 12184 g018
Figure 19. The detection result of ship signal by the proposed algorithm.
Applsci 15 12184 g019
Disclaimer/Publisher’s Note: The statements, opinions and data contained in all publications are solely those of the individual author(s) and contributor(s) and not of MDPI and/or the editor(s). MDPI and/or the editor(s) disclaim responsibility for any injury to people or property resulting from any ideas, methods, instructions or products referred to in the content.