Featured Application
The workflow proposed in this study can be readily applied to environmental education, air-quality management, and citizen-science initiatives. It offers a fully reproducible framework that integrates open urban data with R-based analysis and forecasting, enabling educators, students, and local administrations to examine real atmospheric patterns, assess pollution dynamics, and design data-driven sustainability actions. The same approach can be adapted to other cities or environmental domains where open data and civic participation intersect.
Abstract
Open urban environmental data offer a unique opportunity to connect scientific research, education, and citizen participation. Leveraging IoT-based sensor networks and AI-driven forecasting models, this study integrates open environmental data with reproducible analysis and learning workflows. This study presents a reproducible workflow developed in the Quarto–R environment to analyse and model air-quality dynamics in Madrid between 2020 and 2024. The workflow integrates data acquisition, validation, harmonisation, exploratory analysis, and forecasting using the Prophet model. The analysis focuses on nitrogen dioxide (NO2) and ozone (O3) as representative pollutants of traffic emissions and photochemical processes. Results show a marked decline in NO2 concentrations across traffic stations and a parallel rise in O3 levels in suburban areas, reflecting the combined effects of emission control and regional transport. Beyond its scientific contribution, the Quarto–R workflow functions as a pedagogical tool that embeds transparency, traceability, and active learning throughout the analytical process. By enabling students and researchers to reproduce every step, from raw data to interpreted results, it strengthens data literacy and fosters a deeper understanding of urban sustainability. The framework exemplifies how open data and reproducible computing can be integrated into STEM education and citizen-science initiatives, promoting both environmental awareness and methodological integrity, thus bridging artificial intelligence and experiential learning.
1. Introduction
Urban air quality remains a critical challenge for both environmental management and public health. In recent years, the growing availability of IoT-based environmental sensors has provided high-resolution, real-time datasets that enable the application of artificial intelligence models for urban monitoring and forecasting. Over recent decades, concentrations of nitrogen dioxide (NO2) and ozone (O3) have been the focus of sustained monitoring because of their direct connection to road traffic emissions and secondary photochemical processes that affect human health and atmospheric balance.
Numerous studies have documented their impact on mortality and morbidity across different time scales, underlining the need to strengthen monitoring and modelling systems in urban environments. For example, Bell et al. reported a significant association between daily ozone levels and mortality across 95 urban communities in the United States [1]. The expansion of IoT-based monitoring networks has multiplied the availability of real-time environmental data, providing a natural interface between artificial intelligence and urban sustainability and constituting the core of IoT-enabled environmental intelligence.
Against this backdrop, the expansion of open-data policies offers an exceptional opportunity to link atmospheric science with public engagement and education. Yet, the incorporation of real environmental datasets into university teaching remains rare, largely because of the lack of reproducible workflows and accessible tools that allow data to be analysed, visualised, and interpreted coherently. Reproducible research has emerged in recent years as a response to the replication crisis in science. Peng defined it as the practice of accompanying every result with the data and code required for its full reproduction [2].
Sandve et al. emphasised the importance of traceability, version control, and the documentation of all computational steps [3], while Nosek et al. promoted a culture of open research as a means to enhance trust, transparency, and scientific progress [4]. Munafò et al. further identified reproducibility as a cornerstone of scientific integrity and higher education [5].
In parallel, the development of literate programming and integrated documentation environments such as Quarto and R Markdown has made it possible to unite narrative, code, and results within a single executable document. Rule et al. describe this convergence as an effective and transparent way to teach and share computational analyses [6]. Rooted in Knuth’s original philosophy, this paradigm has been widely adopted across reproducible research and STEM education.
Urban air-quality research has also benefited from the rise of open-source analytical tools. Carslaw and Ropkins developed openair, an R package that democratised atmospheric-data analysis through reproducible functions and standardised visualisations [7]. In Madrid, recent studies have demonstrated that low-emission policies have substantially reduced NO2 concentrations over the past decade, illustrating the value of open data for evaluating urban interventions [8].
Citizen science, in turn, has become a valuable complement to official monitoring networks. Castell et al. showed that low-cost sensors can extend spatial coverage and increase participants’ environmental awareness [9]. However, their reliability depends on rigorous calibration and harmonised protocols, as highlighted by Karagulian et al. [10]. These advances open new avenues for integrating environmental measurement, data analysis, and public participation within educational projects.
During the COVID-19 lockdowns, an inverse photochemical relationship between NO2 and O3 was observed, characterised by decreases in the former and rises in the latter. Sicard et al. [11] described this dynamic in detail, providing a compelling case for teaching that connects real atmospheric processes with statistical interpretation and predictive modelling.
In terms of modelling, both time-series and machine-learning approaches have proved effective for forecasting pollutant concentrations. Taylor and Letham introduced Prophet, a robust additive model capable of capturing multiple seasonalities and structural changes in environmental data [12]. Shen et al. [13] successfully applied Prophet to air-quality prediction in Indian cities, achieving superior performance to classical models, while Middya et al. [14] demonstrated that LSTM neural networks can capture complex temporal dependencies in NO2 and PM2.5 concentrations.
Complementary studies have highlighted the role of artificial intelligence and bibliometric analysis in tracing the evolution of atmospheric forecasting and smart-city research, revealing emerging trends and methodological gaps [15]. These contributions reinforce the relevance of combining predictive modelling with reproducible analytical practices in urban-pollution research.
Drawing upon this literature, the present study proposes a reproducible Quarto–R workflow to analyse, visualise, and model NO2 and O3 in Madrid during 2020–2024, using only open municipal data. Its contribution is twofold: scientific, by offering a transparent and verifiable analytical pipeline; and educational, by transforming that pipeline into an active-learning tool for STEM programmes.
The remainder of this article is structured as follows: Section 2 (Methods) details the data sources, cleaning, harmonisation, and modelling procedures; Section 3 (Results) presents the spatial and temporal patterns together with Prophet’s performance; Section 4 (Discussion) interprets the findings from both scientific and pedagogical perspectives; and Section 5 (Conclusions) synthesises the main contributions and outlines future educational applications and extensions of the Quarto–R approach.
2. Materials and Methods
The complete data-processing and learning workflow is summarized in Figure 1. It illustrates the five main phases connecting open environmental datasets with reproducible analysis and educational outcomes. Each stage is described in the following subsections.
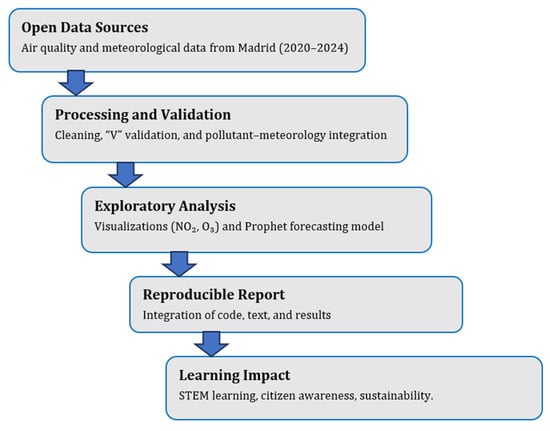
Figure 1.
Open Data and Methodological Pipeline. Source: authors (2025).
2.1. Open Data Sources
The datasets analysed in this study were obtained from the Open Data Portal of the Madrid City Council, which provides hourly and daily records from the city’s air-quality monitoring and meteorological networks for the period 2020–2024. These monitoring networks operate through IoT-enabled sensor infrastructures that continuously transmit validated measurements to the municipal open-data system.
Figure 2 summarises the spatial structure and measurement scope of these networks, defining the geographical domain of analysis and demonstrating the homogeneous coverage of Madrid’s observation system.
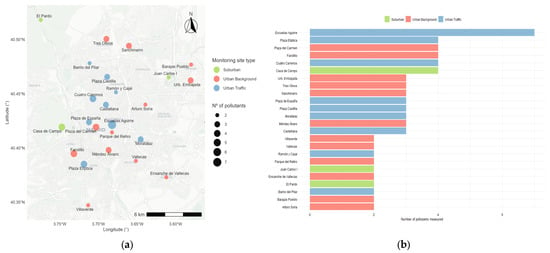
Figure 2.
Spatial analysis of Madrid’s open environmental monitoring networks during 2020–2024: (a) spatial distribution and pollutant coverage of air-quality monitoring stations; (b) pollutant coverage across air-quality monitoring stations in Madrid (2020–2024), classified by environment type (Suburban, Urban Background, and Urban Traffic).
The three site categories considered are Urban Traffic, Urban Background, and Suburban, as defined by the local air-quality network. Colors in both panels correspond to these categories, while symbol size in Figure 2a indicates the number of pollutants measured. The bar chart (Figure 2b) details pollutant coverage for each station, showing that Urban Traffic sites measure the broadest range of pollutants, followed by Urban Background and Suburban locations. This configuration confirms the spatial and functional representativeness of Madrid’s monitoring network and its suitability for urban-scale analysis.
The datasets include concentrations of NO2, O3, PM10, PM2.5, SO2, and CO, together with meteorological variables such as air temperature, solar radiation, relative humidity, wind speed and direction, and precipitation. Each record contains a validation code (“V”) ensuring data reliability. The adoption of the ETRS89 coordinate reference system facilitates spatial harmonisation and visualisation of all stations.
The use of open urban datasets aligns with the principles of transparency, interoperability, and reproducibility promoted by modern data science frameworks [16]. These open resources form the foundation of the reproducible workflow described in the following section, which details the phases of data cleaning and harmonisation prior to statistical and predictive analysis.
2.2. Processing and Validation
All data processing was performed entirely in R (version 4.3) within the Quarto environment, allowing code, narrative text, and analytical results to be integrated into a single reproducible document. This approach ensures full traceability of each transformation and facilitates verification of the analytical workflow. The adoption of literate-programming environments such as Quarto and R Markdown supports transparent and reproducible research practices [17].
The preprocessing workflow comprised sequential stages of data cleaning and harmonisation to generate a coherent and internally consistent dataset. All date and time fields were converted to the ISO 8601 standard [18] to ensure temporal synchronisation between air-quality and meteorological series. Only records with official validation (V) were retained according to the quality-assurance criteria established by the Madrid City Council. Unvalidated or duplicated observations were discarded, and numeric variables were standardised to a unified decimal format.
Column structures were reshaped through pivoting operations to harmonise pollutant readings across hourly files, and variable names were unified according to the metadata scheme of the Madrid Open Data Portal. The resulting datasets were merged by station code and date, generating a tidy, analysis-ready structure consistent with the reproducible standards of the tidyverse ecosystem [19].
Figure 3 summarises the main stages of the cleaning and validation pipeline, from the import of raw CSV files to the integration of validated air-quality and meteorological data.

Figure 3.
Data harmonisation and quality-control pipeline for air-quality datasets. Data source: Madrid Open Data Portal (2020–2024).
Daily means were then computed from hourly observations, and outliers were mitigated by winsorisation, replacing values beyond the 1st–99th percentile range with the corresponding thresholds. This procedure preserved the temporal integrity of the series while reducing the influence of anomalous peaks.
This method was preferred over direct deletion or interpolation because it preserves the temporal continuity of valid records while limiting the impact of extreme yet plausible environmental events, such as Saharan dust intrusions or local traffic surges. Winsorisation maintains the representativeness of the time series without introducing artificial values, ensuring that the resulting dataset reflects genuine variability rather than sampling noise. From a pedagogical viewpoint, it also provides a transparent and replicable example of robust data treatment that students can evaluate in open R workflows, reinforcing reproducibility and critical data literacy.
The final merged dataset maintained comparability across stations and time periods, forming the basis for the exploratory and predictive analyses described in Section 3. Documenting each stage of preprocessing is essential for computational reproducibility and scientific accountability [20].
2.3. Exploratory Analysis
The exploratory analysis focused on nitrogen dioxide (NO2) and ozone (O3), pollutants selected for their urban relevance and contrasting atmospheric behaviour. While NO2 primarily reflects local traffic-related emissions, O3 acts as a secondary pollutant formed through photochemical reactions driven by solar radiation and air-mass stability. Daily and monthly averages were computed, together with seasonal statistics by station type (urban traffic, urban background, and suburban) and year. These indicators revealed the dominant spatiotemporal dynamics across the 2020–2024 period.
As shown in Figure 4, NO2 concentrations exhibit a steady decrease over the study period, particularly at traffic-related monitoring sites, reflecting the effect of mobility restrictions during and after the COVID-19 pandemic. Conversely, O3 levels display a relative increase in peripheral areas, confirming the inverse relationship typically observed between these pollutants in Mediterranean urban environments [21].
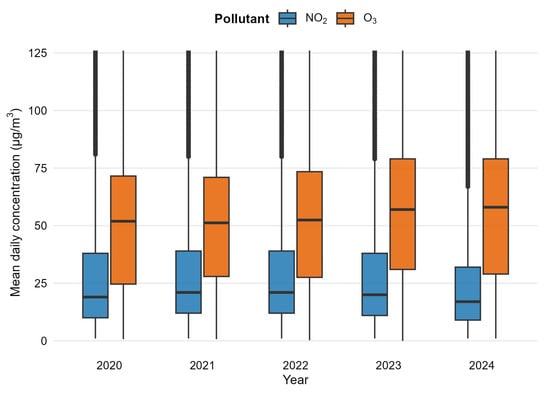
Figure 4.
Annual variability of NO2 and O3 concentrations in Madrid (2020–2024). Data source: Madrid Open Data Portal.
All visualisations were produced using the ggplot2 package, following a structured graphics framework that enhances analytical transparency and facilitates consistent comparisons across pollutants and station typologies [22].
Long-term air-quality studies have highlighted the usefulness of normalisation approaches for interpreting pollutant trends under varying meteorological regimes, supporting the methodological choices adopted in this work [23]. Furthermore, earlier research has described contrasting NO2 and O3 responses during periods of reduced mobility, which aligns with the patterns observed in the present analysis [24].
2.4. Reproductible Report
The forecasting analysis applied the Prophet model to simulate daily concentrations of NO2 and O3 between 2020 and 2024, extending the predictions by 90 days beyond the observed period. Prophet was selected as the core forecasting method due to its additive decomposition structure, which transparently separates trend, seasonality, and residual components. Compared with classical ARIMA models, Prophet automates the detection of multiple seasonalities and changepoints, managing irregular sampling and missing values typical of open environmental datasets. In contrast to deep-learning approaches such as LSTM networks, Prophet requires minimal hyperparameter tuning and provides interpretable outputs that are easily reproducible. This interpretability is particularly valuable for educational contexts, enabling students and researchers to understand, modify, and replicate forecasting experiments without extensive machine-learning expertise. These features justified the choice of Prophet as both a scientific and pedagogical model in this study.
Model validation was conducted through a time-based 80/20 train–test split, ensuring that predictions were evaluated exclusively on unseen data. Prophet combines additive components for trend, yearly and weekly seasonality, and changepoints to represent both long-term dynamics and short-term variability in urban air quality. Within this AI–IoT framework, the model processes sensor-derived data streams, providing interpretable forecasts that connect computational intelligence with environmental sensing. Model configuration was optimised by increasing changepoint flexibility and Fourier terms to enhance sensitivity to abrupt variations associated with the COVID-19 lockdown and the subsequent recovery of urban traffic.
Figure 5 presents the observed and Prophet-predicted daily concentrations of NO2 (a) and O3 (b). The results show strong correspondence between observed and estimated values, with performance metrics of MAE = 8.31 µg/m3 and RMSE = 10.99 µg/m3 for NO2, and MAE = 10.33 µg/m3 and RMSE = 12.64 µg/m3 for O3. The NO2 forecasts accurately reproduced the sharp decrease during the 2020 confinement, followed by a progressive rebound linked to traffic recovery. In contrast, O3 exhibited the inverse pattern, with well-defined summer peaks and the photochemical oscillations typical of Mediterranean urban atmospheres [25].
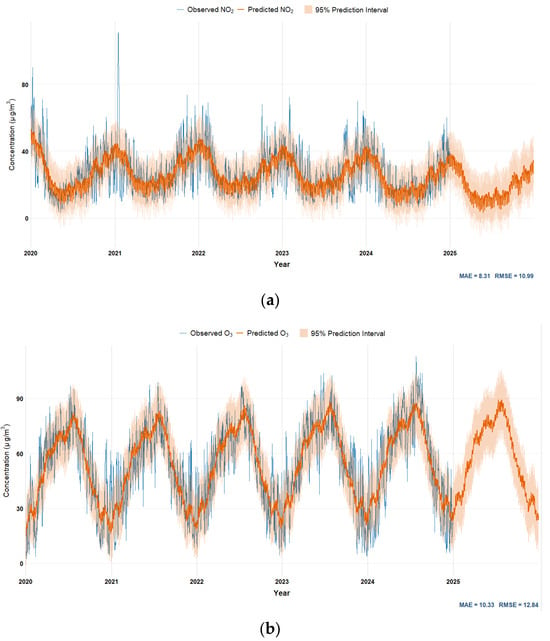
Figure 5.
Prophet-based forecasting of daily NO2 (a) and O3 (b) concentrations in Madrid (2020–2024). Data source: Madrid Open Data Portal.
These results illustrate how a simple statistical structure can capture complex environmental dynamics when embedded within an open and transparent workflow. The Prophet implementation in Quarto–R ensures traceability of data, code, and outputs in accordance with reproducibility standards for computational research [26]. Beyond its predictive accuracy, the model aligns with current trends in interpretable machine learning, which emphasise explainability over complexity [27]. Recent studies have also demonstrated the potential of hybrid Prophet–LSTM approaches, where the statistical decomposition capabilities of Prophet are combined with the temporal sensitivity of deep learning to improve forecasting stability and responsiveness [28].
In methodological terms, Prophet’s performance aligns with previous atmospheric studies addressing variability in pollutant behaviour under changing meteorological conditions [29], confirming its suitability for daily-scale forecasting in complex urban contexts. From a pedagogical standpoint, Prophet’s transparent decomposition and minimal parameterisation make it ideal for classroom replication and for illustrating the interpretability–complexity trade-off in environmental forecasting.
2.5. Learning Impact
Each stage of the workflow, from data access to forecasting, was documented in a single Quarto file, including package versions and random seed specifications. This structure ensures full reproducibility in line with international standards on computational transparency and open-science practices [30].
Figure 6 illustrates the learning and reproducibility ecosystem linking open data, computational analysis, and STEM education through the Quarto–R environment. By integrating IoT sensor data and AI forecasting within this environment, the workflow extends reproducibility beyond computation, enabling learners to engage with live environmental information in near real time. The diagram shows how environmental datasets feed into reproducible analysis (R + tidyverse + Prophet), exploratory forecasting, and documentation, ultimately supporting STEM and citizen learning.

Figure 6.
Learning and reproducibility ecosystem connecting open data, computational analysis, and STEM education through the Quarto–R environment. Source: authors’ elaboration.
This workflow enables users to follow the entire analytical process within one coherent and transparent environment, reinforcing both methodological and pedagogical objectives. Beyond its technical value, the approach nurtures scientific and digital literacy through open-source tools that empower students, educators, and citizens to explore environmental data, interpret variability, and reflect on urban implications.
Embedding reproducible workflows in air-quality education strengthens STEM competences, deepens environmental awareness, and fosters civic engagement in data-driven science. Such alignment between computational transparency and educational innovation supports the development of critical data literacies in higher education [31].
2.6. Meteorological Covariates
Meteorological conditions exert a fundamental influence on the formation, dispersion, and transformation of air pollutants in urban environments. Temperature, humidity, wind speed, and solar radiation directly affect photochemical reactions and pollutant dilution, shaping the daily variability of nitrogen dioxide (NO2) and ozone (O3).
In this study, meteorological parameters were incorporated as contextual covariates to complement the interpretation of NO2 and O3 dynamics. Hourly datasets covering 2020–2024 were retrieved from the Madrid Open Data Portal, providing harmonised records of temperature (°C), relative humidity (%), wind speed (m s−1), wind direction (°), solar radiation (W m−2), and precipitation (mm), together with station metadata (ID, coordinates, altitude, and typology).
Data processing followed a transparent R–Quarto workflow summarised in Figure 7, which depicts three sequential stages: (i) data inputs (meteorological variables and station metadata); (ii) data processing (import, restructuring of hourly fields H01–H24, filtering of validated observations, aggregation to daily means, and derivation of dynamic covariates u, v, calm and high-insolation days); and (iii) integration with validated NO2 and O3 datasets by station and date.
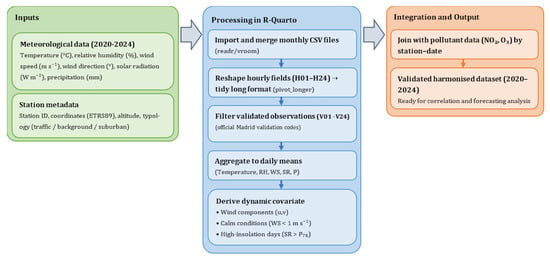
Figure 7.
Workflow for harmonising meteorological data and integrating them with air–quality observations in R–Quarto (2020–2024).
The resulting harmonised database links atmospheric chemistry and meteorological variability at a daily scale. The derived variables and their analytical rationale are summarised in Table 1, which supports the correlation and forecasting analyses presented in Section 3.

Table 1.
Meteorological variables and derived covariates included in the analysis (2020–2024).
From a scientific perspective, this integration quantifies how meteorological variability governs pollutant behaviour in Mediterranean cities. The combined influence of temperature, solar radiation, and calm winds promotes photochemical O3 episodes and NO2 titration under stagnant conditions [32].
The threshold of 1 m s−1 used to define calm conditions follows the meteorological criteria established by the Spanish Meteorological Agency (AEMET) and the European Environment Agency (EEA), which classify winds below this limit as insufficient to produce effective pollutant dispersion. This convention enables comparability with national air-quality reports and facilitates the reproducible identification of stagnant episodes. From an educational perspective, it also allows learners to interpret how physical definitions translate into analytical variables within open environmental datasets.
Studies across the Iberian Peninsula confirm that such patterns are modulated by seasonal radiation and synoptic pressure gradients [33].
From an educational standpoint, the reproducible workflow offers a tangible framework for interdisciplinary learning in R, allowing students and citizen scientists to explore how atmospheric processes affect air-quality patterns [34].
This approach strengthens inquiry-based STEM education by linking real-world data with analytical problem-solving and fostering science data literacy among students [35]. Integrating transparent analytical pipelines into teaching promotes environmental data literacy and supports the pedagogical principles of open science [36].
Additional scripts, extended tables, and all reproducible figures are provided in the Supplementary Materials.
3. Results
The results are presented in three complementary subsections that describe, visualise, and model the spatiotemporal dynamics of air pollutants in Madrid using open urban datasets. Section 3.1 examines temporal and spatial patterns of NO2 and O3, highlighting their contrasting behaviours across monitoring stations. Section 3.2 assesses the performance of the Prophet forecasting model through quantitative and visual evaluation metrics, while Section 3.3 explores meteorological drivers and correlation patterns linking atmospheric conditions with pollutant variability.
Together, these analyses demonstrate how reproducible workflows in R–Quarto can transform raw environmental data into structured knowledge, supporting both scientific interpretation and data-driven STEM learning [37].
3.1. Descriptive and Correlative Overview
Daily concentrations of nitrogen dioxide (NO2) and ozone (O3) in Madrid between 2020 and 2024 reveal marked contrasts in magnitude, variability, and seasonal behaviour. The distribution of NO2 concentrations shows a sustained decline after the 2020 lockdown, stabilising between 25 and 30 µg m−3 from 2021 onwards. This reduction reflects the long-term effect of mobility restrictions and the gradual recovery of traffic emissions [37]. The narrower interquartile ranges observed after 2021 indicate more homogeneous background levels, although occasional winter peaks persist due to local traffic episodes.
Figure 8 summarises these temporal patterns, comparing the annual distributions of NO2 and O3 concentrations across the 2020–2024 period. NO2 levels display a downward trend, whereas O3 shows a relative increase and wider dispersion, with annual medians centred around 50–70 µg m−3.
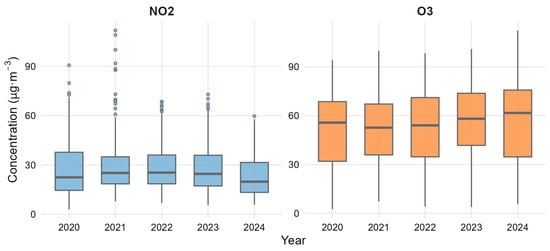
Figure 8.
Annual distribution of daily NO2 and O3 concentrations in Madrid (2020–2024). Data source: Madrid Open Data Portal.
The persistence of elevated O3 despite the decline in NO2 highlights the non-linear coupling between both pollutants, a characteristic feature of Mediterranean urban atmospheres [38]. Reduced nitrogen oxide emissions under strong solar radiation favour ozone formation through photochemical compensation processes [39].
From a correlative perspective, the opposite evolution of NO2 and O3 underscores their diagnostic value as complementary indicators of urban air chemistry. These patterns reflect the dynamic balance between emission reductions, radiative forcing, and atmospheric stability that defines Madrid’s basin.
The integration of open datasets with reproducible R–Quarto workflows allows such complex relationships to be visualised transparently, transforming raw environmental data into accessible analytical resources for both scientific interpretation and STEM-oriented learning.
3.2. Temporal and Spatial Variabilidy
The temporal evolution of nitrogen dioxide (NO2) and ozone (O3) in Madrid between 2020 and 2024 reveals pronounced seasonal and spatial contrasts shaped by the city’s emission structure and meteorological dynamics. Monthly averages (Figure 9a) show a persistent winter–summer inversion: NO2 peaks during colder months, when boundary-layer stability and limited ventilation constrain dispersion, whereas O3 concentrations increase sharply from late spring to early autumn under strong solar radiation. This anti-phase pattern between primary and secondary pollutants has been widely documented across Mediterranean and Iberian urban environments [40].
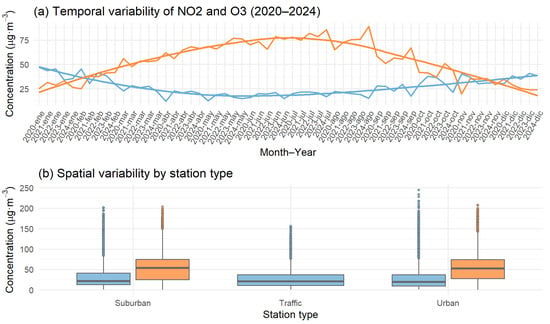
Figure 9.
Temporal and spatial variability of daily NO2 and O3 concentrations in Madrid (2020–2024): (a) Monthly evolution of both pollutants. (b) Spatial gradients by station type. Data source: Madrid Open Data Portal.
Figure 9 summarises these dynamics across both time and space. Panel (a) displays the temporal variability of NO2 and O3, capturing the marked decline in NO2 levels during 2020, the progressive recovery associated with mobility resumption, and the intensification of summer O3 peaks in subsequent years. Panel (b) depicts spatial variability by monitoring-site type, showing that Traffic stations consistently record the highest NO2 concentrations, while Urban Background and Suburban sites exhibit higher O3 values. This spatial inversion reflects the localised nature of NO2 emissions and the regional photochemical production of O3 downwind of emission sources [41].
Traffic stations in Madrid primarily monitor primary pollutants such as NO2 and particulate matter, while O3 observations are restricted to background and suburban environments in line with European air-quality monitoring protocols. The persistence of these spatial contrasts, despite declining emissions, suggests that urban form and traffic intensity remain decisive factors in pollutant distribution across the Madrid basin. Comparable patterns have been reported for other Mediterranean cities where orography and recirculation favour pollutant accumulation.
The predictive evaluation of these patterns using the Prophet model further confirms the reliability of the observed trends. As summarised in Table 2, model performance achieved MAE and RMSE values below 13 µg m−3 for both pollutants, reproducing the seasonal cycles and emission-related fluctuations observed in Figure 9.

Table 2.
Prophet model performance metrics for NO2 and O3 concentrations in Madrid (2020–2024).
The coherence between observed and predicted values illustrates how open urban datasets can be integrated into transparent forecasting workflows, combining statistical interpretability with scientific and educational relevance. This integrated approach supports reproducible urban-air analysis and provides an accessible resource for citizen engagement in data-driven environmental learning.
3.3. Prophet Model Performance
The Prophet model was employed to forecast the daily evolution of NO2 and O3 concentrations in Madrid during 2020–2024. The model successfully reproduced the main temporal dynamics, capturing the post-pandemic decline in NO2 and the recurrent summer peaks of O3 associated with enhanced photochemical activity. Its additive decomposition of trend and seasonality generalised well across multiple years, delivering stable forecasts even under irregular short-term fluctuations.
Model evaluation achieved mean absolute error (MAE) and root mean square error (RMSE) values below 13 µg m−3 for both pollutants, confirming the adequacy of Prophet for medium-term air-quality forecasting using open urban datasets. Beyond quantitative accuracy, the approach provides high pedagogical value: the explicit separation of trend, seasonality, and residual components enables students and citizen scientists to explore urban air dynamics transparently within reproducible R-Quarto workflows.
To further examine how meteorological conditions influence pollutant variability, the forecasted series were compared against six atmospheric variables: temperature, wind speed, relative humidity, solar radiation, atmospheric pressure, and precipitation, each standardised for visual consistency. Figure 10a displays this joint temporal evolution, revealing the seasonal co-variation between pollutants and meteorological drivers and providing an intuitive basis for interpreting their interactions. In Fig. 10a, each meteorological variable is represented by a distinct colour: temperature (orange), wind speed (blue), relative humidity (red), solar radiation (yellow), atmospheric pressure (purple), and precipitation (grey).
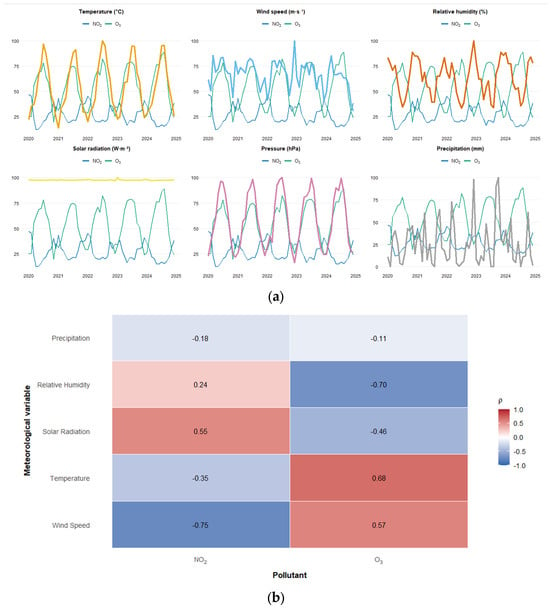
Figure 10.
(a) Temporal comparison between NO2 and O3 concentrations and six meteorological variables in Madrid (2020−2024). Data source: Madrid Open Data Portal. (b) Spearman correlation coefficients (ρ) between NO2 and O3 concentrations and meteorological variables during 2020−2024.
Complementing this visual analysis, a Spearman correlation study was conducted between daily pollutant concentrations and the same meteorological parameters. The resulting heatmap (Figure 10b) reveals coherent and physically consistent associations. O3 shows strong positive correlations with temperature (ρ = 0.68) and solar radiation (ρ = 0.55), confirming its photochemical dependence on thermal and radiative conditions. In contrast, NO2 correlates negatively with wind speed (ρ = −0.75) and moderately with temperature (ρ = −0.35), reflecting the combined effects of emission intensity and atmospheric dispersion. Relative humidity exhibits opposite tendencies, positive for NO2 and negative for O3, indicating that humid and stagnant conditions favour primary pollutant accumulation while limiting ozone formation.
Overall, these relationships emphasise the complementary behaviour of NO2 and O3 in the Madrid basin and demonstrate how meteorological forcing governs pollutant variability. From a critical standpoint, the moderate-to-strong correlations highlight both the explanatory power and the limits of statistical coupling: meteorology shapes, but does not fully determine, concentration trends. At the same time, the open-data, R-based workflow offers a pedagogically rich framework for analysing atmosphere–pollution interactions, enabling students to reproduce correlation analyses, interpret physical causality, and discuss uncertainty within authentic environmental datasets.
Supplementary Materials include extended figures, correlation results, and reproducible R–Quarto scripts supporting the analyses presented in this section.
4. Discussion
Reproducible workflows built on open environmental data can effectively fulfil both scientific and educational purposes. In this study, the integration of IoT-based sensing and AI-driven forecasting within a transparent Quarto–R framework demonstrated how intelligent infrastructures can enhance interpretability, scalability, and civic participation in urban-air analysis. The joint examination of NO2, O3, and meteorological parameters clarified the mechanisms shaping air-quality variability in Mediterranean cities while illustrating how computational intelligence can be embedded in participatory learning environments.
From a scientific standpoint, the contrasting evolution of NO2 and O3 between 2020 and 2024 reflects a combination of emission shifts and meteorological influences. The steady reduction in NO2 after 2020 coincides with mobility restrictions and the progressive implementation of low-emission policies in Madrid [8,38]. Conversely, the relative increase in O3 conforms to the photochemical regime typical of southern European cities, where elevated temperature and solar radiation drive secondary pollutant formation [32,33]. The Prophet model successfully reproduced these dynamics, yielding low prediction errors and stable seasonal patterns across years, thereby confirming its suitability for medium-term forecasting based on open urban datasets.
The correlation analysis reinforced these findings. O3 showed positive correlations with temperature and solar radiation, confirming its photochemical dependence under anticyclonic conditions. Atmospheric pressure also appeared to modulate O3 variability, suggesting that stable high-pressure systems favour pollutant accumulation over the Madrid basin. In contrast, NO2 concentrations displayed negative correlations with wind speed and temperature, indicating that stagnant, cooler conditions favour accumulation of primary pollutants. These relationships align with previous Mediterranean studies [33,35,39], supporting the reliability of the patterns observed.
Nevertheless, several limitations must be acknowledged. Meteorological and pollutant data were harmonised to a daily resolution, which may smooth extreme short-term variations. Although the Open Data Portal of the Madrid City Council and the Spanish Meteorological Agency (AEMET) apply official validation protocols consistent with the European Environment Agency (EEA) standards, low-cost sensors integrated into the municipal network can still introduce minor biases related to calibration drift or environmental noise. O3 and NO2 instruments rely on electrochemical or UV-absorption principles that may exhibit temperature-dependent cross-sensitivities [10]. These limitations do not affect the comparative validity of the analysis but should be considered when extrapolating the results to other networks or high-resolution modelling contexts. Future research could incorporate independent calibration datasets or multi-sensor fusion to quantify uncertainty more rigorously.
Technologically, the integration of AI and IoT within this workflow illustrates how real-time sensor networks and interpretable forecasting models can transform environmental monitoring into a dynamic and transparent process. By merging data from IoT-enabled infrastructures with open-source predictive analytics, the approach bridges computational modelling and environmental management in a reproducible manner. This convergence aligns with the global transition toward intelligent urban sensing, where artificial intelligence supports early warning, policy design, and educational engagement simultaneously.
From a pedagogical perspective, the reproducible design of the workflow transforms analytical transparency into a meaningful learning experience. Each computational stage, from data access and cleaning to model evaluation, can be replicated, modified, and interpreted by students and citizen scientists alike. This hands-on participation fosters data literacy, methodological integrity, and critical environmental reasoning. In higher-education settings, the workflow can be integrated into project-based modules where learners reproduce the analysis using R and Quarto, compare local stations, and present visual narratives through dynamic reports. Pilot workshops conducted within environmental-informatics courses at the Complutense University have shown that such activities strengthen statistical reasoning, collaborative coding, and environmental awareness. Even without formal assessment data, this pathway outlines a clear educational implementation that connects open data with active STEM learning.
Despite these strengths, Prophet cannot capture abrupt or non-recurrent events, such as lockdowns, transboundary intrusions, or traffic restrictions, that fall outside its predefined seasonal structure. Future research should explore hybrid schemes combining Prophet with deep-learning architectures (e.g., Prophet–LSTM or VMD-GAT-BiLSTM [22]) to improve responsiveness to sudden events while maintaining interpretability. The development of interactive Shiny dashboards could also enhance accessibility, allowing educators and practitioners to interact with live data in real time. These extensions would consolidate the framework’s dual role in advancing environmental forecasting and promoting scientific literacy within open, participatory contexts.
Beyond its methodological contribution, the framework has been conceived as a transferable educational resource for higher-education programmes focused on data analysis and environmental informatics. Its reproducible structure, based on R and Quarto, enables instructors to adapt the workflow for teaching statistical modelling, open-data management, and environmental interpretation using real urban datasets. The framework is designed for integration into postgraduate or lifelong-learning environments, where it can support project-based activities involving pollutant forecasting and meteorological analysis. This universality strengthens its value not only as a local case study but as a blueprint for reproducible, data-driven environmental education applicable to any city with open datasets.
5. Conclusions
This study presented a reproducible workflow that combines open environmental data, IoT-based sensing, and AI-driven forecasting within the Quarto–R ecosystem. Applied to Madrid’s air-quality records from 2020 to 2024, the approach demonstrated that interpretable models such as Prophet can effectively capture urban pollution dynamics while remaining transparent, traceable, and easily replicable.
From a scientific perspective, the workflow bridges the gap between advanced time-series modelling and the open-data principles of modern environmental research. It confirms that reliable forecasts can be obtained using freely accessible data and open-source tools, thus lowering the barriers to urban-scale environmental analytics. The integration of meteorological covariates and correlation analysis strengthened the understanding of NO2–O3 interactions and their meteorological drivers, highlighting the explanatory power of interpretable models over purely black-box approaches.
From an educational standpoint, the workflow transforms air-quality forecasting into a hands-on, transparent learning experience that connects programming, statistics, and environmental science. Its modular structure allows students and citizen scientists to reproduce every analytical step, fostering data literacy, methodological integrity, and critical environmental reasoning. This pedagogical orientation aligns with the broader movement toward open, reproducible, and project-based STEM education.
The framework’s reproducible design and use of openly available datasets ensure its adaptability beyond the Madrid case. Any city with open air-quality data can replicate the workflow to explore local dynamics, evaluate policies, or support educational initiatives. This universality reinforces its value not merely as a local analysis but as a blueprint for reproducible, data-driven environmental education, connecting open science, digital skills, and sustainability.
Future developments will focus on integrating hybrid Prophet–LSTM architectures to capture non-recurrent events and on deploying interactive Shiny dashboards for real-time exploration. Such extensions will consolidate the framework’s dual contribution to scientific transparency and environmental awareness, advancing the transition toward intelligent, participatory, and reproducible urban analytics.
Supplementary Materials
The following supporting information can be downloaded: all figures (TIFF format) and tables included in this manuscript are available in the corresponding author’s public GitHub repository OpenUrbanAirandMeteorological (https://github.com/jcaceres-academic/OpenUrbanAirandMeteorological), accessed on 1 November 2025. No additional supplementary figures or tables were produced beyond those presented in the article.
Author Contributions
Conceptualization, J.C.-T.; methodology, J.C.-T. and J.J.G.-H.; software, J.C.-T.; validation, J.C.-T., J.J.G.-H. and E.L.-M.; formal analysis, J.C.-T.; investigation, J.C.-T.; resources, E.L.-M. and M.B.M.C.; data curation, J.C.-T.; writing—original draft preparation, J.C.-T.; writing—review and editing, J.J.G.-H.; visualization, J.C.-T.; supervision, J.J.G.-H.; project administration, J.C.-T.; funding acquisition, E.L.-M. All authors have read and agreed to the published version of the manuscript.
Funding
This research received no external funding.
Institutional Review Board Statement
Not applicable. This study did not involve humans or animals.
Informed Consent Statement
Not applicable.
Data Availability Statement
All processed and harmonised datasets (air-quality and meteorological) used in this study are openly available in the public repository OpenUrbanAirandMeteorological (https://github.com/jcaceres-academic/OpenUrbanAirandMeteorological, accessed on 1 November 2025). The repository contains the reproducible scripts, harmonised data in Parquet format, and the complete bibliographic file applsci-15-12183.bib (Better BibTeX format) used for citation management and transparency. A mirrored bibliographic dataset is also archived in the author’s Zotero collection for reproducibility verification (https://www.zotero.org/jcaceres_academic/collections/X6RW9UGU, accessed on 1 November 2025). Raw air-quality records were retrieved from the Madrid Open Data Portal, and meteorological variables from the Agencia Estatal de Meteorología (AEMET).
Acknowledgments
The authors would like to express their gratitude to the Madrid Open Data Portal for providing open and transparent environmental information.
Conflicts of Interest
The authors declare no conflicts of interest.
Abbreviations
The following abbreviations are used in this manuscript:
| NO2 | Nitrogen dioxide |
| O3 | Ozone |
| STEM | Science, Technology, Engineering, and Mathematics |
| R | Statistical computing language |
| LSTM | Long Short-Term Memory |
| RMSE | Root Mean Square Error |
| MAE | Mean Absolute Error |
References
- Bell, M.L.; McDermott, A.; Zeger, S.L.; Samet, J.M.; Dominici, F. Ozone and short-term mortality in 95 US urban communities. JAMA 2004, 292, 2372–2378. [Google Scholar] [CrossRef]
- Peng, R.D. Reproducible research in computational science. Science 2011, 334, 1226–1227. [Google Scholar] [CrossRef]
- Sandve, G.K.; Nekrutenko, A.; Taylor, J.; Hovig, E. Ten simple rules for reproducible computational research. PLoS Comput. Biol. 2013, 9, e1003285. [Google Scholar] [CrossRef] [PubMed]
- Nosek, B.A.; Alter, G.; Banks, G.C.; Borsboom, D.; Bowman, S.D.; Breckler, S.J.; Buck, S.; Chambers, C.D.; Chin, G.; Christensen, G.; et al. Promoting an open research culture. Science 2015, 348, 1422–1425. [Google Scholar] [CrossRef] [PubMed]
- Munafò, M.R.; Nosek, B.A.; Bishop, D.V.M.; Button, K.S.; Chambers, C.D.; Percie du Sert, N.; Simonsohn, U.; Wagenmakers, E.J.; Ware, J.J.; Ioannidis, J.P.A. A manifesto for reproducible science. Nat. Hum. Behav. 2017, 1, 0021. [Google Scholar] [CrossRef] [PubMed]
- Rule, A.; Birmingham, A.; Zuniga, C.; Altintas, I.; Huang, S.-C.; Knight, R.; Moshiri, N.; Nguyen, M.H.; Rosenthal, S.B.; Pérez, F.; et al. Ten simple rules for writing and sharing computational analyses in Jupyter notebooks. PLoS Comput. Biol. 2019, 15, e1007007. [Google Scholar] [CrossRef]
- Carslaw, D.C.; Ropkins, K. Openair—An R package for air quality data analysis. Environ. Model. Softw. 2012, 27–28, 52–61. [Google Scholar] [CrossRef]
- Morillas, L.; Notario, A.; Gómez, C.; Gómez-Moreno, F.J.; Rodríguez, M.C. Impact of the implementation of Madrid’s Low Emission Zone on NO2 concentrations. Atmos. Environ. 2024, 320, 120326. [Google Scholar] [CrossRef]
- Castell, N.; Dauge, F.R.; Schneider, P.; Vogt, M.; Lerner, U.; Fishbain, B.; Broday, D.; Bartonova, A. Can commercial low-cost sensor platforms contribute to air quality monitoring and exposure estimates? Environ. Int. 2017, 99, 293–302. [Google Scholar] [CrossRef]
- Karagulian, F.; Barbiere, M.; Kotsev, A.; Spinelle, L.; Gerboles, M.; Lagler, F.; Redon, N.; Crunaire, S.; Borowiak, A. Review of the performance of low-cost sensors for air quality monitoring. Atmosphere 2019, 10, 506. [Google Scholar] [CrossRef]
- Sicard, P.; De Marco, A.; Agathokleous, E.; Feng, Z.; Xu, X.; Paoletti, E.; Rodriguez, J.J.D.; Calatayud, V. Amplified ozone pollution in cities during the COVID-19 lockdown. Sci. Total Environ. 2020, 735, 139542. [Google Scholar] [CrossRef] [PubMed]
- Taylor, S.J.; Letham, B. Forecasting at scale. Am. Stat. 2018, 72, 37–45. [Google Scholar] [CrossRef]
- Shen, J.; Wang, S.; Zhang, J.; Wang, Y. Prophet forecasting model: A machine learning approach to predict the concentration of air pollutants in Seoul, South Korea. PeerJ 2020, 8, e9961. [Google Scholar] [CrossRef] [PubMed]
- Middya, A.I.; Roy, S. Pollutant specific optimal deep learning and statistical model building for air quality forecasting. Environ. Pollut. 2022, 301, 118972. [Google Scholar] [CrossRef]
- Cáceres-Tello, J.; Galán-Hernández, J.J. Mathematical evaluation of classical and quantum predictive models applied to PM2.5 forecasting in urban environments. Mathematics 2023, 13, 1979. [Google Scholar] [CrossRef]
- Wickham, H.; Averick, M.; Bryan, J.; Chang, W.; McGowan, L.D.; François, R.; Grolemund, G.; Hayes, A.; Henry, L.; Hester, J.; et al. Welcome to the tidyverse. J. Open Source Softw. 2019, 4, 1686. [Google Scholar] [CrossRef]
- Stodden, V.; Seiler, J.; Ma, Z. An empirical analysis of journal policy effectiveness for computational reproducibility. Proc. Natl. Acad. Sci. USA 2018, 115, 2584–2589. [Google Scholar] [CrossRef]
- ISO 8601:2019; Date and Time—Representations for Information Interchange. ISO: Geneva, Switzerland, 2019.
- Wickham, H. ggplot2: Elegant Graphics for Data Analysis; Springer: New York, NY, USA, 2016. [Google Scholar] [CrossRef]
- Grange, S.K.; Carslaw, D.C.; Lewis, A.C.; Boleti, E.; Hueglin, C. Random forest meteorological normalisation models for Swiss PM10 trend analysis. Atmos. Chem. Phys. 2018, 18, 6223–6239. [Google Scholar] [CrossRef]
- Houdou, B.; Chen, M.; Ooka, R. Interpretable machine learning approaches for forecasting and predicting air pollution: A systematic review. Aerosol Air Qual. Res. 2024, 24, 230151. [Google Scholar] [CrossRef]
- Cáceres-Tello, J.; Galán-Hernández, J.J. Analysis and prediction of PM2.5 pollution in Madrid: The use of Prophet–Long Short-Term Memory hybrid models. Appl. Math. 2024, 4, 1428–1452. [Google Scholar] [CrossRef]
- Cáceres-Tello, J.; Galán-Hernández, J.J. Artificial intelligence applied to air quality in smart cities: A bibliometric analysis. In Communication and Applied Technologies; Springer: Singapore, 2024; pp. 271–283. [Google Scholar] [CrossRef]
- López-Meneses, E.; Cáceres-Tello, J.; Galán-Hernández, J.J.; López-Catalán, L. Quantum computing in data science and STEM education: Mapping academic trends and analysing practical tools. Computers 2025, 14, 235. [Google Scholar] [CrossRef]
- Hyndman, R.J.; Koehler, A.B. Another look at measures of forecast accuracy. Int. J. Forecast. 2006, 22, 679–688. [Google Scholar] [CrossRef]
- Elliott, K.C.; Resnik, D.B. Making open science work for science and society. Environ. Health Perspect. 2019, 127, 075002. [Google Scholar] [CrossRef] [PubMed]
- Raffaghelli, J.E.; Manca, S.; Stewart, B.; Prinsloo, P.; Sangrà, A. Supporting the Development of Critical Data Literacies in Higher Education: Building Blocks for Fair Data Cultures in Society. Int. J. Educ. Technol. High. Educ. 2020, 17, 58. [Google Scholar] [CrossRef]
- Arslan, S. A hybrid forecasting model using LSTM and Prophet for energy consumption with decomposition of time series data. PeerJ Comput. Sci. 2022, 8, e1001. [Google Scholar] [CrossRef]
- Khomsi, K.; Chelhaoui, Y.; Alilou, S.; Souri, R.; Najmi, H.; Souhaili, Z. Concurrent heat waves and extreme ozone (O3) episodes: Combined atmospheric patterns and impact on human health. Int. J. Environ. Res. Public Health 2022, 19, 2770. [Google Scholar] [CrossRef]
- Ballard, H.L.; Lindell, A.J.; Jadallah, C.C. Environmental education outcomes of community and citizen science: A systematic review of empirical research. Environ. Educ. Res. 2024, 30, 1007–1040. [Google Scholar] [CrossRef]
- Ward, F.; Lowther-Payne, H.J.; Halliday, E.C.; Dooley, K.; Joseph, N.; Livesey, R.; Moran, P.; Kirby, S.; Cloke, J. Engaging communities in addressing air quality: A scoping review. Environ. Health 2022, 21, 89. [Google Scholar] [CrossRef]
- Kariotis, T.; Borda, A.; Winkel, K.; Gray, K. Citizen Science for One Digital Health: A rapid qualitative review of studies in air quality with Reflections on a Conceptual Model. Citiz. Sci. Theory Pract. 2022, 7, 39. [Google Scholar] [CrossRef]
- Sicard, P.; Agathokleous, E.; De Marco, A.; Paoletti, E.; Calatayud, V. Urban population exposure to air pollution in Europe over the last decades. Environ. Sci. Eur. 2021, 33, 28. [Google Scholar] [CrossRef]
- Querol, X.; Massagué, J.; Alastuey, A.; Viana, M.; Moreno, T.; Gangoiti, G. Lessons from the COVID-19 air pollution decrease in Spain: How to improve urban air quality? Sci. Total Environ. 2021, 779, 146380. [Google Scholar] [CrossRef]
- Qiao, C.; Chen, Y.; Guo, Q.; Yun, Y. Understanding science data literacy: A conceptual framework and assessment tool for college students majoring in STEM. Int. J. STEM Educ. 2024, 11, 25. [Google Scholar] [CrossRef]
- Grange, S.K.; Lee, J.D.; Drysdale, W.S.; Lewis, A.C.; Hueglin, C.; Emmenegger, L.; Carslaw, D.C. COVID-19 lockdowns highlight a risk of increasing ozone pollution in European urban areas. Atmos. Chem. Phys. 2021, 21, 4169–4185. [Google Scholar] [CrossRef]
- Gorrochategui, E.; Hernandez, I.; Pérez-Gabucio, E.; Lacorte, S.; Tauler, R. Temporal air quality (NO2, O3, and PM10) changes in urban and rural stations in Catalonia during COVID-19 lockdown: An association with human mobility and satellite data. Environ. Sci. Pollut. Res. 2022, 29, 18905–18922. [Google Scholar] [CrossRef] [PubMed]
- Massagué, J.; Torre-Pascual, E.; Carnerero, C.; Escudero, M.; Alastuey, A.; Pandolfi, M.; Querol, X.; Gangoiti, G. Extreme ozone episodes in a major Mediterranean urban area. Atmos. Chem. Phys. 2024, 24, 4827–4850. [Google Scholar] [CrossRef]
- Badia, A.; Vidal, V.; Ventura, S.; Curcoll, R.; Segura, R.; Villalba, G. Modelling the impacts of emission changes on O3 sensitivity, atmospheric oxidation capacity, and pollution transport over the Catalonia region. Atmos. Chem. Phys. 2023, 23, 10751–10770. [Google Scholar] [CrossRef]
- Domínguez-López, D.; Adame, J.A.; Hernández-Ceballos, M.A.; Vaca, F.; De la Morena, B.A.; Bolívar, J.P. Spatial and temporal variation of surface ozone, NO and NO2 at urban, suburban, rural and industrial sites in the southwest of the Iberian Peninsula. Environ. Monit. Assess. 2014, 186, 5337–5351. [Google Scholar] [CrossRef]
- Hasnain, A.; Sheng, Y.; Hashmi, M.Z.; Bhatti, U.A.; Hussain, A.; Hameed, M.; Marjan, S.; Bazai, S.U.; Hossain, M.A.; Sahabuddin, M.; et al. Time series analysis and forecasting of air pollutants based on Prophet forecasting model in Jiangsu Province, China. Front. Environ. Sci. 2022, 10, 945628. [Google Scholar] [CrossRef]
Disclaimer/Publisher’s Note: The statements, opinions and data contained in all publications are solely those of the individual author(s) and contributor(s) and not of MDPI and/or the editor(s). MDPI and/or the editor(s) disclaim responsibility for any injury to people or property resulting from any ideas, methods, instructions or products referred to in the content. |
© 2025 by the authors. Licensee MDPI, Basel, Switzerland. This article is an open access article distributed under the terms and conditions of the Creative Commons Attribution (CC BY) license (https://creativecommons.org/licenses/by/4.0/).