Article

A Numerical Study on the Influence of CO2 Injection Location and Flow Rate on the Oxidation Zone in Goaf

1
College of Geology and Mining Engineering, Xinjiang University, Urumqi 830046, China
2
Xinjiang Collaborative Innovation Center for Green Mining and Ecological Restoration of Mineral Resources, Urumqi 830046, China
*
Author to whom correspondence should be addressed.
Appl. Sci. 2025, 15(22), 12181; https://doi.org/10.3390/app152212181
Submission received: 14 October 2025 / Revised: 23 October 2025 / Accepted: 27 October 2025 / Published: 17 November 2025

Abstract

The spontaneous combustion of coal represents a common and serious safety challenge in underground mining. A frequent cause of mine fires is the ignition of residual coal accumulated in goafs. Based on the governing equations of continuity, momentum, and energy conservation, combined with the theory of flow through porous media, a three-dimensional numerical model was developed to simulate CO2 injection for fire prevention in coal goafs. Using COMSOL Multiphysics software, the effects of different CO2 injection parameters (location and flow rate) on oxygen distribution and the range of the oxidation zone within the goaf were investigated. The results indicate that with an injection point 15 m from the working face and a flow rate of 4.41 m3/min, the width of the oxidation zone was most significantly reduced, effectively suppressing the occurrence of coal spontaneous combustion. The location of the injection point was found to have a greater impact on the inerting effect than the injection flow rate. This study provides a theoretical basis and parameter optimization guidelines for CO2 injection in goaf areas for fire prevention and control.

1. Introduction

Coal is the cornerstone of China’s energy system. However, its extraction process is persistently accompanied by the significant safety hazard of spontaneous combustion. Furthermore, coal spontaneous combustion represents a global hazard that affects underground mining operations worldwide, posing a persistent and severe challenge in major coal-producing regions and countries such as Germany, the United States, India, and Australia. In Germany’s Ruhr region, approximately 10 coal fires annually are triggered by spontaneous combustion. In India, such fires account for 75% of coal field fires, with the Jharia coalfield fire being one of the most severe cases [1,2,3]. In coal mine goafs, residual coal is transformed into a porous medium due to roof collapse. Under oxygen supply from air leakage, this coal undergoes slow oxidation, and the resulting heat accumulation can readily trigger a spontaneous combustion fire. Statistics indicate that spontaneous combustion in goafs is the leading cause of mine fires. Such incidents not only cause substantial resource loss and equipment damage but also pose a risk of triggering secondary disasters, such as gas or coal dust explosions, thereby severely threatening the lives of underground workers and the overall safety of mining operations [4].
The key to preventing and controlling coal spontaneous combustion lies in disrupting one or more elements of the fire triangle: the fuel (coal), oxygen, and the initial heat source. A widely adopted active control technology involves injecting inert gases into goafs. Among these, CO2 injection is particularly effective due to its multiple mechanisms, including asphyxiation, cooling, and physical–chemical inhibition of coal. By isolating oxygen and reducing the temperature of the heat source, CO2 injection demonstrates significant prevention efficacy [5,6]. Furthermore, injecting and sequestering CO2 in goafs achieves synergistic benefits by integrating coal fire prevention with CO2 geological sequestration, which aligns with the strategic direction of green mining [7]. However, the field application efficacy is highly dependent on the optimal selection of gas injection parameters. Improper parameter settings may not only fail to effectively inert the spontaneous combustion zone but could also disturb the flow field, driving oxygen into deeper areas. This, in turn, can expand the oxidation zone and potentially exacerbate the spontaneous combustion risk. To more accurately describe the flow behavior of CO2 in goaf areas, this study draws upon the modified dual-dispersion diffusion model proposed by Zhou et al. This model integrates multiple diffusion mechanisms, providing a superior characterization of CO2 diffusion processes in residual coal [8]. Zhang et al. constructed a dynamic porosity model by combining the Discrete Element Method (DEM) with Computational Fluid Dynamics (CFD), which accurately simulated the flow field in the goaf and identified areas prone to coal spontaneous combustion. In a separate study [9], Perera et al. conducted a numerical study of the CO2 mass transfer behavior in coal seams, focusing on the roles of injection pressure and leakage pathways in governing the seepage process [10]. Li et al. integrated sealed oxygen-consumption experiments with CFD simulations to investigate the optimal injection location and flow rate for CO2 in the Jiudaoling mine goaf. Their work further demonstrated the effectiveness of CO2 injection technology in suppressing spontaneous combustion in goaf areas [11]. However, the optimal injection parameters, such as location and flow rate, are not fixed but are influenced by factors such as the specific mine’s geological conditions and coal properties. For instance, based on a study of the oxidation characteristics (extinction oxygen concentration) of coal samples, Huang et al. demonstrated that for a specific coking coal mine, the optimal injection port location was 43 m from the working face, with a corresponding optimal injection flow rate of 156.9 m3/h [12]. It should be noted that during the actual gas injection process, a portion of the injected CO2 is adsorbed by the residual coal in the goaf, resulting in a loss of gas volume, which may consequently affect the final inerting effect. The study by Li demonstrated that the adsorption capacity of coal for CO2 varies significantly with temperature, and proposed an adsorption-compensated gas injection model along with the concept of the maximum dissipation ratio. Their findings concluded that, under the simulated conditions, the optimal gas injection volume considering adsorption compensation was approximately 33% higher than the calculated value without accounting for adsorption [13].
The goaf is a typical porous medium environment characterized by heterogeneous distributions of porosity and permeability, along with complex structures such as “O-shaped rings.” These factors make the airflow and gas transport behaviors difficult to observe directly. Field testing is often costly and high-risk, especially in fire prevention and control engineering, where improper operations may trigger safety incidents. In contrast, simulation methods can recreate the gas flow and mass transfer processes within the goaf under risk-free and controllable conditions, offering strong visualization capabilities for better understanding. Currently, research on CO2 injection technology for fire prevention predominantly focuses on macroscopic effectiveness analyses. However, there remains a relative lack of detailed, quantitative studies investigating the influence mechanisms of different injection parameters (location and flow rate). Based on this gap, this paper aims to use numerical simulation to conduct an in-depth investigation into the impact of key CO2 injection parameters on oxygen distribution and the extent of the oxidation zone within the goaf. Based on the laws of mass, momentum, and energy conservation, combined with the theory of flow through porous media, this study establishes a three-dimensional numerical model for CO2 injection into the goaf using COMSOL Multiphysics 6.3 software. The model is used to systematically simulate the inerting process under various injection locations and flow rates to determine the optimal injection parameters. The findings are intended to provide a theoretical basis and decision-making support for implementing precise and efficient fire prevention and extinguishing operations in the field [14].

2. Methods

Fluid flow in the goaf adheres to three fundamental physical principles: continuity, momentum, and energy. Although these conservation equations describe the changes in mass, momentum, and energy for fluid elements, their conventional formulations are somewhat generic, as shown in Figure 1. Consequently, effectively describing the specific flow patterns requires a tight coupling between these governing equations and the actual fluid flow conditions within the goaf [15,16].

2.1. Continuity Equation

The change in fluid mass within a control volume is determined by applying the continuity equation to the net mass flow across its boundaries. In a three-dimensional numerical framework, the conservation of mass for a control volume, accounting for flow in all three coordinate directions, is governed by the following equation:
ρ t + ρ u = q
where ρ is the fluid density, q the term pertaining to the control volume, t the time, and u the gas flow velocities.
Due to the considerable spatial variation in porosity within the goaf, which governs the gas flow behavior, the Darcy velocity and the seepage velocity are introduced and related to more accurately describe fluid flow through the porous medium of the goaf. This relationship can be represented by the following equation.
u d = u s φ
where u d is the Darcy velocity, u s the seepage velocity, and φ the porosity of the porous medium.
Equation (1) can be rewritten in the form of the mass continuity equation for a porous medium environment
φ ρ t + ρ u s = q

2.2. Momentum Equation

The momentum equation, a fundamental principle describing fluid motion, states that the external forces acting on a fluid element are balanced by its rate of momentum change. This law is concretely expressed by the N-S equations, which can model fluid motion under turbulent conditions. However, in a goaf, where porosity varies spatially, the airflow entering from the working face exhibits three distinct states: turbulent, transitional, and laminar flow. Consequently, momentum conservation must be represented by different equations that capture the characteristics of each flow regime: the N-S equations for turbulence, the Darcy–Forchheimer equation for transitional flow, and Darcy’s law for laminar flow [17].
The different flow regimes are determined by the Reynolds number [18], which is calculated as
Re = ρ u k β μ f
where Re is the Reynolds number, k the permeability, β the Forchheimer number, and μ f the viscosity.
The fluid momentum in turbulent flow is described by the N-S equation:
ρ u t + u u = p + μ u + u T 2 3 μ u I + F
where u is the velocity field, I the identity tensor, F the body force, T the temperature, p the pressure, and μ the Melia parameter.
As the fluid velocity decreases, the Reynolds number is reduced, and the flow state transitions to the transitional flow regime. To account for this regime, Forchheimer introduced an inertial term into the Darcy equation [19]. The resulting Darcy–Forchheimer equation is given as
v f = k μ p β ρ v f + 2 ρ g D
where v f is the Forchheimer velocity, D the unit vector in the direction of gravity, and g the gravitational acceleration.
When the fluid velocity decreases further, the flow enters the laminar regime. Under these conditions, Darcy’s law is employed to describe the fluid momentum.
u = k μ p + ρ g D
While the three aforementioned equations provide a comprehensive description of momentum conservation across different flow regimes, the fluid environment within a goaf constitutes a complex porous medium. The Brinkman equation integrates these equations into a unified form, capable of accounting for the relevant factors across various flow states, and is expressed as [20,21,22]:
ρ φ u t + u u φ = p + 1 φ μ u + u T 2 3 μ u k 1 μ + β | u | + q φ 2 u + F

2.3. Energy Equation

The energy conservation equation is employed to characterize temperature variations within spontaneous combustion zones of a goaf. In such a porous medium environment, heat generated by coal oxidation induces thermal transport phenomena during fluid movement through the porous medium [23].
The heat release reaction from coal oxidation can be represented by the Arrhenius equation:
W O 2 = A c O 2 n e E R g T s
where A is the pre-exponential factor, E the apparent activation nenergy, R g the gas constant, T S the temperature of coal grains, C O 2 the oxygen concentration and n the apparent order of reaction.
The consideration of temperature differences between the gas and solid phases necessitates the use of distinct thermal energy equations depending on the magnitude of this difference. Specifically, this leads to the application of either the Local Thermal Equilibrium model or the Local Thermal Non-Equilibrium model.
The Local Thermal Equilibrium model postulates that no temperature difference exists between the solid and fluid phases in a porous medium, which can be described by the following equation.
a T = E T
a = k e f   f ρ c p e f   f
E i j = F 1 δ i j + F 2 V i V j
E 11 = η 1 U + a
E 22 = E 33 = η 2 U + a
E i j = 0 , i j
where a is the thermal diffusivity, E the dispersion tensor, E 11 the longitudinal dispersion coefficient, E 22 and E 33 the transverse dispersion coefficient, k e f   f the effective thermal conductivity, and ρ c p e f   f the effective specific heat capacity.
In contrast, the Local Thermal Non-Equilibrium model governs scenarios where a significant temperature difference exists between the solid and fluid phases of a porous medium. This approach necessitates separate energy equations to account for interphase heat exchange and is formulated as follows:
h = h s   f a s   f
a s   f = 6 1 φ 2 r
1 h s   f = 2 r N u f   s k p + 2 r β T k s
where h s   f is the convective heat transfer coefficient, a s   f the convective heat transfer area, r the solid particle radius, k s and k p the thermal conductivity of the solid and the fluid, β T the thermal expansion coefficient, and N u f   s the fluid–solid Nusselt number.

2.4. Seepage Parameters for the Goaf Model

After the extraction of the working face, the overlying strata in the goaf undergo the evolution of the “three vertical zones” (caved zone, fractured zone, and bending subsidence zone) and the “three horizontal areas” (coal wall support area, bed separation fracture area, and recompacted area). The porosity of the goaf is significantly influenced by the compaction process of the overlying collapsed strata, exhibiting a trend of being higher in the central and near-face regions and decreasing with increasing goaf length [24]. The coal pillars along both sides of the roadway form supporting points, leading to the compaction of the central strata under their own weight, while the periphery, supported by coal pillars, forms cantilever beam structures that preserve bed separation fractures and vertical broken fractures. These fractures eventually connect at the goaf boundary, forming an annular fracture zone known as the “O”-circle.
The caved coal and rock within the “O”-circle zone exhibit relatively large pores, which serve as the primary flow paths for air. The porosity of the goaf can be represented by the rock bulk factor as considering the bulk factor.
φ = 1 1 λ
Among these zones, the “caved zone” of the goaf exhibits relatively high porosity, which contributes to air leakage from the working face into the goaf and can subsequently trigger coal spontaneous combustion. Conversely, the reduced porosity in the “fractured zone” attenuates the influence of airflow and related transport processes. The extent of the fractured zone is closely related to factors such as the rock bulk factor and the mining height of the coal seam [25]. The following expression uses the rock bulk factor to characterize the porosity distribution in the goaf:
λ = λ min + λ max λ min e a 1 d 1 1 e c 1 a 0 d 0
where λ min and λ max are the minimum and maximum bulk factors, a 0 and a 1 the attenuation rates from the working face and solid boundaries, d 0 and d 1 the distances from the working face and solid boundaries, and c 1 the distribution shape adjustment coefficient.
Permeability refers to the ability of a porous medium to allow fluids to pass through it. Its magnitude is influenced by factors such as porosity and pressure difference. Higher permeability facilitates faster fluid flow through the porous medium, as expressed by the following equation:
u = k p μ f L
where p / L is the pressure gradient and μ f the dynamic viscosity.
Regarding the study of permeability, Carman, building upon and modifying Kozeny’s permeability model and integrating it with Darcy’s law, proposed the Kozeny–Carman (K-Z) equation, which has since gained widespread application.
k = Φ s 2 D p 2 φ 3 180 1 φ 2
where D p is the packed particle diameter and Φ s the sphericity of the packed particles.

3. Model Verifications

3.1. Simulation Case

The ZF coal mine is located in Xinjiang in China. The primary minable coal seams are #1, #2, and #3, which are susceptible to spontaneous combustion with an ignition period of approximately 3 months. The coal seams are buried at a depth of about 600 m, and the coal type is predominantly lignite. The #3 E12604 working face employs a conventional U-type ventilation system with an airflow rate of 800 m3/min. The panel has a strike length of 200 m and a dip length of 260 m. The mine utilizes the fully mechanized top coal caving method for full-seam extraction, with an average mining height of approximately 15 m.
Simulations were conducted using the transient solver in COMSOL Multiphysics, where the governing equations were discretized and solved using the finite element method. The total calculation time was 3 d, with a time step of 0.1 d.

3.2. Physical Model

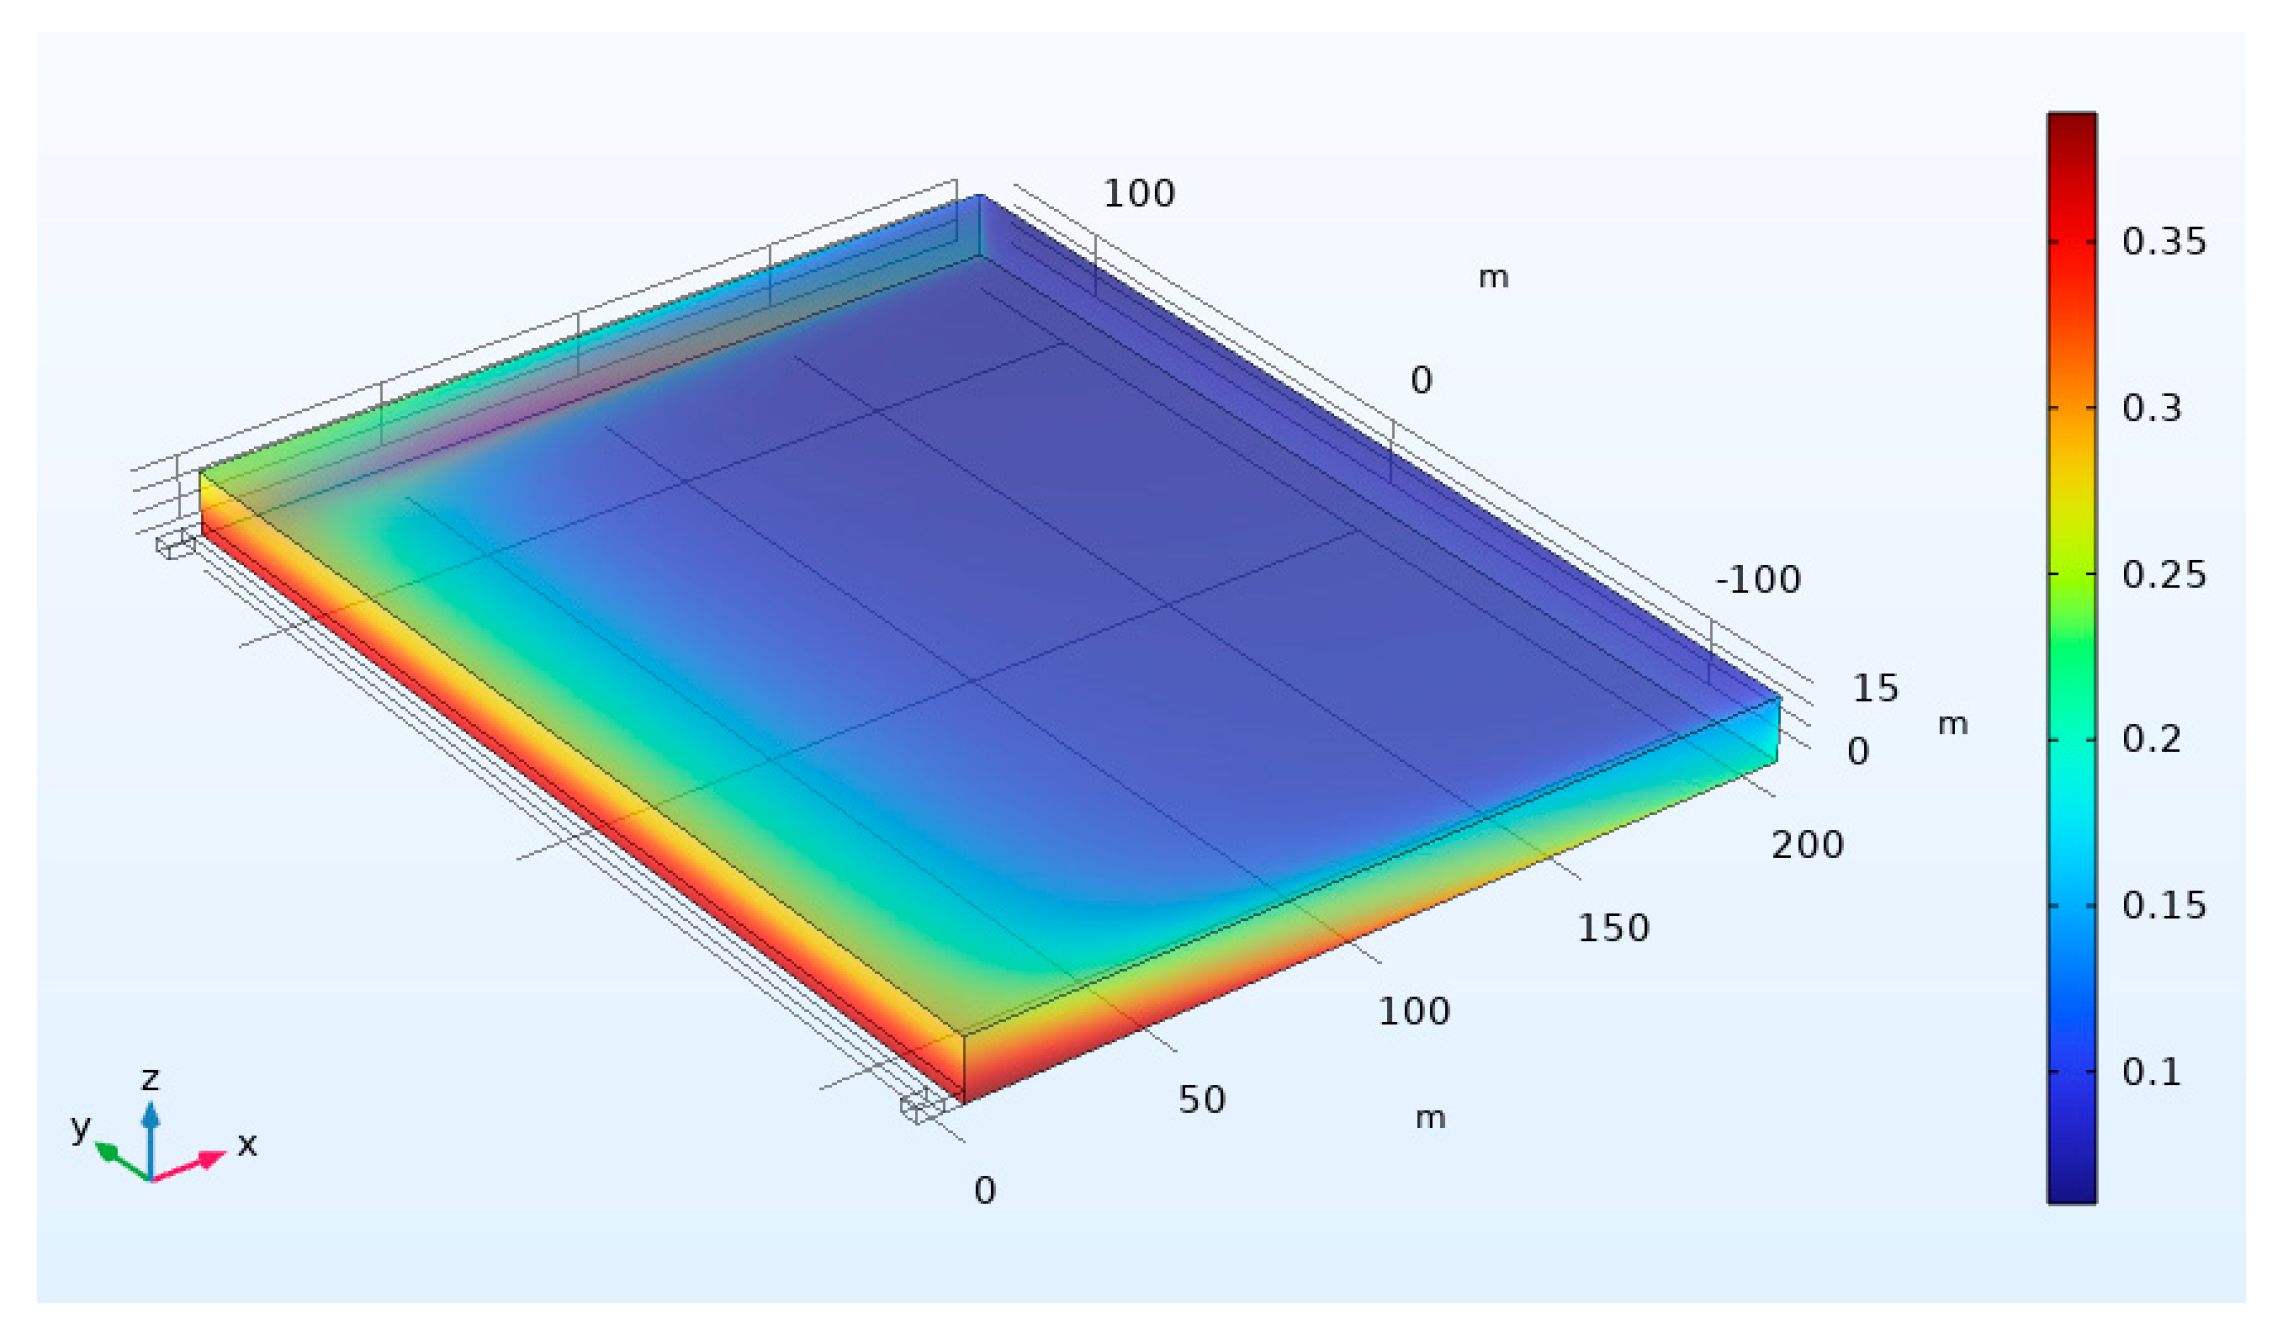
A three-dimensional numerical model was established, taking the goaf of the spontaneous combustion-prone coal seam at the working face of ZF Coal Mine as the research object. The model was meshed using the “user-controlled mesh” option, with the maximum element size set to 3 m, the minimum element size set to 0.06 m, and the maximum element growth rate set to 1.3. The mesh was generated using the sweep tool with the method set to “generate hexahedral elements,” resulting in a total of 56,321 elements with an average element quality of 0.8343. Meanwhile, the initial oxygen concentration within the goaf was set to 8%, which is the lower limit of oxygen concentration for coal spontaneous combustion, to facilitate the investigation of the effectiveness of the CO2 injection schemes. The oxygen concentration of the air entering from the ventilation roadway was set to 20% to simulate the actual ventilation conditions. The CO2 injection port is located on the intake side of the working face and extends into the depth of the goaf, as shown in Figure 2. Using the built-in plotting functions in COMSOL Multiphysics, a porosity distribution model of the goaf was developed based on the goaf seepage parameter formula, as illustrated in Figure 3.
Based on the actual conditions, the basic parameters of the physical model were configured. The key parameters of the model are listed in the Table 1. It should be noted that the initial temperature of the goaf was set to 293.tabparameters on oxygen distribution without the complicating factor of elevated initial temperatures. Future studies will incorporate temperature-dependent reactions and heat transfer to further refine the model. Additionally, the initial CO2 concentration in the goaf was set to 0 mol/m3 to establish a clear baseline for evaluating the inerting effect of injected CO2. Although trace amounts of CO2 may naturally exist in the goaf due to coal oxidation or strata emissions, this simplification is justified for the purpose of quantitatively assessing the impact of external CO2 injection.

3.3. Numerical Simulation Results

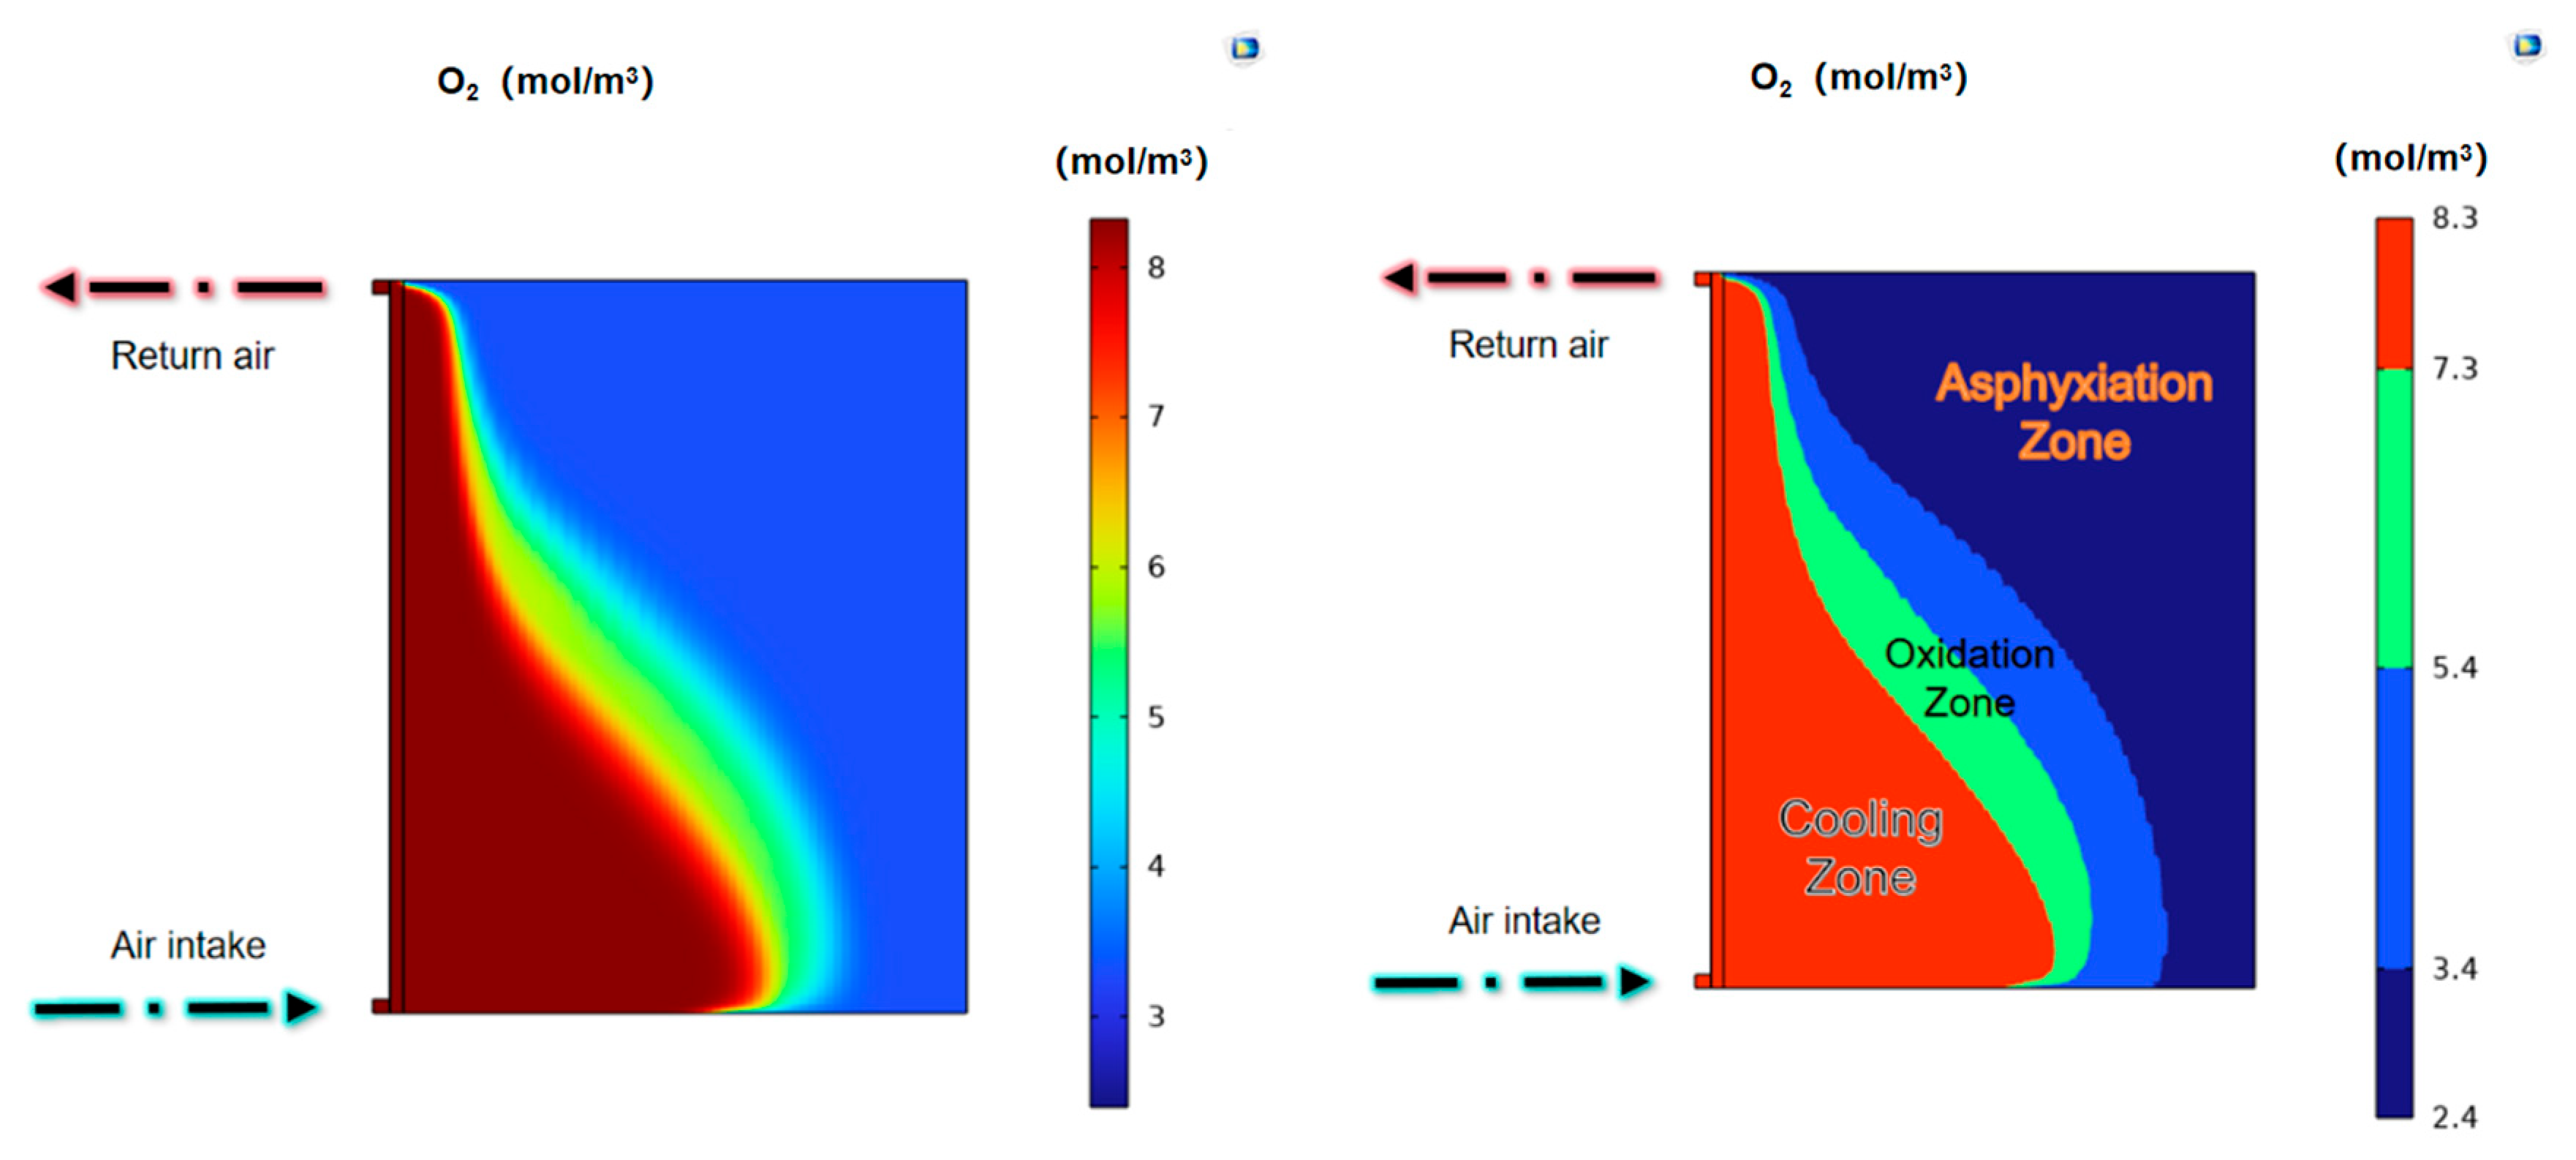
The built-in plotting tools in COMSOL Multiphysics were utilized to post-process the numerical simulation results. By defining a cross-sectional plane parallel to and 1.5 m above the coal seam floor, the oxygen concentration contour field on this plane was generated, as illustrated in the figure. Analysis of the numerical data reveals the oxygen concentration at various distances from the working face. The oxygen distribution is more extensive in areas adjacent to the intake airway, whereas it becomes more confined near the return airway. This pattern occurs because as air enters the goaf from the intake airway and flows toward the return airway, the oxygen concentration diminishes due to the resistance offered by the porous medium of the residual coal, leading to a narrower distribution range near the outlet.
The zone extending from the working face deep into the goaf, up to the first oxygen concentration contour line, is identified as the Cooling Zone, where the oxygen concentration remains above 17.9%. Within this region, the high airflow velocity effectively carries away most of the heat generated by the oxidation of residual coal, thereby inhibiting temperature accumulation. Between the first and the second oxygen concentration contour lines lies the Oxidation Zone. Here, the progressive collapse and compaction of the overlying strata lead to a significant reduction in porosity and a consequent increase in flow resistance. This results in diminished airflow velocity and flux. Coupled with continuous oxygen consumption by coal oxidation, the oxygen concentration in this zone ranges between 8.3% and 17.9%. The combination of low airflow and poor heat dissipation creates conditions conducive to spontaneous combustion of residual coal. The distal boundary of this zone can reach up to 140 m from the working face.
Beyond the second oxygen contour line, further into the goaf depths, is the Asphyxiation Zone. Here, oxygen concentration progressively decreases to below 8.3%, a level insufficient to sustain the spontaneous combustion process, thus effectively inerting the residual coal.

3.4. Model Validation and Comparative Analysis

To enhance the credibility of the numerical model, the simulation results under the non-injection condition were compared with the findings from a similar study conducted by Li et al. in the Jiudaoling mine goaf [11]. Although direct field measurements for the ZF coal mine goaf are not available, this comparative approach provides an indirect validation of the model’s reliability.
In the uninjected base case simulation, the distal boundary of the oxidation zone (defined by the 8.3% oxygen concentration contour) extended approximately 140 m from the working face, as shown in Figure 4. This finding is consistent with the range of oxidation zone extents reported by Li et al. [11] for their base scenario, which also identified high-risk zones within 100–150 m from the working face under similar U-type ventilation conditions. Furthermore, the simulated oxygen concentration distribution pattern, characterized by a wider spread near the intake airway and a narrower range near the return airway, aligns well with the flow field and oxygen transport characteristics described in their work [11] and other CFD studies of goaf environments [9].
The consistency between the general patterns and quantitative ranges of the oxidation zone obtained in this study and those reported in independent, peer-reviewed literature lends credence to the predictive capability of the established numerical model. It confirms that the model can reasonably capture the key physical processes governing gas transport in a coal mine goaf.

4. Analysis of the Impact of CO2 Injection Parameters on Spontaneous Combustion in the Goaf

To investigate the effects of different CO2 injection parameters on coal spontaneous combustion propensity, multiple simulation scenarios were designed. Considering both on-site construction constraints and model meshing limitations, the specific injection parameters are listed in Table 2. The selection of the two specific CO2 injection flow rates (2.94 and 4.41 m3/min) in this numerical study was based on a comprehensive consideration of engineering practicality and research objectives. These values represent the typical range used in field applications, ensuring the relevance and practical applicability of the research findings. The chosen flow rates, which differ by a factor of 1.5, provide a clear contrast to effectively observe the sensitivity of the oxidation zone width to flow rate variations at each location, thereby achieving a balance between computational feasibility and scientific rigor. Simulation results of oxygen transport in the goaf without CO2 injection indicated that the distal boundary of the oxidation zone can extend up to 140 m from the working face, as shown in Figure 4. The variation in the oxidation zone extent across all simulation cases was analyzed to determine the optimal injection strategy.

4.1. Injection Location

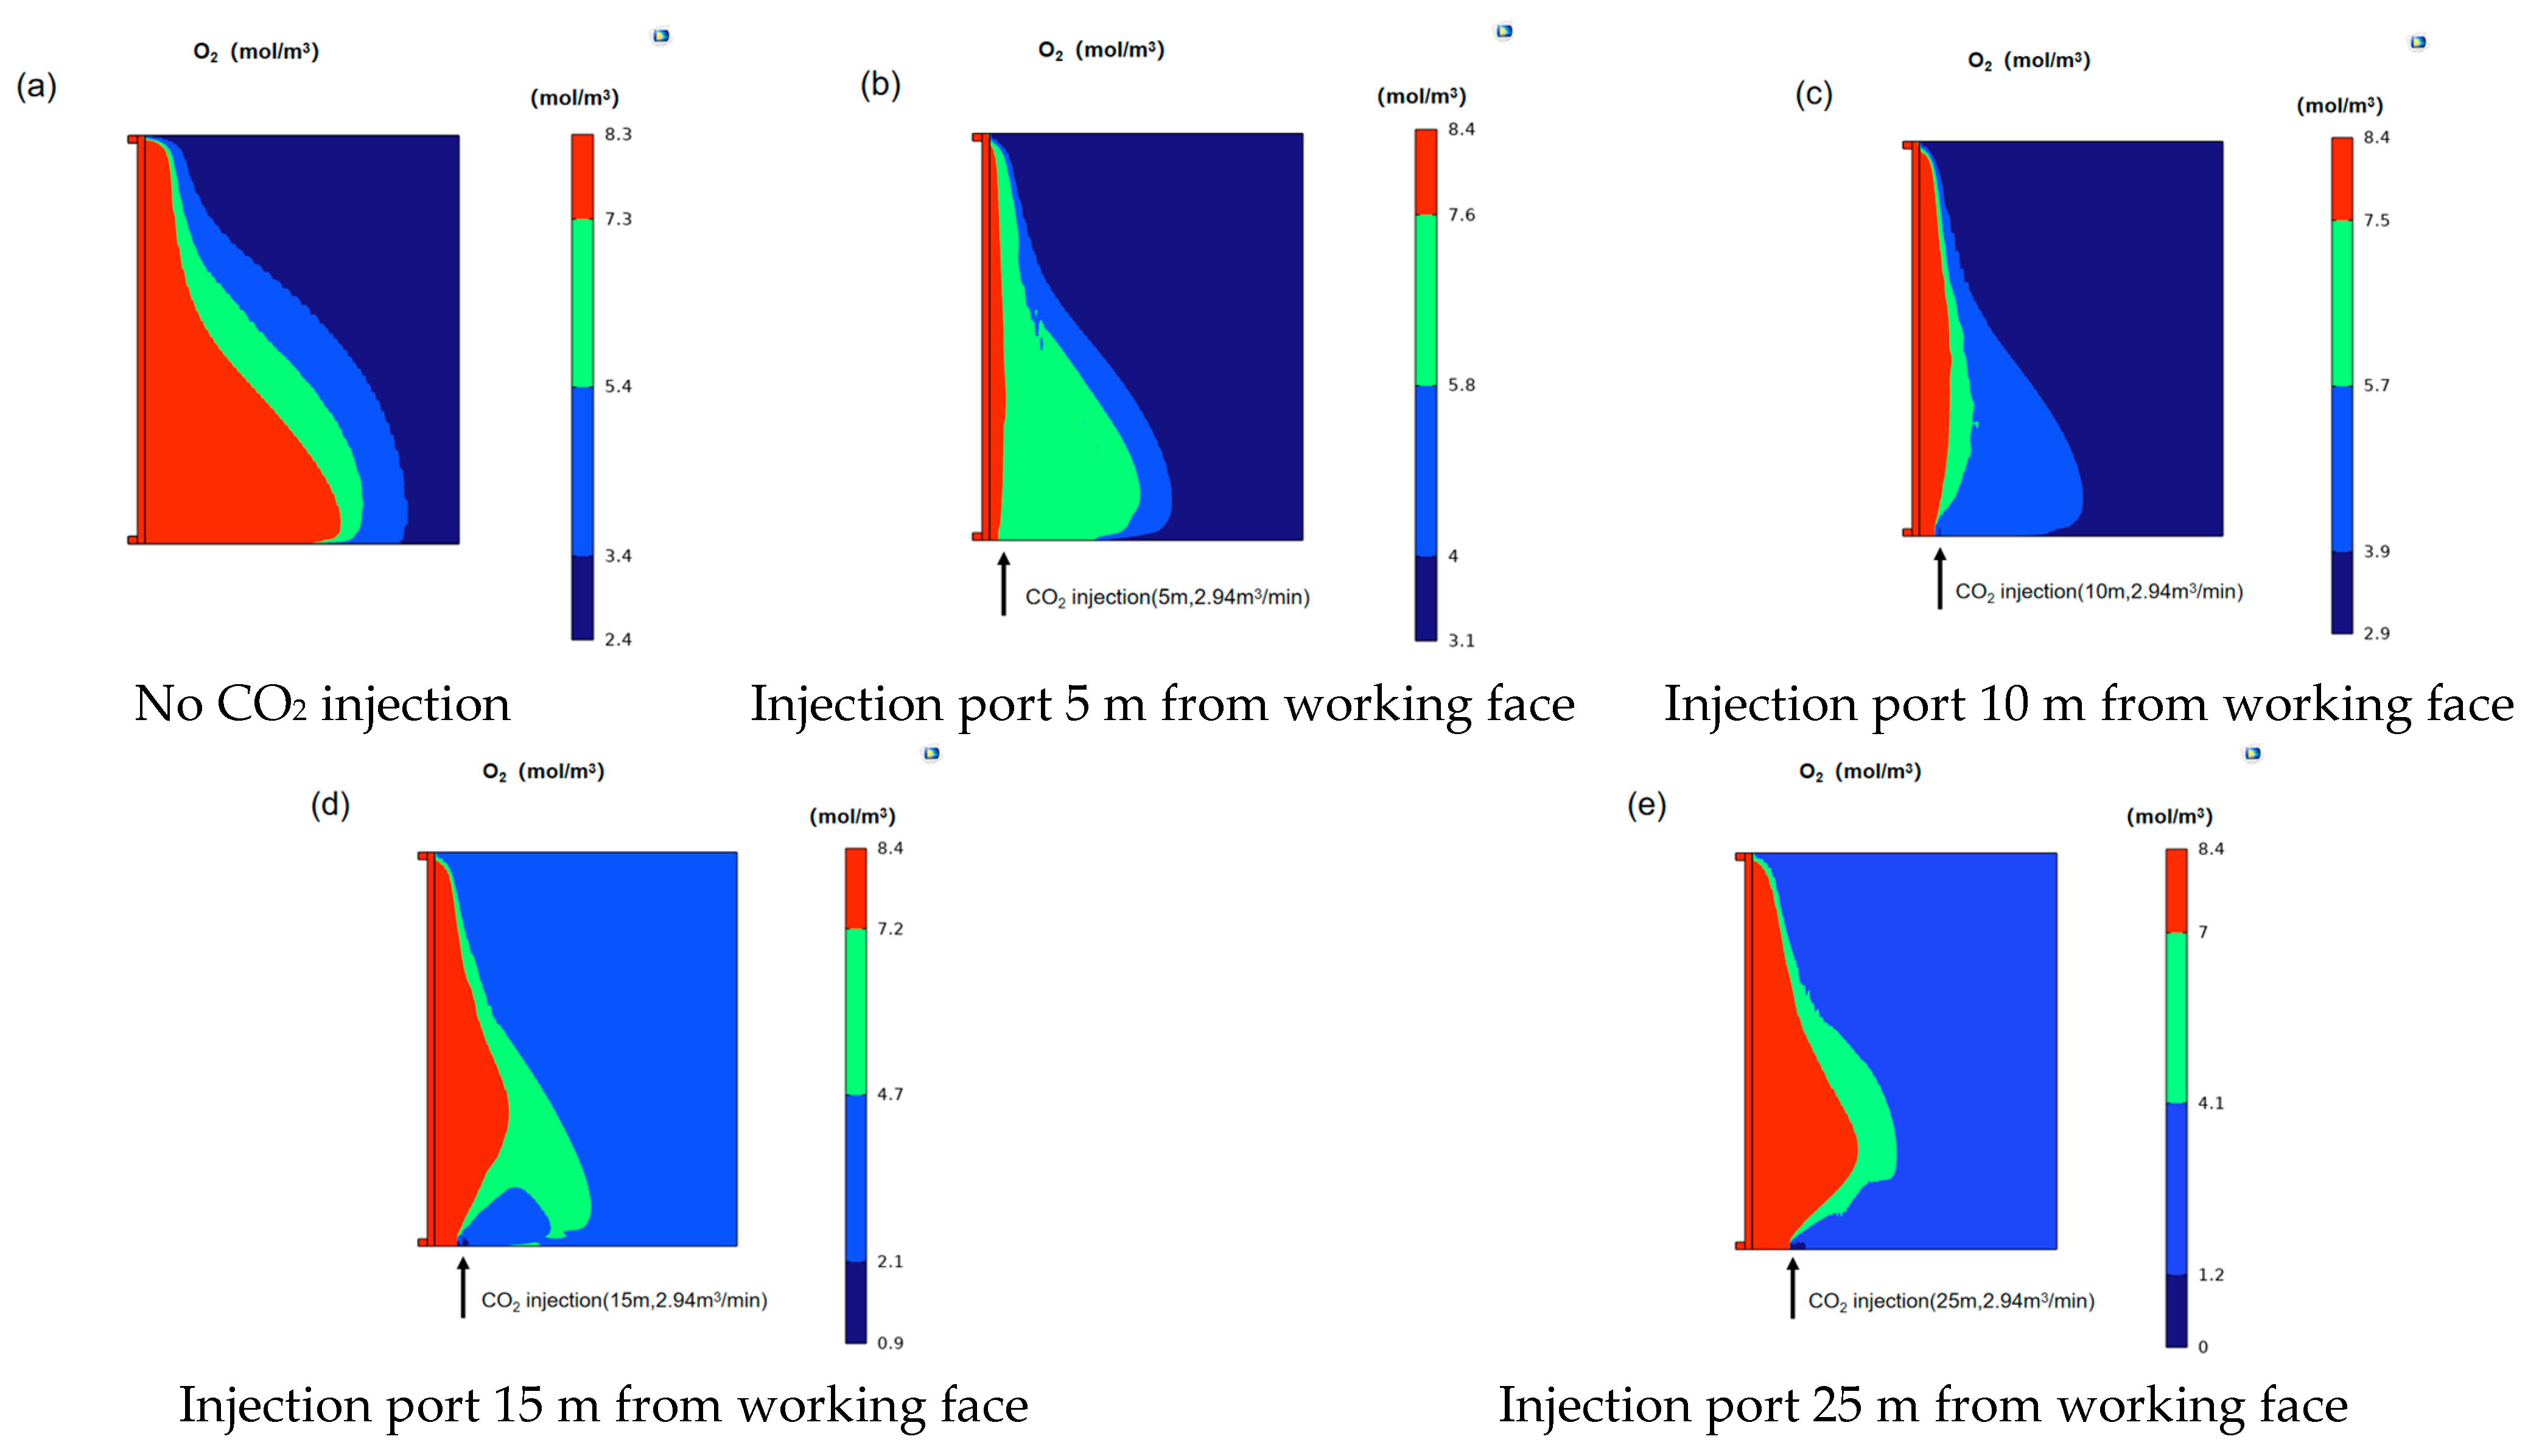
To determine rational CO2 injection port locations, the distributions of oxygen concentration in the goaf were simulated for injection points at 5 m, 10 m, 15 m, and 25 m from the working face using COMSOL Multiphysics. For a clear depiction of the gas concentration distribution, a cross-section at 0.8 m above the goaf floor was selected as the subject of study, with a CO2 injection flow rate set at 2.94 m3/min. Variations in the spontaneous combustion “three zones” under different injection locations were compared to identify the optimal placement.
As shown in Figure 5, Simulated results after CO2 injection reveal a significant reduction in the diffusion range of oxygen originally flowing from the intake airway into the goaf. This occurs because the injected CO2 acts as a barrier, inhibiting the inward flow of oxygen. Following injection, the majority of the CO2 is transported by the airflow and continuously disperses into the middle and deep sections of the goaf. Concurrently, a reduction in the oxygen diffusion range is also observed at the bottom of the goaf.
When the CO2 injection port was positioned 5 m from the working face, a noticeable reduction in the cooling zone was observed compared to the base case without injection. However, the area within the oxidation zone characterized by oxygen concentrations between 14.1% and 18.5% expanded. This occurred because the high airflow velocity near the injection port displaced the oxygen in the cooling zone, causing it to diffuse more widely. Although the peak oxygen concentration was lowered, the overall effect was an expansion of the oxidation zone, which is detrimental to preventing spontaneous combustion. With the injection port at 10 m, the oxidation zone showed a decreasing trend compared to the 5 m case. The area with 14.1–18.5% oxygen concentration was significantly reduced. This improvement is attributed to lower porosity and airflow velocity at this location, allowing CO2 to displace oxygen more effectively without causing widespread dispersion. Most of the oxidation zone in this scenario was occupied by gases with 9.5–13.9% oxygen, and its overall extent was slightly reduced. At the 15 m injection location, the cooling zone increased while the oxidation zone was significantly reduced. The further decrease in porosity enhanced the CO2 blocking effect, effectively reducing oxygen concentration in this region. Most oxygen with concentrations above 17.5% was confined to the goaf front by a CO2 barrier carried by the airflow. Finally, with injection at 25 m, the oxidation zone was even more markedly reduced. The proximity of the injection port to the trailing edge of the oxidation zone enabled a more direct and efficient oxygen concentration reduction, thereby significantly shrinking the zone prone to spontaneous combustion.
The physical mechanisms underlying these phenomena can be attributed to the coupling between the local airflow field and the CO2 injection dynamics. When the injection port is positioned too close to the working face (5 m), the high-velocity airflow carries and rapidly disperses the injected CO2, preventing the formation of a stable inerting barrier. This not only fails to effectively displace oxygen but can also entrain oxygen from the cooling zone, driving it deeper into the goaf and consequently expanding the oxidation zone. In contrast, at locations further into the goaf (15 m, 25 m), the reduced porosity and lower airflow velocity allow the denser CO2 to settle and accumulate more effectively. Here, the injected CO2 can form a more persistent, blanket-like layer that physically blocks the pathways for oxygen ingress. The significantly enhanced inerting effect at the 15 m and 25 m locations demonstrates the critical importance of targeting the injection to areas where the flow regime transitions from turbulent/transitional to laminar, enabling effective gas stratification and oxygen displacement.
From a mine safety perspective, these findings imply that injection ports should be strategically positioned within the goaf depth where the airflow has sufficiently decelerated. This strategic placement ensures that the inert gas performs its designed function of oxygen isolation rather than being wasted or, worse, disturbing the flow field and potentially exacerbating the risk.

4.2. Injection Flow Rate

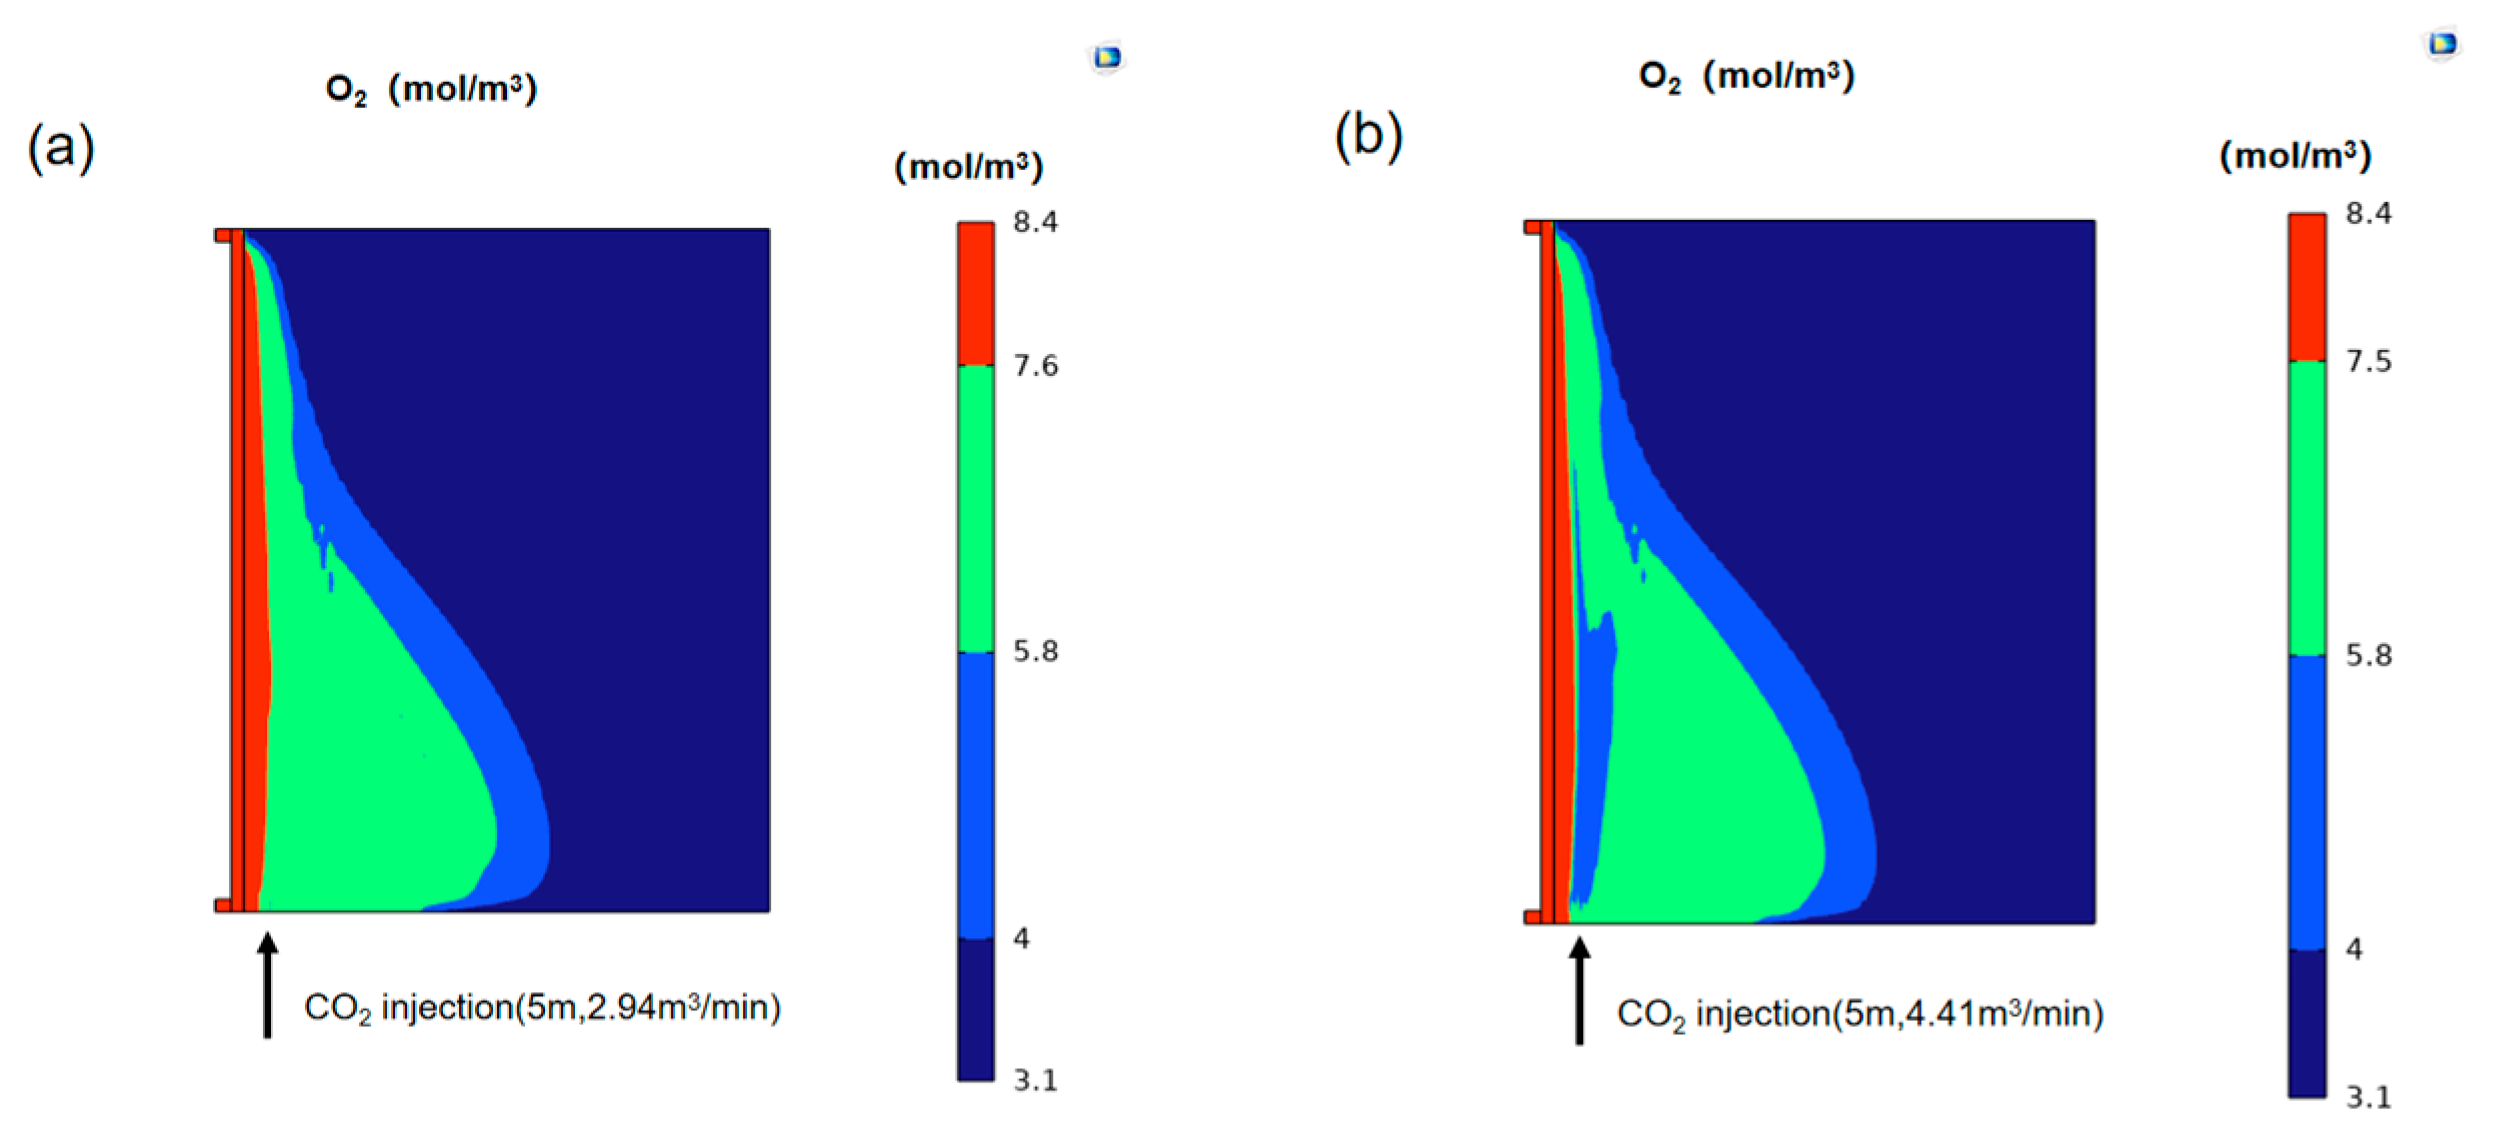
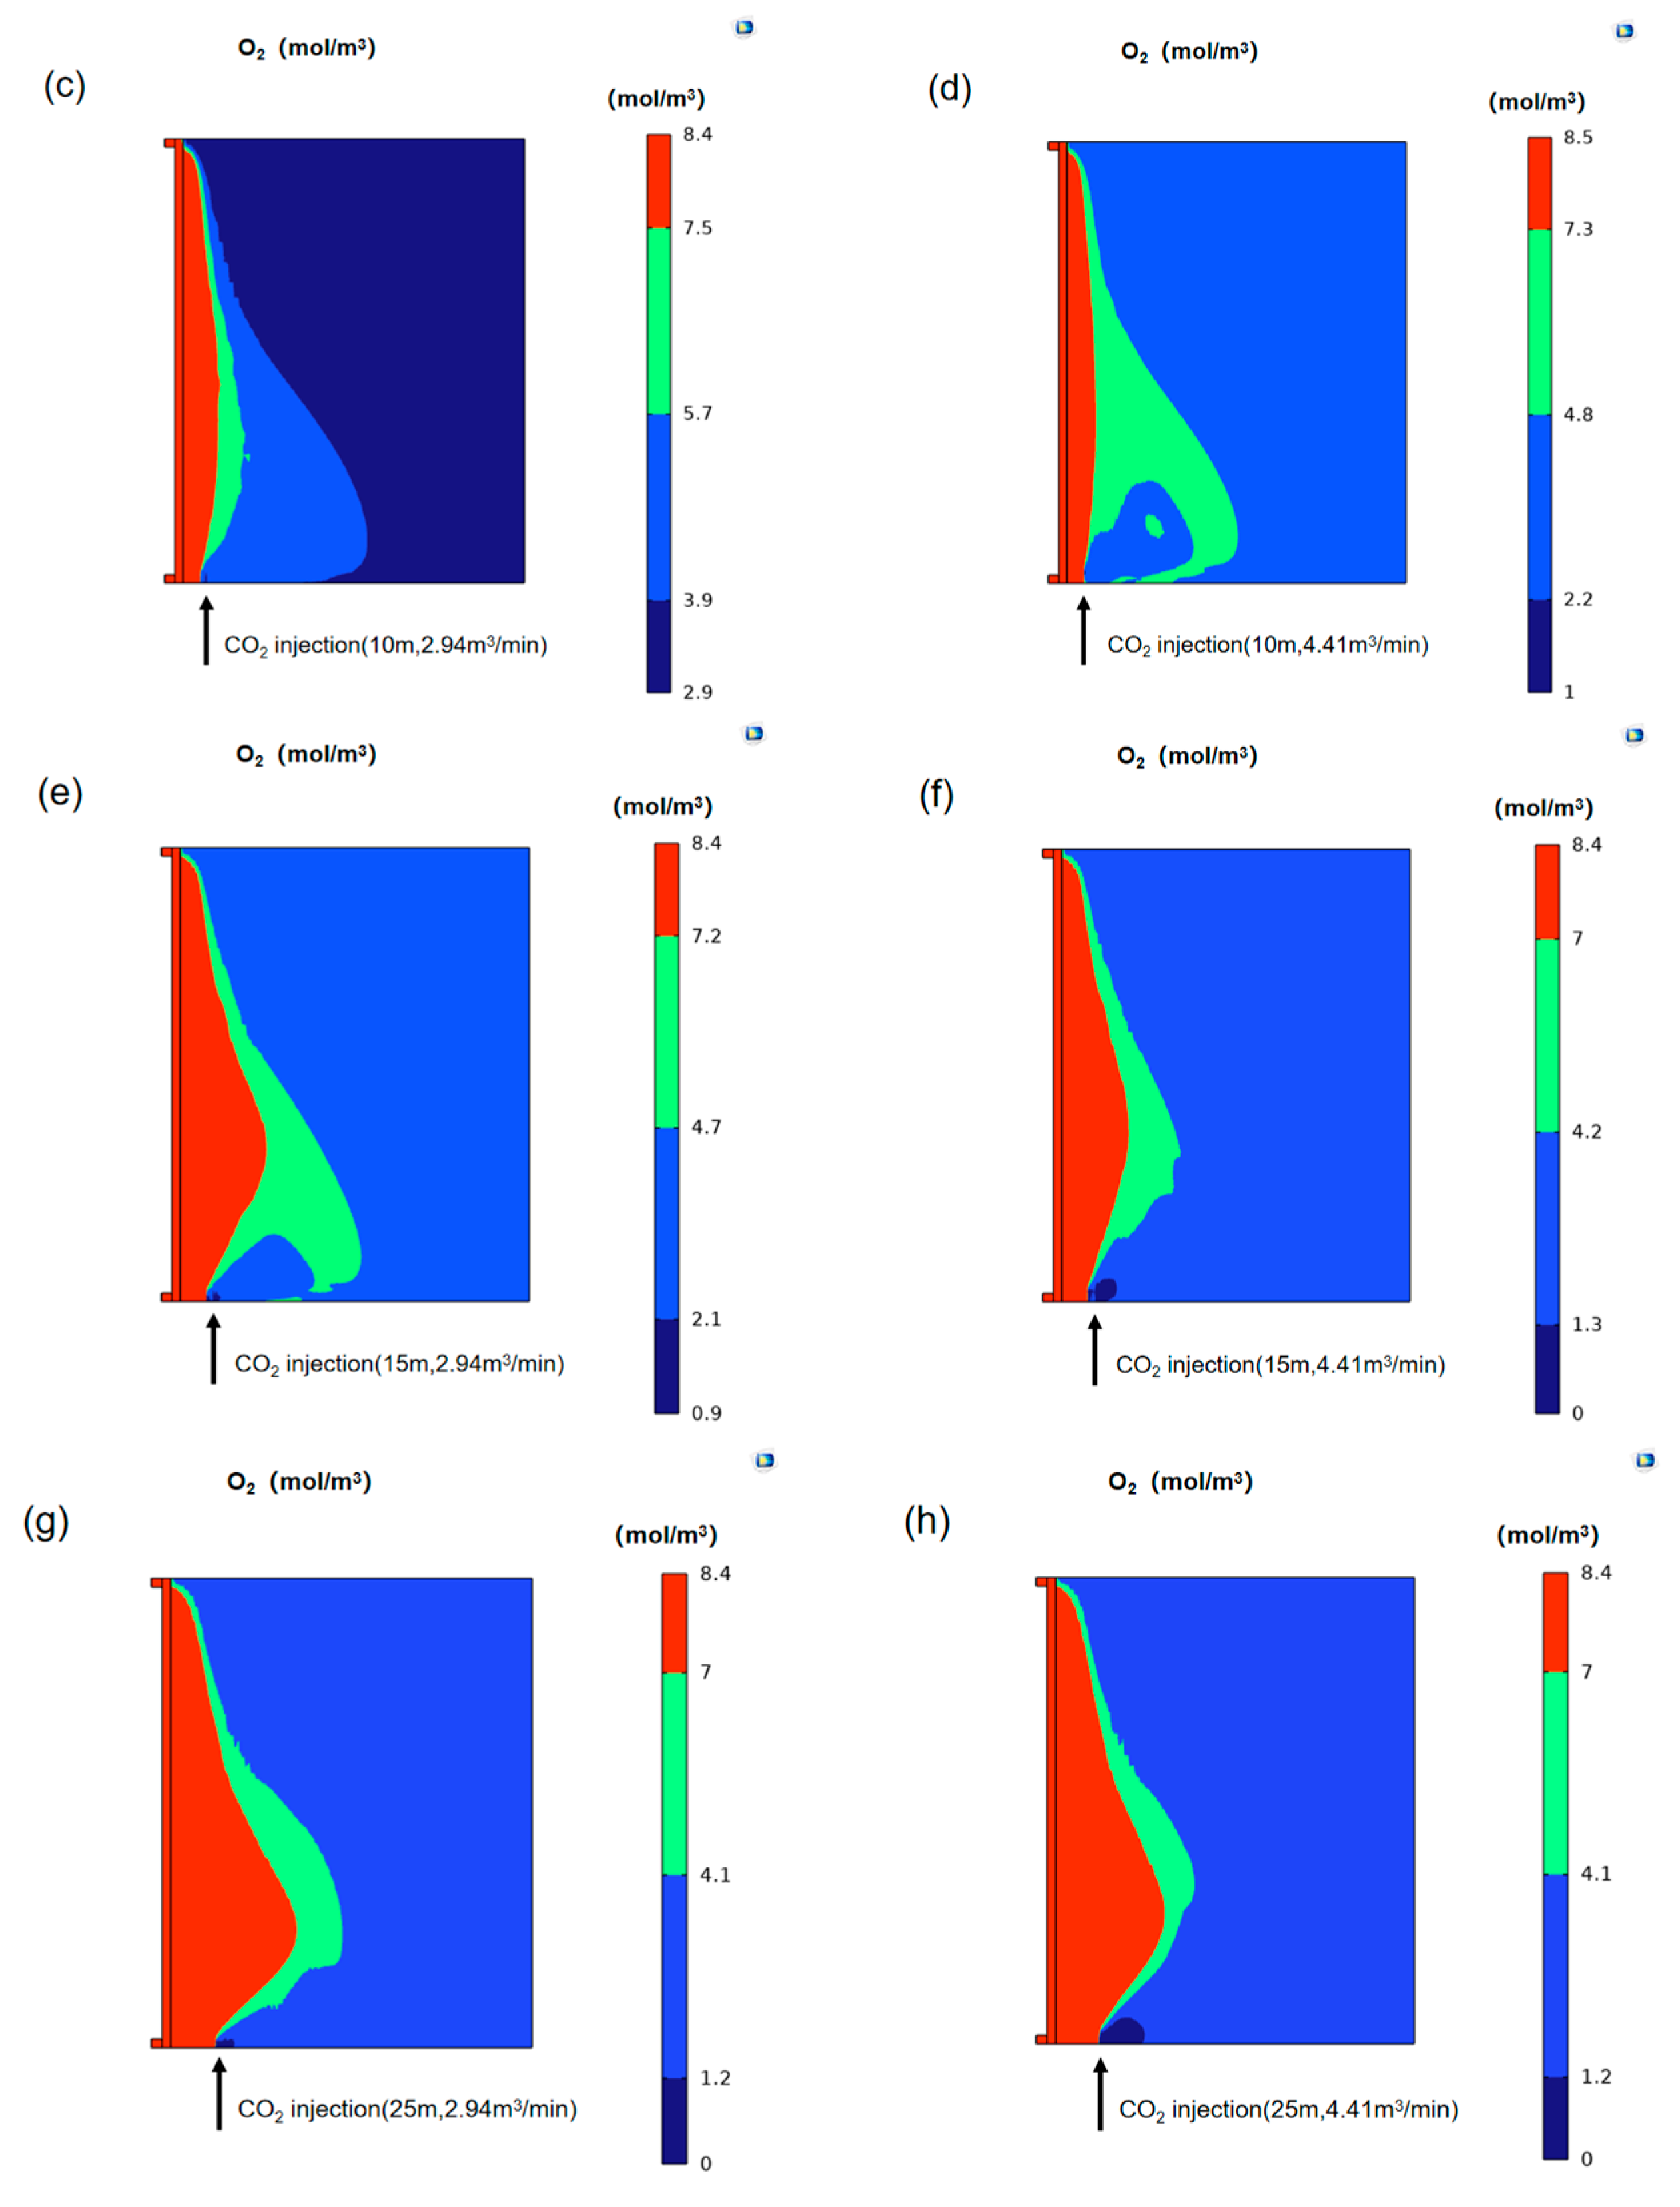
Following the analysis of the influence of CO2 injection location on the extent of the oxidation zone in the goaf, the impact of the CO2 injection flow rate was further investigated. It is noteworthy that variations in the flow rate parameter may potentially affect the conclusions drawn from the aforementioned injection location analysis. Therefore, in this section, numerical simulations were conducted for each injection location using different injection flow rates for comparative observation. The corresponding simulation results are presented in Figure 6.
A comparison of the simulation results from the four scenarios indicates that when the injection port is located 5 m and 10 m from the working face, increasing the injection flow rate reduces the areal extent of the oxidation zone in the goaf and lowers the oxygen concentration to some degree. This effect is most pronounced at the 10 m location, although the degree of reduction in the oxidation zone area is not substantial. In contrast, when the injection port is positioned 15 m and 25 m from the working face, increasing the injection flow rate results in a more significant reduction in the oxidation zone area. The smallest oxidation zone area is achieved with the injection port at 25 m and an injection flow rate of 4.41 m3/min, demonstrating that this scenario provides the most effective CO2 injection strategy for preventing spontaneous combustion of residual coal.
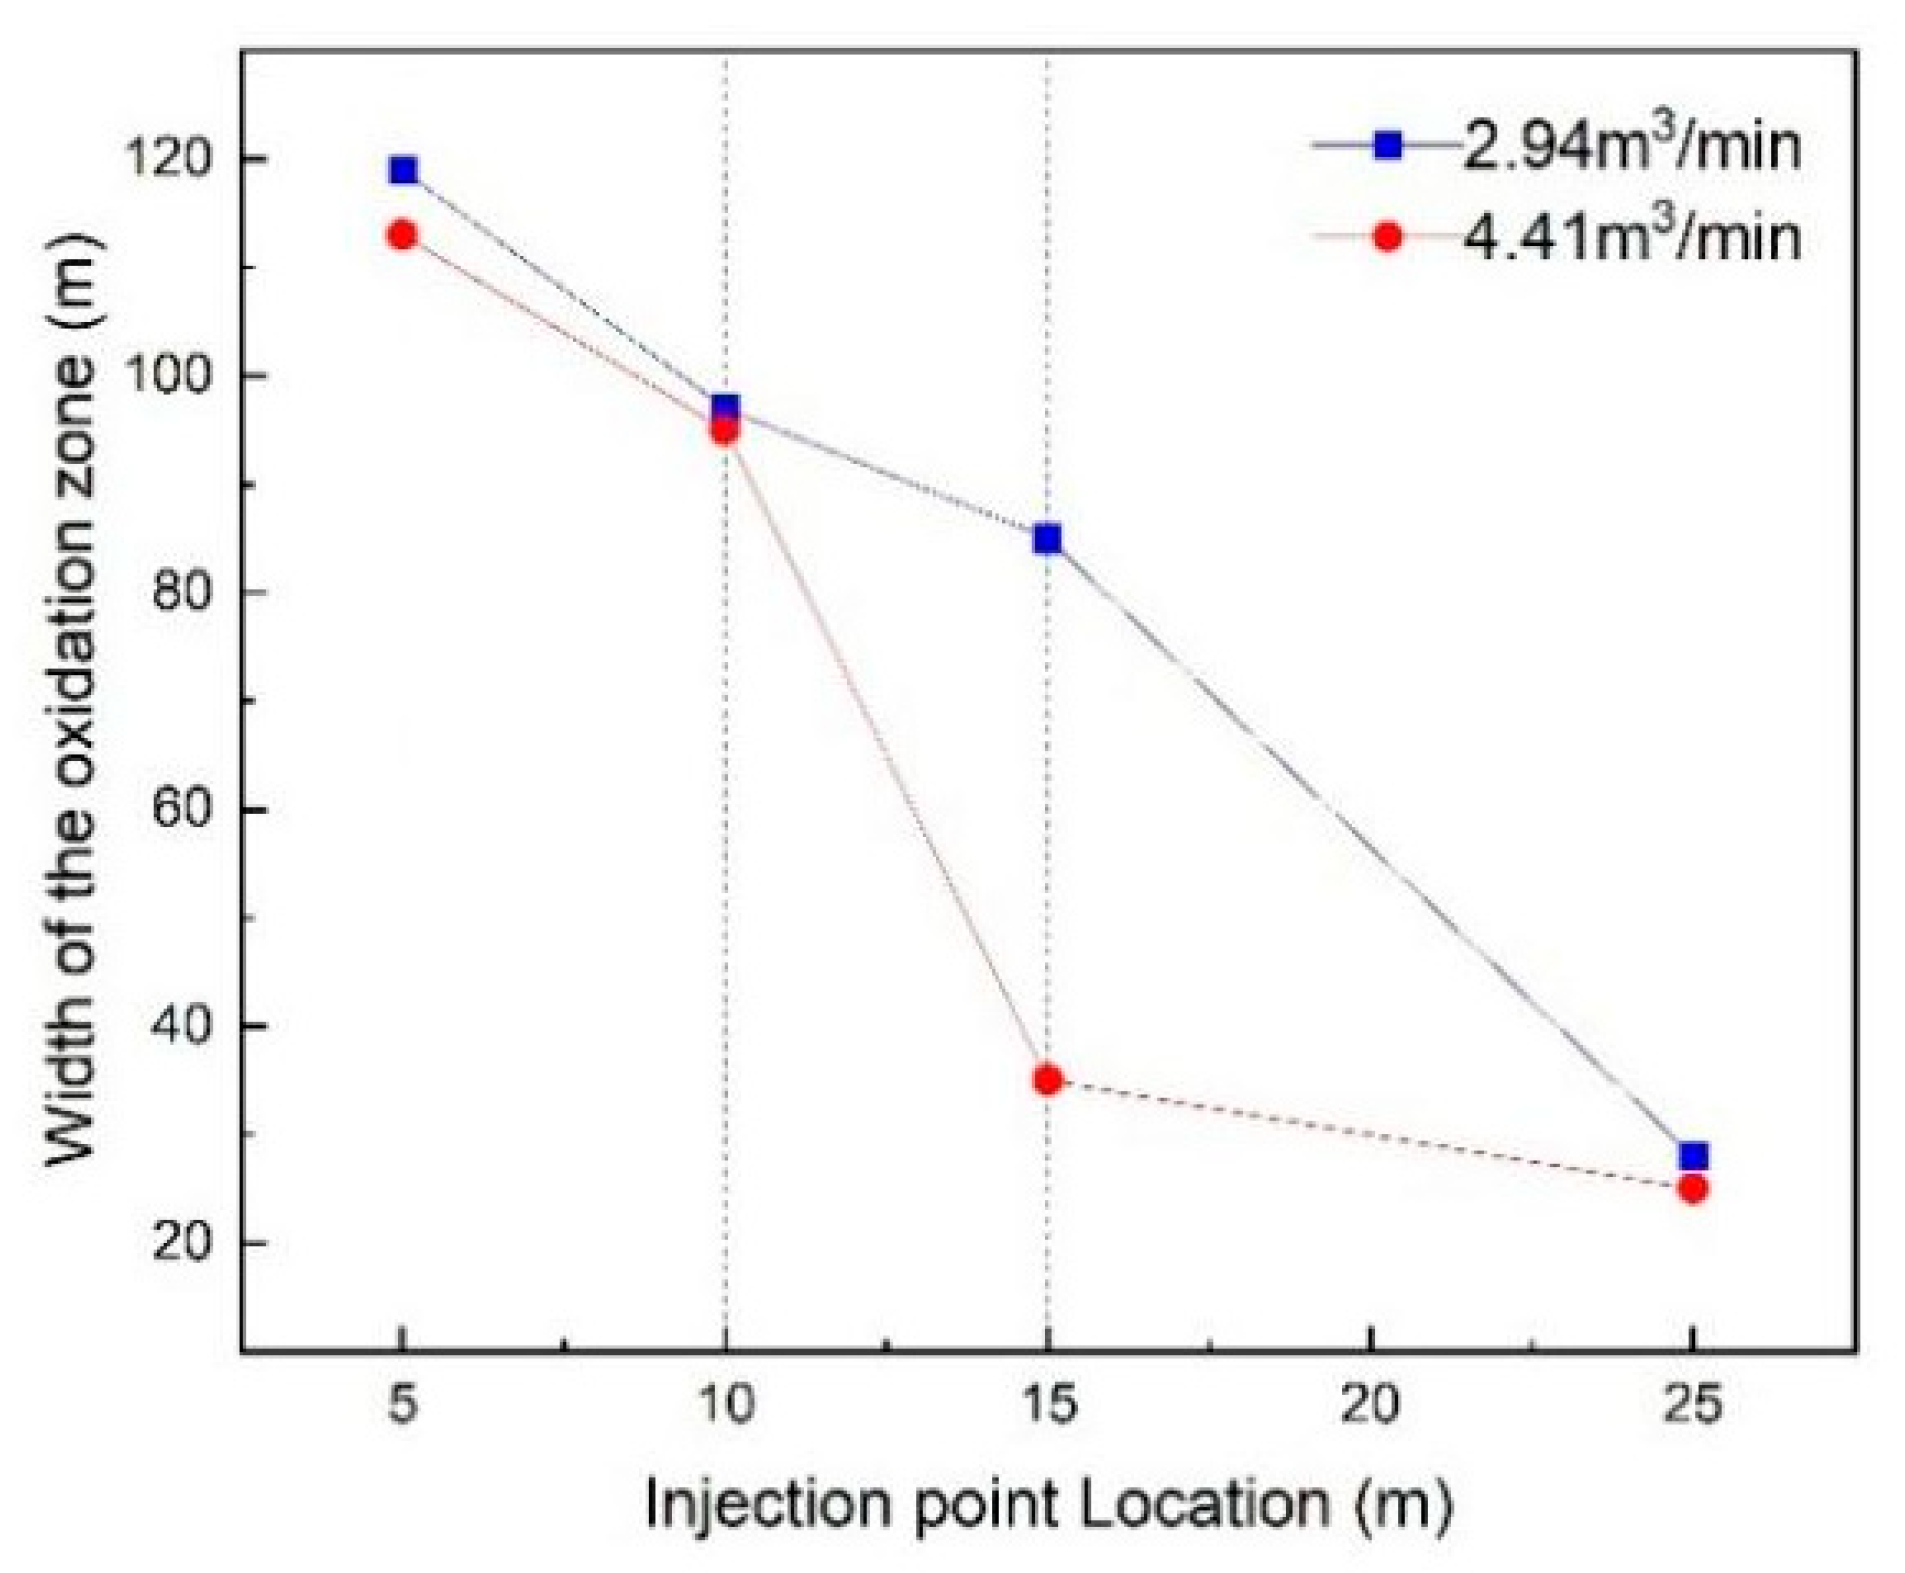
The oxidation zone width under two different injection flow rates is plotted, with the injection port location as the abscissa and the oxidation zone width as the ordinate, as shown in the figure. After injecting CO2 at both flow rates, the oxidation zone width in the goaf decreases as the distance from the working face increases. This indicates that the distance of the injection port from the working face is a critical factor influencing the effectiveness of CO2 injection in the goaf. However, it is particularly noteworthy that when the injection port is located 15 m from the working face, the scheme with an injection flow rate of 4.41 m3/min reduces the oxidation zone width by an additional 50 m compared to the scheme with a flow rate of 2.94 m3/min. In contrast, for the other three injection locations, varying the injection flow rate while keeping the location constant shows no significant impact on the oxidation zone width. This demonstrates that in CO2 injection technology for goaf, the injection port location plays a dominant role, followed by the injection flow rate.
The differential impact of flow rate at various locations further elucidates the complex flow-property interactions within the goaf. At shallow injection points (5 m, 10 m), the flow field is dominated by advection. Increasing the flow rate in this high-energy environment primarily enhances turbulent mixing rather than forming a wider inert barrier, leading to only marginal improvements in the inerting effect. Conversely, at deeper locations (15 m, 25 m), the flow is more laminar and diffusion-dominated. Here, a higher flow rate of CO2 can more effectively fill the available pore space and push the oxygen concentration front further back, leading to a substantial reduction in the oxidation zone width, as vividly demonstrated by the 50 m reduction at the 15 m injection point location, as shown in Figure 7.
This has direct operational implications for fire prevention strategies. It underscores that while optimizing the injection point location is the primary and most cost-effective step, fine-tuning the injection flow rate can yield significant additional benefits once the optimal location is identified. For instance, at the identified optimal location of 15 m, increasing the flow rate from 2.94 to 4.41 m3/min resulted in a dramatic improvement. This suggests that in high-risk scenarios, operators can implement a two-stage strategy: first, ensure the injection port is placed at the optimally identified depth, and second, utilize a higher but controlled flow rate to maximize the inerting coverage and safety margin, ensuring a more robust and reliable fire prevention system.

5. Conclusions

This study established a numerical model for CO2 injection in goaf areas. Based on the three-zone theory of spontaneous combustion, numerical simulations of CO2 injection under different parameters were conducted using COMSOL Multiphysics, and the impacts of various injection parameters on fire prevention effectiveness were analyzed. The main findings are summarized as follows:
(1)
Using numerical simulation methods to evaluate the effectiveness of CO2 injection in the goaf, it was found that injecting CO2 at a location at least 10 m from the working face on the intake side significantly reduces oxygen concentration and shrinks the oxidation zone area, thereby mitigating the low-temperature oxidation and spontaneous combustion of residual coal.
(2)
Comparative analysis of different injection parameters confirmed that CO2 injection displaces oxygen within a certain range in the goaf, which is closely related to the distribution of airflow velocity in the goaf.
(3)
By comparing eight injection scenarios, it was determined that the most significant reduction in oxidation zone width occurs when the injection port is 15 m from the working face with a flow rate of 4.41 m3/min. This study found that, within the tested range, the injection location has a more dominant influence on the oxidation zone width than the injection flow rate. To quantitatively substantiate the claim that injection location plays a dominant role over flow rate, the average change in oxidation zone width was calculated. Varying the injection location (across 5, 10, 15 and 25 m) led to an average change in oxidation zone width of approximately 45 m per 10-m shift in location, when averaged over the two flow rates. In contrast, varying the injection flow rate (between 2.94 and 4.41 m3/min) resulted in an average change of only about 10 m per 1.47 m3/min flow rate increase, when averaged across all locations. This finding provides a significant refinement to the existing understanding. While Li et al. [12] identified an optimal location for the Jiudaoling mine and Huang et al. [13] determined optimal parameters for a coking coal mine, their studies were context-specific. Our work generalizes this concept by demonstrating that the injection location is a primary controlling factor. This implies that in practice, engineers should prioritize the precise positioning of injection ports before fine-tuning the flow rate. This strategic insight can significantly enhance the efficiency of fire prevention planning.
(4)
This study provides a viable methodology for researching CO2 injection technology in goaf fire prevention. However, it is important to acknowledge its limitations. The numerical model, while consistent with literature findings [11], has not been directly validated against experimental or field measurement data from the specific mine, which introduces some uncertainty to the absolute quantitative results. The model assumed a uniform initial goaf temperature of 293.15 K and zero initial CO2 concentration. These assumptions, while simplifying the analysis, may not fully represent the actual conditions in deep mining environments where higher geothermal temperatures and pre-existing CO2 could influence gas behavior. Furthermore, the range of injection parameters investigated was limited [26], and a comprehensive sensitivity or uncertainty analysis of key input parameters was not conducted. These shortcomings will be addressed in future work. Our next steps include conducting detailed parametric sensitivity studies and collaborating with industry partners to collect in situ goaf monitoring data for direct model calibration and validation. Despite these limitations, the identified trends and the dominant role of injection location provide valuable strategic insights. For practical engineering applications, the model proposed by Li et al. [13] can be referenced to calculate the adsorption-compensated injection volume based on the goaf temperature field, thereby optimizing injection parameters for more precise and cost-effective fire prevention.
(5)
Furthermore, this modeling framework can be seamlessly extended beyond fire prevention to evaluate the synergistic potential of integrating CO2 injection with CO2 geological sequestration, a cornerstone of green mining initiatives. The same model that simulates O2 displacement for fire inerting can simultaneously track the transport, distribution, and long-term fate of the injected CO2 within the goaf. Key sequestration performance indicators, such as the effective CO2 storage capacity of the goaf, and its adsorption by residual coal, can be incorporated and assessed. This study observed that optimal fire prevention was achieved when CO2 accumulated and persisted in the deep goaf areas (15–25 m), forming a stable barrier. This very condition is also ideal for sequestration, as it indicates minimal CO2 leakage back to the working face and maximizes the contact time and volume for adsorption and dissolution. Therefore, the pursuit of optimal fire prevention parameters using this model inherently helps identify scenarios that favor higher CO2 sequestration efficiency, creating a dual benefit. Future work will explicitly integrate these sequestration metrics into the simulation outcomes, providing a comprehensive tool for designing combined safety and environmental management strategies in coal mines.

Author Contributions

Methodology, G.C. and Y.W.; Software, Y.D.; Validation, S.Z.; Formal analysis, B.W.; Data curation, C.X.; Writing—original draft, Y.W.; Writing—review & editing, G.C.; Visualization, X.Z.; Supervision, G.C.; Project administration, G.C. All authors have read and agreed to the published version of the manuscript.

Funding

This work was financially supported by Introduction Plan for “Tianchi Talent” in Xinjiang Uygur Autonomous Region.

Institutional Review Board Statement

Not applicable.

Informed Consent Statement

Not applicable.

Data Availability Statement

All relevant data are within the paper, and the data that support the findings of this study are available from the corresponding author upon reasonable request.

Acknowledgments

The authors have reviewed and edited the output and take full responsibility for the content of this publication.

Conflicts of Interest

The authors declare no conflicts of interest.

References

  1. Liu, Y.; Wen, H.; Chen, C.; Guo, J.; Jin, Y.; Zheng, X.; Cheng, X.; Li, D. Research status and development trend of coal spontaneous combustion fire and prevention technology in China: A review. ACS Omega 2024, 9, 21727–21750. [Google Scholar] [CrossRef]
  2. Raju, A.; Singh, A.; Chandniha, S.K. A synergetic approach for quantification and analysis of coal fires in Jharia Coalfield, India. Phys. Chem. Earth Parts A/B/C 2023, 131, 103441. [Google Scholar] [CrossRef]
  3. Muduli, L.; Jana, P.K.; Mishra, D.P. Wireless sensor network based fire monitoring in underground coal mines: A fuzzy logic approach. Process Saf. Environ. Prot. 2018, 113, 435–447. [Google Scholar] [CrossRef]
  4. Deng, J.; Bai, Z.J.; Xiao, Y.; Song, Z. Present situation and challenge of coal spontaneous combustion disasters prevention and control technology. Saf. Coal Mines 2020, 51, 118–125. [Google Scholar] [CrossRef]
  5. Li, Q.-W.; Xiao, Y.; Zhong, K.-Q.; Shu, C.-M.; Lü, H.-F.; Deng, J.; Wu, S. Overview of commonly used materials for coal spontaneous combustion prevention. Fuel 2020, 275, 117981. [Google Scholar] [CrossRef]
  6. Guo, L.; Du, H.; Cui, X.; Zhang, J.; Wang, K.; Wu, J.; Guo, H. Research progress and prospects of CO2 fire prevention and extinguishing technology in mine goafs. Thermochim. Acta 2025, 747, 179977. [Google Scholar] [CrossRef]
  7. Fan, J. Effects of CO2 injection factors on preventing spontaneous coal combustion in coal mine gobs: A simulation approach. Front. Earth Sci. 2023, 11, 1191049. [Google Scholar] [CrossRef]
  8. Zhou, H.; Wu, Y.; Liu, C.; Geng, H.; Yao, C. Study on the diffusion and migration law of CO2 sequestrated in abandoned coal mine goaf. Deep. Undergr. Sci. Eng. 2025, 10, 1–18. [Google Scholar] [CrossRef]
  9. Zhang, Y.; Niu, K.; Du, W.; Zhang, J.; Wang, H.; Zhang, J. A method to identify coal spontaneous combustion-prone regions based on goaf flow field under dynamic porosity. Fuel 2021, 288, 119690. [Google Scholar] [CrossRef]
  10. Perera, M.; Ranjith, P.; Choi, S.; Bouazza, A. A parametric study of coal mass and cap rock behaviour and carbon dioxide flow during and after carbon dioxide injection. Fuel 2013, 106, 129–138. [Google Scholar] [CrossRef]
  11. Li, Z.; Liu, Y.; Wang, Z.; Lin, L. Study on numerical simulation of CO2 injection fire prevention and extinguishing technique in goaf of Jiudaoling Mine. Coal Sci. Technol. 2018, 46, 153–157. [Google Scholar] [CrossRef]
  12. Huang, S.; Li, Z.; Liu, Y.; Wu, J. Optimization study of CO2 inerting parameters in goaf based on coal sample oxidation characteristics. Arab. J. Chem. 2025, 18, 1. [Google Scholar] [CrossRef]
  13. Li, Z.; Li, L.; Si, J.; Yang, X. New exploration on the goaf inerting with hidden fire source under CO2 injection volume of adsorption compensation. Case Stud. Therm. Eng. 2024, 62, 105203. [Google Scholar] [CrossRef]
  14. Si, J.; Li, L.; Cheng, G.; Shao, H.; Wang, Y.; Li, Z. Characteristics and safety of CO2 for the fire prevention technology with gob-side entry retaining in goaf. Acs Omega 2021, 6, 18518–18526. [Google Scholar] [CrossRef] [PubMed]
  15. Ma, Q.; Xue, J.; Shi, Y.; Zeng, X. Characteristics of porosity distribution and gas migration in different layers of comprehensive working face goaf. Energies 2023, 16, 2325. [Google Scholar] [CrossRef]
  16. Wang, Y.; Si, G.; Oh, J.; Belle, B. CFD modelling of longwall goaf atmosphere under vertical boreholes gas drainage. Int. J. Coal Geol. 2023, 280, 104400. [Google Scholar] [CrossRef]
  17. Xia, T.; Zhou, F.; Wang, X.; Kang, J.; Pan, Z. Safety evaluation of combustion-prone longwall mining gobs induced by gas extraction: A simulation study. Process Saf. Environ. Prot. 2017, 109, 677–687. [Google Scholar] [CrossRef]
  18. Jambhekar, V.A. Forchheimer Porous-Media Flow Models-Numerical Investigation and Comparison with Experimental Data. Master’s Thesis, Universität Stuttgart-Institut für Wasserund Umweltsystemmodellierung, Stuttgart, Germany, 2011. [Google Scholar]
  19. Kirsch, E.G. Zeitschrift des Vereines deutscher Ingenieure. In Die Theorie der Elastizität und die Bedurfrisse der Festigkeitslehre; Springer: Berlin/Heidelberg, Germany, 1898; Volume 42, pp. 797–807. [Google Scholar]
  20. Kuznetsov, A.V. Analytical study of fluid flow and heat transfer during forced convection in a composite channel partly filled with a Brinkman–Forchheimer porous medium. Flow Turbul. Combust. 1998, 60, 173–192. [Google Scholar] [CrossRef]
  21. Hooman, K.; Li, J.; Dahari, M. Thermal dispersion effects on forced convection in a porous-saturated pipe. Therm. Sci. Eng. Prog. 2017, 2, 64–70. [Google Scholar] [CrossRef]
  22. Nield, D.A.; Bejan, A. Convection in Porous Media; Springer: New York, NY, USA, 2006. [Google Scholar] [CrossRef]
  23. Taraba, B.; Michalec, Z. Effect of longwall face advance rate on spontaneous heating process in the gob area–CFD modelling. Fuel 2011, 90, 2790–2797. [Google Scholar] [CrossRef]
  24. Wang, G.; Xu, H.; Wu, M.; Wang, Y.; Wang, R.; Zhang, X. Porosity model and air leakage flow field simulation of goaf based on DEM-CFD. Arab. J. Geosci. 2018, 11, 148. [Google Scholar] [CrossRef]
  25. Shao, H.; Jiang, S.; Wang, L.; Wu, Z. Bulking factor of the strata overlying the gob and a three-dimensional numerical simulation of the air leakage flow field. Min. Sci. Technol. 2011, 21, 261–266. [Google Scholar] [CrossRef]
  26. Guo, J.; Gao, B.; Liu, Y.; Chen, C.; Cai, G.; Wang, L. Research and Application of CO2 Fire Prevention Mechanism and Key Technologies in Mines: A Review. Fire 2024, 7, 353. [Google Scholar] [CrossRef]
Figure 1. Coupling relationship of the equations.
Applsci 15 12181 g001
Figure 2. Numerical model and mesh distribution for CO2 injection in the goaf.
Applsci 15 12181 g002
Figure 3. Simulated porosity distribution in the goaf.
Applsci 15 12181 g003
Figure 4. Numerical Simulation Results of Oxygen Transport Patterns in Uninjected CO2 Goafs and Distribution Characteristics of the ‘Triple Oxidation Zone’.
Applsci 15 12181 g004
Figure 5. Oxygen concentration distribution in the goaf at various injection locations with a fixed flow rate of 2.94 m3/min.
Applsci 15 12181 g005
Figure 6. Oxygen concentration distribution in the goaf under different injection locations and concentrations. (a) Injection port 5 m from the working face, with a flow rate of 2.94 m3/min. (b) Injection port 5 m from the working face, with a flow rate of 4.41 m3/min. (c) Injection port 10 m from the working face, with a flow rate of 2.94 m3/min. (d) Injection port 10 m from the working face, with a flow rate of 4.41 m3/min. (e) Injection port 15 m from the working face, with a flow rate of 2.94 m3/min. (f) Injection port 15 m from the working face, with a flow rate of 2.94 m3/min. (g) Injection port 25 m from the working face, with a flow rate of 2.94 m3/min. (h) Injection port 25 m from the working face, with a flow rate of 4.41 m3/min.
Applsci 15 12181 g006aApplsci 15 12181 g006b
Figure 7. Comparison of oxidation zone extent under different injection scenarios.
Applsci 15 12181 g007
Table 1. Key parameters of the model.
ParameterSymbolUnitValue
The initial temperature of goaf T 0 K293.15
Initial oxygen concentration in goaf C 0 O 2 mol/m38.3142
Initial CO2 concentration in goaf C 0 C O 2 mol/m30
Attenuation rates from the working face a 0 Dimensionless0.08
Attenuation rates from the solid boundaries a 1 Dimensionless0.368
Distribution shape adjustment coefficient c 1 Dimensionless0.323
Minimum bulk factors λ min Dimensionless1.12
Maximum bulk factors λ max Dimensionless1.5
The CO2 diffusion coefficient in the standard state D C C O 2 m2/s3.5 × 10−5
The density of coal ρ b kg/m31410
Goaf height H 0 m15
Table 2. Simulation cases for CO2 injection.
CasesInjection LocationInjection Flow Rate
A15 m2.94 m3/min
A25 m4.41 m3/min
B110 m2.94 m3/min
B210 m4.41 m3/min
C115 m2.94 m3/min
C215 m4.41 m3/min
D125 m2.94 m3/min
D225 m4.41 m3/min
Disclaimer/Publisher’s Note: The statements, opinions and data contained in all publications are solely those of the individual author(s) and contributor(s) and not of MDPI and/or the editor(s). MDPI and/or the editor(s) disclaim responsibility for any injury to people or property resulting from any ideas, methods, instructions or products referred to in the content.